Embed Size (px)
Citation preview
Clays and Clay Minerals, 1973, Vol. 21, pp. 103-114. PergamonPress. PrintedinGreatBritain
THE CRYSTAL STRUCTURE OF TALC
J. H. RAYNER and G. BROWN Pedology Department, Rothamsted Experimental Station, Harpenden, Hefts, England
(Received 28 August 1972)
Abstract-The crystal structure of a sample of talc from Harford County, Maryland, has been deter- mined by least squares refinement from X-ray diffraction photographs. A triclinic cell with a = 5.293, b = 9.179, c = 9.496A, a = 90'57 ~ = 98-91 ~ y = 90.03, space group cT is adopted. The layers of the structure have almost monoclinic symmetry but the nearly hexagonal rings of oxygen atoms on the surfaces of the layers, formed by the bases of the silica tetrahedra, are not held in register by inter- layer ions as they are in micas but are partly displaced so that the stack of layers forms a triclinic crystal. The hexagons of surface oxygens are distorted by a 3.4 ~ twist of the tetrahedra so that the b axis is 0.2 per cent shorter than in a structure with regular hexagons, and the twist brings the oxygen ions a little closer to the octahedral magnesium ions.
INTRODUCTION THE CLAY fraction of soils commonly contains layer silicates, some of which have close counter- parts in the well crystallised minerals in rocks and some of which have formed by alteration of miner- als with an existing layer silicate structure. As part of our study of these minerals we have re-examined the structure of talc.
The structures of the layer silicates were outlined by Pauling (1930) and established by Gruner (1934) and Hendricks (1938), but more recent work (re- viewed by Brown (1965) and by Bailey (1966)) showed that the structures are less regular and have additional general features. The tetrahedra of oxygen atoms are twisted from the ideal positions to allow a better fit between the tetrahedral and octahedral layers, and flattening of the oxygen octahedra parallel to the sheet allows a greater separation of the octahedral cations. Talc is the simplest of the layer silicate structures and should show these features without the complication of interlayer cations.
Hendricks took single crystal Weissenberg photographs of talc and pyrophyllite, but did not complete a structure determination for either. We have repeated his examination and published preliminary reports (Rayner and Brown, 1964, 1966). Like Hendricks' , our structure of pyro- phyllite is incomplete, as the photographs are strongly streaked because of disorder in the structure, but it was possible to refine a sub-cell of the structure. For talc, Hendricks proposed a mono- clinic unit cell and space group C2[c or Cc. We found a triclinic cell close to monoclinic in shape, but the intensities of the reflections quite clearly do not have monoclinic symmetry. When the photo- graphs published by Hendricks (1940) were re- examined, one of them (Figs. 3a and d) was found to
have the lower symmetry expected for a triclinic cell. It is possible that, because of twinning, parts of his sample appeared to be more symmetrical. Some of our photographs show evidence of a small twinned component. Ross, Smith and Ashton (1968) examined 14 talc crystals, 13 from Gouver- neur, New York, and found them all triclinic.
OCCURRENCE AND CRYSTAL DESCRIPTION
Talc, ideally Mg3Si4010 (OH)2, is a hydrated magnesium silicate found as a soft crystalline, foliated or compact mineral of white, grey or pale green color and soapy feel. Its formation by hydro- thermal alteration of basic rocks of thermal meta- morphism of siliceous dolomites is summarised by Deer, Howie and Zussman (1962, p. 126). The specimen used for this analysis was a clear colorless cleavage flake from the same sample from Harford County, Maryland (U.S.N.M. No. 82519) used by Hendricks (1938) and kindly provided by him.
Optical description; colorless (slightly greenish- grey reflection from bent and split parts, brown stain near edge) optically negative with 2Vx ranging from 3-8 ~ but commonly 6-7 ~ Dispersion of optic axes r > v. X = 1.538___0.002, Y and Z = 1.588 _ 0-002.
The chemical composition is similar to the published composition of two other talcs of small aluminum content (Table 1), but other analysed samples contain more A1, up to 2-4% A1203 (Deer, Howie and Zussman, 1962). The composi- tion is close to the ideal Sis Mg6 O20(OH)4 but with nearly 2% of Mg replaced by Fe. The fluorine content, 0.06% is towards the lower end of the range found by Ross, Smith and Ashton (1968).
The loss in weight from 110 to about 950~ (Meker burner) agress well with the formula, but a
103
104 J. H. RAYNER and G. BROWN
Table 1. Chemical composition of talc
Proportion (%)
1
on basis of 22 O 2-
2 3 Proportion
on basis (%) Si+Mg-- 14 (%)
Proportion on basis of
2202-
SiO2 Al=Oa
MgO MnO
FeO Fe~Oa Na20 K,O H20 - -
L o s s 110 ~ IO00~ F
Total (excluding H20-) Correction for Fluoride replacing oxide
63"22 8'043 not 0 detected
304 ~ W l detected 0'89 0'094] 0-33 0-031J 0"02 0.004 0"05 0.008 0"20 0.044 4"78 4-052
0-06• 0.024
5.892
62-68 7.916 62-61 0.06* 0.01 trace
32.33 6.084 30-22 0.04* 0.004 0-01
0.04* 0.004 2.46
0.01" 0"003 0.001" 0.0002 0'33 0"014 5.27 4-035 + F
(includes F) 0.48 0.192
7.99 8
5.743] 0-007~ 6"0
0.261J
4-72 4.018
99-80 100-76 100-02
0-03 0-20
99-77 100.56
1 Talc used in this structure determination. Harford County single crystal, analyst G. Pruden. CaO, AI2Oa, P~Os, TiO2 not detected. Another sample heated from room temperature to 1150~ Wt loss 5.9 • 0-1 per cent, gain by anhydrous Mg(C104)2 6.6 • 0.2 per cent, analyst A. C. D. Newman.
2 Another talc known to be triclinic. Gouverneur talc district New York. (Ross, Smith and Ashton, 1968). *Spectrographic determination.
3 Talc low in AI2Oz reported by Deer, Howie and Zussman (1962), altered peridotite, Muruhatten, N. Sweden (Du Reitz, 1935).
separate experiment indicates that there is a further loss in weight and release of water on heating to 1150~ This high temperature weight loss is also suggested by measurements for talc by Aleixandre and Alvarez Estrada (1952) reported by Mackenzie (1957). Deer, Howie and Zussman suggest that fine grained talcs may retain sorbed water above 110~ but the appearance of the flakes as clear and apparently single crystals argues against a similar explanation for the behavior of our specimens. El-Attar, Jackson and Volk (1972) find that fluorine is lost completely from hectorite at 950~ in 6 hr, mainly as SiF4, but if all F in talc is lost in this way it would not explain the whole of the weight loss to 1150~
Seeking evidence of sorbed water, infra-red absorption spectra with rather low dispersion in the 3000-4000 cm -1 region of two of the flakes of talc were taken on an Infracord spectrometer. There was only weak absorption and no clear peak at about 3450 cm -~ where an OH stretching vibration occurs in expanded layer silicates; this is attributed to interlayer water (Kodama and Oinuma, 1963).
Sclar, Carrison and Schwartz (1965) find a peak of medium height at 3260 cm -1 in a Mg deficient talc with oxonium ions between the layers, and Farmer (1958) reports a broad weak band at 3413 cm -1 due to sorbed water in an oriented deposit of ground talc; these were not detected in the single crystal spectrum. The spectrum does show the expected peak, at about 3680 cm -1, that in talcs is attributed to a structural OH surrounded by three Mg atoms (Farmer and Russell, 1964; Wilkins, 1967; Wilkins and Ito, 1967). However, at this resolution we did not detect the peak expected at about 3660 cm -1 for an OH surrounded by 2Mg + 1Fe. From the Fe content of the sample, this peak should have 1[15 the intensity of the 3680 cm -1 peak. When the talc flake was perpendicular to the infrared beam the 3680 cm -1 peak was six times weaker than when it was inclined at 30 or 60 ~ . This change would be expected if most of the absorption due to stretching of OH bands in the structure occurred for vibra- tions perpendicular to the layers and would occur only if most of the OH bonds were oriented in this direction.
"IHE CRYSTAL S T R U C T U R E OF TALC 105
X-RAY MEASUREMENTS
T h e t r ic l inic s y m m e t r y was e s t ab l i shed by X- ray single c rys ta l osc i l la t ion and ro ta t ion p h o t o g r a p h s a b o u t all t h ree 5.3 .A and all t h ree 9.3 A axes t ha t lie in the p lane o f the sheets . N o n e of t h e s e was a s y m m e t r y axis n o r w e r e they pe rpend icu l a r to a s y m m e t r y ~ T h e ro t a t i on p h o t o g r a p h s for the t h r e e 5.3 A axes w e r e similar , bu t d is t inc t , as are t hose for the t h r ee 9-3 A axes , so the axes of a new c rys ta l f rom the sample can b e quickly identified.
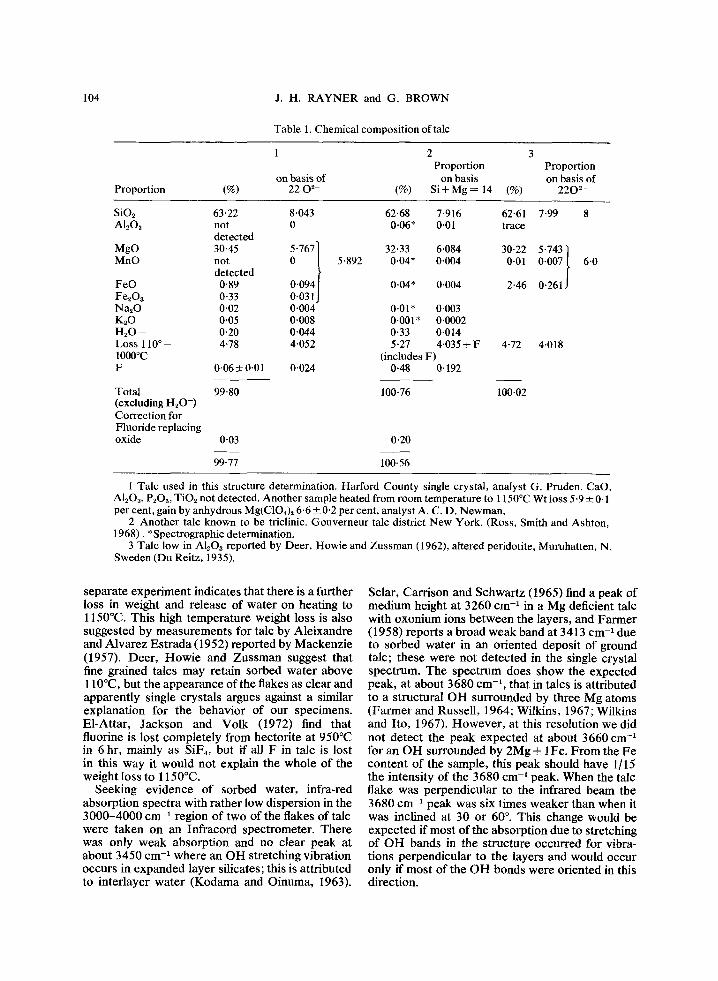
T h e conven t i ona l cho ice of axes for a t r icl inic c rys ta l are the edges of a pr imi t ive cell, b u t the talc s t r uc tu r e can be c o m p a r e d more easi ly wi th o the r l ayer si l icates if a C f ace -cen t e r ed cell is chosen . T a b l e 2 and F igu re 1 show four poss ib le choices of cell. T h e C cell is u s e d in this paper . T h e axes of the C f ace -cen te red cel l are re la ted to the opt ical m e a s u r e m e n t s so t ha t app rox ima te ly a is paral lel t o O . A . P . i . e . a = Y , b ~ Z , c ~ X .
W e i s s e n b e r g p h o t o g r a p h s were t a k e n for the
0=r 3
~ , 9 ~ o
c =q =c2=b 3 ~-w b I ~3
Fig. 1. Unit cells for talc. Axes without subscripts are for the C cell. Subscripts are for the three P cells (see Table 2).
Table 2. Uni tce l land reciprocal celldimensionsfortalc
P~ P2 P3 C
a 5.293(2)• 5.299(2) 5.297(2) 5.293(2) b 5.299(2) 5.297(2) 9.469(3) 9-179(3) c 9-469(3) 9-469(3) 5.293(2) 9-469(3)
86.06(3) ~ 94.93(3) ~ 98-91(3) ~ 90.57(3) ~ /3 98'91(3) ~ 93.94(3) ~ 119-95(3) ~ 98.91(3) ~ Y 119"99(3) ~ 120"06(3) ~ 85'07(3) ~ 90"03(3) ~ a* 0-2203(1)A -1 0-2199 0.2179 0.1912 b* 0.2179(1) 0.2203 0.1069 0-1089 c* 0.1069(0) 0.1069 0.2199 0.1069 ~* 89.42 ~ 81.98 ~ 82.55 ~ 89.42 ~ /3* 81-98 ~ 82.55 ~ 60-42 ~ 81-09 ~ T* 60'24~ 59"34~ 90"58~ 89"88~
P1 used in Rayner and Brown (1966) P2 Delaunay reduced cell; a , /3 and Y non-acute (Henry and
Lonsdale, 1952). Pz Bravais reduced cell; c < a < b, a and /3 non-acute
(Donnay, Donna),, Cox, Kennard and King, 1963; Kennard, Speakman and Donnay, 1967).
C C face-centred cell most nearly monoclinic in shape.
106 J .H . RAYNER and G. BROWN
zero to fourth layers about the b axis and the zero, first and second layers about the a axis. The reflections were slightly split into up to four compo- nents, and over an angular range of up to 4 ~ in the worst cases. Two batches of 3 films were exposed for each layer, and the intensities brought to a common scale by comparison of reflections com- mon to several films, intensities were estimated visually with the aid of a calibrated scale using timed exposures of a single crystal reflection. Two crystals of about 0-2 mm x 0.2 mm x 0.03 mm were used for the two axes, and the intensities were corrected for Lorentz-polarisation by a program written in Extended Mercury Autocode. An attempt to put the structure factors for the two crystals on a common scale left systematic differen- ces in the structure factors, and so at first the two sets were used separately in the structure deter- mination and combined into a single set when these two sets had been shown to lead to consistent models for the structure.
TRIAL STRUCTURE
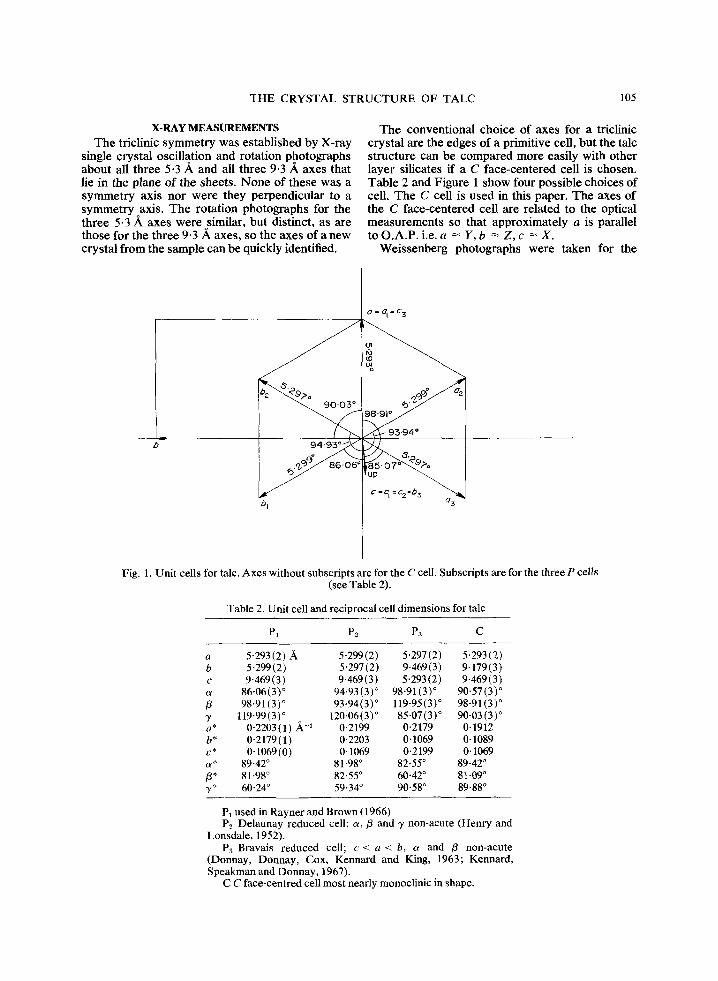
The layer spacing in the c* direction is 9.4 .A, so the cell contains one 2 : 1 silicate layer. The !ayer is trioctahedral and the b axis length, 9.17A, sug- gests that the twist of the tetrahedra will be small (Radoslovich, 1962). An ideal layer with no twist can be fitted into the cell in six ways. A single layer has a perpendicular plane of symmetry that defines a unique direction in the plane of the layer (Brindley, Oughton and Robinson, 1950) and the orientation of the layer is completely defined if it is represented by a vector between any two atoms in this plane of "symmetry. In Fig. 2 such a vector between the OH atom in the bottom half of the layer and the nearest OH atom in the top half is represented in stereographic projection for each of six distinct possible positions of the vector with respect to the crystal axes.
When the corresponding six possible structures are projected down the a axis, there are three different arrangements of the projected atoms, each representing two different three dimensional structures.
The one hundred 0kl structure factors corres- ponding to the a axis projections of these models were calculated from atomic coordinates estimated, in part using the methods of Donnay, Donnay and Takeda (1964), from an Mg-O distance of 2.10 A, an unshared octahedral edge of b/3, and a Si-O bond length of 1.62 A. The layer in these models has a center of symmetry at one of the Mg atoms and the trial structures all belong to the space group C]-. The R factors for comparison of these calculated 0kl structure factors with those ob- served are 38, 20 and 40 per cent suggesting that the second projected arrangement and hence one of
a
m 2
Fig. 2. The relationship of the six trial structures of talc to the crystal axes. The cell axes (0) and the six possible: orientations of the layer represented by the shortest
vector from lower to upper OH groups (ll).
the two corresponding three dimensional arrange- ments (2 or 2' in Fig. 2) is correct. Structure factors for the 0kl, lkl and 2kl reflections calculated for the arrangements represented by 2 and 2' gave R factors of 22 and 59 per cent respectively. The R factors for structure 2 for each of the layer lines separately were 23, 19 and 23 per cent and so this structure was accepted for refinement.
STRUCTURE REFINEMENT The a-axis data were relined by least squares
(using a program written in Extended Mercury Autocode for the Orion computer) to give the first of the three sets of coordinates in Table 3. The R factor for 384 a-axis non-zero reflections is 14.8 per cent for atoms with an isotropic temperature factor, and 14.2 per cent when all atoms are allowed to have anisotropic temperature factors. The b axis reflections give to the second set of coordinates in Table 3, with R factors of 17.3 per cent for isotropic and 15.7 per cent for anisotropic atoms. Different scale factors were refined for each of the b axis layer lines. The R factors were larger than expected for a structure of this size, and some of the error was due to the difficulty in making an estimate of the total intensity of a reflection when it was spread out and split into several parts. The splitting varied in a systematic way over the X-ray photographs as the angle between the beam and the flake varied. In an attempt to overcome this difficulty the b axis photographs were divided into seven regions, and separate scaling factors calculated. These factors showed that the estimated intensity did vary
T H E CRYSTAL STRUCTURE OF TALC
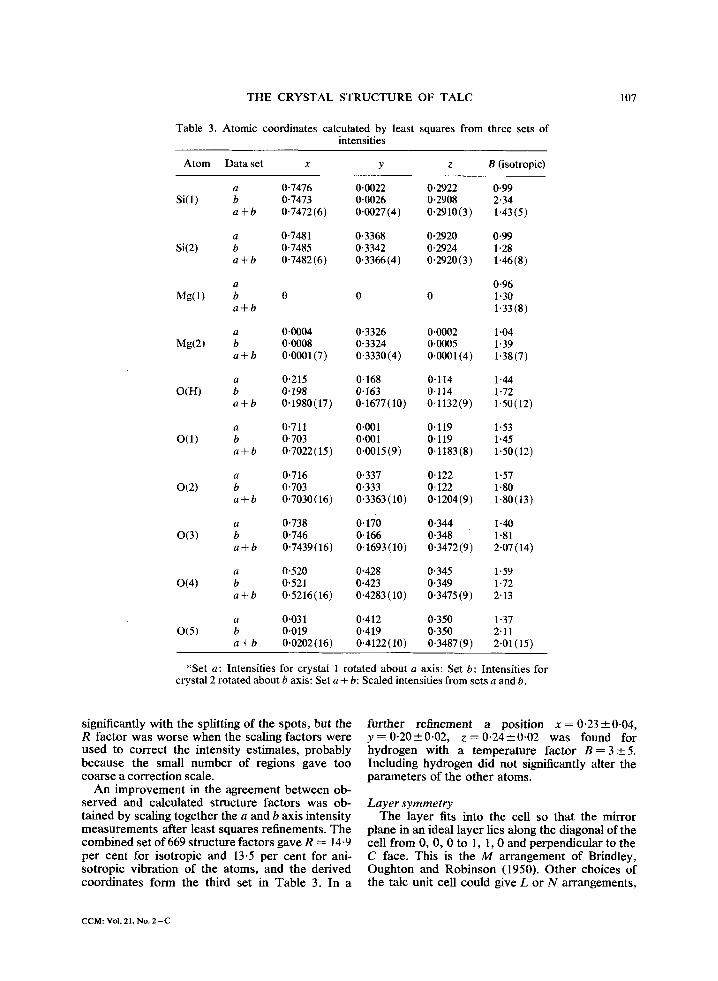
Table 3. Atomic coordinates calculated by least squares from three sets of intensities
Atom Data set x y z B (isotropic)
Si(1)
Si(2)
a 0.7476 0.0022 0.2922 0-99 b 0-7473 0.0026 0.2908 2-34 a + b 0.7472(6) 0.0027(4) 0.2910(3) 1-43(5)
a 0.7481 0.3368 0.2920 0.99 b 0.7485 0.3342 0.2924 1-28 a + b 0-7482(6) 0.3366(4) 0.2920(3) 1"46(8)
a 0-96 Mg(1) b 0 0 0 1-30
a + b 1-33 (8)
a 0.0004 0.3326 0.0002 1 "04 Mg(2) b 0-0008 0-3324 0.0005 1-39
a + b 0.0001(7) 0.3330(4) 0.0001(4) 1.38(7)
a 0.215 0.168 0.114 1.44 O(H) b 0.198 0.163 0-114 1-72
a + b 0-1980(17) 0.1677(10) 0-1132(9) 1.50(12)
a 0.711 0.001 0.119 1"53 O(1) b 0-703 0-001 0-119 1.45
a + b 0"7022(15) 0.0015(9) 0-1183(8) 1.50(12)
a 0.716 0.337 0.122 1"57 0(2) b 0.703 0.333 0' 122 1-80
a + b 0'7030(16) 0.3363(10) 0.1204(9) 1.80(13)
a 0"738 0.170 0.344 1"40 0(3) b 0.746 0.166 0.348 1"81
a + b 0-7439(16) 0.1693(10) 0.3472(9) 2.07(14)
a 0-520 0-428 0-345 1.59 0(4) b 0,521 0.423 0.349 1-72
a + b 0.5216(16) 0.4283(10) 0.3475(9) 2"13
a 0.031 0.412 0-350 1 "37 0(5) b 0.019 0.419 0.350 2.11
a + b 0,0202(16) 0.4122(10) 0.3487(9) 2-01(15)
*Set a: Intensities for crystal 1 rotated about a axis: Set b: Intensities for crystal 2 rotated about b axis: Set a + b: Scaled intensities from sets a and b.
107
significantly with the splitting o f the spots, but the R fac tor was worse when the scaling factors were used to cor rec t the intensity est imates , probably because the small number of regions gave too coarse a correc t ion scale.
A n improvemen t in the agreement be tween ob- se rved and calculated structure factors was ob- ta ined by scaling together the a and b axis intensity measuremen t s after least squares refinements. The combined set o f 669 structure factors gave R --- 14-9 per cent for isotropic and 13.5 per cent for ani- sotropic vibrat ion of the atoms, and the der ived coordinates form the third set in Tab le 3. In a
fur ther re f inemen t a posi t ion x = 0 . 2 3 + 0 . 0 4 , y = 0 . 2 0 _ 0 . 0 2 , z = 0 - 2 4 + 0 - 0 2 was found for hydrogen with a tempera ture fac tor B = 3__+5. Including hydrogen did not significantly alter the parameters of the o ther atoms.
L a y e r s y m m e t r y T h e layer fits into the cell so that the mirror
plane in an ideal layer lies along the diagonal of the cell f rom 0, 0 , 0 to 1, 1, 0 and perpendicular to the C face. This is the M arrangement of Brindley, Ough ton and Rob inson (1950). O the r choices of the talc unit cell could give L or N arrangements,
CCM: Vo|. 21, No. 2 - C
108 J . H . RAYNER and G. BROWN
but would not be close to monoclinic in shape as this cell is. The center of symmetry implied by the 2/m symmetry of the ideal layer is retained in the C]- symmetry of talc structure. The addition of a mirror plane to the center of symmetry generates a two fold axis, and vice versa and the small distortions from 2/m symmetry are conveniently measured as distances from the plane. The pseudo symmetry plane passes exactly through the Mg(1) atoms at the centers of symmetry and 0(4) and OH are not significantly displaced (by 0.004___0.008 and 0-006 ~ 0.008 ~ ) from their images in the plane. Other atoms are significantly, but very little, displaced. The largest displacement is of 0(22 from the mirror image of O(1) by 0.025---0.011 A; the most significant displacement is of Mg(2) from the image of the centrosymmetrically related Mg(2) atom, by 0.018--_ 0.004 A.
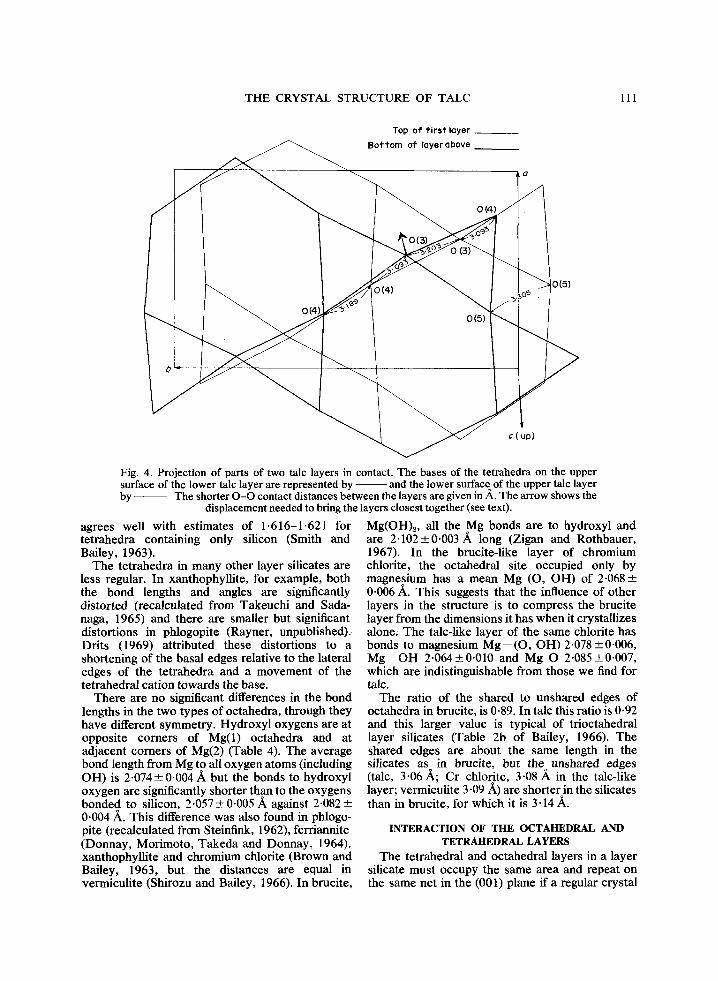
INTERLAYER CONTACTS AND STACKING The tetrahedral twist is only 3.4 ~ so that when
the surface oxygen sheet is represented by lines between the centers of the oxygen atoms, it is only a little distorted from a quasi-regular tesselation of equilateral triangles and regular hexagons (Coxeter, 1948, p. 60). In micas, the distorted hexagons of adjacent layers lie over one another and form trigonally distorted hexagonal prisms round the interlayer cations. In paragonite, the sodium atom is small enough for the oxygen atoms of the two hexagons to be in van der Waals contact with one another (two O - O distances of 3.09 and four of 3.24 ,~, Burnham, 1963). In talc, the adjacent layer surfaces are displaced so that the oxygen atoms can pack together and allow the layers to come closer together. Fig. 3 shows that there is a sequence of contacts 0 ( 3 ) - 0 ( 4 ) - 0 ( 4 ) - 0 ( 3 ) - 0 ( 3 ) zig-zagging between the sheets. The shortest distances are 3.093 ,~ between the 0(3) and 0(4) atoms if this contact distance were maintained, and if the hexagons were superposed without lateral displace- ment, as in mica, the layers would be 0.27 A further apart.
The layers could be packed 0-1 ,~ closer together without any closer contact between oxygen atoms if 0(3) were moved, as shown by the arrow in Fig. 3, to the center of the triangle formed by O(3), 0(4) and 0(5) in the adjacent layer. That this arrangement with closest approach to the layers is not found may be due to interaction of second nearest neighbors. In the structure we found the free space between the layers is concentrated around the centers of symmetry at ~,1 ~,1 �89 and ], ] �89 However , the van der Waals contact radius is only about 0-8 A so the space is unlikely to contain either the water or the small amounts of N a and K found in some analyses.
The contact distances between oxygen atoms of
opposing layer surfaces are not all equal, but the packing of the layers causes little or no distortion of the surface, and the z coordinates of the surface oxygen atoms are not significantly different. The contact surfaces of the layers interpenetrate and so the layers cannot slide over one another without separation. Amelinckx and Delavignette (1961) showed by electron microscopy that talc sheets slide over one another by the movement of ribbons of dislocations in which three different slightly less stable arrangements of the contact surfaces are adopted locally, leaving most of the surface in a single relative position of close contact. The struc- ture found here is similar to the stacking that, on the basis of a layer structure with untwisted tetra- hedra, they thought most likely. The twist of the tetrahedra alters the arrangement of surface oxygen atoms from the regular hexagonal ar- rangement, but the positions of close approach at the ends of the partial Burgers' vectors are little altered by the tetrahedral twist.
In talc, if the hydroxyl oxygen lying below the center of the hexagon of oxygen atoms in each half layer is taken as a reference point, its displacement in the plane of the layers can be divided into two parts. Within the,. layer, the displacement from lower to upper half layer is nearly ( - 1/6 a - l /6b), equivalent to about 1/3 of an a length axis, (the axis called aa by Brindley, Oughton and Robinson (1950)). Between layers, the displacement is rather less than this, - -0 .11a+0 .16b , so that the overall shift for one unit cell lies nearly along - - a and is about 1/4 a combined with a small displace- ment along -- b.
This layer stacking in talc is one of the three possible stacking patterns found by a sub-cell refinement of the pyrophylli te structure (Rayner and Brown, 1965). Brindley and Wardle (1970) found triclinic samples of pyrophylli te with a = 5-173, b = 8.960, c = 9.360A, a = 91.2~ = 100.4 ~ y = 90-0 ~ similar to the C cell chosen for talc. The displacement between adjacent layers of this pyro- phyllite is - 0 . 3 a - 0 . 0 2 b suggesting a similar stacking to that found for talc and this is confirmed by a structure refinement of the powder diffraction intensities (Wardle and Brindley, 1972).
BOND LENGTHS AND ANGLES The standard deviations of the coordinates
(Table 3) and bond lengths (Table 4) are obtained by least squares refinement and probably underes- t imate the errors, particularly when bond lengths are compared with those in different substances (Hamilton and Abrahams, 1970). Table 4 gives mean bond lengths and angles between chemically similar sets of atoms. The standard deviation of the means are calculated as though the bond lengths were independent, but in some cases this will
THE CRYSTAL STRUCTURE OF TALC 109
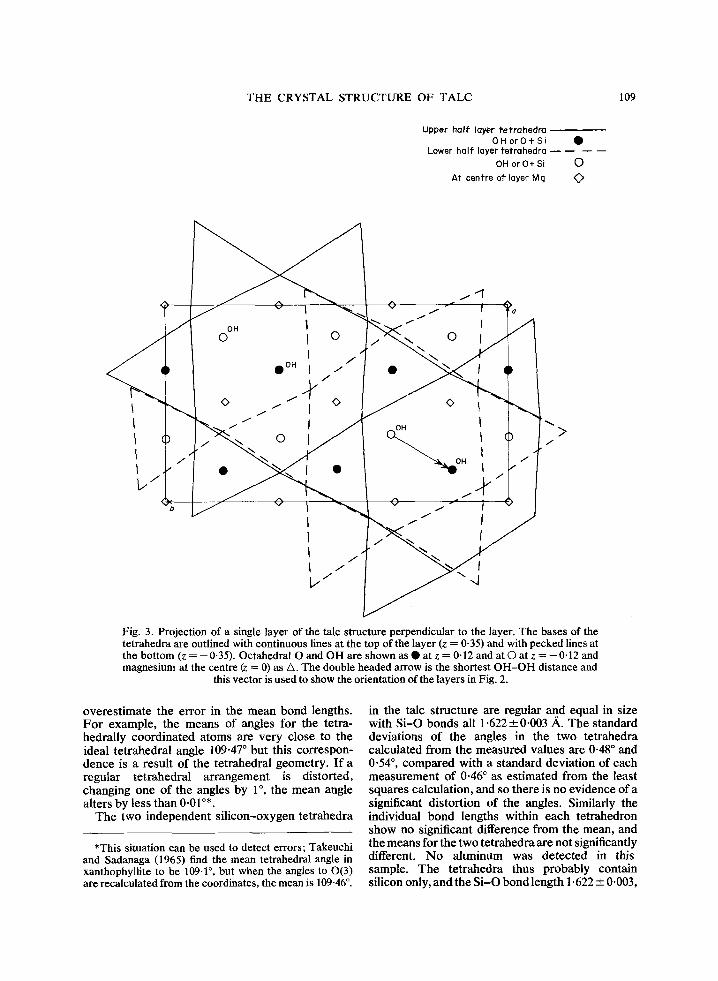
Upper half layer "l'e'trohedre O H o r O + S i
Lower half layer fetrahedro
OH or 0 + Si
At cenfre of- layer Mg
0
0
l ~ / ~I
j o I ~ o / - ?a
/ 0 I 0 ~ 0 "
D @o. I - / �9
0 / ' q ~ /
I / " H /
/ /
t.. / \d
> /
Fig. 3. Projection of a single layer of the talc structure perpendicular to the layer. The bases of the tetrahedra are outlined with continuous lines at the top of the layer (z = 0.35) and with pecked lines at the bottom (z = - 0.35). Octahedral O and OH are shown as �9 at z = 0.12 and at O at z = --0.12 and magnesium at the centre ~z = 0) as A. The double headed arrow is the shortest OH-OH distance and
this vector is used to show the orientation of the layers in Fig. 2.
overestimate the error in the mean bond lengths. For example, the means of angles for the tetra- hedrally coordinated atoms are very close to the ideal tetrahedral angle 109"47 ~ but this correspon- dence is a result of the tetrahedral geometry. If a regular tetrahedral arrangement is distorted, changing one of the angles by 1 ~ the mean angle alters by less than 0-01 ~
The two independent silicon-oxygen tetrahedra
*This situation can be used to detect errors; Takeuchi and Sadanaga (1965) find the mean tetrahedral angle in xanthophyllite to be 109-1 ~ but when the angles to 0(3) are recalculated from the coordinates, the mean is 109-46 ~ .
in the talc structure are regular and equal in size with Si-O bonds all 1.622 _+ 0.003 A. The standard deviations of the angles in the two tetrahedra calculated from the measured values are 0-48 ~ and 0.54 ~ compared with a standard deviation of each measurement of 0.46 ~ as estimated from the least squares calculation, and so there is no evidence of a significant distortion of the angles. Similarly the individual bond lengths within each tetrahedron show no significant difference from the mean, and the means for the two tetrahedra are not significantly different. No aluminum was detected in this sample. The tetrahedra thus probably contain silicon only, and the Si -O bond length 1.622 • 0-003,
110 J . H . R A Y N E R and G. B R O W N
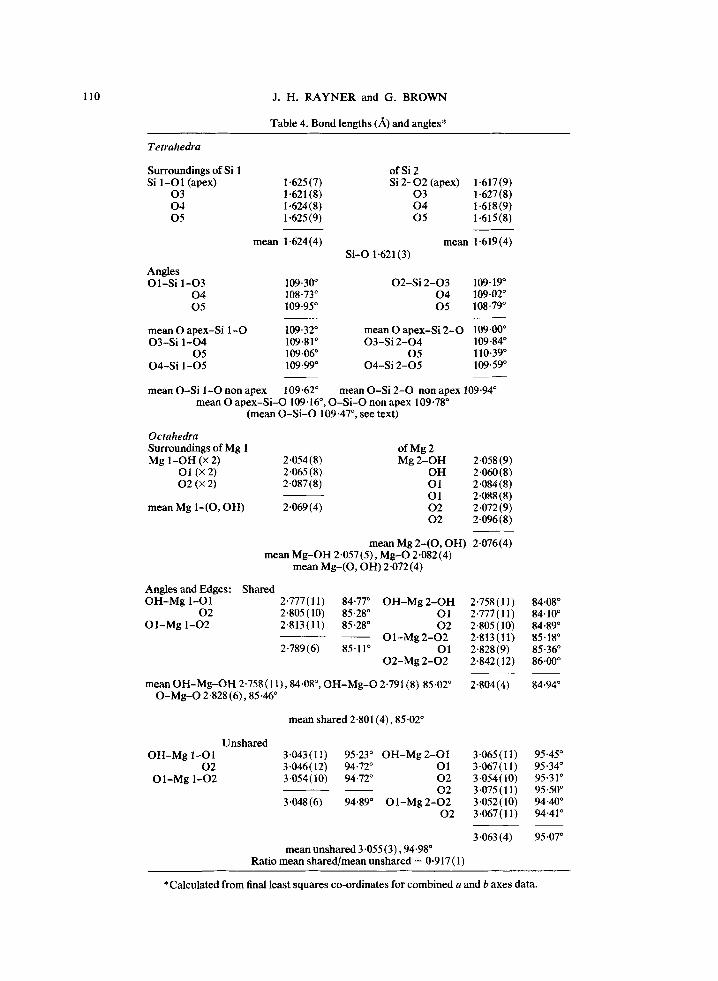
Table 4. Bond lengths (A) and angles*
Tetrahedra
Surroundings of Si 1 of Si 2 Si 1-O1 (apex) 1.625(7) Si 2 - 0 2 (apex) 1.617(9)
0 3 1.621 (8) 0 3 1.627 (8) 0 4 1-624(8) 0 4 1.618(9) 0 5 1.625(9) 0 5 1-615(8)
mean 1.624(4) mean 1-619(4) S i -O1.621(3)
Angles O l - S i 1-O3 109.30 ~ O2-S i 2 - 0 3 109-19 ~
0 4 108-73 ~ 0 4 109-02 ~ 0 5 109"95 ~ 0 5 108-79 ~
m e a n O apex-Si 1 -O 109.32 ~ mean O apex -S i 2 - 0 109-00 ~ O 3 - S i 1 -O4 109.81 ~ O 3 - S i 2 - 0 4 109-84 ~
0 5 109"06 ~ 0 5 110-39 ~ O 4 - S i 1 -O5 109.99 ~ O4-S i 2 - 0 5 109-59 ~
mean O-S i 1 -O non apex 109"62 ~ mean O-S i 2 - 0 non apex 109-94 ~ mean O a p e x - S i - O 109.16 ~ O - S i - O non apex 109.78 ~
(mean O - S i - O 109.47 ~ see text)
Octahedra Surroundings of Mg 1 of Mg 2 Mg 1 - O H (• 2) 2.054 (8) Mg 2 - O H 2.058 (9)
O1 (x 2) 2"065(8) O H 2.060(8) 0 2 (x 2) 2.087(8) O1 2.084(8)
O1 2.O88(8) mean Mg 1-(O, OH) 2-069 (4) 0 2 2.072 (9)
0 2 2-096(8)
mean Mg 2 - ( 0 , OH) 2.076(4) mean M g - O H 2.057 (5), M g - O 2.082 (4)
mean M g - ( O , OH) 2.072 (4)
Angles and Edges: Shared O H - M g 1-O1 2.777(11) 84"77 ~ O H - M g 2 - O H 2.758(11)
0 2 2-805(10) 85.28 ~ O1 2.777(11) O 1 - M g 1-O2 2.813(11) 85.28 ~ 0 2 2.805(10)
O 1 - M g 2 - O 2 2-813(11) 2.789 (6) 85.11 ~ O 1 2.828 (9)
O 2 - M g 2 - 0 2 2-842 (12)
84.08 ~ 84.10 ~ 84.89 ~ 85.18 ~ 85-36 ~ 86-00 ~
m e a n O H - M g - O H 2 " 7 5 8 ( 1 1 ) , 8 4 - 0 8 ~ 85.02 ~ 2-804(4) O - M g - O 2 . 8 2 8 ( 6 ) , 8 5 . 4 6 ~
84.94 ~
mean shared 2.801(4), 85.02 ~
O H - M g 1 -O 1 0 2
O I - M g 1-O2
U n s h a r e d 3-043( l l ) 95-23 ~ O H - M g 2 -O1 3-065(11) 3.046(12) 94.72 ~ O1 3-067(11) 3.054 (10) 94.72 ~ O2 3 -054 (10)
0 2 3-075(11) 3.048(6) 94.89 ~ O l - M g 2 - O 2 3-052(10)
0 2 3.067(11)
95 "45 ~ 95 "34 ~ 95.31 ~ 95 "50 ~ 94-40 ~ 94.41 ~
m e a n unshared 3.055 (3), 94-98 ~ Ratio mean sha red /mean unshared = 0.917 (1)
3.063 (4) 95.07 ~
*Calculated from final least squares co-ordinates for combined a and b axes data.
THE CRYSTAL STRUCTURE OF TALC 111
/
b
/
Top of "first layer
Bo'l"l'om of layer above
0(4-
0(4) ~*'~'"I ~ (4)
~G
c (up)
0(5)
Fig. 4. Projection of parts of two talc layers in contact. The bases of the tetrahedra on the upper surface of the lower talc layer are represented by and the lower surface of the upper talc layer by The shorter O-O contact distances between the layers are given in A. The arrow shows the
displacement needed to bring the layers closest together (see text).
agrees well with estimates of 1.616-1.621 for tetrahedra containing only silicon (Smith and Bailey, 1963).
The tetrahedra in many other layer silicates are less regular. In xanthophyllite, for example, both the bond lengths and angles are significantly distorted (recalculated from Takeuchi and Sada- naga, 1965) and there are smaller but significant distortions in phlogopite (Rayner, unpublished). Drits (1969) attributed these distortions to a shortening of the basal edges relative to the lateral edges of the tetrahedra and a movement of the tetrahedral cation towards the base.
There are no significant differences in the bond lengths in the two types of octahedra, through they have different symmetry. Hydroxyl oxygens are at opposite comers of Mg(1) octahedra and at adjacent comers of Mg(2) (Table 4). The average bond length from Mg to all oxygen atoms (including OH) is 2.074• A but the bonds to hydroxyl oxygen are significantly shorter than to the oxygens bonded to silicon, 2.057 • 0.005 A against 2.082 • 0.004 ~. This difference was also found in phlogo- pite (recalculated frma Steinfink, 1962), ferriannite (Donnay, Morimoto, Takeda and Donnay, 1964). xanthophyllite and chromium chlorite (Brown and Bailey, 1963, but the distances are equal in vermiculite (Shirozu and Bailey, 1966). In brucite,
Mg(OH)2, all the Mg bonds are to hydroxyl and are 2 .102• long (Zigan and Rothbauer, 1967). In the brucite-like layer of chromium chlorite, the octahedral site occupied only by magnesium has a mean Mg (O, OH) of 2.068 • 0.006 A. This suggests that the influence of other layers in the structure is to compress the brucite layer from the dimensions it has when it crystallizes alone. The talc-like layer of the same chlorite has bonds to magnesium M g - ( O , OH)2.078 ___0.006, M g - O H 2.064• and Mg O 2-085• which are indistinguishable from those we find for talc.
The ratio of the shared to unshared edges of octahedra in brucite, is 0-89. In talc this ratio is 0.92 and this larger value is typical of trioctahedral layer silicates (Table 2b of Bailey, 1966). The shared edges are about the same length in the silicates as in brucite, but the~ unshared edges (talc, 3.06 A; Cr chlorio'te, 3.08 A in the talc-like layer; vermiculite 3-09 A) are shorter in the silicates than in brucite, for which it is 3.14 A.
INTERACTION OF THE OCTAHEDRAL AND TETRAHEDRAL LAYERS
The tetrahedral and octahedral layers in a layer silicate must occupy the same area and repeat on the same net in the (001) plane if a regular crystal
112 J . H . RAYNER and G. BROWN
with flat layers is to be formed. The area occupied by tetrahedral layers depends on the angle of rotation of the tetrahedra. In micas the area can also be altered by shortening the basal O - O dis- tances in the tetrahedra and increasing the O-O distances to the apical oxygen.
From a statistical analysis of the angles of twist in micas, McCauley and Newnham (1971) find that the strongest component in predicting the angle of twist is the ratio of tetrahedral to octa- hedral bond lengths estimated from the chemical composition and standard cation to oxygen bond lengths. A less important component is the field strength (valency/ionic radius) of the interlayer cation, which they suggest influences the angle by contracting the basal tetrahedral O - O distances. On this model the talc structure would have undistorted tetrahedra (as we have found) because there are no interlayer cations and adjustment of the tetrahedral layer area must be by twist only.
The octahedral layer area can be adjusted by shortening the shared octahedral O-O edges. This distortion from a layer of regular octahedra is found in micas and also in structures where the octa- hedral oxygen atoms are all attached to hydrogen rather than silicon as in Mg(OH)2 (brucite), Ca(OH)2 and AI(OH)3 (gibbsite). That this ar- rangement of flattened layers is more stable because like charges within the layers are further apart is suggested by electrostatic energy calcula- tions for crystals of Ca(OH)2. Energies were calculated for structures with different ratios of shared (s) to unshared (u) octahedral edge lengths; the spacing of the layers was adjusted to keep the -- OH groups in van der Waals contact. There is a minimum of electrostatic energy for the model Ca2+(O2-H+)2 at s/u = 0.92 and for a model with charges reduced to Ca 2+ (O 1�89 at s/u = 0.87, a ratio very close to the observed value of 0.86.
If the charges and other forces were well enough known then it would be possible to predict the s/u ratio of the octahedral layer in micas and the response of the layer to forces transmitted from t he tetrahedral layer. McCauley and Newnham (1971) suggest that the changes in the angle of twist (a) are about half what they would be if all the adjustment was made by the tetrahedral layer. These authors also suggest that an equal adjustment is made by the octahedral layer. If their regression relation- ship, based on micas and on an Mg-O distance of 2.10 A, is applied to talc, the predicted twist is 1.2 ~ rather than the observed 3.4 ~
The original prediction of Radoslovich (1962) suggests that the octahedral layer in talc would have a greater basal area than the tetrahedral layer and so the tetrahedra would have zero twist and would be distorted to increase the size of their bases. This prediction was based on a shorter Si-O
distance, 1.60 A, than was deduced later by Smith and Bailey (1963) from more accurately determined structures. Smith and Bailey's distance 1.616-1.621
would predict a zero to 2 ~ twist but the change of cos at at ct near zero is too small to make an accurate prediction. This value agrees with the measured small twist of 3.4 ~ (esd 0.2~ This twist only reduces the size of the layer by 0.21 per cent of its linear dimensions, but shows that the layer is not being stretched by the octahedral layer.
REFERENCES Aleixandre, V. and Alvarez Estrada, D. (1952) Estudos
sobre talcos espafioles y sus aplicaciones en dielrctricos para La alta frecuencia. Consejo Superior de Investi- gaciones Cientificas, Madrid.
Amelinckx, S. and Delavignette, P. (1961) Electron microscope observation of dislocations in talc: J. appl. Phys. 32, 341-351.
Bailey, S. W. (1966) The status of clay mineral structures: Clays and Clay Minerals 14, 1-23.
Brindley, G. W., Oughton, B. M. and Robinson, K. (1950) Polymorphism of the chlorites-I. Ordered structures: .4cta Crystallogr. 3, 408-416.
Brindley, G. W. and Wardle, R. (1970) Monclinic and triclinic pyrophyllite: Am. Mineralogist 55, 1259-1272.
Brown, B. E. and Bailey, S. W. (1963) Chlorite poly- typism-II. Crystal structure of a one layer Cr- chlorite: Am. Mineralogist 48, 42-61.
Brown. G. (1965) Significance of recent structure determinations of layer silicates for clay studies: Clay Minerals 6, 73-82.
Burnham, C. W. and Radoslovich, E. W. (1964) Crystal structures of coexisting muscovite and paragonite: Carnegie Institute Year Book, 63, pp. 232-236. Washington D.C. (and privately communicated co- ordinates).
Coxeter, H. S. M. (1948) Regular Polytopes. Methuen, London.
Deer, W. A., Howie, R. A. and Zussman, J. (1962)Rock Forming Minerals-Il l . Sheet Silicates. Longmans, London.
Donnay, J. D. H., Donnay, G., Cox, E. G., Kennard, O. and King, M. V. (1963) Crystal Data Determinative Tables. 2nd Edn. Monograph 5. American Crystallog- raphic Association.
Donnay, G., Donnay, J. D. H. and Takeda, H. (1964) Trioctahedrai one layer micas-lI . Prediction of the structure from composition and cell dimensions: Acta Crystallogr., 17, 1374-1381.
Donnay, G., Morimoto, N., Takeda, H. and Donnay, J. D. H. (1964) Trioctahedral one layer micas-I. Crystal structure of a synthetic ion mica: Acta Crystal- Iogr. 17 1369-1373.
Drits, V. A. (1969) Some general remarks on the structure of trioctahedral micas, pp. 51-59. Proc. (Tokyo)Inter- national Clay Conference, Israel U.P., Jerusalem.
El-Attar, H. A., Jackson, M. L. and Volk, V. V. (1972) Fluorine loss from silicates on ignition: Am. Miner- alogist 57, 246-252.
Farmer, V. C. (1958) The infra-red spectra of talc, saponite and hectorite: Mineralog. Mag. 31, 829-945.
Farmer, V. C. and Russell, J. D. (1964) The infra-red
T H E CRYSTAL S T R U C T U R E OF TALC 113
spectra of layer silicates: Spectrochimica Acta 20, 1149-1173.
Gruner, J. W. (1934) The crystal structures of talc and pyrophyllite: Zeit. Krist. 88, 412-419.
Hamilton, W. C. and Abraham, S. G. (1970) International Union of Crystallography Single Crystal Intensity P ro jec t - I I . Least squares refinements of structural parameters: A cta. CrystaUogr. A26 18-24.
Hendricks, S. B. (1938) On the crystal structure of talc and pyrophyllite: Zeit Krist. 99, 264-274.
Hendricks, S. B. (1940) Variable structures and con- tinuous scattering from layer silicate lattices: Phys. Rev. 57, 448-454
Henry, N. F. and Lonsdale, K. (1952) International tables for X-ray crystal lography- 1. Symmetry Groups.
Kennard, O., Speakman, J. C. and Donnay, J. D. H. (1967) Primary crystallographic data: Acta. Crystallogr. 22, 445-449.
Kodama, H. and Oinuma, K. (1963) Identification of kaolin minerals in clays by X-ray and infra-red spectro- scopy: Clays and Clay Minerals 11,236-249.
McCauley, J. W. and Newnham, R. E. (1971) Origin and prediction of ditrigonal distortion in micas: Am. Miner- alogist 56, 1626-1638.
Mackenzie, R. C. (1957) Editor The Differential Thermal Investigation o f Clays. Mineralogical Society, Clay Minerals Group, London.
Pauling, L. (1930) The structure of micas and related minerals: Proc. Nat .Aca. Sci. U.S. 16, 123-129.
Radoslovich, E. W. (1962) The cell dimensions and symmetry of layer lattice s i l icates-II . Regression relations: A m. Mineralogist 47, 617-636.
Rayner, J. H. and Brown, G. (1964) Structure of pyro- phytlite: Clays and Clay Mineralsl3 73-84.
Rayner, J. H. and Brown, G. (1966) Triclinic form of talc: Nature, Lond. 212, 1352-1353.
Rayner, J. H. The crystal structure of phlogopite (to be published).
Ross, M., Smith, W. L. and Ashton, W. H. (1968) Triclinic talc and associated amphiboles from Gouver- neur mining district, New York: Am. Mineralogist 53, 751-769.
Sclar, C. B., Carrison, L. C. and Schwartz, C. M. (1965) Phase equilibria in the system MgO-SiOe-HzO, 20-130Kb, 350-1300~ Basic Sci. Div. American Ceramic Society (Sept. 65).
Shirozu, H. and Bailey, S. W. (1966) Crystal structure of a two layer Mg-vermiculite: Am. Mineralogist 51, 1124-1143.
Smith J. V. and Bailey S. W. (1963) Second review of A1-O and Si-O tetrahedral distances: Acta. Crystallogr. 16, 801-811.
Steinfink, H. (1962) The crystal structure of a triocta- hedral mica: phlogopite: Am. Mineralogist 47, 886- 896.
Stewart, R. F., Davidson, E. R. and Simpson, W. T. (1965) Coherent scattering for the hydrogen atom in the hydrogen molecule: J. Chem. Phys. 42, 3175-3187.
Takeuchi, Y. and Sadanaga, R. (1966) Structural studies of brittle micas (1) the structure of Xanthophyllite refined: Min. Journ. (Japan) 4, 424-437.
Wardle, R. and Brindley, G. W. (1972) The crystal structures of pyrophyllite, ITc and of its dehydroxy- late: Am. Mineralogist 57, 732-750.
Wilkins, R, W. T. (1967) The hydroxyl-stretching region of the biotite mica spectrum. Mineralog. Mag 36, 325-333.
Wilkins, R. W. T. and Ito, J. (1967) Infra-red spectra of some synthetic talcs: Am. Mineralogist 52, 1649-1661.
Zigan, F. and Rothbauer, R. (1967) Neutronenbeugungs- messungen an Brucit: N. Jb. Miner. Mh. 4/5 137-143.
R6sum6- La structure cristaUine d'un 6chantillon de talc du Harford County, Maryland, a 6t6 d6ter- min6e par un raffinement par moindres carr6s h partir de clichfs photographiques de diffraction des rayons X. On a adopt6 une maille triclinique de groups C]-, avec a = 5,293 A, b = 9,179 A, c = 9,496 A, c~ = 90,57 ~ fl = 98,91 ~ et y = 90,03 ~
Les couches de la structure ont presque une sym6trie monoclinique, mais les anneaux d'atomes d'oxyg~ne de surface, d'une forme voisine de l'hexagone, form6s par les bases des t6tra6dres de silice ne sont pas en correspondance exacte comme ils le sont dans les micas ofa se trouvent des ions inter- feuillets; ils sont au contralre d6plac6s en partie, si bien que l'empilement des feuillets forme un cristal triclinique. Les hexagones des atomes d'oxyg~ne de surface sont d6form6s ?~ cause d'une rotation des t6tra~des de 3,4~ ainsi l'axe b e s t plus court de 0,2% de ce qu'il est dans une structure ~t hexagones r6guliers, et la rotation des t6trabdres rapproche un petit peu les ions oxyg~ne des ions magn6sium octa6driques.
Kurzrefera t - Die Kristallstruktur einer Talkprobe aus Harford County, Maryland, wurde aus R/Jnt- genbeugungsaufnahmen unter Berechnung der kleinsten Abweichungsquadrate bestimmt. Es wurde eine trikline Zelle mit a = 5,293, b = 9,179, c = 9,496/~, a = 90,57 ~ fl = 98,91 ~ und 3' = 90,03 ~ Raumgruppe C 1 angenommen. Die Schichten dieser Struktur haben fast monokline Symmetrie, doch werden die nahezu hexagonalen Ringe der Sauerstoffatome an den durch die Grundfl~ichen der Si- Tetraeder gebildeten Schichtoberft~ichen nicht durch Zwischenschichtionen aufeinander ausgerichtet, wie dies bei den Glimmern der Fall ist. Sie sind vielmehr teilweise versetzt, so dab die Schichtfolge einen triklinen Kristall bildet. Die Sechsecke der Oberfl~ichensauerstoffe sind durch eine 3,4~ der Tetraeder verzerrt, so dab die b-Achse um 0,2% kiirzer ist als in einer Struktur mit regelm~iBigen Sechsecken. Die Drehung bringt die Sauerstoffionen etwas n~iher an die oktaedrischen Magnesium- ionen heran.
114 J . H . R A Y N E R and G. BROWN
Pe3mMe - - CrpyKrypa rpHCTa~noB TaJlbra onpe j leh~acb npH nOMOU.IrI peHTreHorpaqbHH no o6pa3uy Ha xapqbopjIcKoro orpyra , MapitaanJI. FlpHnaTa TpHKnHHHaa rneTKa c a =5 , 293 , b=9 , 179 , c =9 ,496 A, ~ =90,57 ~ f l=98,91 ~ 7 = 90,03, npoMeaCyTOK rpyrmbl C 1. CaOH crpyKTypbt HMerOT noqr~ qrO MOriOKaiiHrECro CHMMeTprIm, HO Ha noBepXHOCT~ caoee HMerOTCa npHMepno mecrH- rpaHHbie KOYibI~a aTOMOB KHcnopo~a, KoropbIe He co:Iep~aTcfl B paBHOBeCHH B Me~CJIOi~HblX HOHaX raK B cam~e, a tlaCTH~tHO cMemeHbl, Tar ~ITO CTOJI6HK CJIOfl o6pa3yeT TpHg~IHmqbl~ KpHcrana. IIIecTHrpaHHHKH HoBepXHOCTm, IX KHcaopo~oB HcKa~eHb~ cKpy~_'rlBaHHeM TeTpa3~pbI Ha 3,4 ~ Tah'IIM o6paaoM OCl, b Ha 0,2 700 Kopo ~ie, qeM crpyKTypa C peryJIapnbIMH mecTHrpannHraMH, a cKpyqHsanHe caerxa npH6nH>Kaer HOHbI ICHc~opo~a K OKTa,3~paJIbHbIM HOH&M MarHHg.