Embed Size (px)
Citation preview
Vol. 6, No. 8, August 1967 NOTES 1589
is narrower for this material than for lanthanum tung- sten bronze. Above x = 0.15, WOz appears. No yttrium tungstate structureza* could be detected even when the stoichiometric value of x was 0.2. Below x = 0.09 a tetragonal form appears. It has the same lat- tice parameters as the tetragonal form of the lan- thanum tungsten bronze. The cubic lattice parameter varies from 3.800 A a t x = 0.09 to 3.815 A a t x = 0.15. Scandium does not form a tungsten bronze under the preparative conditions employed here. A mixture of Wls0494 and Wzo05g6 was found by X-ray examination.
Tungsten bronzes containing the rare earths have recently been de~cribed.~~’ In the cases reported, a tetragonal form was found a t low concentrations of the rare earths while a t higher concentrations a cubic perov- skite-type structure was found for all of the readily available rare earth elements. Magnetic studiess showed that the rare earth was present in a trivalent form. It would appear that both yttrium and lan- thanum also form tungsten bronzes in their trivalent states. This is to be expected as these elements normally exist in a trivalent state and further have essentially the same radii as the rare earths in the 12-coordinated position of the perovskite lattice. Gellers has found that relative radii of Y3+, Eu3+, and La3+ in the A position of perovskites to be 1.281, 1.304, and 1.346 A, respectively. The cubic lattice parameters for the corresponding tung- sten bronzes are in the same order. Y0.1W03 has a parameter of 3.802 A and E u 0 . 1 W 0 3 was found to have a lattice constant of 3.815 A6 while Lao.lW03 prepared here has a cubic parameter of 3.834 A.
The color of La,W03 varies from green a t x = 0.02 to blue a t x = 0.10 and finally to red-purple a t x = 0.19. A yellow form such as is found in the sodium tungsten bronzes a t high sodium concentrationsQ does not appear here.
Electrical conductivity measurements on pressed powders of the materials synthesized here indicate that all the phases prepared, with the possible exception of Lao.ozW03, have specific conductivities greater than 100 mhos/cm. The tungsten bronzes were not at- tacked by 3.7 M sulfuric acid a t 90’ even after 16 hr. The intense, lustrous color, the high electrical conduc- tivity, the resistance to attack by acid, and the range of chemical composition of these materials character- ize them as bronzes. lo
Acknowledgment.-We wish to thank the U. S. Army Electronics Command, Fort Monmouth, N. J., for supporting this research under Contract DA 36-039 AMC-O3743(E). The author is indebted to Professor E. Banks for mahy stimulating discussions, to Mr. J. T.
(3) K. Nassau, H. J. Levinstein, and G. M. Loiacono, J . Phys. Chem.
(4) ASTM X-Ray Powder Diffraction Cards 5-0392 and 5-0393. (5) ASTM X-Ray Powder Diffraction Cards 5-0386 and 5-0387. (6) W. Ostertag, Inovg. Chem., S, 758 (1966). (7) C. V. Collins and W. Ostertag, J . Am. Chem. Soc., 88, 3171 (1966). (8) S. Geller, A d a Cvyst., 10, 248 (1957). (9) M. J. Sienko, Advances in Chemistry Series, No. 39, American Chemi-
(10) S. Anderson and A. D. Wadsley, Acta Cryst . , lS, 201 (1962).
Solids, 86, 1805 (1965).
cal Society, Washington, D. c., 1963, paper 21.
Allen, Jr., for his aid in obtaining the X-ray data, and to Mr. J. T. Pavlovcak for his help in preparing the materials.
CONTRIBUTION FROM THE RESEARCH LABORATORIES, 14603 XEROX CORPORATION, ROCHESTER, NEW YORK
The Crystal Structure of Trigonal Selenium]
BY PAUL CHERIN AND PHYLLIS UNGER
Received January 31, 1967
Because of the intensified interest in trigonal sele- nium in recent years, an investigation of the Se-Se bond length, bond angle, and interchain separation was undertaken, using modern techniques of collecting and analyzing data. Elemental selenium can exist in several solid modifications : two monoclinic (CY and p) , a trigonal, a vitreous, and a cubic modification. Under normal conditions of temperature and pressure, only the trigonal phase is stable; the others, being meta- stable, slowly convert to the trigonal form. A pre- vious crystal structure determination of trigonal sele- nium was completed by BradleyJ2 who used powder photography techniques.
Experimental Section Crystals were grown by slowly cooling a saturated solution of
amorphous selenium in hot aniline. The resulting needle crystals were mounted parallel to their long axis, which was parallel to the c axis of the hexagonal cell. Those which were relatively strain free and with regular hexagonal cross sections (diameters were about 0.2 mm) were selected for further study. Two- dimensional hkO data were collected using a General Electric XRD-5 unit equipped with a quarter-circle Eulerian cradle goniostat, a scintillation counter, and a pulse-height discrimina- tor. Both Cu Koc and Mo Koc radiation (filtered with Xi and Zr, respectively) were used.
Determination and Structure The stationary crystal-stationary counter method
was used to record the reflections. This was related to integrated intensity in the usual manner. Difficulties were encountered owing to high and rapidly changing background.
For convenience, the unit cell is generally treated as hexagonal. The hexagonal cell dimensions, deter- mined by Swanson, Gilfrich, and U g r i n i ~ , ~ are a = 4.3662 and c = 4.9536 A. The space group is either P3121 or P3221. There are three atoms per unit cell, lying on twofold axes; the position of the asymmetric atom in the hexagonal cell can be described by one parameter. The usual Lorentz and polarization cor- rections were made. An absorption correction was
(1) Presented a t the 7th International Congress and Symposium of the International Union of Crystallography, Moscow, July 12-21, 1966.
(2) A. J. Bradley, Phil. Mag., 48, 477 (1924). (3) L. E. Alexander and G. S. Smith, Acta Cryst., 16, 983 (1962). (4) H. E. Swanson, N. T. Gilfrich, and G . M. Ugrinic, National Bureau of
Standards Circular 539, Vol. 5, U. S. Government Printing Office, Washing- ton, D. C., 1955, p 54.
1590 NOTES Inorganic C’lzemzstry
applied to the data, based on the assumption that the crystals were cylindrical. Although this was a source of error, a complete set of equivalent reflections was measured and averaged in each case, tending to reduce the error. Near the end of the refinement the diameter of the “cylinder” was permitted to vary. The position parameter, the standard deviation, and the reliability factor were found to be rather independent of small changes in the assumed diameter.
An anomalous dispersion correction was necessary because selenium shows considerable anomalous scatter- ing when irradiated with Cu K a and Mo Ka. Fortu- nately, in the case of a chemical element, i t is possible to apply a dispersion correction directly to the ob- served structure factors and avoid the involved correc- tions described by Patterson5 and Ibers and Hamil- tom6 For any unit cell containing one kind of atom, one may write
where A = f oH, B = f ,K, 61 = Aj”’/fo, and 8 2 = Af”/fol and H and K are geometrical structure factors and in- clude the temperature factors. The observed struc- ture amplitude may now be corrected for dispersion and used directly in a least-squares refinement. For a Fourier summation, the phase angle, @, is determined in the usual way, i.e., tan @ = B/A.
Since so few parameters were to be determined, a least-squares refinement was applied directly, using a program written by Busing, Llartin, and Levy (ORFLS)’
starting with the positional parameter of x = 0.217 re- ported by Bradley. The function minimized was Zw. ( 1 F,[ - 1 Fol) 2/ZwF,,2, where w, the weighting factors, were taken from Evanss
w(hkZ) = l/a2(hkZ)
u(hkJ) = ’/z[c(P + Q)/(p - Q)l1I2
where u(hk2) is the standard deviation of the hkl re- flection, c contains the geometrical factors such as Lorentz and polarization corrections, P is the total number of counts recorded for a reflection, and Q is the number of background counts.
Both copper and molybdenum data were refined in four cycles. Later, both sets of data were combined and once more refined.
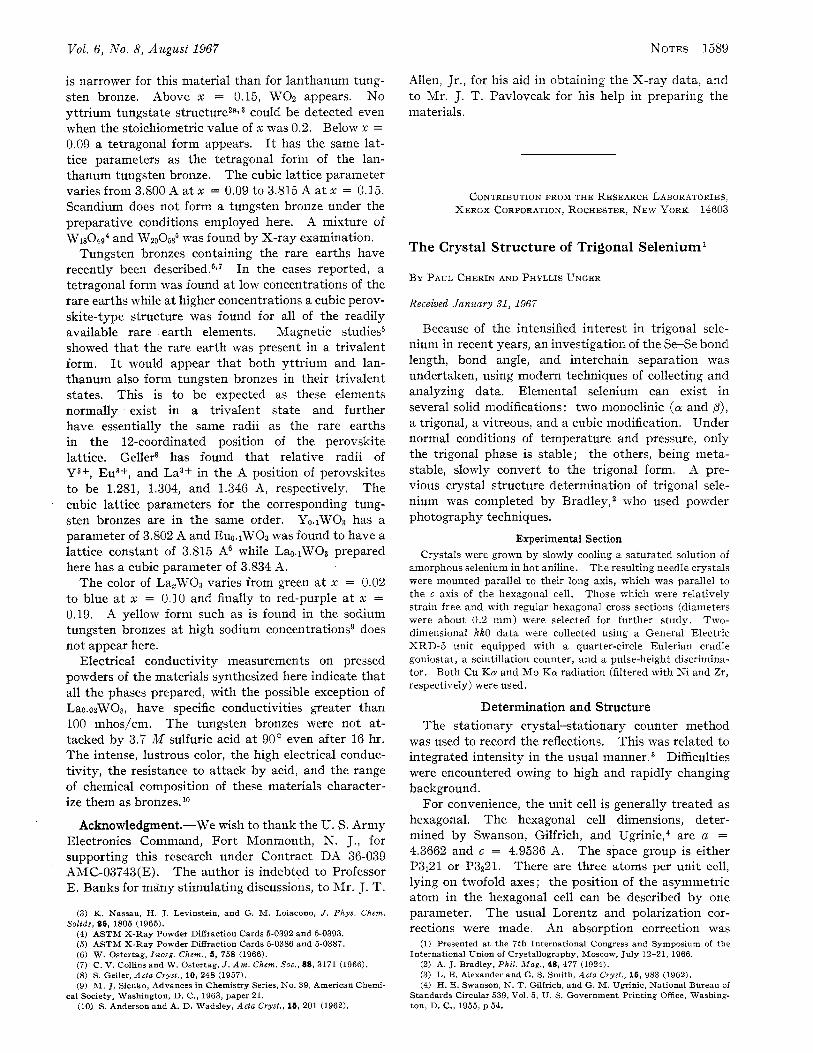
Results The position and thermal parameters are given in
Table I. This table also includes the appropriate bond length and angle as well as the root-mean-square vibrational amplitude of motion in the aa plane. In spite of the small number of independent reflections, the position parameter seemed relatively independent of the weighting. Two other weighting schemes were
( 5 ) A. L. Patterson, Acta Cryst., 16, 1256 (1963). (6) J. A. Ibers and W. C. Hamilton, ibid., 17, 781 (1964). ( 7 ) W. I<. Busing, K. 0. Martin, and H. A. Levy, “A Crystallographic
Least-Squares Refinement Program for the IBM 704,” ORh’L-59-4-37, 1959.
(8) H. T. Evans, Jr., Acta C r y s t . , 14, 689 (1961).
TABLE I THERMAL ASD POSITION PARAMETERS
OF TRIGOXAL SELENIUM
X 0.2254 i 0 0010 0.217 Bond length, A 2 . 3 7 3 i 0.005 2.33 Bond angle, deg 103.1 i 0 . 2 104.8 P11 0.0338f0.0020 P22 0.0417rt 0.0043 Rms vibrational amplitude
(along “a”), A Rms vibrational amplitude
(perpendicular to “a”), A R, % 3 . 2
used, and the position parameter did not change by more than one standard deviation.
The observed and calculated structure amplitudes are given in Table 11. Ten reflections were observed with Cu K a radiation and &lo K a yielded an addi- tional two. The intensities decreased very sharply in the range 50-60°, 20 (Mo K a ) . A great deal of scattering in the radial direction was observed on our Weissenberg photographs. These effects . were at- tributed to defects in the structure.
Cherin and Unger (1966) Bradley (1924)
0.174 =I= 0.006
0.150A 0.004
TABLE I1 OBSERVED STRUCTURE AMPLITUDES FOR TRIGOSAL SELESIUM
hkl F O F C
100 109.3 113.33 200 60.0 60.25 400 69.9 74.39 500 38.9 39.69 110 125.4 123.68 220 57.7 57.19 330 37.3 39.71 120 124.8 123. 80 130 29.8 25.15 230 33.2 33.28 140 35.5 34.85 240 16.3 15.57
The Se-Se bond length is somewhat longer than the value reported by Bradley,2 and i t is also longer than the average Se-Se bond length of 2.34 * 0.02 A re- ported by Burbankg for a-Se, a monoclinic phase in which the atoms bond in ring form. The bond angle we have found in trigonal selenium is in good agree- ment with the value of 102.6’ reported for trigonal tellurium.
Only two temperature coefficients needed to be determined because of the restrictions imposed by the twofold axis in the hexagonal cell. Of course, b33,
bI3, and bZ3 could not be determined from hkO data. The values determined for the root-mean-square am- plitudes of vibration indicate the motion is rather iso- tropic in the aa plane. No attempt has been made to separate these amplitudes into interatomic vibration and chain motion, nor has any attempt been made to correct the bond length for any “riding” motion that might exist. A recent study of tellurium has just been completed. The calculated root-mean-square ampli- tudes of vibration are almost identical with the corre- sponding selenium parameters.
(9) R. D. Burbank, ibid., 4 , 140 (1961).
Vol. 6 , No. 8, August 1967 NOTES 1591
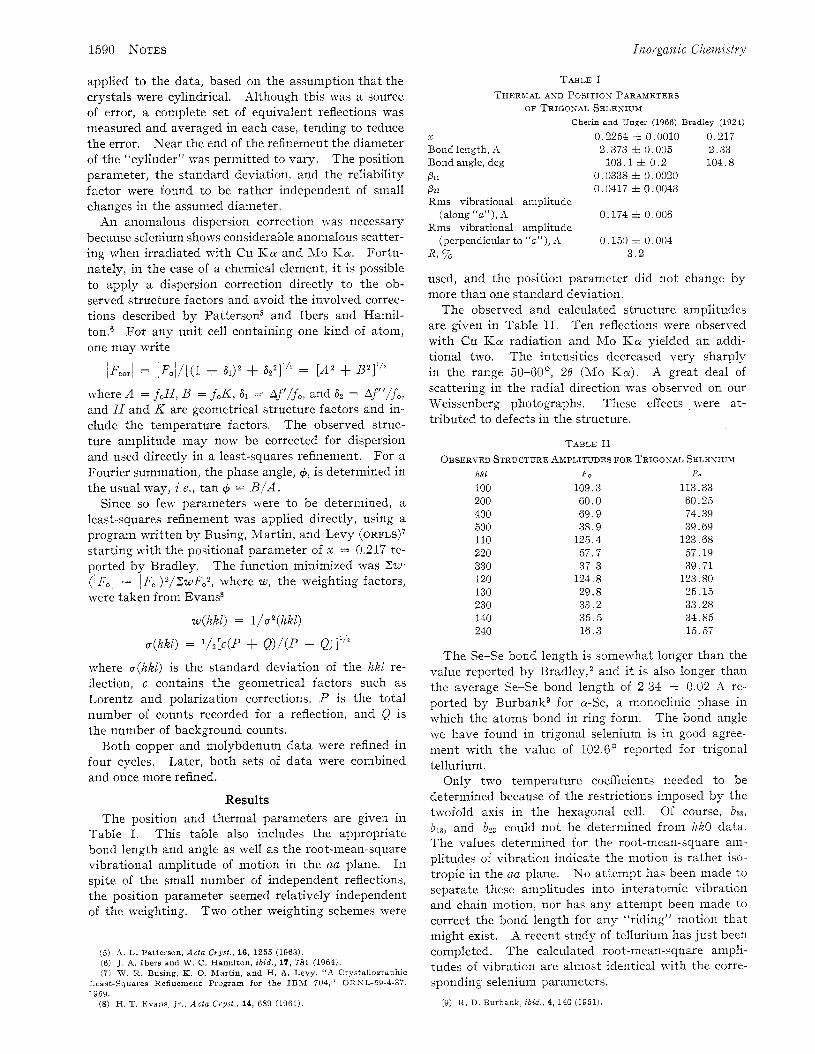
3.436: C 1 n
Figure 1.-Nearest neighbor distances in trigonal selenium.
Several important coordination distances are given in Figure 1. The nearest neighbor distance of atoms on adjacent chains (3.436 A) is considerably shorter than the 4.0 A one would expect if on3y van der Waals forces were operating between the chains. lo
The reliability factor
n
where N is the total number of observed reflections, for the combined data is quite good. However, with so few independent variables and data points (only 12 independent reflections were observed with Mo Ka: radiation; see Table 11), the standard deviations for each parameter (Table I) should be more indicative of the precision of this work.
Investigation of three-dimensional data is planned in order to learn more about the defect structure of the vibrational motion of the chains.
(10) A. Von Hippel, J . Chem. Phys., 16, 372 (1948).
CONTRIBUTION FROM THE DEPARTMENT OF CHEMISTRY, MICHIGAN STATE UNIVERSITY, EAST LANSING, MICHIGAN
The Infrared Spectra of Transition Metal Complexes of Pentamethylenetetrazole'
BY FRANK M. D'ITRI AND ALEXANDER I. POPOV
Received February 4,1967
48823
In our previous communications2 we described the preparation and physical properties of three types of transition metal perchlorate complexes of pentamethyl- enetetrazole (hereafter abbreviated a t PMT) having the
(1) Taken in part from the M.S. thesis of F. M. D'Itri, Michigan State University, Feb 1866.
(2) (a) H. A. Kuska, F. Ill. D'Itri, and A. I. Popov, Inovg. Chem., 6, 1272 (1966); (b) F. M. D'Itri and A. I. Popov, ib id . , 6, 1670 (1966); (c) F. M. D'Itri and A. 1. Popov, i b i d . , 6, 597 (1967).
compositions: Cu(PMT)&104, CU(PMT)~(CIO~)Z, and M"(PMT)~(CIO~)Z, where M" = manganese(II), iron(II), cobalt(II), nickel(II), copper(I1) , or zinc(I1). Physicochemical measurements indicate that the hexa- coordinated transition metal complexes are isomorphous and have octahedral configurations.
The present work was undertaken to determine the infrared spectra of these complexes in the 5000-180- cm-1 spectral region so as to obtain some information on the structure of these compounds and the nature of the metal-ligand bond.
Experimental Section The materials, preparation, description, analytical data, and
physicochemical properties of the transition metal complexes of PMT of the type M1I(PMT)6(C104)2, Cu(PMT)a(ClO4)2, and Cu(PMT)ZClOa have been described in previous publications.2
Infrared Measurements.-Infrared spectra in the 5000-670- cm-1 spectral regions were obtained on a Beckman IR-5A spec- trometer. The solid complexes were dispersed in Nujol. An attempt was made to measure the spectra of complexes in KBr pellets, but the compounds appeared to undergo a partial de- composition in the KBr press with the formation of metal- bromide complexes.
The measurements in the 670-180-~m-~ regions were carried out on a Perkin-Elmer 301 spectrometer. All of the spectra were obtained on Nujol mulls which were supported between plates of cesium bromide or polyethylene windows and using air or poly- ethylene of the same thickness as references. The entire system was continually flushed with dry nitrogen.
In order to obtain spectra of the complexes in the 700-100-cm-1 region, it was necessary to change gratings, mirrors, choppers, and restrahlen filters several times. It was, therefore, found convenient to obtain the spectra of all of the compounds under in- vestigation in one region before modifying the instrument for the next region. For this reason, the relative intensities of bands for the same sample in different regions probably do not have much significance. The breaks in the spectra due to these changes are shown on the figures by interruptions in the traces.
The stabilities of the complexes in the Nujol mulls were checked by remeasuring some of the spectra after 24 hr. In all cases the spectra were reproducible.
Discussion and Results (1) Infrared Spectra in the 5000-670-Cm-l Region.
Hexakis(pentamethylenetetrazo1e)-Transition Metal- Perchlorate Complexes.-The comparison of the spec- trum of PMT with those of the hexakis(pentamethy1- enetetrazo1e)-transition metal-perchlorate complexes shows little change in the PMT spectrum upon com- plexation. There are, however, small (i 3-cm-l) ab- sorption shifts which vary with the respective central metal ion. The uncomplexed perchlorate ion has a regular tetrahedral structure and belongs to the point group T d . 3 If, in the process of complexation, the C104- ion becomes coordinated to the metal ion, the oxygen atom involved in the partial covalent bonding is no longer equivalent to the other three oxygen atoms, and the symmetry of the perchlorate group is lowered to C3v. As a result, the broad, degenerate v3
band splits into two well-defined bands with maxima between 1200 and 1000 cm-l. Likewise, the chlorine- coordinated oxygen (Cl-0*) stretching frequency v2
(3) B. J. Hathaway and A. E. Underhill, J . Chem. Soc., 3091 (1961).

![IJESRT /Archives-2014/March-2014/21.pdf[1211-1215] IJESRT INTERNATIONAL JOURNAL OF ENGINEERING SCIENCES & RESEARCH TECHNOLOGY Ionic Liquids Tailoring Trigonal Selenium Microrods under](https://img.pdfslide.net/doc/110x75/6079d92a601ff95c8f120c4e/archives-2014march-201421pdf-1211-1215-ijesrt-international-journal-of-engineering.jpg)