Embed Size (px)
Citation preview
The Current Water Supply Situation
Business Briefing
Peter Flower
Director:Water & Sanitation Department 9 May 2017
Presentation Outline
1. Overview of Bulk Water supply system
2. Status of water resources and water use
3. Water demand management
4. Assurance of Supply and Water Restrictions
5. Disaster declaration and contingency planning
6. Acceleration of water resource schemes
7. Business Sector engagement
8. Future outlook

Bulk Water Infrastructure
• Dams (DWA & City) 15
• Water Treatment Plants 12
– Production Capacity 1650 Ml/day
– Current Capacity utilisation 45 %
• Reservoirs 24
– Storage Capacity 2740 Ml
– Average demand storage 3 days
– Peak demand storage 2.5 days
• Pipelines 655 km
• Water Allocation and Demand
– Allocation from System 400 Mm3 p.a.
– 2014/15 Demand 345 Mm3 p.a.
– 2015/16 Demand 330 Mm3 p.a.
– Projected 2016/17 Demand 280 Mm3 p.a.
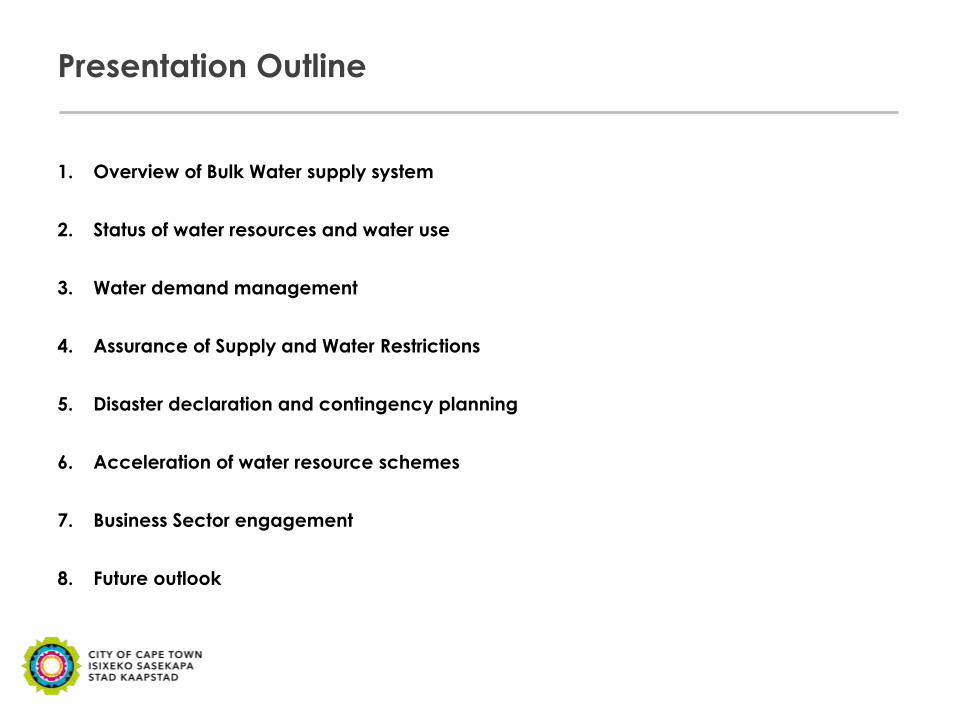
Comparative Water Use from WCWSS (2014/2015)
Cape Town:
345 Mm3/a
(64%)
Other
municipalities:
37 Mm3
(7%)
Agriculture:
158 Mm3
(29%)
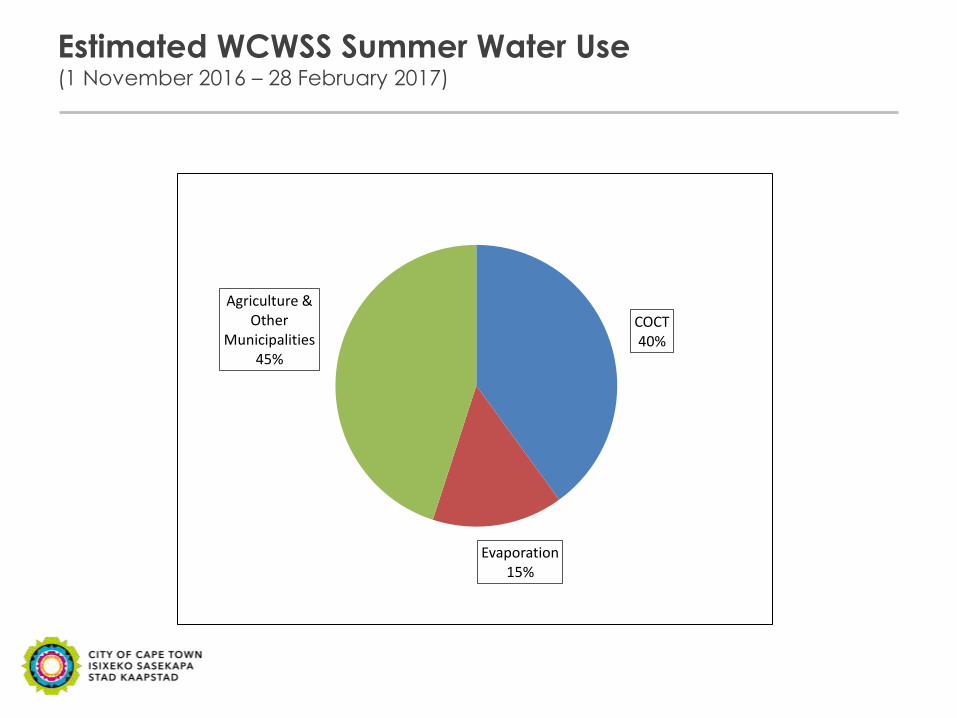
Estimated WCWSS Summer Water Use (1 November 2016 – 28 February 2017)
COCT 40%
Evaporation 15%
Agriculture & Other
Municipalities 45%

Water Use in Cape Town (2015 / 16)
Houses , 55.6%
Flats & complexes,
9.2%
Domestic other, 1.8%
Informal Settlements, 4.7%
Retail & Offices, 11.0%
Industry, 3.9%
CCT Departments & Council-owned premises,
5.2%
Government, 2.5%
Other, 6.2%
70 % Residential
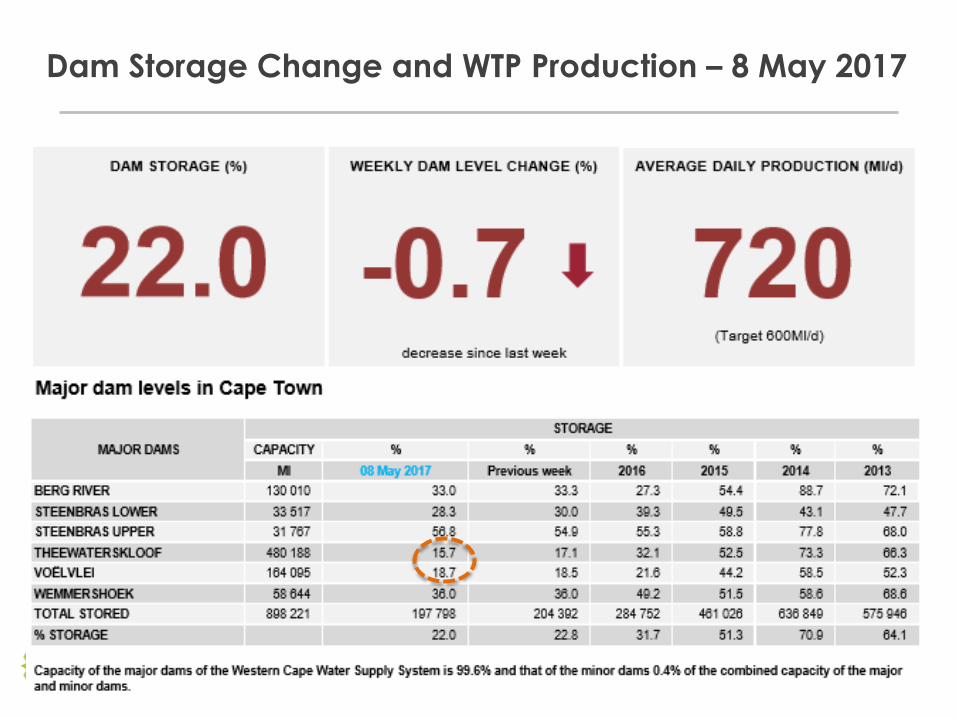
Dam Storage Change and WTP Production – 8 May 2017
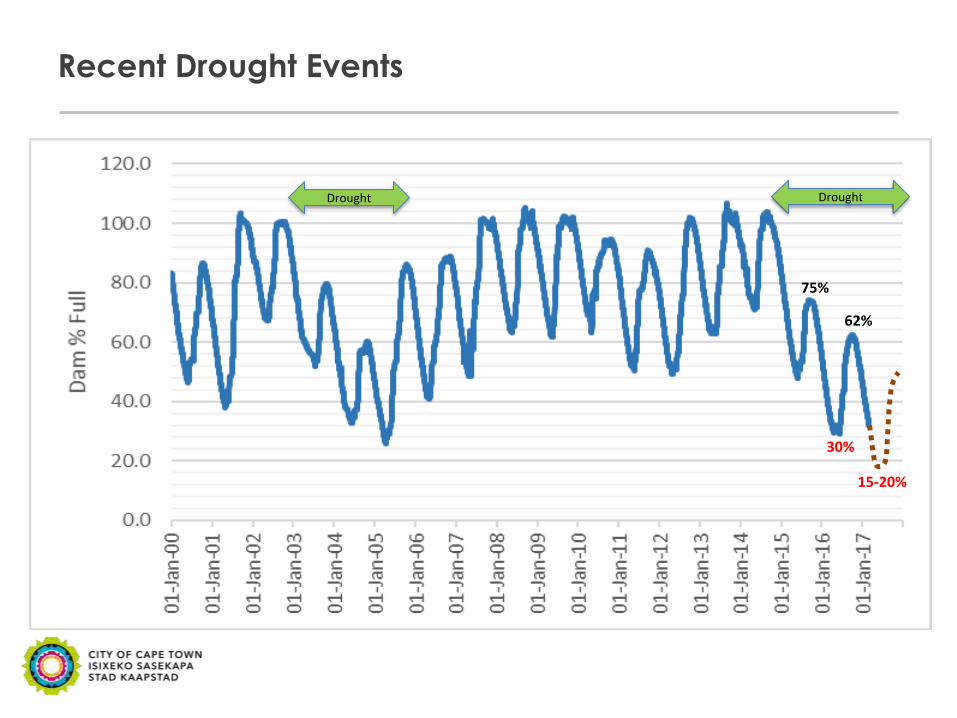
30%
15-20%
62%
75%
Drought Drought
Recent Drought Events
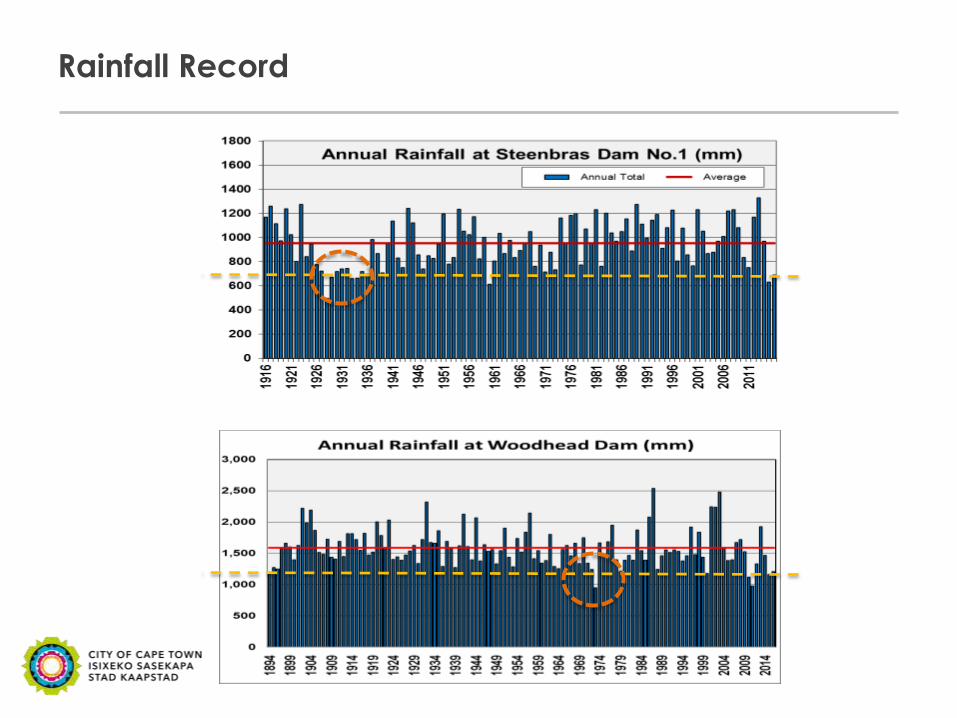
Rainfall Record

Rainfall Forecasts (SAWS / GFCSA)
Weather Outlook (March – May 2017) - Normal to below normal rainfall is expected over the Western-Cape for autumn and early winter. (PDMC Drought Monitoring Situation Report No.9)
With the possibility of a moderate El Nino event becoming more likely in the summer of 2017/18, conservative planning is advised wherever possible (SAWS 2 May 2017)
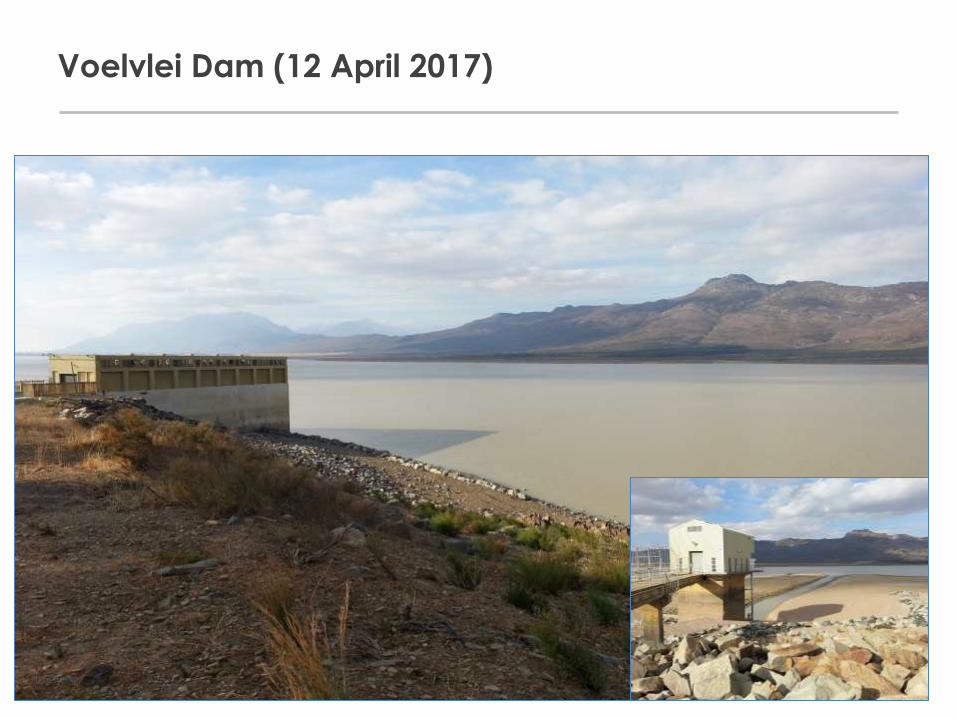
Voelvlei Dam (12 April 2017)

Theewaterskloof Dam (28 April 2017)
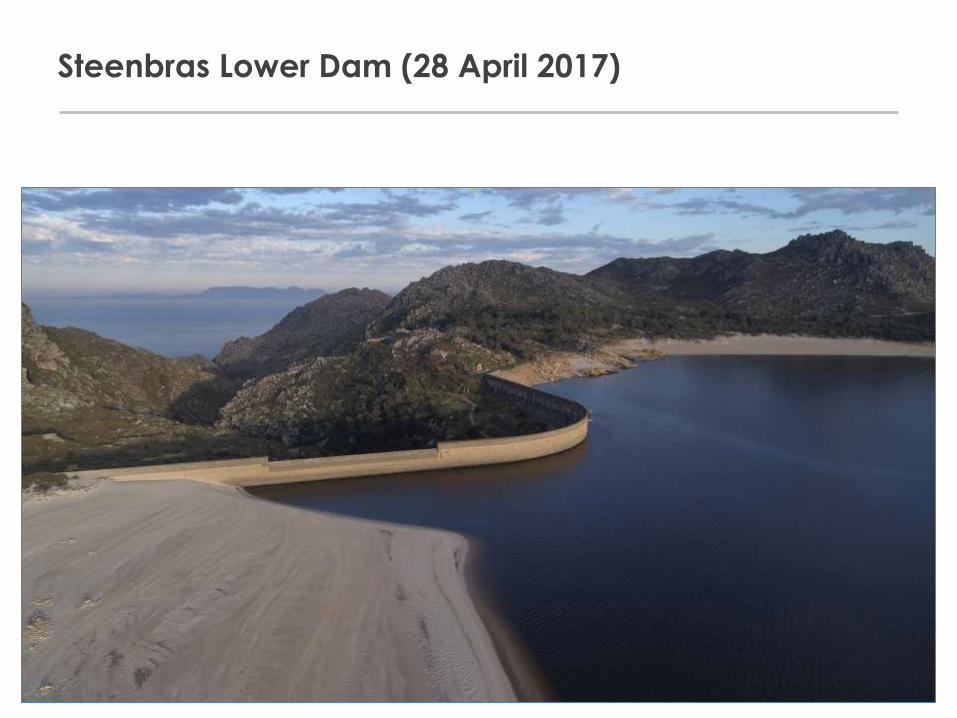
Steenbras Lower Dam (28 April 2017)
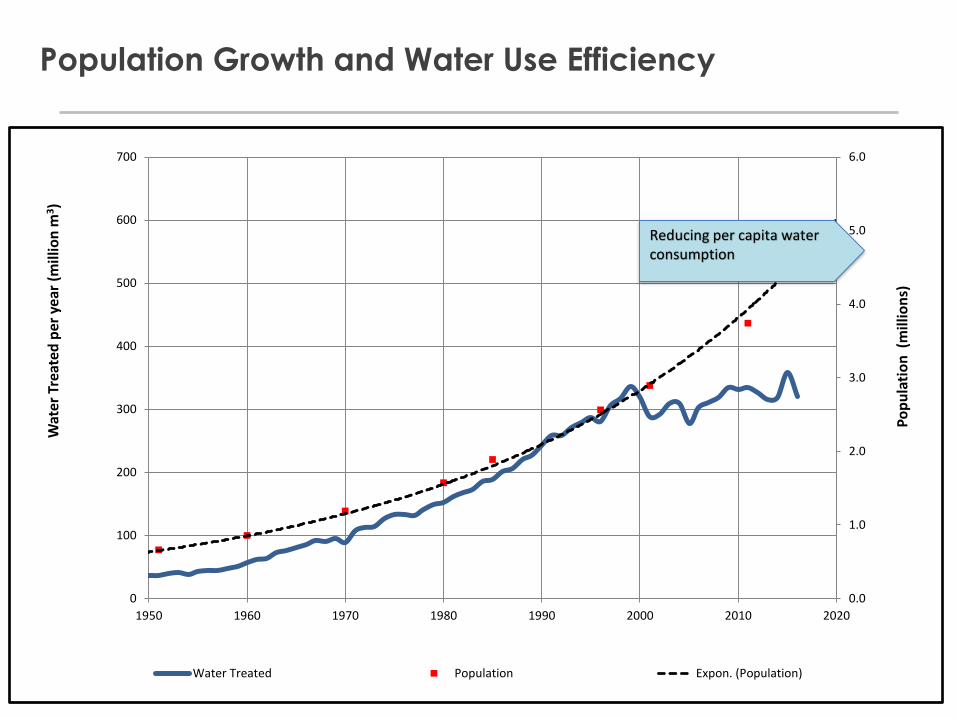
Population Growth and Water Use Efficiency
0.0
1.0
2.0
3.0
4.0
5.0
6.0
0
100
200
300
400
500
600
700
1950 1960 1970 1980 1990 2000 2010 2020
Po
pu
lati
on
(m
illio
ns)
Wat
er T
reat
ed p
er y
ear
(mill
ion
m3)
Water Treated Population Expon. (Population)
Reducing per capita water consumption
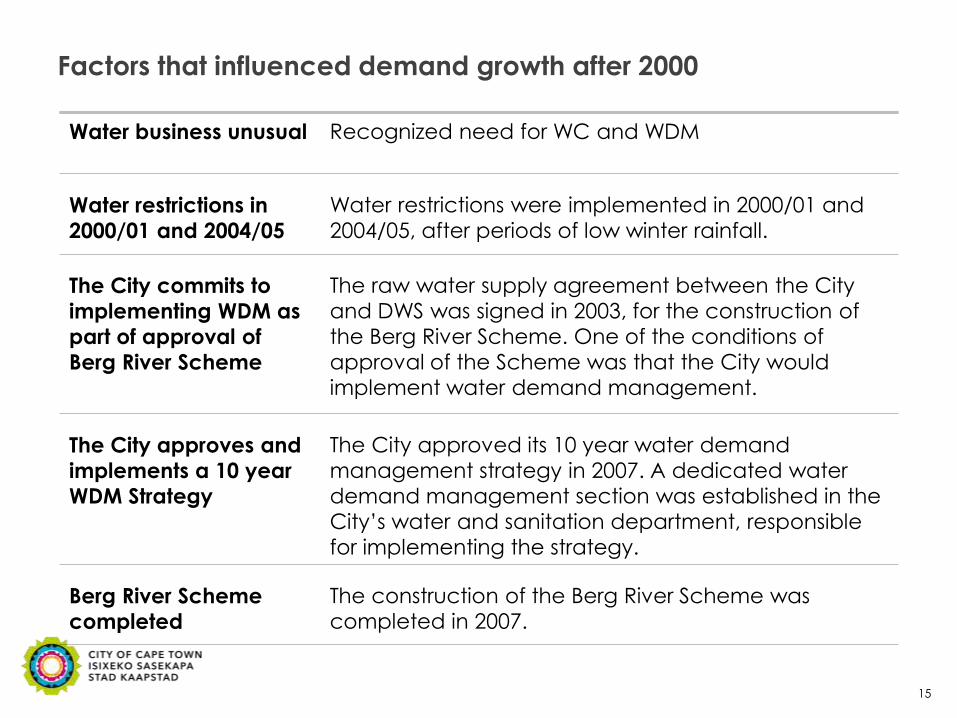
Factors that influenced demand growth after 2000
15
Water business unusual Recognized need for WC and WDM
Water restrictions in
2000/01 and 2004/05
Water restrictions were implemented in 2000/01 and
2004/05, after periods of low winter rainfall.
The City commits to
implementing WDM as
part of approval of
Berg River Scheme
The raw water supply agreement between the City
and DWS was signed in 2003, for the construction of
the Berg River Scheme. One of the conditions of
approval of the Scheme was that the City would
implement water demand management.
The City approves and
implements a 10 year
WDM Strategy
The City approved its 10 year water demand
management strategy in 2007. A dedicated water
demand management section was established in the
City’s water and sanitation department, responsible
for implementing the strategy.
Berg River Scheme
completed
The construction of the Berg River Scheme was
completed in 2007.
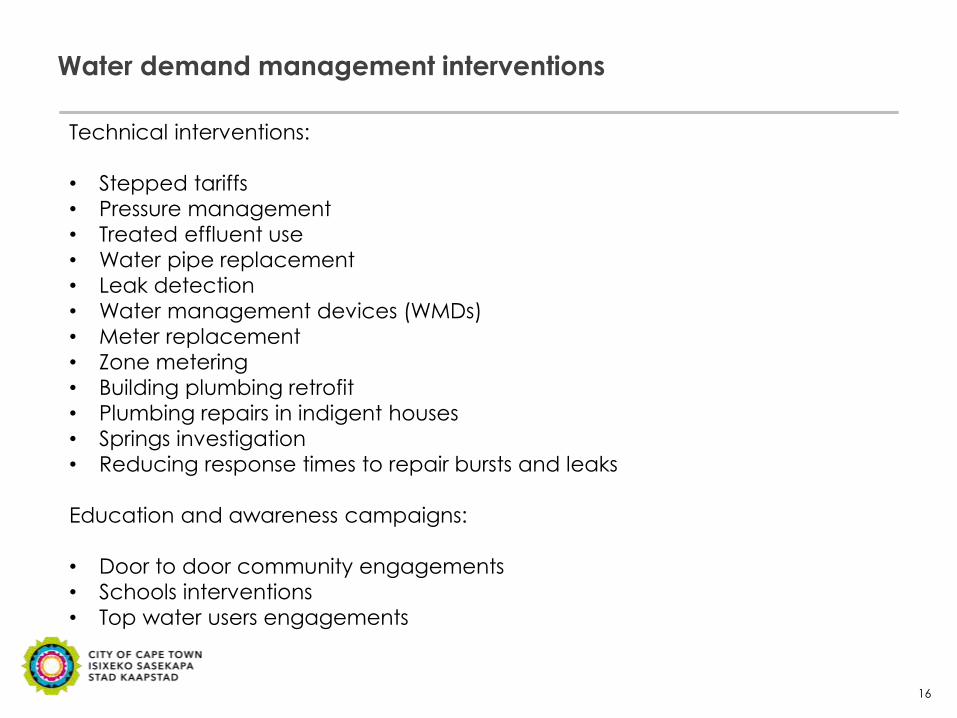
Water demand management interventions
16
Technical interventions:
• Stepped tariffs
• Pressure management
• Treated effluent use
• Water pipe replacement
• Leak detection
• Water management devices (WMDs)
• Meter replacement
• Zone metering
• Building plumbing retrofit
• Plumbing repairs in indigent houses
• Springs investigation
• Reducing response times to repair bursts and leaks
Education and awareness campaigns:
• Door to door community engagements
• Schools interventions
• Top water users engagements
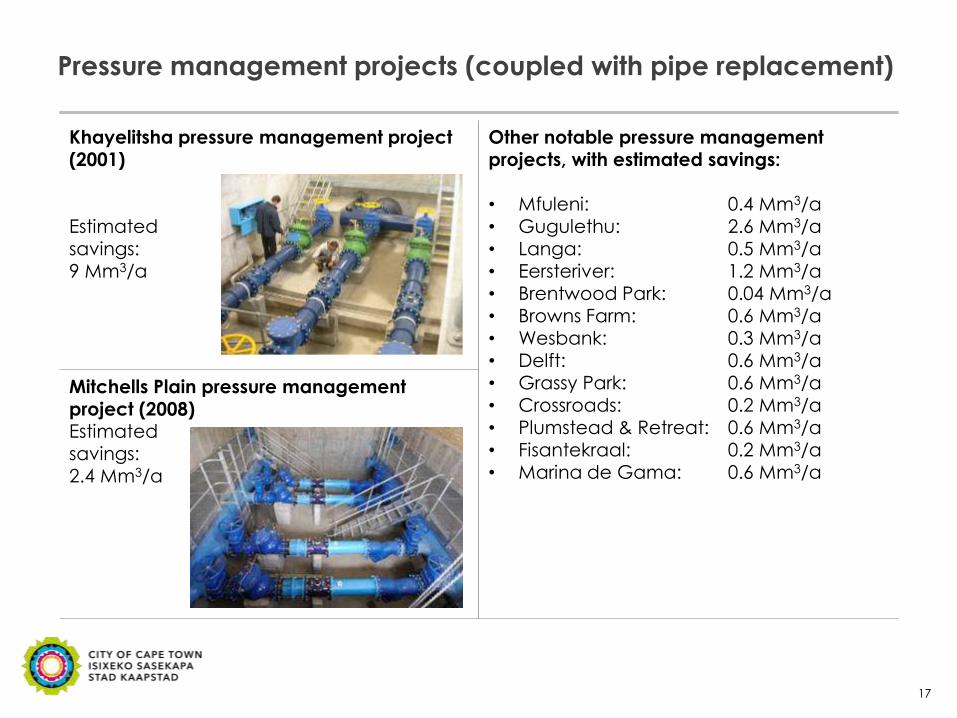
Pressure management projects (coupled with pipe replacement)
17
Khayelitsha pressure management project (2001) Estimated
savings: 9 Mm3/a
Other notable pressure management projects, with estimated savings: • Mfuleni: 0.4 Mm3/a • Gugulethu: 2.6 Mm3/a
• Langa: 0.5 Mm3/a • Eersteriver: 1.2 Mm3/a • Brentwood Park: 0.04 Mm3/a • Browns Farm: 0.6 Mm3/a • Wesbank: 0.3 Mm3/a • Delft: 0.6 Mm3/a • Grassy Park: 0.6 Mm3/a
• Crossroads: 0.2 Mm3/a • Plumstead & Retreat: 0.6 Mm3/a • Fisantekraal: 0.2 Mm3/a • Marina de Gama: 0.6 Mm3/a
Mitchells Plain pressure management
project (2008) Estimated savings: 2.4 Mm3/a

Treated Effluent Re-use
• More than 250 users are connected
• Mostly used for irrigation and industrial purposes
– Golf courses
– City Parks
– Schools
– Farmers
– Refinery
– Currently approximately 7% of potable water
treatment requirement is off-set by TE
18
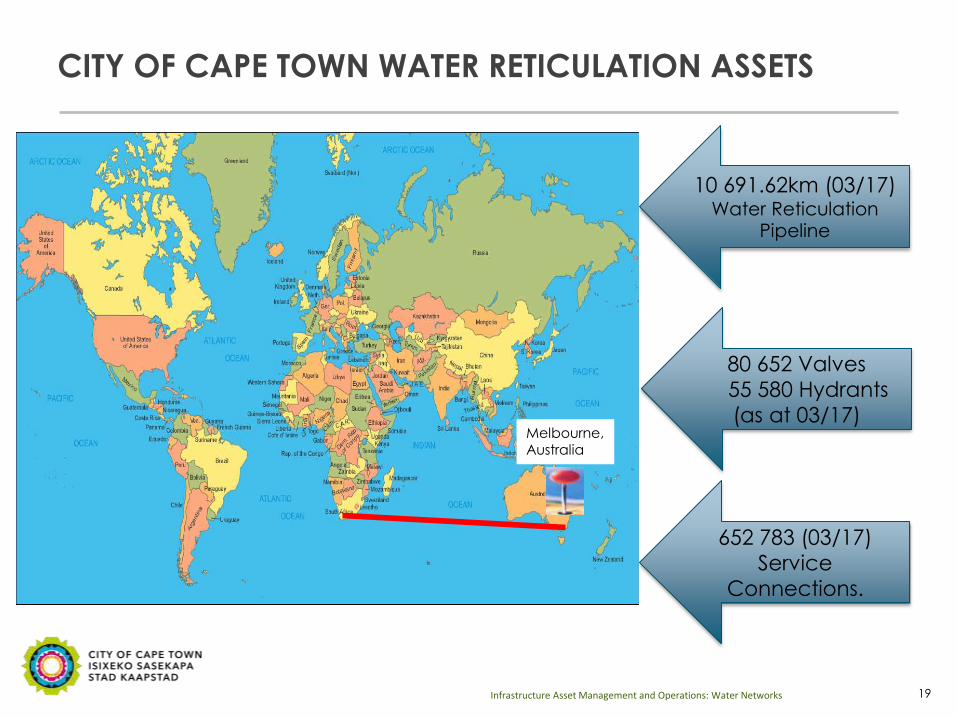
CITY OF CAPE TOWN WATER RETICULATION ASSETS
19 Infrastructure Asset Management and Operations: Water Networks
Melbourne, Australia
10 691.62km (03/17) Water Reticulation
Pipeline
80 652 Valves
55 580 Hydrants
(as at 03/17)
652 783 (03/17)
Service
Connections.
0
1 000
2 000
3 000
4 000
5 000
6 000
7 000
2007/08 2008/09 2009/10 2010/11 2011/12 2012/13 2013/14 2014/15 2015/16 2016/17 (as atMarch 2017)
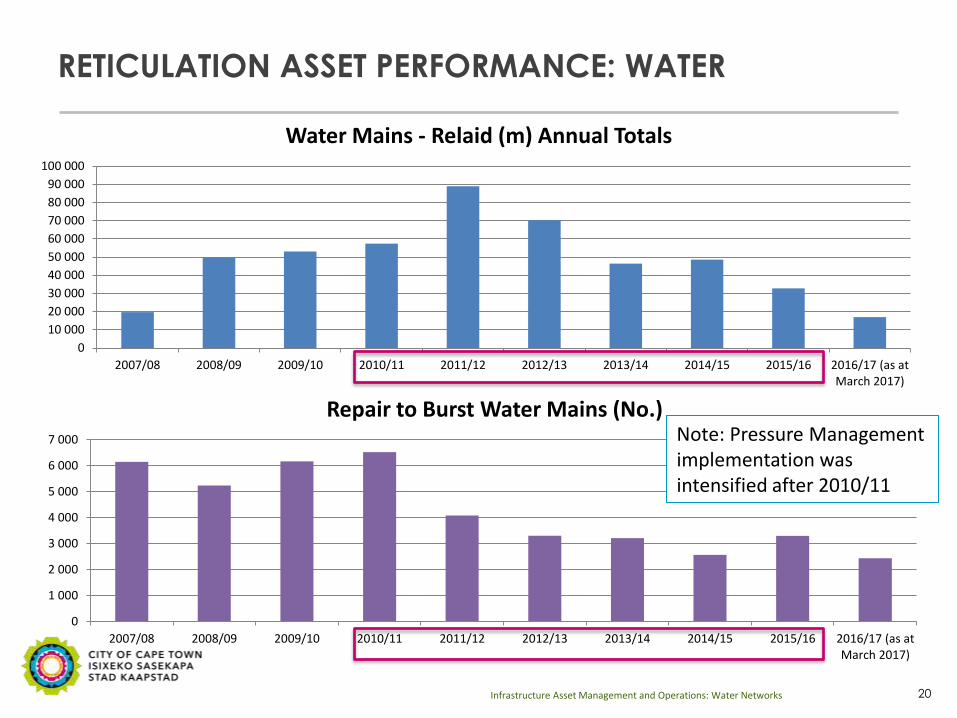
Repair to Burst Water Mains (No.)
0
10 000
20 000
30 000
40 000
50 000
60 000
70 000
80 000
90 000
100 000
2007/08 2008/09 2009/10 2010/11 2011/12 2012/13 2013/14 2014/15 2015/16 2016/17 (as atMarch 2017)
Water Mains - Relaid (m) Annual Totals
RETICULATION ASSET PERFORMANCE: WATER
20 Infrastructure Asset Management and Operations: Water Networks
Note: Pressure Management implementation was intensified after 2010/11
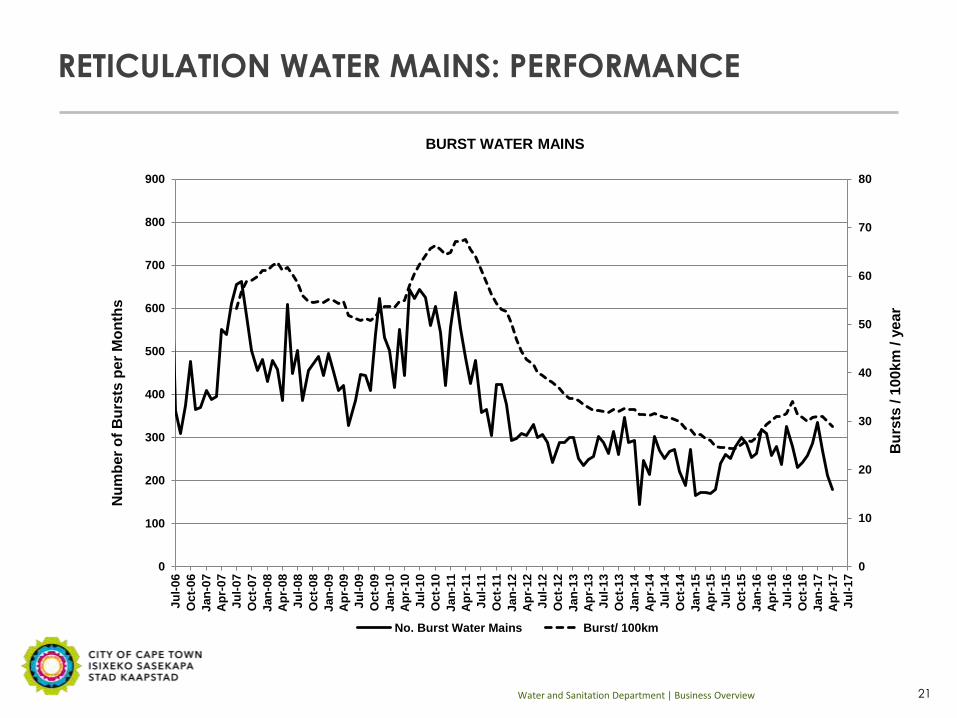
RETICULATION WATER MAINS: PERFORMANCE
21 Water and Sanitation Department | Business Overview
0
10
20
30
40
50
60
70
80
0
100
200
300
400
500
600
700
800
900J
ul-
06
Oc
t-0
6
Jan
-07
Ap
r-07
Ju
l-0
7
Oc
t-0
7
Jan
-08
Ap
r-08
Ju
l-0
8
Oc
t-0
8
Jan
-09
Ap
r-09
Ju
l-0
9
Oc
t-0
9
Jan
-10
Ap
r-10
Ju
l-1
0
Oc
t-1
0
Jan
-11
Ap
r-11
Ju
l-1
1
Oc
t-1
1
Jan
-12
Ap
r-12
Ju
l-1
2
Oc
t-1
2
Jan
-13
Ap
r-13
Ju
l-1
3
Oc
t-1
3
Jan
-14
Ap
r-14
Ju
l-1
4
Oc
t-1
4
Jan
-15
Ap
r-15
Ju
l-1
5
Oc
t-1
5
Jan
-16
Ap
r-16
Ju
l-1
6
Oc
t-1
6
Jan
-17
Ap
r-17
Ju
l-1
7
Bu
rsts
/ 1
00
km
/ y
ear
Nu
mb
er
of
Bu
rsts
per
Mo
nth
s
BURST WATER MAINS
No. Burst Water Mains Burst/ 100km

Active Leak Detection and Repair
22
Subzone's statistics
Description Highbury Highbury Park Wesbank Mfuleni Du noon Pella Totals
Zone's Statistics
Length of watermains (km) 20.39 15.34 22.91 58.617 32.083 149.34
Pipeline Material Fibre cement Fibre cement Fibre cement Fibre cement Fibre cement Fibre cement
No. of properties 1259 943 3204 8441 3025 16872
located leaks statistics
Total No. leaks located 46 12 77 215 40 23 413
Dates in Months when leaks
detection was done 2013 2013 2014 2014/15 2015 2015 1.8 yrs
Dates in Months when leaks
were repaired Fixed Fixed
Leaks fixed except
leaking meters with
WMD
Not fixed Not fixed Not fixed generally leaks
are not fixed
Water demand management interventions
23
Technical interventions:
• Stepped tariffs
• Pressure management
• Treated effluent use
• Water pipe replacement
• Leak detection
• Water management devices (WMDs) • Meter replacement
• Zone metering
• Building plumbing retrofit
• Plumbing repairs in indigent houses
• Springs investigation and utilization for non-potable uses
• Reducing response times to repair bursts and leaks
Education and awareness campaigns:
• Door to door community engagements
• Schools interventions
• Top water users engagements
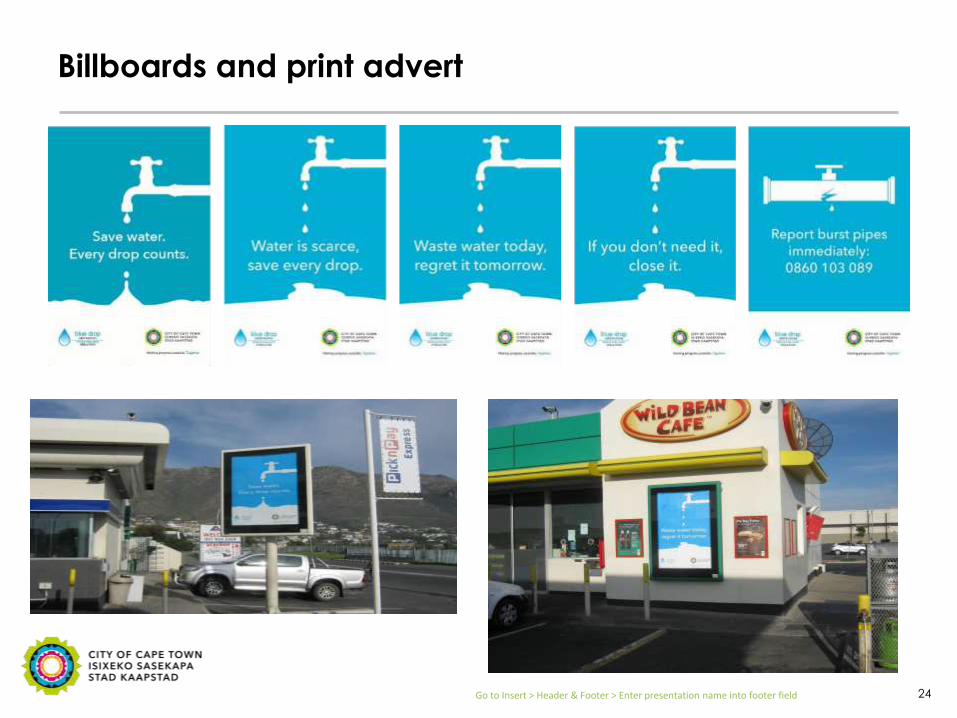
Billboards and print advert
24 Go to Insert > Header & Footer > Enter presentation name into footer field

Social Media
25 Go to Insert > Header & Footer > Enter presentation name into footer field
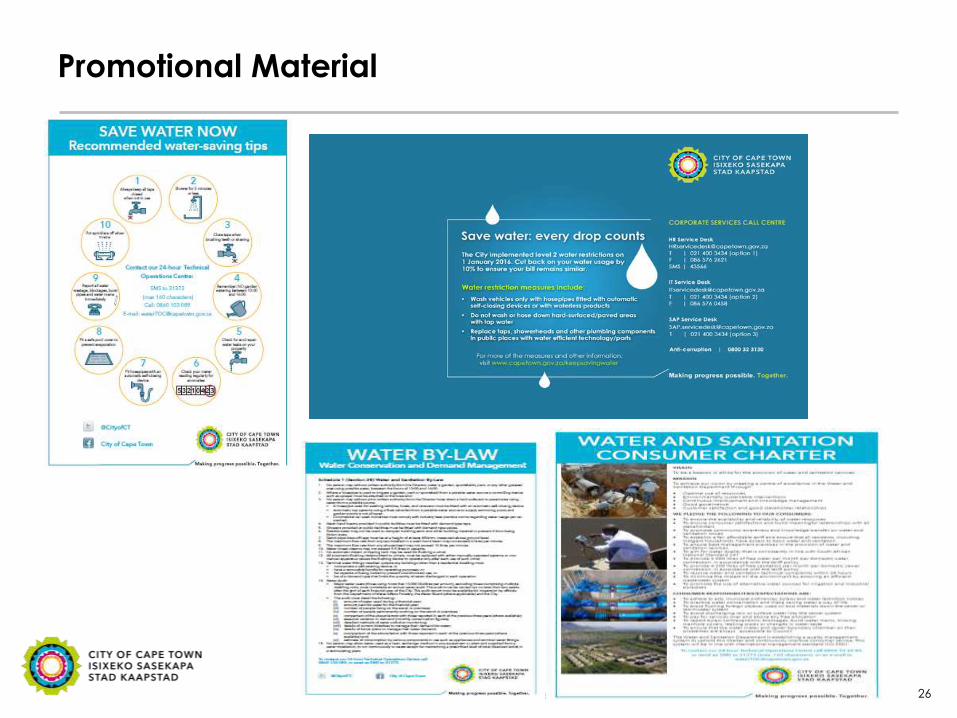
Promotional Material
26 Go to Insert > Header & Footer > Enter presentation name into footer field
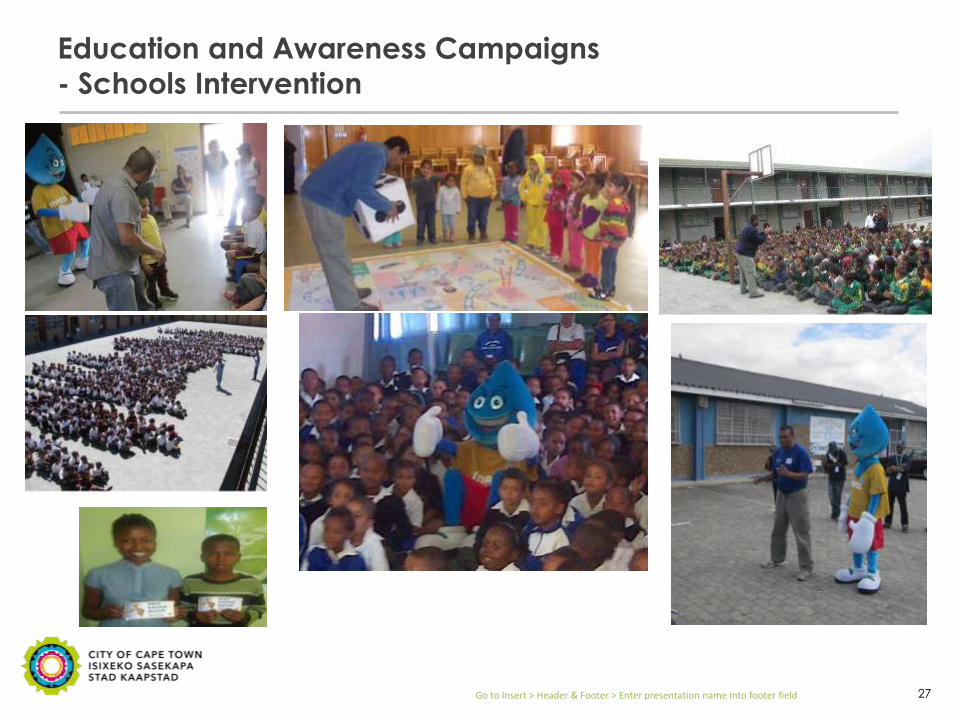
Education and Awareness Campaigns
- Schools Intervention
27 Go to Insert > Header & Footer > Enter presentation name into footer field
28 Go to Insert > Header & Footer > Enter presentation name into footer field
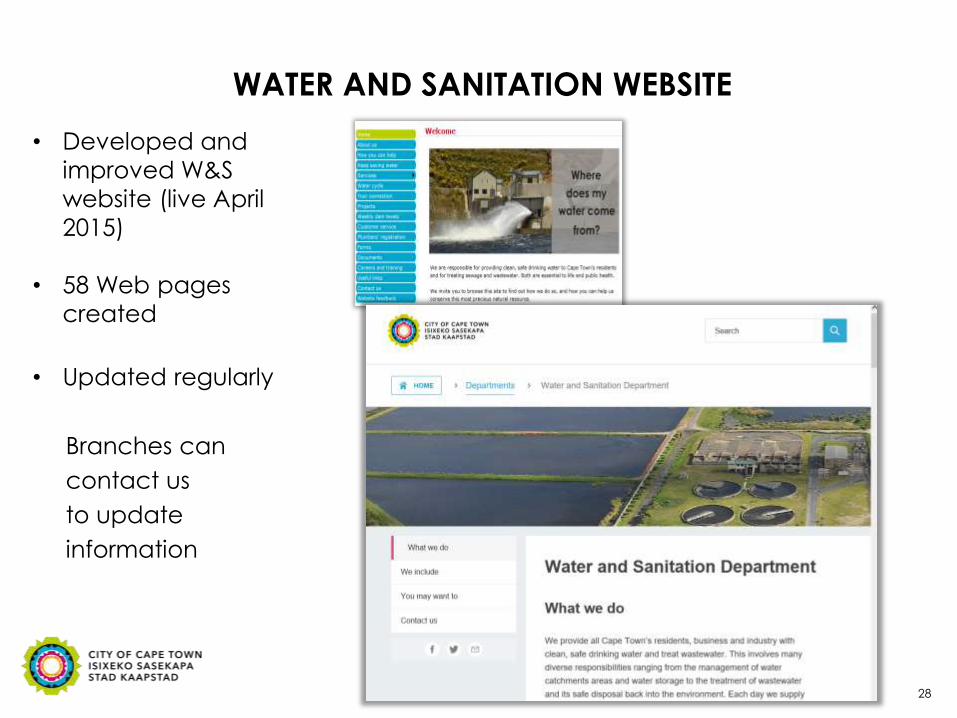
WATER AND SANITATION WEBSITE
• Developed and
improved W&S
website (live April
2015)
• 58 Web pages
created
• Updated regularly
Branches can
contact us
to update
information
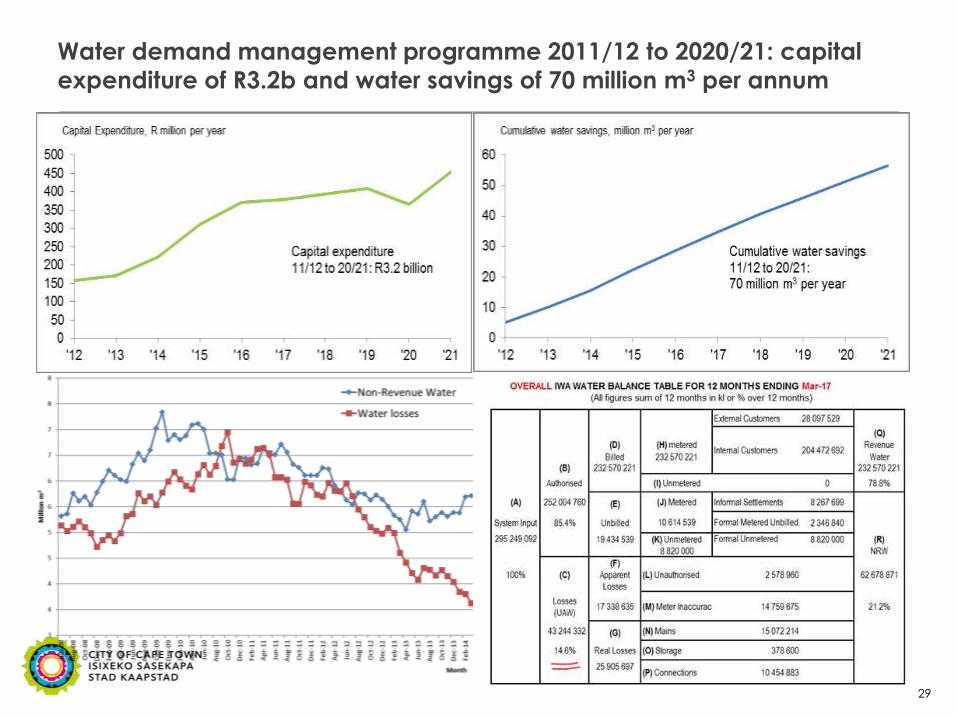
Water demand management programme 2011/12 to 2020/21: capital
expenditure of R3.2b and water savings of 70 million m3 per annum
29

Cape Town Scoops C40 Cities Award
at COP21 Conference in Paris

Population Growth and Water Use Efficiency
0.0
1.0
2.0
3.0
4.0
5.0
6.0
0
100
200
300
400
500
600
700
1950 1960 1970 1980 1990 2000 2010 2020
Po
pu
lati
on
(m
illio
ns)
Wat
er T
reat
ed p
er y
ear
(mill
ion
m3)
Water Treated Population Expon. (Population)
Reducing per capita water consumption

Water Allocations and Actual Demand
Allocation from Berg River Dam (84 Mm3) Fully Financed by COCT
Combined allocations from Voelvlei, Wemmershoek, Theewaterskloof and Steenbras Dams plus Palmiet Transfer (320 Mm3)
Proposed COCT Augmentation Schemes Accelerated Programme (Additional 15 Mm3)
280- 260 Mm3
20 % Saving
Supply Assurance and WCWSS Operating Rules (COCT /
DWS Raw Water Supply Agreement)
• Supply Assurance
– Number of years out of a hundred that a water user will obtain it’s allocated yield without the application of water restrictions (Urban 97%, Agriculture 91%)
– Curtailment of abstractions required in drought years to ensure demand can be sustainably met from the supply system. This is internationally accepted water resource planning practice.
• Operating Rules for System of Dams
– Minimize spillage : COCT demand can be shifted to dams most likely to spill to maximize system yield
– Minimize Wastage : WC/WDM Strategies to be implemented by all users
– Water Restrictions : DWS are responsible for determining and managing water restrictions
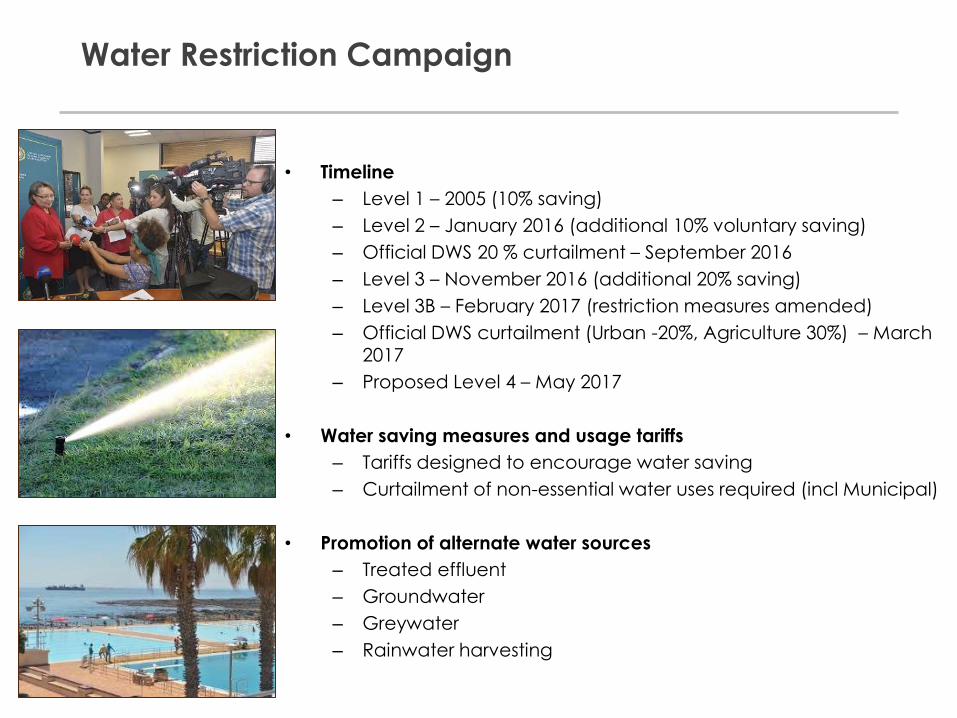
• Timeline
– Level 1 – 2005 (10% saving)
– Level 2 – January 2016 (additional 10% voluntary saving)
– Official DWS 20 % curtailment – September 2016
– Level 3 – November 2016 (additional 20% saving)
– Level 3B – February 2017 (restriction measures amended)
– Official DWS curtailment (Urban -20%, Agriculture 30%) – March 2017
– Proposed Level 4 – May 2017
• Water saving measures and usage tariffs
– Tariffs designed to encourage water saving
– Curtailment of non-essential water uses required (incl Municipal)
• Promotion of alternate water sources
– Treated effluent
– Groundwater
– Greywater
– Rainwater harvesting
Water Restriction Campaign
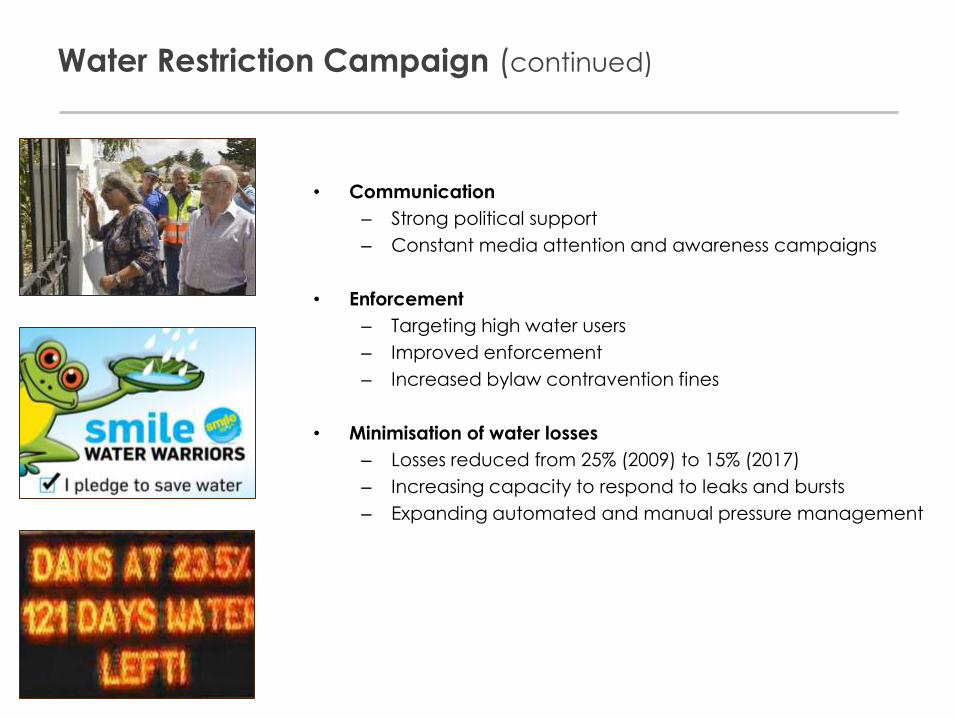
Water Restriction Campaign (continued)
• Communication
– Strong political support
– Constant media attention and awareness campaigns
• Enforcement
– Targeting high water users
– Improved enforcement
– Increased bylaw contravention fines
• Minimisation of water losses
– Losses reduced from 25% (2009) to 15% (2017)
– Increasing capacity to respond to leaks and bursts
– Expanding automated and manual pressure management
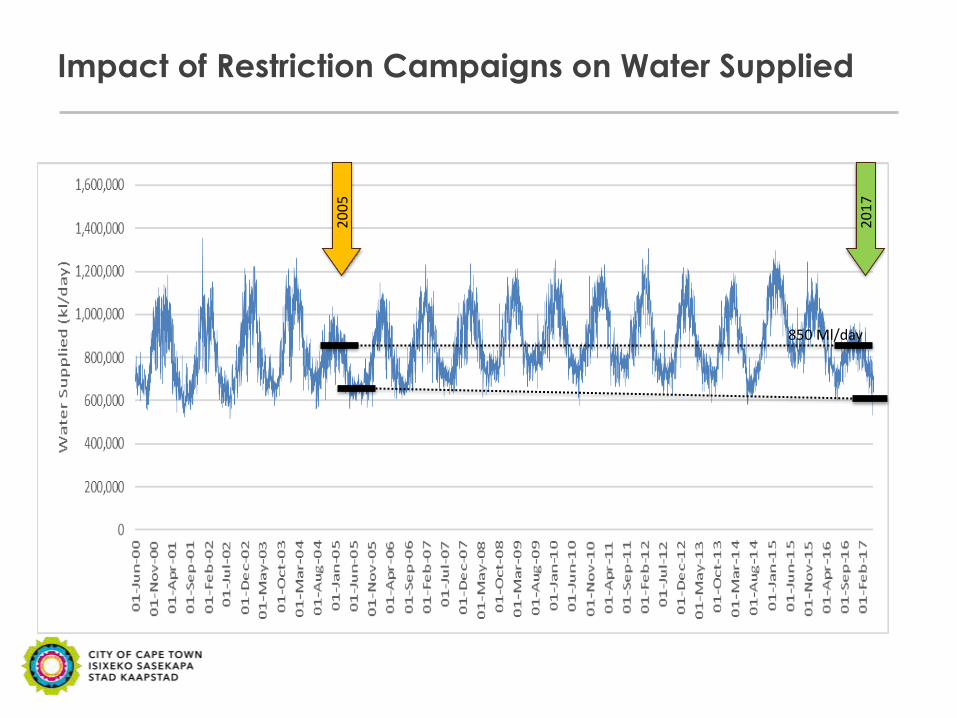
Impact of Restriction Campaigns on Water Supplied
850 Ml/day 2
00
5
20
17
21%
Unrestricted Summer
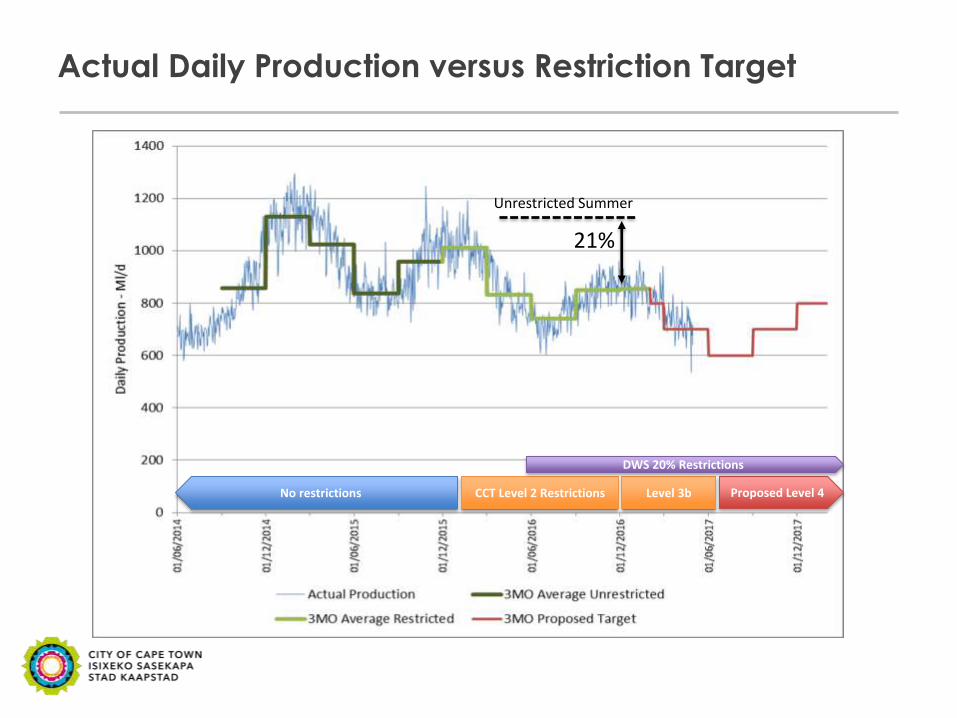
Actual Daily Production versus Restriction Target
No restrictions CCT Level 2 Restrictions Level 3b Proposed Level 4
DWS 20% Restrictions
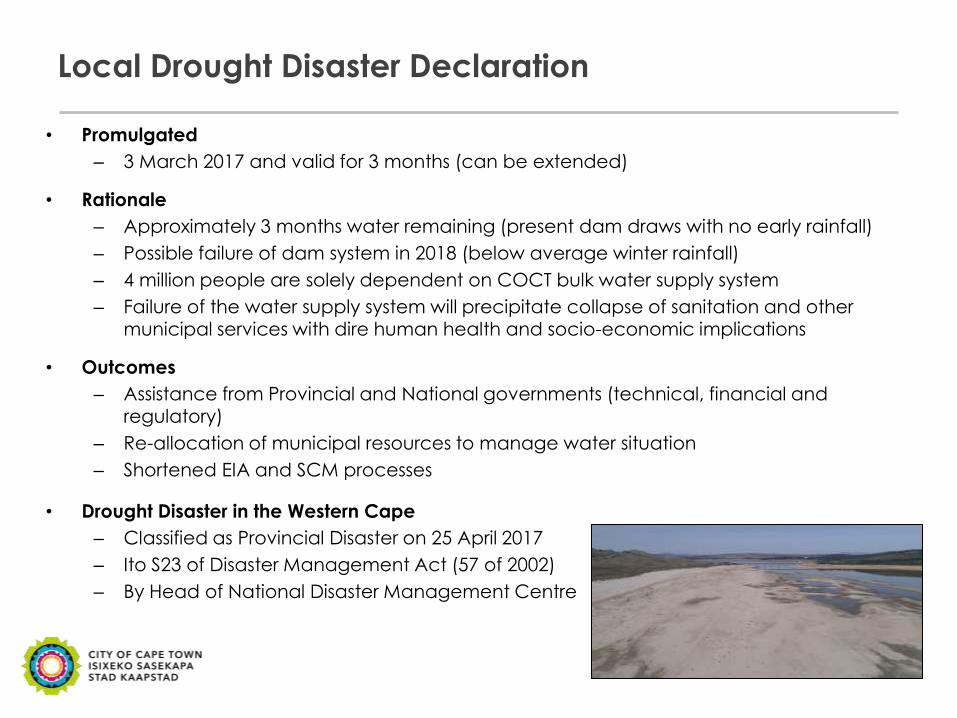
Local Drought Disaster Declaration
• Promulgated
– 3 March 2017 and valid for 3 months (can be extended)
• Rationale
– Approximately 3 months water remaining (present dam draws with no early rainfall)
– Possible failure of dam system in 2018 (below average winter rainfall)
– 4 million people are solely dependent on COCT bulk water supply system
– Failure of the water supply system will precipitate collapse of sanitation and other municipal services with dire human health and socio-economic implications
• Outcomes
– Assistance from Provincial and National governments (technical, financial and
regulatory)
– Re-allocation of municipal resources to manage water situation
– Shortened EIA and SCM processes
• Drought Disaster in the Western Cape
– Classified as Provincial Disaster on 25 April 2017
– Ito S23 of Disaster Management Act (57 of 2002)
– By Head of National Disaster Management Centre

Contingency Measures
• 15 – 20% dam storage - Increase the water restrictions measures and decrease water pressures in the network
• 10 – 15% dam storage - Implement intermittent supply in residential areas, with stringent restriction measures.
• Below 10% dam storage – Provide a ‘lifeline’ water supply, which would involve minimal supply pressures, intermittent supply, and very stringent restriction measures.
Steenbras Lower and Wemmershoek Dams at 10% - 1973
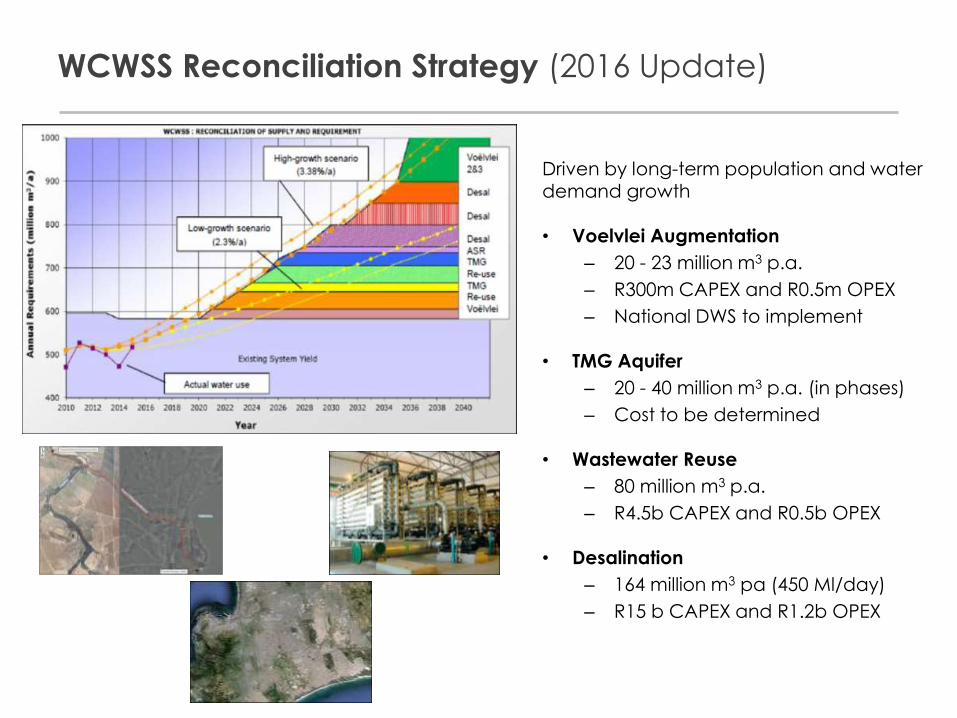
WCWSS Reconciliation Strategy (2016 Update)
Driven by long-term population and water demand growth
• Voelvlei Augmentation
– 20 - 23 million m3 p.a.
– R300m CAPEX and R0.5m OPEX
– National DWS to implement
• TMG Aquifer
– 20 - 40 million m3 p.a. (in phases)
– Cost to be determined
• Wastewater Reuse
– 80 million m3 p.a.
– R4.5b CAPEX and R0.5b OPEX
• Desalination
– 164 million m3 pa (450 Ml/day)
– R15 b CAPEX and R1.2b OPEX

Accelerated Water Supply Schemes
• Increase supply in short to medium term
• Diversify water sources
• Mitigate against climate change and improve drought resilience
• Acquisition of baseline costing, yield and environmental information
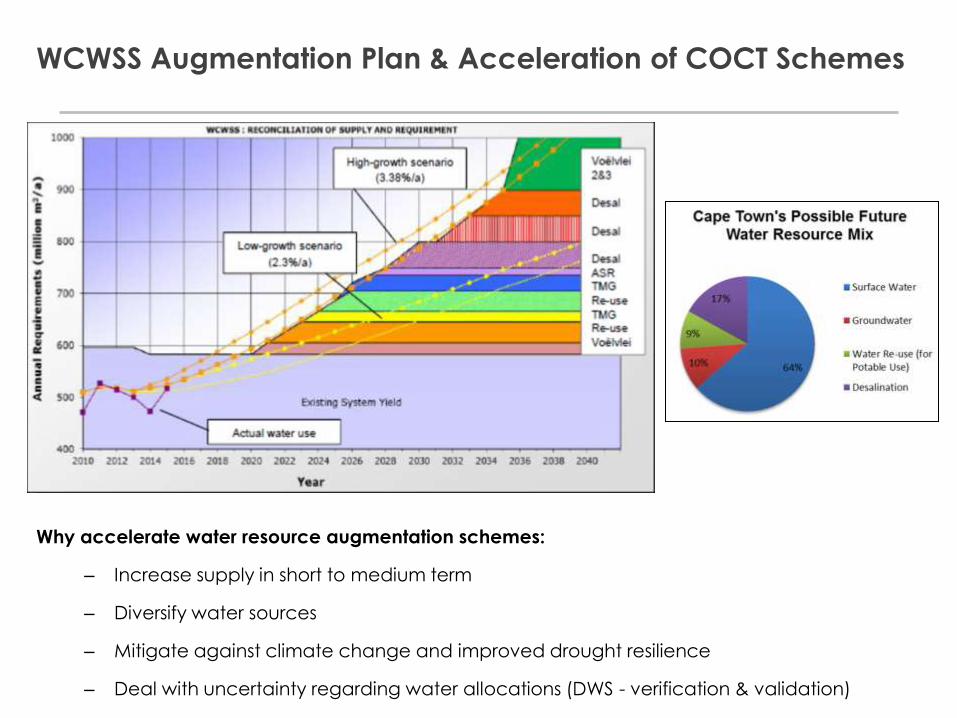
WCWSS Augmentation Plan & Acceleration of COCT Schemes
Why accelerate water resource augmentation schemes:
– Increase supply in short to medium term
– Diversify water sources
– Mitigate against climate change and improved drought resilience
– Deal with uncertainty regarding water allocations (DWS - verification & validation)

Accelerated Water Supply Schemes
Scheme Yield
(Ml/day) Description Status Estimated Cost
TMG Aquifer 10 Development of well fields into deep aquifer at Steenbras, Wemmershoek and Theewaterskloof Dams
• Drilling tenders being evaluated • Contract commencement scheduled
for end June 2017
R 85 million
Seawater Desalination Package Plant
5 Primarily for sea water quality data acquisition as well as to improve supply security in Atlantis
• Design underway • Construction tenders to advertised in
July 2017
R 100 million
Wastewater Re-use (drinking water)
10 Treatment of effluent from Zandvliet WWTW for direct or indirect injection into bulk water supply system.
• Design underway • Construction tenders to be advertised
in January 2018
R 120 million
Cape Flats Aquifer & Atlantis Aquifer
5 Incremental drilling of boreholes to abstract water from the Cape Flats Aquifer in Mitchells Plain as well as expansion of well fields in Atlantis
• Consultants to be appointed in June 2017
R 50 million
WC/WDM Strategy 100 Intensification of demand management measures: • Water restrictions • Pressure management • Water saving incentive schemes • Regulation of plumbing fittings and
water using appliances • Informative water billing • Communication
• Level 4 restrictions to be considered by Council at end May 2016
• Network pressures are being reduced in the Faure, Blackheath and Northern Reservoir supply zones
R 10 million
Voelvlei
Augmentation
(Phase 1)
60 DWS Scheme – Pumped transfer of water from Berg River to Voelvlei Dam
• Comment period for EIA closed. R 300 million
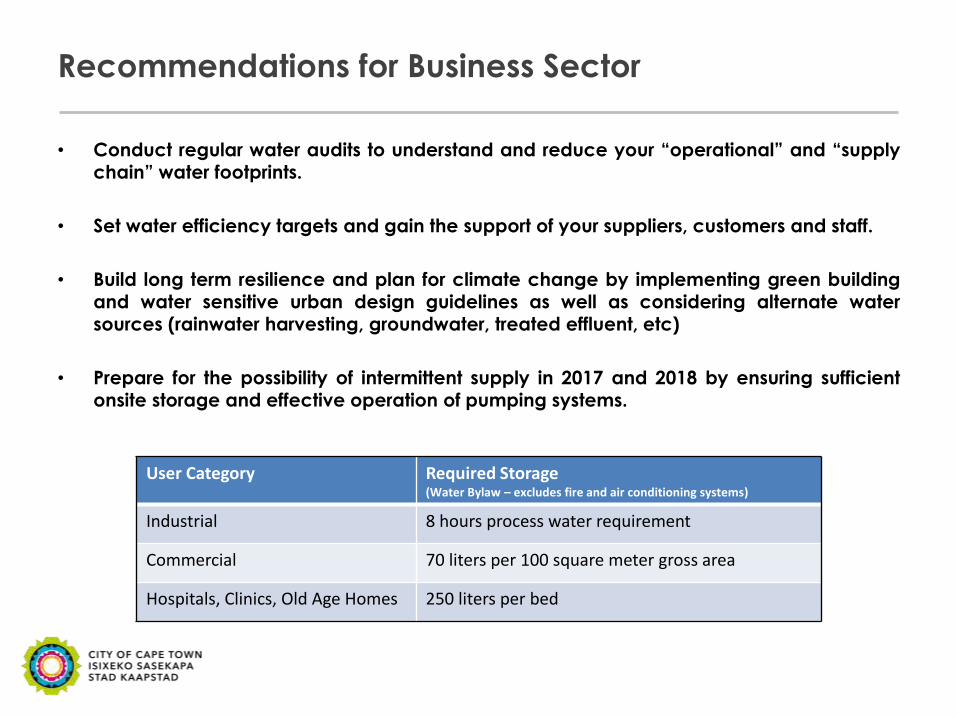
Recommendations for Business Sector
• Conduct regular water audits to understand and reduce your “operational” and “supply chain” water footprints.
• Set water efficiency targets and gain the support of your suppliers, customers and staff.
• Build long term resilience and plan for climate change by implementing green building and water sensitive urban design guidelines as well as considering alternate water sources (rainwater harvesting, groundwater, treated effluent, etc)
• Prepare for the possibility of intermittent supply in 2017 and 2018 by ensuring sufficient onsite storage and effective operation of pumping systems.
User Category Required Storage (Water Bylaw – excludes fire and air conditioning systems)
Industrial 8 hours process water requirement
Commercial 70 liters per 100 square meter gross area
Hospitals, Clinics, Old Age Homes 250 liters per bed
45 Water and Sanitation Department | Sewer Network Management
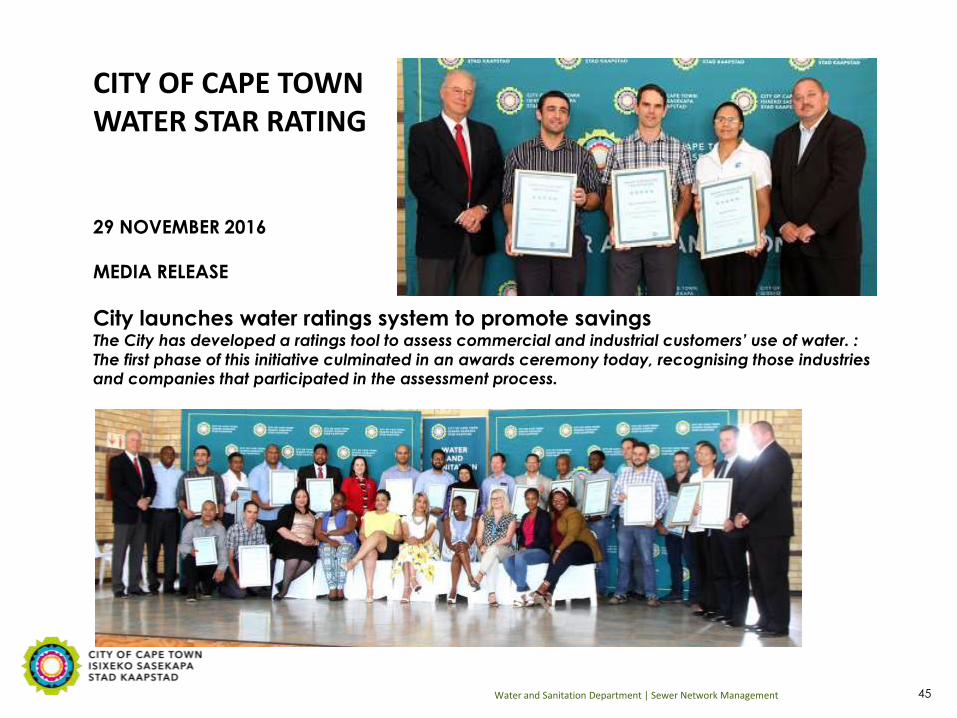
29 NOVEMBER 2016
MEDIA RELEASE
City launches water ratings system to promote savings The City has developed a ratings tool to assess commercial and industrial customers’ use of water. :
The first phase of this initiative culminated in an awards ceremony today, recognising those industries and companies that participated in the assessment process.
CITY OF CAPE TOWN WATER STAR RATING
Water Star Rating System
• About the Star Rating System
– Developed a Rating Tool to encourage better on-site water management in Industries
– The tool was designed to:
• Monitor legal compliance
• Encourage improvement in terms of water usage, water conservation and water discharge
– The Tool considered green, blue and grey water management
– Participation is voluntary.
– Assessed 19 companies with the Rating Tool
• Purpose
– The Management of Water must become everyone’s responsibility
– Encourage self regulation
– Interaction with industries in the past was mostly on non-compliance issues
– Interactive approach to highlight water conservation and water pollution issues
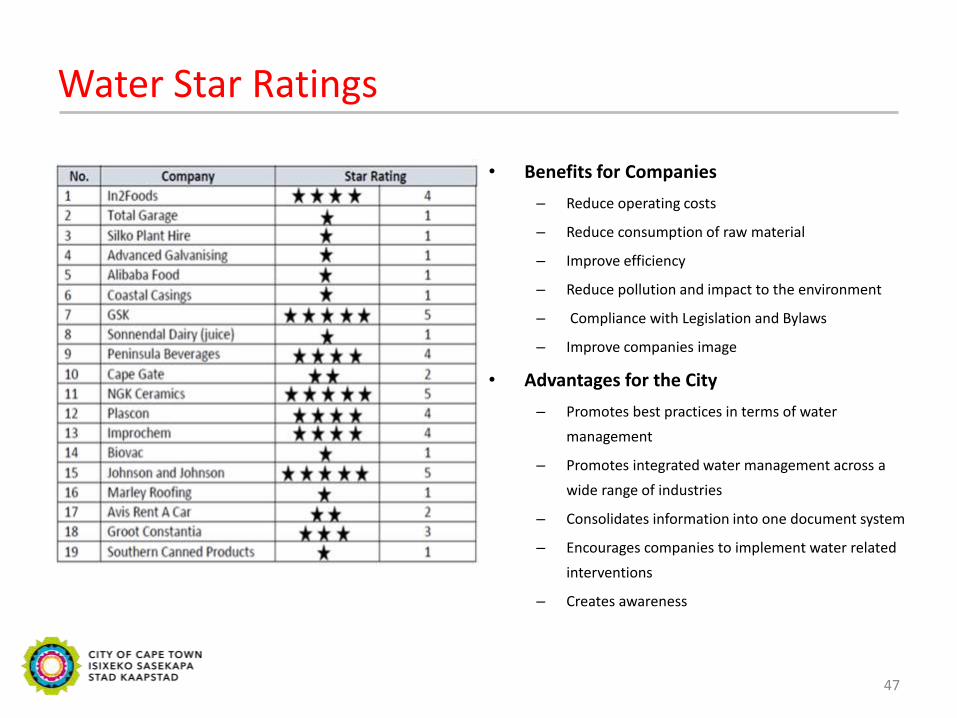
Water Star Ratings
• Benefits for Companies
– Reduce operating costs
– Reduce consumption of raw material
– Improve efficiency
– Reduce pollution and impact to the environment
– Compliance with Legislation and Bylaws
– Improve companies image
• Advantages for the City
– Promotes best practices in terms of water
management
– Promotes integrated water management across a
wide range of industries
– Consolidates information into one document system
– Encourages companies to implement water related
interventions
– Creates awareness
47
Future Water Outlook
• Key considerations:
– Growing regional demand and competition for water
– Climate change requires diversification of water sources and improved water
use efficiency
– Unit cost of water is likely to increase as more costly alternatives to surface water
schemes are implemented
– The opportunity provided by the current water crisis must be maximized to effect
a “quantum leap” change to the way water is resourced and utilized in CT.
• Reposition Cape Town as a Water Sensitive City that:
– Optimises and integrates the management of all available water resources
(surface water, ground water, wastewater and stormwater) to improve
resilience
– Places high value on water and strives to increase water use efficiency through
water sensitive urban design
– Is a liveable city with healthy waterways and coastal waters

Thank You