Embed Size (px)
Citation preview

CYCAS-MED
The CYCAS–MED project: analysis ofweather data in Morocco for statistical
weather yield function
Antonella Bodini(1), Erika Entrade(1), Pierpaolo Zara(2)
Carla Brambilla(1), Martin Dubrovsky(3), Elisa Varini(1)
(1) CNR-IMATI, Milano
(2) CNR-IBIMET, Sassari
(3) Institute of Atmospheric Physics
ASCR, Prague, Czech Republic
Workshop on BIODIVERSITY IN AGROECOSYSTEMS – p. 1/21

CYCAS-MEDSummary
◮ Analysis of weather data: a few issues
◮ Data analysis◮ temperature: normal values and trend◮ rainfall: missing data...
◮ Weather yield function from observational data◮ Simulated weather data◮ Future work
Workshop on BIODIVERSITY IN AGROECOSYSTEMS – p. 2/21

CYCAS-MEDThe analysis of weather data...
... a few issues:
◮ long time series◮ normal values: 30–yr standard period (1961–1990,
1971–2000), with at least 20 years of completedata
◮ indexes
Workshop on BIODIVERSITY IN AGROECOSYSTEMS – p. 3/21

CYCAS-MEDThe analysis of weather data...
... a few issues:
◮ long time series◮ normal values: 30–yr standard period (1961–1990,
1971–2000), with at least 20 years of completedata
◮ indexes◮ Tmin, Tmax, Tday
◮ daily, monthly, seasonal, etc. rainfall
◮ max. number of consecutive dry days,heat wave duration index, etc.
◮ . . .Workshop on BIODIVERSITY IN AGROECOSYSTEMS – p. 3/21

CYCAS-MEDThe analysis of weather data...
... a few issues:
◮ long time series◮ normal values: 30–yr standard period (1961–1990,
1971–2000), with at least 20 years of completedata
◮ indexes◮ potential evapotranspiration, ET0
◮ length of the growing period (with temp. thresholds)
◮ Growing degree days (single sine method; Allen, 1976)
◮ . . .
Workshop on BIODIVERSITY IN AGROECOSYSTEMS – p. 3/21

CYCAS-MEDThe analysis of climatic data...
...the problem of missing data◮ temperature data:
− low variability− linear relationship
⇒ data imputation up to 4 consecutive days bylinear interpolation
Workshop on BIODIVERSITY IN AGROECOSYSTEMS – p. 4/21

CYCAS-MEDThe analysis of climatic data...
...the problem of missing data◮ temperature data:
− low variability− linear relationship
⇒ data imputation up to 4 consecutive days bylinear interpolation
◮ rainfall data:− high variability− singletons− imputation can destroy data autocorrelation
⇒ no daily data imputation (but still some kind ofimputation...)
Workshop on BIODIVERSITY IN AGROECOSYSTEMS – p. 4/21

CYCAS-MEDStudy area
16 sites; Source: Ministry of Agriculture
Workshop on BIODIVERSITY IN AGROECOSYSTEMS – p. 5/21

CYCAS-MEDMorocco temperature data
Normal values, after imputationstandard period (SP): 1971–2000
tot nr. nr. SP Tmin Tmax Tday Tn90 Tn90∗
Station years years (◦C) (◦C) (◦C) (%) daysMarrakech 32 28 13.3 26.7 20.0 10.2 37.2Casablanca 28 25 13.9 21.6 17.7 9.8 35.8Meknes 25 21 11.2 23.3 17.3 9.7 35.2Nouasser 32 28 11.4 23.5 17.5 9.4 34.3Oujda 26 22 10.2 23.5 16.8 10.7 39.0Safi 26 24 13.7 23.3 18.5 10.5 38.3Taza 24 23 12.6 23.8 18.2 9.9 36.1Rabat 32 28 12.7 22.2 17.4 10.7 39.0Tanger 30 27 13.4 22.1 17.7 10.9 39.8Tn90: Percent of time Tmin > 90th percentile of daily minimum
temperature (warm nights). Tn90∗ = Tn90 × 365.Workshop on BIODIVERSITY IN AGROECOSYSTEMS – p. 6/21

CYCAS-MEDMorocco temperature data
TREND(Mann–Kendall test)
Tmin Tmax Tday Tn90
Station (◦C) (◦C) (◦C) (%)Marrakech +1 +1 +1 0Nouasser +1 +1 +1 +1Rabat 0 +1 +1 +1Tanger 0 +1 +1 +1
Tn90: Percent of time Tmin > 90th percentileof daily minimum temperature (warm nights).Tn90∗ = Tn90 × 365.
Workshop on BIODIVERSITY IN AGROECOSYSTEMS – p. 6/21

CYCAS-MEDMorocco temperature data
Variation per 10 years(Sen’s slope)
Tmin Tmax Tday Tn90
Station (◦C) (◦C) (◦C) (%)Marrakech 0.46 0.37 0.44 –Nouasser 0.60 0.55 0.59 13.5Rabat – 0.43 0.40 5.8Tanger – 0.32 0.44 5.8
Tn90: Percent of time Tmin > 90th percentileof daily minimum temperature (warm nights).Tn90∗ = Tn90 × 365.
Workshop on BIODIVERSITY IN AGROECOSYSTEMS – p. 6/21

CYCAS-MEDMorocco temperature data
NOUASSER TANGER
1975 1980 1985 1990 1995 2000 2005
5
10
15
20
25
Tn90
1975 1980 1985 1990 1995 2000 2005year
5
10
15
20
% Tn90
Tn90: Percent of time Tmin > 90th percentile of daily min. temperature (warm nights)
non climatic change?
(similar to the near station of Casablanca...)
Workshop on BIODIVERSITY IN AGROECOSYSTEMS – p. 6/21

CYCAS-MEDMorocco temperature data
MARRAKECH
1975 1980 1985 1990 1995 2000 2005
12.5
13
13.5
14
14.5MINIMUM TEMPERATURE
1975 1980 1985 1990 1995 2000 2005
25
25.5
26
26.5
27
27.5
28
28.5MAXIMUM TEMPERATURE
Workshop on BIODIVERSITY IN AGROECOSYSTEMS – p. 6/21

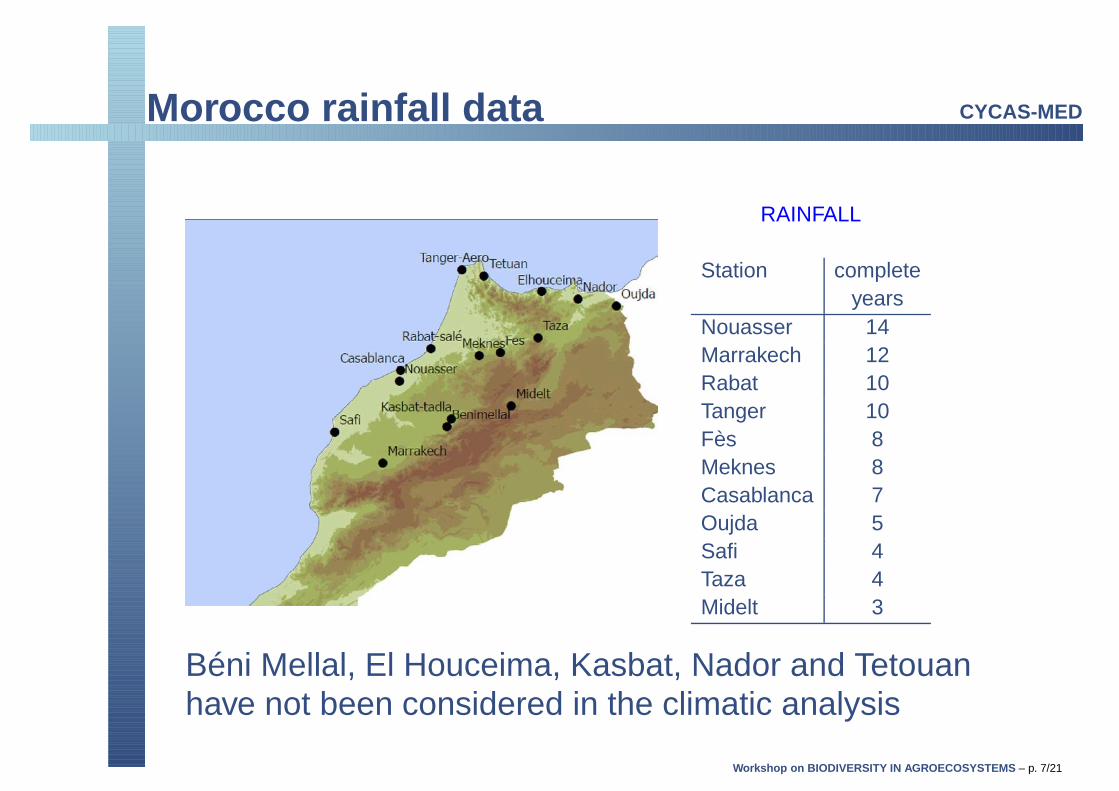
CYCAS-MEDMorocco rainfall data
RAINFALL
Station completeyears
Nouasser 14Marrakech 12Rabat 10Tanger 10Fès 8Meknes 8Casablanca 7Oujda 5Safi 4Taza 4Midelt 3
Workshop on BIODIVERSITY IN AGROECOSYSTEMS – p. 7/21
CYCAS-MEDMorocco rainfall data
RAINFALL
Station completeyears
Nouasser 14Marrakech 12Rabat 10Tanger 10Fès 8Meknes 8Casablanca 7Oujda 5Safi 4Taza 4Midelt 3
Béni Mellal, El Houceima, Kasbat, Nador and Tetouanhave not been considered in the climatic analysis
Workshop on BIODIVERSITY IN AGROECOSYSTEMS – p. 7/21

CYCAS-MEDMorocco rainfall data
RAINFALL
Station completeyears
Nouasser 14Marrakech 12Rabat 10Tanger 10Fès 8Meknes 8Casablanca 7Oujda 5Safi 4Taza 4Midelt 3
only a limited climate analysis is possible
Workshop on BIODIVERSITY IN AGROECOSYSTEMS – p. 7/21

CYCAS-MEDImputation of dekadal rainfall values
Proposal:Aim of the work : weather yield function, Crop Specific SoilWater Balance + AgroMetShell ←֓ dekadal values (=10days, rd)
Workshop on BIODIVERSITY IN AGROECOSYSTEMS – p. 8/21

CYCAS-MEDImputation of dekadal rainfall values
Proposal:Aim of the work : weather yield function, Crop Specific SoilWater Balance + AgroMetShell ←֓ dekadal values (=10days, rd)
New-LocClim (FAO, 2005) provides the estimates (best) ofmean dekadal rainfall values, and σ (or confidenceintervals): we compare these estimates to the observeddata.
rd missing (best − σ, imputated(mm) days best best + σ) value
– 10 18.77 (15.53, 22.01) 18.7724.1 <10 20.67 (16.11, 25.24) 24.13.3 <10 14.87 (12.19, 17.54) 12.19
104.9 <10 19.42 (16.18, 22.66) 104.9Workshop on BIODIVERSITY IN AGROECOSYSTEMS – p. 8/21

CYCAS-MEDImputation of dekadal rainfall values
◮ take into account as much as possible theobserved values
◮ save autocorrelation of rd s
◮ slightly more results on climate analysis
◮ inputs to AMS 7−→Weather Yield Function
Workshop on BIODIVERSITY IN AGROECOSYSTEMS – p. 9/21

CYCAS-MEDWeather yield function
WYF: crop yield = linear function of outputs of AMS
◮ Total Water Requirement (TWR)◮ Water Satisfaction Index (WSI)
and◮ water excess (WEX)◮ water deficit (WDEF)◮ actual evapotranspiration (ETA)
at several phenological phases (Initial, Vegetative,Flowering, Ripening) and Total
Workshop on BIODIVERSITY IN AGROECOSYSTEMS – p. 10/21

CYCAS-MEDCrop yield data
1980–2006 (1982 missing)(q/ha)
durum wheat soft wheat barley
Station mean std. dev mean std. dev mean std. devBéni Mellal 13.0 6.8 13.9 7.8 10.1 6.6Casablanca 13.8 8.4 15.7 8.6 14.2 7.3El Houceima 9.1 3.9 9.4 3.6 11.3 4.0Fès 12.8 7.2 14.0 7.6 11.3 5.6Marrakech 6.0 4.1 5.1 3.6 6.6 4.5Meknes 15.3 7.0 16.9 7.5 13.6 5.8Midelt 9.4 3.5 10.4 4.0 10.0 4.2Nador 8.2 3.4 9.9 4.7 10.0 4.1Nouasser 10.8 7.7 11.0 7.3 10.1 6.8Oujda 5.9 3.7 6.1 3.8 6.3 3.8Rabat 12.6 7.2 14.4 6.2 13.1 6.8Safi 7.9 5.0 6.2 4.1 8.1 4.3Tanger 11.8 3.3 11.9 5.5 13.2 3.9Taza 11.0 5.5 9.5 5.4 9.8 4.4Tetouan 12.9 3.4 13.6 3.8 12.9 3.5
Workshop on BIODIVERSITY IN AGROECOSYSTEMS – p. 11/21

CYCAS-MEDCrop yield data
◮ strong correlation of the 3 cereals at eachdistrict:> 0.68apart Tanger
◮ strong correlation of similar cereals within districts:◮ trend analysis: no trend. Please, note Rabat:
Workshop on BIODIVERSITY IN AGROECOSYSTEMS – p. 11/21

CYCAS-MEDCrop yield data
◮ strong correlation of the 3 cereals at eachdistrict:> 0.68apart Tanger
◮ strong correlation of similar cereals within districts:◮ trend analysis: no trend. Please, note Rabat:
1985 1990 1995 2000 2005year
5
10
15
20
25
30q�ha RABAT - DURUM W.
1985 1990 1995 2000 2005year
5
10
15
20
25
30q�ha RABAT - BARLEY
non climatic changes?Workshop on BIODIVERSITY IN AGROECOSYSTEMS – p. 11/21

CYCAS-MEDVariable selection
correlation◮ between crop yield and outputs◮ within outputs
Workshop on BIODIVERSITY IN AGROECOSYSTEMS – p. 12/21

CYCAS-MEDVariable selection
correlation◮ between crop yield and outputs◮ within outputs
⇒WSI, TWR
WDEFf , WDEFt,
ETAf, ETAr and ETAt.
Workshop on BIODIVERSITY IN AGROECOSYSTEMS – p. 12/21

CYCAS-MEDResults: durum weat
District Nr. of data Variables R2 p-value RMSEBéni Mellal 15 WSI 0.88 ≪ 10−03 5.10Casablanca 20 WSI, WEXt 0.83 ≪ 10−03 5.76El Houceima 15 WSI 0.93 ≪ 10−03 2.49Fès 20 WSI 0.58 ≪ 10−03 4.37Marrakech 24 WSI, TWR 0.74 ≪ 10−03 2.13Meknes 17 WSI, WEXt 0.89 ≪ 10−03 4.92Midelt 17 WSI, TWR 0.89 ≪ 10−03 3.45Nador 13 WSI 0.87 ≪ 10−03 3.10Nouasser 24 WSI, TWR 0.86 ≪ 10−03 4.59Oujda 18 WSI 0.84 ≪ 10−03 2.40Rabat 24 WSI 0.81 ≪ 10−03 6.26Safi 19 WSI 0.84 ≪ 10−03 3.36Tanger 23 WSI, WEXt 0.94 ≪ 10−03 2.87Taza 19 WSI, WEXt 0.89 ≪ 10−03 3.80Tetouan 18 WSI 0.97 ≪ 10−03 2.35
Workshop on BIODIVERSITY IN AGROECOSYSTEMS – p. 13/21

CYCAS-MEDResults: soft weat
District Nr. of data Variables R2 p-value RMSEBéni Mellal 15 WSI 0.88 ≪ 10−03 5.42Casablanca 20 WSI 0.81 ≪ 10−03 6.93El Houceima 15 WSI 0.92 ≪ 10−03 2.93Fes 20 WSI, TWR 0.89 ≪ 10−03 4.71Marrakech 24 WSI, TWR 0.66 ≪ 10−03 2.16Meknes 17 WSI, WEXt 0.91 ≪ 10−03 4.95Midelt 17 WSI, WDEFr 0.39 ≪ 10−03 3.13Nador 13 WSI 0.88 ≪ 10−03 3.25Nouasser 24 WSI, TWR 0.89 ≪ 10−03 4.18Oujda 18 WSI, WDEFr 0.87 ≪ 10−03 2.15Rabat 24 WSI, ETAi 0.92 ≪ 10−03 4.25Safi 19 WSI, WEXt 0.86 ≪ 10−03 2.60Tanger 23 WSI, WEXt 0.85 ≪ 10−03 4.99Taza 19 WSI, WEXt 0.91 ≪ 10−03 3.32Tetouan 18 WSI 0.96 ≪ 10−03 2.97
Workshop on BIODIVERSITY IN AGROECOSYSTEMS – p. 14/21

CYCAS-MEDResults: barley
District Nr. of data Variables R2 p-value RMSEBéni Mellal 15 WSI, ETAi 0.89 ≪ 10−03 3.75Casablanca 20 WSI 0.86 ≪ 10−03 5.03El Houceima 15 WSI, TWR 0.63 ≪ 10−03 2.24Fes 20 WSI, TWR 0.92 ≪ 10−03 3.25Marrakech 24 WSI, TWR 0.52 ≪ 10−03 3.19Meknes 17 WSI 0.88 ≪ 10−03 4.62Midelt 17 WSI, TWR 0.89 ≪ 10−03 3.39Nador 13 WSI 0.89 ≪ 10−03 3.51Nouasser 24 WSI, TWR 0.87 ≪ 10−03 4.03Oujda 18 WSI 0.81 ≪ 10−03 2.78Rabat 24 WSI 0.83 ≪ 10−03 6.13Safi 19 WSI, WEXt 0.86 ≪ 10−03 3.25Tanger 23 WSI 0.93 ≪ 10−03 3.78Taza 19 WSI 0.87 ≪ 10−03 3.88Tetouan 18 WSI 0.96 ≪ 10−03 2.81
Workshop on BIODIVERSITY IN AGROECOSYSTEMS – p. 15/21
CYCAS-MEDWeather Generator
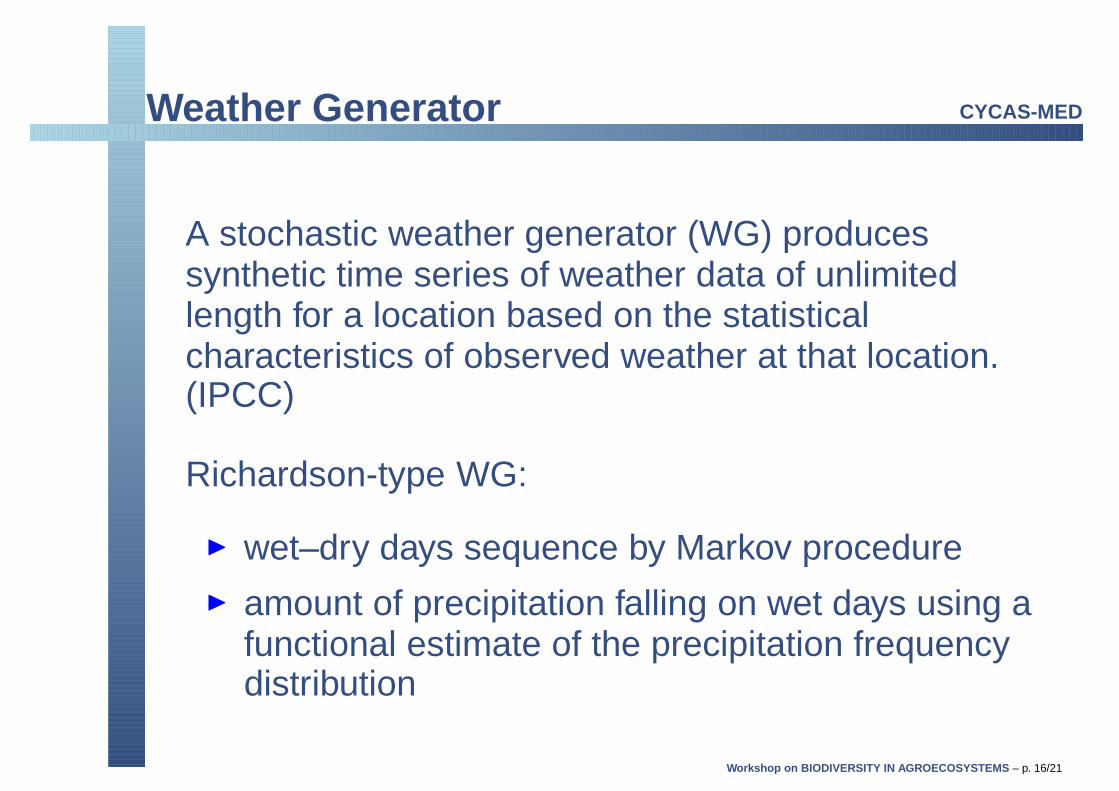
A stochastic weather generator (WG) producessynthetic time series of weather data of unlimitedlength for a location based on the statisticalcharacteristics of observed weather at that location.(IPCC)
Richardson-type WG:
◮ wet–dry days sequence by Markov procedure◮ amount of precipitation falling on wet days using a
functional estimate of the precipitation frequencydistribution
Workshop on BIODIVERSITY IN AGROECOSYSTEMS – p. 16/21

CYCAS-MEDWeather Generator
1.Data collection - observed daily climatological data for thevariables and site(s) of interest should be collected, qualitycontrolled and correctly formatted.2.Parameterized - the parameters of the model are estimatedusing methods documented for the weather generator.3.Model testing - time series of weather are generated and theirstatistics analysed and compared with the observed data on whichthey were based.4.Climate scenarios - if the WG is to be used to create weathertime series representing a changed climate, procedures will alsobe required for applying climate change information (e.g. onclimate variability change from GCMs) as adjustments to theparameters of the WG. Some WG software also handlesclimate scenarios.
Workshop on BIODIVERSITY IN AGROECOSYSTEMS – p. 16/21

CYCAS-MEDM&Rfi
M&Rfi is a new parametric generator. M&Rfi may berun with various numbers of variables (precipitation,solar radiation and daily extreme temperatures aretypically involved) and at various time steps (1–day,3–day, 5–day, 1–week, 10–day, half–month, 1-month).
Precipitations are modeled by Gamma distributions
Martin Dubrovsky, Institute of Atmospheric Physics,ASCR, Prague, Czechia
Workshop on BIODIVERSITY IN AGROECOSYSTEMS – p. 17/21
CYCAS-MEDChecking simulations
1000 simulated years that should have the meancharacteristics obtained from observed data.
Workshop on BIODIVERSITY IN AGROECOSYSTEMS – p. 18/21

CYCAS-MEDChecking simulations
1000 simulated years that should have the meancharacteristics obtained from observed data.
MEAN data Tmin Tmax Tday Daily rainfall
Site ◦C ◦C ◦C mm (> 0)
Marrakech OBS 13.3 26.7 20.0 6.8SIM 13.7 27.1 20.4 6.3
Nouasser OBS 11.4 23.5 17.5 6.0SIM 11.7 23.9 17.8 6.0
Rabat OBS 12.7 22.2 17.4 7.9SIM 12.8 22.4 17.6 7.8
Tanger OBS 13.4 22.1 17.7 9.0SIM 13.5 18.0 22.4 8.9
good mean (climatic) valuesWorkshop on BIODIVERSITY IN AGROECOSYSTEMS – p. 18/21

CYCAS-MEDChecking simulations
1000 simulated years that should have the meancharacteristics obtained from observed data.
VARIANCE Tmax (◦C) Tday (◦C) D. rainfall (mm)
Site obs. sim. obs. sim. obs. sim.Marrakech 32.10 31.90 56.43 55.92 26.04 11.64Nouasser 27.31 27.24 32.13 31.83 30.27 11.00Rabat 21.06 20.97 21.52 21.38 36.42 21.84Tanger 24.78 24.81 28.81 28.76 54.43 33.89
rainfall variability is underestimated
Workshop on BIODIVERSITY IN AGROECOSYSTEMS – p. 18/21

CYCAS-MEDChecking simulations
1000 simulated years that should have the meancharacteristics obtained from observed data.
NOUASSER
5 10 15 20 25 30 35JULIAN DEKAD
10
20
30
40mm
SIMULATIONS
OBS. DATA
Workshop on BIODIVERSITY IN AGROECOSYSTEMS – p. 18/21

CYCAS-MEDFuture work
◮ improvement of M&Rfi,Gamma 7−→ mixtures of Exponential
distributions
◮ a different weather generatorhidden Markov models (to be improved)
◮ better understanding of impact of WG errors onprojected crop yields
Workshop on BIODIVERSITY IN AGROECOSYSTEMS – p. 19/21

CYCAS-MEDFuture work
Workshop on BIODIVERSITY IN AGROECOSYSTEMS – p. 20/21
CYCAS-MED
THANK YOUFOR YOUR ATTENTION
Workshop on BIODIVERSITY IN AGROECOSYSTEMS – p. 21/21