Embed Size (px)
Citation preview
© 2016 Nimble Storage
The Data Feedback Loop Using Big Data to Enhance Data Storage
Shannon Loomis Data Scientist Sept 19, 2016
© 2016 Nimble Storage 2
Using Big Data to Enhance Data Storage
Introduction to the InfoSight Platform – The what, how, and why of big data collection
Case Study #1: Data Change Rates
– How often should you back up your data? Case Study #2: IO Block Sizes
– How do real world applications send and receive data? – What does this mean for benchmarking?
© 2016 Nimble Storage 3
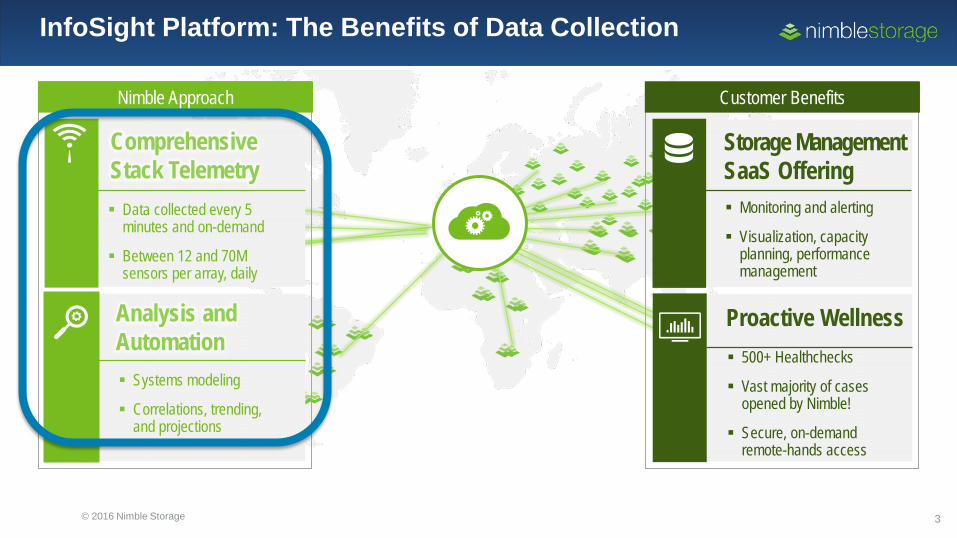
Data collected every 5 minutes and on-demand
Between 12 and 70M sensors per array, daily
Comprehensive Stack Telemetry
Systems modeling
Correlations, trending, and projections
Analysis and Automation
500+ Healthchecks
Vast majority of cases opened by Nimble!
Secure, on-demand remote-hands access
Proactive Wellness
Monitoring and alerting
Visualization, capacity planning, performance management
Storage Management SaaS Offering
Nimble Approach Customer Benefits
InfoSight Platform: The Benefits of Data Collection
© 2016 Nimble Storage 4
InfoSight Platform: Big Data
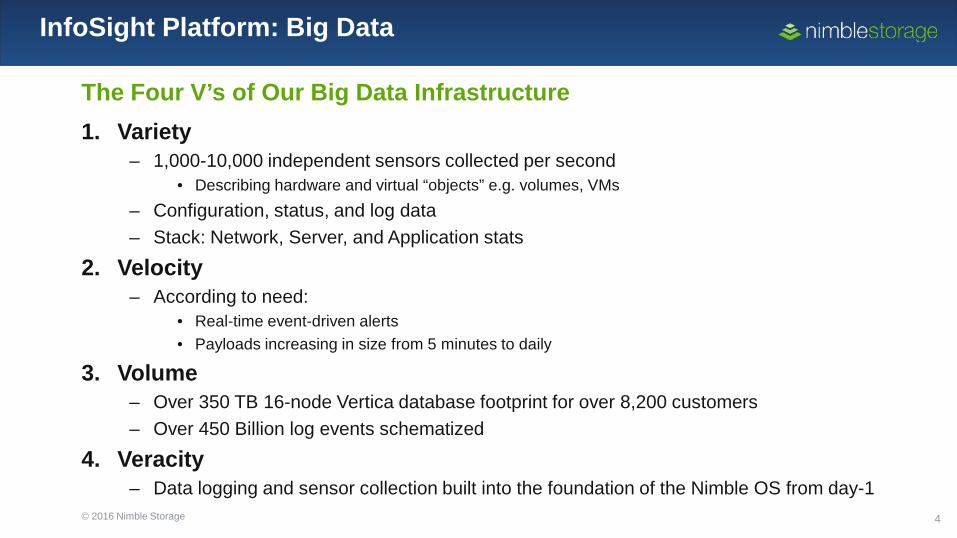
The Four V’s of Our Big Data Infrastructure 1. Variety
– 1,000-10,000 independent sensors collected per second • Describing hardware and virtual “objects” e.g. volumes, VMs
– Configuration, status, and log data – Stack: Network, Server, and Application stats
2. Velocity – According to need:
• Real-time event-driven alerts • Payloads increasing in size from 5 minutes to daily
3. Volume – Over 350 TB 16-node Vertica database footprint for over 8,200 customers – Over 450 Billion log events schematized
4. Veracity – Data logging and sensor collection built into the foundation of the Nimble OS from day-1
© 2016 Nimble Storage 5
Using Big Data to Enhance Data Storage
Introduction to the InfoSight Platform – The what, how, and why of big data collection
Case Study #1: Data Change Rates
– How often should you back up your data? Case Study #2: IO Block Sizes
– How do real world applications send and receive data? – What does this mean for benchmarking?
© 2016 Nimble Storage 6
Growth, Change Rates and Data Protection
Data is doubling every 2 years and changing the data protection landscape.
15%
32%
50%
53%
41%
82%
Gartner Magic Quadrant for Data Center Backup and Recovery Software
© 2016 Nimble Storage 7
Growth, Change Rates and Data Protection
• Data changes are influenced by writes, but how? – Compression, deletes, and overwrites mean that writes:data change
isn’t 1:1 – Is linear? Or some other functional form?
• If we know how fast data is changing on one timescale, can we multiply it
out to estimate how much will change on another? – E.g. My average daily snapshot is 1 GB – does that mean my
average weekly would be 7GB?
Shannon Loomis | Disaster preparedness: Using data change rates for capacity and protection planning
© 2016 Nimble Storage 8
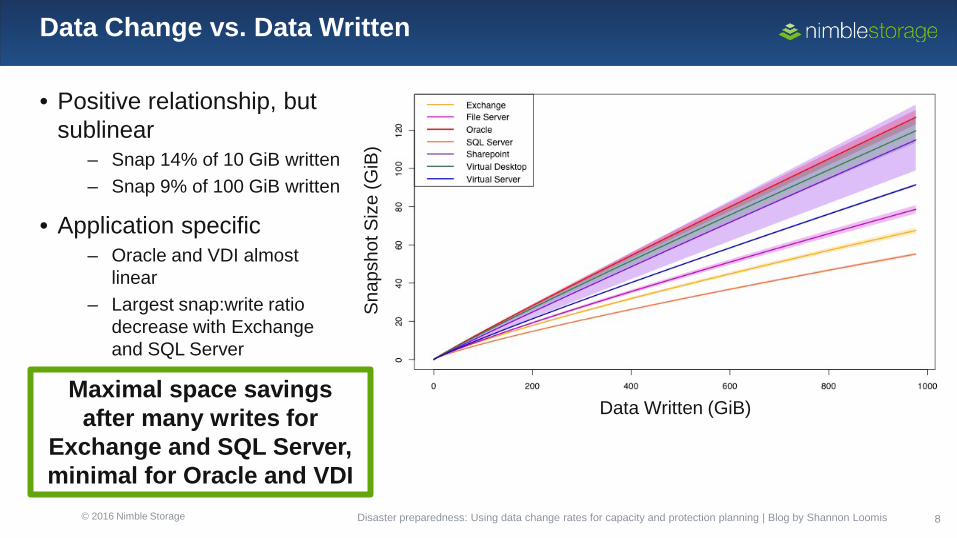
Data Change vs. Data Written
• Positive relationship, but sublinear
– Snap 14% of 10 GiB written – Snap 9% of 100 GiB written
• Application specific – Oracle and VDI almost
linear – Largest snap:write ratio
decrease with Exchange and SQL Server
Data Written (GiB)
Sna
psho
t Siz
e (G
iB)
Disaster preparedness: Using data change rates for capacity and protection planning | Blog by Shannon Loomis
Maximal space savings after many writes for
Exchange and SQL Server, minimal for Oracle and VDI
© 2016 Nimble Storage 9
Growth, Change Rates and Data Protection
• Data changes are influenced by writes, but how? – Compression, deletes, and overwrites mean that writes:data change
isn’t 1:1 – Is linear? Or some other functional form?
• If we know how fast data is changing on one timescale, can we multiply it
out to estimate how much will change on another? – E.g. My average daily snapshot is 1 GB – does that mean my
average weekly would be 7GB?
Disaster preparedness: Using data change rates for capacity and protection planning | Blog by Shannon Loomis
© 2016 Nimble Storage 10
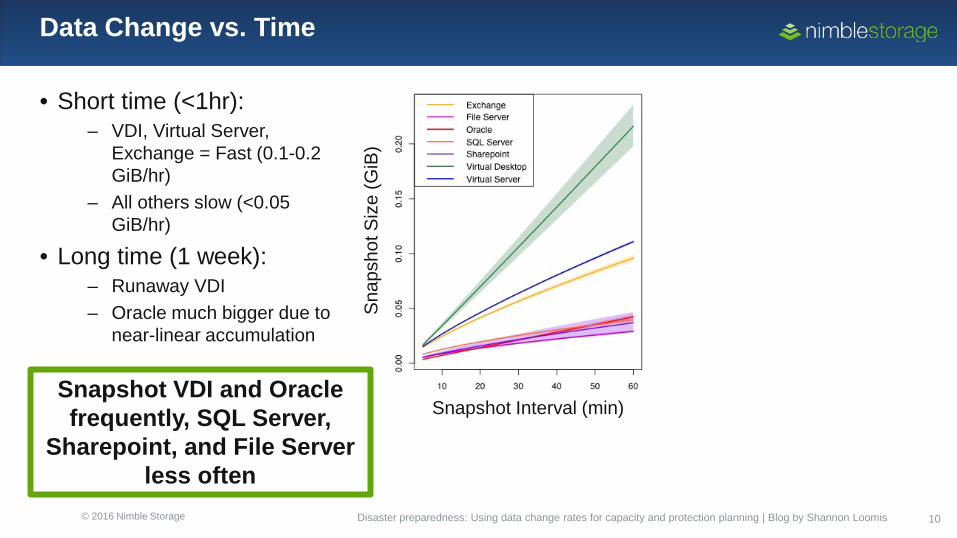
Data Change vs. Time
• Short time (<1hr): – VDI, Virtual Server,
Exchange = Fast (0.1-0.2 GiB/hr)
– All others slow (<0.05 GiB/hr)
• Long time (1 week): – Runaway VDI – Oracle much bigger due to
near-linear accumulation
Snapshot Interval (min)
Sna
psho
t Siz
e (G
iB)
Snapshot Interval (day) Snapshot VDI and Oracle frequently, SQL Server,
Sharepoint, and File Server less often
Disaster preparedness: Using data change rates for capacity and protection planning | Blog by Shannon Loomis
© 2016 Nimble Storage 11
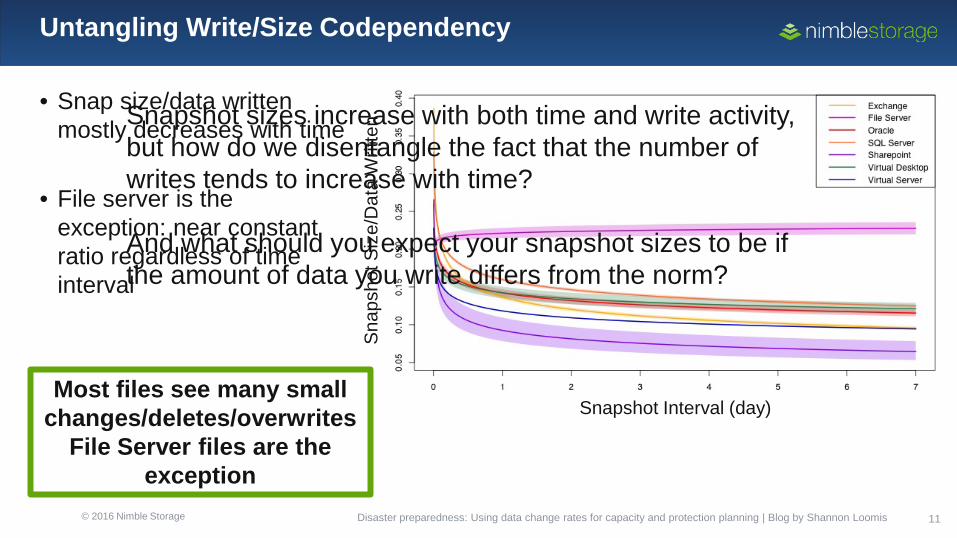
Untangling Write/Size Codependency
• Snap size/data written mostly decreases with time
• File server is the exception: near constant ratio regardless of time interval
Snapshot Interval (day)
Sna
psho
t Siz
e/D
ata
Writ
ten
Most files see many small changes/deletes/overwrites
File Server files are the exception
Snapshot sizes increase with both time and write activity, but how do we disentangle the fact that the number of writes tends to increase with time? And what should you expect your snapshot sizes to be if the amount of data you write differs from the norm?
Disaster preparedness: Using data change rates for capacity and protection planning | Blog by Shannon Loomis
© 2016 Nimble Storage 12
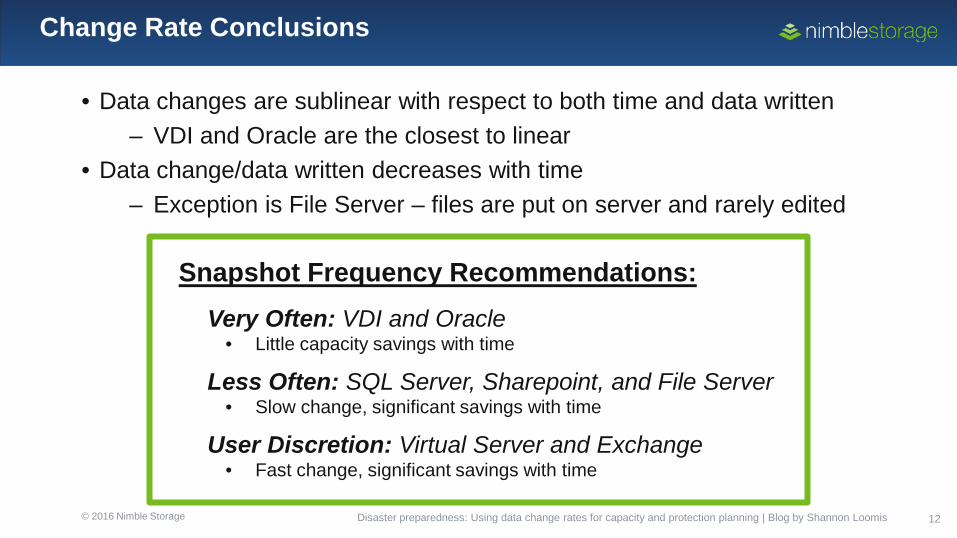
Change Rate Conclusions
• Data changes are sublinear with respect to both time and data written – VDI and Oracle are the closest to linear
• Data change/data written decreases with time – Exception is File Server – files are put on server and rarely edited
Snapshot Frequency Recommendations: Very Often: VDI and Oracle
• Little capacity savings with time
Less Often: SQL Server, Sharepoint, and File Server • Slow change, significant savings with time
User Discretion: Virtual Server and Exchange • Fast change, significant savings with time
Disaster preparedness: Using data change rates for capacity and protection planning | Blog by Shannon Loomis
© 2016 Nimble Storage 13
Using Big Data to Enhance Data Storage
Introduction to the InfoSight Platform – The what, how, and why of big data collection
Case Study #1: Data Change Rates
– How often should you back up your data? Case Study #2: IO Block Sizes
– How do real world applications send and receive data? – What does this mean for benchmarking?
© 2016 Nimble Storage 14
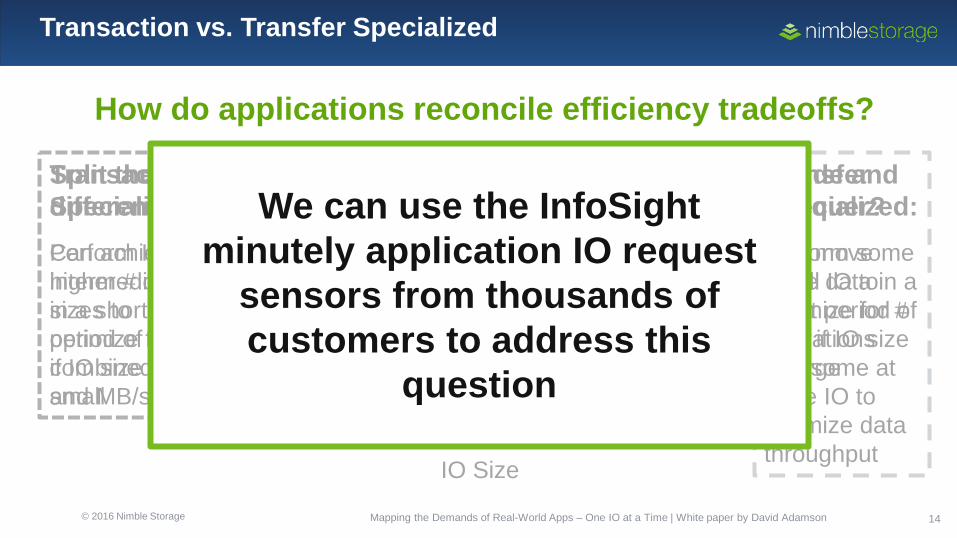
Transaction vs. Transfer Specialized
How do applications reconcile efficiency tradeoffs?
IO/s
ec a
chie
vabl
e
MB
/sec
ach
ieva
ble
IO Size
Transaction Specialized: Can achieve higher # of IO in a short period of time if IO size is small
Transfer Specialized: Can move more data in a short period of time if IO size is large
Split the difference? Perform IO at intermediate sizes to optimize for combined IO and MB/sec
Divide and conquer? Perform some small IO to optimize for # operations and some at large IO to optimize data throughput
Mapping the Demands of Real-World Apps – One IO at a Time | White paper by David Adamson
We can use the InfoSight minutely application IO request
sensors from thousands of customers to address this
question
© 2016 Nimble Storage 15
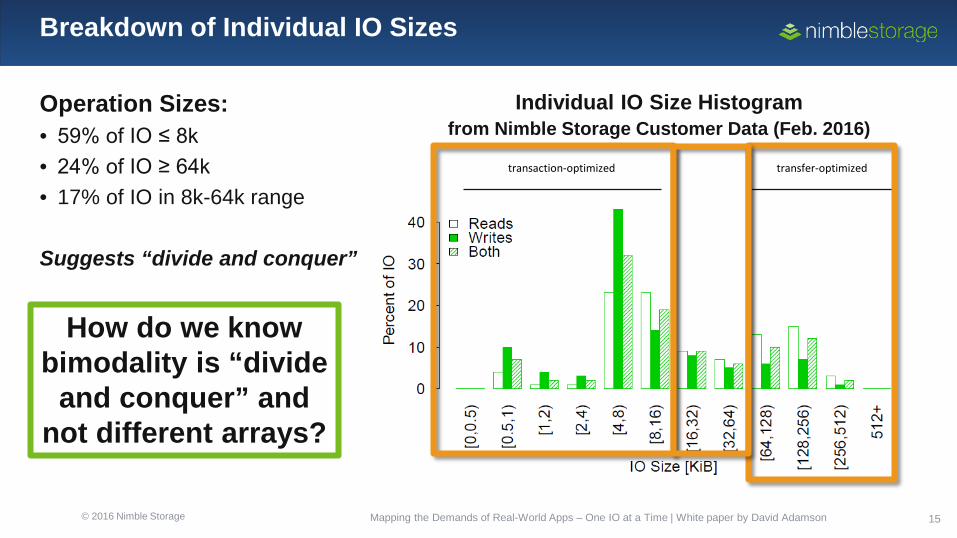
Breakdown of Individual IO Sizes
transfer-optimized transaction-optimized
Individual IO Size Histogram from Nimble Storage Customer Data (Feb. 2016)
Operation Sizes: • 59% of IO ≤ 8k • 24% of IO ≥ 64k • 17% of IO in 8k-64k range Suggests “divide and conquer”
How do we know bimodality is “divide
and conquer” and not different arrays?
Mapping the Demands of Real-World Apps – One IO at a Time | White paper by David Adamson
© 2016 Nimble Storage 16
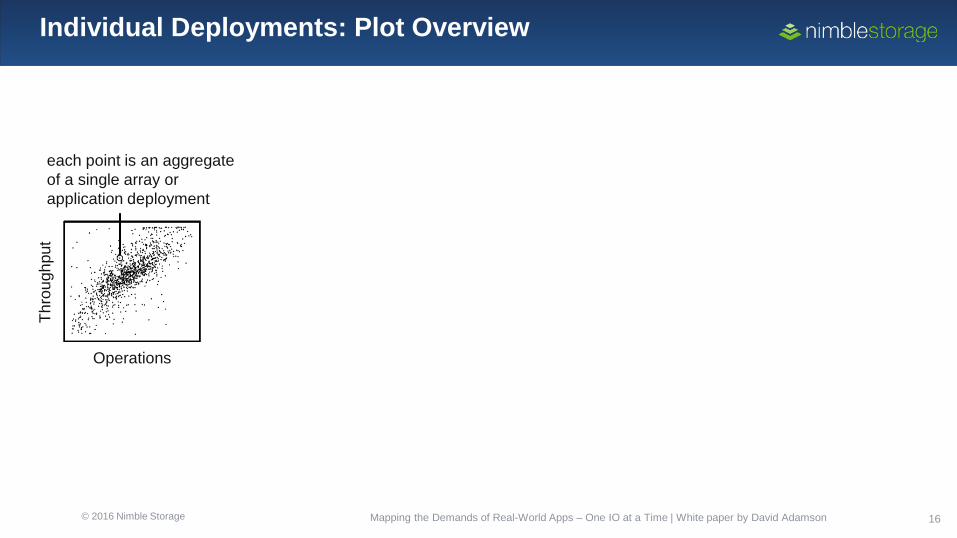
Individual Deployments: Plot Overview
each point is an aggregate of a single array or application deployment
Operations
Thro
ughp
ut
Mapping the Demands of Real-World Apps – One IO at a Time | White paper by David Adamson
© 2016 Nimble Storage 17
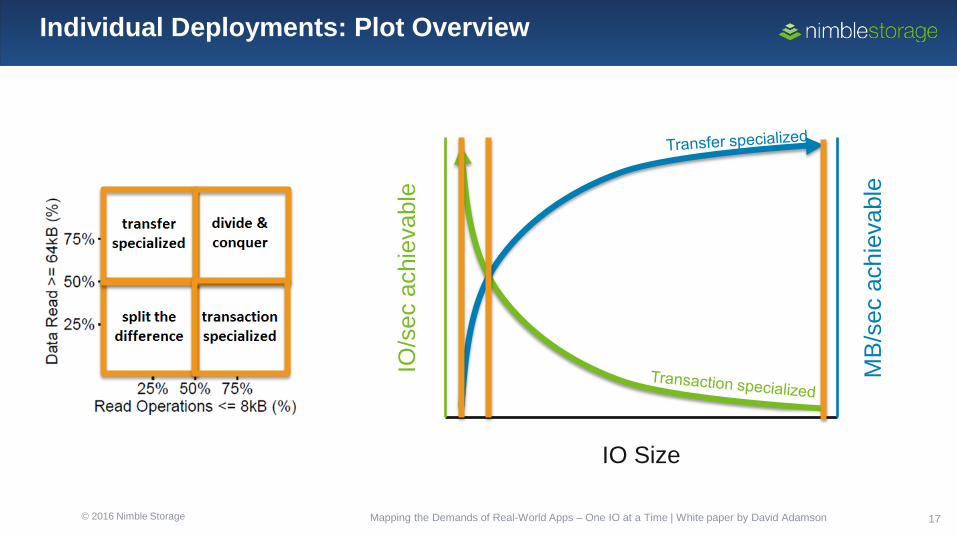
Individual Deployments: Plot Overview
IO/s
ec a
chie
vabl
e
MB
/sec
ach
ieva
ble
IO Size
Mapping the Demands of Real-World Apps – One IO at a Time | White paper by David Adamson
© 2016 Nimble Storage 18
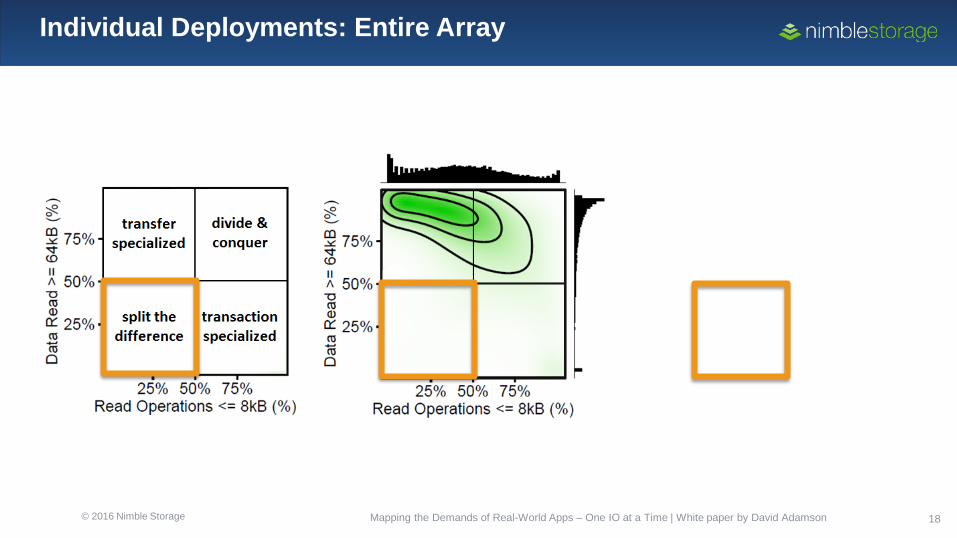
Individual Deployments: Entire Array
Mapping the Demands of Real-World Apps – One IO at a Time | White paper by David Adamson
© 2016 Nimble Storage 19
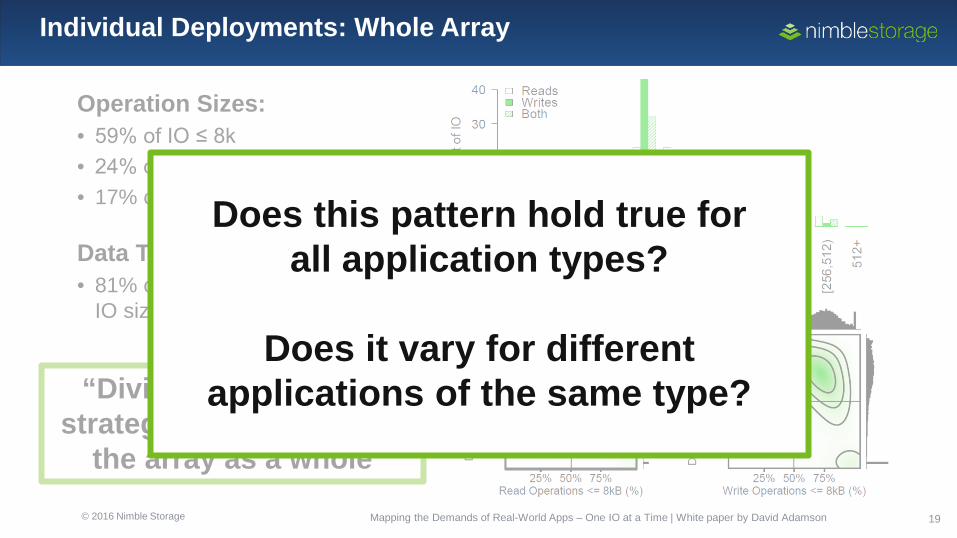
Individual Deployments: Whole Array
Operation Sizes: • 59% of IO ≤ 8k • 24% of IO ≥ 64k • 17% of IO in 8k-64k range
Data Transfer: • 81% of data transferred in
IO size ≥ 64k
“Divide and conquer” strategy predominant on
the array as a whole
Mapping the Demands of Real-World Apps – One IO at a Time | White paper by David Adamson
Does this pattern hold true for all application types?
Does it vary for different
applications of the same type?
© 2016 Nimble Storage 20
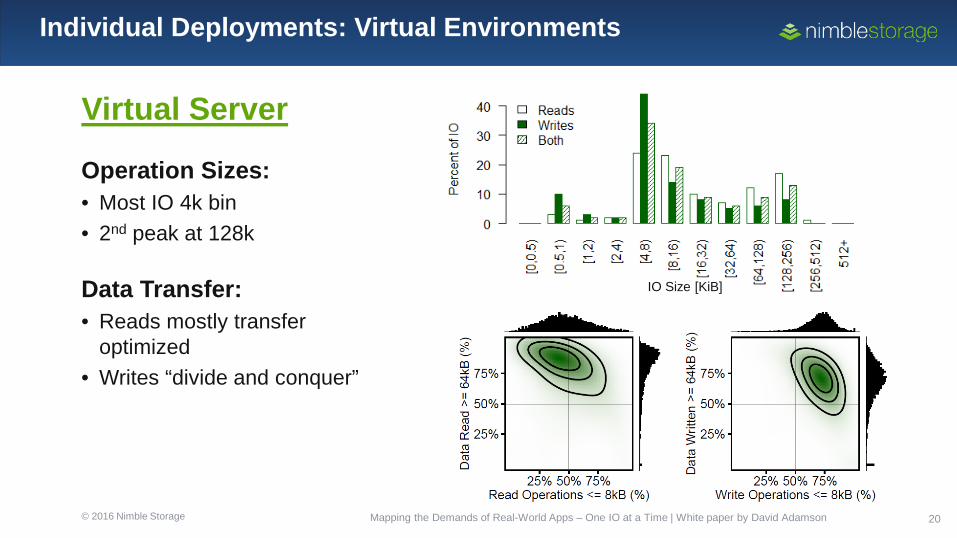
Individual Deployments: Virtual Environments
Virtual Server
Operation Sizes: • Most IO 4k bin • 2nd peak at 128k
Data Transfer: • Reads mostly transfer
optimized • Writes “divide and conquer”
IO Size [KiB]
Mapping the Demands of Real-World Apps – One IO at a Time | White paper by David Adamson
© 2016 Nimble Storage 21
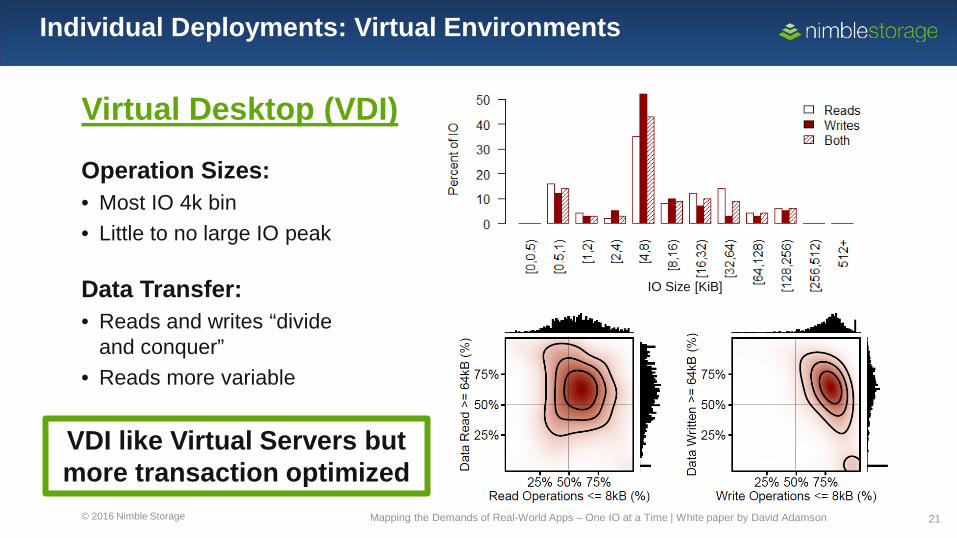
Individual Deployments: Virtual Environments
Virtual Desktop (VDI)
Operation Sizes: • Most IO 4k bin • Little to no large IO peak
Data Transfer: • Reads and writes “divide
and conquer” • Reads more variable
VDI like Virtual Servers but more transaction optimized
IO Size [KiB]
Mapping the Demands of Real-World Apps – One IO at a Time | White paper by David Adamson
© 2016 Nimble Storage 22
Individual Deployments: Databases
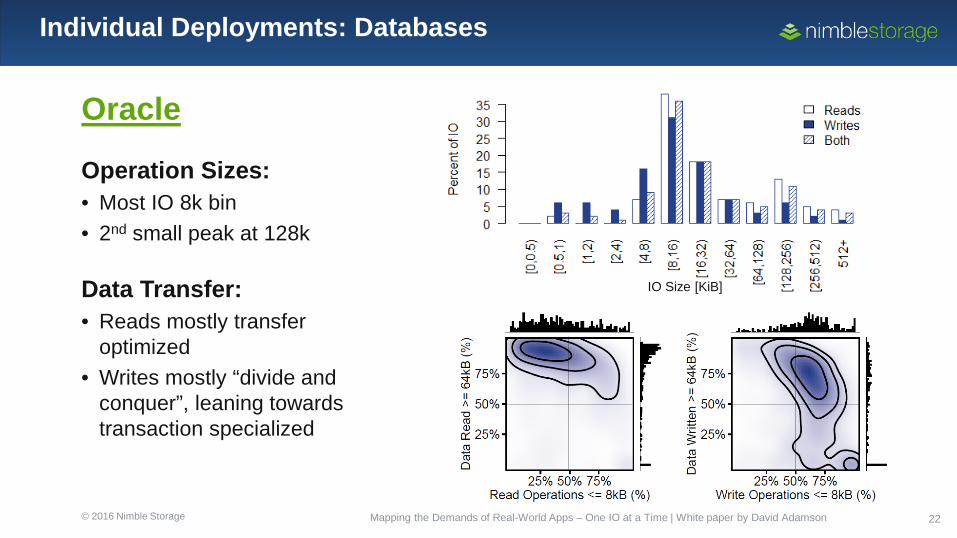
Oracle
Operation Sizes: • Most IO 8k bin • 2nd small peak at 128k
Data Transfer: • Reads mostly transfer
optimized • Writes mostly “divide and
conquer”, leaning towards transaction specialized
IO Size [KiB]
Mapping the Demands of Real-World Apps – One IO at a Time | White paper by David Adamson
© 2016 Nimble Storage 23
Individual Deployments: Databases
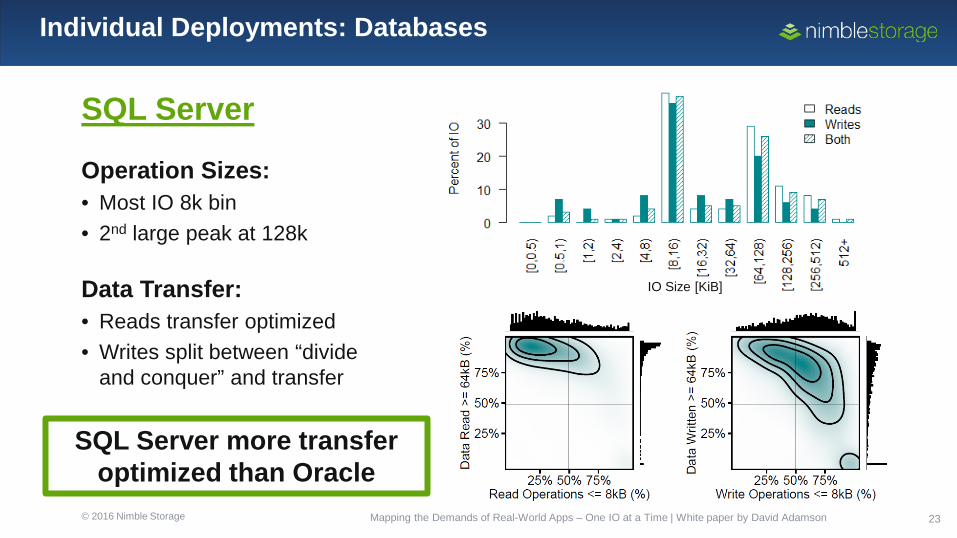
SQL Server
Operation Sizes: • Most IO 8k bin • 2nd large peak at 128k
Data Transfer: • Reads transfer optimized • Writes split between “divide
and conquer” and transfer SQL Server more transfer
optimized than Oracle
IO Size [KiB]
Mapping the Demands of Real-World Apps – One IO at a Time | White paper by David Adamson
© 2016 Nimble Storage 24
Individual Deployments: File Sharing
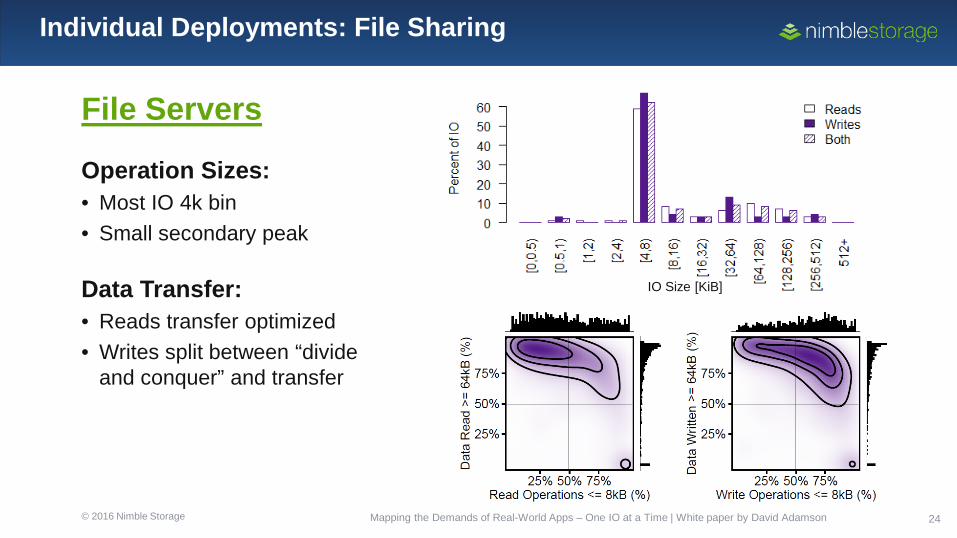
File Servers
Operation Sizes: • Most IO 4k bin • Small secondary peak
Data Transfer: • Reads transfer optimized • Writes split between “divide
and conquer” and transfer
IO Size [KiB]
Mapping the Demands of Real-World Apps – One IO at a Time | White paper by David Adamson
© 2016 Nimble Storage 25
Individual Deployments: File Sharing
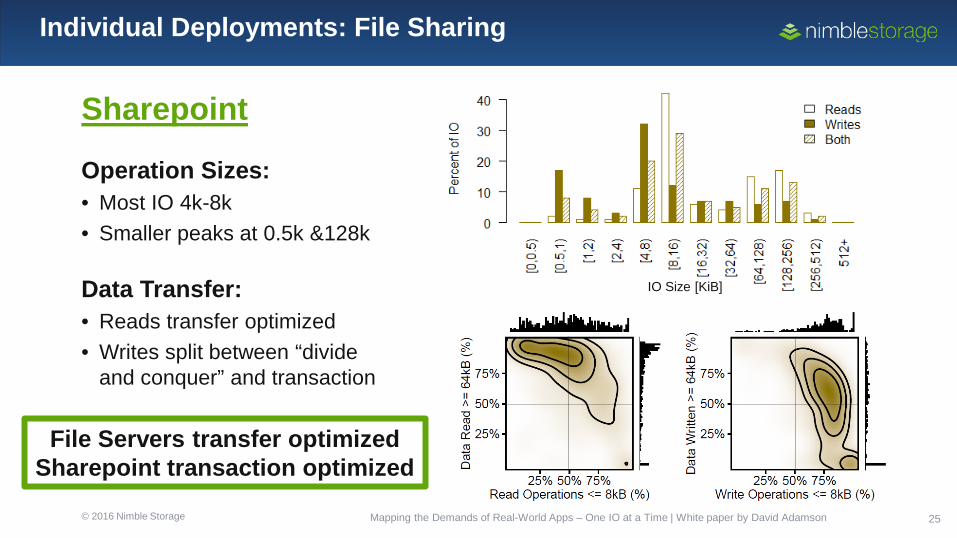
Sharepoint
Operation Sizes: • Most IO 4k-8k • Smaller peaks at 0.5k &128k
Data Transfer: • Reads transfer optimized • Writes split between “divide
and conquer” and transaction
File Servers transfer optimized Sharepoint transaction optimized
IO Size [KiB]
Mapping the Demands of Real-World Apps – One IO at a Time | White paper by David Adamson
© 2016 Nimble Storage 26
Individual Deployments: Exchange Servers
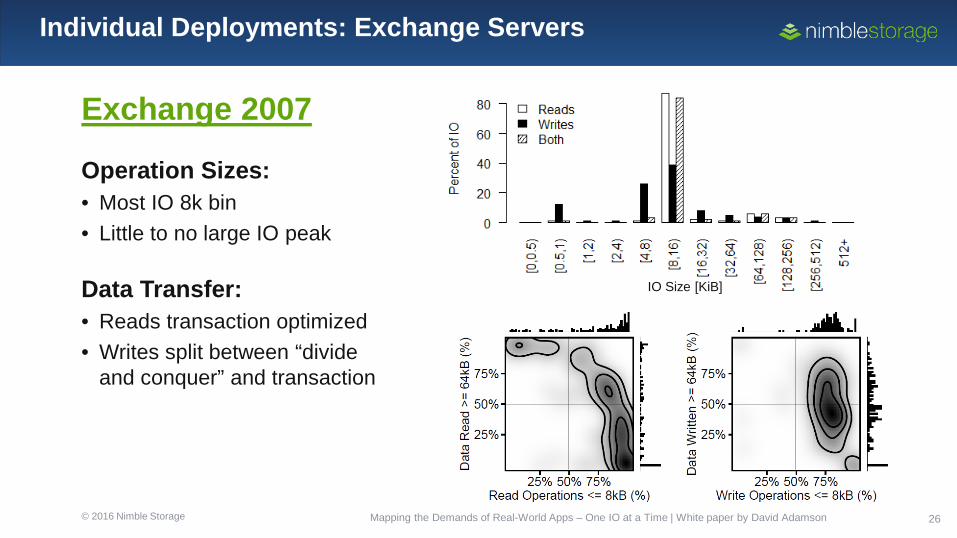
Exchange 2007
Operation Sizes: • Most IO 8k bin • Little to no large IO peak
Data Transfer: • Reads transaction optimized • Writes split between “divide
and conquer” and transaction
IO Size [KiB]
Mapping the Demands of Real-World Apps – One IO at a Time | White paper by David Adamson
© 2016 Nimble Storage 27
Individual Deployments: Exchange Servers
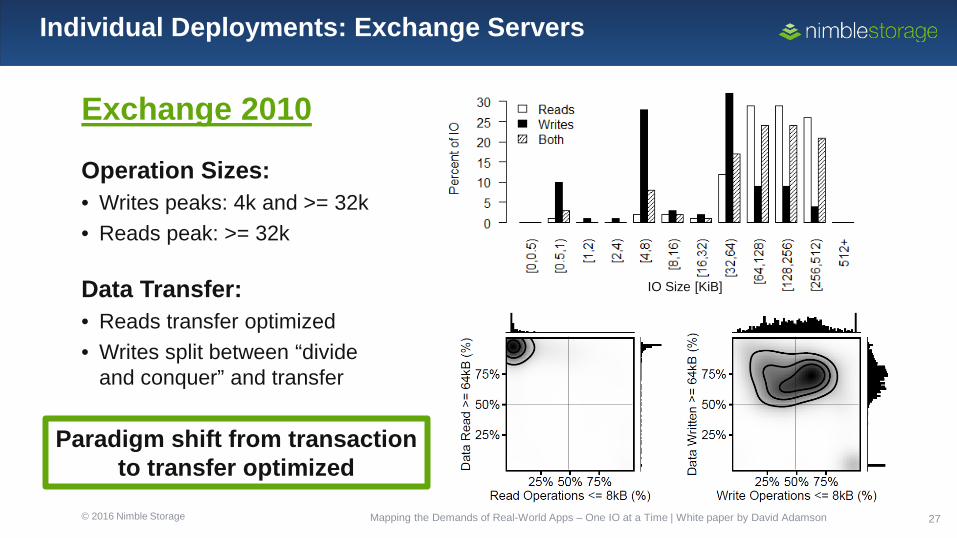
Exchange 2010
Operation Sizes: • Writes peaks: 4k and >= 32k • Reads peak: >= 32k
Data Transfer: • Reads transfer optimized • Writes split between “divide
and conquer” and transfer
Paradigm shift from transaction to transfer optimized
IO Size [KiB]
Mapping the Demands of Real-World Apps – One IO at a Time | White paper by David Adamson
© 2016 Nimble Storage 28
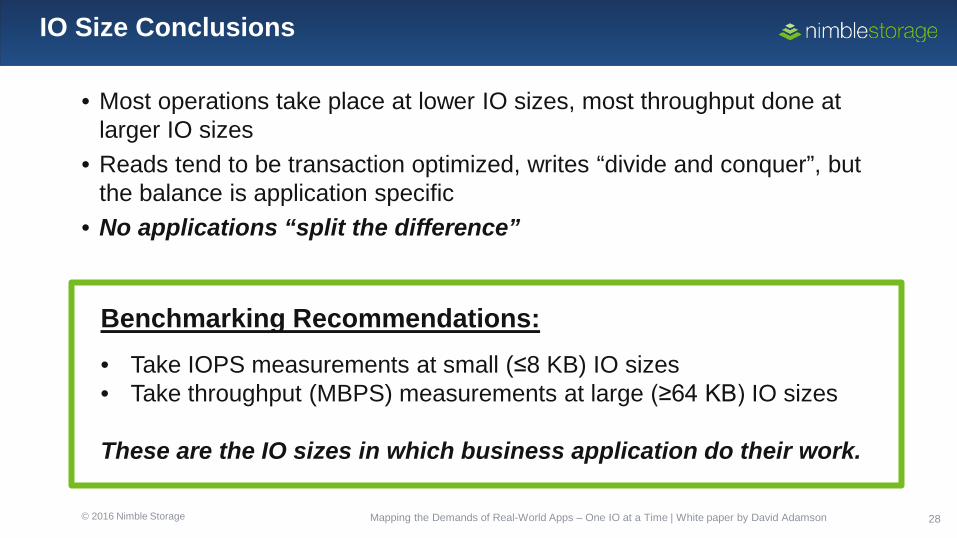
IO Size Conclusions
• Most operations take place at lower IO sizes, most throughput done at larger IO sizes
• Reads tend to be transaction optimized, writes “divide and conquer”, but the balance is application specific
• No applications “split the difference”
Benchmarking Recommendations: • Take IOPS measurements at small (≤8 KB) IO sizes • Take throughput (MBPS) measurements at large (≥64 KB) IO sizes
These are the IO sizes in which business application do their work.
Mapping the Demands of Real-World Apps – One IO at a Time | White paper by David Adamson
© 2016 Nimble Storage 29
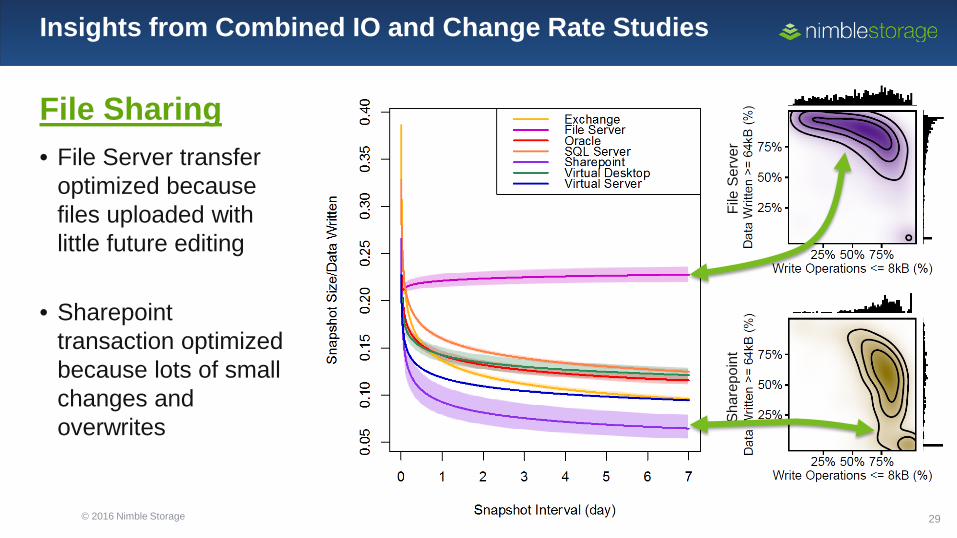
Insights from Combined IO and Change Rate Studies
File Sharing • File Server transfer
optimized because files uploaded with little future editing
• Sharepoint transaction optimized because lots of small changes and overwrites
File
Ser
ver
Shar
epoi
nt
© 2016 Nimble Storage 30
Using Big Data to Enhance Data Storage
Introduction to the InfoSight Platform – The what, how, and why of big data collection
Case Study #1: IO Block Sizes
– How do real world applications send and receive data? – What does this mean for benchmarking?
Case Study #2: Data Change Rates
– How often should you back up your data?
– Big data collection/analysis can show you how storage and applications interact, providing insights for engineers and customers
– Real world applications can be transfer optimized, transaction optimized, or take part in both
– None perform significant IO at intermediate (e.g. 32k) block sizes
– Change rates vary by time and application, and these relationships are less than linear
© 2016 Nimble Storage
Backup Slides
© 2016 Nimble Storage 33
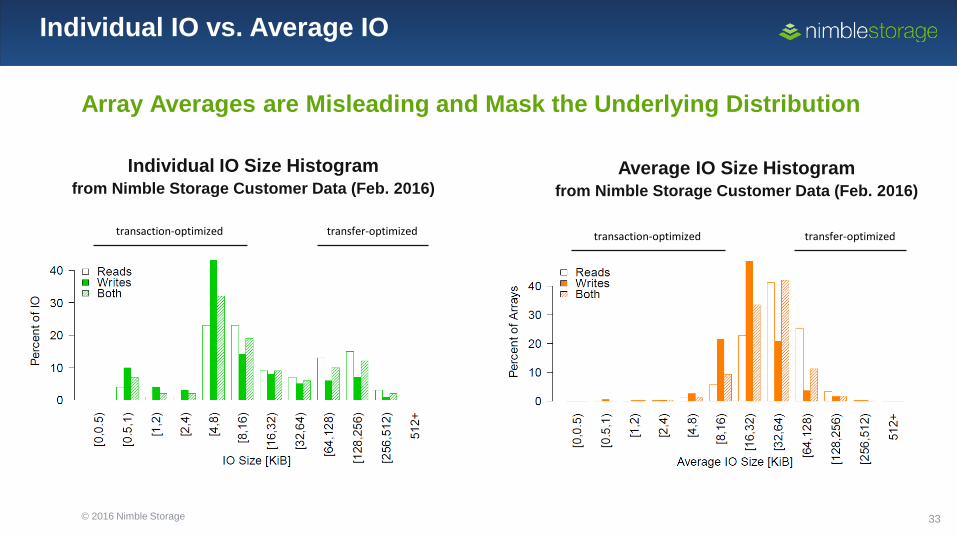
Individual IO vs. Average IO
Array Averages are Misleading and Mask the Underlying Distribution
transfer-optimized transaction-optimized transfer-optimized transaction-optimized
Individual IO Size Histogram from Nimble Storage Customer Data (Feb. 2016)
Average IO Size Histogram from Nimble Storage Customer Data (Feb. 2016)
© 2016 Nimble Storage 34
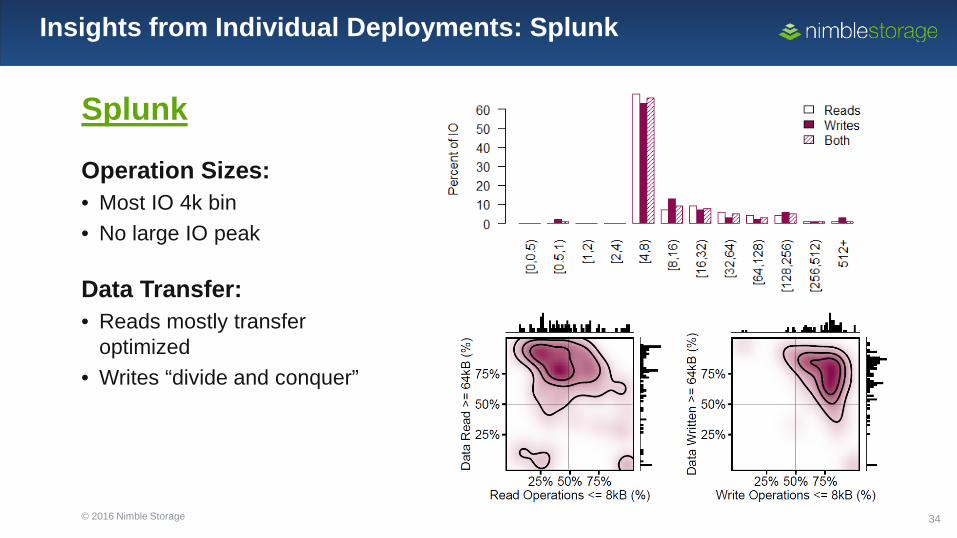
Insights from Individual Deployments: Splunk
Splunk
Operation Sizes: • Most IO 4k bin • No large IO peak
Data Transfer: • Reads mostly transfer
optimized • Writes “divide and conquer”
© 2016 Nimble Storage 35
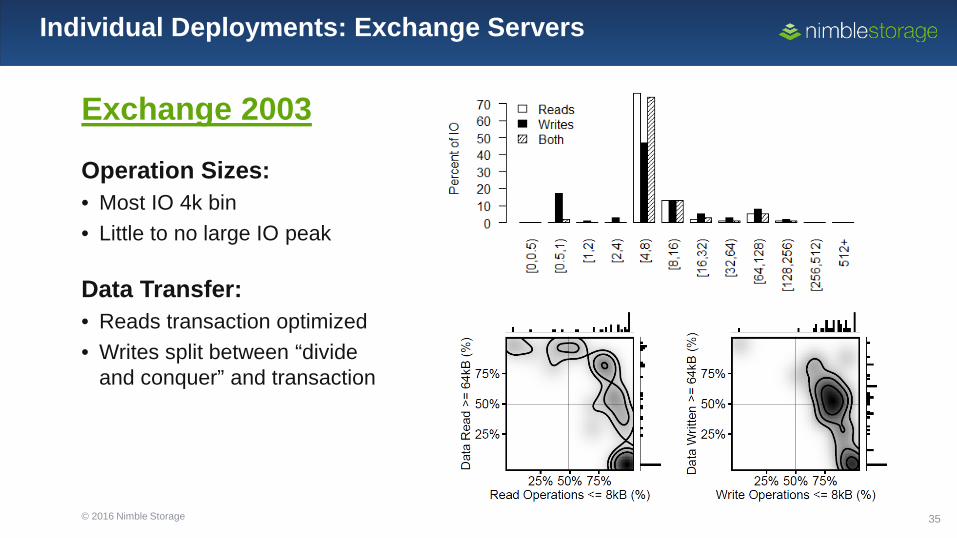
Individual Deployments: Exchange Servers
Exchange 2003
Operation Sizes: • Most IO 4k bin • Little to no large IO peak
Data Transfer: • Reads transaction optimized • Writes split between “divide
and conquer” and transaction
© 2016 Nimble Storage 36
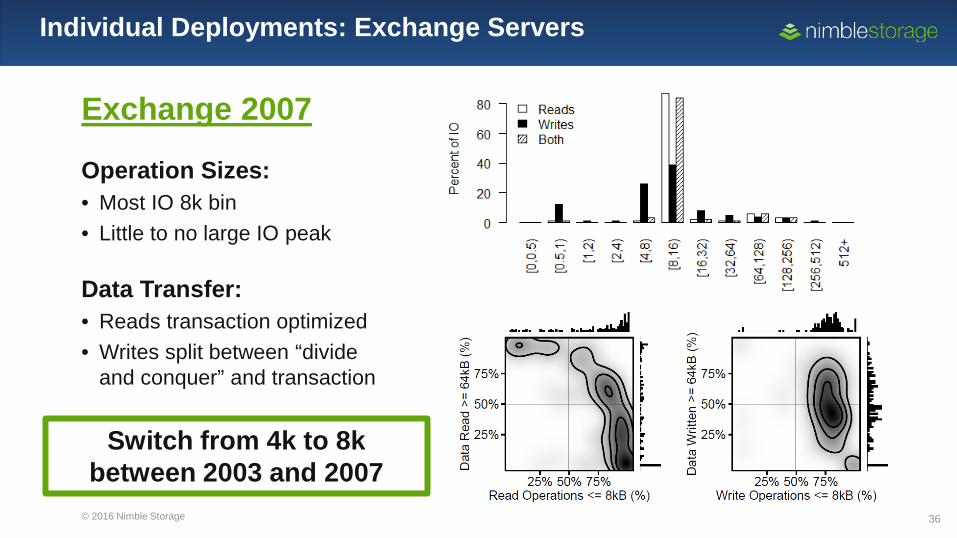
Individual Deployments: Exchange Servers
Exchange 2007
Operation Sizes: • Most IO 8k bin • Little to no large IO peak
Data Transfer: • Reads transaction optimized • Writes split between “divide
and conquer” and transaction
Switch from 4k to 8k between 2003 and 2007

© 2016 Nimble Storage 37
Individual Deployments: Exchange Servers
Exchange 2010
Operation Sizes: • Writes peaks: 4k and >= 32k • Reads peak: >= 32k
Data Transfer: • Reads transfer optimized • Writes split between “divide
and conquer” and transfer
Switch from transaction (2007) to transfer optimized (2010)
© 2016 Nimble Storage 38
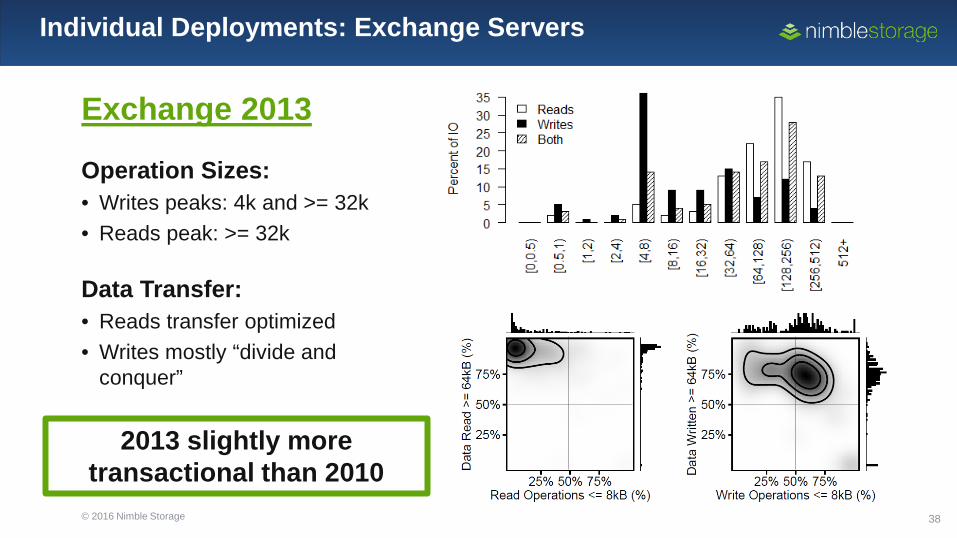
Individual Deployments: Exchange Servers
Exchange 2013
Operation Sizes: • Writes peaks: 4k and >= 32k • Reads peak: >= 32k
Data Transfer: • Reads transfer optimized • Writes mostly “divide and
conquer”
2013 slightly more transactional than 2010
© 2016 Nimble Storage 39
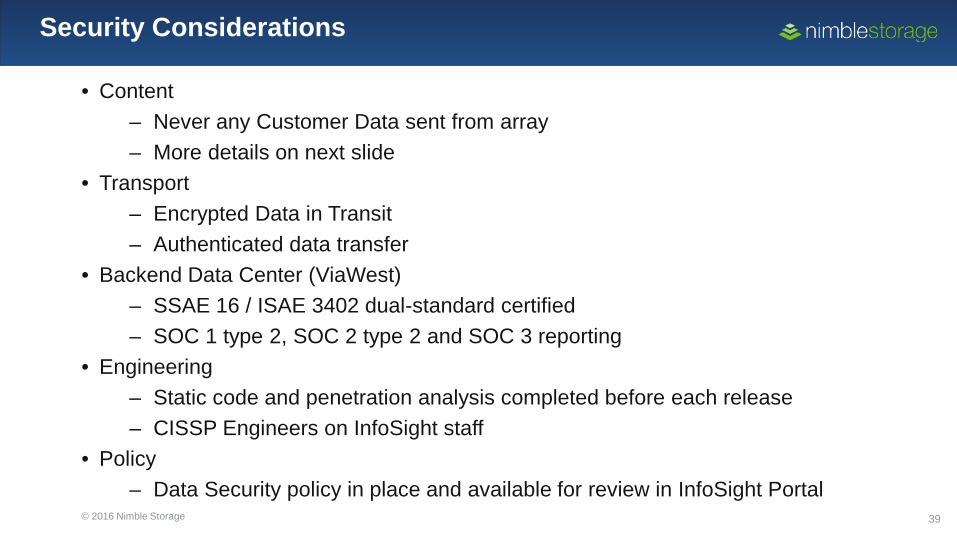
Security Considerations
• Content – Never any Customer Data sent from array – More details on next slide
• Transport – Encrypted Data in Transit – Authenticated data transfer
• Backend Data Center (ViaWest) – SSAE 16 / ISAE 3402 dual-standard certified – SOC 1 type 2, SOC 2 type 2 and SOC 3 reporting
• Engineering – Static code and penetration analysis completed before each release – CISSP Engineers on InfoSight staff
• Policy – Data Security policy in place and available for review in InfoSight Portal
© 2016 Nimble Storage 40
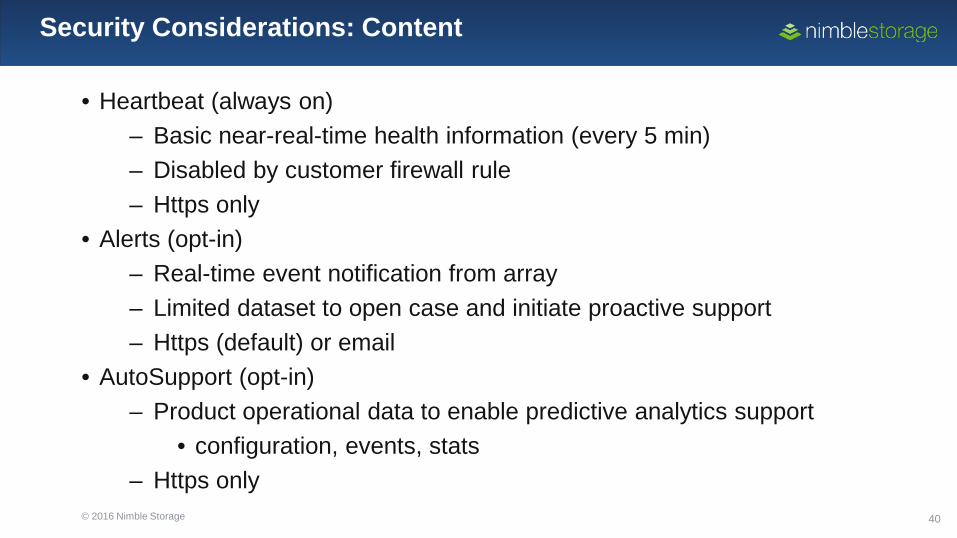
Security Considerations: Content
• Heartbeat (always on) – Basic near-real-time health information (every 5 min) – Disabled by customer firewall rule – Https only
• Alerts (opt-in) – Real-time event notification from array – Limited dataset to open case and initiate proactive support – Https (default) or email
• AutoSupport (opt-in) – Product operational data to enable predictive analytics support
• configuration, events, stats – Https only
© 2016 Nimble Storage 41
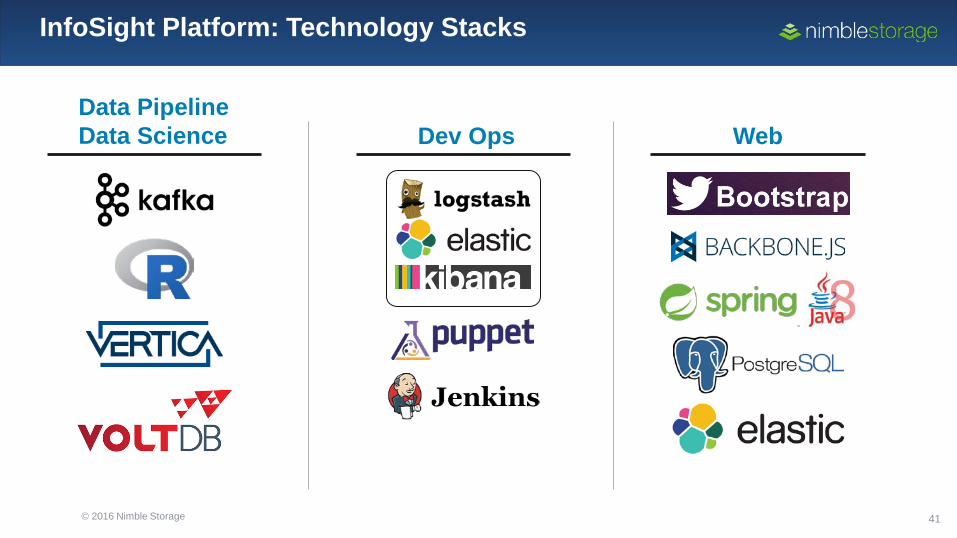
InfoSight Platform: Technology Stacks
Data Pipeline Data Science Dev Ops Web