Embed Size (px)
DESCRIPTION
2. The Data of Macroeconomics. 2-1 Measuring the Value of Economic Activity: GDP 2-2 Measuring the Cost of Living: The CPI 2-3 Measuring Joblessness: The Unemployment Rate. Learning Objectives. Define the meaning and measurement of the most important macroeconomic statistics: - PowerPoint PPT Presentation
Citation preview
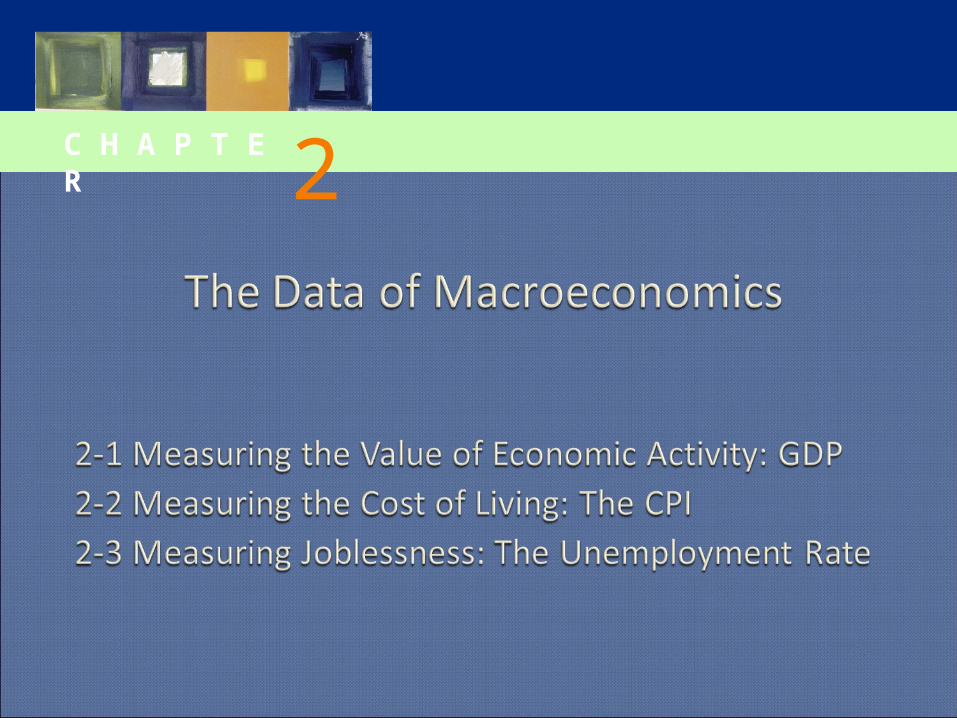
C H A P T E R 2
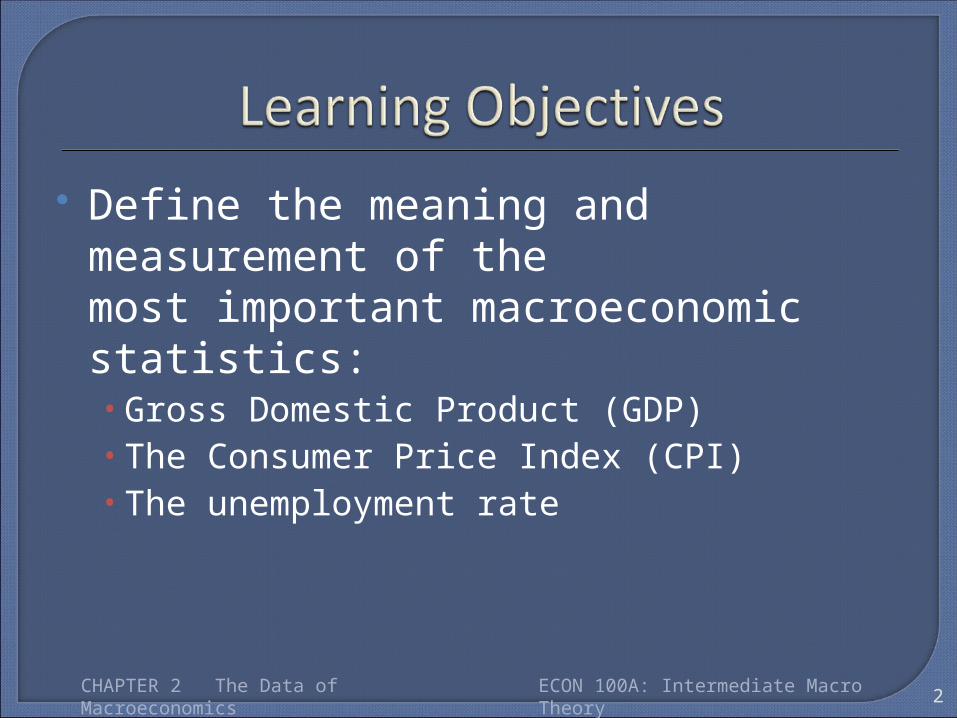
Define the meaning and measurement of the most important macroeconomic statistics:• Gross Domestic Product (GDP)• The Consumer Price Index (CPI)• The unemployment rate
2CHAPTER 2 The Data of Macroeconomics ECON 100A: Intermediate Macro Theory
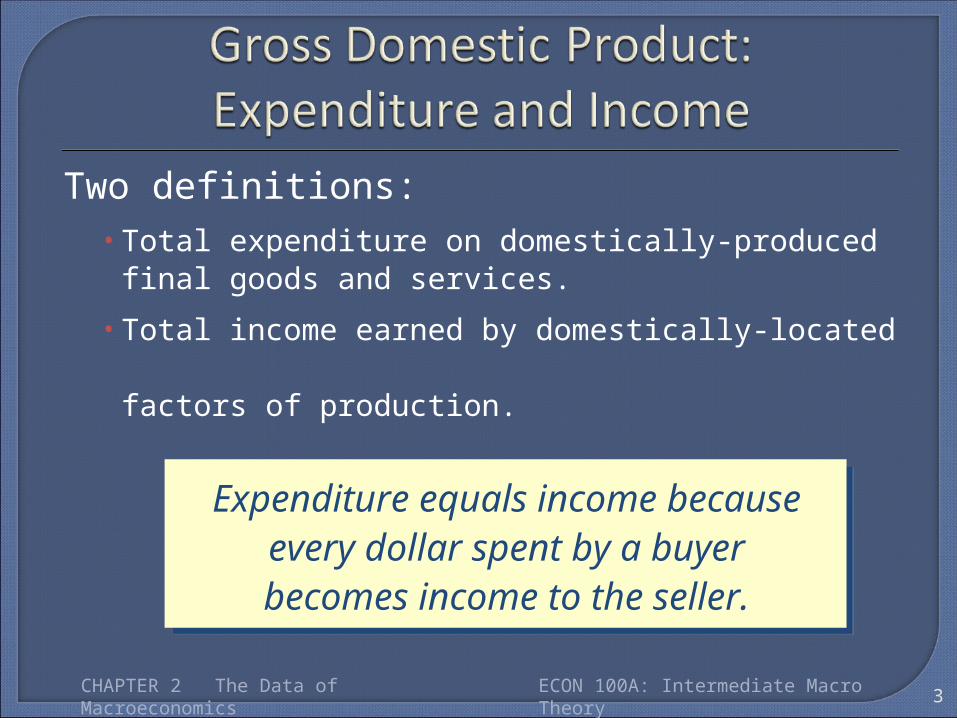
Two definitions:• Total expenditure on domestically-produced
final goods and services.• Total income earned by domestically-located
factors of production.
Expenditure equals income because every dollar spent by a buyer becomes income to the seller.
3CHAPTER 2 The Data of Macroeconomics ECON 100A: Intermediate Macro Theory
4
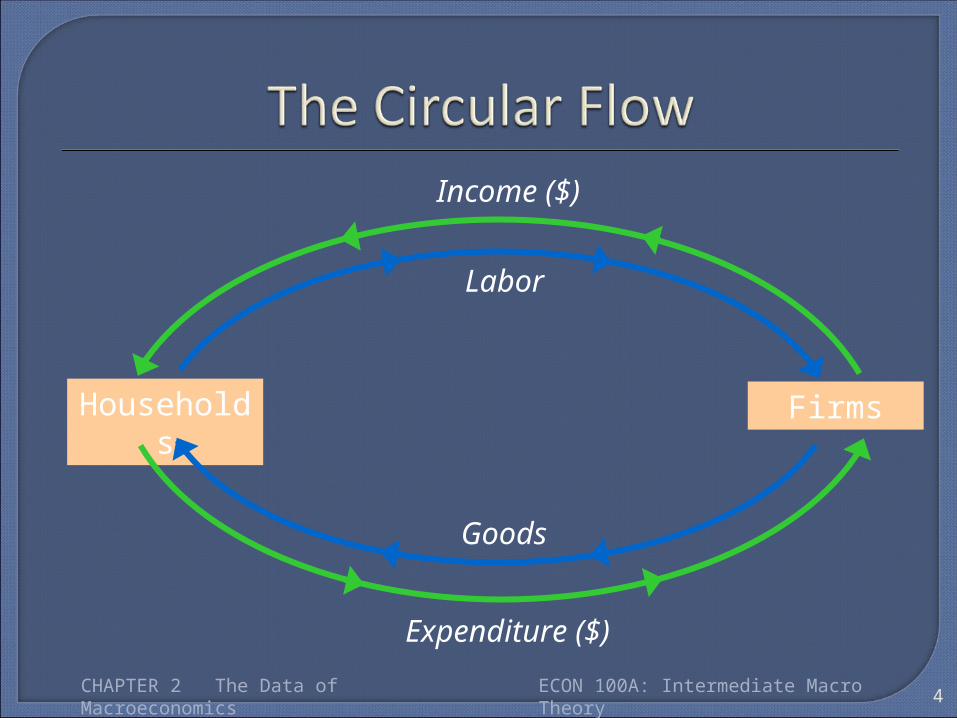
Households Firms
Goods
Labor
Expenditure ($)
Income ($)
CHAPTER 2 The Data of Macroeconomics ECON 100A: Intermediate Macro Theory
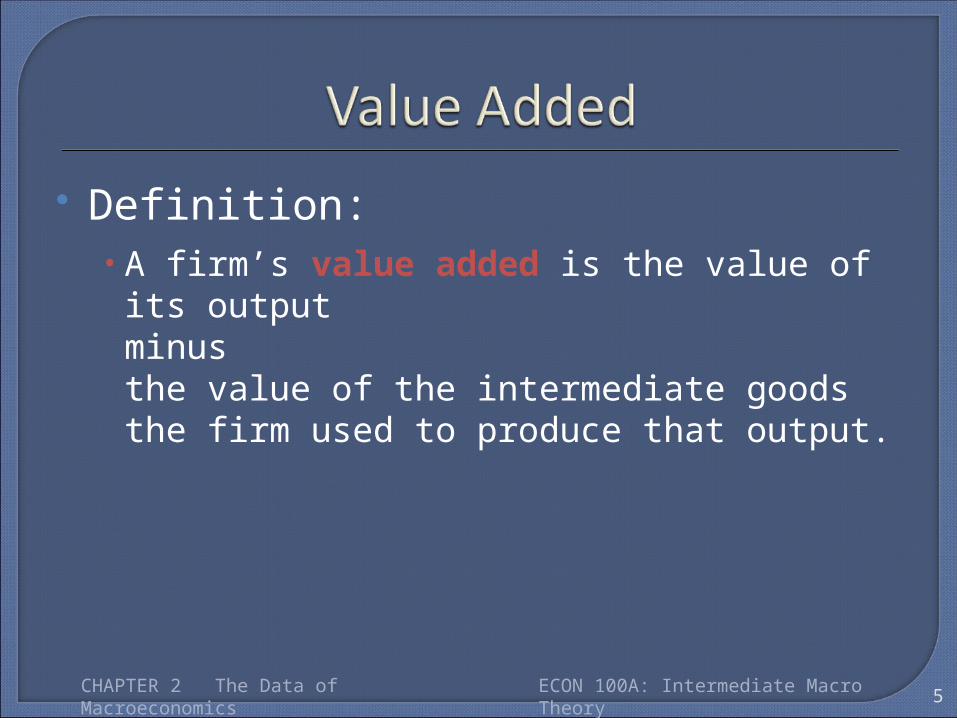
Definition: • A firm’s value added is the value of its output
minus the value of the intermediate goods the firm used to produce that output.
5CHAPTER 2 The Data of Macroeconomics ECON 100A: Intermediate Macro Theory
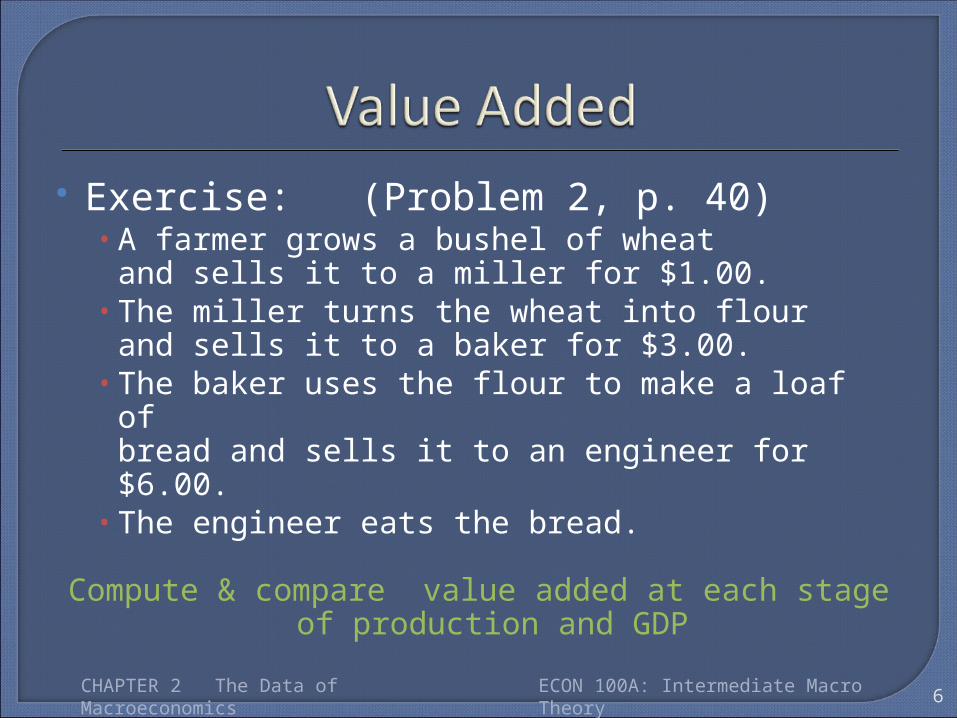
Exercise: (Problem 2, p. 40)• A farmer grows a bushel of wheat
and sells it to a miller for $1.00. • The miller turns the wheat into flour
and sells it to a baker for $3.00. • The baker uses the flour to make a loaf of
bread and sells it to an engineer for $6.00. • The engineer eats the bread.
Compute & compare value added at each stage of production and GDP
6CHAPTER 2 The Data of Macroeconomics ECON 100A: Intermediate Macro Theory
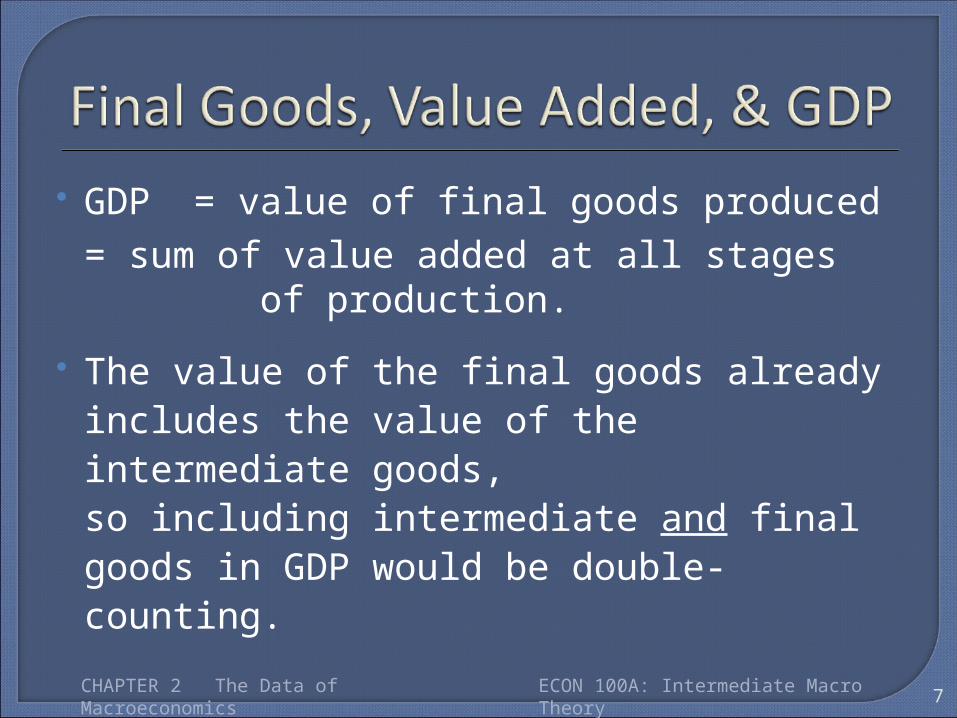
GDP = value of final goods produced = sum of value added at all stages
of production.
The value of the final goods already includes the value of the intermediate goods, so including intermediate and final goods in GDP would be double-counting.
7CHAPTER 2 The Data of Macroeconomics ECON 100A: Intermediate Macro Theory
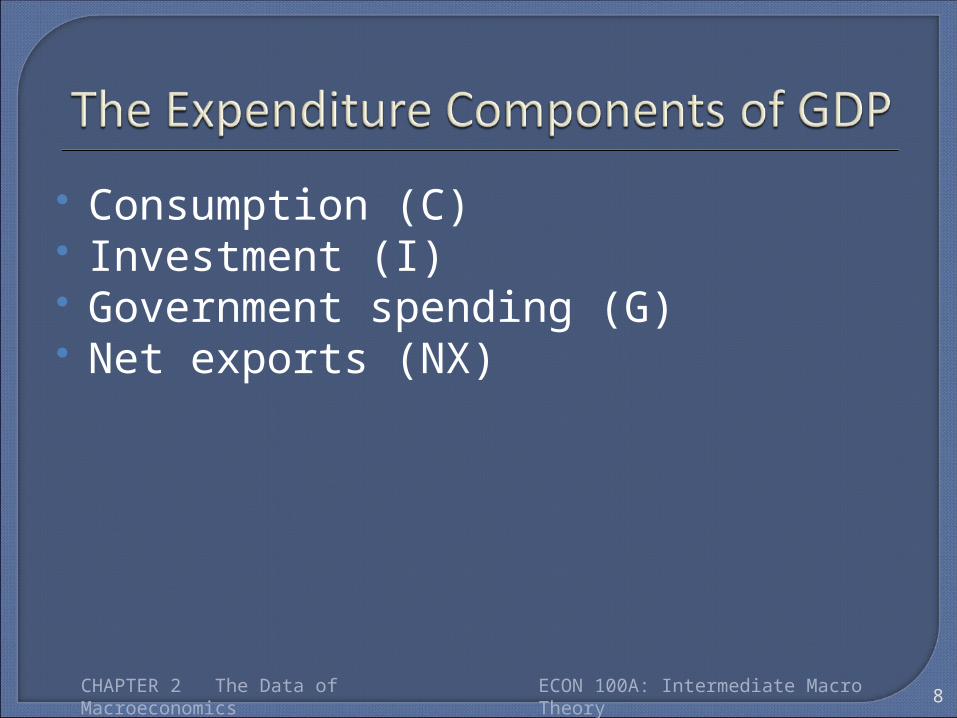
Consumption (C) Investment (I) Government spending (G) Net exports (NX)
8CHAPTER 2 The Data of Macroeconomics ECON 100A: Intermediate Macro Theory
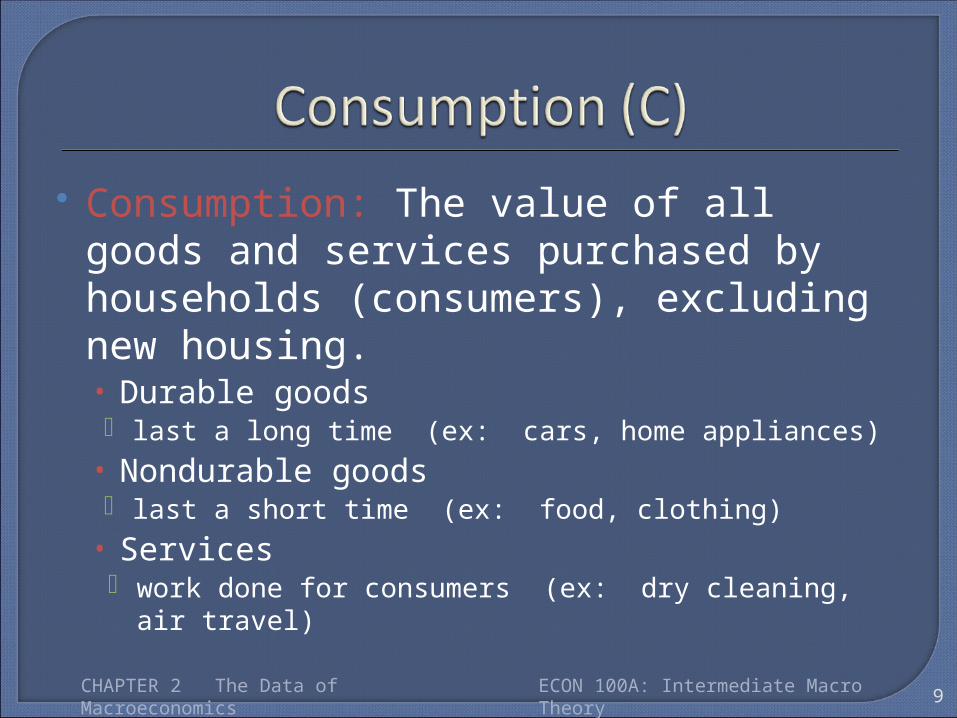
Consumption: The value of all goods and services purchased by households (consumers), excluding new housing.• Durable goods last a long time (ex: cars, home appliances)
• Nondurable goods last a short time (ex: food, clothing)
• Services work done for consumers (ex: dry cleaning, air travel)
9CHAPTER 2 The Data of Macroeconomics ECON 100A: Intermediate Macro Theory
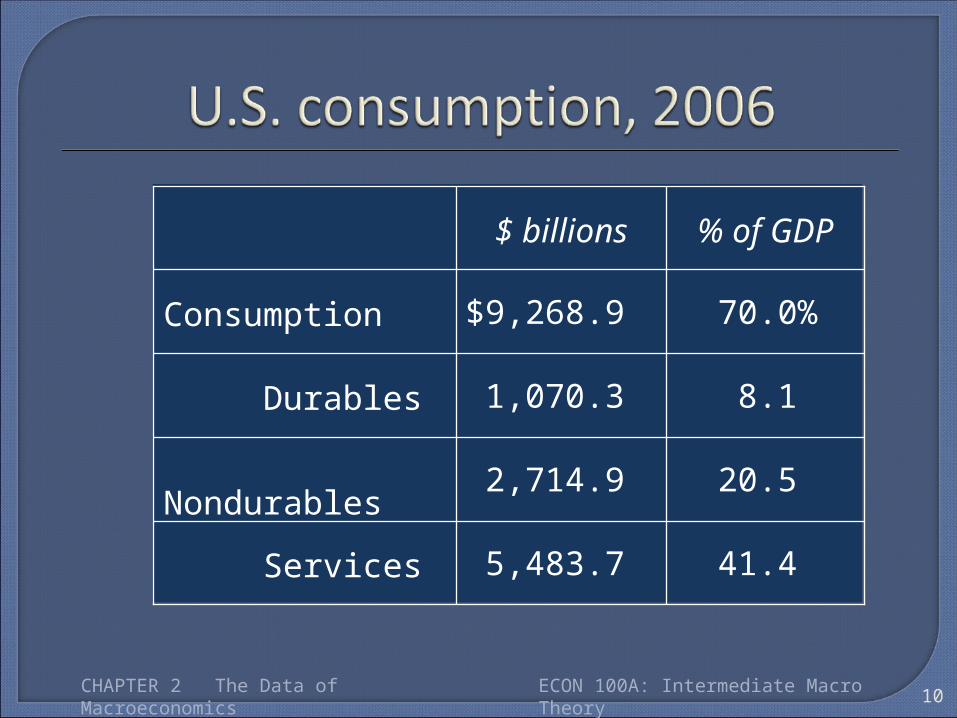
41.4
20.5
8.1
70.0%
5,483.7
2,714.9
1,070.3
$9,268.9
Services
Nondurables
Durables
Consumption
% of GDP$ billions
10CHAPTER 2 The Data of Macroeconomics ECON 100A: Intermediate Macro Theory
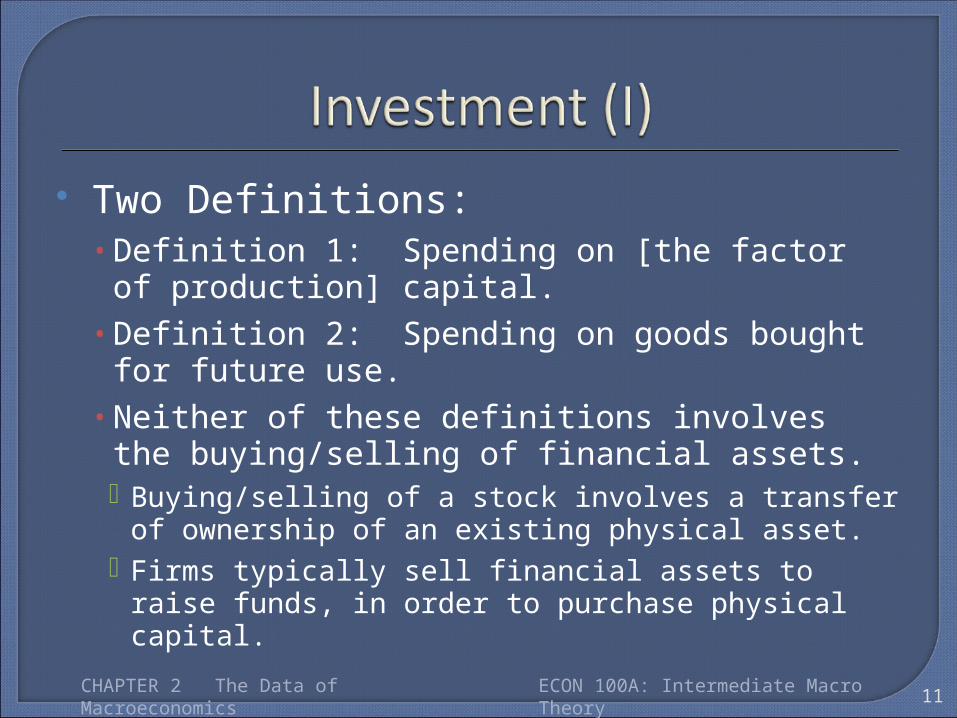
Two Definitions:• Definition 1: Spending on [the factor of production]
capital.• Definition 2: Spending on goods bought for future use.• Neither of these definitions involves the buying/selling
of financial assets. Buying/selling of a stock involves a transfer of ownership of
an existing physical asset. Firms typically sell financial assets to raise funds, in order to
purchase physical capital.
11CHAPTER 2 The Data of Macroeconomics ECON 100A: Intermediate Macro Theory
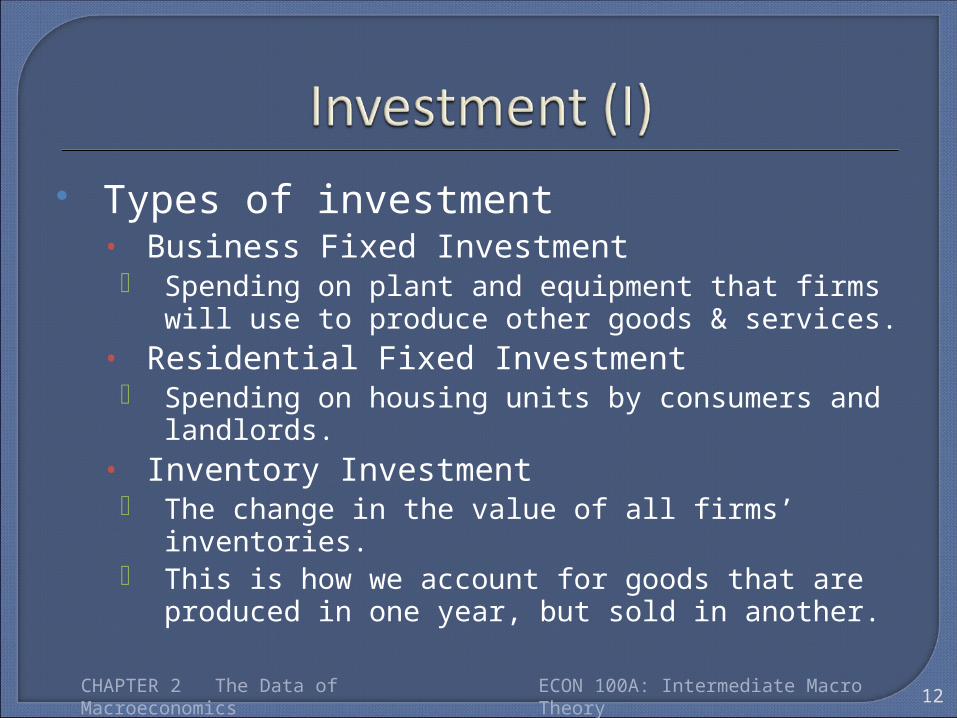
Types of investment• Business Fixed Investment Spending on plant and equipment that firms will use to
produce other goods & services.• Residential Fixed Investment Spending on housing units by consumers and landlords.
• Inventory Investment The change in the value of all firms’ inventories. This is how we account for goods that are produced in one
year, but sold in another.
12CHAPTER 2 The Data of Macroeconomics ECON 100A: Intermediate Macro Theory
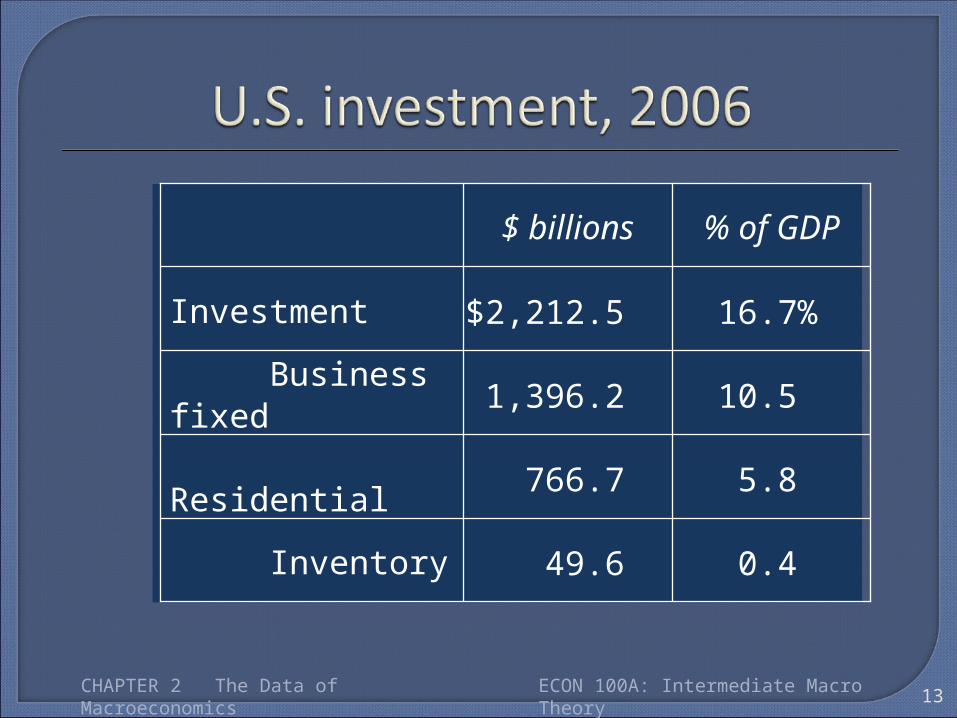
0.4
5.8
10.5
16.7%
49.6
766.7
1,396.2
$2,212.5
Inventory
Residential
Business fixed
Investment
% of GDP$ billions
13CHAPTER 2 The Data of Macroeconomics ECON 100A: Intermediate Macro Theory
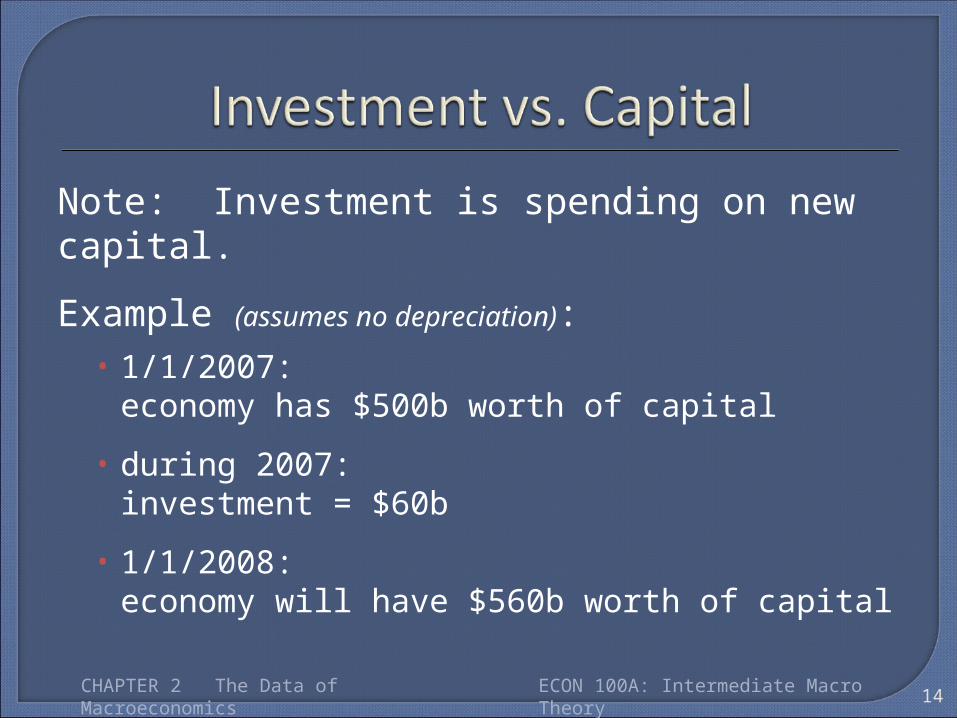
Note: Investment is spending on new capital.
Example (assumes no depreciation): • 1/1/2007:
economy has $500b worth of capital
• during 2007:investment = $60b
• 1/1/2008: economy will have $560b worth of capital
14CHAPTER 2 The Data of Macroeconomics ECON 100A: Intermediate Macro Theory
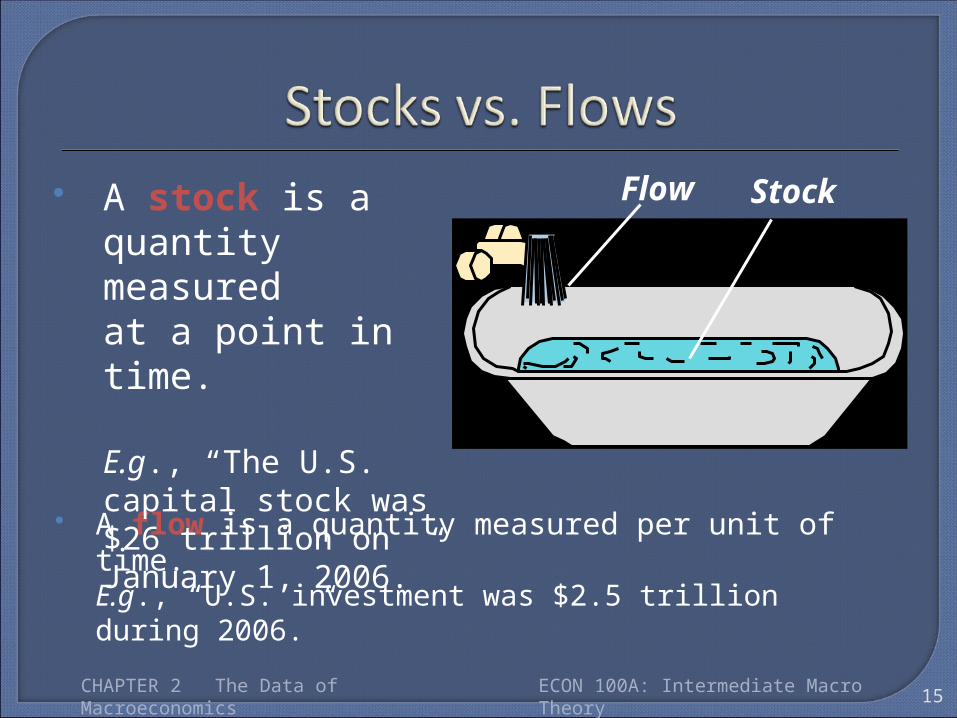
A flow is a quantity measured per unit of time. E.g., “U.S. investment was $2.5 trillion during 2006.”
15
Flow Stock
CHAPTER 2 The Data of Macroeconomics ECON 100A: Intermediate Macro Theory
A stock is a quantity measured at a point in time.
E.g., “The U.S. capital stock was $26 trillion on January 1, 2006.”
16
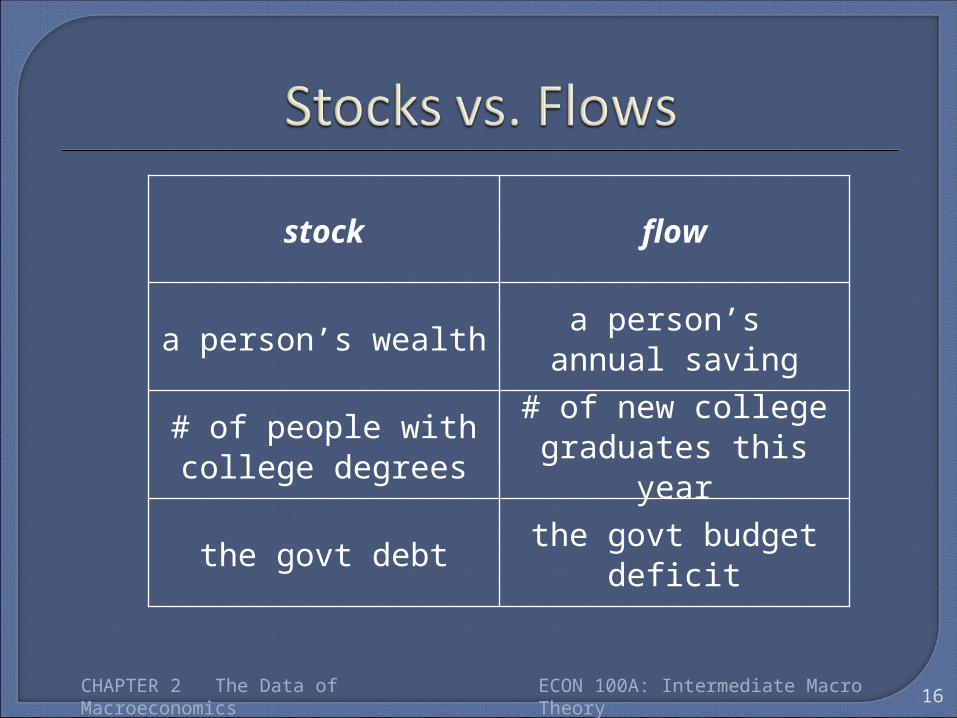
the govt budget deficitthe govt debt
# of new college graduates this year
# of people with college degrees
a person’s annual savinga person’s wealth
flowstock
CHAPTER 2 The Data of Macroeconomics ECON 100A: Intermediate Macro Theory
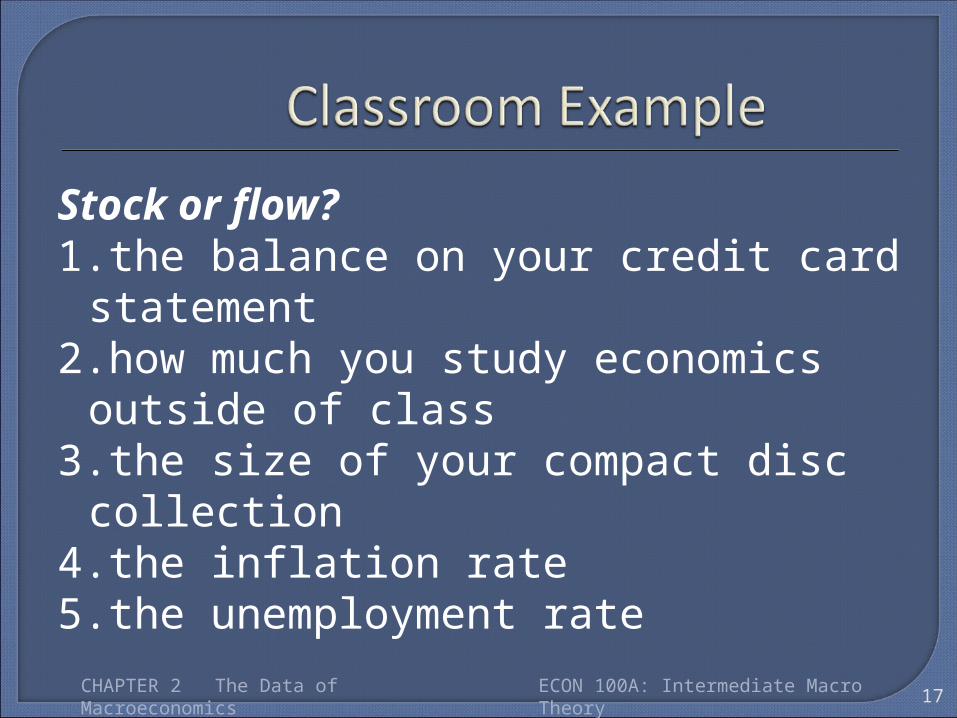
Stock or flow?1.the balance on your credit card statement2.how much you study economics outside of
class3.the size of your compact disc collection4.the inflation rate5.the unemployment rate
17CHAPTER 2 The Data of Macroeconomics ECON 100A: Intermediate Macro Theory
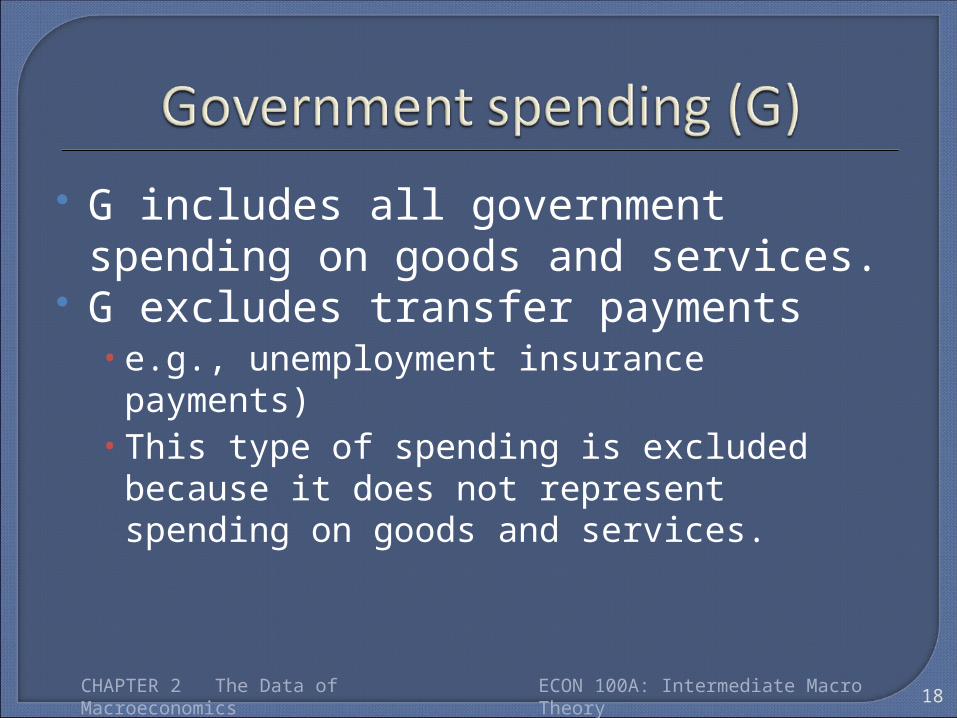
G includes all government spending on goods and services.
G excludes transfer payments • e.g., unemployment insurance payments)• This type of spending is excluded because it does not
represent spending on goods and services.
18CHAPTER 2 The Data of Macroeconomics ECON 100A: Intermediate Macro Theory
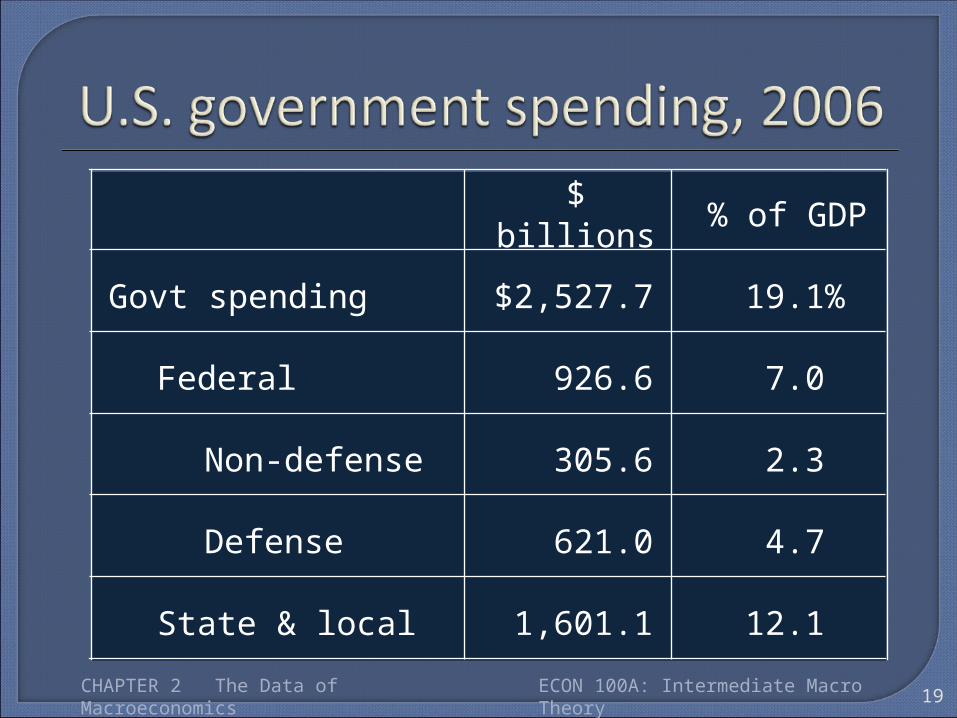
Federal
19.1%$2,527.7Govt spending
State & local
Defense
7.0
12.1
4.7
2.3
926.6
1,601.1
621.0
305.6Non-defense
% of GDP$ billions
19CHAPTER 2 The Data of Macroeconomics ECON 100A: Intermediate Macro Theory
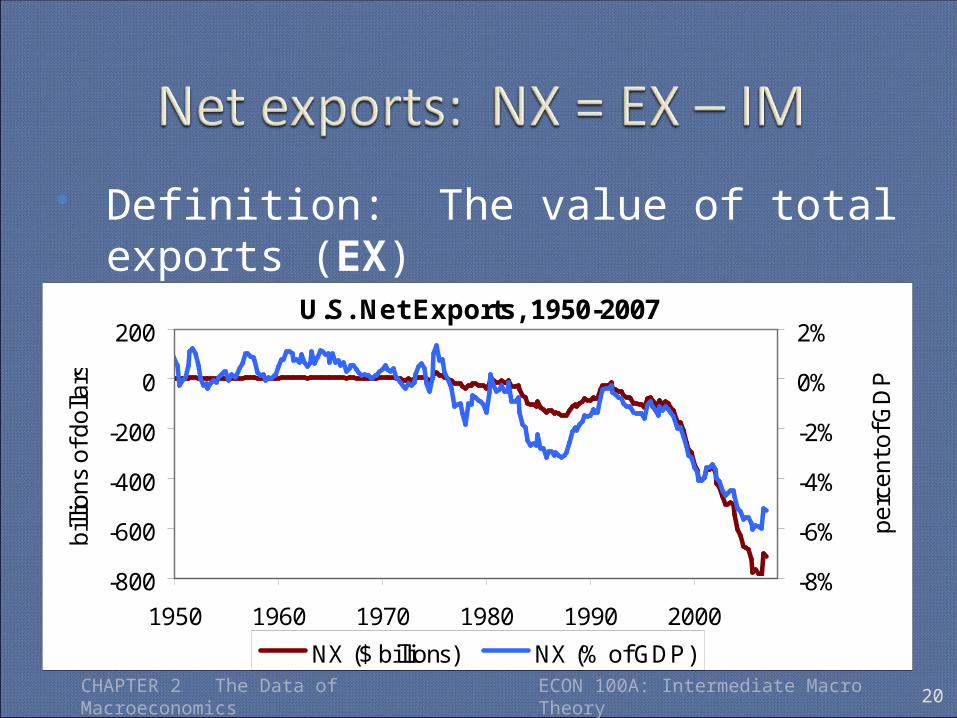
Definition: The value of total exports (EX) minus the value of total imports (IM).
CHAPTER 2 The Data of Macroeconomics ECON 100A: Intermediate Macro Theory 20
U.S. Net Exports, 1950-2007
-800
-600
-400
-200
0
200
1950 1960 1970 1980 1990 2000
billi
ons
of d
olla
rs
-8%
-6%
-4%
-2%
0%
2%
perc
ent o
f GD
P
NX ($ billions) NX (% of GDP)
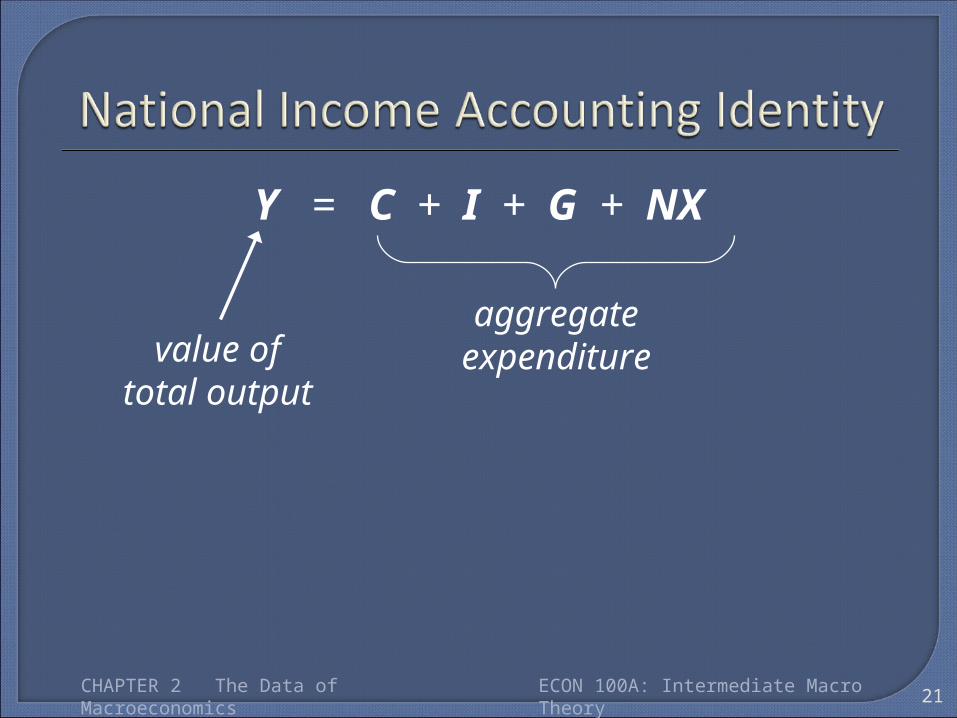
Y = C + I + G + NX
21
aggregate expenditurevalue of
total output
CHAPTER 2 The Data of Macroeconomics ECON 100A: Intermediate Macro Theory
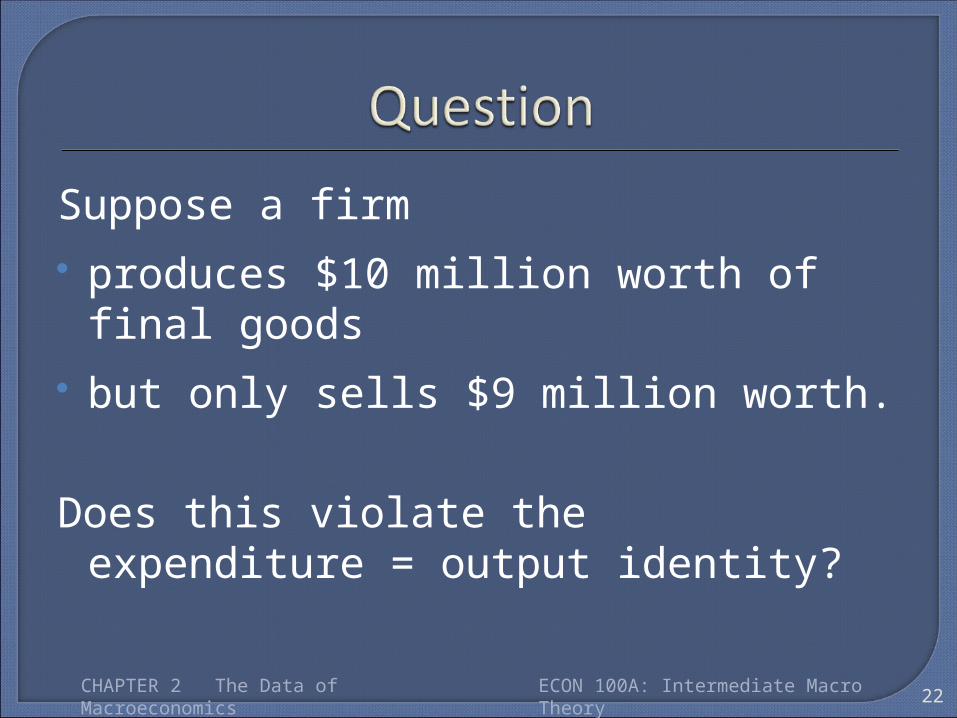
Suppose a firm produces $10 million worth of final goods but only sells $9 million worth.
Does this violate the expenditure = output identity?
22CHAPTER 2 The Data of Macroeconomics ECON 100A: Intermediate Macro Theory
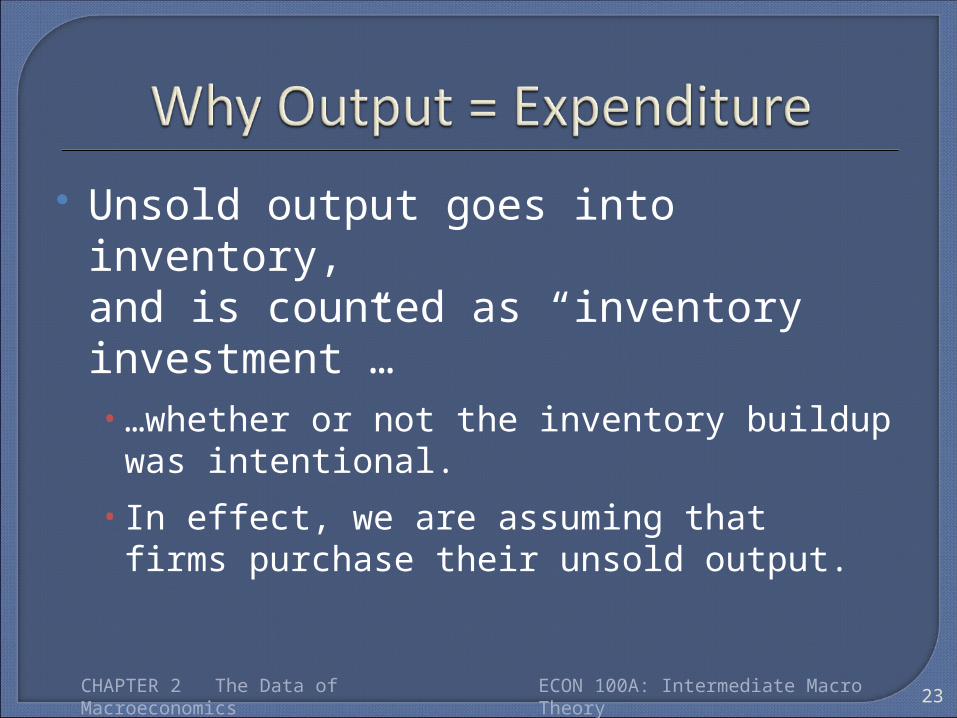
Unsold output goes into inventory, and is counted as “inventory investment”…• …whether or not the inventory buildup was
intentional. • In effect, we are assuming that
firms purchase their unsold output.
23CHAPTER 2 The Data of Macroeconomics ECON 100A: Intermediate Macro Theory
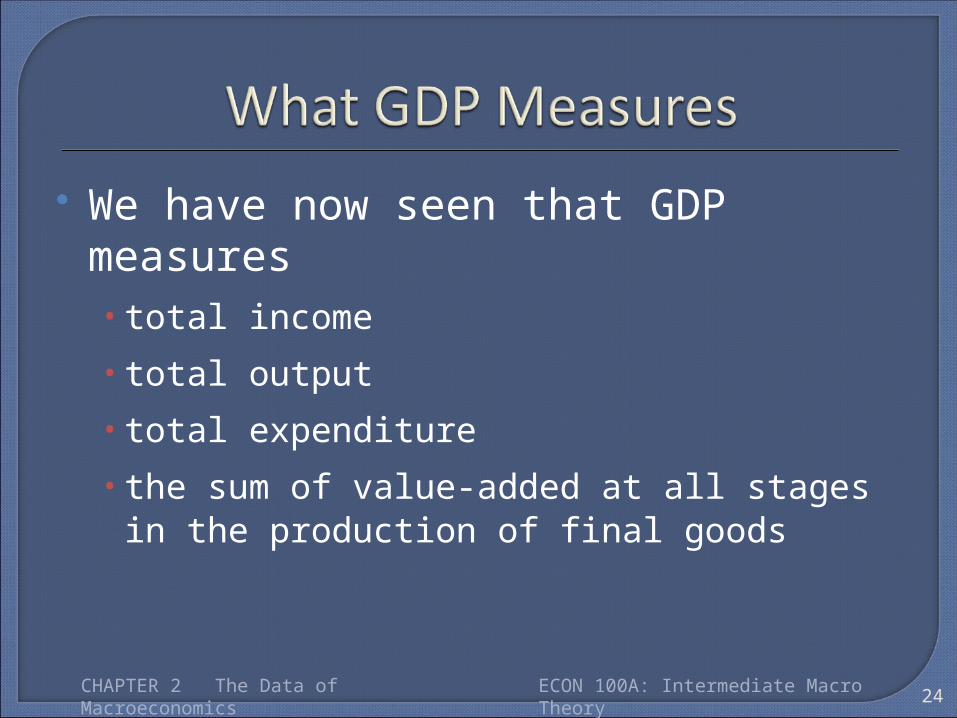
We have now seen that GDP measures• total income• total output• total expenditure• the sum of value-added at all stages
in the production of final goods
24CHAPTER 2 The Data of Macroeconomics ECON 100A: Intermediate Macro Theory
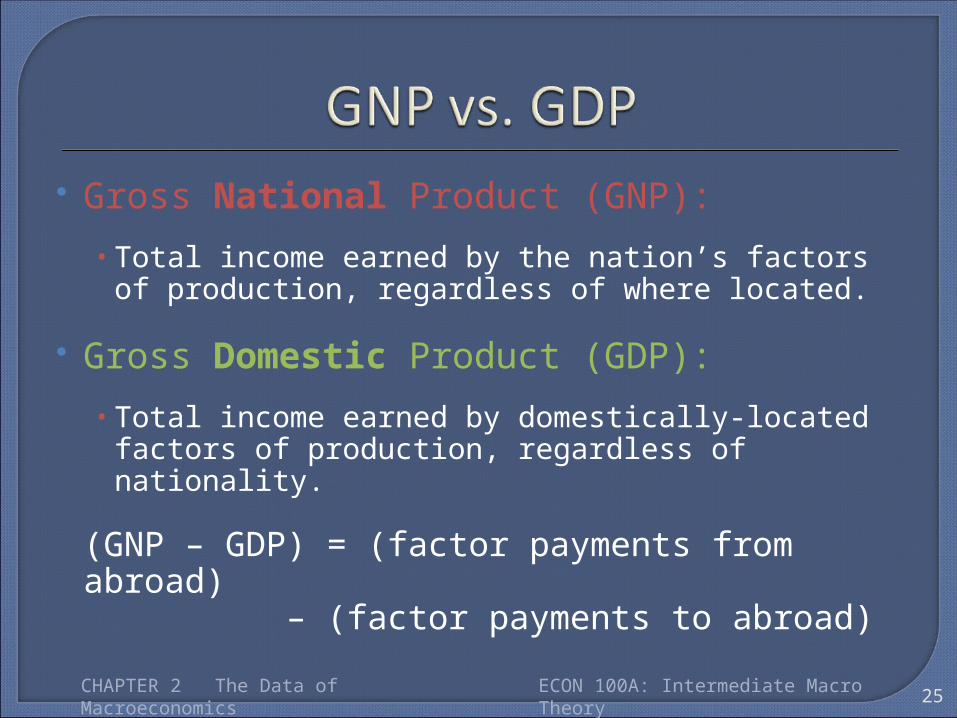
Gross National Product (GNP): • Total income earned by the nation’s factors of
production, regardless of where located.
Gross Domestic Product (GDP):• Total income earned by domestically-located factors of
production, regardless of nationality.
(GNP – GDP) = (factor payments from abroad) – (factor payments to abroad)
25CHAPTER 2 The Data of Macroeconomics ECON 100A: Intermediate Macro Theory

In your country, which would you want
to be bigger, GDP, or GNP?
Why?
26CHAPTER 2 The Data of Macroeconomics ECON 100A: Intermediate Macro Theory
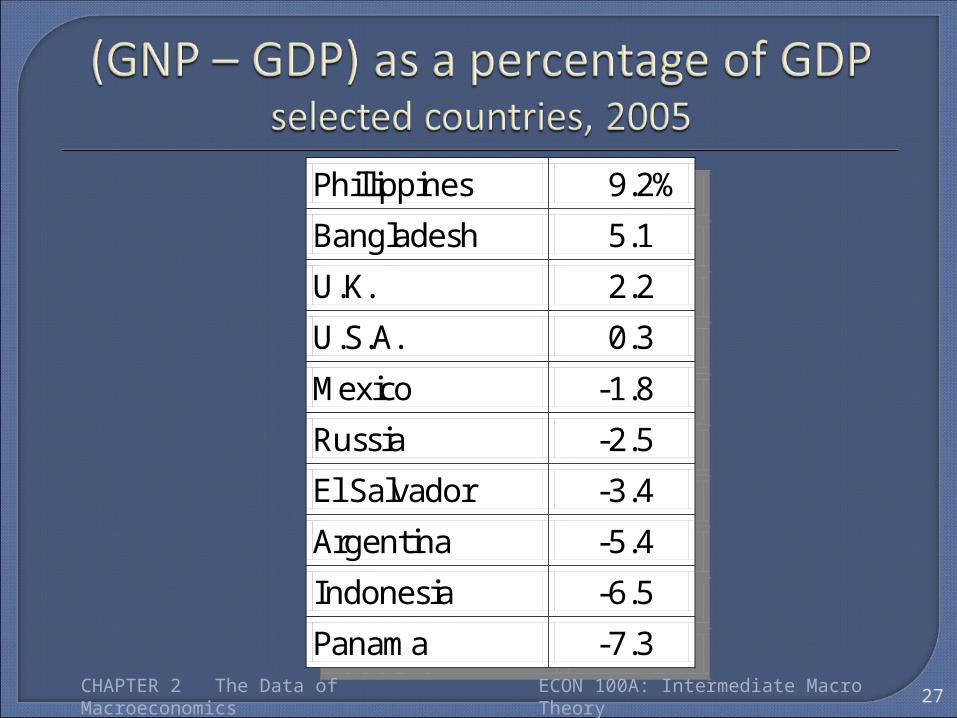
27
Phillippines 9.2% Bangladesh 5.1 U.K. 2.2 U.S.A. 0.3 Mexico -1.8 Russia -2.5 El Salvador -3.4 Argentina -5.4 Indonesia -6.5 Panama -7.3
CHAPTER 2 The Data of Macroeconomics ECON 100A: Intermediate Macro Theory
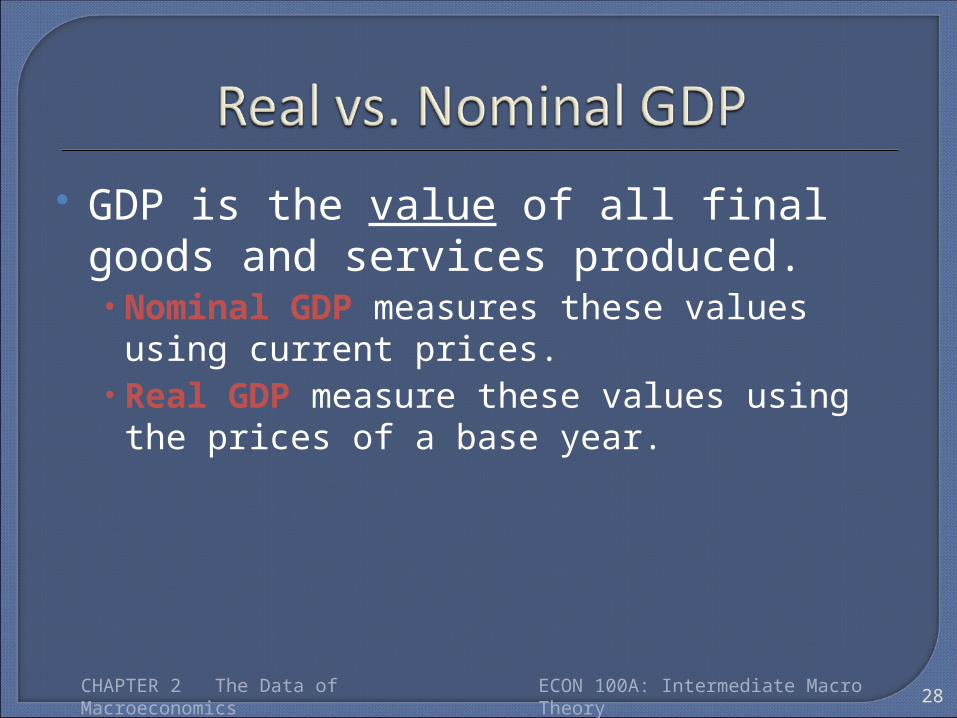
GDP is the value of all final goods and services produced. • Nominal GDP measures these values using current
prices. • Real GDP measure these values using the prices of a
base year.
28CHAPTER 2 The Data of Macroeconomics ECON 100A: Intermediate Macro Theory
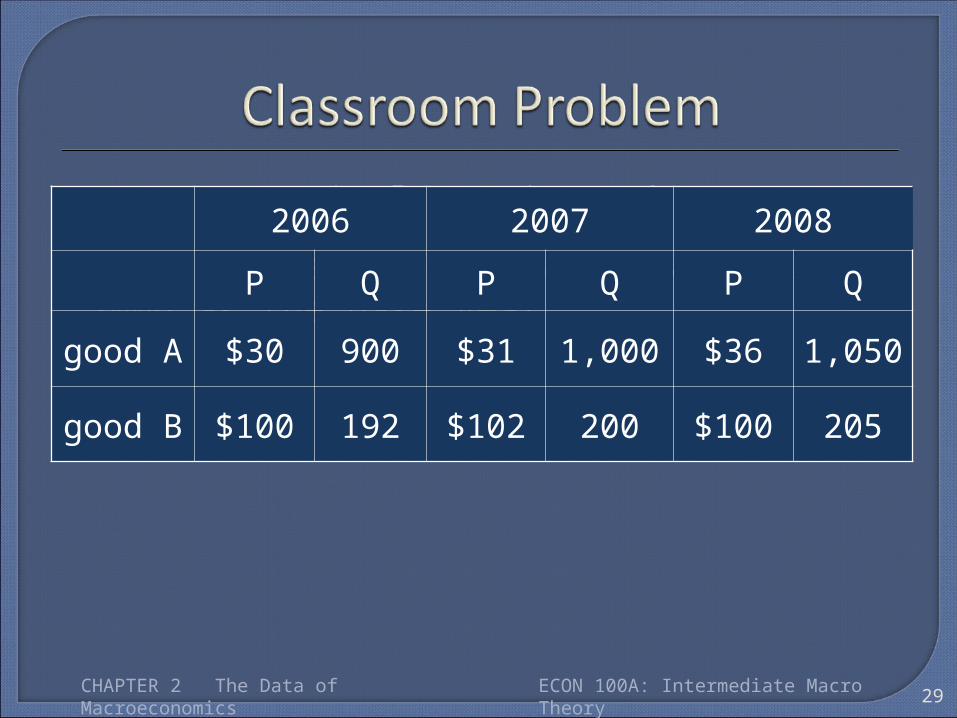
Compute nominal GDP in each year.
Compute real GDP in each year using 2006 as the base year.
29
2006 2007 2008
P Q P Q P Q
good A $30 900 $31 1,000 $36 1,050
good B $100 192 $102 200 $100 205
CHAPTER 2 The Data of Macroeconomics ECON 100A: Intermediate Macro Theory
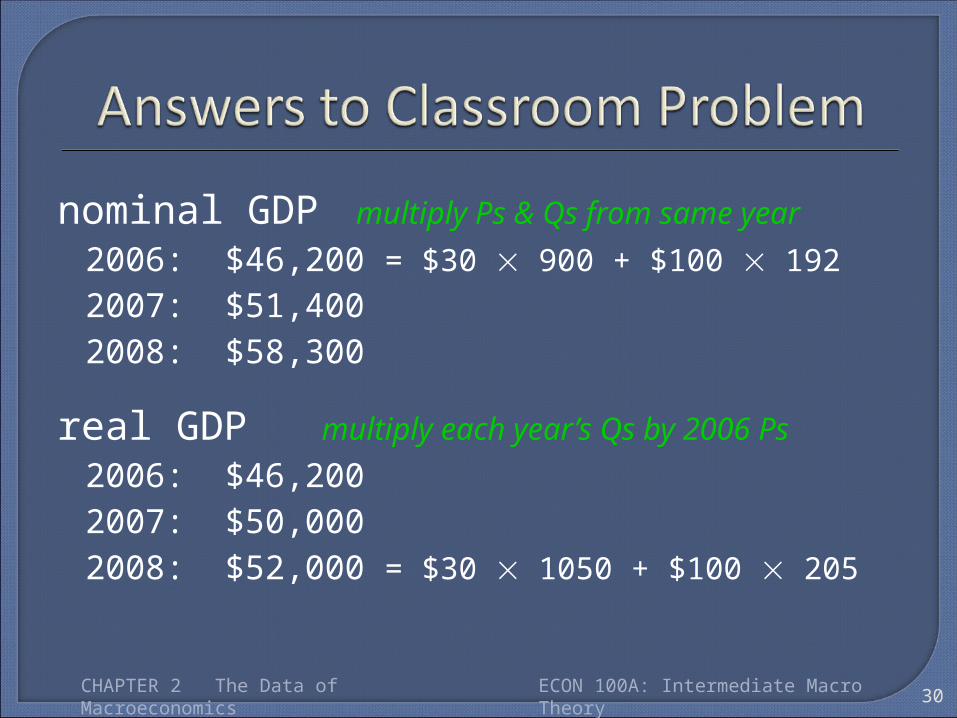
nominal GDP multiply Ps & Qs from same year2006: $46,200 = $30 900 + $100 192 2007: $51,400 2008: $58,300
real GDP multiply each year’s Qs by 2006 Ps2006: $46,2002007: $50,000 2008: $52,000 = $30 1050 + $100 205
30CHAPTER 2 The Data of Macroeconomics ECON 100A: Intermediate Macro Theory
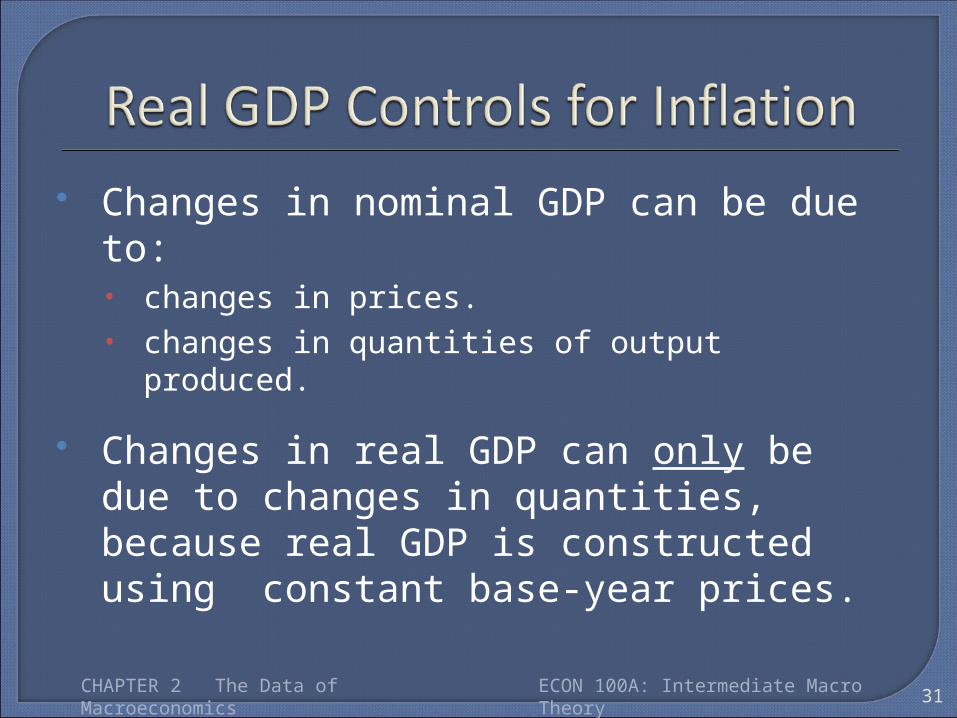
Changes in nominal GDP can be due to:• changes in prices. • changes in quantities of output produced.
Changes in real GDP can only be due to changes in quantities, because real GDP is constructed using constant base-year prices.
31CHAPTER 2 The Data of Macroeconomics ECON 100A: Intermediate Macro Theory
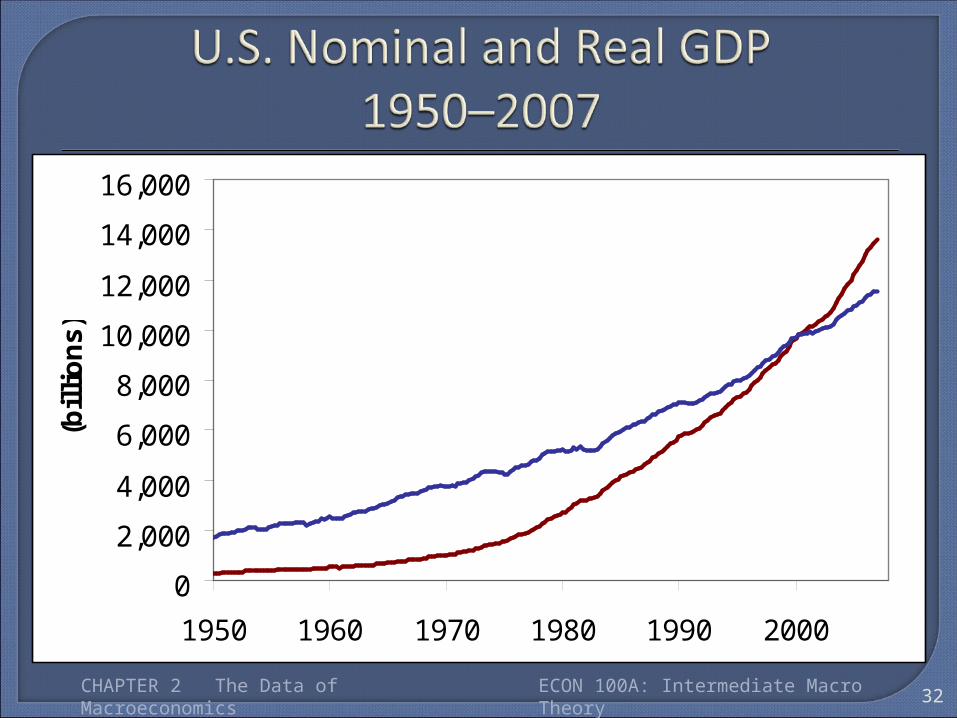
32
0
2,000
4,000
6,000
8,000
10,000
12,000
14,000
16,000
1950 1960 1970 1980 1990 2000
(bill
ions
)
Nominal GDP
Real GDP(in 2000 dollars)
CHAPTER 2 The Data of Macroeconomics ECON 100A: Intermediate Macro Theory
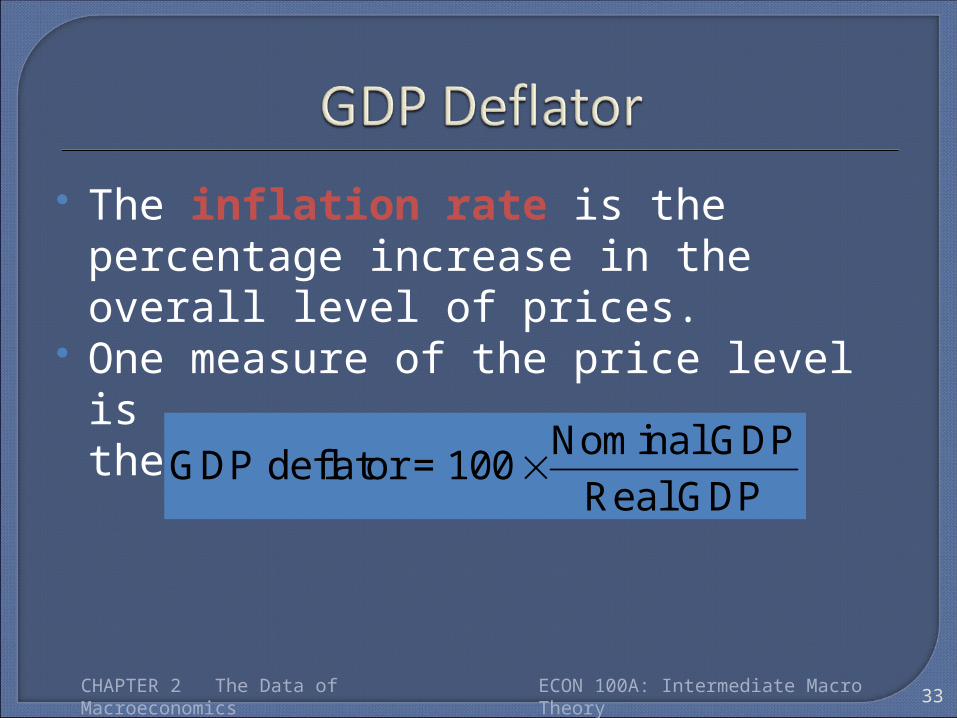
The inflation rate is the percentage increase in the overall level of prices.
One measure of the price level is the GDP deflator, defined as
33
Nominal GDPGDP deflator = 100
Real GDP
CHAPTER 2 The Data of Macroeconomics ECON 100A: Intermediate Macro Theory
Use your previous answers to compute the GDP deflator in each year.
Use GDP deflator to compute the inflation rate from 2006 to 2007, and from 2007 to 2008.
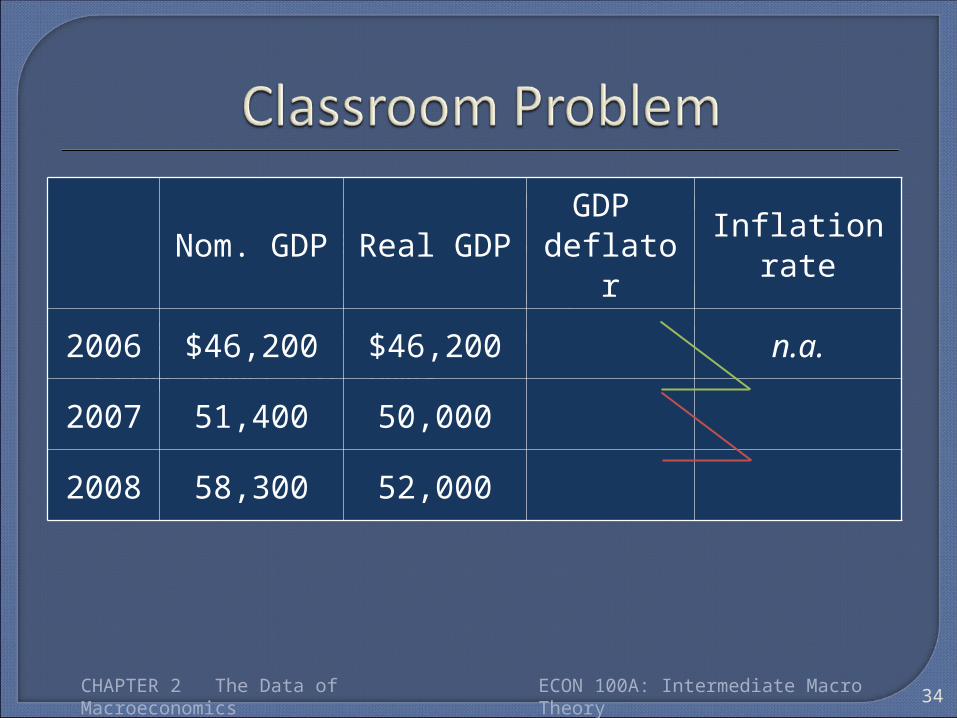
34
Nom. GDP Real GDP GDP deflator
Inflationrate
2006 $46,200 $46,200 n.a.
2007 51,400 50,000
2008 58,300 52,000
CHAPTER 2 The Data of Macroeconomics ECON 100A: Intermediate Macro Theory
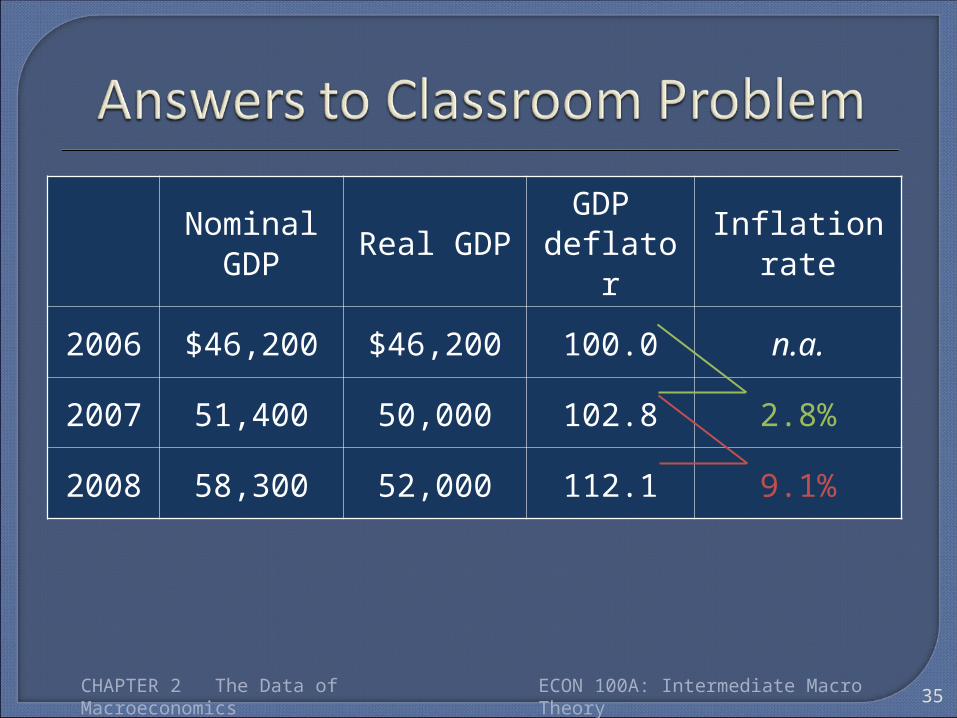
35
Nominal GDP Real GDP GDP
deflatorInflation
rate
2006 $46,200 $46,200 100.0 n.a.
2007 51,400 50,000 102.8 2.8%
2008 58,300 52,000 112.1 9.1%
CHAPTER 2 The Data of Macroeconomics ECON 100A: Intermediate Macro Theory
36
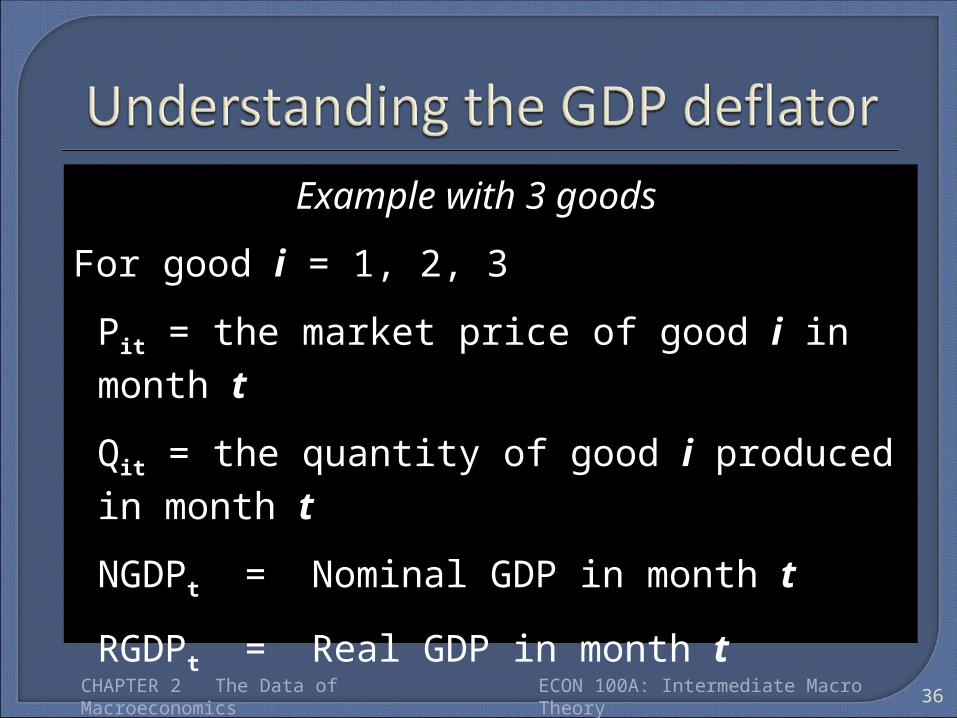
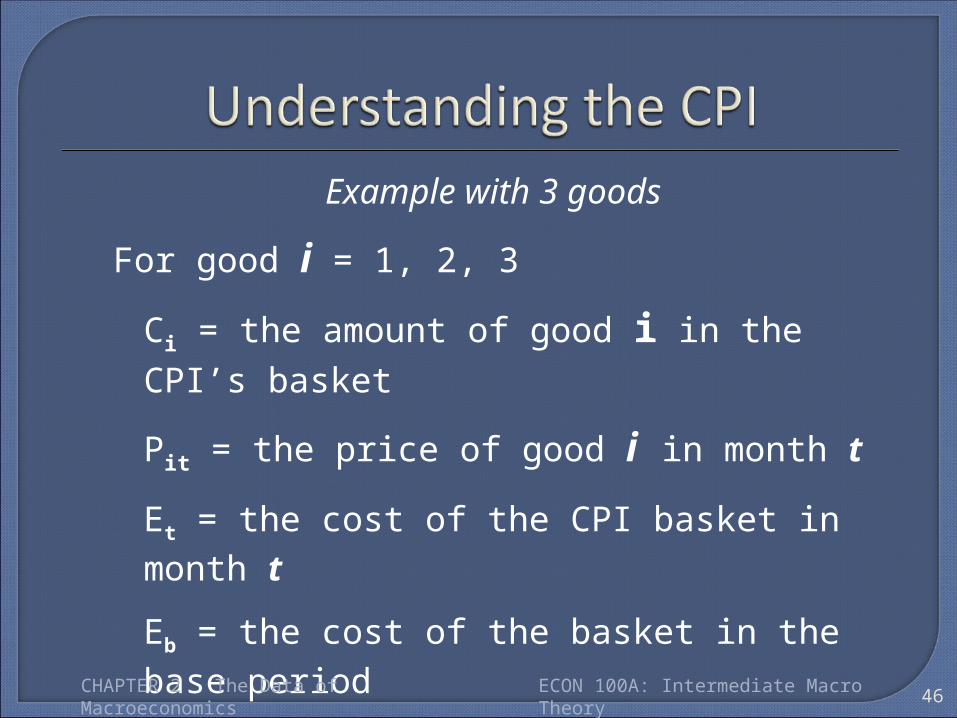
Example with 3 goods
For good i = 1, 2, 3
Pit = the market price of good i in month t
Qit = the quantity of good i produced in month t
NGDPt = Nominal GDP in month t
RGDPt = Real GDP in month t
CHAPTER 2 The Data of Macroeconomics ECON 100A: Intermediate Macro Theory
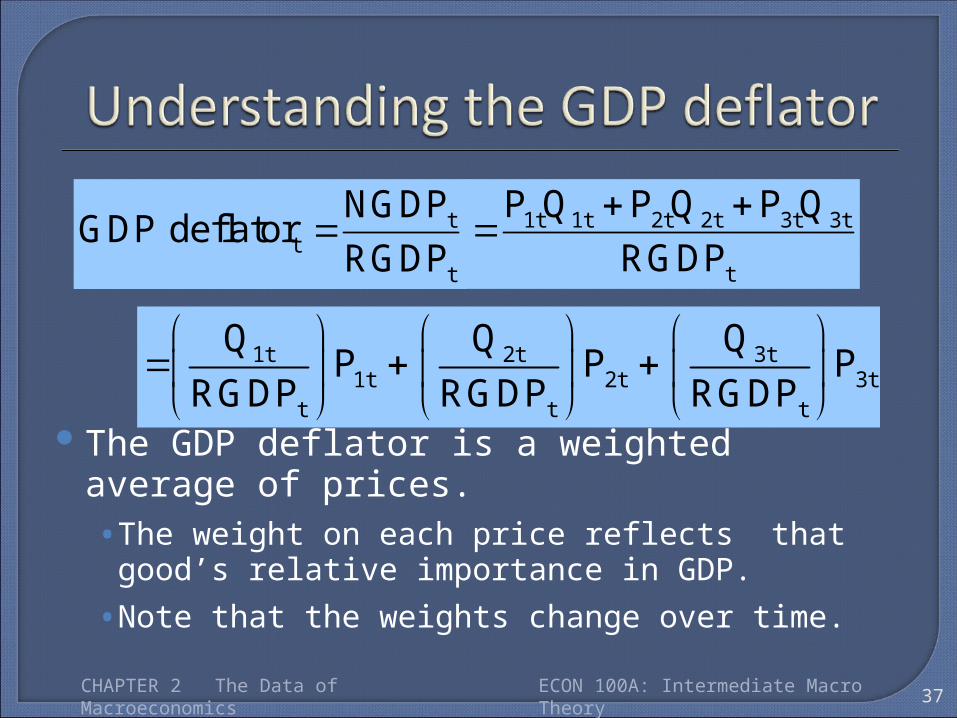
The GDP deflator is a weighted average of prices. •The weight on each price reflects that good’s relative
importance in GDP. •Note that the weights change over time.
37
tt
t
NGDPGDP deflator
RGDP
1t 1t 2t 2t 3t 3t
t
P Q P Q P QRGDP
1t 2t 3t1t 2t 3t
t t t
Q Q QP P P
RGDP RGDP RGDP
CHAPTER 2 The Data of Macroeconomics ECON 100A: Intermediate Macro Theory
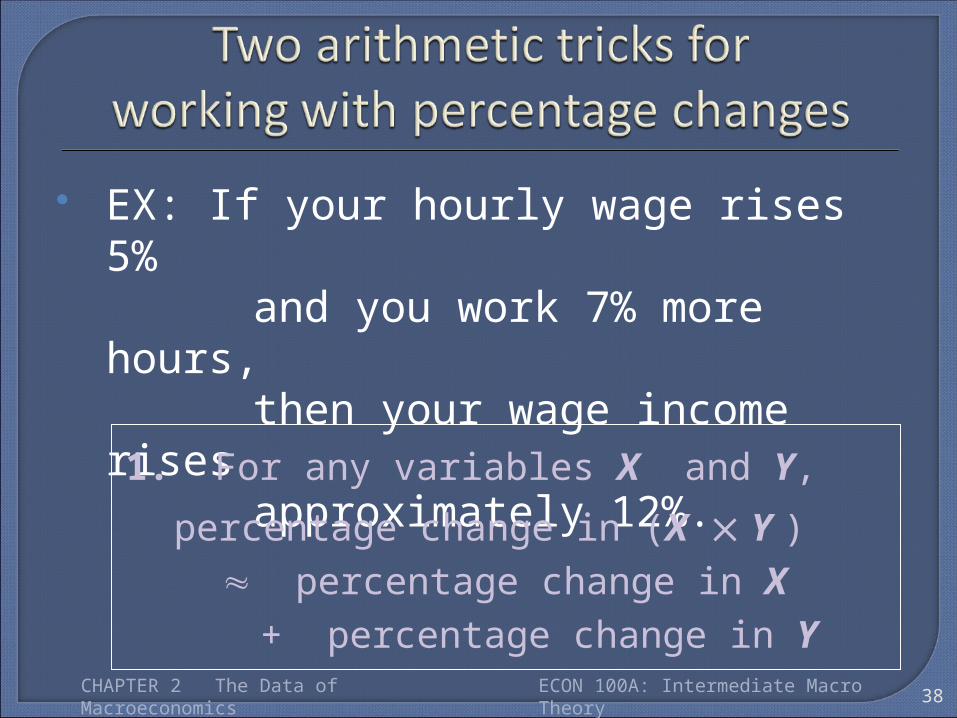
EX: If your hourly wage rises 5% and you work 7% more hours, then your wage income rises approximately 12%.
38
1. For any variables X and Y,
percentage change in (X Y ) percentage change in X + percentage change in Y
CHAPTER 2 The Data of Macroeconomics ECON 100A: Intermediate Macro Theory
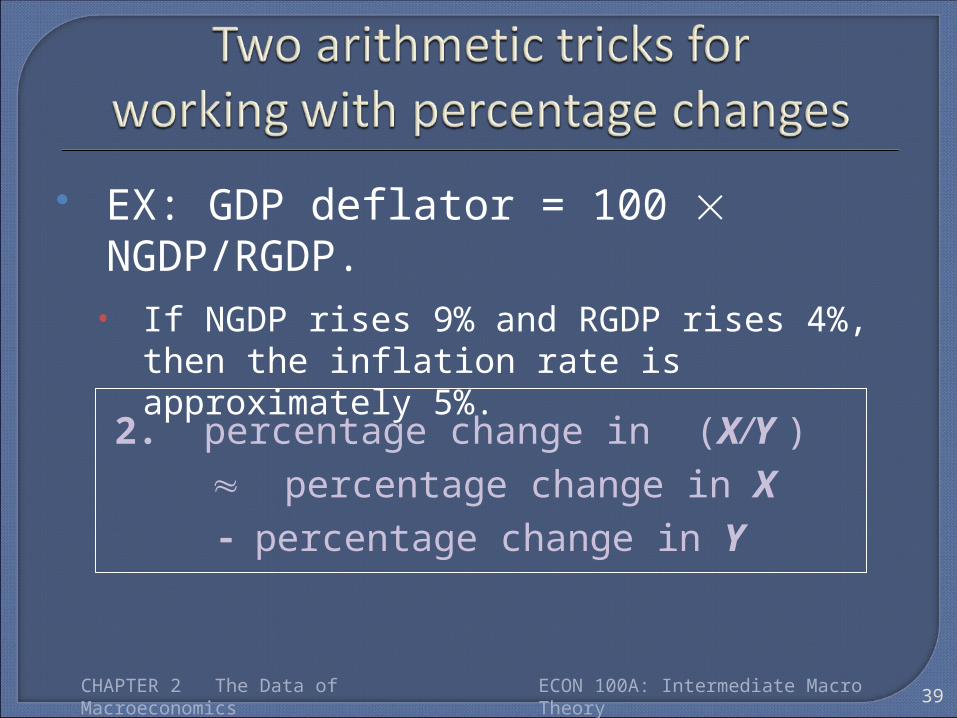
EX: GDP deflator = 100 NGDP/RGDP.• If NGDP rises 9% and RGDP rises 4%,
then the inflation rate is approximately 5%.
39
2. percentage change in (X/Y ) percentage change in X percentage change in Y
CHAPTER 2 The Data of Macroeconomics ECON 100A: Intermediate Macro Theory
Over time, relative prices change, so the base year should be updated periodically.• In essence, chain-weighted real GDP
updates the base year every year, so it is more accurate than constant-price GDP.
Your textbook usually uses constant-price real GDP, because: • the two measures are highly correlated.• constant-price real GDP is easier to compute.
40CHAPTER 2 The Data of Macroeconomics ECON 100A: Intermediate Macro Theory
A measure of the overall level of prices Published by the Bureau of Labor Statistics
(BLS) Uses:
• tracks changes in the typical household’s cost of living
• adjusts many contracts for inflation (“COLAs”)• allows comparisons of dollar amounts over time
41CHAPTER 2 The Data of Macroeconomics ECON 100A: Intermediate Macro Theory
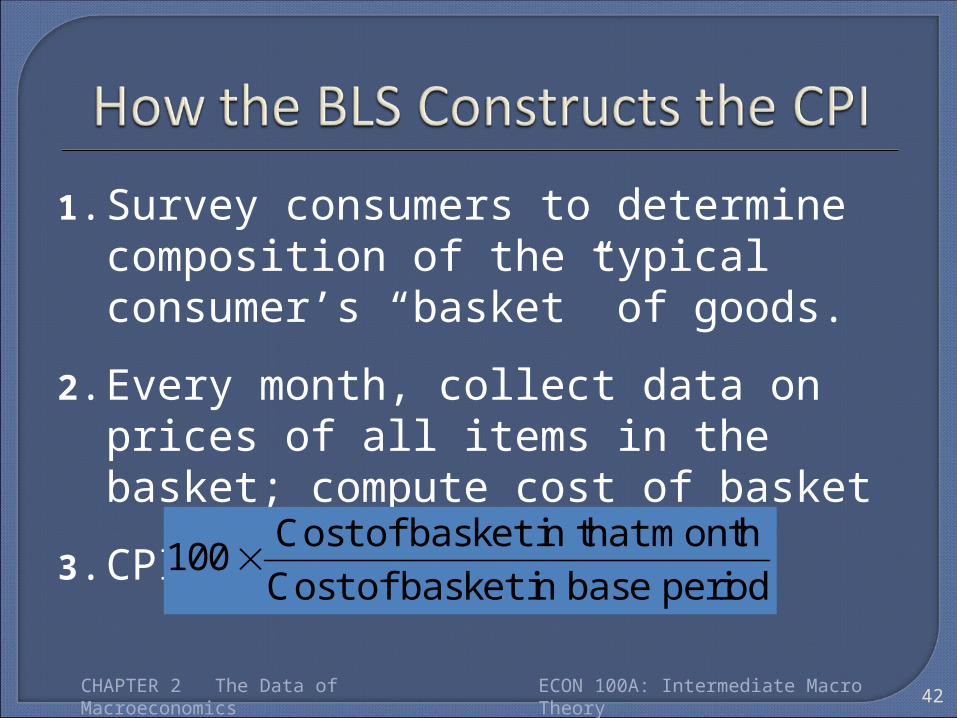
1. Survey consumers to determine composition of the typical consumer’s “basket” of goods.
2. Every month, collect data on prices of all items in the basket; compute cost of basket
3. CPI in any month equals
42
Cost of basket in that monthCost of basket in base period
100
CHAPTER 2 The Data of Macroeconomics ECON 100A: Intermediate Macro Theory
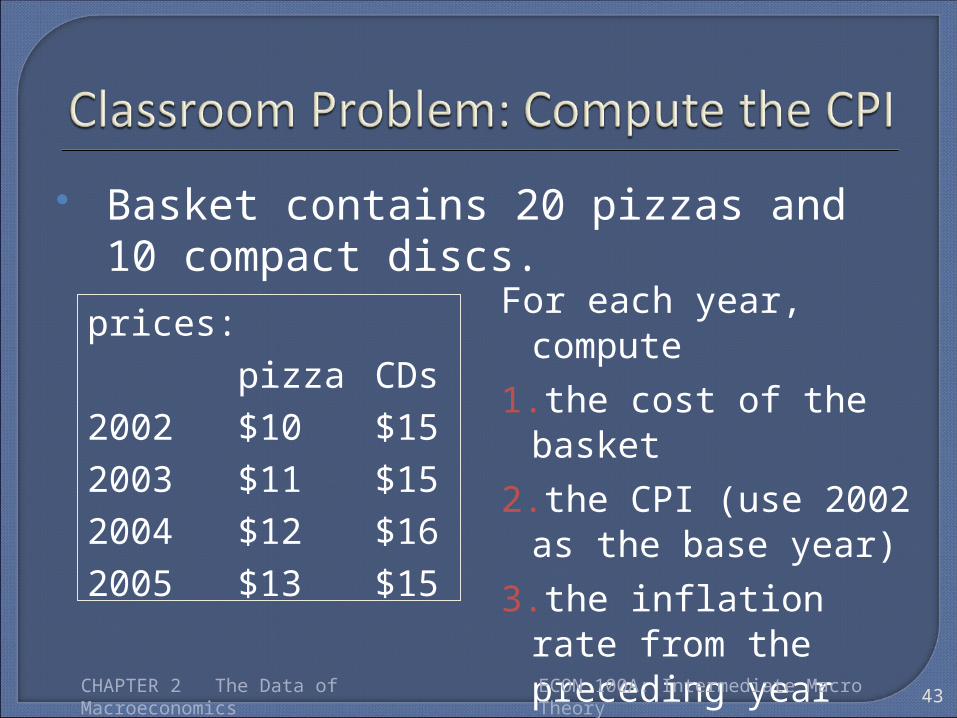
Basket contains 20 pizzas and 10 compact discs.
43
prices:pizza CDs
2002 $10 $152003 $11 $152004 $12 $162005 $13 $15
For each year, compute1.the cost of the basket2.the CPI (use 2002 as
the base year)3.the inflation rate from
the preceding year
CHAPTER 2 The Data of Macroeconomics ECON 100A: Intermediate Macro Theory
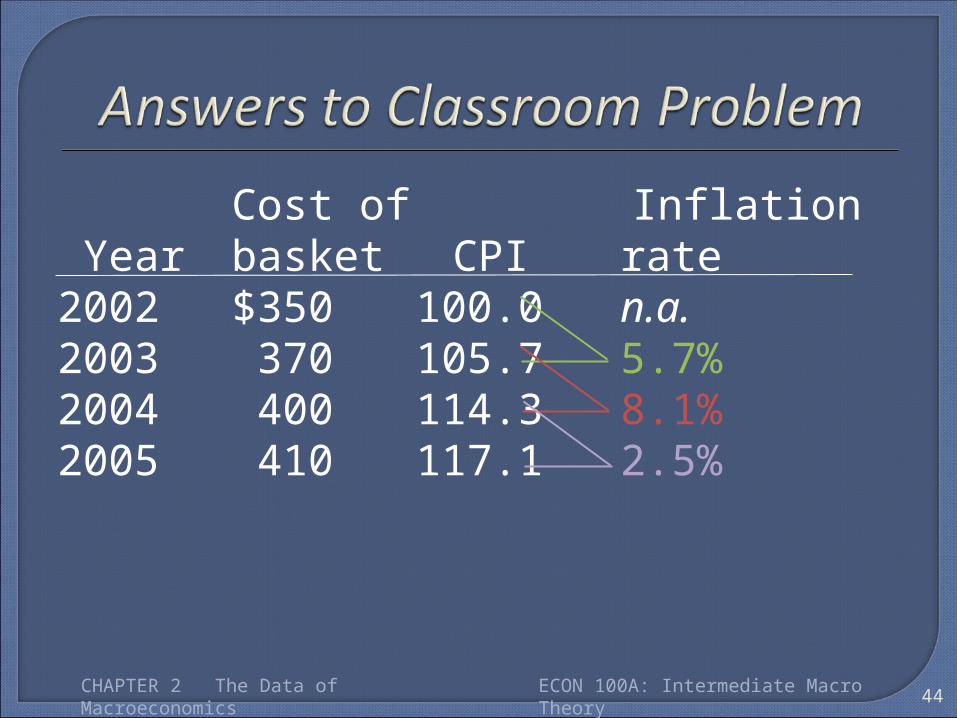
Cost of Inflation Year basket CPI rate2002 $350 100.0 n.a.2003 370 105.7 5.7%2004 400 114.3 8.1%2005 410 117.1 2.5%
44CHAPTER 2 The Data of Macroeconomics ECON 100A: Intermediate Macro Theory
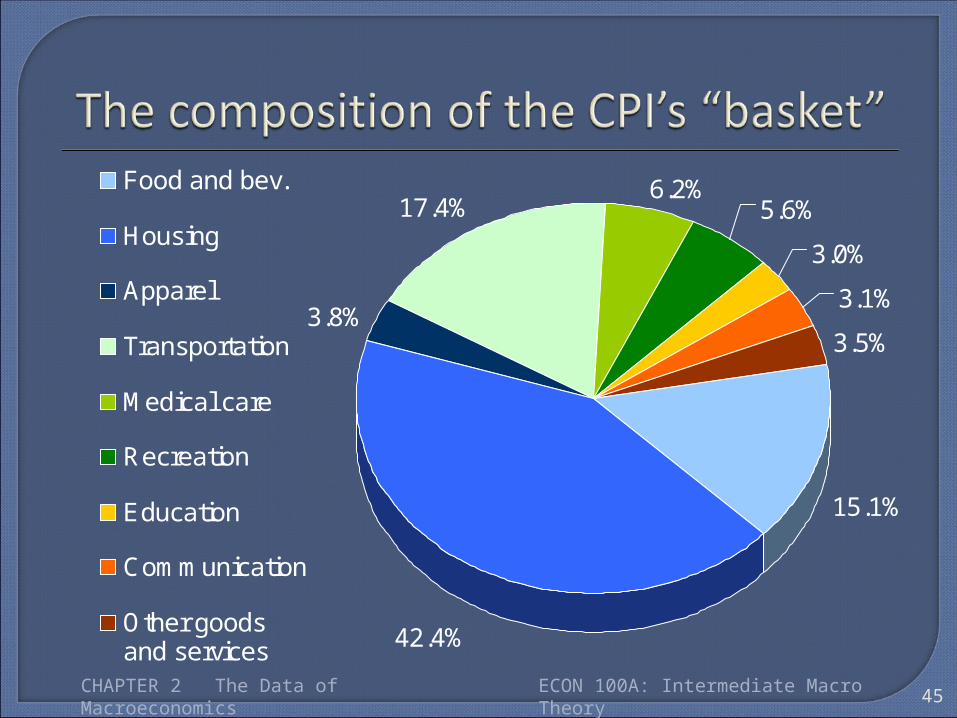
45
15.1%
42.4%
3.8%
17.4%6.2%
5.6%
3.0%
3.1%
3.5%
Food and bev.
Housing
Apparel
Transportation
Medical care
Recreation
Education
Communication
Other goodsand services
CHAPTER 2 The Data of Macroeconomics ECON 100A: Intermediate Macro Theory
46
Example with 3 goods
For good i = 1, 2, 3
Ci = the amount of good i in the CPI’s basket
Pit = the price of good i in month t
Et = the cost of the CPI basket in month t
Eb = the cost of the basket in the base period
CHAPTER 2 The Data of Macroeconomics ECON 100A: Intermediate Macro Theory
47
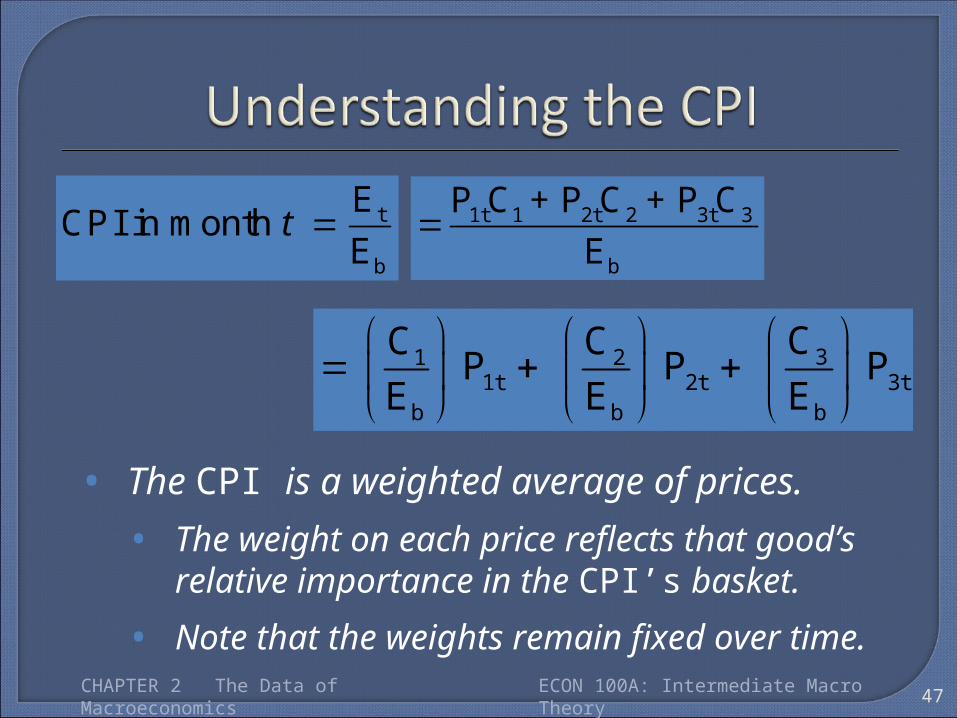
t
b
ECPI in month
Et 1t 1 2t 2 3t 3
b
P C + P C + P CE
31 21t 2t 3t
b b b
CC CP P P
E E E
• The CPI is a weighted average of prices. • The weight on each price reflects that good’s
relative importance in the CPI’s basket.
• Note that the weights remain fixed over time.CHAPTER 2 The Data of Macroeconomics ECON 100A: Intermediate Macro Theory
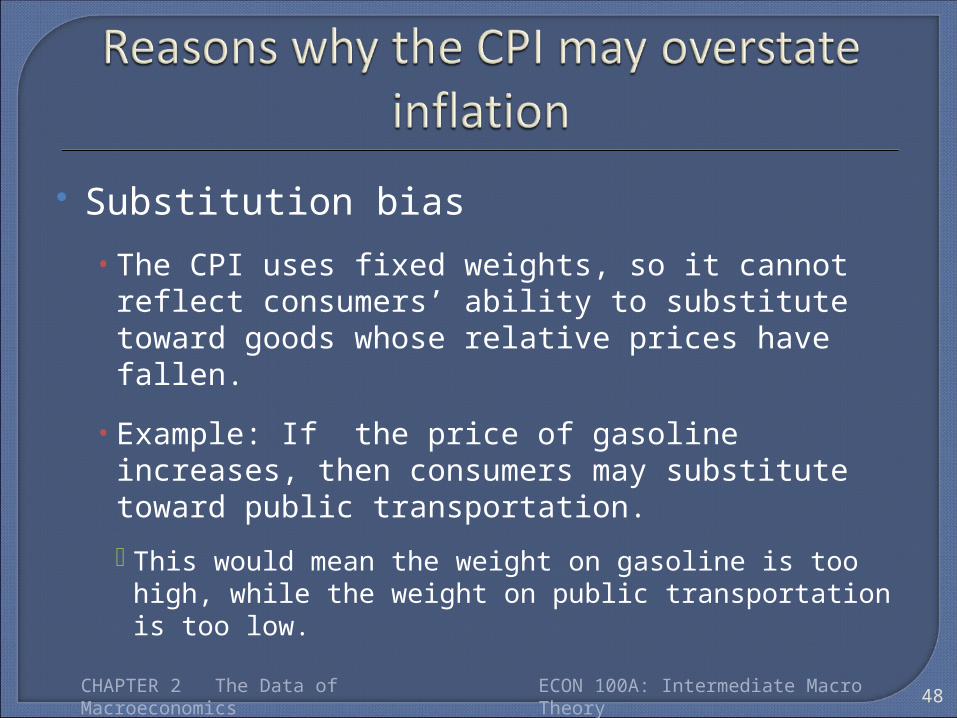
Substitution bias• The CPI uses fixed weights, so it cannot reflect
consumers’ ability to substitute toward goods whose relative prices have fallen.
• Example: If the price of gasoline increases, then consumers may substitute toward public transportation.
This would mean the weight on gasoline is too high, while the weight on public transportation is too low.
48CHAPTER 2 The Data of Macroeconomics ECON 100A: Intermediate Macro Theory
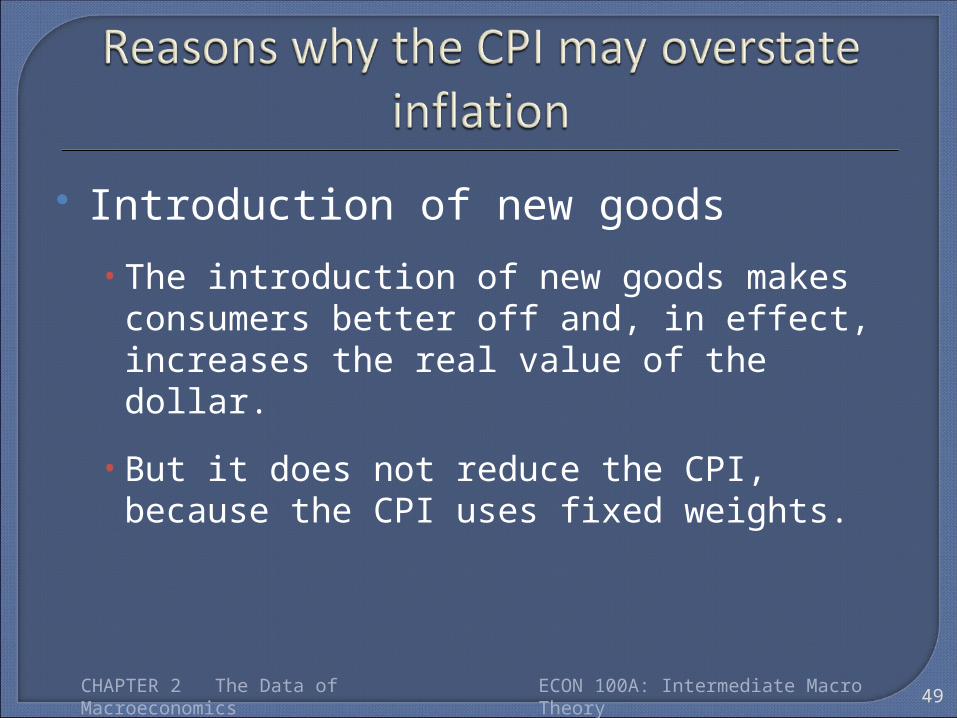
Introduction of new goods• The introduction of new goods makes consumers
better off and, in effect, increases the real value of the dollar.
• But it does not reduce the CPI, because the CPI uses fixed weights.
49CHAPTER 2 The Data of Macroeconomics ECON 100A: Intermediate Macro Theory
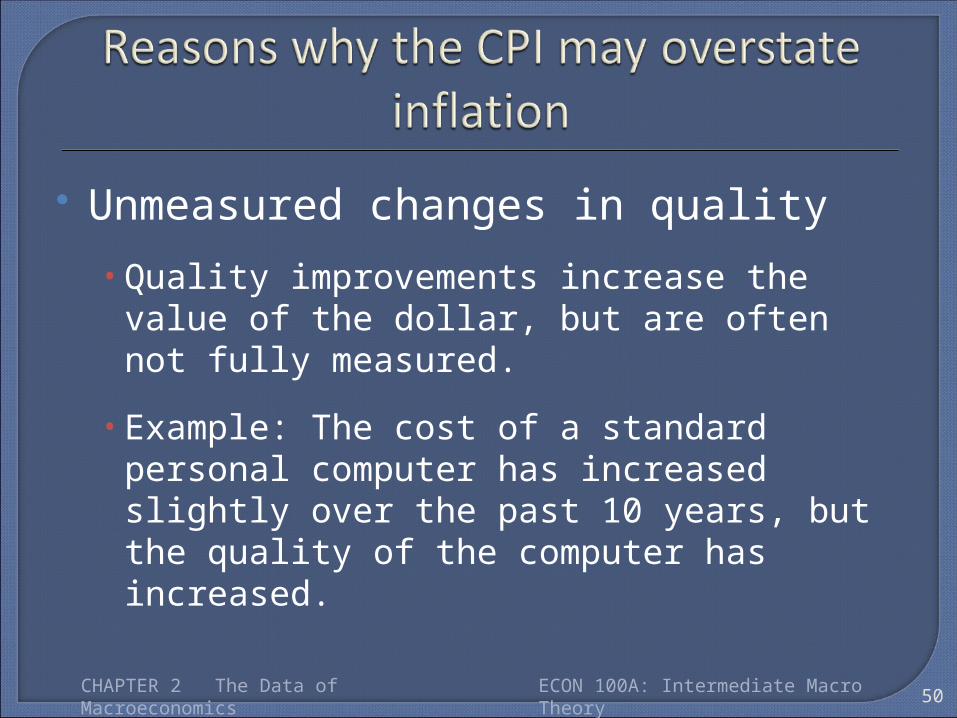
Unmeasured changes in quality• Quality improvements increase the value of the dollar,
but are often not fully measured.
• Example: The cost of a standard personal computer has increased slightly over the past 10 years, but the quality of the computer has increased.
50CHAPTER 2 The Data of Macroeconomics ECON 100A: Intermediate Macro Theory
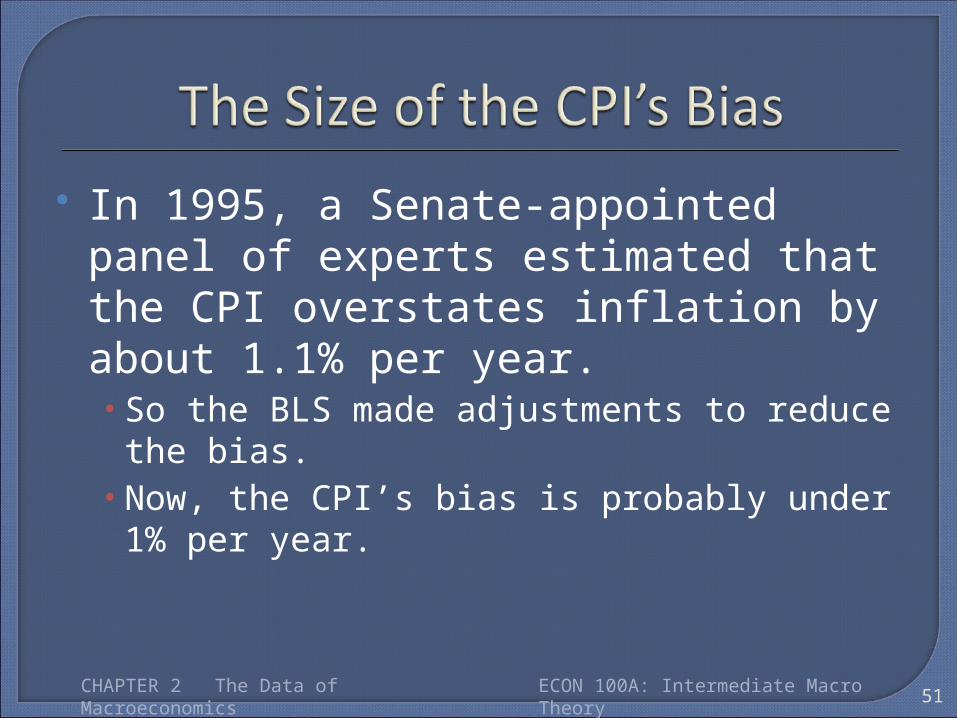
In 1995, a Senate-appointed panel of experts estimated that the CPI overstates inflation by about 1.1% per year.• So the BLS made adjustments to reduce the bias.• Now, the CPI’s bias is probably under 1% per year.
51CHAPTER 2 The Data of Macroeconomics ECON 100A: Intermediate Macro Theory
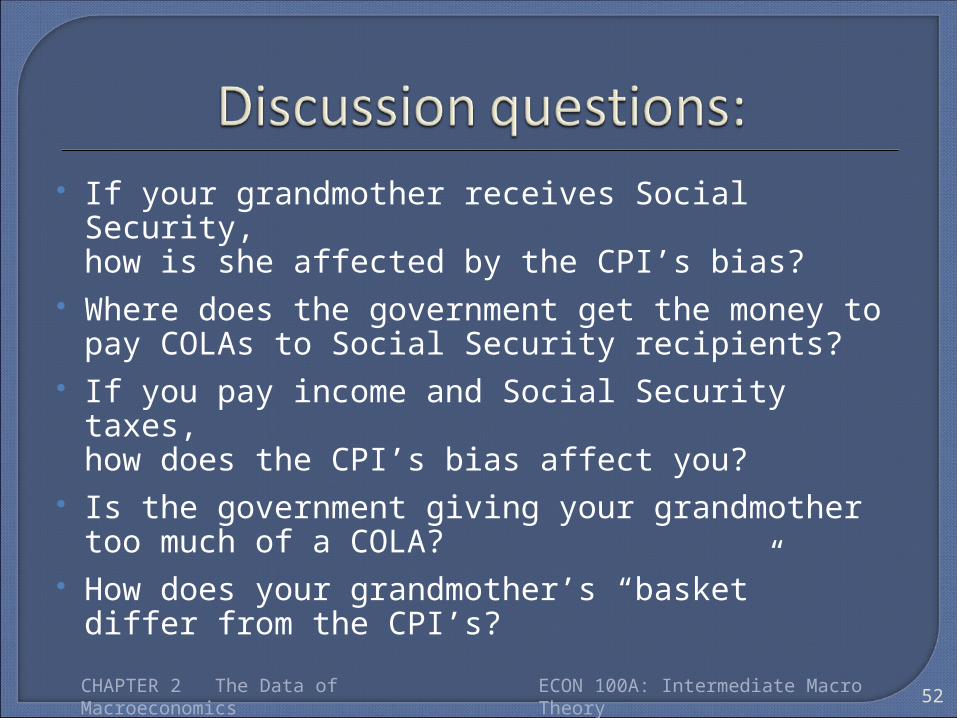
If your grandmother receives Social Security, how is she affected by the CPI’s bias?
Where does the government get the money to pay COLAs to Social Security recipients?
If you pay income and Social Security taxes, how does the CPI’s bias affect you?
Is the government giving your grandmother too much of a COLA?
How does your grandmother’s “basket” differ from the CPI’s?
52CHAPTER 2 The Data of Macroeconomics ECON 100A: Intermediate Macro Theory
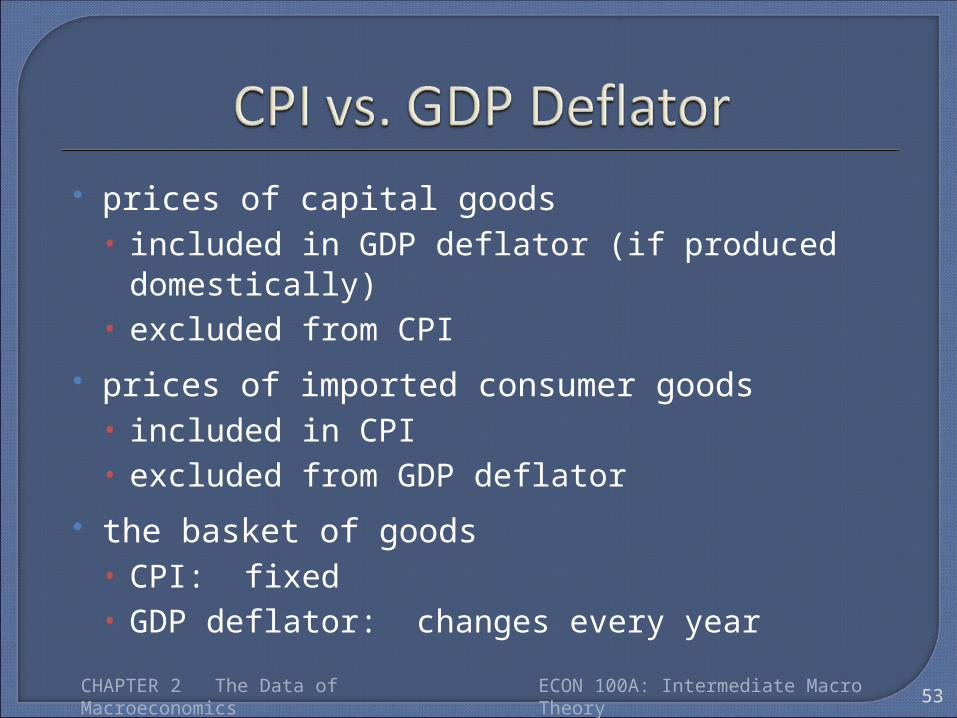
prices of capital goods• included in GDP deflator (if produced domestically)• excluded from CPI
prices of imported consumer goods• included in CPI• excluded from GDP deflator
the basket of goods• CPI: fixed• GDP deflator: changes every year
53CHAPTER 2 The Data of Macroeconomics ECON 100A: Intermediate Macro Theory
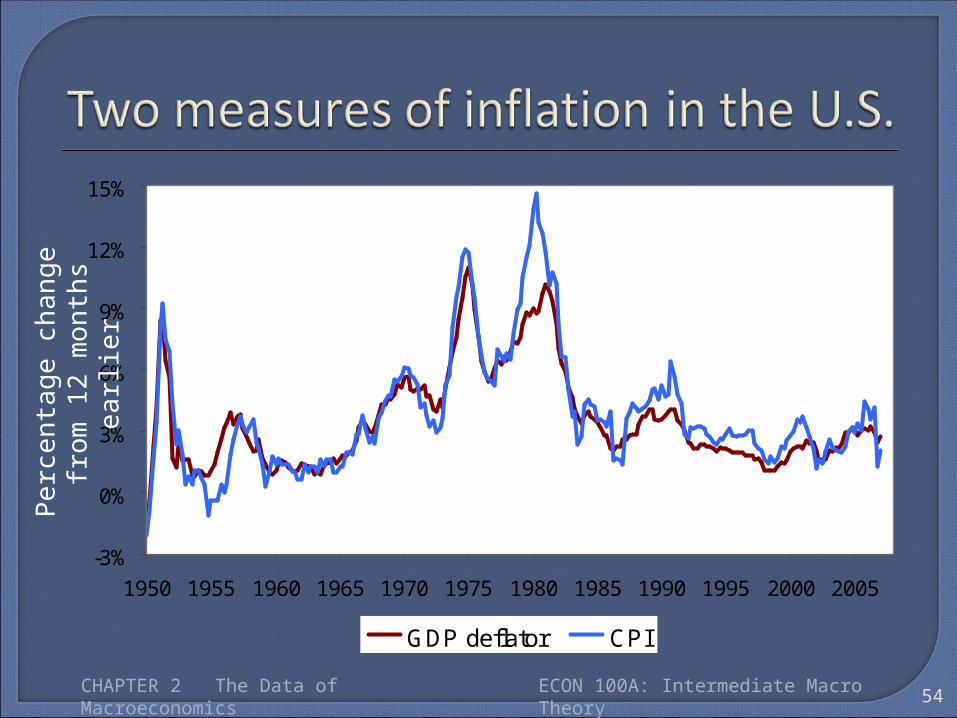
54
-3%
0%
3%
6%
9%
12%
15%
1950 1955 1960 1965 1970 1975 1980 1985 1990 1995 2000 2005
GDP deflator CPI
Per
cent
age
chan
ge
from
12
mon
ths
earli
er
CHAPTER 2 The Data of Macroeconomics ECON 100A: Intermediate Macro Theory
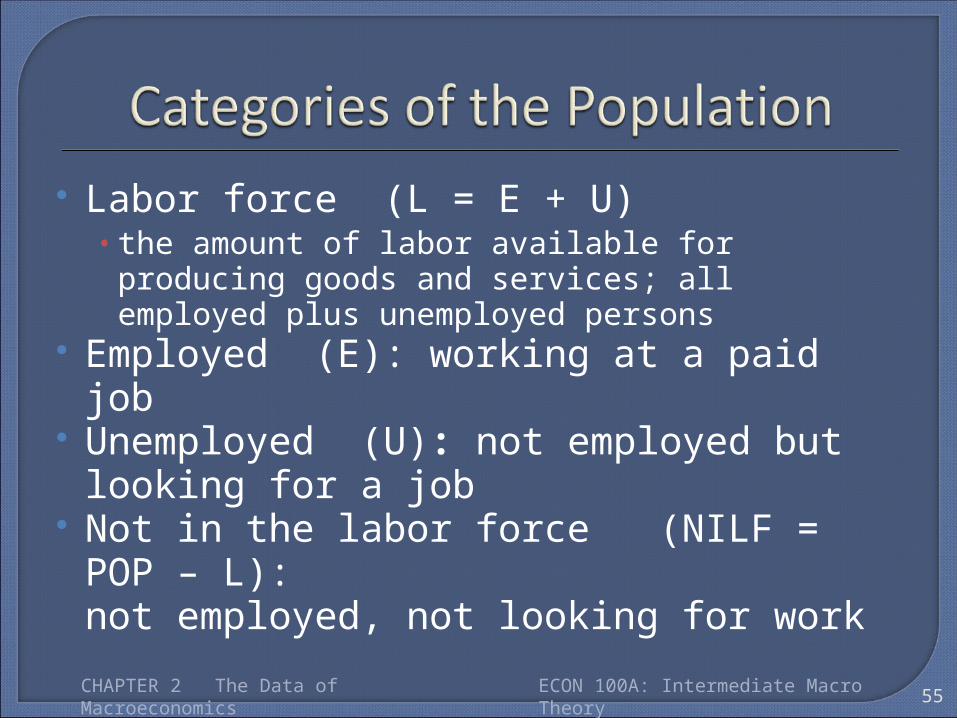
Labor force (L = E + U)• the amount of labor available for producing goods and
services; all employed plus unemployed persons Employed (E): working at a paid job Unemployed (U): not employed but looking
for a job Not in the labor force (NILF = POP – L):
not employed, not looking for work
55CHAPTER 2 The Data of Macroeconomics ECON 100A: Intermediate Macro Theory
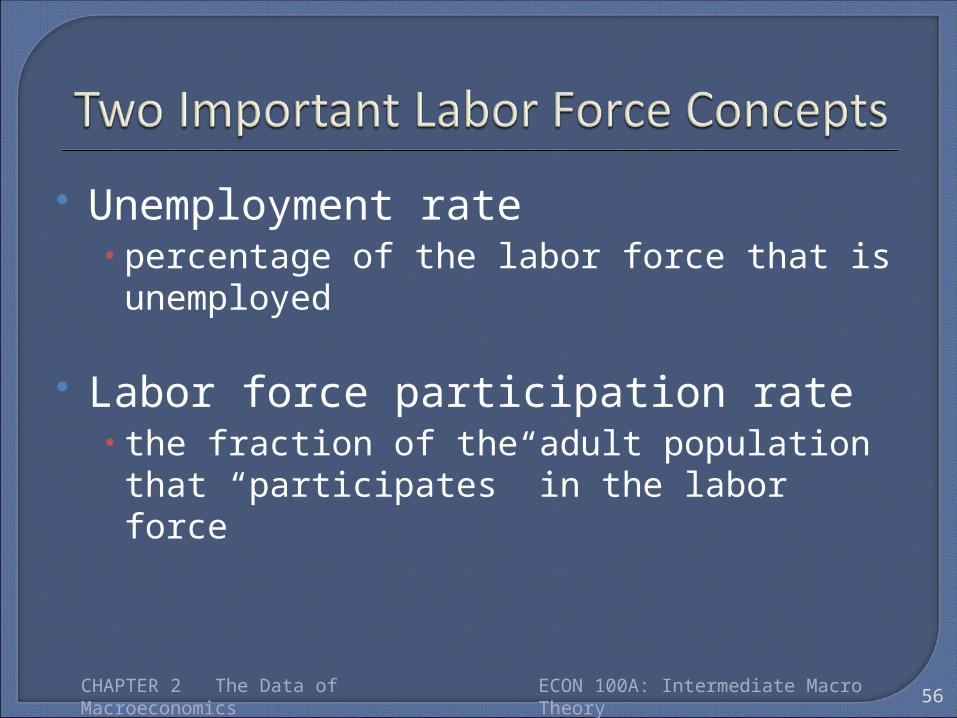
Unemployment rate • percentage of the labor force that is unemployed
Labor force participation rate • the fraction of the adult population that “participates”
in the labor force
56CHAPTER 2 The Data of Macroeconomics ECON 100A: Intermediate Macro Theory
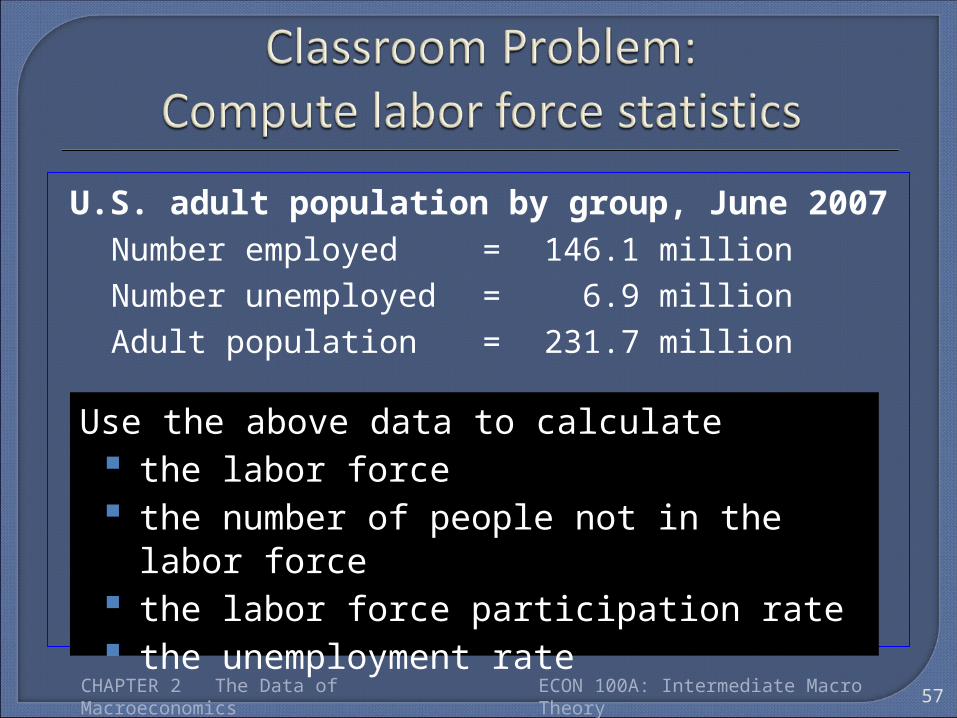
U.S. adult population by group, June 2007Number employed = 146.1 millionNumber unemployed = 6.9 millionAdult population = 231.7 million
57
Use the above data to calculate the labor force the number of people not in the labor force the labor force participation rate the unemployment rate
CHAPTER 2 The Data of Macroeconomics ECON 100A: Intermediate Macro Theory
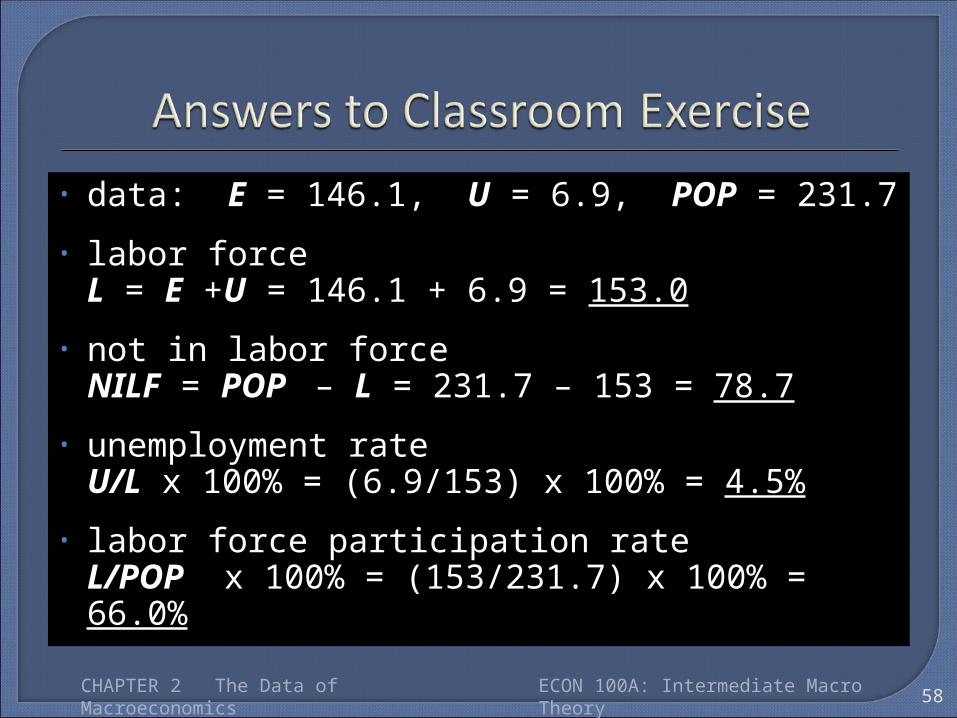
• data: E = 146.1, U = 6.9, POP = 231.7
• labor forceL = E +U = 146.1 + 6.9 = 153.0
• not in labor forceNILF = POP – L = 231.7 – 153 = 78.7
• unemployment rateU/L x 100% = (6.9/153) x 100% = 4.5%
• labor force participation rateL/POP x 100% = (153/231.7) x 100% = 66.0%
58CHAPTER 2 The Data of Macroeconomics ECON 100A: Intermediate Macro Theory
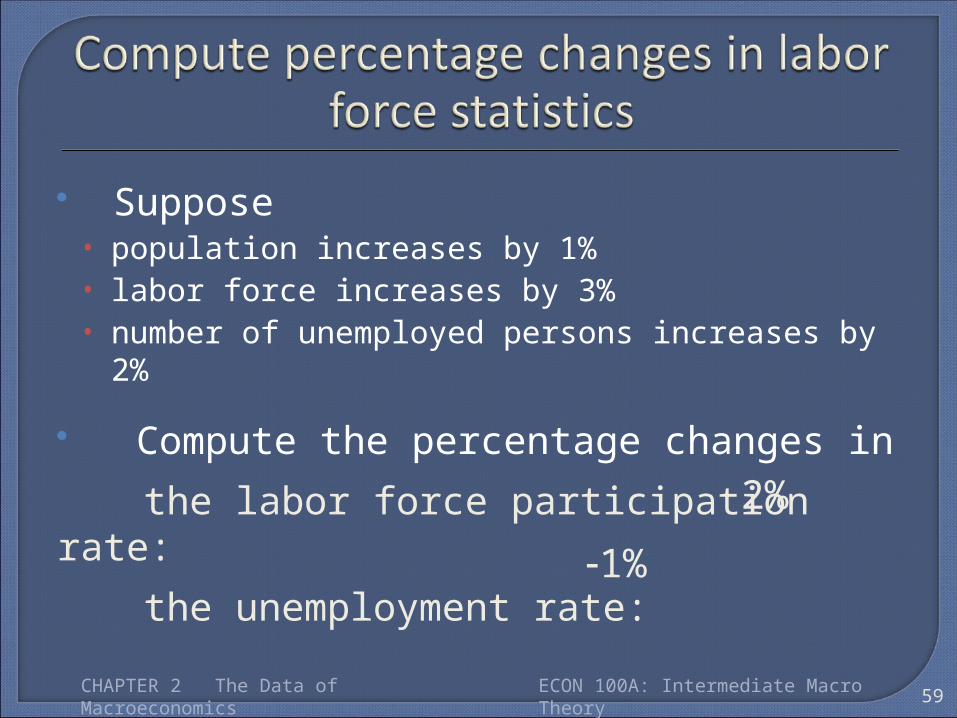
Suppose • population increases by 1%• labor force increases by 3%• number of unemployed persons increases by 2%
Compute the percentage changes in the labor force participation rate:the unemployment rate:
59
2%1%
CHAPTER 2 The Data of Macroeconomics ECON 100A: Intermediate Macro Theory
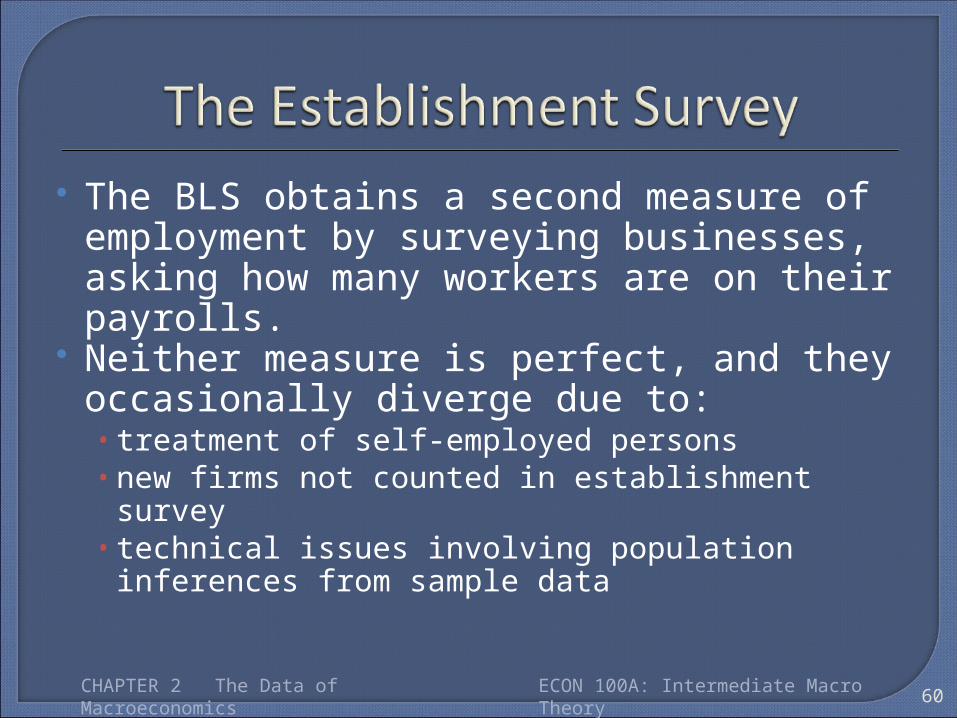
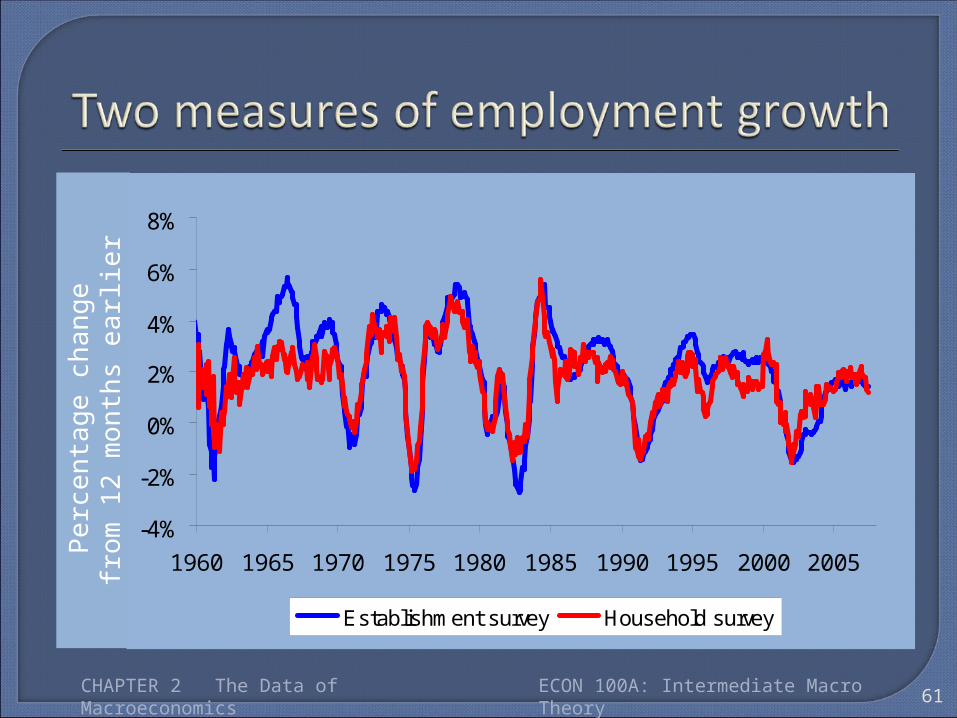
The BLS obtains a second measure of employment by surveying businesses, asking how many workers are on their payrolls.
Neither measure is perfect, and they occasionally diverge due to:• treatment of self-employed persons• new firms not counted in establishment survey• technical issues involving population inferences from
sample data
60CHAPTER 2 The Data of Macroeconomics ECON 100A: Intermediate Macro Theory
61
-4%
-2%
0%
2%
4%
6%
8%
1960 1965 1970 1975 1980 1985 1990 1995 2000 2005
Establishment survey Household survey
Per
cent
age
chan
ge
from
12
mon
ths
earli
er
CHAPTER 2 The Data of Macroeconomics ECON 100A: Intermediate Macro Theory
1. Gross Domestic Product (GDP) measures both total income and total expenditure on the economy’s output of goods & services.
2. Nominal GDP values output at current prices; real GDP values output at constant prices. Changes in output affect both measures, but changes in prices only affect nominal GDP.
3. GDP is the sum of consumption, investment, government purchases, and net exports.
62CHAPTER 2 The Data of Macroeconomics ECON 100A: Intermediate Macro Theory
4. The overall level of prices can be measured by either• the Consumer Price Index (CPI),
the price of a fixed basket of goods purchased by the typical consumer, or
• the GDP deflator, the ratio of nominal to real GDP
5. The unemployment rate is the fraction of the labor force that is not employed.
63CHAPTER 2 The Data of Macroeconomics ECON 100A: Intermediate Macro Theory