Embed Size (px)
Citation preview
The Decline of Competition inU.S. Primary Elections, 1908-20041
Stephen AnsolabehereDepartment of Political Science
Massachusetts Institute of Technology
John Mark HansenDepartment of Political Science
University of Chicago
Shigeo HiranoDepartment of Political Science
Columbia University
James M. Snyder, Jr.Departments of Political Science and Economics
Massachusetts Institute of Technology
November, 2005
1
Abstract
Primary elections have been a prominent feature of U.S. politics for the past century.
However, surprisingly little is known about how primaries have operated over time. Except
for the most recent decades, we do not even know simple facts such as how many primaries
were contested, how competitive the constested races were, and how these patterns varied
across states, o±ces, and time. This is mainly because of data availability. To gain greater
insight into the functioning of primaries, we have constructed a comprehensive data set of
primary election returns. The data set covers all statewide executive and federal o±ces for
all states and almost all years that primaries have been in operation. We ¯nd that primaries
were an important source of electoral competition during the ¯rst 30-40 years following their
introduction, both in open-seat contests and in incumbent-challenger races. This is no longer
the case, however, except in open-seat contests, where competition remains robust.
1. Introduction
A hallmark of elections in the United States is a two-stage electoral process. Candidates
running under the standard of one of the major political parties must ¯rst win the party's
endorsement in a primary election. Few other countries use party plebiscites to nominate
their candidates, but the United States has employed primary elections widely for nearly
100 years.1 The primary system is relatively new in U.S. presidential elections, in which
a majority of delegates were chosen by state conventions and caucuses until the 1970s.
For other state and federal o±ces, however, almost all states have used primary elections to
nominate candidates for the general election since the early decades of the twentieth century.
From their inception, primary elections have been seen as an important vehicle for polit-
ical competition in the United States. Progressive reformers at the turn of the last century
promoted the direct primary as a way to undercut the power of local and state political
machines and as a way to bring into the parties fresh candidates, new ideas, and organized
constituencies. Many texts on U.S. elections assert that primaries were introduced because
there was so little inter-party competition in most states. A typical example is from Burn-
ham (1970, p. 75): \Clearly a tremendous impetus for the adoption of [direct primaries] was
the post-1896 conversion of most parts of the United States into one-party bailiwicks, with
the consequent erosion of signi¯cant choice at the general election."2
Competition in primaries is potentially more °uid, volatile, and intense than competition
in general elections. Unlike in general elections, the main political parties do not exert
oligopolistic control over access to the ballot and do not structure the choices of voters
through well established brand names. Rather, any candidate who can secure su±cient
numbers of signatures or pay the appropriate ¯ling fee can get on the ballot.3
Overall, the scholarship by political scientists supports the reformers' conjectures that
primary elections o®er an e®ective second electoral screen. King (1997) argues that pri-
mary elections make all candidates in the United States excessively concerned with winning1See Carey and Polga-Hecimovich (2004) for a discussion of primary elections in Latin America.2See also Key (1958), Ladd (1970), and Sorauf (1972).3These requirements have only diminished since the 1970s, after the Supreme Court held high fees un-
constitutional in two cases, Williams v. Rhodes and Jenness v. Fortson.
2
elections. They are, he contends, always at risk either from a challenger from the oppos-
ing party or from a challenger from within their own party. Fiorina, Abrams, and Pope
(2004) argue that primary elections are an important force in polarizing elite discourse in
the United States. In order to get through the primary round, Democratic candidates must
¯rst run to the left and Republicans to the right.4 And Zaller (1998), likening politicians to
pugilists, suggests that the two-round electoral system in the U.S. naturally selects a certain
type of politician. Like boxers who must win successive ¯ghts to move up in their rankings,
he argues, politicians must win successive elections to gain seniority and political power.
Primary elections have doubled the electoral scrutiny a typical American politician must
endure, with the result that American politicians face many more electoral battles than any
other politicians in the world.
These accounts imagine robust primary election competition in the U.S.. Surprisingly,
however, not much is known about actual primary election competition. Most research has
focused on the dynamics of presidential primaries.5 A handful of papers have considered the
levels of primary election competition in recent U.S. House and gubernatorial elections (Berry
and Cannon 1993, Schantz 1980). As a general account of primary election competition,
though, these studies are limited by the o±ces examined and by the period studied. How
has competition in primary elections varied across o±ces, and how has competition varied
over time?
In addition to opening up the party process, a second important rationale for introducing
direct primary elections was to inject political contestation into areas that lacked competition
in general elections. Reformers expected primary competition to be most salient in the many
states and locales dominated by one political party. As a result, the use of primary elections
would increase the overall amount of competition for any given o±ce.
The claim that primaries may be an alternative to party competition has traditionally
been supported by evidence from the Democratic-dominated South (Key, 1954; Jewell, 1967;
Ewing, 1953). Several studies provide evidence that primaries are more likely to be contested
4There is some debate in literature concerning the di®erences between primary and general electionelectorates in the U.S. and how this a®ects candidate selection (Ranney (1968), Polsby (1983), Crotty andJackson (1985), Geer (1988), Kaufmann, Gimpel and Ho®man (2003), and Abramowitz (1989).
5See for example Bartels (1988).
3
in electorally \safe" rather than competitive areas (e.g. Key, 1956; Grau, 1981; Jewell and
Olson, 1982). In this view, competition in primaries and competition in general elections
substitute for each other|the one increases as the other declines.
The view that primaries o®er an alternative to party competition does not seem to
travel well outside the South. Primaries are most competitive in open seat elections and
least competitive when incumbents are present (Schantz, 1980; Grau, 1981; Hogan, 2003).
Turner (1953, p. 210) writes, \The comparative usefulness of the primary as a method for
selecting successors for retiring incumbents does not o®set the fact that the primary is not
a successful alternative to two-party competition in most parts of the United States."6 This
suggests that primaries have a limited role in holding representatives accountable for their
behavior in o±ce.7
A separate literature argues the exact contrary, that primary and general election com-
petition should be positively correlated. Candidates who face primary competition are likely
also to face more stringent competition in the general election. At the level of individual
races, some contend, contested primaries wound nominees and make closely fought November
elections more likely.8 At the level of the political system, moreover, primary competition
and general election competition are two parts of the same phenomenon. Elazar (1966), for
example, argues that state political cultures create conditions that either facilitate or retard
competition in all elections. Lipset and Rokkan's (1967) classic study on social diversity and
political competition also suggests a positive correlation. Polities with more diversity, they
argue, are bound to have more competition throughout the political system. The evidence
for a positive correlation between primary and general election competition, like the evidence
for a negative correlation, is mixed (Born, 1981; Bernstein, 1977; Hacker, 1965; Herrnson
6Jewell and Breaux (1991, p. 142) write, \Students of primary competition have often argued that it islikely to be more intense where the party's chances of winning the general election are greatest... The factthat we have found such a high proportion of incumbents having no opposition in either election suggeststhat this theory does not work perfectly."
7The threat of primary competition might be enough to improve representation by incumbents, and openseat races might be su±cient to select \good types." But few democratic theorists argue that latent orinfrequent competition is enough for a healthy democracy. See, for example, Ware (1987). Sartori (1976) isan exception. Recent work by Besley, Persson and Sturm (2005) suggests that actual political competitionis good for economic growth and certain economic policies.
8Born (1981) and others argue the general election competition can a®ect the degree to which primarieswill be competitive.
4
and Gimpel, 1995; Jewell and Olson, 1978; Johnson and Gibson, 1974; Kenney and Rice,
1984; Lengle, 1980; Piereson and Smith, 1975).9
All told, then, most research holds that primary and general election competition should
be correlated. There is, however, considerable disagreement about whether the correlation
should be negative or positive, and the evidence is at best con°icting, or limited to a partic-
ular time or region.
In this paper we examine the e®ectiveness of primaries as instruments for electoral com-
petition. First, we ask, how much competition exists in primaries, and how has that changed
over time? Second, how much do primary elections contribute to the overall quantity of elec-
toral competition, and speci¯cally are primaries a substitute or a complement for general
election competition? To examine these questions, we document the changes in primary and
general election competitiveness in all U.S. states throughout the twentieth century. To our
knowledge, there are no previous studies that examine primary competition in all states over
so many o±ces and over such a long period of U.S. history. We are able to do this using
a new dataset of statewide and federal primary election returns that extends back to the
initial primary elections in each state.
2. Data and Measures
American state and federal primary elections have been rarely studied owing to the
elusiveness of the data. Most of the data available in state reports have not been compiled.
In some states, especially before the 1950s, primary election returns are available only from
newspaper reports, as the primaries in those states were treated as activities of private clubs
and, thus, not part of the o±cial state election process.
Several projects over the years have assembled parts of the overall picture. Scammon
and Wattenberg's America Votes provides primary election returns for governor, U.S. House,
U.S. Senate and President from 1956 to the present. Several studies have examined trends in
primary election competition for just one of these o±ces. On the U.S. House see Alford and9Further complications arise with the form of the primary election. Whether there exists such a positive
correlation may depend on the use of run-o® elections (Canon, 1978; Berry and Canon, 1993) or multi-member districts (Jewell and Breaux, 1991), or the use of pre-primary endorsing conventions.
5
Arceneaux (2000) and Gerber and Morton (1998); on the U.S. Senate see Westlye (1991);
on governors see Berry and Canon (1993); on state representatives see Grau (1981).
We have compiled the primary and general election returns for all statewide o±ces and
for the U.S. House and Senate from 1900 to 2004 using o±cial state election reports, state
manuals, newspapers, and almanacs. The sources for individual states are listed in Table
A1 in the appendix. Data on general election competition in statewide elections come from
the MIT State Elections Database. For further information on and discussion of the general
election data see Ansolabehere and Snyder (2002).
We measure electoral competition in three ways: the fraction of contested races, the
defeat rate of incumbents, and the division of the vote. In general elections, the division
of the vote is the share of the two party vote won by the Democrats. This quantity itself
consists of the underlying partisan division of the state, or normal vote; the personal votes
of candidates, including incumbency advantages and challenger quality; national party tides,
which take the form of year e®ects; and idiosyncratic variation. See Ansolabehere and Snyder
(2002) for a decomposition along these lines.
General election competition may be considered broadly or considered strictly in partisan
terms. The absolute value of the Democratic share of the two party vote deviated from 0.5
captures the broadest sense of competitiveness. When considering the competitiveness of
states we classify elections as being either competitive or ¯rmly aligned with one party. We
classify states in a given year as competitive if the average Democratic share of the two party
vote across all statewide o±ces is between 60 and 40 percent for the 10 year period including
and prior to the year of interest.10
Measuring primary election competition raises several additional issues. As with general
elections, turnover occurs primarily when incumbents lose. One complication emerges when
considering the number of contestants. As in general elections, incumbents can stand for
renomination in their party primaries without facing opposition. It is also possible that no
one runs in the primary for the nomination of the opposing party; that is, many primaries10Rising incumbency advantages might make party competition seem less intense. A more precise estimate
of partisan competition, then, subtracts out the estimated incumbency e®ect, which equals the expected shareof the two party vote in the absence of an incumbent. The results below are qualitatively similar using thede¯nition of competition that does not include incumbency e®ects.
6

have zero candidates. We classify primaries in which one candidate runs or in which no
candidate runs as uncontested. The modal primary is uncontested.11
Other primaries involve more than two candidates. In Oklahoma, for example, the av-
erage number of candidates running in the Democratic gubernatorial primary over the past
100 years is just over seven. The varying numbers of primary election candidates mean that
the \two-candidate" vote share is not a natural measure of closeness of the election. Orient-
ing the data to measure the \normal vote" proves particularly di±cult in primary elections,
even if all races involved just two candidates. Researchers cannot identify the ideological
positioning or factional identi¯cation of each candidate using aggregate election data alone.
We have experimented with various measures of electoral competitiveness, such as the
winning candidates' share of all votes, the di®erence between the top two candidates' vote
shares, the winner's share of the top two candidates' votes, and the incumbents' share of
the vote. All track each other closely, as we discuss in Section 3 below. In analyzing the
relationship between general and primary election competition we classify as competitive
those races where the winner received less than 60 percent of the total votes cast.
3. Trends in Primary Election Competition
Primary elections in the United States rose out of two distinct historical conditions.
In the U.S. South, primaries were integral to the constellation of electoral rules and in-
stitutions designed to disfranchise African Americans and to sustain the solid Democratic
party hold on the states of the Confederacy. Most Southern states prohibited African Amer-
icans, often explicitly, from voting in primaries. And given the Democrats' advantage in the
general election, the Democratic nomination was tantamount to election, Within the Demo-
cratic primaries, though, historians and political scientists describe robust competition, with
shifting factions, coalitions of convenience, and political machines built around personalities,
families, and friends and neighbors (see Key, 1949).
Outside the South, primary elections were the cornerstone of progressive reforms. States
that adopted the direct primary early, such as Wisconsin, California, and North Dakota, were11The inclusion of \empty" primaries uncontested by any candidate has no substantive e®ect on our
analysis. The same conclusions hold for primaries entered by only one candidate.
7

strongholds of the Progressive movement within the Republican Party.12 (The package of
political reforms called the \Wisconsin idea," including the direct primary, was the handiwork
of progressive Republican senator Robert M. LaFollette.) The direct primary, its advocates
argued, promised to turn out of o±ce politicians long out of touch with the typical voter
and to renew the Republican Party with a healthy dose of competition. In the South too,
progressives called for direct primaries as a means of weakening the hold of particular factions
or organizations over state politics. Where the target of reform in the North was the business
plutocracy and immigrant machines, in the South the target was courthouse cliques and
plantation bosses.
Figures 1 and 2 display the history of primary electoral competition in the North and
South, respectively. Throughout this article, we refer to the Northeast, Midwest, and West
as the \North." To be sure, there are interesting di®erences among these regions, such as
the strength of Progressivism in the Midwest and West, but not the Northeast. But these
di®erences pale in comparison to the distinctiveness of the South from the rest of American
political culture. Each ¯gure contains four panels, corresponding to four di®erent measures
of competition: the fraction of races with no competition, one minus the winner's vote share,
the fraction of races in which the winner received less than 60 percent of the vote, and the
fraction of incumbents who won.13 The ¯gures also distinguish between races including
incumbents and races for open seats.14
The Northern, Midwestern, and Western states showed a modest amount of electoral
competition in primaries in the 1910s and 1920s, and a steady decline in primary election
competition over the succeeding decades. Given the rapid adoption of this reform and the
expectations of the early advocates, we expected more competition in the early primaries.
But, in fact, between 40 to 50 percent of all primary elections in the northern states were12Primary elections of other kinds antedate the progressive reforms. In the nineteenth century, some states
allowed and a few required parties to conduct \indirect primaries" to elect delegates to party caucuses orconventions. The hallmark of the progressive program was direct primaries to decide nominations by aplebiscite of party voters. For a history, see Merriam and Overacker (1928).
13The winner's vote share is the vote share of the total vote but excludes those winners who are notcontested. The fraction of races where the winner received less than 60 percent of the total vote includesthe uncontested races.
14We classify both parties' primaries as incumbent-challenger races if there is an incumbent running ineither party's primary.
8
uncontested during the early decades of the twentieth century. Competition spiked brie°y
during the decade of the New Deal, as both parties repositioned themselves, but then the
chronic lack of contestation returned. Over the entire course of their history the northern
states have sustained rates of uncontested primaries of around 60 percent.
Among the contested primaries, the winners' vote share further illustrates the decline in
primary competition. In the 1910s through the 1930s, the primary election winner received
less than 60 percent of the vote in 35 percent of the elections. The typical winner in this
early period captured around 55 percent of the vote. After 1940, though, competition steadily
eroded. By the 1990s, primary winners won less than 60 percent of the vote only 20 percent
of the time, and average winner's vote share rose to over 60 percent of the vote.
Incumbents rarely lost a primary election, even in the early period. During the Pro-
gressive era, incumbents lost less than 3.5 percent of their primary elections. This fraction
dropped to about 1 percent in the 1950s and has stayed at about 1 percent ever since.
Figure 2 illustrates the pattern of primary competition in southern states. During the
¯rst decades of the twentieth century, primary elections were more competitive in the South
than in the North. Candidates ran without primary opposition in around 35 percent of the
primary races, much less often than incumbents ran unopposed in the North, Midwest, and
West.
Winner's vote shares and incumbent re-election rates provide further evidence that pri-
mary elections were more competitive in the South than the North during the ¯rst decades
of the twentieth century. In this period, the winners in roughly half of the primary elections
received less than 60 percent of the vote. The winning candidate's vote share on average
was less than 55 percent. Incumbents had less security in primaries in the South, with more
than 5 percent of incumbents turned out of o±ce during the early period.
The Supreme Court cracked open this closed world of southern politics in a series of cases
from the 1920s into the 1940s, especially Nixon v. Herndon, United States v. Classic, and
Smith v. Allright. In the ¯nal chapter of Southern Politics, V. O. Key wondered aloud what
the South would look like after the 1944 decision in Smith v. Allright e®ectively ended the
white primary.
9

Now we know. After 1940, southern primaries rapidly became less competitive, to the
point that competition in southern primaries strongly resembled competition|or lack of
it|in northern primaries. The number of uncontested primaries rose dramatically, so that
by the 1990s, less than 60 percent of Southern primaries were contested. The average vote
share of winners topped 55 percent, and the winner received more than 60 percent of the vote
in more than 80 percent of the elections. Furthermore, less than 1 percent of incumbents
failed to win renomination in a primary election.
Over the course of a century, then, the competitiveness of primary elections across the
regions of the country has converged. The North showed modest levels of primary compe-
tition in the 1910s and 1920s, and very little incumbent turnover. The South, by contrast,
began the twentieth century with relatively high levels of primary election competition. To-
day, however, the North and the South hardly di®er. This pattern, interestingly, mirrors
the trends in general election competition. The South began the twentieth century under
the domination of a single party, the Democrats. The other regions had more inter-party
competition, but some of them, especially in New England, were also dominated by a single
party, the Republicans. Over the course of the twentieth century, all states have become
increasingly competitive in their general elections. Just as the regions have converged in
their levels of general election competition, so have they converged in their levels of primary
election competition.
4. Primary and General Election Competition
How has the decline of primary election competition a®ected the overall level of electoral
competition in the United States? The answer in part depends upon the relationship between
primary and general election competition.
To illustrate how the impact of declining primary competition on overall competition may
depend upon the distribution of primary and general election competition, we can consider
a highly stylized situation with three types of general elections. Suppose in a given election
one-third of the seats are safe Democratic, one-third are safe Republican, and one-third are
competitive. In a competitive race, the candidates from both parties have an equal chance
of winning the general election.
10
One possible distribution of primary election competition is that the seats that are com-
petitive in the primaries are also competitive in the general elections. In this case, declining
primary election competition by itself would not alter the overall competitiveness of the sys-
tem. The competitive seats would remain highly competitive in both the primary election
and the general election, and the safe seats would remain uncompetitive in both the primary
and general elections.
A second possibility is that primary election competition substitutes for general election
competition: the safe Democratic and Republican seats have sti® primary election compe-
tition, while the candidates in the seats with intense general election competition face no
challenges in the primary elections. In this scenario, if primary election competition declines
without a compensating increase in general election competition, then roughly two thirds of
the elections (primary plus general) that were competitive become uncompetitive. This, of
course, is an extreme version of the argument put forward by V. O. Key (1949) and tested
by Julius Turner (1953) using U.S. House data from the 1940s.
These hypothetical cases highlight the possibility that declining primary election com-
petition has either substantially reduced the competitiveness of the electoral system in the
United States (the second case) or has had little practical consequence (the ¯rst case). Of
course, the real world does not look like either of these circumstances. It is a mix of these ide-
alized cases. But, these hypotheticals do depict a version of the world that has considerable
currency (Key's hypothesis), and they do help to focus the empirical question of interest.
What is the empirical relationship between primary and general election competition?
To address this question we classi¯ed primary elections as competitive or not and general
elections as competitive or not. We use whether a candidate wins less than 60% of the vote
in a given race as our measure of competitive elections.15 The classi¯cation of primary and
general elections as competitive, in turn, yields four di®erent cases: (1) competitive primary
election and competitive general election, (2) competitive primary election but uncompetitive
general election, (3) uncompetitive primary election but competitive general election, and
15We have examined other thresholds for competitiveness (e.g. 55% and 65%) and the patterns aresimilar. We have also considered raw correlations in vote shares. However, owing to the very large numberof uncontested races, these correlations are sensitive to missing data.
11
(4) uncompetitive primary election and uncompetitive general election. We then computed
the fraction of o±ce holders whose races fell into each of these categories. This procedure,
of course, omits the amount of competition in the party of the general election loser. We
follow the literature in examining the electoral test that the o±ce holders faced. Including
the primary election competition of the party that did not win the seat in°ates the number
of elections in which there is no primary election competition, by introducing a large number
of cases in which no primary was held (e.g. the southern Republican Party did not regularly
hold primaries during the ¯rst half of the century).16
Table 1 presents the proportion of elections in each of the four categories listed above.
We present the statewide elections (including U.S. Senate) and U.S. House races separately,
as these o±ces show di®erent levels of competition but similar trends. To simplify the
presentation of time trends we divided the twentieth century into three periods: (1) 1910-
1938, (2) 1940-1958, and (3) 1960-2000. These correspond roughly to the Progressive era
and the years of the Solid South, the years of transition in the South, and the current era
of high incumbency advantages and established voting rights (see Aldrich and Niemi (1996)
on the last era).
There are two quantities of particular interest in Table 1. The ¯rst is an indicator of the
overall (un)competitiveness of the system, which can be measured by the fraction of races in
which the winner received in excess of 60 percent of the vote in the primary and the general
election (case 4 above). The second is an indicator of the importance of primary elections
per se, which can be measured by the fraction of cases in which the winner received less than
60 percent of the vote in the primary but more than 60 percent of the vote in the general
election (case 2 above). This is the case where the primaries were competitive even though
the general elections were not.
Table 1 illustrates a familiar story of steady decline in the overall levels of competition
in U.S. elections. In statewide elections the fraction of races in which the winner captured
better than 60 percent of the vote in both stages of the election rose from 26 percent of
all cases to 33 percent { a 7 percentage point drop in this measure of the overall level of16The patterns of electoral competition do not change signi cantly when the primaries of those who did
not win the primary election are included.
12
competitiveness. In U.S. House elections competition plummeted over the course of the
twentieth century. From 1900 to 1938, 39 percent of House candidates won their seats with
more than 60 percent of the vote in both the primary and general election. From 1960 to
2000, 64 percent of House candidates cleared the 60 percent mark in both elections.
Is declining primary election competition per se to blame? The fraction of cases in which
the primary election was competitive but the general election was not suggests that the
primaries contributed to the overall decline. However, the di®ering patterns in primary com-
petition for statewide and U.S. House o±ces also suggests that the overall decline in electoral
competition cannot simply be determined by the decline in primary election competition.
Primary competition did contribute to the overall level of competition in the early period
from 1910 to 1938. In the primary elections for statewide o±ces, 25 percent of the winners
faced competition in the primaries but not the general elections in the early period. Similarly
in the primary elections for the House, 12 percent of winners faced competition only in the
primaries during this period.
The drop in primary competition in statewide elections far exceeds the drop in overall
competition. The fraction of races without serious competition rose 7 percentage points,
from 26 percent to 33 percent, as noted above. However, the change in the fraction of races
in which there was a competitive primary but an uncompetitive general election far exceeds
the decline in the overall level. The fraction of statewide o±ce holders who only faced
primary competition dropped from 25 percent in the ¯rst period, to 17 percentage points in
the 1940s to 1950s, to just 8 percent in ¯nal decades of the century.
In contrast, for U.S. House elections the drop in primary competition can account for
only a small fraction of the drop in overall competition. Over the course of the twentieth
century, the fraction of U.S. House candidates facing competition in at least one stage of the
process dropped from 61 percent to 36 percent. During this period, the fraction of cases in
which House members faced a serious primary challenge but no general election challenge
dropped from 13 percent to 5 percent. The fraction of House members who faced signi¯cant
competition fell by 25 percentage points, but the drop in competitive House primaries can
account for, at most, only an 8 percentage point decline.
13
The di®erence between statewide and House elections suggests that changes in the overall
level of competition cannot simply be explained by the decline in primary competition. In the
statewide elections, decreasing primary competition was o®set by increasing general election
competition. In the House elections, decreasing general election competition far exceeded
the decline in primary election competition.
The declines in competitiveness in both primary and general elections for the House and
the fall in competitiveness in primaries coupled with the rise in competitiveness in general
elections for statewide o±ces suggests a possible connection between primary and general
election competition. Is there any evidence that primary and general election competition are
correlated? Is there any evidence that general election competition increases when primary
election declines? Or, do these factors operate independently?
The data suggest that primary and general election competition are at largely inde-
pendent, at least within periods. The change in overall competition appears to stem from
changes in the marginal distributions of primary and general election competition, rather
than a substitution between primary and general election competition.
Consider, again, the statewide races. In the ¯rst period, roughly half of all primary
elections are classi¯ed as competitive and 51 percent of all general elections are classi¯ed as
competitive. The hypothesis that primary and general election competition are substitutes
predicts that the joint distribution of these two variables deviates from what is predicted
under independence. Under independence we would expect roughly one-quarter of all cases
in the ¯rst period to fall into each category of competition. The fraction of observed cases
di®ered from levels predicted under independence by only about 1 percentage point in each
category of competition. Although the chi-squared test rejects the statistical independence
of the two variables, which is not surprising given the large number of cases, the observed
distribution is substantively very close to what we would expect if primary and general
election competition were independent.
A similar pattern of independence between statewide primary and general election com-
petition appears in the 1940 to 1958 period and the 1960 to 2000 period. The observed
levels of competition di®er from those predicted under independence by less than 3 percent-
14
age points in each of the four categories in both periods. In the second period the chi-squared
test even fails to reject the null hypothesis of independence despite the large number of cases.
The rise in the number of elections in which there was only a competitive general election
and the fall in the number of elections in which there was only a competitive primary
is consistent with what we would expect if the changes in primary and general election
competition were independent. This ¯nding matches prior studies, such as Turner (1953),
which have found little relationship between primary and general election competition. We
¯nd that in statewide elections the two do not appear to act as substitutes over the very
long run of the twentieth century.
What did change was the incidence of general and primary election competition. In
statewide elections, primary election competition fell over the course of the past century,
while general election competition rose. In the ¯rst decades of the century, half of all general
and primary elections for statewide o±ce were competitive. By the end of the century,
the fraction of competitive general elections for statewide o±ce rose to 59 percent while
the fraction of competitive primary elections dropped to just 25 percent. These appear to
operate independently (at least in the aggregate), and the separate changes in the marginal
distributions of primary and general election competition for statewide o±ce are su±cient
to explain the change observed in the patterns of competition. Because primary election
competition declined and general election competition rose, the fraction of cases in which
primary elections were the only screen plummeted, the fraction of cases in which general
elections were the only electoral screen surged, and the overall level of competition dropped
somewhat. Declining primary election competition in statewide elections, thus, did not alter
the overall level of competition much, but it did sharply reduce the role of primaries in
generating that competition.
In U.S. House elections, we appear to confront a di®erent puzzle. At ¯rst glance it appears
that declining primary competition contributed little to the overall decline of competition in
U.S. House elections.
But in fact, competition in elections to the House tracks the same pattern as competition
in elections to statewide o±ces, albeit with a much more lower starting level of primary
15
competition and a decrease in general election competition. As in the statewide o±ces,
primary and general election competition for the House are not highly correlated. Consider
the ¯rst period in Table 1. Roughly half of all House members won their seats in competitive
general elections from 1900 to 1938, but just under 30 percent faced a serious primary
election challenge. If primaries and general elections operate independently then we would
expect 14 percent of all House members to have won less than 60 percent of the primary
and general election vote; 15 percent to have won less than 60 percent in the primary but
more than 60 percent in the general; 35 percent to have won less than 60 percent in the
general but more than 60 percent in the primary; and 37 percent to have won more than
60 percent in both rounds. As in the statewide o±ces, the observed fraction of cases for
each category of competition deviate from the fraction predicted under independence by less
than 3 percentage points. Similar calculations for the 1940 to 1958 and the 1960 to 2004
periods yield similar conclusion. Although the marginal distributions had changed, the joint
distribution of primary and general election competition appears consistent with the notion
that the two variables operate independently.
In short, the changing patterns of competition in House elections are likely to be at-
tributed to independent changes in the rates of general and primary election competition.
The aggregate rate of competitive primaries fell from 29 percent to 11 percent of all House
races. General election competition declined as well. These two forces yielded a dramatic
decline in overall competition in U.S. House elections. competition for statewide o±ces had
a di®erent trajectory than competition for the U.S. House because of the increase in general
election competition for senator, governor, and other state executive o±ces. Had House
elections witnessed a rise in general election competition comparable to the rise in statewide
elections, a very di®erent pattern would have emerged. Suppose the fraction of U.S. House
seats won by less than 60 percent in the general election equalled the statewide ¯gure of 59
percent, instead of 32 percent. In that case, the changes in patterns of competition for the
House would have resembled the pattern in competition for statewide o±ces. Fifty-three
percent of House candidates would have won in competitive general elections and uncom-
petitive primary elections. The di®erent patterns of changes in primary and general election
16
competition in elections for the House and for statewide o±ces can be attributed entirely to
di®erent trajectories in general election competition.
Three conclusions are abundantly clear from this analysis. First, primaries once often
served an important screening role, but now they very rarely do. From 1900 to 1938, one
quarter of all statewide o±cers and one eighth of all House members faced only primary com-
petition. By the last part of the century, from 1960 to 2000, primary competition a®ected
just one in twelve in the statewide o±ces and only one in twenty in the House. Second, the
overall competitiveness of the electoral system has fallen. Only one third of all statewide o±-
cers win with at least 60 percent of the vote in both the general and primary elections, while
just under two-thirds of all House candidates face no serious general or primary competition.
Third, primary and general election competition appear to make relatively independent con-
tributions to the total level of competition in U.S. elections. Primary and general election
competition do not act as substitutes. The declining rate of primary election competition
meant that primaries served much less as a screen. Whether they also contributed to declin-
ing rates of overall competition depended on changes in general election competition. Where
general election competition increased, as in contests for statewide o±ces, overall competi-
tion changed only modestly. Where general election competition also fell, as in elections for
the House, the drop in primary election competition contributed to a dramatic drop in the
total amount of electoral competition.
5. Incumbents and Parties
So a puzzle emerges from Table 1. Why did general election competition strengthen
in statewide elections but weaken in House elections? Primaries show less competition
across the board, but the di®erential trends in general election competition suggest two
very di®erent electoral systems at work|one at the level of U.S. House districts and the
other at the level of the state. In addition, these distinct trends raise the possibility that
there may be a strong connection between primary and general election competition that is
masked by some other important factor|whatever explains the di®erential trends in general
election competition over the 100 year span.
17
Two obvious suspects, given the literature on political competition in the United States,
are incumbency and party. Gelman and King (1990), Levitt and Wolfram (1997), and others
document a large increase in the incumbency advantage in U.S. House elections beginning
in the late 1950s or early 1960s. Ansolabehere and Snyder (2002) document a substantial
rise in the incumbency advantages in all statewide o±ces, as well as a clear narrowing of the
party divisions within states. In the analysis in Table 1, we combined open and incumbent-
contested seats, and we did not control for the underlying party division within the states.
Table 2 isolates the e®ects of incumbency. For statewide and U.S. House races, we present
the competitiveness of primary and general elections over time in incumbent-contested and
open seats. We use the same measure of competitiveness as in Table 1.
The data summarized in Table 2 reveal that incumbency was not likely to have masked
an underlying correlation between primary and general election competition. For each period
and for each type of election (e.g., open-statewide), we computed the expected results under
the hypothesis that the variables are independent. As in the forgoing analysis, in no category
of competition in Table 2 did the fraction of cases we would expect under independence di®er
from the fraction of cases observed by more than 3 percentage points. More than half of the
chi-squared tests cannot reject the null of independence at the 1 percent signi¯cance level.
The evidence in Table 2 also suggests that the di®erential trends in competition in
statewide and House elections are attributable to incumbency. In both sorts of elections,
incumbents enjoyed rising electoral security in the general elections, but the fraction of all
races contested by incumbents was much lower in statewide elections than in House elections.
Consider, ¯rst, the open seat races. These serve as a baseline against which to contrast
the races contested by incumbents. Open seat races show relatively little change or even
growing competitiveness. In open seat races for the House, the subtables for the period 1910
to 1938 and for 1960 to 2000 are nearly indistinguishable. In both eras, 12 percent of the
winners faced no serious primary or general election competition. There was a slight drop in
the fraction of cases in which the winners received less than 60 percent of the vote in both
the general and primary elections, but it was substantively unimportant. Statewide races
show more change, and in the direction of increased competition. Overall general election
18
competition rose considerably. Half of all open seat winners received less than 60 percent of
the vote in the general election in the ¯rst period; 71 percent of all open seat winners faced
serious general election competition in the third period. Primary election competition fell
slightly in these seats, and overall competition rose.
Races contested by incumbents show a drop in competition in both statewide and House
elections. In statewide elections, the fraction of incumbents who won reelection with at least
60 percent in the primary and general elections rose from 32 percent in the ¯rst period to 42
percent in the third period. House elections show a somewhat larger gain. The fraction of
incumbents who won reelection with at least 60 percent in the primary and general elections
rose from 42 percent in the ¯rst period to 69 percent in the third period. Primary election
competition fell substantially in both the House and the statewide o±ces. Competition in
statewide general elections did not change appreciably between these periods. House general
election competition dropped dramatically. Forty-seven percent of House incumbents won
by less than 60 percent of the general election vote through the ¯rst half of the twentieth
century; just twenty-eight percent did in the second half of the century.
Trends in overall competitiveness mask contrary trends in open seats and incumbent-
contested seats. The open seats show little trend, or, in the case of statewide elections, some
increase in competition. Incumbent-contested seats, especially in the primary elections,
show signi¯cant weakening in competitiveness. Statewide elections show a slight increase
in competition because half of all statewide o±ces are selected in open seats, and that
fraction has risen somewhat over the twentieth century. The higher frequency of open seats
in statewide elections traces to one feature of state electoral laws { term limits on most
statewide o±ce holders (see Ansolabehere and Snyder 2004). U.S. House elections show a
signi¯cant weakening in competitiveness because 90 percent of all House races are contested
by incumbents. That trend dominates in the House series.
Incumbency explains much of the di®erence in overall competition between House and
statewide o±ces. It does not, however, a®ect the underlying relationship between primary
and general elections. Competition in these two stages appears to operate independently.
These facts suggest that many of the fundamentals in the election system changed little.
19
Open seats are as competitive as ever. Thus, the decline in overall competitiveness appears
to be a consequence of rising incumbency advantages and increasingly large numbers of
incumbents running for reelection. Owing to complicated measurement issues, we consider
the growth of the incumbency e®ect in primary elections in a separate paper.
Partisan divisions of the states have also changed dramatically over the course of the
twentieth century. Southern states shifted from Democratic dominance to strong two-party
competition today. Likewise, many northern states that were once dominated by the Re-
publican Party have today also become very competitive. As a ¯nal slice at the connection
between primary and general election competition, we consider whether the rise of party
competition within states correlated with less primary election competition.
We classi¯ed all states according to their degree of general election competition. To do
this, we used the measure of the normal vote produced by the analysis of state election
returns, as discussed above. The normal vote for a given state in a given election year is the
average general election vote share across all statewide o±ces for the ten year period prior to
and including the election year of interest. We call states competitive if the normal division
of the two party vote calculated for that year was less than 60 percent or more than 40
percent Democratic. Strongly Democratic states are those where the normal two-party vote
exceeds 60 percent, and strongly Republican states are those where the normal two-party
vote falls below 40 percent. We coded each party primary election as competitive if the
winner received less than 60 percent of the total vote.
Over time American state elections have become much more competitive. From 1900 to
1938, 49 percent of all statewide o±cers were elected in states where the normal division of
the two party vote was closer than 60 to 40. From 1962 to 2004, 64 percent of all statewide
elections occurred in competitive states.
The change in the competitiveness of states, however, is unlikely to explain the decline
in competitiveness of primary elections. Even within the competitive states the fraction of
both Republican and Democratic primaries in which the winner's vote share exceeded 60
percent dropped by more than 15 percentage points.
The di®erence between the primary competition for a dominant party in its \safe" state
20
and for that same party in a competitive state is less than 10 percentage points for the
Democrats and less than 7 percentage points for the Republicans. From 1900 to 1938, 52
percent of Republican party primaries were competitive in Republican-dominated states; by
contrast 46 percent of Republican primaries were competitive in competitive states. Fifty-
one percent of Democratic primaries were competitive in Democratic-dominated states; by
comparison, 45 percent of Democratic primaries were competitive in two-party competi-
tive states. From 1940 to 1960, 31 percent of Republican primaries were competitive in
Republican-dominated states, in comparison to 32 percent in the competitive states. In this
same period, 39 percent of Democratic primaries were competitive in Democratic-dominated
states, as compared to 33 percent in the competitive states. From 1962 to 2004, 37 percent
of Democratic primaries were competitive in the handful of Democratic-dominated states,
in comparison with 28 percent in the competitive states, and the proportion of competitive
GOP primaries were virtually the same, at 24 percent in Republican states and 27 percent
in closely-contested states. While the di®erences between the proportion of competitive
elections in the one- versus two-party states are found to be statistically signi¯cant using a
simple t-test, these di®erences are substantively small.
The partisan balance does have a large and negative e®ect on the degree of competition
in the primaries of the disadvantaged party. In a state dominated by one party, there is
much less competition in the \out party's" primaries than in the \in party's," and also much
less competition than in two-party competitive states. This surely re°ects the disincentive
to run in a competitive primary when there is little hope of winning in the general election.
Thus, moving from a one-party to a two-party state is likely to increase the competitiveness
of the formerly subordinate party's primary. Thus, as states become more competitive, the
increase in the competitiveness of the out party's primaries may potentially o®set the decline
in competitiveness of the in party's primaries.
To account for potential di®erences between states with dominant Democratic parties in
the South and states with dominant parties states in the North, we also compared electoral
competition in one-party and two-party states in the South and the North.17 Di®erences17These results are available from the authors upon request.
21
in the patterns between the South and North appear to depend upon whether Oklahoma is
coded as southern or northern. When Oklahoma, which is known to have very competitive
primaries, is excluded from the analysis, any substantive di®erence between the southern and
northern states in the trends in one-party and two-party primary competition disappears.
6. Conclusions
Primary elections in the United States today fall far short of the ideal for which they
were introduced. Primaries were conceived as a way to open up the parties and increase
electoral competition in the United States, and they served as an alternative to general
election competition in states that were dominated by one party. Using the simplest indi-
cator, they certainly seemed to have met this function at the beginning of the twentieth
century. Approximately one in four statewide elections would not have had signi¯cant elec-
toral competition during the ¯rst four decades of the twentieth century were there no primary
elections. However, over the course of the past century, the screening function of primary
elections appears to have weakened dramatically. Today, only about 25 percent of statewide
candidates face serious primary opposition, and less than 8 percent win after competitive
primaries but uncompetitive general elections.
The historical record also suggests that primary elections are not a substitute for general
election competition, nor do they re°ect di®erent cultures of competition within states.
Our strong expectation at the beginning of this inquiry was that we would ¯nd a strong
correlation between primary and general election competition, and, following Key's seminal
work, that this correlation would be negative. However, we have discovered that primary
election competition is not associated with general election competition. Rather these appear
to operate independently of one another. The weakening primary election screen is not
balanced out by more general election competition. The result of declining primary election
competition, then, is less competition overall in the U.S. electoral system.
We have, of course, compared primaries today with primaries 100 years ago. We have not
compared primaries with caucus and convention nomination systems, or the system of rota-
tion. Nineteenth century nomination politics is almost completely undocumented. It may be
the case that the very institution of primaries profoundly alters the politics of nominations.
22
We have focused on the politics within one sort of institution|primary elections|which
their advocates sought in order to produce a very competitive electoral system in the U.S.
We have documented the long-term decline in competition in primaries.
It is ultimately a normative matter whether the decline of primary election competition,
and the corresponding decline in overall electoral competition, is good or bad. However, the
atrophy of primary election competition raises doubts about many theoretical arguments
about American politics today. We are skeptical that primary elections can be a major
source of polarization in elite discourse in the United States. With so few competitive and
contested primaries it is unclear to us why politicians would not be more attentive to the
median voter and less attentive to the primary electorates. Also, these ¯ndings raise doubts
about arguments, such as those of Zaller and King, that primary elections contribute to
incumbent vulnerability and incumbency advantages. If elections are like single-elimination
tournaments, then almost all incumbents draw a bye in the ¯rst round. Given the utter lack
of competition in primary elections it seems unlikely that incumbents are \running scared"
that they might lose the next primary. That being said, the overall decline in competition
is tied to incumbency, as there is less competition when incumbents run.
Finally, we are concerned by the very fact that electoral competition in the United States
is waning. Political science takes virtually as given that electoral competition is good. It
improves accountability of government and representation; it is the venue for deliberative
democracy. It may be that we, as a discipline, are wrong about this conjecture. Careful
consideration of why electoral competition has declined and how might help in understanding
the conditions under which competition matters. However, it seems more plausible that the
conjecture is right|that more competition is generally better. With the decline of primary
election competition Americans have lost an important instrument of electoral accountability.
23
REFERENCES
Abramowitz, Alan I. 1989. \Viability, Electability, and Candidate Choice in a PresidentialPrimary Election: A Test of Competing Models." Journal of Politics 51 (4): 977-992.
Aldrich, John H., and Richard G. Niemi. 1996. \The Sixth American Party System." InBroken Contract, Stephen Craig, ed. Boulder: Westview Press.
Alford, John R., and Kevin T. Arceneaux. 2000. \Isolating the Origins of the IncumbencyAdvantage: An Analysis of House Primaries, 1956-1990." Paper presented at theannual meeting of the Southern Political Science Association.
Ansolabehere, Stephen, and James M. Snyder. 2002. \The Incumbency Advantage in U.S.Elections: An Analysis of State and Federal O±ces, 1942-2000" Election Law Journal1: 313-338.
Ansolabehere, Stephen, and James M. Snyder. 2004. \Using Term Limits to EstimateIncumbency Advantages When O±ceholders Retire Strategically" Legislative StudiesQuarterly 29: 487-515.
Bartels, Larry M. 1988. Presidential Primaries and the Dynamics of Public Choice. Prince-ton, NJ: Princeton University Press.
Bernstein, Robert A. 1977. \Divisive Primaries Do Hurt: U.S. Senate Races, 1956-1972."American Political Science Review. 71 (2): 540-545.
Berry, William D., and Bradley C. Canon. 1993. \Explaining the Competitiveness ofGubernatorial Primaries." Journal of Politics. 55 (2): 454-471.
Besley, Timothy, Torsen Persson, and Daniel Sturm. 2005. \Political Competition andEconomic Performance: Theory and Evidence from the United States." Unpublishedmanuscript, London School of Economics.
Born, Richard. 1981. \The In°uence of House Primary Election Divisiveness on GeneralElection Margins, 1962-76." Journal of Politics. 43 (3): 640-661.
Burnham, Walter Dean. 1970. Critical Elections and the Mainsprings of American Politics.New York: W.W. Norton and Company.
Canon, Bradley C. 1978. \Factionalism in the South: A Test of Theory and Revisitationof V.O. Key." American Journal of Political Science 22: 833-848.
Carey, John M., and John Polga-Hecimovich. 2004. \Primary elections and candidatestrength in Latin America." Unpublished manuscript, Dartmouth College.
Crotty, William J., and John S. Jackson III. 1985. Presidential Primaries and Nominations.Washington: Congressional Quarterly Press.
Elazar, Daniel J. 1966. American Federalism: A View from the States. New York: Crowell.
Ewing, Cortez A.M. 1953. Primary Elections in the South: A Study in Uniparty Politics.Norman: University of Oklahoma Press.
24
Fiorina, Morris P., Samuel J. Abrams, and Jeremy C. Pope. 2005. Culture war? The Mythof a Polarized America. New York: Pearson Longman.
Geer, John G. 1988. \Assessing the representativeness of electorates in presidential pri-maries." American Journal of Political Science 32 (4): 929-945.
Gelman, Andrew, and Gary King. 1990. \Estimating Incumbency Advantage withoutBias." American Journal of Political Science 34: 1142-1164.
Gerber, Elizabeth R., and Rebecca B. Morton. 1998. \Primary Election Systems andRepresentation." Journal of Law, Economics, and Organization 14 (2): 304-324.
Grau, Craig H. 1981. \Competition in State Legislative Primaries." Legislative StudiesQuarterly. 6 (1): 35-54.
Hacker, Andrew. 1965. \Does a 'Divisive' Primary Harm a Candidate's Election Chances?"American Political Science Review 59 (1): 105-110.
Herrnson, Paul S., and James G. Gimpel. 1995. \District Conditions and Primary Divi-siveness in Congressional Elections." Political Research Quarterly 48 (1): 117-34.
Hogan, Robert E. 2003. \Sources of Competition in State Legislative Primary Elections."Legislative Studies Quarterly 28 (1): 103-126.
Jenness v. Fortson, 403 U.S. 431 (1971).
Jewell, Malcolm E. 1967. Legislative Representation in the Contemporary South. Durham:Duke University Press.
Jewell, Malcolm E., and David Breaux. 1991. \Southern Primary and Electoral Competi-tion and Incumbent Success." Legislative Studies Quarterly 14:1:129-143.
Jewell, Malcolm E., and David M. Olson. 1978. American State Political Parties andElections. Homewood, Ill.: Dorsey.
Johnson, Donald, and James Gibson. 1974. \The Divisive Primary Revisited," AmericanPolitical Science Review 68: 67-77.
Kaufmann, Karen M., James G. Gimpel, and Adam H. Ho®man. 2003. \A PromiseFul¯lled? Open Primaries and Representation." Journal of Politics 65 (2): 457-476.
Kenney, Patrick J. 1988. \Sorting Out the E®ects of Primary Divisiveness in Congressionaland Senatorial Elections." Western Political Quarterly 41 (4): 765-777.
Kenney, Patrick J., and Tom W. Rice, \The Relationship between Divisive Primaries andGeneral Election Outcomes." American Journal of Political Science. 31 (1): 31-44.
Key, V.O., Jr. 1949. Southern Politics. New York: Vintage Books.
Key, V.O., Jr. 1956. American State Politics: An Introduction. New York: Alfred A.Knopf.
25
Key, V.O., Jr. 1958. Politics, Parties, and Pressure Groups. 4th Edition. New York:Thomas Y. Cromwell.
King, Anthony S. 1997. Running Scared: Why America's Politicians Campaign Too Muchand Govern Too Little. New York: Martin Kessler Books.
Ladd, Everett Carll, Jr.. 1970. American Political Parties: Social Change and PoliticalResponse. New York: Norton.
Lengle, James I. 1980. \Divisive Presidential Primaries and Party Electoral Prospects1932-1976." American Politics Quarterly 8: 261-277.
Levitt, Steven D., and Catherine D. Wolfram. 1997. \Decomposing the Sources of Incum-bency Advantage in the U.S. House." Legislative Studies Quarterly 22: 45-60.
Lipset, Seymour Martin, and Stein Rokkan. 1967. \Cleavage Structures, Party Systems,and Voter Alignments: An Introduction." Pp. 1-64 in Party Systems and VoterAlignments: Cross-National Perspectives, Seymour Martin Lipset and Stein Rokian,eds. New York: Free Press.
Merriam, Charles E., and Louise Overacker. 1928. Primary Elections. Chicago: Universityof Chicago Press.
Nixon v. Herndon, 273 U.S. 536 (1927).
Piereson, James E., and Terry B. Smith. 1975. \Primary Divisiveness and General ElectionSuccess: A Reexamination." Journal of Politics 37: 555-562.
Polsby, Nelson W. 1983. Consequences of Party Reform. New York: Oxford UniversityPress.
Ranney, Austin. 1968. \Representativeness of Primary Electorates." Midwest Journal ofPolitical Science 12: 224-238.
Sartori, Giovanni. 1976. Parties and Party Systems. New York: Cambridge UniversityPress.
Smith v. Allright, 321 U.S. 649 (1944).
Schantz, Harvey L. 1980. \Contested and Uncontested Primaries for the U.S. House,"Legislative Studies Quarterly 5: 545-562.
Sorauf, Frank J. 1972. Party Politics in America. 2nd Edition. Boston: Little Brown.
Turner, Julius. 1953. \Primary Elections as the Alternative to Party Competition in `Safe'Districts." Journal of Politics. 15 (2): 197-210.
United States v. Classic, 313 U.S. 299 (1941).
Ware, Alan. 1987. Ciizens, Parties, and the State. Princeton: Princeton University Press.
Westlye, Mark C. 1991. Senate Elections and Campaign Intensity. Baltimore: JohnsHopkins University Press.
26
Williams v. Rhodes, 393 U.S. 23 (1968).
Zaller, John. 1998. \Politicians as Prize Fighters: Electoral Selection and IncumbencyAdvantage." In Politicians and Party Politics, edited by John G. Geer. Baltimore:Johns Hopkins University Press.
27
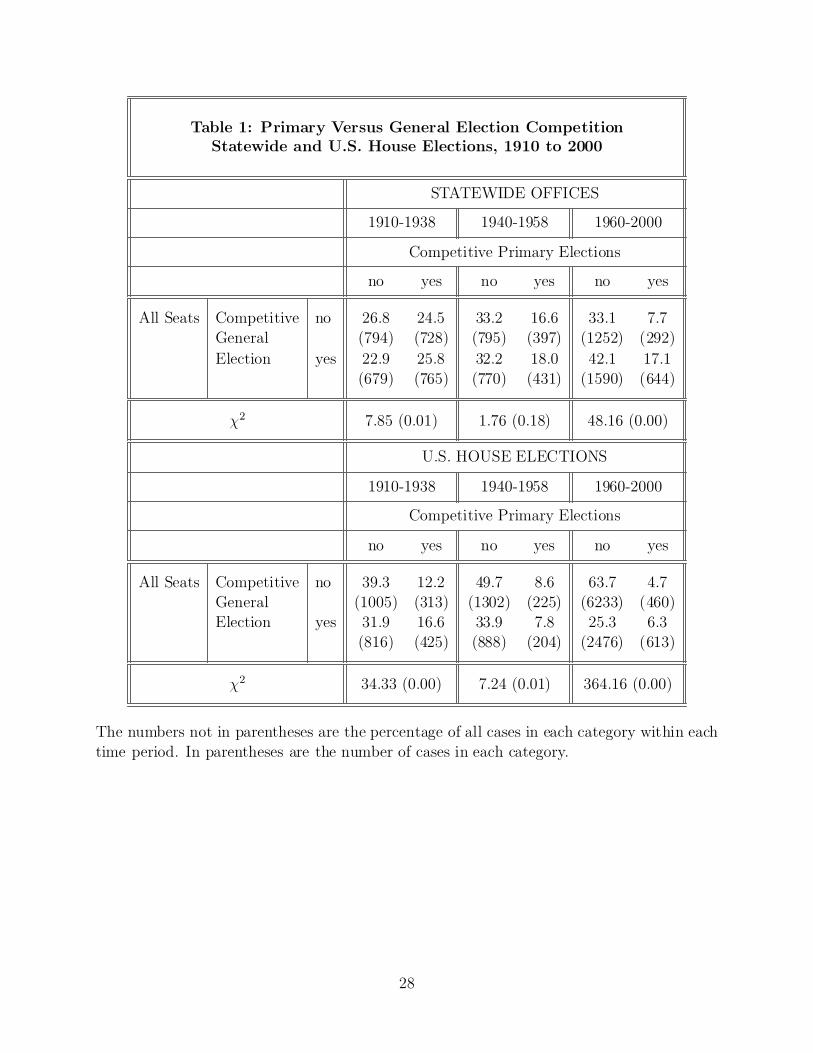
Table 1: Primary Versus General Election CompetitionStatewide and U.S. House Elections, 1910 to 2000
STATEWIDE OFFICES
1910-1938 1940-1958 1960-2000
Competitive Primary Elections
no yes no yes no yes
All Seats Competitive no 26.8 24.5 33.2 16.6 33.1 7.7General (794) (728) (795) (397) (1252) (292)Election yes 22.9 25.8 32.2 18.0 42.1 17.1
(679) (765) (770) (431) (1590) (644)
Â2 7.85 (0.01) 1.76 (0.18) 48.16 (0.00)
U.S. HOUSE ELECTIONS
1910-1938 1940-1958 1960-2000
Competitive Primary Elections
no yes no yes no yes
All Seats Competitive no 39.3 12.2 49.7 8.6 63.7 4.7General (1005) (313) (1302) (225) (6233) (460)Election yes 31.9 16.6 33.9 7.8 25.3 6.3
(816) (425) (888) (204) (2476) (613)
Â2 34.33 (0.00) 7.24 (0.01) 364.16 (0.00)
The numbers not in parentheses are the percentage of all cases in each category within eachtime period. In parentheses are the number of cases in each category.
28
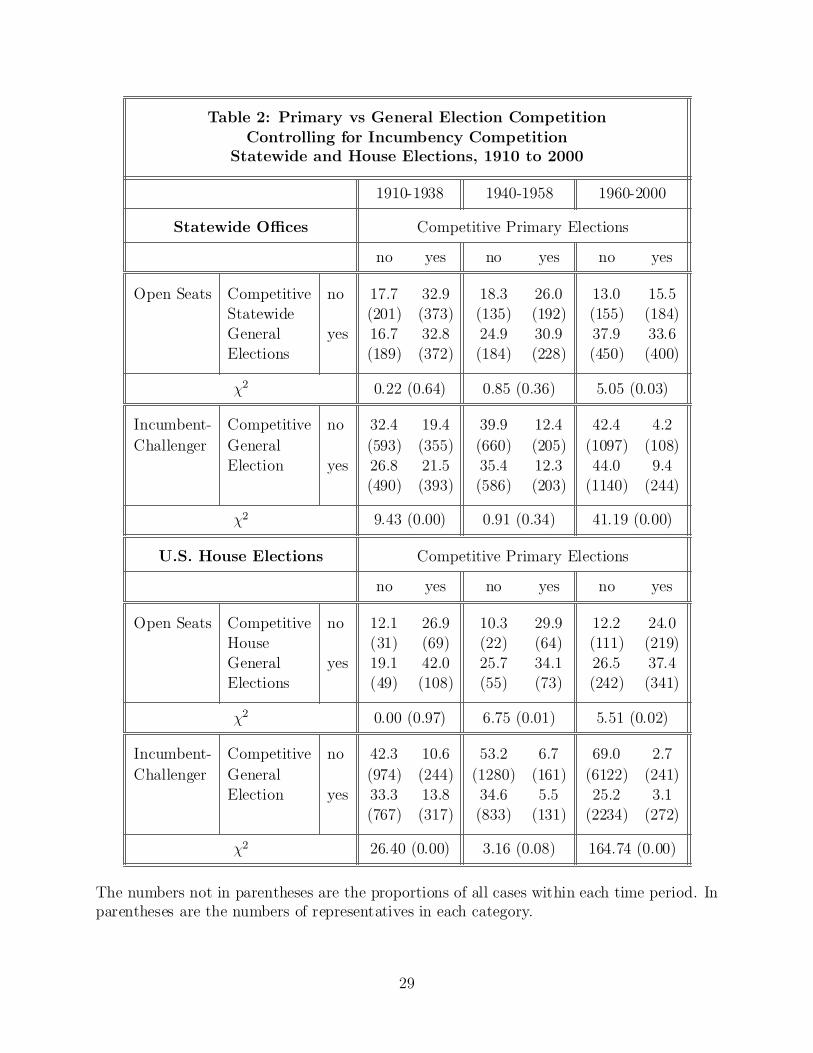
Table 2: Primary vs General Election CompetitionControlling for Incumbency Competition
Statewide and House Elections, 1910 to 2000
1910-1938 1940-1958 1960-2000
Statewide O±ces Competitive Primary Elections
no yes no yes no yes
Open Seats Competitive no 17.7 32.9 18.3 26.0 13.0 15.5Statewide (201) (373) (135) (192) (155) (184)General yes 16.7 32.8 24.9 30.9 37.9 33.6Elections (189) (372) (184) (228) (450) (400)
Â2 0.22 (0.64) 0.85 (0.36) 5.05 (0.03)
Incumbent- Competitive no 32.4 19.4 39.9 12.4 42.4 4.2Challenger General (593) (355) (660) (205) (1097) (108)
Election yes 26.8 21.5 35.4 12.3 44.0 9.4(490) (393) (586) (203) (1140) (244)
Â2 9.43 (0.00) 0.91 (0.34) 41.19 (0.00)
U.S. House Elections Competitive Primary Elections
no yes no yes no yes
Open Seats Competitive no 12.1 26.9 10.3 29.9 12.2 24.0House (31) (69) (22) (64) (111) (219)General yes 19.1 42.0 25.7 34.1 26.5 37.4Elections (49) (108) (55) (73) (242) (341)
Â2 0.00 (0.97) 6.75 (0.01) 5.51 (0.02)
Incumbent- Competitive no 42.3 10.6 53.2 6.7 69.0 2.7Challenger General (974) (244) (1280) (161) (6122) (241)
Election yes 33.3 13.8 34.6 5.5 25.2 3.1(767) (317) (833) (131) (2234) (272)
Â2 26.40 (0.00) 3.16 (0.08) 164.74 (0.00)
The numbers not in parentheses are the proportions of all cases within each time period. Inparentheses are the numbers of representatives in each category.
29
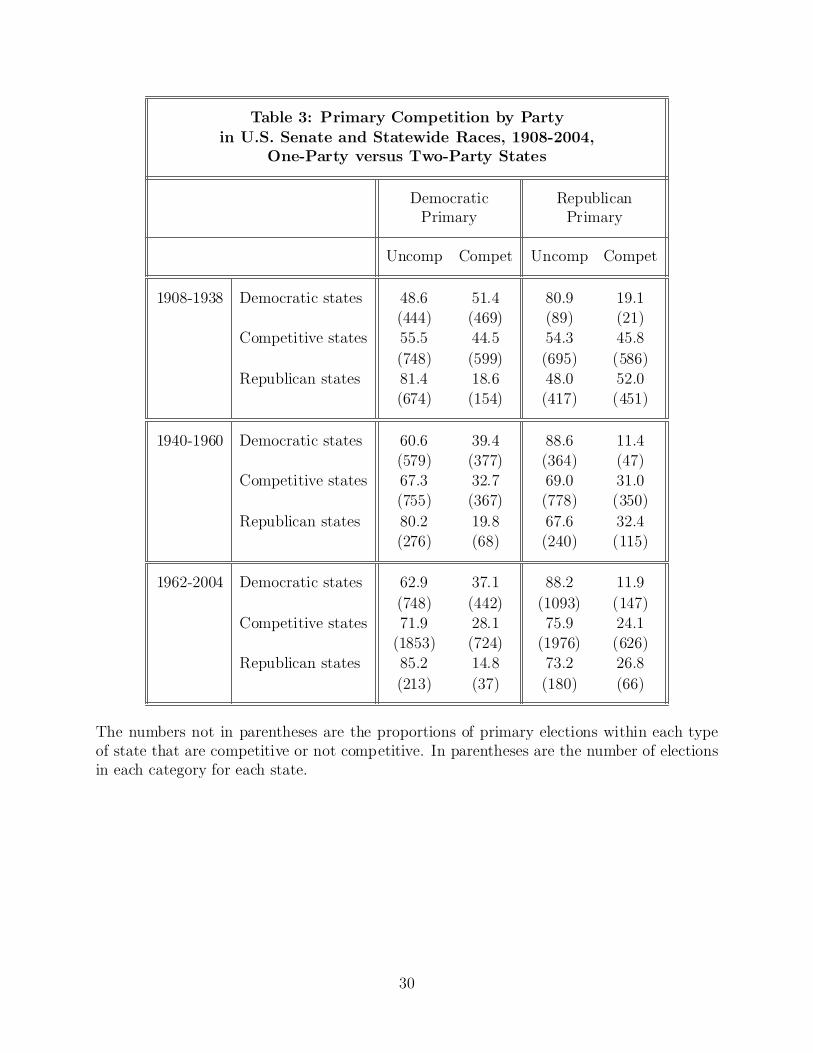
Table 3: Primary Competition by Partyin U.S. Senate and Statewide Races, 1908-2004,
One-Party versus Two-Party States
Democratic RepublicanPrimary Primary
Uncomp Compet Uncomp Compet
1908-1938 Democratic states 48.6 51.4 80.9 19.1(444) (469) (89) (21)
Competitive states 55.5 44.5 54.3 45.8(748) (599) (695) (586)
Republican states 81.4 18.6 48.0 52.0(674) (154) (417) (451)
1940-1960 Democratic states 60.6 39.4 88.6 11.4(579) (377) (364) (47)
Competitive states 67.3 32.7 69.0 31.0(755) (367) (778) (350)
Republican states 80.2 19.8 67.6 32.4(276) (68) (240) (115)
1962-2004 Democratic states 62.9 37.1 88.2 11.9(748) (442) (1093) (147)
Competitive states 71.9 28.1 75.9 24.1(1853) (724) (1976) (626)
Republican states 85.2 14.8 73.2 26.8(213) (37) (180) (66)
The numbers not in parentheses are the proportions of primary elections within each typeof state that are competitive or not competitive. In parentheses are the number of electionsin each category for each state.
30
Table A1: Elected O±ces and Data Sources for Each State
O±ces Elected in One or More Years Sources
AL LG, SS, AG, Tr, Au, E, Ag, PU, Gm, O±cial and Statistical RegisterAK O±cial ReturnsAZ SS, AG, Tr, Au, E, Co, M, Tx, J Year Book; O±cial Canvass; Bill Turnbow's
AZ Political AlmanacAR LG, SS, AG, Tr, Au, E, Ag, Ld, PU, J O±cial Register; AR ElectionsCA LG, SS, AG, Tr, Au, E, I, Ld, Pr, Ck,
JStatement of Vote; CA Blue Book
CO LG, SS, AG, Tr, Au, E, Rg, PU, J Abstract of Votes CastCT LG, SS, AG, Tr, Au Statement of Vote; Register and ManualDE LG, AG, Tr, Au, I State Manual; O±cial Results of Primary
ElectionsFL SS, AG, Tr, Au, E, Ag, PU, J Report of Sec. of StateGA LG, SS, AG, Tr, Au, E, Ag, PU, Lb, I,
Pn, JO±cial and Statistical Register
HI LG Result of Votes CastID LG, SS, AG, Tr, Au, E, M, J Abstract of Votes; Biennial Report of Sec. of
StateIL LG, SS, AG, Tr, Au, E, Ck, Rg O±cial Vote; Blue Book of State of ILIN LG, SS, AG, Tr, Au, E, Ld, Ck, St, J Report of Sec. of State; Yearbook of State of
INIA LG, SS, AG, Tr, Au, E, Ag, Cm, Ck, J O±cial Register; Canvass of the VoteKS LG, SS, AG, Tr, Au, E, I, PU, Pr, J O±cial Statement of Vote Cast; Biennial
Report of Sec. of StateKY LG, SS, AG, Tr, Au, E, Ag, Ld, Ck Statement of O±cial Vote; KY Votes; O±-
cial Primary and General Election ReturnsLA LG, SS, AG, Tr, Au, E, I, Ag, Ld, El Biennial Report of Sec. of State; Compila-
tion of Primary Election ReturnsMD LG, AG, Au, Ck Compilation of Election Returns; MD Man-
ualME Au O±cial Vote; Statement of VoteMA LG, SS, AG, Tr, Au Election Statistics; Number of Assessed
PollsMI LG, SS, AG, Tr, Au, E, Ag, Ld, Rg,
Hy, JMI Manual; O±cial Directory and Leg.Manual
MN LG, SS, AG, Tr, Au, PU, Ck, J MN Legislative Manual
31
Table A1, continued
O±ces Elected in One or More Years Sources
MS LG, SS, AG, Tr, Au, E, Ag, Ld, I, Ck,Tx, J
O±cial and Statistical Register; MS BlueBook
MO LG, SS, AG, Tr, Au, E, PU, J O±cial Vote of the State of MO; Roster ofState and District O±cers; O±cial Manual
MT LG, SS, AG, Tr, Au, E, PU, Ck, J O±cial Primary Election Returns; MT Pol-itics Since 1864
NE LG, SS, AG, Tr, Au, E, PU, Ld, J O±cial Report of the State CanvassingBoard
NV LG, SS, AG, Tr, Au, E, M, Ld, Ck, Pr,Rg, J
Political History of Nevada; O±cial Returns
NH Manual for the General CourtNJ NJ Election Returns; NJ ManualNM LG, SS, AG, Tr, Au, E, Ld, Co, J Blue Book; O±cial ReturnsNY LG, SS, AG, Tr, Au, Ld, J NY Red Book; Primary Election VoteNC LG, SS, AG, Tr, Au, E, Co, Ag, Lb, I,
JNC Manual
ND LG, SS, AG, Tr, Au, E, Ag, PU, Lb, I,Tx, J
O±cial Abstract of Vote Cast; Compilationof Election Returns; ND Election Statistics
OH LG, SS, AG, Tr, Au, E, Ag, Ck, PW, J OH Election StatisticsOK LG, SS, AG, Tr, Au, E, Co, Ag, Lb,
Ld, I, M, CC, Ck, JDirectory of the State of Oklahoma; O±-cially Veri¯ed Returns
OR SS, AG, Tr, E, Ag, PU, Lb, Pr, J Blue Book; O±cial Abstract of VotesPA LG, SS, AG, Tr, Au, J State Manual (Smulls Handbook); O±cial
ResultsRI LG, SS, AG, Tr O±cial Count of the Ballots CastSC LG, SS, AG, Tr, Au, E, Ag, PU, Aj Supplem. Report of Sec. of State; SC Leg.
ManualSD LG, SS, AG, Tr, Au, E, PU, Ld, Lb, J O±cial Election Returns; SD Leg. ManualTN PU, J Directory and O±cial Vote; TN Blue BookTX LG, AG, Tr, Au, E, Ag, PU, Ld, J Returns of an Election Held; TX AlmanacUT LG, SS, AG, Tr, Au, E, J Abstract of Vote
32
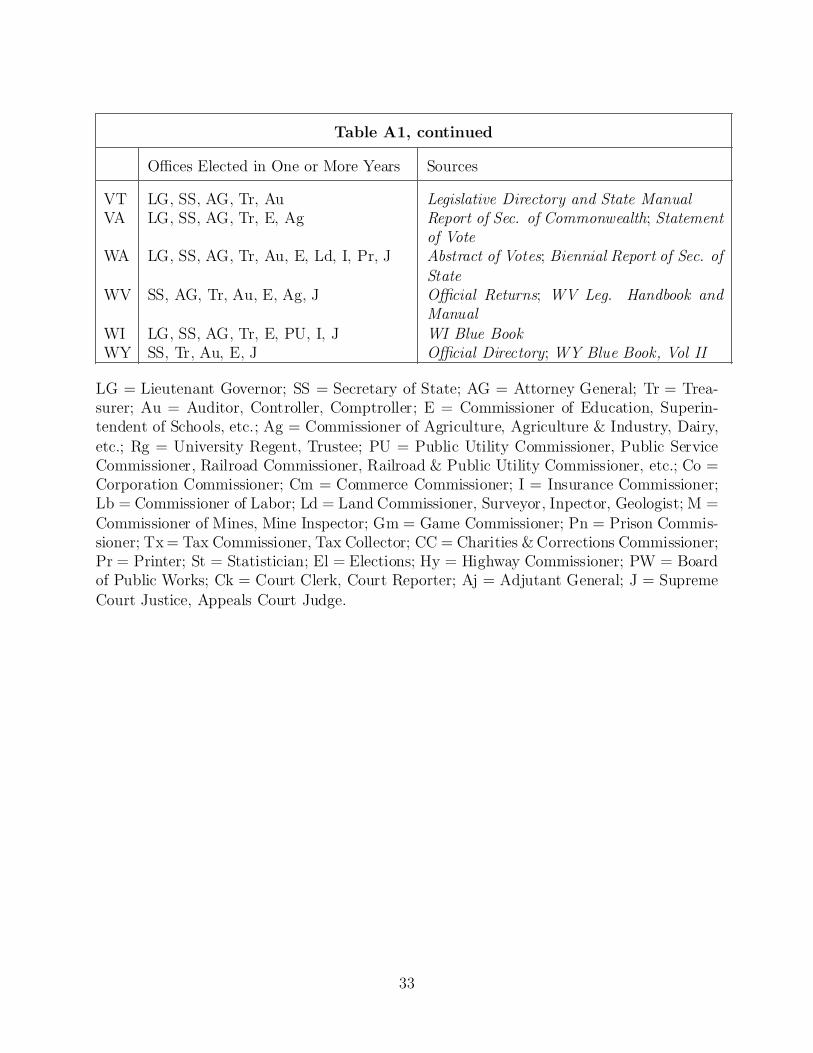
Table A1, continued
O±ces Elected in One or More Years Sources
VT LG, SS, AG, Tr, Au Legislative Directory and State ManualVA LG, SS, AG, Tr, E, Ag Report of Sec. of Commonwealth; Statement
of VoteWA LG, SS, AG, Tr, Au, E, Ld, I, Pr, J Abstract of Votes; Biennial Report of Sec. of
StateWV SS, AG, Tr, Au, E, Ag, J O±cial Returns; WV Leg. Handbook and
ManualWI LG, SS, AG, Tr, E, PU, I, J WI Blue BookWY SS, Tr, Au, E, J O±cial Directory; WY Blue Book, Vol II
LG = Lieutenant Governor; SS = Secretary of State; AG = Attorney General; Tr = Trea-surer; Au = Auditor, Controller, Comptroller; E = Commissioner of Education, Superin-tendent of Schools, etc.; Ag = Commissioner of Agriculture, Agriculture & Industry, Dairy,etc.; Rg = University Regent, Trustee; PU = Public Utility Commissioner, Public ServiceCommissioner, Railroad Commissioner, Railroad & Public Utility Commissioner, etc.; Co =Corporation Commissioner; Cm = Commerce Commissioner; I = Insurance Commissioner;Lb = Commissioner of Labor; Ld = Land Commissioner, Surveyor, Inpector, Geologist; M =Commissioner of Mines, Mine Inspector; Gm = Game Commissioner; Pn = Prison Commis-sioner; Tx = Tax Commissioner, Tax Collector; CC = Charities & Corrections Commissioner;Pr = Printer; St = Statistician; El = Elections; Hy = Highway Commissioner; PW = Boardof Public Works; Ck = Court Clerk, Court Reporter; Aj = Adjutant General; J = SupremeCourt Justice, Appeals Court Judge.
33
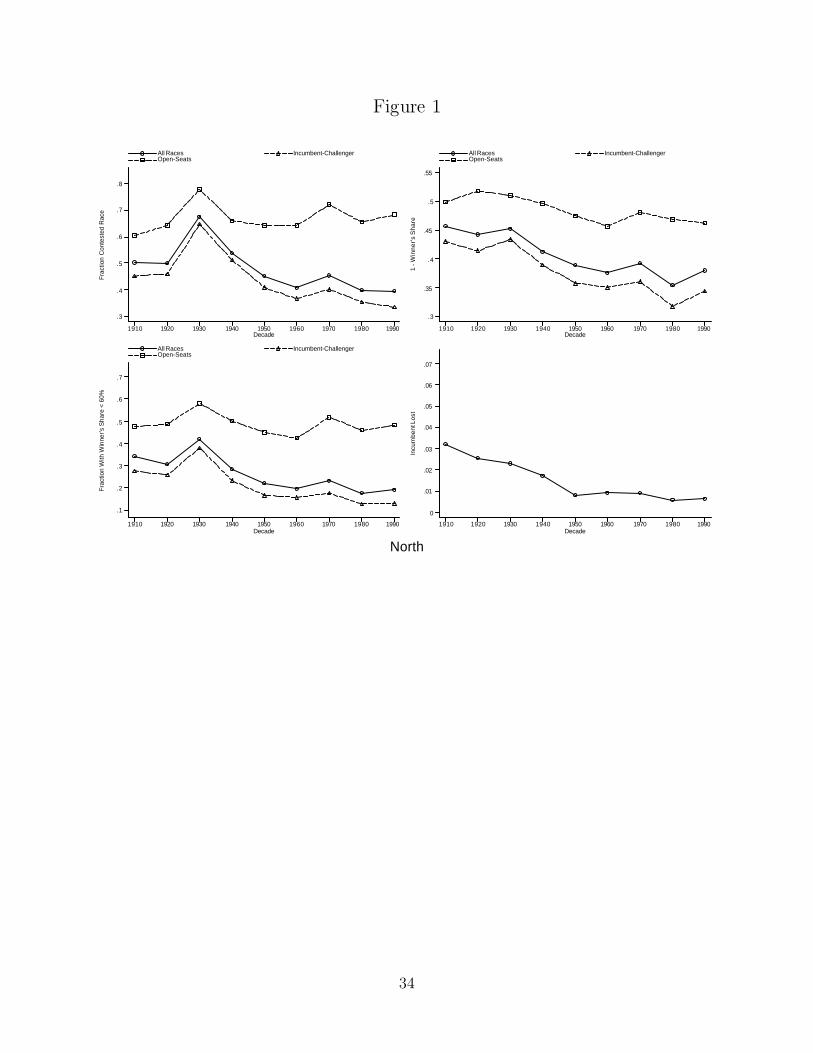
Figure 1
North
Frac
tion
Con
test
ed R
ace
Decade
All Races Incumbent-Challenger Open-Seats
1910 1920 1930 1940 1950 1960 1970 1980 1990
.3
.4
.5
.6
.7
.8
1 - W
inne
r's S
hare
Decade
All Races Incumbent-Challenger Open-Seats
1910 1920 1930 1940 1950 1960 1970 1980 1990
.3
.35
.4
.45
.5
.55
Frac
tion
With
Win
ner's
Sha
re <
60%
Decade
All Races Incumbent-Challenger Open-Seats
1910 1920 1930 1940 1950 1960 1970 1980 1990
.1
.2
.3
.4
.5
.6
.7
Incu
mbe
nt L
ost
Decade1910 1920 1930 1940 1950 1960 1970 1980 1990
0
.01
.02
.03
.04
.05
.06
.07
34
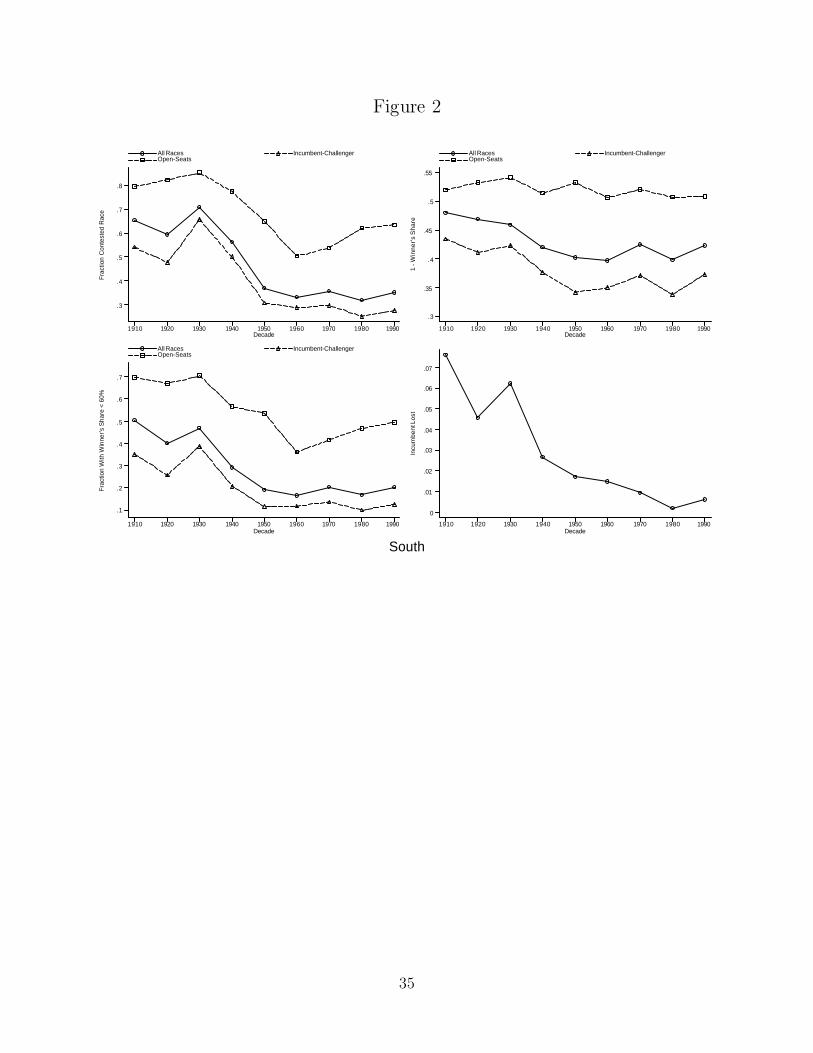
Figure 2
South
Frac
tion
Con
test
ed R
ace
Decade
All Races Incumbent-Challenger Open-Seats
1910 1920 1930 1940 1950 1960 1970 1980 1990
.3
.4
.5
.6
.7
.8
1 - W
inne
r's S
hare
Decade
All Races Incumbent-Challenger Open-Seats
1910 1920 1930 1940 1950 1960 1970 1980 1990
.3
.35
.4
.45
.5
.55
Frac
tion
With
Win
ner's
Sha
re <
60%
Decade
All Races Incumbent-Challenger Open-Seats
1910 1920 1930 1940 1950 1960 1970 1980 1990
.1
.2
.3
.4
.5
.6
.7
Incu
mbe
nt L
ost
Decade1910 1920 1930 1940 1950 1960 1970 1980 1990
0
.01
.02
.03
.04
.05
.06
.07
35


![REEVES Contested Trajectories[1]](https://img.pdfslide.net/doc/110x75/577d1d011a28ab4e1e8b6ad7/reeves-contested-trajectories1.jpg)