Embed Size (px)
Citation preview

Journal of Criminal Law and CriminologyVolume 95Issue 2 Winter Article 3
Winter 2005
The Decline of the Juvenile Death Penalty:Scientific Evidence of Evolving NormsJeffrey Fagan
Valerie West
Follow this and additional works at: https://scholarlycommons.law.northwestern.edu/jclc
Part of the Criminal Law Commons, Criminology Commons, and the Criminology and CriminalJustice Commons
This Symposium is brought to you for free and open access by Northwestern University School of Law Scholarly Commons. It has been accepted forinclusion in Journal of Criminal Law and Criminology by an authorized editor of Northwestern University School of Law Scholarly Commons.
Recommended CitationJeffrey Fagan, Valerie West, The Decline of the Juvenile Death Penalty: Scientific Evidence of Evolving Norms, 95 J. Crim. L. &Criminology 427 (2004-2005)
0091-4169/05/9502-0427THE JOURNAL OF CRIMINAL LAW & CRIMINOLOGY Vol. 95, No. 2Copyright 0 2005 by Northwestern University, School of Law Printed in US.A.
THE DECLINE OF THE JUVENILE DEATHPENALTY: SCIENTIFIC EVIDENCE OF
EVOLVING NORMS
JEFFREY FAGAN* AND VALERIE WESTt
I. INTRODUCTION
Shortly after the U.S. Supreme Court issued its decision in Atkins v.Virginia1 holding that the execution of mentally retarded persons violatedthe Eighth Amendment, legal scholars, advocates, and journalists began tospeculate that the Court would next turn its attention to the question of theexecution of persons who were juveniles-below eighteen years of age-fat the time they committed homicide. Following the Atkins decision, fourJustices expressed the view that the rationale of Atkins also supported theconclusion that execution of juvenile offenders was unconstitutional.2 Aconstitutional test of capital punishment for juveniles was inevitable.
The Atkins Court held that capital punishment was an uncon-stitutionally cruel and unusual punishment for the mentally retarded for tworeasons. First, the Court concluded that the impairments associated withmental retardation both reduced the culpability of the mentally retarded,making death a disproportionate punishment for them, and created a"special risk of wrongful execution."3 Second, the Court found that anational consensus had emerged that death is an excessive punishment for
" Professor of Law and Public Health, Columbia University. Thanks to the WallaceGlobal Fund, the Open Society Institute, and Columbia Law School for their generoussupport. Excellent research assistance was provided by Gabriel Miller, Monica Shah, andAmanda Beth Geller.
t Research Analyst, Mailman School of Public Health, Columbia University, andDoctoral Candidate, Department of Sociology, New York University.
1 536 U.S. 304 (2002).2 See In re Stanford, 537 U.S. 968 (2002) (Stevens, J., dissenting from denial of petition
for writ of habeas corpus) (joined by Justices Souter, Ginsburg, and Breyer); see alsoPatterson v. Texas, 536 U.S. 984 (2002) (Stevens, J., dissenting from denial of certiorari); id.(Ginsburg, J., dissenting from denial of certiorari) (joined by Justice Breyer).
' Atkins, 536 U.S. at 320-21.

JEFFREY FAGAN& VALERIE WEST
the mentally retarded.4
As evidence of that national consensus, the Court pointed to thegrowing number of states that expressly barred the imposition of the deathpenalty on the mentally retarded: since 1989, when the Court had lastconsidered the constitutionality of executing the mentally retarded,5 thenumber of states with such legislation had grown from two to eighteen.6 Inaddition, the Court observed that, even in states where the death penaltywas theoretically a permissible punishment for the mentally retarded, it wasrarely imposed: since 1989, only five states had executed offenders knownto be mentally retarded.7
Like the question of execution of the mentally retarded, the question ofthe constitutionality of the death penalty for juveniles was last visited by theSupreme Court in 1989. That year, in Stanford v. Kentucky,8 the Courtconcluded that the death penalty was not inherently disproportionate to theculpability of adolescents and that individualized assessments could reliablysort out which juveniles were sufficiently morally culpable.9 And it heldthat no national consensus barred the imposition of capital punishment onsixteen- or seventeen-year-old juveniles.l°
The Supreme Court returned to the juvenile death penalty in January2004 when it granted certiorari to review the Missouri Supreme Court'sdecision in Simmons v. Roper." In Simmons, the Missouri Supreme Courtrelied on the logic of Atkins to hold that the execution of persons whocommitted homicide before reaching their eighteenth birthday isunconstitutional. 12 The Court cited the immaturity and consequent reducedculpability of juvenile offenders, 13 plus the special risk of wrongfulexecution for juvenile offenders, due in part to the risk of false confession. 14
In addition, the Simmons court concluded that, since Stanford was decidedin 1989, a national consensus had emerged opposing the death penalty forjuvenile offenders. 5 Evidence of this consensus was found in both the
4 Id. at 316.5 See Penry v. Lynaugh, 492 U.S. 302 (1989).6 See Atkins, 536 U.S. at 314-15.7 Id. at 316.8 492 U.S. 361 (1989).
9 Id. at 374-77.'o Id. at 370-71." 112 S.W.3d 397 (Mo. 2003), cert. granted, 72 U.S.L.W. 3487 (U.S. Jan. 26, 2004)
(No. 03-633).12 Id. at 399-400.13 Id. at 412.
14 Id. at 413.15 Id.
[Vol. 95
2005] DECLINE OF THE JUVENILE DEATH PENALTY 429
increasing number of states that ban the juvenile death penalty by statuteand the infrequency with which juries now impose the punishment of deathon juvenile offenders even in jurisdictions where it is legislativelyauthorized.16 On March 1, 2005, the U.S. Supreme Court voted 5-4 toaffirm the Missouri Supreme Court's ruling in Simmons.' 7 The Court'sdecision relied on social science evidence of the reduced culpability ofjuveniles and the declining use of the juvenile death penalty to ban the useof the death penalty for persons who commit capital homicide beforereaching the age of eighteen.1
8
At the time of the Simmons decision, a growing body of research hasaddressed the issues of juveniles' lesser culpability and greater risk ofwrongful execution. 19 In contrast, discussions of the declining use of thedeath penalty against juveniles have been largely descriptive. This articleprovides statistical analyses of the available data regarding changes in theuse of the death penalty for juveniles over time, and analyzes data on thepatterns of decisions by judges and juries to illustrate the Simmons Court'sconclusions on the consensus opposing the execution of minors.
The number of juvenile death sentences has declined sharply since1994, when eighteen juveniles were sentenced to death.20 In 2003, only two
16 See id. at 408-10.17 Roper v. Simmons, No. 03-633, 2005 WL 464890, at *18 (U.S. Mar. 1, 2005).18 ld. at *11, *'*16-17
19 See, e.g., Mary Beckman, Crime, Culpability and the Adolescent Brain, 305 SCIENCE596 (2004) (describing recent neuropsychological studies showing that development ofcritical frontal lobe brain functions related to impulse control, decision making andreasoning is incomplete at age eighteen, and may not be completed until age twenty-one orlater); Jeffrey Fagan, Atkins, Adolescence and the Maturity Heuristic: Rationales for aCategorical Exemption for Juveniles from Capital Punishment, 33 N.M. L. REV. 207 (2003)(discussing evidence of juveniles' immaturity and the risk of false confessions and the riskof error in attempts to assess individual juveniles' culpability); Elizabeth S. Scot &Laurence Steinberg, Blaming Youth, 81 TEX. L. REV. 799 (2002) (on the diminishedculpability of adolescents owing to their deficits in psycho-social maturity, and the need forlaw to accommodate these facts); David S. Tanenhaus & Steven A. Drizin, "Owing to theExtreme Youth of the Accused": The Changing Legal Response to Juvenile Homicide, 92 J.CRIM. L. & CRIMINOLOGY 641, 671-89 (2003) (on the special risk of false confessions foradolescents).
20 See Victor L. Streib, The Juvenile Death Penalty Today: Death Sentences andExecutions for Juvenile Crimes, January 1, 1973-December 31, 2004, at 9 tbl.3, availableat http://www.law.onu.edu/faculty/streib/documents/JuvDeathDec2004.pdf (updated Jan. 21,2005) [hereinafter Streib, December]; see also Victor Streib, The Juvenile Death PenaltyToday: Death Sentences and Executions for Juvenile Crimes January 1, 1973-June 30, 2004,available at http://www.law.onu.edu/faculty/streib/documents/JuvDeathJune302004NewTables.pdf (updated July 1, 2004) [hereinafter Streib, June]; Victor Streib, The JuvenileDeath Penalty Today: Death Sentences and Executions for Juvenile Crimes, January 1,1973-April 30, 2004, available at http://www.law.onu.edu/faculty/streib/JuvDeathApr

JEFFREYFAGAN& VALERIE WEST
juveniles were sentenced to death, and one of these was a re-sentencefollowing a reversal of a previous sentence; in 2004, two juveniles weresentenced to death.2 Adult death sentences have declined at a slower paceduring this time, from a recent peak of 320 in 1996 to 143 in 2003.22
The decline in the number of juvenile death sentences since Stanfordmay simply reflect a lower juvenile homicide arrest rate and a reducedsupply of juvenile defendants eligible for death sentences. But the declinein juvenile death sentences may also signal the emergence of a societalnorm against the imposition of capital punishment on juvenile offenders,expressed through juries' sentencing decisions, prosecutors' decisions notto seek death sentences for juvenile offenders, or both.23
In order to evaluate these competing explanations for the decline injuvenile death sentences, we first conducted a descriptive analysis of trendsover time, considering both the absolute number of death sentencesimposed on juvenile offenders and the rate at which juvenile offenders are
302004.pdf (updated May 4, 2004) [hereinafter Streib, April].
21 Id. at 9 tbl.3, 21, 23. In 2004, two juveniles were sentenced to death. See id. at 9 tbl.3,
21, 23, 28. The data necessary to place these recent sentences in context, such as thejuvenile homicide arrest rate, will not be available until the end of the year. Accordingly, wedo not include these juvenile death sentences in the analyses infra.
Nevertheless, we do not anticipate that the inclusion of these two 2004 cases will alterthe trends we identify in Parts III and IV. A fluctuation of one juvenile death sentence oreven two in a single year is expected within trends of longer duration, and does not changethe statistical identification of a continuous trend of decline over time. Such fluctuations areknown in social science and financial economics as "random walks," a process consisting ofa sequence of discrete steps of fixed length and limited duration. See BARRY D. HUGHES,RANDOM WALKS AND RANDOM ENVIRONMENTS, VoL. 1: RANDOM WALKS (1995). Randomwalks follow a normal distribution, with a probability greater than 95% that the process willreturn to its initial starting point or take no more than one standardized step in any directionfrom its origin. See Eric W. Weisstein, Random Walk-l-Dimensional, MATHWORLD,available at http://mathworld.wolfram.com/RandomWalkl-Dimensional.html (last visitedJan. 14, 2005). In a random walk, these discrete steps occur within longer statistical trends,and do not predict the onset of an increase or decline that would alter the identification of acontinuous time trend. For example, burglary rates in the United States have declined from110 burglaries per 1,000 households in 1973 to 27.7 in 2002. See BUREAU OF JUSTICESTATISTICS, U.S. DEP'T OF JUSTICE, NATIONAL CRIME VICTIMIZATION SURVEY PROPERTYCRIME TRENDS, 1973-2002, available at http://www.ojp.usdoj.gov/bjs/glance/tables/proptrdtab.htm (last visited Jan. 14, 2005). Within this twenty year period when burglaryrates declined more than seventy-five percent, one-year increases in the burglary rate weremeasured in four of the twenty years. Id.
22 Death Penalty Information Center, Death Sentences By Year, 1973 - 2003, available atwww.deathpenaltyinfo.org/article.php?scid=9&did=873 (last visited Jan. 14, 2005). Thefigure for 2003 represents the projected number of death sentences for that year. Id.
23 See David 0. Brink, Immaturity, Normative Competence, and Juvenile Transfer: How
(Not) to Punish Minors for Major Crimes, 82 TEX. L. REV. 1555 (2004). See generallyFagan, supra note 19.
[Vol. 95

2005] DECLINE OF THE JUVENILE DEATH PENALTY 431
sentenced to death (indexed to the homicide rate and to the rate at whichjuveniles are arrested for homicide). We then performed a multivariateanalysis to determine whether the decline in the use of the juvenile deathpenalty is statistically significant after controlling for other competingexplanations. These analyses provide an empirical foundation fordetermining whether the striking decline in the use of the juvenile deathpenalty reflects an emerging societal norm opposing the punishment ofdeath penalty for persons who committed their crimes before the age ofeighteen.
II, THE JURISPRUDENCE OF EVOLVING NORMS IN THE JUVENILE DEATHPENALTY
Evolving norms and standards are at the heart of Eighth Amendmentjurisprudence. The Supreme Court has often stated that "[t]he Amendmentmust draw its meaning from the evolving standards of decency that markthe progress of a maturing society. 24 Accordingly, a punishment may beunconstitutionally cruel and unusual under the Eighth Amendment if thereis a current societal consensus against the imposition of that punishment.Indicia of evolving standards were set forth in Coker v. Georgia,25 wherethe Supreme Court charted future deliberations on this question by statingthat evolving standards should be measured by "objective factors to themaximum possible extent. ' 26 Coker and subsequent cases have reliedprimarily on two objective factors to assess societal consensus with regardto the death penalty: (1) state legislation, and (2) sentencing decisions byjuries.27 We briefly consider the first factor and then turn to the second,which is the focus of this article.
A. STATE LEGISLATION
State legislation demonstrates that a growing number of states opposecapital punishment for juveniles. In the fifteen years since the Stanforddecision, no state has lowered its age threshold for the juvenile deathpenalty from eighteen years of age to seventeen or sixteen, althoughStanford set the lower boundary for a death sentence at sixteen.28 Instead,during this period, six states prohibited capital punishment for juveniles by
24 See, e.g., Atkins v. Virginia, 536 U.S. 304, 311-12 (2002); Trop v. Dulles, 356 U.S.86, 101 (1958) (plurality).
2' 433 U.S. 584 (1977).
26 Id. at 592.27 See id.; Atkins, 536 U.S. at 314-16.28 See Stanford v. Kentucky, 492 U.S. 361 (1989).

JEFFREY FAGAN & VALERIE WEST
statute: Kansas (1994),29 New York (1995),3 0 Montana (1999),31 Indiana(2002),32 South Dakota (2004),33 and Wyoming (2004).34 In addition, theWashington Supreme Court's 1993 Furman decision interpretedWashington's death-penalty statute as excluding the death penalty forpersons under eighteen.35 Including the eleven states that had legislativelyprohibited the juvenile death Penalty prior to the Stanford decision,eighteen of the thirty-eight states that permit the death penalty nowexpressly bar its use for offenders under the age of eighteen.36 Thirteenjurisdictions bar the death penalty altogether. 37
Other states have passed legislative bans on the juvenile death penaltyin one or both houses of their state legislatures, a trend that the SupremeCourt noted in Atkins as states moved to ban execution of mentally retardeddefendants.38 In 2004, New Hampshire passed legislation in both housesbanning the juvenile death penalty, but the governor vetoed the legislation.And in two of the three most active juvenile death sentencing states,39
Texas (2002) and Florida (2001, 2002, and again in 2004), one house of thestate legislature voted to ban death sentences for juveniles. Theselegislative developments suggest a societal trend away from use of thedeath penalty for offenders under eighteen.
B. JURY SENTENCING DECISIONS
In addition to looking at state legislation, the Supreme Court hasconsistently examined data on jury sentencing decisions in order toascertain the existence of a societal consensus against the use of the deathpenalty for a particular group.
In Coker v. Georgia,40 the Court explained:
[T]he jury... is a significant and reliable objective index of contemporary values
29 See KAN. STAT. ANN. § 21-4622 (1995).
30 See N.Y. PENAL LAW § 125.27 (2004).
31 See MONT. CODE ANN. § 45-5-102 (2004).32 See IND. CODE ANN. § 35-50-2-3 (2004).33 See S.D. CODIFIED LAWS § 23A-27A-42 (2004).34 See WYO. STAT. ANN. § 6-2-101(b) (2004).35 See State v. Furman, 858 P.2d 1092, 1103 (1993).36 See Streib, December, supra note 20, at 7 tbl.2. The eleven states that prohibited the
juvenile death penalty prior to Stanford are California, Colorado, Connecticut, Illinois,Maryland, Nebraska, New Jersey, New Mexico, Ohio, Oregon, and Tennessee. See id.Missouri is included in the eighteen states barring the death penalty for juveniles.
31 See id.38 See Atkins v. Virginia, 536 U.S. 340, 315 (2002).39 See infra Tables 6 and 7 and Figures 4a and 4b.40 433 U.S. 584 (1977).
[Vol. 95

2005] DECLINE OF THE JUVENILE DEATH PENALTY 433
because it is so directly involved."... [I]t is thus important to look to the sentencingdecisions that juries have made in the course of assessing whether capital punishmentis an appropriate penalty for the crime being tried.4 1
Accordingly, in support of its holding that the death penalty is anexcessive punishment for the crime of rape of an adult woman,4 2 the Courtrelied in part on the fact that between 1973 and 1.977, Georgia juries hadsentenced defendants to death for the crime of rape only six times.43
In Enmund v. Florida,4 the Court employed a similar analysis inholding that death was an unconstitutional punishment under thecircumstances of that case-involving an accomplice to a robbery in whichanother perpetrator shot and killed the robbery victims-for a defendantwho had neither killed nor intended to kill.45 The Court stated:
Society's rejection of the death penalty for accomplice liability in felony murders isalso indicated by the sentencing decisions that juries have made. As we havepreviously observed, "[t]he jury ... is a significant and reliable objective index ofcontemporary values because it is so directly involved." The evidence isoverwhelming that American juries have repudiated imposition of the death penaltyfor crimes such as petitioner's.
Similarly, in Thompson v. Oklahoma,a7 a plurality of the Court reliedon evidence that, between 1982 and 1986, only five of 1861 persons undersixteen who were arrested for homicide were sentenced to death to supportits conclusion that there was a societal consensus against the use of thedeath penalty for offenders under sixteen.a And most recently, in Atkins,the Court noted-as evidence of a national consensus against execution ofthe mentally retarded-that the execution of mentally retarded offenderswas "uncommon" and that only five states had executed defendants knownto be retarded since the Court's earlier decision in Penry.49
Consistent with the constitutional framework set out in these decisions,this article conducts an empirical examination of the frequency with whichjuries impose the death penalty on defendants who were under the age ofeighteen when they committed their crimes.
41 Id. at 596 (quoting Gregg v. Georgia, 428 U.S. 153, 181 (1976)).42 See id. at 592.43 See id. at 597.
' 458 U.S. 782 (1982).45 See id. at 801.46 Id. at 794 (quoting Coker, 433 U.S. at 596 (in turn quoting Gregg, 428 U.S. at 181))
(citations omitted).4' 487 U.S. 815 (1988).48 Id. at 832-33, 833 n.39.49 Atkins v. Virginia, 536 U.S. 304, 316 (2002).

JEFFREY FAGAN& VALERIE WEST
C. A NOTE ON PROSECUTORIAL DISCRETION
This article focuses on sentencing decisions by juries, and gauges therate at which juries sentence juvenile offenders to death by comparing thenumber of juvenile death sentences to the number of juvenile offendersarrested for homicide. Nevertheless, it should be noted that decisions byprosecutors as to whether to charge a particular defendant with a capitalcrime-which intervene between arrest and sentencing-will also influencethe rate at which juvenile offenders are sentenced to death.
As Justice O'Connor noted in her concurrence in Thompson, data onthe number of juvenile death sentences and the number of juvenilehomicide arrests, without more, "do not indicate how many juries havebeen asked to impose the death penalty for crimes committed [byjuveniles], or how many times prosecutors have exercised their discretion torefrain from seeking the death penalty in cases where the statutoryprerequisites might have been proved." 50 Justice O'Connor concluded that,in part for that reason, the sentencing statistics on which the Thompsonplurality relied were "not dispositive," even though they did "support theinference of a national consensus opposing the death penalty for 15-year-olds." 5'
Although data regarding charging decisions by prosecutors wouldcertainly give a fuller picture of the use of the juvenile death penalty, astatistically reliable analysis of the preferences of prosecutors across thestates that permit juvenile death sentences is probably beyond the capabilityof social science. Reliable and consistent data regarding prosecutors'decisions whether to seek the death penalty for juveniles are very hard toobtain, if they exist at all, for three reasons: (1) uncertainty about theexistence of comprehensive written records of the reasons for case-specificcharging decisions, (2) uncertainty that prosecutors will fully open theirrecords to analysis, and (3) uncertainty that age-specific factors are fullyacknowledged on the record in these decisions. Accordingly, it is notpossible, given the available data, to isolate accurately the separateinfluences of prosecutorial decision-making and jury decision-making onthe use of the juvenile death penalty.
We nevertheless believe that the data analyzed in this article providethe best available empirical foundation for an analysis of societal consensusregarding the juvenile death penalty. Although the data may reflectprosecutors', as well as juries', choices, those actions of prosecutors arerelevant to the calculus of evolving norms. Like the actions of juries,
50 Thompson, 487 U.S. at 853 (O'Connor, J., concurring in the judgment).S Id .
434 [Vol. 95

2005] DECLINE OF THE JUVENILE DEATH PENALTY 435
prosecutors' charging decisions reflect the will of the people. They respondto the interests of victims, as well as to the societal interest in seekingpunishments that are proportionate to the severity of the offense and thatrealize retributive concerns. For that reason, the Supreme Court stated inEnmund that "it would be relevant" to the constitutional analysis ofevolving standards "if prosecutors rarely sought the death penalty" for aparticular group of offenders, "for it would tend to indicate that prosecutors,who represent society's interest in punishing crime, consider the deathpenalty excessive" for that group of offenders.52
Moreover, as discussed further below, 53 the results of our multivariateanalysis demonstrate that the decline in the use of the juvenile death penaltyis statistically significant after controlling for the decline in the murder rate,the decline in the juvenile homicide arrest rate, the general decline in theuse of the death penalty, and measures of political pressure andpunitiveness that correlate with use of the death penalty. Accordingly, evenif some part of the decline is due to the choices of prosecutors, themultivariate analysis supports the conclusion that those choices were drivenby a specific societal norm against the juvenile death penalty, rather than byother social and political factors that might affect prosecutors.
D. SOCIAL AND LEGAL CONTEXTS: INNOCENCE AND THE DECLINE INJUVENILE DEATH SENTENCES
The decline in juvenile death sentences since 1999 is situated in awider social and historical context of a "crisis of confidence" in the deathpenalty in America. 54 Several challenges to the legitimacy and accuracy ofthe death penalty emerged within a relatively narrow and recent timeframethat eroded public confidence in the death penalty.55 The challengesconverged on revelations of high rates of substantive errors in the use of thedeath penalty, errors that led to reversals in many cases and over 100exonerations that in turn raised the awful specter of wrongful execution.Accordingly, we expanded our analyses to consider whether thesechallenges may have given pause to judges and juries in capital cases, andfurther suppressed the rate of juvenile death sentences per juvenilehomicide arrest.
52 Enmund v. Florida, 458 U.S. 782, 796 (1982)." See infra Part V.54 See, e.g., Joseph L. Hoffmann, Protecting the Innocent: The Massachusetts
Governor's Council Report, 95 J. CRIM. L. & CRIMINOLOGY 561 (2005).55 See, e.g., The Gallup Organization, Question: Do Your Favor or Oppose the Death
Penalty for Persons Convicted of... Murder (Sept. 11, 1988) (78.94%); The GallupOrganization, Question: Do Your Favor or Oppose the Death Penalty for Persons Convictedof... Murder (June 23, 2000) (65.63%).

JEFFREYFAGAN & VALERIE WEST
The decline in the use of the death penalty for both adults andjuveniles took place in the same narrow timeframe in which thesechallenges entered the nation's legal and political landscape. In thisSymposium, Professor Samuel Gross and his colleagues identify 205exonerations for murder in the United States from 1989 through 2003,including seventy-four for persons serving death sentences.56 Gross and hiscolleagues show that the rate of exonerations averaged twelve per year from1989-94, 57 then rose sharply beginning in the late 1990s, from thirteen in1998 to forty-three in 2001 and forty-four in 2003.58 The trends inexonerations mirror the trends juvenile death sentences. Juvenile deathsentences declined slowly after 1994, and then declined sharply beginningin 1999, from fifteen in 1999 to seven in 2000 and eventually to one newdeath sentence in 2003.59
The increase in exonerations through the 1990s paralleled therecurring and dramatic revelations of innocent men on death row both inIllinois and nationally in that decade. Illinois led the nation in totalexonerations from 1989 through 2003 with fifty-four, followed by NewYork with thirty-five, Texas with twenty-eight, and California with twenty-seven. 60 The Illinois exonerations first captured national attention in thelate 1990s. In 1996, the exonerations from death row of the "Ford Heights
56 Samuel R. Gross et al., Exonerations in the United States, 1989 Through 2003, 95 J.
CRIM. L. & CRIMINOLOGY 523 (2005) [hereinafter Gross et al., Exonerations]. The data usedin these analyses were obtained from an earlier version of this paper. Samuel Gross et al.,Exonerations in the United States 1989 through 2003, app. at 27-31 (Apr. 19, 2004),available at http://www.law.umich.edu/NewsAndlnfo/exonerations-in-us.pdf (on file withauthors) [hereinafter Gross et al., Exonerations early draft]. The results reported in SectionV.B.2. infra are based on this version of the Gross et al. article, in which the authorsdiscussed 328 exonerations. In the Symposium publication, the authors updated theirresearch and modified their findings, reporting 340 exonerations. The additional twelvecases included six murder exonerations, of which one was a capital case, and one non-capitalhomicide case where the defendant was a minor. New cases were found in five deathpenalty states, of which two were juvenile death penalty states. No states added cases thathad no exonerations in the previous version. Accordingly, these small differences will notstatistically alter the pattern of results reported in Table 15 infra.
57 Gross et al., Exonerations, supra note 56, at 4 fig. 1.58 Id. at 4 fig.1 & 3 n.10. Although the discovery of exculpatory DNA evidence
accounted for fewer than half of the 340 exonerations reported by Gross and colleagues,DNA became linked in the popular imagination to the question of innocence. See BRIAN
FORST, ERRORS OF JUSTICE: NATURE, SOURCES, AND REMEDIES, 201-04 (2004). See generallyJIM DWYER ET AL., ACTUAL INNOCENCE: WHEN JUSTICE GOES WRONG AND HOW TO MAKE IT
RIGHT (2003).59 New juvenile death sentences are distinguished from juveniles re-sentenced to death
following appellate review and reversal. See infra Part III.B.60 Gross et al., Exonerations, supra note 56, at 17 tbl.2.
[Vol. 95

2005] DECLINE OF THE JUVENILE DEATH PENALTY 437
Four" grabbed national headlines. 61 The Chicago Tribune's 1999 series"The failure of the death penalty in Illinois"62 concluded that the recurringproblem of exonerations in capital cases was intrinsic to capital prosecutionin the state. Later in 1999, the exoneration of Anthony Porter within forty-eight hours of his scheduled execution dramatically highlighted the urgencyof these exonerations and the risks of error. 63 By January 2003, when then-Governor George H. Ryan commuted the sentences of Illinois's death rowand placed a moratorium on the death penalty in the state, seventeen of the289 persons sentenced to death in Illinois had already been exonerated byappellate review, an error rate of 5.9%. 64
The Illinois revelations were followed closely by the release in June2000 of a study by Professor James Liebman and colleagues at ColumbiaUniversity showing that two in three death sentences from 1973 through1995 were reversed at one or more stages or appellate review. The studywas widely reported in the national media,66 and was cited in several state
61 See Rob Warden, Illinois Death Penalty Reform: How it Happened, What it Promises,
95 J. CRIM. L. & CRIMINOLOGY 381 (2005). See generally DAVID L. PROTESS & ROBERTWARDEN, A PROMISE OF JUSTICE (1998) (documenting the media reactions to theexonerations of the four death row inmates).
62 Ken Armstrong & Steve Mills, The Failure of the Death Penalty in Illinois (series),
CHI. TRIB., Nov. 14-18, 1999, at 1.63 Andrew Bluth, Illinois Man Is Finally Cleared in 2 Murders: An Armed Robbery
Conviction Lingers from a Murder Case., N.Y. TIMES, Mar. 12, 1990, at A20; Sharon Cohen,Last-Minute Exonerations Fuel Death-Penalty Debate Justice: Wrongful Convictions ShiftFocus from Morality to Legitimacy, L.A. TIMES, Aug. 15, 1999, at Al; Daniel H. Lehmann,Cleared of '82 Murders, CHI. SUN-TIMES, Mar. 12, 1999, at 8.
64 Warden, supra note 61.65 James Liebman, Jeffrey Fagan, Valerie West, & Jonathan Lloyd, Capital Attrition:
Error Rates in Capital Cases, 1973 - 1995, 78 TEX. L. REv. 1839 (2000) [hereinafterLiebman et al., Capital Attrition] (showing that 68% of all death sentences since Furman v.Georgia were reversed either on direct appeal, state direct appeal, or federal habeas review;most (82%) of those reversed were re-sentenced to non-capital punishments, 7% wereexonerated, and the remainder were re-sentenced to death); see also FORST, supra note 58, at200-02 (noting that the errors in these cases were the result of misidentification ofwitnesses, prosecutorial or police misconduct, incompetent defense counsel, prejudicialinstructions by judges, and biased jury selection procedures); James Liebman, JeffreyFagan, & Valerie West, A Broken System, Part I: Error Rates in Capital Cases, 1973-1995(2000), available at http://www2.law.columbia.edu/instructionalservices/liebman/[hereinafter Liebman et al., A Broken System, Part 1]; James Liebman et al., A BrokenSystem, Part H: Why There Is So Much Error in Capital Cases, and What Can Be DoneAbout It (2002), available at http://www2.law.columbia.edu/brokensystem2/report.pdf[hereinafter Liebman et al., A Broken System, Part II].
66 See, e.g., David Broder, Broken Justice, WASH. POST, June 19, 2000, at B.07:
In the annals of politics, there have been few pieces of social research which have decisivelyaffected the course of policy debate. Michael Harrington's "The Other America" opened the eyesof the nation-and of Presidents Kennedy and Johnson-to the extent of poverty in this nation.

JEFFREYFAGAN & VALERIE WEST
commissions that have examined substantive problems in the administrationof the death penalty.67 The discovery of widespread unreliability in deathsentences ignited arguments that the "reasonable doubt" standard of proofin capital cases should be replaced by a "beyond any doubt" standard.68
Daniel Patrick Moynihan's essay on "The Negro Family" alerted President Nixon and hissuccessors to the plight of female-headed welfare families.
Now, there may be a third. James S. Liebman's just-published report, "A Broken System: ErrorRates in Capital Cases 1973-1995," transforms the debate on the death penalty as much as thoseearlier works did the understanding of poverty and welfare in America.
Id.; see also Jonathan Alter, The Death Penalty on Trial: Special Report-DNA and OtherEvidence Freed 87 People From Death Row; Now Ricky McGinn is Roiling Campaign2000; Why America's Rethinking Capital Punishment, NEWSWEEK, June 12, 2000, at 24, 26-34 (noting changes in political rhetoric concerning the death penalty); Alan Berlow, TheBroken Machinery of Death, THE AM. PROSPECT, July 30, 2001, at 16; David Gergen, Deathby Incompetence, U.S. NEWS & WORLD REP., June 26, 2000, at 76; James Liebman, TheCondemned, and The Mistakes, N.Y. TIMES, July 12, 2000 at A20; Murder One, THEECONOMIST, June 17, 2000, at 33:
America has been convulsed by a debate about the death penalty.... Most of the argumentshave either been ideological or framed in terms of emotive individual cases .... Hence theimportance, this week, of the first real data. It comes from the first comprehensive study of allthe 5,760 capital cases heard in America from 1973 to 1995.
Id. This research was cited as a model for contemporary scholarship of relevance to thelegal profession and to the reform of legal institutions by the President of the AmericanAssociation of Law Schools in the Association's quarterly publication. See Elliott Milstein,Coming Soon to A Law School Near You: A Colloquium on How You Can Help PromoteAccess to Equal Justice, THE ASS'N OF AM. LAW SCHOOLS NEWSL. (Washington, D.C.), Aug.2000, at 1, available at http://www.aals.org/pmaug00.html.
See also David Broder, A Broken System, WASH. POST, June 18, 2000, at B7(Editorial); Fox Butterfield, Death Sentences Being Overturned in 2 of 3 Appeals, N.Y.TIMES, June 12, 2000, at Al; Deadly Mistakes, N.Y. TIMES, June 13, 2000, at A26(Editorial); David Gergen, Death by Incompetence, U.S. NEWS & WORLD REP., June 26,2000, at 76; Henry Weinstein, Death Penalty Overturned in Most Cases, L.A. TIMES, June12, 2000, at Al; Good Morning America: Study Finds U.S. Capital Punishment SystemFlawed (ABC News broadcast, June 12, 2000); The Early Show: New Study of the DeathPenalty Finds that a Majority of the Cases are Overturned on Appeal (CBS News broadcast,June 12, 2000); Today: Professor James Liebman, Columbia University, Discusses DeathPenalty (NBC broadcast, June 12, 2000); Morning Edition: Recent Study Showing HighNumber of Death Penalty Cases Have Been Reversed Because of Critical Mistakes (NPRbroadcast, June 12, 2000); All Things Considered: Studies Show the Death Penalty System isFraught with Error (NPR broadcast, June 12, 2000); The News Hour with Jim Lehrer: DeathPenalty Debate (PBS broadcast, June, 13, 2000).
67 State death penalty study commissions in Arizona, California, Connecticut, Illinois,
New Jersey, North Carolina, Maryland, Nebraska, Nevada, Pennsylvania, and Virginia havecited the Columbia study as one impetus to examine the state's system of capitalpunishment. For discussion and links to each of the state study commission reports, seeHuman Rights Watch, The Death Penalty in the United States of America, athttp://www.hrw.org/campaigns/deathpenalty/statestudies.htm (last visited Jan. 14, 2005).
68 FORST, supra note 58; Liebman et al., A Broken System, Part II, supra note 65.
[Vol. 95

2005] DECLINE OF THE JUVENILE DEATH PENALTY 439
Coming closely on the heels of the revelations of actual innocence and theexonerations of inmates on death row in Illinois, and in the shadow of thegrowing number of exonerations nationally that surpassed 100 in 2002, theLiebman et al. study intensified the debate on the accuracy of the deathpenalty and further raised doubts about the reliability of capital sentences.
Many of the issues in capital punishment revealed by the exonerationsin Illinois and elsewhere, and by the Liebman et al. study, have particularsalience for adolescents facing the death penalty, and may underlie thedeclining use of the death penalty for adolescents who are convicted ofcapital murders committed before the age of eighteen. Juveniles accountedfor thirty-three of the 340 exonerations reported by Professor Gross andcolleagues, including twenty-three for murder. Fourteen of the thirty-threewere exonerated following revelation of false confessions, a far higher rate(42%) compared to their older counterparts (13%).69 The specialvulnerability of adolelcents to false confessions reflects theirdevelopmental and functional immaturity and the likelihood of theirdiminished culpability. 0
The tension between the culpability and immaturity of juvenilemurderers was highlighted in recent cases in Florida involving Lionel Tate,and in Michigan involving Nathaniel Abraham.71 In each case, public
69 Gross et al., Exonerations, supra note 56, at 545.70 Steven A. Drizin & Richard A. Leo, The Problem of False Confessions in a Post-DNA
World, 82 N.C. L. REv. 892, 963 (2004); see, e.g., Beckman, supra note 19 (describingrecent neuropsychological studies showing that development of critical frontal lobe brainfunctions related to impulse control, decision making and reasoning is incomplete at ageeighteen, and may not be completed until age twenty-one or later); Fagan, supra note 19(discussing evidence of juveniles' immaturity and the risk of false confessions, and the riskof error in attempts to assess individual juveniles' culpability); Scott & Steinberg, supra note19 (on the diminished culpability of adolescents owing to their deficits in psycho-socialmaturity, and the need for law to accommodate these facts); Tanenhaus & Drizin, supra note19, at 671-89 (on the special risk of false confessions for adolescents). Questions about thediminished culpability of juveniles reached the U.S. Supreme Court in a rare publisheddissent by Justices Stevens, Breyer and Ginsburg in August 2002, in a petition for certiorariin a juvenile death penalty case that was denied. See Patterson v. Texas, 536 U.S. 984(2002) (Stevens, Ginsburg, Breyer, J.J., dissenting); see also Adam Liptak, 3 Justices Callfor Reviewing Death Sentences for Juveniles, N.Y. TIMEs, Aug. 30, 2002 at Al.
71 See, e.g., Keith Bradsher, Michigan Boy Who Killed at 11 is Convicted of Murder asAdult, N.Y. TIMEs, Nov. 17, 1999, at Al; Michael Browning, Boy, 14, Gets Life in TVWrestling Death: Killing of 6-Yr. -Old Playmate Wasn't Just Horseplay, Florida Judge Says,CHi. SuN-TmEs, Mar. 10, 2001, at 1 (noting that the death occurred while Tate was"allegedly demonstrating wrestling techniques on her"); Dana Canedy, At 14, a LifeSentence: Boy Killed Girl in 'Wrestling' Murder, DALLAS MORNING NEWS, Mar. 10, 2001, atIA. The case of thirteen-year-old Nathaniel serves as another example of the tendency onthe part of prosecutors to respond to the deeds rather than the needs of juvenile defendants.Despite the fact that Nathaniel "was officially assessed as functioning at the level of a six-

JEFFREYFAGAN & VALERIE WEST
debates about the severity of their crimes were contextualized in analyses oftheir immaturity and the belief of the courts that these juveniles wereamenable to change. Whether this contextualist view of culpability entersthe deliberations of jurors, whether simply to rule out death or to morecautiously calibrate the reliability of a conviction when the defendant is anadolescent, the special considerations of the culpability of adolescents andthe heightened risks of error may be factors that contribute to the recentdecline in juvenile death sentences. The Atkins majority worried about thepotential for execution of innocents, or at the least, of those less culpable.72
The same may now be true about jurors in juvenile death penalty cases.Accordingly, we extend the analyses in this article to examine whether
the accumulation of innocence has influenced the rate of juvenile deathsentences. We include measures of exonerations in multivariate models toestimate the contributions of innocence to the declining patterns of juveniledeath sentences and evidence of the evolving social and legal norms on thejuvenile death penalty.
III. RESEARCH DESIGN AND METHODS
A. OVERVIEW
To test for evidence of an evolving standard in the use of the juveniledeath penalty since 1989, when the Supreme Court last addressed theconstitutionality of the juvenile death penalty in Stanford, we examinedtrends and patterns in the use of the death penalty for juvenile offendersduring the period from 1990-the year following the Stanford decision-to2003.
In order to understand the significance of changes in the frequency
year-old, both intellectually and emotionally," prosecutors, pursuant to a state statute, Mich.Comp. Laws Ann. 712A.2d (West 2000), charged him as an adult for first degree murder onthe basis that he was capable of forming the requisite intent. Deanna M. Maher, MichiganJuveniles Are Denied Equal Defenses Before the Law: The State of Michigan's Reaction toJuvenile Defendants, 78 U. DET. MERCY L. REv. 259, 260 (2001). At thirteen years of age,Nathaniel was the youngest person to be tried for first degree murder in the United States.Christina DeJong & Eve Schwitzer Merrill, Getting "Tough on Crime": Juvenile Waiverand the Court, 27 OHio N.U. L. REv. 175, 175 (2001). Although Nathaniel was eventuallyfound guilty by a Detroit jury of second degree murder, the judge presiding over the caseexercised the discretion allotted to him under Michigan law to sentence Nathaniel to ajuvenile detention center rather than a prison. Maher, supra, at 261. The judge was able toexercise this discretion because Nathaniel was under the age of fourteen when he committedthe alleged offense. For an analysis of how trial court judges adjusted the sentences of thesedefendants to accommodate their immaturity and prospects for rehabilitation, see Fagan,supra note 19.
72 Atkins v. Virginia, 536 U.S. 304, 320 n.25 (2002).
[Vol. 95

2005] DECLINE OF THE JUVENILE DEATH PENALTY 441
with which the death penalty is imposed on juvenile offenders, it isnecessary to take account of the decline in the homicide rate and, inparticular, in the juvenile homicide rate, beginning in the 1990s. As Figurel a shows, the homicide rate in the United States peaked in 1991 and hasdeclined steadily since 1993. 73 As Figure lb shows, an even steeper declinehas occurred during the same period for juvenile homicides; the rate forhomicides committed by juveniles ages fourteen to seventeen peaked in1993 and has declined steadily since that year.74 Any estimate of themagnitude of the decline in juvenile death sentencing since 1990 musttherefore account for the general decline in the supply of defendants-bothjuveniles and adults-who were eligible for the death penalty. Only trendsthat are independent of changing homicide rates would reflect an evolvingstandard in death sentencing. Accordingly, we examine data from 1990through 2003 to determine whether there has been a decline in the numberof death sentences imposed on juvenile offenders that is not explained bythe decline in the juvenile homicide rate.
73 See also Alfred Blumstein, Disaggregating the Violence Trends, in THE CRIME DROPIN AMERICA 13, 20-24 (A. Blumstein & J. Wallman eds., 2000). The homicide rate per100,000 persons has followed a cyclical pattern over the past thirty years, with peaks in 1974(9.8), 1980 (10.2) and 1991 (9.8), followed in each instance by declines of varying durations.See JAMES ALLEN Fox & MARIANNE W. ZAWITZ, U.S. DEP'T OF JUSTICE, HOMICIDE TRENDS
IN THE UNITED STATES, available at http://www.ojp.usdoj.gov/bjs/homicide/homtrnd.htm(last visited Feb. 11, 2005). In addition to reaching a record high nationally in 1991, thehomicide rate reached record levels in fourteen of the largest 100 cities in the United Statesin that year. See generally FRANKLIN E. ZIMRING & GORDON HAWKINS, CRIME IS NOT THEPROBLEM: LETHAL VIOLENCE IN AMERICA (1997).
74 See also, e.g., Philip J. Cook & John H. Laub, After the Epidemic: Recent Trends inYouth Violence, 29 CRIME AND JUST. 1 (2002).

JEFFREYFAGAN & VALERIE WEST
Figure Ia. Homicide Victimization Rates per 100,000Persons by Age, U.S., 1976-2002
30
,r F-14-17I=--18-24
25
', m-=-35*
20. 2
15 NI
S10E K0
5
01976 1978 1980 1982 1984 1986 1988 1990 1992 1994 1996 1998 2000 2002
Source: FBI, SUPPLEMENTARY HOMICIDE REPORTS, 1976-2002
Figure lb. Homicide Offending Rates per 100,000Persons by Age, U.S., 1976-2002
45
40 .
25 25-34
2" 0 ________
80 1
15E0 10
01976 1978 1980 1982 1984 1986 1988 1990 1992 1994 1996 1998 2000 2002
Source: FBI, SUPPLEMENTARY HOMICIDE REPORTS, 1976-2002
[Vol. 95

2005] DECLINE OF THE JUVENILE DEATH PENALTY 443
The research design is a simple cross-sectional prospective analysis ofpatterns and trends at the state level for each year beginning in 1990. Weinclude as observations for each state only the years in the study intervalwhen there was a valid juvenile death sentencing statute in effect.75
Following a set of descriptive analyses, we report the results of a seriesof multivariate statistical models that test whether the rate of decline injuvenile death sentences is simply an artifact of the decline in homicides byjuvenile offenders since 1993 or is a trend indicative of changes in socialand legal norms. To evaluate these competing claims, we analyzed the rateof decline in the imposition of the death penalty on juvenile offendersrelative to homicide arrest rates for juveniles. We also distinguished trendsin the juvenile death penalty from broader social trends in the use of capitalpunishment for adults. That is, we compared the decline in death sentencesper homicide for juveniles to the rate at which death sentences wereimposed on young adult defendants-ages eighteen to twenty-four-toshow that the decline in the use of the death penalty is specific to juveniles.A rate of decline in the number of juvenile death sentences that is greaterthan the rate of decline in juvenile homicide arrests, and greater thancomparable declines for adult death sentences is evidence of changingsocial and legal norms. Accordingly, these analyses test whether there is astatistical trend that signifies growing rejection of the use of the deathpenalty for minors.
B. DEATH SENTENCES AND PERSONS SENTENCED TO DEATH
Throughout this article, we distinguish between death sentences forjuveniles and juveniles sentenced to death. These counts vary slightly, aswe show in Table 4. For example, one juvenile in 2002 and another in2003 were re-sentenced to death following reversals of earlier deathsentences. There are valid reasons to examine each of these dimensions ofthe juvenile death penalty, and we do so whenever possible in thedescriptive analyses. However, in the multivariate analyses predicting theuse of the death penalty and its rate of decline, we use only new sentences,or persons (juveniles and adults) sentenced to death.
We do this for three reasons. First, death sentences imposed post-appeal are not independent of the initial death sentence. This presents ahost of well-known statistical problems, particularly concerning tests ofsignificance for non-independent observations. 76 Second, death sentences
75 For example, the Washington Supreme Court construed the state's death penaltystatute as not applying to juvenile offenders in 1993. Accordingly, for Washington, weinclude only four years of observations.
76 See generally MICHAEL FINKELSTEIN & BRUCE LEVIN, STATISTICS FOR LAWYERS (2d

JEFFREY FAGAN & VALERIE WEST
issued post-appeal reflect dynamics that are influenced by both the appealsprocess and the initial sentencing process. The relative contributions ofeach of these legal dynamics to a subsequent re-sentence are unclear andperhaps unknowable. To be re-sentenced to death, a defendant must havebeen initially sentenced, had that sentence overturned upon review at somepoint later in time (often, years later), and then, been re-sentenced to deathfollowing a new trial. Time to review and outcomes at review vary widelyacross sentencing jurisdictions, and these differences in review periodsfurther complicate comparisons of cases and causes of death sentences.77
Third, not all death sentences that are overturned upon review are sent backfor a new sentence; only a small fraction result in a new death sentence. 78 Itis unknown exactly what factors govern the outcome of cases post appeals,but it would be foolish to assume that they are identical to those whichinfluence the initial sentencing process.
C. DATA SOURCES
We constructed a database on state trends in death sentences forjuveniles and adults. We then integrated data on state trends in crime andpunishment, and included indices of social, economic and political trendsthat are correlated with death sentences, crime, and the behavior of criminaljustice agencies. The database includes all death sentences from 1990 to2003; no sampling was used or needed. The data used here areadministrative data, collected from official data sources, including the U.S.Census, the Bureau of Justice Statistics' database on capital punishment, 79
and the Uniform Crime Reports 80 maintained by the U.S. Department ofJustice to provide a crime-recording and accounting system. We also usedthe comprehensive index of juvenile death sentences maintained byProfessor Victor Streib, which is widely used in the analysis of the juveniledeath penalty. 81 Table 1 provides an overview of data domains and sources.
ed. 2001).77 See Liebman et al., A Broken System, Part II, supra note 65.78 See id.79 See TRACEY SNELL & THOMAS J. BONZCAR, U.S. DEP'T OF JUSTICE, CAPITAL
PUNISHMENT 2002 (2003), available at www.ojp.usdoj.gov/bis/abstract/cpO2.htm. Data arepublicly available at National Archive of Criminal Justice Data, Institute for SocialResearch, University of Michigan, at www.icpsr.umich.edu/cgi-bin/archive.prl?study=3958(last visited Jan. 11, 2005).
80 FED. BUREAU OF INVESTIGATION, U.S. DEPARTMENT OF JUSTICE, UNIFORM CRIME
REPORTS: CRIME IN THE UNITED STATES, various years, at www.fbi.gov/ucr/ucr.htm (lastvisited May 12, 2004). Data are publicly available at National Archive of Criminal JusticeData, Institute for Social Research, University of Michigan, athttp://www.icpsr.umich.edu/NACJD/ucr.html (last visited Jan. 11, 2005).
81 Streib, December, supra note 20, at 5.
[Vol. 95

2005] DECLINE OF THE JUVENILE DEATH PENALTY 445
Table 2 shows the variables computed from these data that were used in theanalyses in Sections IV and V.
Table 1Data Domains and Sources
DomainJuvenileDeathSentences
Adult DeathSentences
HomicideVictimizationPatterns andCharacter-istics
Juvenile andAdultHomicideArrests
SourceThe Juvenile Death Penalty Today: Death Sentences andExecutions for Juvenile Crimes January 1, 1973-June 30, 2004,available at http://www.law.onu.edu/faculty/streib/documents/JuvDeathJune302004NewTables.pdf (last visited Jan. 11, 2005).This is a website maintained by Professor Victor Streib fornearly two decades with a comprehensive list of juveniles whohave received death sentences and their dispositions.
U.S. DEPARTMENT OF JUSTICE, BUREAU OF JUSTICE STATISTICS,
CAPITAL PUNISHMENT IN THE UNITED STATES, 1973-2002(ICPSR STUDY 3958). Compiled by the U.S. Department ofCommerce, Bureau of the Census. First ICPSR Edition April2004, available at http://www.icpsr.umich.edu (last visited Jan.11, 2005).
2
U.S. Department of Health and Human Services, Public HealthService, National Center for Health Statistics, CompressedMortality Files. State homicide and victimization data,including by race, are from the Vital Statistics of the UnitedStates or other data compilations generated by the Centers forDisease Control and Prevention National Center for HealthStatistics. Data for 1988-1992 are from Vital Statistics of theUnited States, Mortality Detail Files, 1968-1992 (ICPSRSTUDY 7632, 6798). Data for 1993-1998 are from Centers forDisease Control and Prevention National Center for HealthStatistics, Compressed Mortality File, 1989-98 CD-ROM Series20, No 2C ASCII Version. Data after 1998 are from CDCWonder, the Centers for Disease Control data extraction engineat http://wonder.cdc.gov (last visited Jan 11, 2005). 3
Annual homicide arrests are taken from The Uniform CrimeReporting Program Data [United States]: SupplementaryHomicide Reports 1976-2001 (ICPSR Study #s, 3108, 3448, and3722). Additional arrest data was taken from The Sourcebookof Criminal Justice Statistics, Bureau of Justice Statistics 1988-2002. Juvenile and adult homicide arrests are based on thegreater value of these two data sources. Due to non-reportingissues and difference in age categories used in these two data
JEFFREYFAGAN& VALERIE WEST
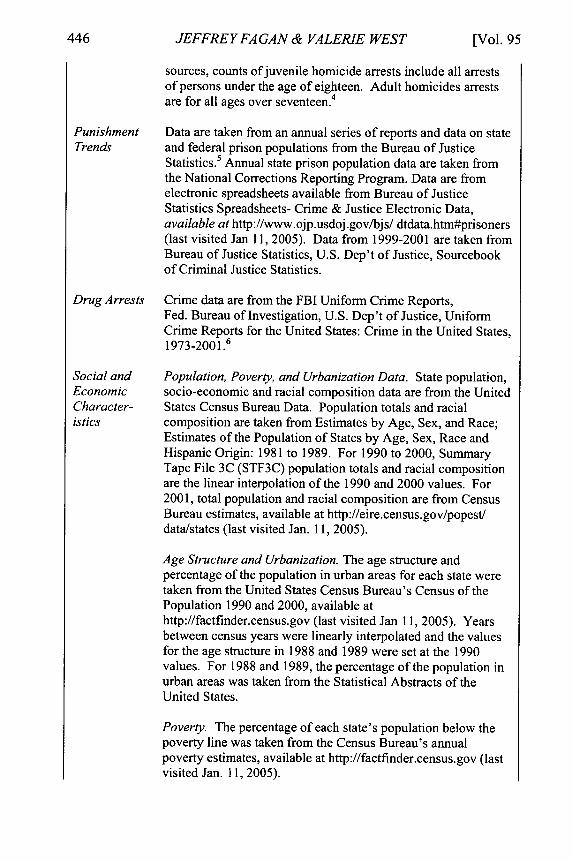
sources, counts of juvenile homicide arrests include all arrestsof persons under the age of eighteen. Adult homicides arrestsare for all ages over seventeen.4
Punishment Data are taken from an annual series of reports and data on stateTrends and federal prison populations from the Bureau of Justice
Statistics. Annual state prison population data are taken fromthe National Corrections Reporting Program. Data are fromelectronic spreadsheets available from Bureau of JusticeStatistics Spreadsheets- Crime & Justice Electronic Data,available at http://www.ojp.usdoj.gov/bjs/ dtdata.htm#prisoners(last visited Jan 11, 2005). Data from 1999-2001 are taken fromBureau of Justice Statistics, U.S. Dep't of Justice, Sourcebookof Criminal Justice Statistics.
Drug Arrests Crime data are from the FBI Uniform Crime Reports,Fed. Bureau of Investigation, U.S. Dep't of Justice, UniformCrime Reports for the United States: Crime in the United States,1973-2001.6
Social and Population, Poverty, and Urbanization Data. State population,Economic socio-economic and racial composition data are from the UnitedCharacter- States Census Bureau Data. Population totals and racialistics composition are taken from Estimates by Age, Sex, and Race;
Estimates of the Population of States by Age, Sex, Race andHispanic Origin: 1981 to 1989. For 1990 to 2000, SummaryTape File 3C (STF3C) population totals and racial compositionare the linear interpolation of the 1990 and 2000 values. For2001, total population and racial composition are from CensusBureau estimates, available at http://eire.census.gov/popest/data/states (last visited Jan. 11, 2005).
Age Structure and Urbanization. The age structure andpercentage of the population in urban areas for each state weretaken from the United States Census Bureau's Census of thePopulation 1990 and 2000, available athttp://factfinder.census.gov (last visited Jan 11, 2005). Yearsbetween census years were linearly interpolated and the valuesfor the age structure in 1988 and 1989 were set at the 1990values. For 1988 and 1989, the percentage of the population inurban areas was taken from the Statistical Abstracts of theUnited States.
Poverty. The percentage of each state's population below thepoverty line was taken from the Census Bureau's annualpoverty estimates, available at http://factfinder.census.gov (lastvisited Jan. 11, 2005).
[Vol. 95

2005] DECLINE OF THE JUVENILE DEATH PENALTY 447
Additional data were collected from previous research, and datasupplied from other published research projects.7
Political Indices of the political pressure on state trial court and appellateContexts judges from judicial selection techniques were developed by
Liebman et al.8 based on provisions of each state's Constitutionsand codes governing judicial selection for trial court judges,supplemented by information from the National Center for StateCourts.
9
Innocence Counts of the number of exonerations by state and year wereCases computed from data compiled by Samuel Gross et al.,
Exonerations early draft, supra note 56, at app. at 27-31.Streib, June, supra note 20, at 5; see also Strieb, December and April, supra note 20.
2 THOMAS P. BONCZAR & TRACY L SNELL, BUREAU OF JUSTICE STATISTICS, CAPITAL PUNISHMENT,2002 (2003), available at http://www.ojp.usdoj.gov/bjs/abstract/cp02.htm. Data and codebooks areavailable at National Archive of Criminal Justice Data, Inter-University Consortium for Social andPolitical Research, Institute of Social Research, University of Michigan, available athttp://www.icpsr.umich.edu/cgi-bin/bob/archivestudy-3958.3 Through 1992, the relevant data sources list homicide victims by state of death. After 1993, therelevant data source lists homicide victims by state of residence. Data for 2001 exclude all victimsfrom the events of September 11 th.4 FED. BUREAU OF INVESTIGATION, U.S. DEP'T OF JUSTICE, UNIFORM CRIME REPORTING PROGRAMDATA [UNITED STATES]: SUPPLEMENTARY HOMICIDE REPORTS 1976-2001 (ICPSR Study 3108,3448, and 3722); BUREAU OF JUSTICE STATISTICS, U.S. DEP'T OF JUSTICE, THE SOURCEBOOK OFCRIMINAL JUSTICE STATISTICS 1988-2002 (2002). Data for Kansas were largely missing and aretaken from Kansa Bureau of Investigation and are available at http://www.accesskansas.org/kbi (lastvisited Jan. 11, 2005); Florida data were also missing and are taken from the Florida Department ofLaw Enforcement publications available at http://www.fdle.state.fl.us/ (last visited Jan. 11, 2005).5 See, e.g., PAIGE HARRISON & ALLEN J. BECK, U.S. DEP'T OF JUSTICE, PRISONERS IN 2002 (2003),available at http://www.ojp.usdoj.gov/bjs/pub/pdf/p02.pdf.6 Drug arrests for Florida are from unpublished data provided by the Florida Department of LawEnforcement. Missing data from other states were linearly interpolated.'See, e.g., H. Naci Mocan & R. Kay Gittings, Getting Off Death Row: Commuted Sentences and theDeterrent Effect of Capital Punishment, XLVI J.L. ECON. 453 (2003). Professor Mocan graciouslyprovided his data, including economic and population characteristics and measures of punishmentand other criminal justice case processing indicia.8 See Liebman et al., Broken System, Part I, supra note 65; Liebman et al., Broken System, Part II,supra note 65.9 See C. Flango & D. Rottman, Appellate Court Procedures (Nat'l Center for State Courts, 1998); D.Rottman & C. Flango, State Court Organization 1998 (Nat'l Center for State Courts, 2000);American Bar Association, Standards on State Judicial Selection 2000 (ABA Standing Committeeon Judicial Indevendence, Commission on State Judicial Selection, 2001).

JEFFREYFA GAN & VALERIE WEST
VariableJuvenilesSentenced to Death
Time
Time Squared
Year Greater Than1999
Interaction withTime
Interaction withTime Squared
Murder Rate(logged)
Population Under18 (logged)
Population 15 andAbove (logged)
Percent of thePopulation Under25
Black/ WhiteVictimization Ratio
Percent Black
Percent Urban
Table 2Variables and Measures1
MeasureCounts of persons under the age of eighteensentenced to death by state and year.
The fourteen years in the study period taken as alinear trend from the beginning to the end of thestudy.
A quadratic term for time; time is squared.
All years greater than 1999 are coded as 1, and allyears 1999 and before are coded as zero.
The interaction of Year Greater than 1990 withTime.
The interaction of Year Greater than 1990 withTime Squared.
The natural log of the number of murders in a stateand year per 100,000 state residents in the state andyear.
The natural log of the population that is under theage of eighteen.
The natural log of the population that is age fifteenand above in each state year.
The percentage of the population in a given stateand year that is under age twenty-five.
The state's Black homicide victims per 100,000Black population divided by its rate of Whitehomicide victims per 100,000 White population.
Percentage of the state's population that is Black.
Percentage of the state's population in urban areasas defined by the United States Census Bureau.
[Vol. 95

2005] DECLINE OF THE JUVENILE DEATH PENALTY
Percent BelowPoverty
Political PressureIndex
Punishment Index
Juveniles Arrestedfor Homicide(logged)
Homicide Residual
Innocence
The percentage of the state's population below thepoverty line.
A measure of the extent to which a state's trialcourt judges are subject to political repercussionsbased on their judicial performance throughpolitical or electoral politics. The index combinesthe way in which judges are selected, the way theyare retained, and the length of the first term.2
The ratio of the number of inmates incarcerated inprison in the state per 100 Index FBI Crimesreported in the state in that year.
The number of persons under the age of eighteenarrested for homicide in a state year.
The un-standardized residual for each state year ofthe homicide rate regressed on a vector ofpredictors. For each year starting in 1988 thehomicide rate was regressed, using ordinary leastsquares, on the percentage of the population undertwenty-five, the percentage of the population that isBlack, the percentage of the population in urbanareas, the percentage of the population belowpoverty, the number of drug arrests, and the naturallog of the population age fifteen and above.2
The number of exonerations in each state-year.The two- and three-year averages of exonerationsin each state.The two- and three-year averages of exonerationsnationally.
All predictors were lagged by two years.2 For a fuller discussion of this variable, see Liebman et al., Broken System, Part I, supra note 65;
Liebman et al., Broken System, Part II, supra note 65.Model statistics available from authors.

JEFFREYFAGAN& VALERIE WEST
D. DATA ANALYSIS PROCEDURES
1. Descriptive AnalysesWe first report results of descriptive analyses showing patterns and
trends in death sentencing for juveniles and adults. We computed bothabsolute numbers of death sentences and the rate at which juveniles aresentenced to death, expressed as number of death sentences per 100juvenile homicide arrests. 82 Because juvenile death sentences sinceStanford are concentrated in a small number of states-Texas, Florida, andAlabama account for more than half of the juvenile death sentencesimposed from 1990 to 2003 83-we also analyze state-specific figures toidentify trends in these three states that disproportionately contribute thelargest share of juvenile death sentences.
2. Multivariate TestsTo determine whether there is a statistically significant downward
trend in juvenile death sentencing, we estimate models of the number ofjuvenile death sentences using zero-inflated Poisson regression models.Poisson techniques are appropriate to identify factors that predict thenumber of occurrences of an event within a specific observation period.84
The Poisson distribution is a discrete distribution which takes on the valuesy = 0, 1, 2, 3,.... It is often used as a model for the number of events(such as the number of telephone calls at a business or the number ofaccidents at an intersection) in a specific time period. It is useful in studiesof law and crime to model the number of crimes or the number of prisonsentences. The probability distribution for a Poisson process is defined as:
p (y yi) A= e( )Ai= ~)-e ,2~ y = 0,1,2,3,..
where
E[yi= 2i = eox,
The exact distribution depends on the expected rate of occurrence ofthe event of interest (X), and X is a vector of explanatory variables. When Xis low, the distribution is skewed to the left. When X is high, the
82 To account for the lag between homicide arrests and death sentences, we laggedhomicide arrests by two years.
83 See Streib, December, supra note 20, at 5.84 See, e.g., WILLIAM GREENE, ECONOMETRIC ANALYSIS (5th ed. 2000); PETER KENNEDY,
A GUIDE TO ECONOMETRICS (1995).
[Vol. 95

2005] DECLINE OF THE JUVENILE DEATH PENALTY 451
distribution more closely resembles a normal distribution.Poisson distributions typically assume that events are inevitable, and
that they follow some known distribution or frequency pattern. In mostcircumstances, there are very few non-occurrences, even though mostevents occur infrequently, and there are a small number of observations thathave higher counts of events. So, for example, very few children miss nodays during the school year, most children are absent from school only afew days a year, a small number of children are absent regularly (perhapsonce a month), and an even smaller number are frequently absent. Butsuppose we are observing a particularly healthy group of children, andschool absence is rare. The event (school absence) is not inevitable, and weneed to know, first, who is absent at least once, and among those, who isabsent more or less often. That is, the few who miss any school at all areabsent at varying rates, most of them quite rarely but a few more often.These two distributions of absence would require two different processes ormodels to account for the high number of zeros and the relatively infrequentoccurrence of school absence.
Accordingly, the Poisson distribution may not accurately predict theoccurrence of a discrete event when these events are rare within anobservational period. That is, the Poisson model may be inaccurate if thereis a separate process that seems to be influencing not just the frequency ofan event, but whether the event itself occurs at any rate greater than zero.85
In other words, there may be two data generating processes that produce theobserved distribution: one which generates a non-zero observation, and asecond that generates a count of non-zero events.
We face that situation in this study: there are 264 state-years with nojuvenile death sentences, out of a total of 334 observations. The number ofjuvenile death sentences might be zero either because there are too fewhomicide arrests to produce an eligible pool of defendants, or thejurisdiction simply may choose not to use this sentencing option, regardlessof the characteristics of the pool of juvenile homicide defendants or the
85 This situation is especially problematic when the non-zero events themselves are
highly skewed. The risks of unreliable predictions with highly skewed data, including bothpredictors and outcomes, are well-known and thoroughly discussed in many statistics texts.The skewed non-zero observations have strong leverage over the data. Efforts to model theseresults to fit these unusual distributions tend to result in a domination of the data by theseextreme cases, and they will unduly influence the results. Leverage turns into influencewhen the extreme values of one variable are paired with extremes of the response variable(in this case, juvenile homicide arrests and juvenile death sentences). The results usuallythen reflect the few anomalous cases, not the majority of the observations. See, e.g., D.R.COOK & SANFORD WEISBERG, APPLIED REGRESSION, INCLUDING COMPUTING AND GRAPHICS(1999); Christopher J. Zorn, An Analytic and Empirical Examination of Zero-Inflated andHurdle Poisson Specifications, 26 SOCIOLOGICAL METHODS AND RESEARCH 368 (1998).

JEFFREY FAGAN & VALERIE WEST
characteristics of the crimes they committed. In either case, this is aseparate phenomenon from a process that generates a count of events oncethe decision is made to use the process. In a distribution with so manyzeros, once the hurdle is crossed so that a non-zero count is generated, therate of occurrence of the events of interest, such as juvenile death sentences,are likely to be quite low.
This is the rationale for two forms of Poisson regression: Poissonmodels, which model the factors that predict the event being observed, andZero-Inflated Poisson (ZIP) models, 86 which also model these predictorsbut accommodate distributions with a large number of zero observations. 87
Both model forms treat each observation as an independent event andestimate regression models that predict the count of these events from aknown set of potential explanatory factors. But they differ in one criticalstatistical respect: in contrast to a Poisson model, the ZIP model combinesequations that reflect the "dual regime" data-generating processes: one thatgenerates the count of non-zero events, and a second that produces theobserved distributions. 88
In a Zero-Inflated Poisson model, the hurdle from a zero to a non-zerocount is modeled separately as a binary outcome, and then introduced intothe second stage specification of the non-zero event counts. The finalmodel is an exponential function of (possibly different) explanatoryvariables. The contributions of potential explanatory variables are tested inboth components of the model, as:
p(yi = 0) = pi + (1- pi)e
p(yi = y)= p(1- pi)e(-i)1 y
One question remains: what is the threshold of overdispersion, or howmany zero-observations would compel an analyst to abandon a Poissonregression model and use a ZIP model? To test the appropriateness ofusing a ZIP model rather than a traditional Poisson model, Professor QuangH. Vuong proposed a test statistic that is well suited for situations where the
86 GREENE, supra note 84, at 22; Diane Lambert, Zero-Inflated Poisson Regression, with
an Application to Defects in Manufacturing, 343 TECHNOMETRIcS 1 (1992).87 See, e.g., GREENE, supra note 84, at 22; JEFFREY M. WOOLRIDGE, ECONOMETRIC
ANALYSIS OF CROSS-SECTIONAL AND PANEL DATA (2003); Zorn, supra note 85, at 369-70.88 See generally Zorn, supra note 85.
[Vol. 95

DECLINE OF THE JUVENILE DEATH PENALTY
distributions (Poisson, in this case) can be anticipated. 9 Vuong's statistic isV = Vn -m / sm, where m, is the log of the ratio of the predi~ted probabilitiesfrom the extended model and the Poisson model log ( Pe /P)i The limitingdistribution of V is a standard normal distribution. Large positive valuesfavor the extended model (the ZIP model), and large negative valuesfavoring the Poisson or nonzero-inflated version of the model. 90 Valuesclose to zero in absolute value favor neither model. 91
In the analyses in Section V, we estimate models using both modelforms. In the first stage, we estimated ZIP models, and included the Vuongtest. The results were inconclusive, i.e., not statistically significant, but notzero either. Accordingly, we used both the ZIP model and the moreconservative "hurdle" Poisson specification.92
Whenever these models are used, robustness checks are essential tocheck for the stability of predictors under different model specificationconditions that challenge assumptions about the causes in the skewness ofthe dependent variable in the face of skewed predictors. We include suchchecks by varying the predictor (explanatory) variable sets to use data fromseveral sources and, more importantly, with different distributionalproperties. 9'
IV. TRENDS AND PATTERNS IN JUVENILE DEATH SENTENCES
Table 3 shows the current lineup of states by age of eligibility forcapital sentencing for juvenile offenders; it also shows the states thatimposed at least one juvenile death sentence at any time during the studyperiod. Several states, such as Utah and Delaware, had valid statutes buttheir courts did not impose any juvenile death sentences from 1990-2003.
A. TRENDS BY TIME ACROSS STATES
Juvenile death sentences have been rare events since 1990. Wecounted juveniles sentenced to death (excluding re-sentencings) in eachyear in each state while that state had a valid juvenile death sentencestatute. There were 262 state-year observations with no juveniles sentencedto death. When states did sentence juveniles to death, most sentenced only
89 See Quang H. Vuong, Likelihood Ratio Tests for Model Selection and Non-NestedHypotheses, 57 ECONOMETRICA 307 (1989).
90 See J. SCOTT LONG, REGRESSION MODELS FOR CATEGORICAL AND LIMITED DEPENDENT
VARIABLES (1997).
9' See id.92 See Yin Bin Cheung, Zero-Inflated Models for Regression Analysis of Count Data: A
Study of Growth and Development, 21 STAT. IN MED. 1461, 1462-67 (2002).93 See Zorn, supra note 85.
2005]

JEFFREY FAGAN & VALERIE WEST
one juvenile to death in a year (fifty-two); and rarely were there more thantwo. Although death sentences were more frequent for persons ageseighteen to twenty-four, there were no persons in that age group sentencedto death in 120 of the state-year data points. However, some statesfrequently used the death penalty for this group: there were eighteen state-years with more than ten persons ages eighteen to twenty-four sentenced todeath.
Table 3Capital Sentencing History and Age Eligibility by State 1990-2003
Minimum Age Eligible for Capital Sentencing 2003
Active JuvenileStates 1990- Sixteen Seventeen Eighteen2003Alabama Alabama Florida CaliforniaArizona Arkansas Georgia ColoradoArkansas Arizona New Hampshire ConnecticutFlorida Delaware North Carolina Federal SystemGeorgia Idaho Texas IllinoisKentucky Kentucky Indiana*Louisiana Louisiana KansasMississippi Mississippi MarylandMissouri Nevada Missouri*North Carolina Oklahoma Montana*Nevada Pennsylvania NebraskaOklahoma South Carolina New JerseyPennsylvania Utah New MexicoSouth Carolina Virginia New YorkSouth Dakota* OhioTexas OregonVirginia South Dakota*Washington* TennesseeWyoming* Washington*
Wyoming*Data Sources: Simmons v. Roper, 112 S.W.3d 397 (2003); American Bar Assoc., Juvenile DeathPenalty Resources & Information, at http://www.abanet.org/crimjust/juvjus/resources.html#context;Streib, June, supra note 20.* The minimum age was raised to eighteen in South Dakota and Wyoming in 2004; Indiana in 2002;Missouri in 2003; Montana in 1999; and Washington in 1993.
Table 4 shows that a total of 112 juvenile defendants received deathsentences from 1990-2003. These totals exclude persons who were re-
[Vol. 95

2005] DECLINE OF THE JUVENILE DEATH PENALTY 455
sentenced to death following reversals of earlier convictions and deathsentences. Table 4 shows that fifty-seven young persons were sentenced todeath in states with a minimum age of sixteen, and fifty-five weresentenced to death in states with a minimum age of seventeen. The peakyear for juveniles sentenced to death was 1994, when fifteen juvenileoffenders were newly sentenced to death. Following a more recent peak offourteen juvenile offenders sentenced to death in 1999, the number ofjuvenile offenders sentenced to death has declined each year. In 2000, thenumber of persons receiving juvenile death sentences dropped sharply toseven, a decline of 50%. The number declined again to three in 2002, andone in 2003. Table 4 also shows that the number of juvenile deathsentences, as distinguished from the number of persons sentenced to deathfollowed a similar trend during this period.
Table 4. Juvenile Death Sentences and Juveniles Sentenced to Deathby Year in States with Capital Punishment for Juveniles, by MinimumAge of Eligibility*, 1990-2003
Juveniles Sentenced to DeathMinimum Age
Total
8566151212810147531
112
Juvenile Death SentencesMinimum Age
1733428955
474511
61
Total
9567181312811147742
123
Year
19901991199219931994199519961997199819992000200120022003Total
Source: Streib, June, supra note 20.* Data include first death sentences that originated during the study period. Data include death
sentences for two defendants fifteen years of age, the first in 1990 in Alabama, the second in 1991 inFlorida. The current minimum death penalty age is seventeen in Florida and sixteen in Alabama.
- v

JEFFREY FAGAN & VALERIE WEST
The rate of decline in the number of juveniles sentenced to death isgreater than the decline in the number of adults sentenced to death, boththose in the next closest demographic group-ages eighteen to twenty-four-and persons age twenty-five and older. Table 5 compares thenumber of persons sentenced to death in each of these three age groupsfrom 1990 to 2002. 94 For example, the number of juveniles sentenced todeath declined from fourteen in 1999 to three in 2002, a drop of 79%. Inthe eighteen to twenty-four age bracket, the number of persons sentenced todeath declined from eighty-nine to forty-three in the same time period, adecline of 52%; among persons twenty-five and older, the number ofpersons sentenced to death declined from 161 to 97 during this period, adrop of 40%.
Table 5Total Persons Sentenced to Death by Year and Age in Juvenile Death
Penalty States, 1990-2002
Year Under 18 18-24 25 and Over Total1990 8 69 178 2551991 5 91 168 2641992 6 98 164 2681993 6 112 154 2721994 15 121 163 2991995 12 122 164 2981996 12 109 177 2981997 8 100 155 2631998 10 112 166 2881999 14 89 161 2642000 7 69 146 2222001 5 55 99 1592002 3 43 97 143Total 111 1,190 1,992 3,293
Sources: SNELL & BONZCAR, supra note 79; Streib, December, supra note 20.
Another way to gauge the decline is to examine the drop from the peakrate during the study period. The number of juveniles sentenced to deathdeclined from the peak yearly incidence of fifteen (in 1994) to three (in
94 Table 5 excludes juveniles sentenced to death in 2003, since comparable data are notavailable for adults during that year.
[Vol. 95

2005] DECLINE OF THE JUVENILE DEATH PENALTY 457
2002), a decline of 82%. For persons ages eighteen to twenty-four, thenumber of persons sentenced to death declined from a peak incidence of122 (in 1995) to 43 (in 2002), a decline of 65%. For persons twenty-fiveand older, the number of persons sentenced to death has increased anddeclined cyclically during the study period, declining from a peak of 178(in 1990) to 154 (in 1993), increasing again to 177 (in 1996), and thendeclining again to 97 (in 2002). The total decrease from the peak of 178 in1990 to the low of 97 in 2002 is 45.5%. Thus, considering either of thesetwo age categories, the rate of decline in the number of juveniles sentencedto death is far greater than the rate for older murder defendants.
Fgure 2a. Death Sentences By Year and Age, States with theDeath Penalty for Juveniles, 1990-2003
-$-Tota Juvenile Death SentencesIOD .,=. Death Sentences 18-24 year olds -
U U ~L~ath Sentences 18-24 year s0
CI
0 o
14 40 10
04 M0 9 93 19$ I5 16 W 19 99 M M M 2
Figure 2b. Persons Sentenced to Death By Year and Age, Stateswith the Death Penalty for Juveniles, 1990-2002
121
OD
08
40
0 2D
1940 191 192 193 14 199 1996 1997 1998 19W 20M 2001 2002 203

JEFFREYFA GAN & VALERIE WEST
The same trends are evident when we examine the total number ofdeath sentences (including re-sentencings), as opposed to the total numberof persons newly sentenced to death (excluding re-sentencings). Figure 2ashows the changes over time in the total number of death sentencesimposed per year, comparing juvenile defendants with defendants eighteento twenty-four years of age. Figure 2b shows the changes over time in thetotal number of persons sentenced to death per year (excluding re-sentencings), comparing the same age groups.95
95 The trends in juvenile death sentences in the post-Stanford era differ in two importantrespects from the trends in juvenile death sentences in the decade preceding Stanford. First,Table 6 shows that the count of juveniles sentenced to death (excluding re-sentencings) from1980 to 1989 fluctuated in a "roller-coaster" pattern of increases and declines over thedecade. Starting with six juveniles sentenced to death in 1980, the number increased tothirteen in 1982, then declined to four in 1984 before rising again to eight in 1986. A one-year decline in 1987 (to two) was followed by another increase in 1988 (to five), thenanother decline to one in 1989. Thus, in this decade, no period of decline lasted longer thantwo years. In comparison, Table 4 shows that juvenile death sentences in the post-Stanfordperiod featured longer and more sustained declines of three years (1995-1997) and fouryears (2000-2003).
Table 6. Persons Under 18 Sentenced to Death, 1980-1989
Year Juvenile Death Sentences
1980 6
1981 6
1982 13
1983 6
1984 4
1985 5
1986 8
1987 2
1988 5
1989 1
Second, the rate of juvenile death sentences per juvenile homicide arrest also issubstantially lower in the post-Stanford era compared to the rate in the decade precedingStanford. Although there were more juvenile death sentences post-Stanford compared to thepreceding decade, the juvenile homicide arrest rate was far lower during the 1980s than the1990s. The national homicide arrest rate for sixteen-year-olds rose from 12 per 100,000 in1985 to 36 per 100,000 in 1995; the rate for seventeen-year-olds rose from 20 per 100,000 in1985 to 51 per 100,000 in 1995. See Blumstein, supra note 73, at 20-24. From 1980 to1989, we calculated that the rate of death sentences per juvenile homicide arrest, in the stateswith valid juvenile death penalty statutes, was 1.06. From 1990 to 2003, the comparable ratewas 0.76, about 28% lower. See infra note 104 regarding the limitations of juvenilehomicide arrest data in the UCR.
[Vol. 95

2005] DECLINE OF THE JUVENILE DEATH PENALTY 459
B. STATE COMPARISONS
Most juvenile death sentences during the study period wereconcentrated in three states: Texas, Florida, and Alabama. Since 1973,these three states accounted for 114 of the 226 juvenile death sentences inthe United States (50.4%). Tables 6 and 7 show that from 1990 to 2002,these three states accounted for 65 of the 111 juveniles- newly sentenced todeath (58.6%), and 71 of the 121 total juvenile death sentences (58.7%).
Table 7 and Figures 3a and 3b show that the concentration of juveniledeath sentences in these three states correlates positively with their overalldeath sentencing patterns.96 Texas ranks first in juvenile death sentences,first in death sentences for young adults ages eighteen to twenty-four, andfirst in total adult death sentences in the U.S. since 1990. Alabama rankssecond, fourth and fifth, respectively, in these three categories, and Floridaranks third, second and second, respectively, in these categories. A secondgroup of states97 sentenced between five and eight juvenile offenders todeath during the study period, ranking them fourth through sixth. Amongthese "middle" ranked states, their ranks for number of persons ageseighteen to twenty-four sentenced to death varied from third (NorthCarolina) to thirteenth (South Carolina), and their ranks for total number ofadults sentenced to death ranged from third (North Carolina) to twelfth(Mississippi).
The lower rate in the 1990s is even more noteworthy given the dramatic increase injuvenile homicide arrest rates nationally from the decade of the 1980s to the decade of the1990s and the punitive climate toward juvenile crime that consequently characterized the1990s. See PATRICIA TORBET ET AL., U.S. DEP'T OF JUSTICE, STATE RESPONSES TO SERIOUS
AND VIOLENT JUVENILE CRIME 1-2 (1996) (showing that since 1990, every state has adoptedone or more statutory strategies to transfer some chronological juveniles to criminal courts).See generally BARRY C. FELD, BAD KIDS: RACE AND THE TRANSFORMATION OF THE JUVENILECOURT (1996) (showing how the boundaries of the juvenile court have been reduced bypunitive attitudes toward adolescent offenders, and the increasing prevalence of violentcrime and minority youths); DAVID GARLAND, CULTURE OF CONTROL (2001) (discussingchanges in societal attitudes toward crime and punishment and their origins in cultural andpolitical change, both in the U.S. and the U.K.); FRANKLIN E. ZLMRING, AMERICAN YOUTHVIOLENCE (1999) (discussing trends toward greater use of adult criminal sanctions forjuvenile offenders).
96 In Figures 4a and 4b, the states are arrayed from left to right according to the numberof persons sentenced to death during the study period (4a) and number of juvenile deathsentences (4b).
97 Those states are Louisiana, Arizona, Mississippi, North Carolina, South Carolina, andVirginia.

JEFFREY FAGAN & VALERIE WEST
Table 7Persons Sentenced to Death in States with Valid Juvenile Death Penalty
Law by State, * Age, and Rank, 1990-2002
Age and RankUnder 18 18-24 AllAdults
State Sentences RankTXALFLLAMSAZNCSCVAGAMONVPAARKYOKWADEIDINMTNHSDUT
361712865555222211110000000
123456666777788889999999
Sentences2057011939342775223244182560148
43210291021
Rank14289113131061412515187191619172021192021
Sentences4361603349071103230727293836419047271206
2815294055
Rank152912731111810134141761916181521232020
Sources: SNELL & BONZCAR, supra note 79; Streib, June, supra note 20.*Montana (1999), Indiana (2002) and Washington (1993) ended capital sentencing for juveniles duringthe study period. Data for adults sentenced to death in these three states are only for the period duringwhich these states were able to sentence a juvenile to death.
[Vol. 95

2005] DECLINE OF THE JUVENILE DEATH PENALTY
Figure 3a. Persons Sentenced to Death by Age and State, inActive Juvenile Death Sentencing States, 1990-2002
500
400 EAge Under 184)400U EAge 25 and Over
SAge 18-24
W 300 --
2000
.0
~100z
TX AL FL LA MS NC VA AZ SC GA MO NV PA OK AR KY WA
State
Figure 3b. Death Sentences by Age and State, in ActiveJuvenile Death Sentencing States, 1990-2002
500
0 400
./ 300
2000
E looZ
TX AL FL LA MS NC VA AZ SC GA MO NV OK PA AR KY WA
State

JEFFREY FAGAN & VALERIE WEST
As Table 7 shows, there is a small group of states whose rankings onjuvenile death sentencing are inconsistent with their ranking on adult deathsentencing. For example, Oklahoma had only one juvenile offendersentenced to death between 1990 and 2002, but had 120 adults sentenced todeath during this period, a ratio of 120:1. Pennsylvania similarly had onlytwo juveniles sentenced to death, but 190 adults sentenced to death, a ratioof 95:1.
The states with no juveniles sentenced to death during the study periodalso generally ranked lowest in number of adults sentenced to death.Nevertheless, there are three states-Delaware, Idaho, and Indiana-thathad no juvenile death sentences during the study period but had betweenfifteen and twenty-nine adult death sentences per state. Accordingly, thereappear to be quite different norms influencing death sentencing patterns forjuveniles and adults in several states. 98
Table 8 shows the trends over time in number of persons sentenced todeath in the three highest ranking juvenile death penalty states-Texas,Alabama, and Florida-and the other juvenile death penalty states from1990-2002. The trends over time in these two groups of states suggestimportant distinctions in their death sentencing patterns. Figure 4a showsthat the number of juveniles sentenced to death in these three statesexceeded the numbers of juveniles sentenced to death in all other statescombined for most years in the time series. The gap between these threestates and the others was especially large from 1995-97, and again in1999. 99
98 State ranks can be somewhat misleading when they are considered separately from thehomicide arrests that create a pool of death-eligible defendants or when juvenile and adultdata are aggregated. Professor John Blume and his colleagues reported that from 1976 to1998, Oklahoma and Nevada imposed the most death sentences per homicide arrest. SeeJohn Blume et al., Explaining Death Row's Population and Racial Composition, 1 J.EMPIRICAL LEGAL STUD. 165 (2004); see also Adam Liptak, Study Revises Texas' Standingas a Death Penalty Leader, N.Y. TIMEs, Feb. 14, 2004, at AI0. These data do not considerjuveniles separately from adults, and Table 6 shows that there are stark differences inOklahoma and Nevada between juvenile and adult death sentences. For example, Oklahomahad one juvenile death sentence compared to 120 adult death sentences, or 0.8% of all deathsentences. In contrast, the comparable rate in Texas is 5.3%; in Florida, the rate is 3.5%, andin Alabama, the rate is 6.9%. In subsequent analyses, we index the juvenile death sentencerate to the juvenile homicide arrest rate, in effect disaggregating the results reported byProfessor Blume and his colleagues to develop indicia specific to juvenile death sentences.See infra Parts IV.C and V.
99 We limit these comparisons to persons sentenced to death; the patterns for total deathsentences are nearly identical.
[Vol. 95

2005] DECLINE OF THE JUVENILE DEATH PENALTY 463
Table 8Number of Persons Sentenced to Death, and Death Sentences, in Texas,
Florida, and Alabama, Compared to Other States, 1990-2002
Texas, Florida, AlabamaDeath Sentences Persons
Year Total 18-24 Under 18 Total 18-24 Under 181990 76 23 6 69 19 51991 85 30 3 79 29 3
1992 90 36 5 79 30 51993 77 38 2 75 38 21994 113 48 9 104 45 71995 94 41 8 93 40 81996 86 34 8 79 33 81997 70 30 6 68 29 61998 93 38 6 91 38 51999 85 29 9 80 25 92000 66 27 3 66 27 32001 49 24 4 48 24 22002 58 18 2 55 17 2
Total 1042 416 71 986 394 65
Other Juvenile Death Penalty StatesDeath Sentences Persons
Year Total 18-24 Under 18 Total 18-24 Under 181990 114 30 3 108 28 31991 126 44 2 120 42 21992 117 37 1 105 36 11993 140 51 5 129 47 41994 149 53 9 134 50 81995 147 49 5 126 45 41996 132 42 4 125 39 41997 131 47 2 120 45 21998 134 48 5 123 44 51999 116 40 5 106 34 52000 97 25 4 91 23 42001 66 21 3 65 20 32002 58 17 2 51 15 1Total 1527 504 50 1403 468 46SNELL & BONzAR, supra note 79; Streib, June, supm note 20

JEFFREYFAGAN& VALERIE WEST
Figure 4a. Juveniles Sentenced to Death in High StatesCompared to Other States, 1990-2002
1990 1991 1992 1993 1994 1995 1996 1997 1998 1999 2000 2001 2002
Figure 4b. Persons Ages 18-24 Sentenced to Death inHigh States vs. Other States, 1990-2002
1990 1991 1992 1993 1994 1995 1996 1997 1998 1999 2000 2001 2002
[Vol. 95
40 1-
20 I
-,-DS 18-24 in Other States-04=DS 18-24 in TX, FL AL

2005] DECLINE OF THE JUVENILE DEATH PENALTY 465
However, the number of juveniles sentenced to death in these threehigh-rate states declined beginning in 1997, and (after a one-year increase)declined sharply after 1999. Accordingly, the general secular decline injuvenile death sentences was evident in all the juvenile death-penalty states,not just in the states that used it most often or in other states that had used itless frequently.
Figure 4b shows the trends in death sentencing of defendants eighteento twenty-four years of age for the two groups of states. The trend lines arenearly identical, and both show a secular decline beginning in 1999 for thisage group. The decline in death sentencing of persons eighteen to twenty-four, however, is not as steep as the decline for juveniles. Accordingly,comparing Figures 4a and 4b suggests that the decline in death sentencingrates is more pronounced for juveniles than for young adults, both in thestates that had used the juvenile death penalty most often and in states thathad used it less frequently. 00 In subsequent multivariate analyses, 101 weintroduce controls for juvenile homicide arrests and populations below ageeighteen in each state and year, so that the trends in juvenile deathsentences are indexed to the homicide arrest rate.
C. JUVENILE DEATH SENTENCES AND THE DECLINING HOMICIDERATE
The possible counterfactual argument to the claim that decliningnumbers of juvenile death sentences signals an evolving standard opposingcapital punishment for juveniles is that any observed decline may simplyreflect declines in juvenile homicide offending. As the supply of juvenileoffenders eligible for death sentences decreases, we would expect thenumber of juvenile death sentences to decline. If there is an evolvingstandard that is specific to juveniles, we would expect the number ofjuvenile death sentences per homicide or per homicide arrest to decline at afaster rate than the number of adult death sentences per homicide, or perhomicide arrest. But if death sentences are declining generally, we cannotclaim that there is an evolving standard that is specific to juveniles. Weexplore this question by examining trends over time, first in the number ofjuvenile and adult death sentences per homicide, and second in the numberof juvenile and adult death sentences per homicide arrest.
1. Juvenile and Adult Death Sentences per Homicide
Table 9 shows the number of persons sentenced to death per 1,000
1oo We omitted 2003 from Figure 5a, so that the years align with Figure 5b.101 See infra section V.

JEFFREY FAGAN & VALERIE WEST
homicide victimizations in the U.S. froin 1990-2002 for persons undereighteen, persons ages eighteen to twenty-four, and persons twenty-five andolder. (We include all homicide victimizations to compute the deathsentencing rates, not just homicide victimizations within eachcorresponding age group. Although some juveniles commit homicidesagainst persons within their own age group, most juvenile homicideoffenders kill persons outside their own age group, usually persons three ormore years older. 102)
The data in Table 9 show that all three age-specific distributionsreflect a curvilinear pattern of increases followed by declines. However,the decline is greater for persons below eighteen years of age. From 1994to 2002, the rate of death sentences per homicide for juveniles declinedfrom 1.29 in 1994 to 0.35 in 2002, a decline of 72.9%. Since 1999, the ratedeclined from 1.67 per 1,000 juvenile homicide arrests to 0.35 in 2002, adecline of 79.0%.
Both of these substantial declines for juvenile homicide offenders werefar greater than the declines for adults. The number of homicide offendersages eighteen to twenty-four sentenced to death per 1,000 homicidevictimizations declined by 58.4% from the peak of 9.01 death sentences perhomicide in 1998 to a low of 3.75 in 2002.103 Among persons twenty-fiveand older, death sentences per 1,000 homicide victimizations declined37.9%, from a peak of 13.46 in 1999 to 8.31 in 2002. Figures 6a, 6b and 6cillustrate this comparative difference in the declines in juvenile homicidearrests per 1,000 homicides.
While these figures suggest a sharp contrast between the trends forjuvenile and adult death sentencing, they are hardly dispositive of the claimthat juvenile death sentencing rates are declining faster than rates for adults.That is, we cannot rely solely on the death sentencing rate per homicide
102 From 1985 to 1995, in cases where the age of the offender is known, about one in
four of the victims of homicide offenders ages thirteen to seventeen were within the sameage group. Three-fourths of the victims of juvenile homicide offenders were eighteen yearsof age or older, and most of those were age twenty-five and older. See Philip J. Cook &John H. Laub, The Unprecedented Epidemic in Youth Violence, 24 CRIME & JUSTICE 27, 48-50 & 48-50 tbls.3-5 (1998). From 1988-99, we analyzed the Supplemental HomicideReports (SHR) to measure the relationship between age of victim and age of offender inhomicide cases where the offender age is known. See Table 2 and Appendix A (data notshown, available from authors). We find a pattern nearly identical to the pattern found byCook and Laub: 25.5% of juvenile homicide offenders kill persons who also are juveniles,while 74.5% kill persons who are over age seventeen. Cook and Laub show in Tables 4 and5 that the these patterns are stable for 1985, 1991, and 1995, despite enormous differences inthe juvenile homicide arrest rate at that time.
103 2002 is the last year when accurate age-specific homicide arrest data are availablenationally.
[Vol. 95

2005] DECLINE OF THE JUVENILE DEATH PENALTY 467
victimization. Many homicides may not be eligible for capital punishment;clearance rates for homicides vary extensively over time and acrossjurisdictions; and changing laws can expand or narrow the types of crimesthat may qualify for capital punishment. Having said that, there is noreason to assume that the percentage of offenders who are deemed to bedeath-eligible would vary across states, or that this proportion within anystate would vary one year to the next. In other words, although not allhomicides are eligible for capital punishment, there is no reason to expectvariation between states, or from one year to the next within any one state,in the proportion of homicides in any age group that are capital offenses,and it is therefore reasonable to assume that the estimates are not biased bythese factors.
Table 9Persons Sentenced to Death Per 1,000 Homicides by Year and Age,
1990-2002Age
Year <17 18-24 > 25 Total1990 .68 4.02 10.61 15.311991 .40 5.69 9.85 15.941992 .51 5.64 9.65 15.801993 .50 7.02 9.42 16.941994 1.29 8.20 11.05 20.631995 1.12 7.95 11.41 20.481996 1.20 7.17 11.96 20.331997 .82 7.57 10.95 19.341998 1.10 9.01 13.41 23.511999 1.67 7.03 13.46 22.152000 .83 5.96 12.15 18.952001 .58 5.06 7.48 13.112002 .35 3.75 8.31 12.41
Source: BUREAU OF JUSTICE STATISTICS, U.S. DEP'T OF JUSTICE, CAPITAL PUNISHMENT 2001 (2002);FED. BUREAU OF INVESTIGATION, supra note 80; Streib, April, supra note 20.
Another way to consider these data is to examine the ratio of personssentenced to death per 1,000 homicides in the various age groups. In 1998,for example, based on the figures in Table 9, the ratio of persons eighteen totwenty-four sentenced to death per homicide to juveniles sentenced to deathper homicide was 8.2 (9.01 1 1.10). In 2002, the ratio was 10.71 (3.75 10.35). In 1998, the ratio of persons over age twenty-five sentenced to deathper homicide to juveniles sentenced to death per homicide was 12.2 (13.41 I

JEFFREY FAGAN& VALERIE WEST
1.10); in 2002, it was 23.7 (8.31 I 0.35). Thus, there was a substantial gapin death sentences per homicide between juveniles and adults, and the gapincreased over time. While prosecutors and juries have always been morereluctant to seek or use capital punishment for juveniles, that reluctanceseems to be growing steadily.
2. Juvenile and Adult Death Sentences per Homicide Arrest
We next turn to death sentences per homicide arrest. Homicide arrestsare an important baseline from which to gauge trends in death sentences,since arrestees are the supply of defendants for capital trials and sentences.Not all arrests for homicide are for capital murder, but again we assume thatbetween-state differences in types of homicide and clearance rates arestable within years, and therefore year-to-year differences in the juvenile-adult comparisons are reliable estimators of the attitudes of juries andprosecutors when we compare states over time. In Figure 5 and Table 10,we compute the rate of persons sentenced to death per 100 homicide arrestsboth for juveniles and for all adults, for the post-Stanford era.'0 4
104 We use all juvenile homicide arrests for persons below eighteen years of age, rather
than specific counts of homicide arrests for sixteen- and seventeen-year old homicideoffenders. (Specific counts of persons sixteen and seventeen years of age who were death-eligible do not exist.) There are both conceptual and practical reasons for this decision.
The practical reasons are data availability and missing data. To estimate the count ofhomicide arrests of sixteen- and seventeen-year olds by state and year, we first turned to theSupplementary Homicide Reports (SHR), a specialized homicide data reporting systemmaintained by the Federal Bureau of Investigation as part of its Uniform Crime Reportsystem. The data for 1975-97 are available at http://www.icpsr.umich.edu/cgi-bin/bob/archive?study=9028. Beginning in 1998, the data for each year are maintained inseparate files. The data for 1998 are available at http://www.icpsr.umich.edu/cgi-bin/bob/archive?study=2906. The data for 1999 are available at http://www.icpsr.umich.edu/cgi-binibob/archive?study=3162. The data for 2000 are available athttp://www.icpsr.umich.edu/cgi-bin/bob/archive?study=33448. For 2001, the data areavailable at http://www.icpsr.umich.edu/cgi-bin/bob/archive?study=3722, and for 2002, thedata are available at http://www.icpsr.umich.edu/cgi-bin/bob/archive?study=3999. Thesedata do report the age of the offender, but they do not provide information on arrestees'capital eligibility. There are critical missing data problems in the SHR, as well. These datado not provide full coverage of all states, either within a given year, or over time. Forexample, data for Florida are absent from the Supplementary Homicide Reports for nine ofthe fourteen study years. For states with reported events, it is unknown if the observedvariation in the number reporting agencies is due to actual variation in the number ofagencies with homicide arrests, or to a failure to report. For example, homicide arrest datafor Alabama are based on as few as two reporting agencies in 1999 and as many as 100 in1994. Most states, large and small alike, follow this pattern. For example, the range inTexas is 305 to 226 reporting agencies and in Montana the range is one to fourteen reportingagencies over the study period. Using incomplete data from the SHR on age-specificjuvenile homicide arrests would risk censoring whole states and years, and would likely biasestimates of juvenile death sentences by inflating the rate at which juveniles are sentenced to
468 [Vol. 95

2005] DECLINE OF THE JUVENILE DEATH PENALTY 469
In these analyses, we lag the homicide arrests by two years, to reflectthe fact that there is generally a significant lapse of time between arrest andsentencing. We estimate an interval of two years based on prior research onprocessing of capital cases. 10 5 To verify the validity of the two-year timelag, we estimated the time from arrest to death sentence based on records insamples of ten cases from 1990 to 1999 in Texas, Florida and Alabama, thethree states with the highest number and percentage of juvenile deathsentences. 10 6 The lag ranged from seven to thirty-eight months across thesecases; the average time lag was 21.9 months, and the median time lag wastwenty-four months. Accordingly, we use a time lag of twenty-four monthsin estimating the duration from arrest to sentencing.
death in some states but not others.To account for missing data, we then turned to the SOURCEBOOK OF CRIMINAL JUSTICE
STATISTICS, available at www.albany.edu/sourcebook (last visited July 7, 2004). TheSourcebook integrates data from over 100 sources of criminal justice information in theUnited States. The Sourcebook reports the total number of persons under the age of eighteenarrested for homicide, but not age-specific counts by state and year. In general, theSourcebook provided fuller coverage and, when all juvenile arrests were compared betweenthese two data sources, consistently reported a higher number of juvenile arrests.
We therefore adopted a conservative approach: for each state-year observation, weused the larger number of homicide arrests of persons under the age of eighteen from theSHR and the Sourcebook. Since we use all juvenile homicide arrests, including arrests ofthose under sixteen and therefore too young to be sentenced to death, our calculation of therate at which juveniles are sentenced to death is somewhat lower than the rate would be ifonly arrests of sixteen-and seventeen-year olds were considered. Nevertheless, since allstates and years are similarly affected by this bias, and assuming the age-specific distributionof juvenile homicide arrests varies little from year to year, we can make reliablecomparisons over time between states. See Alfred Blumstein, supra note 73, at 20-24.
In the political ecology of states and courts that sentence juvenile homicide offenders,it is reasonable to assume that death sentences for eligible juvenile offenders (ages sixteenand seventeen) would be influenced by total patterns of juvenile homicide, especially thosethat receive political attention and popular interest. These totals will include juvenilehomicide offenders under sixteen, whose actions may well be generalized politically andculturally to the broader pool of juvenile homicide offenders.
1o5 See Liebman et al., A Broken System, Part I, supra note 65.106 We reviewed ten randomly selected cases from both urban and rural counties across
each state, representing each state's major population center as well as medium- and small-sized counties. The range of years spanned the decade from 1990-2000. We excluded 2001and later due to the small number of juvenile death sentences and the attendant samplingproblems. We computed the time from incident to arrest, and then from arrest to deathsentence. In Florida, the lag time from arrest to sentencing ranged from seven to twenty-sixmonths, and averaged 15.8 months. In Alabama, the average length of time between arrestand death sentence was twenty-six months, with a range of fifteen to thirty-eight months. InTexas, the lag time from arrest to sentence was 23.4 months, with a range of eleven to thirty-eight months. Data and citations are available from the authors.

JEFFREY FAGAN & VALERIE WEST [Vol. 95
Figure 5. Persons Sentenced to Death Per 100Homicide Arrests Lagged by Two Years,
1990-20034
-- Adult DS Rate--e-Juenie DS Rate
-r
- 2
cfl 1 -_ _
(U
01990 1991 1992 1993 1994 1995 1996 1997 1998 1999 2000 2001 2002 2003
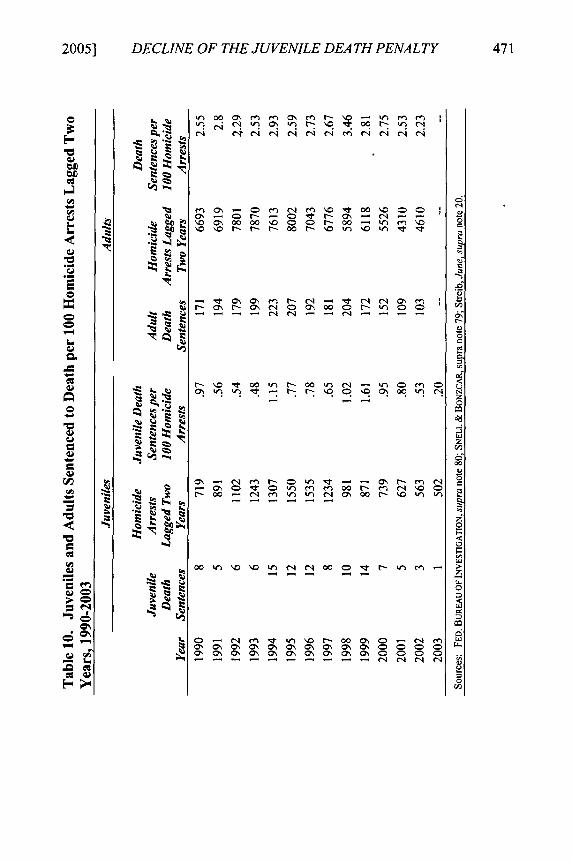
2005] DECLINE OF THE JUVENILE DEATH PENALTY
°,
'*. ~ I~ 0n - N eQ . r- 00 0'. 0) m N e~~~~~~~~C4 A' CN'. Cc. a'4' ' ' ' ' '
- 0 C-- 0 ~r- "o - (
-l cl) oi m~e -r r4~r~o
r- 0' C- '. 0 0'= 00 00 W-f)0
t- t. 0 - 00 r- (N -n o W)~
0'. 'r I. ~ r- N .; 0 'IT 0' 00" '.
0'c) -, c) t- 'n 1-c,
r- 0C'IT w W) 0r- ~ 00 C1 (N M. 0>
t- 00 c- (N W (n 0ll 00 r- %.0 'f' tn
00 W) '.1'0 Itn CN (N 000 It !r- .' m -

JEFFREYFAGAN & VALERIE WEST
Table 10 and Figure 5 show that prior to 1999, the rate of juvenilessentenced to death per 100 homicide arrests varied from year to year withno consistent upward or downward trend. Although the rate at whichjuveniles were sentenced to death was well below the rate for adultsthroughout the period, the two trend lines moved roughly in lockstep. Since1999-the peak year for juveniles-the rate of decline in the rate of
juveniles sentenced to death per juvenile homicide arrest has been fargreater than the decline in the rate for adults since its peak (in 1998). Therate for juvenile cases declined from 1.61 to .20 between 1999 and 2003, adrop of 87.6%; by comparison, for adult cases, the rate declined from 3.46to 2.23 between 1998 and 2002, a drop of 35.5%. Thus, the rate of declinefor juveniles during this period was more than 2.5 times the rate of declinefor adults. By any mathematical index of comparative rate change, thechange for juvenile death sentences has been far greater than that for adultdeath sentences.
This trend was evident both in the three high-rate states and in statesthat sentence juveniles to death less frequently. Figure 6a shows the trendfor Florida, Alabama, and Texas from 1990 to 2002. (Data for adult deathsentences in 2003 have not yet been released). Since 1998, there has been avery small decline in adults sentenced to death per 100 homicide arrests inthe three high-rate states. Figure 6a shows that the rate fell from 3.85 adultssentenced to death per 100 homicide arrests in 1998 to 3.35 in 2002, adecline of 13.0%. For juveniles, on the other hand, there was a sharpdecline in the rate of persons sentenced to death per homicide arrest, from3.06 in 1999 to 1.07 in 2002-a decline of 65%. Even if we consider the1999 peak as an outlier or temporary departure from a longer-term trend,the juvenile rate still declined from its 1990 rate of 1.61 to the 2002 rate of1.07, for a drop of 33.5%. Again, the rate of decline for juvenile deathsentences per homicide arrests is twice that of adults. Either interpretationleads to the conclusion that there has been a secular decline in thefrequency of juvenile death sentences in the three states that account for themajority of juvenile death sentences-and that the decline has beensignificantly greater than the analogous decline for adults.
But the downward trend is not confined to these three states. In theremaining juvenile death penalty states, the decline in the rate of juvenilessentenced to death per 100 juvenile homicide arrests was greater than thedecline for adults. As Figure 6b shows, the rate for juveniles declined from0.87 in 1999 to .27 in 2002, a drop of 69.0%. By comparison, the adult ratedropped from a peak of 3.23 in 1998 to 1.65 in 2002, a drop of 48.9%.
These figures show that in both high- and low-rate death sentencingstates, the decline in the rate at which juveniles are sentenced to death
[Vol. 95

2005] DECLINE OF THE JUVENILE DEATH PENALTY 473
significantly outstrips the analogous decline in adult death sentencing.Once again, these trends support the conclusion that societal norms areshifting away from the use of the juvenile death penalty.
Figure 6a. Persons Sentenced to Death Per 100 HomicideArrests Lagged Two Years, Texas, Alabama and Florida,
1990-2002
4
W5 0.2
EX - > 3 .. . . . ...
4) 0)
CLa) 2
4 m . '-*e-Under 18 Rate
_E=Over 18 Rate
Figure 6b. Persons Sentenced to Death Per 100Homicide Arrests Lagged Two Years, Medium and Low
Juvenile Death Sentencing States, 1990-2002
1990 1991 1992 1993 1994 1995 1996 1997 1998 1999 2000 2001 2002 2003
-0-Under 18 Rate
"4P"Over 18 Rate
JEFFREY FAGAN & VALERIE WEST
V. MODELING THE DECLINE IN JUVENILE DEATH SENTENCES: EVIDENCE
OF EVOLVING NORMS
The preceding sections show that there has been a large and sustaineddecline in the use of the juvenile death penalty in state courts since 1989,compared to declines in death sentences for adults. The decline forjuveniles is greater than the decline for adults in absolute numbers, and it isalso greater than the analogous decline for adults after sentencing rates areindexed to the homicide rate and to the homicide arrest rate.
There are several possible counterfactual explanations for the declinein juvenile death sentences: a decline in the supply of cases due to a lowermurder rate and fewer juvenile homicide arrests; changes in the size of theyouth population; a general social trend opposing death sentences for bothyoung adults (ages eighteen to twenty-four) and juveniles; the presence ofother social and political factors that would alter the political ecology andlegal context of charging and death sentencing.' 0 7 The growing prevalenceof exonerations in capital cases 08 and the high rate of reversals of capitalsentences in state appellate courts' 0 9 may also contribute to the reluctanceof juries to impose death sentences. The contribution of these factors maysignal a loss of faith in the capacity to reliably and accurately implementcapital sentences, but not a normative shift away from the use of the penaltyon juvenile offenders.
Accordingly, we tested whether changes in the social, political, andnormative cultures of the United States have produced an evolving standardthat increasingly opposes the use of capital punishment specifically forjuveniles. We estimated multivariate statistical models to examine thecontributions of several factors that might produce a decline in juveniledeath sentences, including the possible counterfactual explanations thatchallenge the claim that there is an "evolving standard" opposing thejuvenile death penalty.
A. MODEL ESTIMATION
1. Model Specifications
In the models that follow, the dependent variable is juveniles
107 See, e.g., Liebman et al., A Broken System, Part II, supra note 65 (discussing social
and political factors that influence error rates in capital sentences).108 For a listing of exonerations of persons who received death sentences since 1989, see
Gross et al., Exonerations early draft, supra note 54, at app. at 27-31.109 See, e.g., Liebman et al., A Broken System, Part I, supra note 65; Liebman et al., A
Broken System, Part 11, supra note 65.
[Vol. 95

2005] DECLINE OF THE JUVENILE DEATH PENALTY 475
sentenced to death; we did not include re-sentences for the reasonsdiscussed earlier. The general analytic model estimates the probability of ajuvenile death sentence in a state-year, controlling for the number ofjuvenile homicide arrests lagged by two years (i.e., the supply of personseligible for the death penalty)." 10 In the zero-inflated Poisson (ZIP) model,we specify an inflation factor that adjusts for the excessive number of zerosin the dataset. Most of the zeros are located in states with medium and lowtotal death sentencing rates."' Therefore, we include a binary variable asan indicator of whether the state is one of those that produces a highnumber of zeros.
We include an indicator for both a linear time trend (Time) and aquadratic time trend (Time x Time, or Time2). Time2 accounts for the non-linear shape of the distribution of both juvenile death sentences and juvenilehomicide arrests over the study period. 12 We include a dummy (binary)variable for the most recent four-year period of sustained decline in juveniledeath sentences (2000-2003) to test whether the number of juvenile deathsentences after the 1999 spike is lower than in the years before (Post-1999).
We then include an interaction term in separate models-a multiplierof each of the time trends by the Post-1999 variable-to test specificallywhether the slope of the downward trend after 1999 is significant. This is acritical test of the existence of an evolving standard regarding the juveniledeath penalty. By testing for the significance of the slope (downwardtrend) with both the linear and quadratic time trend, we can show whetherthe rate of change-that is, the slope of the downward trend-is asignificant predictor of the juvenile death sentencing rate. We do thisseparately for the interaction of the post-1999 measure with the linear timetrend (TIME) and the quadratic time trend (TIME2 ), and report the resultsas separate models. In each table, we report the regression coefficients,whether they are statistically significant, and the overall model statisticsthat show its strength and predictive power. As we show below, we obtainsimilar results with similar implications using these two constructions of thetime trend.
The models control for the supply of juvenile homicide defendants byincluding the number of juvenile homicide arrests as an "offset" in the
110 The time lag between arrest and death sentencing for juveniles is approximately two
years. See supra Part IV.C.2.1 Texas, Florida, and Alabama account for 65 of the 112 juveniles sentenced to death
from 1990-2003. See supra Tables 6-7.112 This curvilinear distribution is an inverted "U", with an increase in the early 1990s
followed by a peak in 1994 and then a decline (with an interim spike in 1999) through 2003.See supra Figures 3a and 3b.

JEFFREY FAGAN & VALERIE WEST
model."13 We lag the count of juvenile homicide arrests by two years, 14
and use the logged value to relieve the effects of skewness and outliers onthe regression models. The use of an offset is a method for specifying an"exposure" variable, which identifies the size of the population that mightbe affected by the causal factors.1 15 The results and predicted deathsentencing rates are adjusted to reflect this exposure measure, but asignificance test for this variable is not computed in this procedure. In theZIP model, we include an "inflation" factor that adjusts the results to reflectthe large number of zero observations. In the non-inflated Hurdle Poissonmodels, we address this factor by using a binary (dummy) variable thatindicates whether the state is a medium or low death sentencing state toadjust for zero-inflation." 6 The exposure and inflation measures areincluded in each iteration (stage) of the analyses. Note that we do notreport the effects of the inflator in either set of models (it was notsignificant in either specification).
We also include a control variable for the number of death sentencesfor eighteen to twenty-four year old defendants in each state-year during theperiod. We use the natural log of this count, since the count is skewed. Bycontrolling for death sentences in this next oldest age bracket, we candetermine if the decline in juvenile death sentences is predicted by a moregeneral secular trend opposing the death penalty, or if the decline forjuveniles is age-specific and distinct from other norms on capitalpunishment.
Additional control variables include the murder rate per 100,000population and the residual of the murder rate. The residual is an estimatorthat allows us to control for unmeasured variables that contribute to state-level variation in the murder rate. Since the murder rate is correlated withseveral state-level social structural variables, 17 we estimated regression
113 The offset is the functional equivalent of computing a rate of death sentences per
juvenile homicide arrest. But by including the count as the dependent variable, and theoffset as a predictor, we allow for the possibility that the joint distributions may vary overtime. This is one of the essential components of a Poisson model. See GREENE, supra note84.
114 The two year time lag is designed to adjust for the time delay between arrest andsentencing. See supra Part IV.C.2.
115 BRUCE K. ARMSTRONG ET AL., PRINCIPLES OF ExPosURE MEASUREMENT IN
EPIDEMIOLOGY (1992).116 See Table 3, supra, for data on the number of death sentences by state.117 Murder and social structural variables are endogenous, and determining causal
direction often is difficult. See, e.g., Lauren J. Krivo & Ruth D. Peterson, The StructuralContext of Homicide: Accounting for Racial Differences in Process, 65 Am. Soc. REV. 547(2000); Kenneth C. Land et al., Structural Covariates of Homicide Rates: Are There AnyInvariances Across Time and Social Space?, 95 AM. J. Soc. 922, 922-32 (1990). See
[Vol. 95

2005] DECLINE OF THE JUVENILE DEATH PENALTY 477
equations that predict the homicide rate in each state-year from thesevariables. The unstandardized residuals from these regressions represent
the components of the murder rate that reflect factors that are not
represented by these well-known and widely tested social structural factors.
Since these same state-level social structural factors are correlated with
death-sentencing rates, 1 8 we include several in the models predictingjuvenile death sentences. We also include measures of political pressureand punitiveness that were significant predictors of death sentencing anderror rates in death sentences. 1 9 Finally, we include the percentage of the
total population that is below age eighteen as a proxy for the size of thepopulation at risk for both juvenile homicide and capital punishment.
To test for the robustness of these models, we re-estimated each set-ZIP and Poisson models-using a series of alternate assumptions, todemonstrate the stability of the results using alternate specifications of the
basic findings. These alternate specifications address the disproportionatecontributions of the three high juvenile death sentencing states to theoverall distribution of juvenile death sentences. Accordingly, we firstestimate models with all states, followed by a model excluding Texas, and athird model excluding the three high death sentencing states of Texas,Florida, and Alabama. In this way, we can estimate the generality of thedecline in juvenile death sentences in both high- and low-rate states.Finally, for each of the full models-the models with all predictors with the
linear interaction term, and the models with all predictors and the quadraticinteraction term-we graphically show the adjusted rate of juvenile deathsentences that accounts for the influence of the other factors. The meansand standard deviations of all the variables are shown in Appendix A.
generally Robert J. Sampson & Janet H. Lauritsen, Individual-, Situational-, and
Community-Level Risk Factors, in UNDERSTANDING AND PREVENTING VIOLENCE 1 (A.J.
Reiss, Jr. & J.A. Roth eds., 1994). In addition, many of the social structural factors thatexplain and predict homicide rates at the state level also predict death sentencing rates. SeeLiebman et al., A Broken System, Part 11, supra note 65. Including both homicide and socialstructure in the same model raises risks of multicollinearity and endogeneity that woulddistort the regression results. Also, since the murder rate is serially correlated from year toyear, controls are needed to adjust for the potential inflation of its contribution to deathsentencing. Computing the residual accomplishes this. Accordingly, we use a measure ofthe residual of the murder rate to account for the unique contributions of the murder rate ineach year to the prediction of juvenile death sentences. We compute the residual byestimating a regression model with the murder rate as the predictor and social structuralvariables, such as poverty and family structure, as the predictors.
118 See Blume et al., supra note 98; Liebman et al., A Broken System, Part II, supra note65.
119 See Liebman et al., A Broken System, Part 11, supra note 65.

JEFFREY PAGAN & VALERIE WEST
2. Testing for the Effects of Exonerations
To test for the influence of exonerations on the decline in juveniledeath sentences, we extended the first set of Poisson models to includemeasures of the prevalence of exonerations both within each state and in thebroader national context. We computed two- and three-year averages forthe years preceding each year in the time series for each state. This wasdone for two reasons. First, we assume that the effects of exonerationswould not be limited to only those that might have occurred in thepreceding year. The residual perceptual effects of salient events such asexonerations may last for two or three years; beyond that time interval, theeffects of exonerations would be too distal to presume an effect, or wouldbe confounded with other intervening effects. Second, we computedaverages because of the sparseness of the data, and the burden of anexcessive number of zeros that might skew the parameter estimates in thePoisson regression models.120
Accordingly, to measure the effects of within-state exonerations, wecomputed each state's average number of exonerations for both two-andthree-year intervals preceding each year in the study. To measure theeffects of the broader national context in which exonerations take place, wecomputed the national average of exonerations in all death penalty states forthe preceding two-and three-year intervals for each year in the study. Wealso computed the total number of prior exonerations, both within each stateand nationally, for each year in the series. For the national exonerationdata, we computed total exonerations plus two- and three-year averages inthe preceding years, in three different ways: (1) all exonerations in alldeath penalty states, (2) all exonerations in juvenile death penalty statesonly, and (3) capital exonerations in all death penalty states.
We then computed an interaction term that combined the within-stateand national exoneration effects to estimate the combined effects of the twosources of exonerations. The interaction term is the most important of thepredictors in the model, providing a measure of the multiplicative effects ofthe state or national measures and capturing two independent sources of thepotential effects of exonerations on juror or judge decision making. Wetested these models using just the more conservative hurdle Poisson
120 There were fifty-one state-year data points with one or more exonerations in capital
cases in the juvenile death penalty states since 1989, only 12.3% of the 334 state-year datapoints. Because a Poisson distribution with a parameter X is a linear function of a set ofexplanatory variables (In X), an excessive number of zeros in a predictor would exert adownward bias on the estimation of that predictor and potentially inflate the parameterestimates of other predictors in the linear model. See PETER KENNEDY, A GUME TO
ECONOMETRmcs 245 (3d ed. 1994).
[Vol. 95
2005] DECLINE OF THE JUVENILE DEATH PENALTY 479
specification.
B. RESULTS
1. Identifying the Decline in Juvenile Death Sentences
The results of the models using the linear interaction term are shown inTable 11. The first three columns in Table 11 report the results of the ZIPmodels, and the second three report results of (non-zero-inflated) Poissonregressions. In each cell, we show the regression coefficient and thestandard error (in parentheses). We report statistical significance at boththe p < .05 and p < .10 levels. 121
In the full model in Table 11, the Post-1999 * TIME interaction issignificant: the coefficient of -.81 shows that the downward trend in deathsentences after 1999 is statistically significant after controlling for thenumber of juvenile homicide arrests, the general time trends, the adult (ageseighteen to twenty-four) death sentence rate, the murder rate, the residual ofthe murder rate, 22 the youth population, and the state covariates. Note alsothat the murder rate is significant and positive: there are more deathsentences in state-years with higher homicide rates.
The model excluding Texas is shown in the second column of Table11. We exclude Texas because of its substantially higher number of bothjuvenile and adult death sentences, including the high proportion of alldeath sentences that are given to juveniles. This concentration of deathsentences not only is substantively important, but it also carries thepossibility of biasing or skewing the results due to a disproportionatecontribution made by one state. 123
This model produces the same result. In fact, the coefficient for thetime interaction is slightly larger (-.83). This model shows that in statesother than Texas, there is a significant downward trend in juvenile deathsentences after 1999, controlling for the number of juvenile homicidearrests, adult death sentences (ages eighteen to twenty-four), the murderrate, and the youth population.
121 Note that the tables do not show the results for the state covariates, since they are not
directly related to the research question. These data are available from the authors.122 The residual measures the year-to-year variation in homicide rates and its relationship
to social structural factors that predict both death sentences and homicide rates. See supranote 115 and accompanying text.
123 See, e.g., Richard Berk, New Claims About Executions and General Deterrence: DejtiVu All Over Again?, J. EMPIRICAL LEGAL STUD. (forthcoming) (showing that the correlationbetween execution and homicide is heavily skewed by the high incidence of execution inTexas).
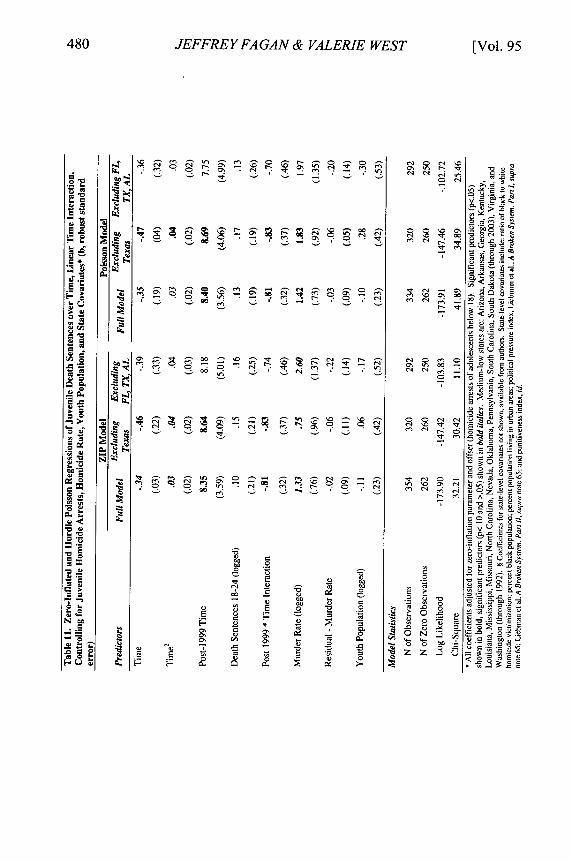
JEFFREY FAGAN & VALERIE WEST
0 C'. 0 ~0en e'~ o C') ~. O~ - C'- O~ ~ C') -~ en* en .0 . . C') . en . - .
00~ ~ R " Pn M C-
i
2
0~
4, ~
C
C-4,0
C
.0
00
04,
C 0~~0
0 4,3-C
- en03-3-04, (~
C
.000
- ; r, ',_r!C)
C')C'- C') ~ - C')
9 :: Q p C It,Cl~ 9 od 9 C') M. e .
LO 0
00 - 00
010o c 0
[Vol. 95
C4 CC'
C'4 0 mn
'C4
"r C
en * 0- 00

2005] DECLINE OF THE JUVENILE DEATH PENALTY 481
The third column in Table 11 shows the results of the ZIP regressions,this time excluding the three states with the highest number of juveniledeath sentences. These states accounted for more than half of the juveniledeath sentences since 1990.124 This time, none of the predictors isstatistically significant. The coefficient for the time interaction is slightlylower than in the other two ZIP models (-.70), but it is not statisticallysignificant (p=.l 1). The result is not surprising, considering how sparsedeath sentencing was after 1999 in the other states with valid juvenile deathpenalty statutes.
The next three columns in Table 11 show results of the non-zero-inflated Poisson regressions. Recall that we used this form of Poissonregression because the Vuong tests on the ZIP models were inconclusive.The conservative approach in that situation is to estimate the models usingPoisson methods, and compare the similarity of the two sets of results. Thepattern of results in all three models is nearly identical. The coefficients arenearly identical, and the pattern of statistical significance is similar. Thecoefficient for the interaction term again approaches significance (p=. 12),but does not reach the standard threshold of p=.05. The only differencebetween the ZIP and Poisson models in the third and sixth models is in thecoefficients for the murder rate. This predictor is not significant in themodel excluding the three high juvenile death sentencing states.
Overall, the regression models reported in Table 11 show a statisticallysignificant downward trend in juvenile death sentences in the years after1999 across a range of models that control for a wide range of social andlegal factors, and under two different modeling strategies.
Table 12 shows a parallel set of analyses, using the quadraticinteraction term of Post-1999 * Time2 , substituting the quadratic termTIME 2 in the interactions with the post-1999 indicator. This is an alternatetest of the significance of the downward slope of death sentences, a morerestrictive test that specifies a more accelerated decline. A significantinteraction term under these conditions would signify that the downwardslope meets a more rigorous and demanding test of its trajectory over time.
124 See Streib, December, supra note 20.

JEFFREYFAGAN & VALERIE WEST
a0
E
0~0~0~
0) 0)E E ~
*EZ *E: ~
¢ . ,,
[Vol. 95
"7
to o
e eq "
CD
oo
N CDen t
0 00

2005] DECLINE OF THE JUVENILE DEATH PENALTY 483
Table 13Persons Sentenced to Death by State and Year, 2000-2003
Year
State 2000 2001 2002 2003 Total
Texas 2 1 1 4Alabama 1 1Florida 1 1 2
Arizona 1 1 1 3North Carolina 1 2 3Louisiana 1 1 2Nevada 1 1ArkansasDelawareGeorgiaIdahoIndiana
§
KentuckyMissouritMississippiNew HampshireOklahomaPennsylvaniaSouth CarolinaSouth Dakota*UtahVirginiaWyoming*
Total 7 5 3 1 16§ Indiana banned the death penalty for juveniles by statute in 2002.* Wyoming and South Dakota banned the death penalty for juveniles by legislation in 2004.t Missouri banned the death penalty for juveniles in August, 2003.Source: Streib, June, supra note 20.

JEFFREYFAGAN& VALERIE WEST
The pattern of results is identical. The coefficients for the interactionof TIME2 * Post- 1999 are smaller compared to the coefficients in Table 11,but this is not surprising given the more demanding test using the quadratictime interaction term. Even with this more restrictive test, the quadratictime interaction is statistically significant in four of the six models; it is notsignificant in the models that exclude the three high juvenile death penaltystates (Texas, Alabama and Florida).
Overall, the results in Tables 11 and 12 provide consistent evidenceunder a variety of measurement and model specification conditions of asignificant downward trend in juvenile death sentences in the United States,especially in the period following 1999. Only when we exclude the threehigh states is the critical interaction term not significant.
The lack of significance when these three states are excluded may bethe result of the extreme sparseness of juvenile death sentences beginningin 2000, especially in the other states. Table 13 shows that seventy-two ofthe eighty possible state-year observations are zeros for the states, otherthan Texas, Alabama, and Florida, that had valid statutes during this time.Only one state (North Carolina) had more than one juvenile death sentencein any year during that period. This is a greater proportion of zeros than isobserved across the earlier period (1990-1999), when 199 of 243observations were zero, and for the entire study period, when 264 of 334observations were zero. It is not surprising, then, that the third and sixthmodels in each table are not significant. Achieving a valid statisticalprediction of such rare events is difficult, even under optimal and efficientmeasurement and sampling conditions. These patterns of sparse dataprovide additional evidence of the decline of juvenile death sentencingsince 1999.
In the last stage of the analysis, we generated predicted values forjuvenile death sentences that are adjusted for the explanatory variables inthe regression model. That is, we show the predicted rates of juvenile deathsentences per juvenile homicide arrest, adjusted for all the predictors inthese models. Figures 7 and 8 show the predicted values for juvenile deathsentences per juvenile homicide arrest that were generated from the fullmodels (with all states) in Tables 11 and 12. On a second axis, we show thejuvenile homicide arrest count, lagged by two years as it is in themultivariate models. 1
25
125 For example, the 1990 predicted JDS rate is predicted from the 1988 juvenile
homicide arrest count. The 1988 time point for juvenile arrests is shown in conjunction withthe 1990 JDS data point. At the other end of the series, the 2001 juvenile homicide arrestcount is shown with the 2003 JDS data point.
484 [Vol. 95

2005] DECLINE OF THE JUVENILE DEATH PENALTY
Figure 7. Juvenile Death Sentences per Year, Adjusted forPredictors including Linear Trend, by Juvenile Homicide
Arrests (Lagged 2 Years), 1990-2003
U.0
0- .3 .5
U) :=0.4=6
>0 CL.040.2
7 0.1
0.0
70
60
50 4
40
30 0
20
01990 1991 1992 1993 1994 1995 1996 1997 1998 1999 2000 2001 2002 2003
Figure 8. Juvenile Death Sentences per Year, Adjusted forPredictors including Quadratic Time Trend, by Juvenile
Homicide Arrests (Lagged 2 Years), 1990-2003
0.7
0.6
0.5
0 U)
C QJ '0.3=0
S0.2
C. 0.1
1990 1991 1992 1993 1994 1995 1996 1997 1998 1999 2000 2001 2002 2003
- Predicted JDS
-U-Juvenile Homicide Arrests (Lagged)
50
40..9 F50 0
20
10
0

JEFFREY FAGAN & VALERIE WEST
Figure 9 uses the linear Time interaction term to compute the predictedjuvenile death sentence rates; Figure 7 uses the more restrictive adjustmentbased on the quadratic (Time2) interaction. The figures are nearly identical.They show that the peak adjusted rate of juvenile death sentences perjuvenile homicide arrest was in 1996 (earlier than 1999), and declinedthereafter other than a one-year increase in 1999. The figures also show awidening gap between the predicted values for juvenile death sentences andjuvenile homicide arrests beginning in 2000. This four-year sustaineddecline in juvenile death sentencing, when indexed to the juvenile homicidearrest rate, and controlling for the murder rate, together with the longerseven-year decline in the adjusted rates, suggests the presence of legal andsocial dynamics that have reduced the use of the juvenile death penaltynearly to zero. Finally, in Figures 9 and 10, we show the predicted rates ofjuvenile death sentences together with 95% confidence intervals (CIs). ACI is a range of values that has a high probability of containing the effect orparameter being estimated. 26 If other information about the value of theparameter is available, it should be taken into consideration when assessingthe likelihood that the interval contains the parameter. In this context, thismeans that the effects of time trends, juvenile homicide arrests, the murderrate, population size, and social and political covariates are included in theestimation of the confidence intervals for each year. Generally, the widthof the CI gives us some idea about how uncertain we are about theunknown parameter (see precision). When the data are sparse, as in thecase of the declining number of juvenile death sentences and the generallyhigh number of zeros across the study period, a wider confidence intervalreflects the sensitivity of the estimates of these very low frequency eventsto the predictors that are included in the statistical model.
Figures 9 and 10 show again that the predicted juvenile death sentencerate per juvenile homicide arrest is declining over time. The trends arenearly identical for either of the two predictions: the predicted ratecontrolling for the linear interaction term of Post-1999 by Time, or themore restrictive condition of Post-1999 by Time2. Generally, the predictedrate of juvenile death sentences per juvenile homicide arrest is declining,especially since 1999, and the confidence intervals are stable throughout theperiod.
126 The 95% confidence interval is constructed in such a way that 95% of such intervals
will contain the parameter. Similarly, with a 99% confidence interval, 99% of theconfidence intervals will contain the parameter. For example, if the parameter beingestimated were i, the 95% confidence interval might look like:
12.5 - [pA- 30.2
[Vol. 95

2005] DECLINE OF THE JUVENILE DEATH PENALTY
Figure 9. Juvenile Death Sentences per Juvenile HomicideArrest by Year with 95%Confidence Intervals, Adjusted for
Linear Time Trend and Other Predictors, 1990-2003
Z.U
0 1.5
1.0
4) 0.0_ 0.5
01.004
0 -1.5
• -2.0
a)I- -
C
~ '2-, 0
-JDS Predicted
-95%CI
1990 1991 1992 1993 1994 1995 1996 1997 1998 1999 2000 2001 2002 2003
Figure 10. Juvenile Death Sentences Per Juvenile HomicideArrest by Year with 95%Confidence Intervals, Adjusted for
Quadratic lime Trend and Other Predictors, 1990-2003
1 11 9 9 1 JDS Predicted-95% Cl
1990 1991 1992 1993 1994 1995 1996 1997 1998 1999 2000 2001 2002 2003

JEFFREY FAGAN & VALERIE WEST
While the confidence intervals widen after 1999, they do not widen toan extent that would raise doubts about the functional form of the overalltime trend. Moreover, the widening confidence intervals are a reflection ofthe sparseness of the data beyond 1999: from fourteen juvenile deathsentences in 1999 to seven (2000), five (2001), three (2002) and one (2003)(see Table 13). The estimates of death sentences per homicide areparticularly sensitive under these conditions, a factor that accounts in partfor the widening confidence intervals. But the fact of one death sentence in2003, and the small and declining number in the preceding years, isunavoidable and uncontestable. The stability and narrow bite of the CIsunder these conditions suggests that the predicted rate of death sentencesper juvenile homicide rate is reliable.
2. The Effects of Exoneration on Juvenile Death Sentences
We estimated a set of models that included several measures of bothwithin-state and national patterns of exonerations. These measures wereadded to the models shown in Table 12. These models, estimated withquadratic time trends and using a hurdle Poisson specification, were themore stringent test of the decline in juvenile death sentences. Here, weshow the results in a slightly different form. In Table 14, we show thecomplete results of one regression model to illustrate the model form and itsresults. In Table 15, we summarize the results of the full set of models,showing only the probabilities associated with the regression coefficient foreach innocence measure. As in the previous models, all models again wereestimated with the full range of state covariates and controls for murderrates, adults death sentences, and population.
Table 14 shows that recent capital exonerations exert a statisticallysignificant downward influence on the number of juvenile death sentencessince 1989. The interaction of the two sources of exonerations combines tosignificantly lower the number of juvenile death sentences. The effect issignificant (p=.0 5 4), and the exponentiated regression coefficient(exp{f3}=.654) suggests that juvenile death sentences are 35% less likely tooccur in the presence of a recent capital exoneration either within the stateor nationally. Table 14 also retains the important finding that juveniledeath sentences had significantly declined since 1999, with the samecontrols for murder and arrest rates as well as adult death sentences andsocial and political factors. In addition to the substantive importance of theexoneration finding in Table 14, it also shows that these effects are evidentafter controlling for the secular trend of declining juvenile death sentences.
As before, we generated predicted values for juvenile death sentencesthat are adjusted for the explanatory variables in the regression model, this
[Vol. 95

2005] DECLINE OF THE JUVENILE DEATH PENALTY 489
time including both the two-year within-state and three-year nationalaverages of capital exonerations. In Figures 11 and 12, we show thepredicted rates of juvenile death sentences per juvenile homicide arrest,adjusted for all the predictors in Table 14. The results are essentiallyunchanged. Figures 11 shows the predicted values for juvenile deathsentences per juvenile homicide arrest. On a second axis, we show thejuvenile homicide arrest count, lagged by two years as it is in themultivariate models. Figure II uses the restrictive prediction based on thequadratic (Time2) interaction. Figure 12 shows the predicted rates ofjuvenile death sentences together with 95% confidence intervals (CIs).
Table 14. Poisson Regression of Exonerations on Juvenile Death Sentences, Controllingfor Time Trends, Murder Rates, Juvenile Homicide Arrests, and State Covariates
95% C!B SE p() Lower Upper
Time -.373 .291 -1.28 .200 -.94 .20Time2 .032 .024 1.35 .178 -.025 .08DS Persons 18-24 .120 .197 .61 .543 -.276 .51Post 1999 3.467 1.730 2.00 .045 .08 6.86Post99*Time2 -.034 .014 -2.42 .015 -.06 -.01Murder Rate (log) 1.243 .768 1.62 .105 -.26 2.75Murder Residual -.020 .089 -.22 .823 -. 19 .15Population > 18 -. 161 .225 -.72 .474 -.60 .28
ExonerationsNational 3yr Average .072 .180 .40 .689 -.28 .42State 2yr Average 2.659 1.151 2.31 .021 .40 4.92Interaction -.424 .220 -1.93 .054 -.86 .01
State CovariatesB/W Homicide Ratio -.076 .051 -1.46 .145 -.18 .03% Black Population .021 2.496 0.01 .993 -4.87 4.91% Urban .005 .013 0.35 .725 -.02 .03Political Pressure -.037 .088 -0.42 .673 -.21 .14Punitiveness .152 .055 2.78 .005 .04 .26Constant -6.054 3.464 -1.75 .081 -12.84 .74
Chi square = 48.08, p = .000Log likelihood = - 170.82075PseudoR 2 = .123

JEFFREY FAGAN& VALERIE WEST
Rgure 11. Juvenile Death Sentences, Adjusted for State and NationalExonerations with Quadratic lime Trend, and Juvenile Homicide Arrests
(Lagged 2 Years), 1990-2003
0 70
0.60
. -t
14 0,0C-
" 'o 0.0
_.4
02 Z 0.20
00
> 0.10
0.00
2.00
:" 1.50
1.00
S0.50
0.00
C
-
S 1.50
1990 1991 1992 1993 1994 1995 1996 1997 1998 1999 2000 2001 2002 2003
Figure 12. Juvenile Death Sentences per Juvenile Homicide Arrestwith 95%Confidence Intervals, Adjusted for State and National
Exonerations with Quadratic ime Trend and Other Predictors, 1990-2003
9 1 =J D 1S
1Predicted
-95% CI
1990 1991 1992 1993 1994 1995 1996 1997 1998 1999 2000 2001 2002 2003
[Vol. 95

2005] DECLINE OF THE JUVENILE DEATH PENALTY 491
Figures 11 and 12 are nearly identical to Figures 8 and 10, and lead toidentical conclusions. They show that the peak adjusted rate of juveniledeath sentences per juvenile homicide arrest was in 1996 (earlier than1999), and declined thereafter other than a one-year increase in 1999. Asbefore, the graphs also show a widening gap between the predicted valuesfor juvenile death sentences and juvenile homicide arrests beginning in2000.
Accordingly, the addition of exoneration data seems to add little to theexplanation and prediction of the declining pattern juvenile death sentencesfollowing Stanford. Although exonerations make unique contributions tothe pattern of juvenile death sentences, the contribution is small and haslittle effect on the functional form of the relationship between the adjustedrate of juvenile death sentences and juvenile homicide arrests.
These results shown in Table 14 and Figures 11 and 12 were obtainedfor one specific iteration of a broader pattern of analyses of the effects ofexonerations. We conducted similar analyses, varying two parameters.First, we included alternate measures of state and national exoneration:prior-year exonerations, and averages for the preceding two- and three-yearintervals. We also varied the source of exonerations (all death penaltystates for national exoneration data versus only juvenile death penaltystates). To assess the robustness of the finding that recent capitalexonerations seem to influence the number and rate of juvenile deathsentences. Regression models similar in form to the models shown in Table14 were conducted for all possible combinations of these constructions ofthe exoneration measure. A total of forty-five regressions were completed.Table 15 reports the results of the significance test for the interaction termfor models with alternate specifications of within-state and nationalexonerations.

JEFFREY FAGAN & VALERIE WEST
00 W-00
C4
Oe o -PC, OW) W)00 r-ONviN rl r nO r- oeq c14 r-
-OO 00'r0 - 'ce-J
0 C
u uc
000-
2a Ae
z0',
4''C'C
C9
> tCI 0
IdnC
>- )5
Ca.) qc
Clz z z
CDr-c 0 0
> >~
00
en, '7
o 0.
rn 0 1>, >-~
ti .0 00
'000
- Zi Zl
[Vol. 95
O** CJ
q en
~0
0 >9:6 'n
.2 >1 11z- z 4

2005] DECLINE OF THE JUVENILE DEATH PENALTY 493
Nine of the forty-five tests (20%) were statistically significant. Theoverall pattern is inconsistent; the significant results are concentrated in oneset of models where the within-state measure of exonerations is the totalnumber of prior capital exonerations for each year in the time series. Thisgroup is the set of models reported in the first three rows of Table 15. Thepattern is the same when national totals are computed for only juveniledeath penalty states and when all death penalty states are considered. Whenwe examine the state two-year averages, three of the six tests aresignificant, again only for within-state capital exonerations. We obtainedsignificant results when the national measure included either allexonerations or just capital exonerations. Significant results were obtainedhere the national data included all death penalty states or just juvenile deathpenalty states, and when the national indicia included either allexonerations or capital exonerations only.1 27
The pattern in Table 15 suggests that exonerations do contribute to thedeclining trend in juvenile death sentences, but under specific and limitedconditions. Two such conditions are evident from Table 15: the totalnumber of capital exonerations within the state, or the average number ofexonerations over the previous two years within the state. The rising trendin total exonerations across the nation seems to influence juvenile deathsentences conditionally on the presence of these within-state trends. Evenwhen these effects are present, Figures 11 and 12 remind us that capitalexonerations have little measurable influence on the overall pattern ofdeclining juvenile death sentences. What is more likely is that the declinein juvenile death sentences and the rise in exonerations are two faces of alarger temporal trend in capital punishment that points to its decreasing usein the face of strong evidence of the unreliability of death sentences. Thatis, beyond the influence of exonerations, there appears to be a normativeshift away from sentencing juvenile offenders to death.
VI. CONCLUSION
In 2003, the Missouri Supreme Court ruled in Simmons v. Roper thatthe execution of offenders under the age of eighteen violates the evolvingstandards of decency embodied in the Eighth Amendment's prohibitionagainst cruel and unusual punishments. The Simmons court relied in parton two objective indicia of an emerging national consensus against thejuvenile death penalty: the growing number of states that have enactedlegislation barring the juvenile death penalty, and the infrequency with
127 The model in this group that combines National 3 year average * State 2 year
average, for Capital Exonerations in All Death Penalty States is the model shown in detail inTable 14.

JEFFREY FAGAN& VALERIE WEST
which juries choose to inflict the punishment of death on a juvenileoffender. The Simmons case is now before the Supreme Court, which lastconsidered the constitutionality of the juvenile death penalty in 1989 inStanford v. Kentucky. The first marker of evolving standards, statelegislation, suggests a steady erosion of support for capital punishment ofjuveniles since Stanford. This article analyzes the available data regardingthe second marker of evolving standards: the frequency with which juriesimpose the death penalty on juvenile offenders. We conclude that thedecline in the use of the juvenile death penalty since Stanford is evidence ofan emerging societal norm opposing the use of the death penalty forjuveniles.
To reach this conclusion, we analyzed empirical data regarding the useof the death penalty for adolescent homicide offenders in state courts in theUnited States since 1990. The data show that the number of juvenilessentenced to death (excluding re-sentencings) has declined sharply sinceStanford, from a peak of fifteen in 1994, and a more recent peak of fourteenin 1999, to one in 2003. (Total death sentences, including re-sentencings,have shown a similar decline.) The decline in the number of juvenilessentenced to death since Stanford has been greater than the parallel declinefor adults ages eighteen to twenty-four and for adults twenty-five and over,suggesting an age-specific decline. The decline in juveniles sentenced todeath is striking, and is greater than the analogous decline for adults, evenafter the sentencing rate is indexed to the declining homicide rate and to thedeclining homicide arrest rate.
Comparing the states, we found that the declines for juveniles aregreater than for adults both in the highest juvenile death sentencing statesand in other states, when we index the sentencing rate to the homicide arrestrate. Texas is an outlier for death sentences, but the pattern of decline indeath sentences in Texas and other high-rate states is comparable to the restof the states that permit death sentences for juveniles.
Using two types of multivariate statistical analyses, we found that thedecline in juvenile death sentences is statistically significant (greater thanchance) after we control for competing explanations for its decline: thedecline in the murder rate, the decline in the number of juveniles arrestedfor homicide, secular declines in death sentences for other age groups,changes in the size of the youth population, changing political and socialcontexts, and changes in the general punitiveness of the criminal justicesystem. The results are consistent across different measurement andanalysis conditions.
We also examined the effects of the growing number of innocencecases on the declining rates of juvenile death sentences. We find evidence
[Vol. 95

2005] DECLINE OF THE JUVENILE DEATH PENALTY 495
that the combined effects of recent capital innocence cases both withinjuvenile death sentencing states and across the nation exerted a downwardpressure on juvenile death sentences, controlling for murder rates andjuvenile homicide arrest rates. Although capital innocence cases may havecontributed to the reluctance of juries to impose death sentences onjuveniles, the accumulation of innocence cases is contemporaneous with thetrend that we observed for juvenile death sentences. Both trends are afunction of time: the increase in innocence cases and the decline of juveniledeath sentences. Both contribute reciprocally to the evolving social andlegal norms opposing the use of the death penalty for juveniles.
There is compelling evidence, even in the states that theoreticallypermit the use of the juvenile death penalty, of an emerging societal normopposing the death penalty for juvenile offenders-which has in the lastseveral years reduced the number of juveniles sentenced to death almost tozero. Its disuse signals that the juvenile death penalty may no longer beneeded.

[Vol. 95
Table Cl. Data Description, Means, Standard Deviations
Variable
Persons Under 18 Sentenced to Death
Homicide Arrests Under 18 (Logged)
Time
Time 2
Binary: Year Greater Than 1999
Persons 18-24 Sentenced to Death (Logged)
Time * Year Greater Than 1999
Time 2 * Year Greater Than 1999
Murder Rate (Logged)
Residual of Homicide Rate
Population Under 18 (Logged)
Ratio: Black/White Homicide Victimization Rate
White Homicide Victimization Rate
Percent Black Population
Percent Population in Urban Areas
Political Pressure Index
Punishment Index
ExonerationsNational 3 Year Average
State 2 Year Average
Interaction
StandardMinimum Maximum Mean Deviation
0.00 7.00 0.34 0.860.00 5.91 2.96 1.43
1.00 14.00 7.38 4.021.00 196.00 70.55 61.560.00 1.00 0.27 0.450.00 3.04 0.92 0.880.00 14.00 3.40 5.60
0.00 196.00 42.80 71.530.19 3.06 1.92 0.59
-4.64 4.42 0.04 1.5311.65 15.59 13.55 0.95
0.00 35.27 5.56 4.23
0.90 12.85 5.09 2.390.00 0.37 0.13 0.11
22.91 92.25 66.56 14.28
3.00 9.00 7.27 1.901.77 21.70 8.12 3.35
3.00 7.00 4.69
.00 2.00 .092
.00 14.00 .47
JEFFREYFAGAN& VALERIE WEST
APPENDIX
DESCRIPTIVE STATISTICS

2005] DECLINE OF THE JUVENILE DEATH PENALTY
• o 9ooo
. A-7. 80.0 0 0 04
V"' 6' o 666oo 6o 6 6o"
0'oo o'oo0669oo 660o 666
t -o
:F = - 8 n r, 2 "1 8 8 8 n 8
a 0 ; 05 a00 6 6 6 0 a 9 0 6 6 0 0
.~ v
u 6 6 6 6 6 0
497

498 JEFFREY FAGAN & VALERIE WEST [Vol. 95

2005] DECLINE OF THE JUVENILE DEATH PENALTY 499

500 JEFFREY FAGAN & VALERIE WEST [Vol. 95