Embed Size (px)
Citation preview
The Decline of Women Coaches in Collegiate Athletics
A REPORT ON SELECT NCAA DIVISION-I FBS INSTITUTIONS
2012-2013
This report was prepared by Nicole M. LaVoi, Ph.D., associate director, the Tucker Center for Research on Girls &
Women in Sport, and Board of Directors member, the Alliance of Women Coaches.
Please direct all inquiries to [email protected].
AcknowledgementsThank you to the following individuals for their role in producing and preparing this report: Sam Albrecht, Austin
Calhoun, Julia Dutove, Marta Fahrenz, Gopher Athletics, Torrie Hazelwood, Holly Hesse, Megan Kahn, Mary Jo
Kane, Elora Koepke, Julie Roe Lach, Nicole Lee, Emma Hawkins-Leyden, Ann Salerno, Celia Slater, Robin Sparks,
Jonathan Sweet, Judy Sweet, Emily Timmerman, Stephanie VanderPloeg, and Chris Werle.
Design by Nance Longley, photos courtesy of the University of Minnesota Gopher Athletics and the Alliance of Women
Coaches. Cover photo: Stefanie Golan, Head Soccer Coach at the University of Minnesota
LaVoi, N. M. (2013, December). The decline of women coaches in collegiate athletics: A report on select NCAA Division-I
FBS institutions, 2012-13. Minneapolis: the Tucker Center for Research on Girls & Women in Sport.
The report can be downloaded free of charge at z.umn.edu/womencoachesreport
© 2013 Regents of the University of Minnesota. All rights reserved.
The University of Minnesota is an equal opportunity educator and employer.
Opinions expressed herein belong entirely to the authors and do not necessarily represent viewpoints of the Regents
of the University of Minnesota.
www. Tu c k e r C e n t e r. org@TuckerCenter
facebook.com/tuckercenter
www. G o C o a c h e s . org@GoCoaches
facebook.com/AllianceofWomenCoaches
1
The Decline of Women Coaches in Collegiate Athletics
A REPORT ON SELECT NCAA DIVISION-I FBS INSTITUTIONS
2012-2013
The purpose of this project is to document the percentage of women coaches of women’s teams in “big time” college athletics by sport, conference, and institution in order to track the effectiveness of initiatives aimed at reversing the decline of women in
coaching. This project is a partnership between the Tucker Center for Research on Girls & Women in Sport at the University of Minnesota—the first research center of its kind in the world—and the Alliance of Women Coaches, an organization dedicated to increasing the number of women in the coaching profession. To commemorate the 20th anniversary of the Tucker Center, this report launches the beginning of a meaningful longitudinal research project, expands the interdisciplinary collaborative research the Tucker Center has conducted over the last 20 years, and honors our mission of making a difference in the lives of girls and women in sport.
Why this report mattersSport is inextricably linked to the American ideal of meritocracy—that if you are good enough, work hard enough, and make sacrifices, you will have the opportunity to achieve and succeed. This has been a prevailing ideology for athletes, but does this same ideal of meritocracy apply to the coaching profession? Does it apply to all coaches both male and female? Based on the data in our report, as well as the work of others, the answer is a resounding “NO!”
Opportunities for girls and women to participate in sports after the passage of Title IX in1972 is at an all-time high, but the percentage of women coached by women has declined to an all-time low. In 1974, 90+% of college female athletes were coached by women, but today the number is around 43% (Acosta & Carpenter, 2012). Women coaches in the 40 years following Title IX less frequently occupy coaching positions within women’s athletics and are rarely, if ever, given opportunities to coach men. Conversely, men who desire to coach collegiate athletes enjoy dual career tracks, meaning that they have legitimate opportunity to coach both men and women. So, while Title IX dramatically opened up participation opportunities for females, it also opened up twice as many coaching opportunities for men. Currently, men occupy a majority (80%) of the
THE DECLINE OF WOMEN COACHES IN COLLEGIATE ATHLETICS
2
coaching positions in both men’s and women’s college sport (Acosta & Carpenter). Nearly all college male athletes are coached by men (96-98%), and more than half of college female athletes are coached by men (~60%) (Acosta & Carpenter, 2012). At the NCAA Division I level women occupy only 38.6% of all head coaching positions of women’s teams (Lapchick et al., 2013). This is not to suggest that men should not ever coach women. All athletes regardless of gender can benefit from being coached by qualified men and women, but given the current minority of women coaches, this benefit often remains unrealized. Women who desire to coach should have equal access and opportunity to pursue dual career tracks to coach both male and female athletes.
Why women coaches matterWomen coaches matter in many ways. First, if societal stereotypes about gender and leadership—that privilege male coaches—are to change, male and female athletes need to be coached by women. Exposure to female role models and leaders in a context that matters to young people (e.g., sport) may help to change values and beliefs about women in positions of power and leadership. Second, if girls and young women see females in coaching roles they will more likely think about coaching as a legitimate and viable career, and so may aspire to become a coach. Same-sex role models inspire others to pursue and emulate similar achievements, and data indicate female athletes who were coached by women are more likely to pursue a career in coaching (Everhart & Chelladurai, 1998). Third, same-sex role models can provide advice and insight to female athletes and to female colleagues on how to navigate the workplace. Lastly, having more females in the workplace reduces the likelihood of a negative workplace experience and environment for women. In many workplace environments female coaches are the statistical minority or “tokens” (≤ 15% of the population; Kanter, 1977). Those with minority status are at the highest risk for many possible negative outcomes including increased risk of sexual harassment, wage inequality, limited opportunity for advancement, attribution of failure to group (e.g., if one female coach has a losing season, all female coaches are losers and incompetent), pressure to conform, feeling scrutinized, pressure to over-perform to gain credibility, potential harm to mental and physical health, and increased risk for burnout and quitting (Kanter, 1977).
Today the number of collegiate coaching jobs is at an all-time high and a record number of female athletes exist in the market who possess the knowledge and skills to coach. Furthermore, females comprise over 50% of the student body on college campuses, girls and young women state they value and need female role models, the number of women leaders in nearly all occupations is rising, and women are interested in coaching. Scholars have well documented the complex and numerous barriers faced by women coaches that have contributed to the decline in the 40 years after Title IX (see LaVoi & Dutove, 2012 for review). Now the question we must answer is: What can be done to retain and increase the percentage of women who are in the coaching profession?
3
A REPORT ON SELECT NCAA DIVISION-I FBS CONFERENCES
Purpose of projectThe purpose of this project is twofold: 1) to retain and increase the percentage of women who are in the coaching profession, and 2) bring awareness to the decline of women coaches and provide an evidence-based starting point for a national discussion on this important topic. The first step in achieving our purpose is to educate and increase awareness by documenting and tracking the percentage of women coaches of women’s teams in big time college athletics by sport, conference, and institution. Big time athletics programs are the most visible, powerful entity in college sport; therefore it is critical these trend-setting, flagship programs strive for a gender-balanced coaching staff. When women are seen in coaching positions—especially as head coaches in the programs that matter most in college sport—change may be more likely. This report complements and expands existing reports produced by the NCAA, The Institute for Diversity and Ethics in Sport (TIDES), and the longitudinal work of Vivian Acosta and Linda Carpenter over the last 35+ years, by including data by school and conference, as well as for a wider range of coaching staff positions. This data can be used by schools, conferences, and sport coaching associations to advocate for women coaches, to track progress or decline, and evaluate the effectiveness of interventions or strategies to reverse the decline of women coaches. The data can also be used to motivate stakeholders and decision-makers who hire coaches to recruit, hire, and retain women coaches.
The following research question informed the current report: What percentage of women occupy coaching positions for women’s sport teams that compete in six select “big time” Football Bowl Series (FBS) conferences?
• bysport• byconference• byinstitution
MethodologyDocumenting and adhering to a rigorous methodology is important for transparency, comparison to other data, and consistency in tracking and reporting over time.
PHASE I: DATA COLLECTION
A coding key was developed by the primary researcher to collect information that would answer the previously stated research question. Data collected included position, first and last name, sport, conference, institution, and gender of individual. If unclear, gender was determined by examination of photograph and gender markers in accompanying biographical text. A research team trained by the primary researcher at the Tucker Center for Research on Girls & Women in Sport collected the data for this study from January 2013 through April 2013 by visiting each institution’s athletic Web site and reviewing the coaching roster/staff for each women’s team listed. The report data covers individuals employed in athletics positions for the 2012-13 academic year. All individuals listed on the coaching roster were recorded, from head coach to volunteer coach (N = 3104).
THE DECLINE OF WOMEN COACHES IN COLLEGIATE ATHLETICS
4
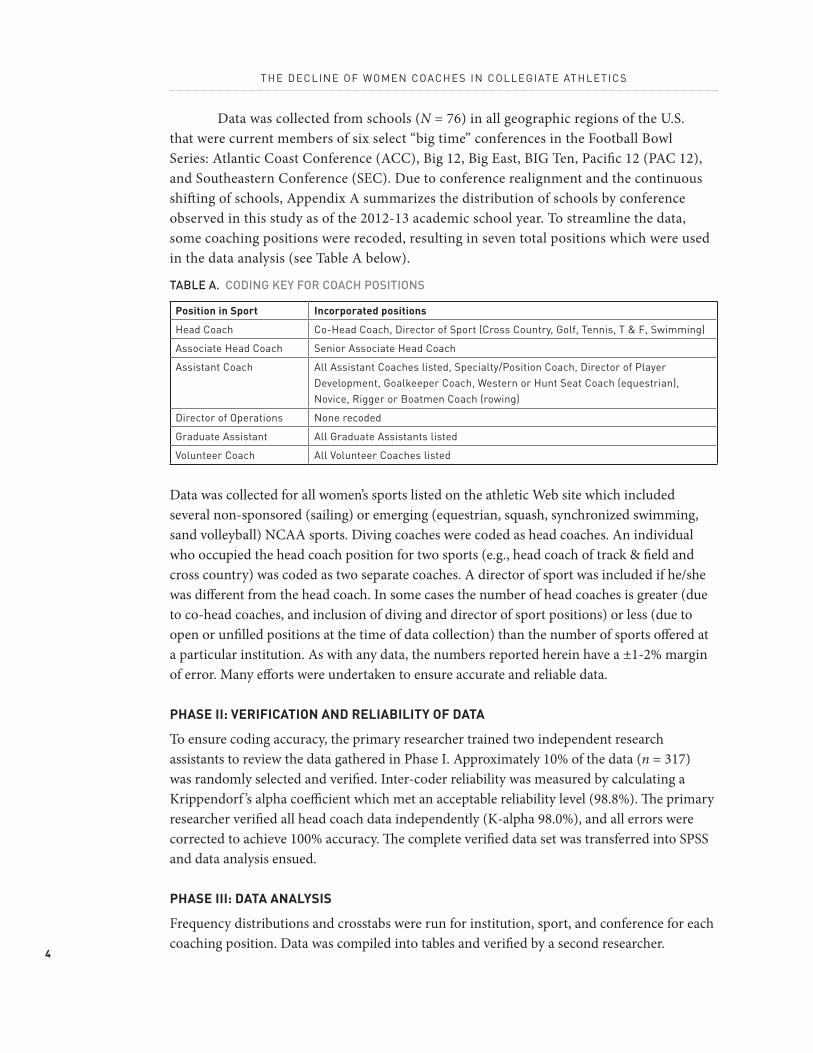
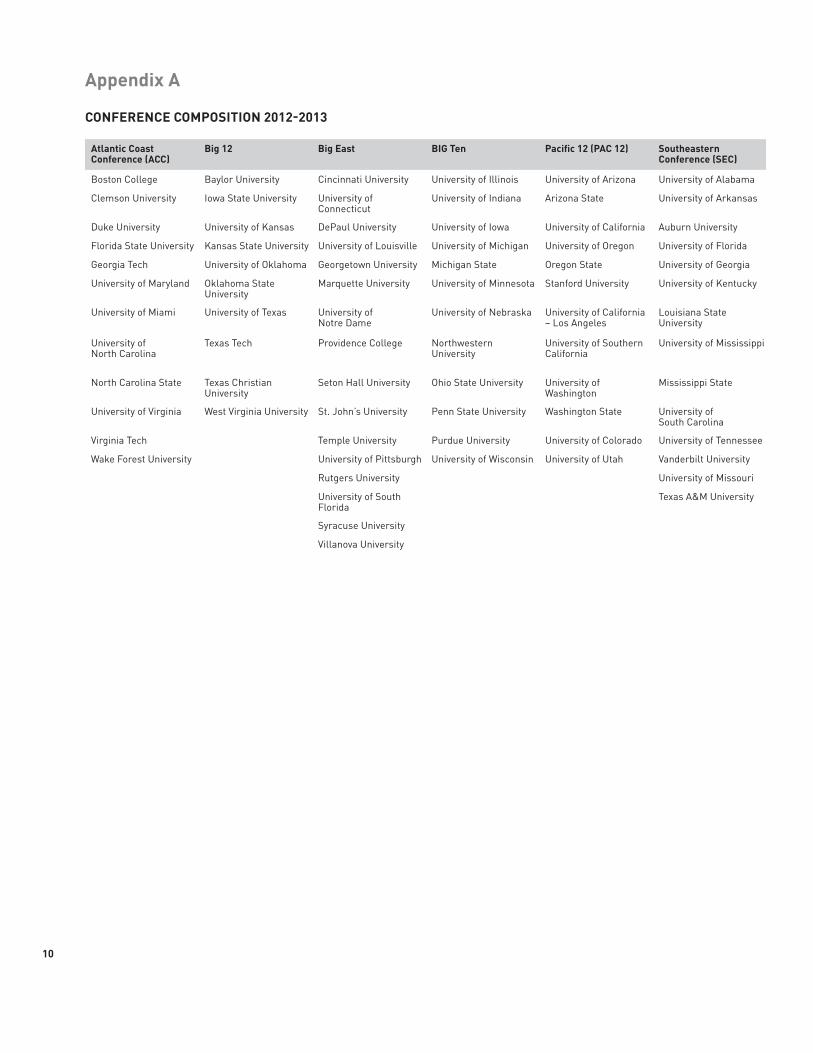
Data was collected from schools (N = 76) in all geographic regions of the U.S. that were current members of six select “big time” conferences in the Football Bowl Series: Atlantic Coast Conference (ACC), Big 12, Big East, BIG Ten, Pacific 12 (PAC 12), and Southeastern Conference (SEC). Due to conference realignment and the continuous shifting of schools, Appendix A summarizes the distribution of schools by conference observed in this study as of the 2012-13 academic school year. To streamline the data, some coaching positions were recoded, resulting in seven total positions which were used in the data analysis (see Table A below).
TABLE A. CODING KEY FOR COACH POSITIONS
Position in Sport Incorporated positions
Head Coach Co-Head Coach, Director of Sport (Cross Country, Golf, Tennis, T & F, Swimming)
Associate Head Coach Senior Associate Head Coach
Assistant Coach All Assistant Coaches listed, Specialty/Position Coach, Director of Player Development, Goalkeeper Coach, Western or Hunt Seat Coach (equestrian), Novice, Rigger or Boatmen Coach (rowing)
Director of Operations None recoded
Graduate Assistant All Graduate Assistants listed
Volunteer Coach All Volunteer Coaches listed
Data was collected for all women’s sports listed on the athletic Web site which included several non-sponsored (sailing) or emerging (equestrian, squash, synchronized swimming, sand volleyball) NCAA sports. Diving coaches were coded as head coaches. An individual who occupied the head coach position for two sports (e.g., head coach of track & field and cross country) was coded as two separate coaches. A director of sport was included if he/she was different from the head coach. In some cases the number of head coaches is greater (due to co-head coaches, and inclusion of diving and director of sport positions) or less (due to open or unfilled positions at the time of data collection) than the number of sports offered at a particular institution. As with any data, the numbers reported herein have a ±1-2% margin of error. Many efforts were undertaken to ensure accurate and reliable data.
PHASE II: VERIFICATION AND RELIABILITY OF DATA
To ensure coding accuracy, the primary researcher trained two independent research assistants to review the data gathered in Phase I. Approximately 10% of the data (n = 317) was randomly selected and verified. Inter-coder reliability was measured by calculating a Krippendorf ’s alpha coefficient which met an acceptable reliability level (98.8%). The primary researcher verified all head coach data independently (K-alpha 98.0%), and all errors were corrected to achieve 100% accuracy. The complete verified data set was transferred into SPSS and data analysis ensued.
PHASE III: DATA ANALYSIS
Frequency distributions and crosstabs were run for institution, sport, and conference for each coaching position. Data was compiled into tables and verified by a second researcher.
5
A REPORT ON SELECT NCAA DIVISION-I FBS CONFERENCES
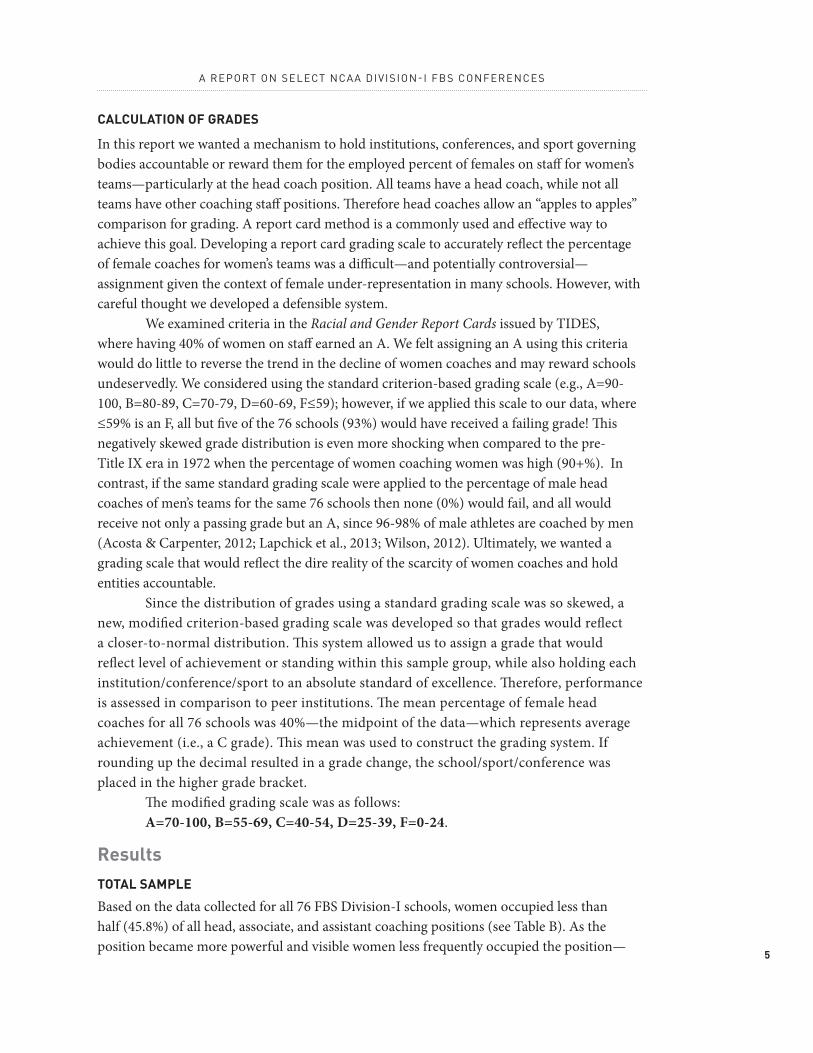
CALCULATION OF GRADES
In this report we wanted a mechanism to hold institutions, conferences, and sport governing bodies accountable or reward them for the employed percent of females on staff for women’s teams—particularly at the head coach position. All teams have a head coach, while not all teams have other coaching staff positions. Therefore head coaches allow an “apples to apples” comparison for grading. A report card method is a commonly used and effective way to achieve this goal. Developing a report card grading scale to accurately reflect the percentage of female coaches for women’s teams was a difficult—and potentially controversial—assignment given the context of female under-representation in many schools. However, with careful thought we developed a defensible system.
We examined criteria in the Racial and Gender Report Cards issued by TIDES, where having 40% of women on staff earned an A. We felt assigning an A using this criteria would do little to reverse the trend in the decline of women coaches and may reward schools undeservedly. We considered using the standard criterion-based grading scale (e.g., A=90-100, B=80-89, C=70-79, D=60-69, F≤59); however, if we applied this scale to our data, where ≤59% is an F, all but five of the 76 schools (93%) would have received a failing grade! This negatively skewed grade distribution is even more shocking when compared to the pre-Title IX era in 1972 when the percentage of women coaching women was high (90+%). In contrast, if the same standard grading scale were applied to the percentage of male head coaches of men’s teams for the same 76 schools then none (0%) would fail, and all would receive not only a passing grade but an A, since 96-98% of male athletes are coached by men (Acosta & Carpenter, 2012; Lapchick et al., 2013; Wilson, 2012). Ultimately, we wanted a grading scale that would reflect the dire reality of the scarcity of women coaches and hold entities accountable.
Since the distribution of grades using a standard grading scale was so skewed, a new, modified criterion-based grading scale was developed so that grades would reflect a closer-to-normal distribution. This system allowed us to assign a grade that would reflect level of achievement or standing within this sample group, while also holding each institution/conference/sport to an absolute standard of excellence. Therefore, performance is assessed in comparison to peer institutions. The mean percentage of female head coaches for all 76 schools was 40%—the midpoint of the data—which represents average achievement (i.e., a C grade). This mean was used to construct the grading system. If rounding up the decimal resulted in a grade change, the school/sport/conference was placed in the higher grade bracket.
The modified grading scale was as follows: A=70-100, B=55-69, C=40-54, D=25-39, F=0-24.
ResultsTOTAL SAMPLE
Based on the data collected for all 76 FBS Division-I schools, women occupied less than half (45.8%) of all head, associate, and assistant coaching positions (see Table B). As the position became more powerful and visible women less frequently occupied the position—
THE DECLINE OF WOMEN COACHES IN COLLEGIATE ATHLETICS
6
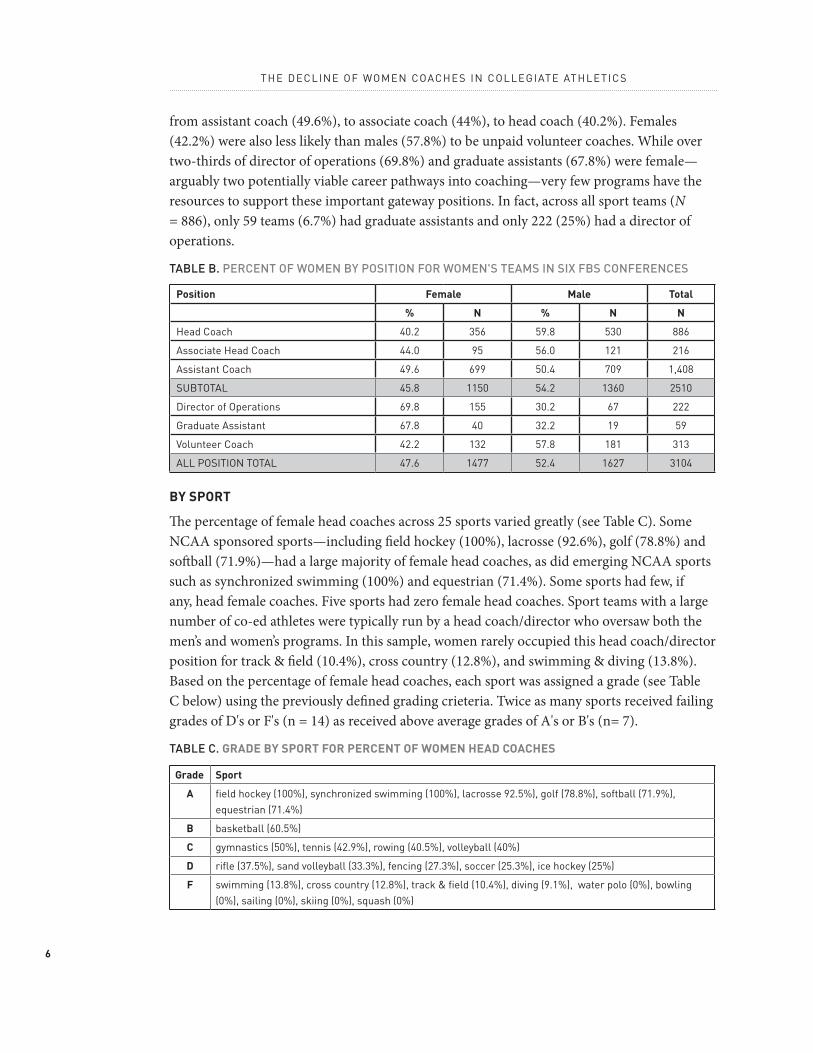
from assistant coach (49.6%), to associate coach (44%), to head coach (40.2%). Females (42.2%) were also less likely than males (57.8%) to be unpaid volunteer coaches. While over two-thirds of director of operations (69.8%) and graduate assistants (67.8%) were female—arguably two potentially viable career pathways into coaching—very few programs have the resources to support these important gateway positions. In fact, across all sport teams (N = 886), only 59 teams (6.7%) had graduate assistants and only 222 (25%) had a director of operations.
TABLE B. PERCENT OF WOMEN BY POSITION FOR WOMEN'S TEAMS IN SIX FBS CONFERENCES
Position Female Male Total
% N % N N
Head Coach 40.2 356 59.8 530 886
Associate Head Coach 44.0 95 56.0 121 216
Assistant Coach 49.6 699 50.4 709 1,408
SUBTOTAL 45.8 1150 54.2 1360 2510
Director of Operations 69.8 155 30.2 67 222
Graduate Assistant 67.8 40 32.2 19 59
Volunteer Coach 42.2 132 57.8 181 313
ALL POSITION TOTAL 47.6 1477 52.4 1627 3104
BY SPORT
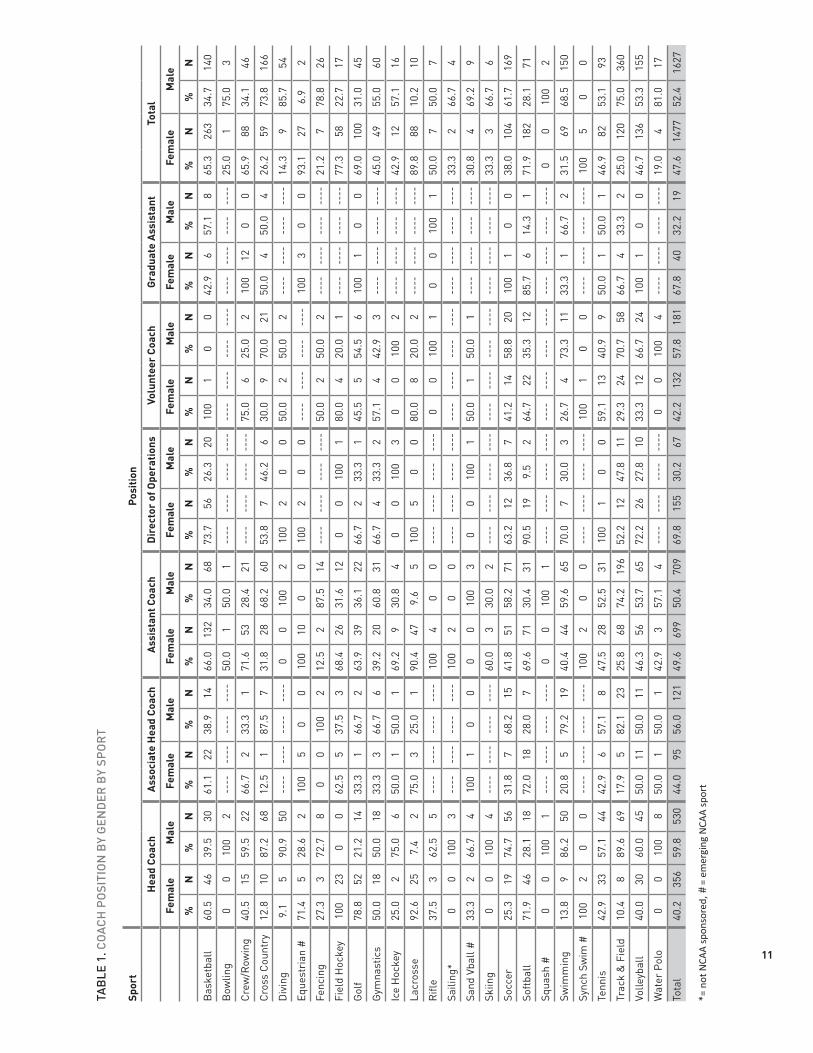
The percentage of female head coaches across 25 sports varied greatly (see Table C). Some NCAA sponsored sports—including field hockey (100%), lacrosse (92.6%), golf (78.8%) and softball (71.9%)—had a large majority of female head coaches, as did emerging NCAA sports such as synchronized swimming (100%) and equestrian (71.4%). Some sports had few, if any, head female coaches. Five sports had zero female head coaches. Sport teams with a large number of co-ed athletes were typically run by a head coach/director who oversaw both the men’s and women’s programs. In this sample, women rarely occupied this head coach/director position for track & field (10.4%), cross country (12.8%), and swimming & diving (13.8%). Based on the percentage of female head coaches, each sport was assigned a grade (see Table C below) using the previously defined grading crieteria. Twice as many sports received failing grades of D's or F's (n = 14) as received above average grades of A's or B's (n= 7).
TABLE C. GRADE BY SPORT FOR PERCENT OF WOMEN HEAD COACHES
Grade Sport
A field hockey (100%), synchronized swimming (100%), lacrosse 92.5%), golf (78.8%), softball (71.9%), equestrian (71.4%)
B basketball (60.5%)
C gymnastics (50%), tennis (42.9%), rowing (40.5%), volleyball (40%)
D rifle (37.5%), sand volleyball (33.3%), fencing (27.3%), soccer (25.3%), ice hockey (25%)
F swimming (13.8%), cross country (12.8%), track & field (10.4%), diving (9.1%), water polo (0%), bowling (0%), sailing (0%), skiing (0%), squash (0%)
7
A REPORT ON SELECT NCAA DIVISION-I FBS CONFERENCES
Data for all coaching and staff positions in both NCAA sponsored and non-sponsored sports can be found in the Appendix, Table 1. According to the NCAA (2011), the top five sports with the most women’s teams were basketball, volleyball, cross country, soccer, and softball. The percentage of female head coaches for these five most frequently offered college sports in this FBS sample were basketball 60.5%, volleyball 40.0%, cross country 12.8%, soccer 25.3%, and softball 71.9% respectively. Graduate assistants and director of operations positions were most frequently part of the coaching staff in these five sports, and most common in basketball.
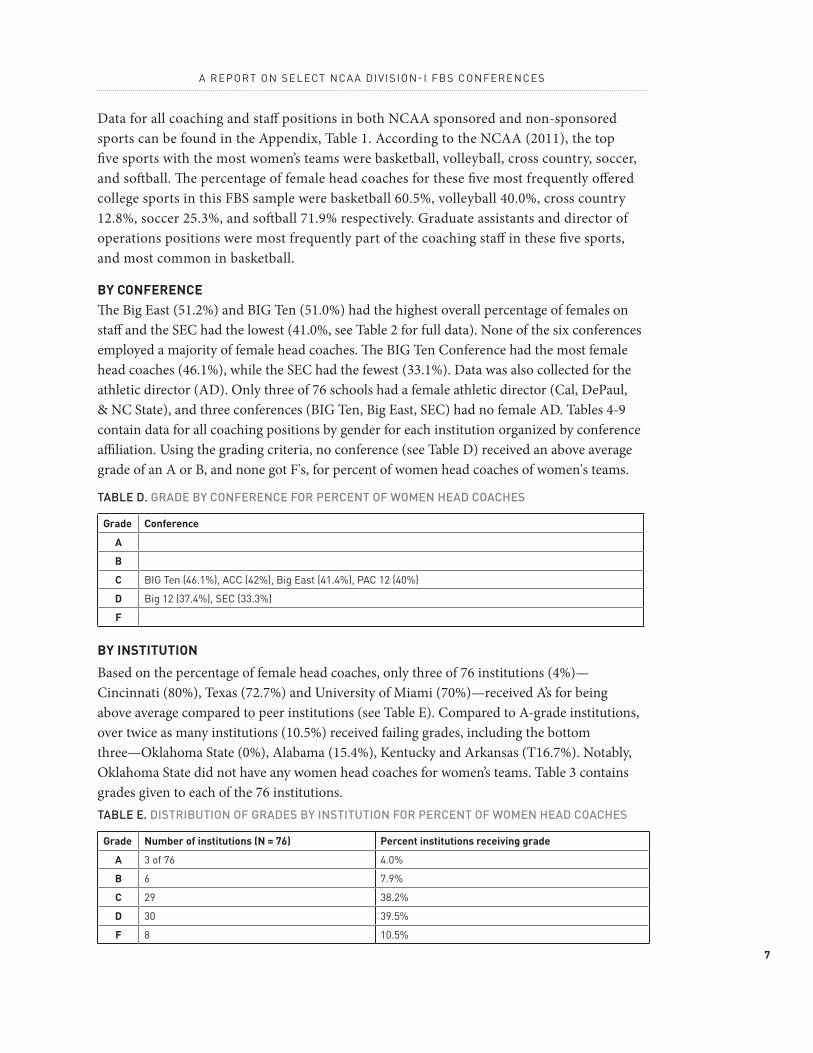
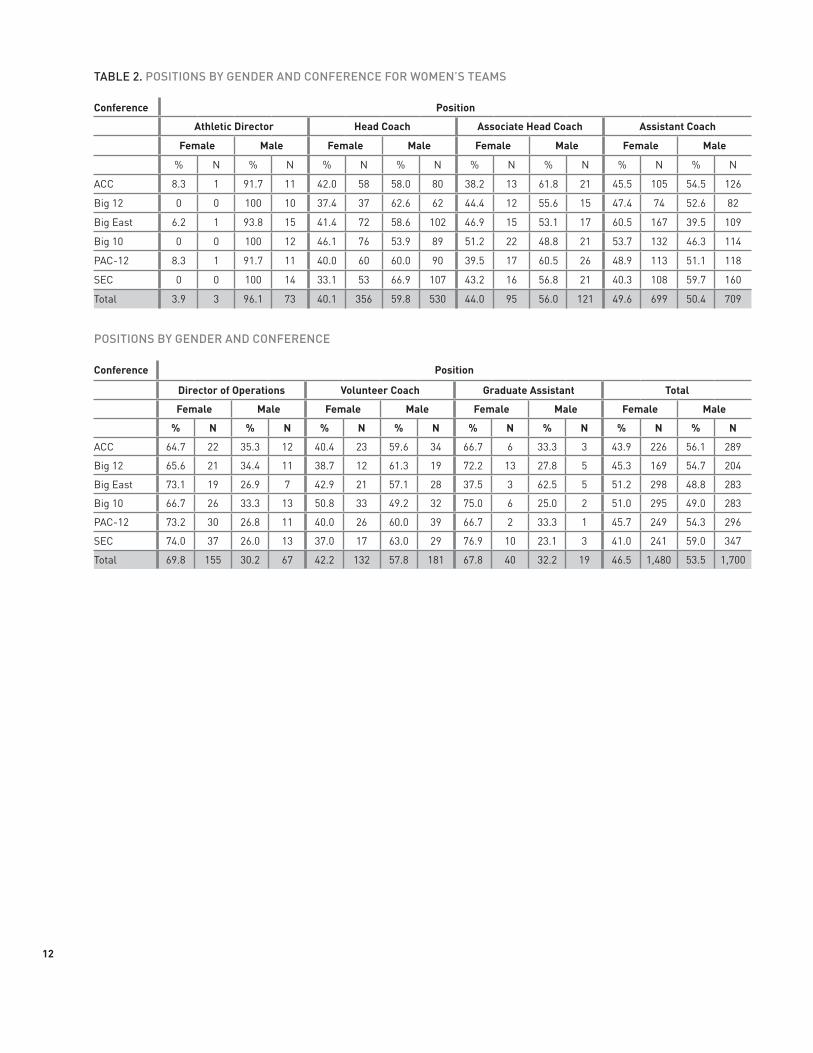
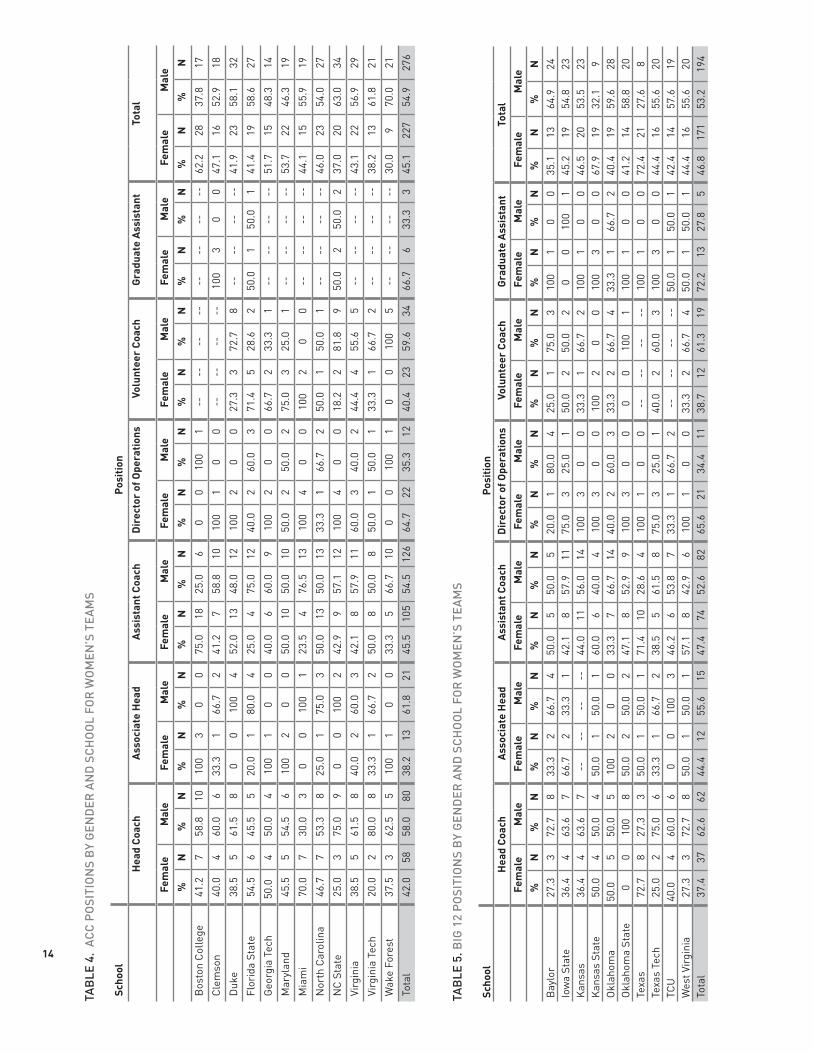
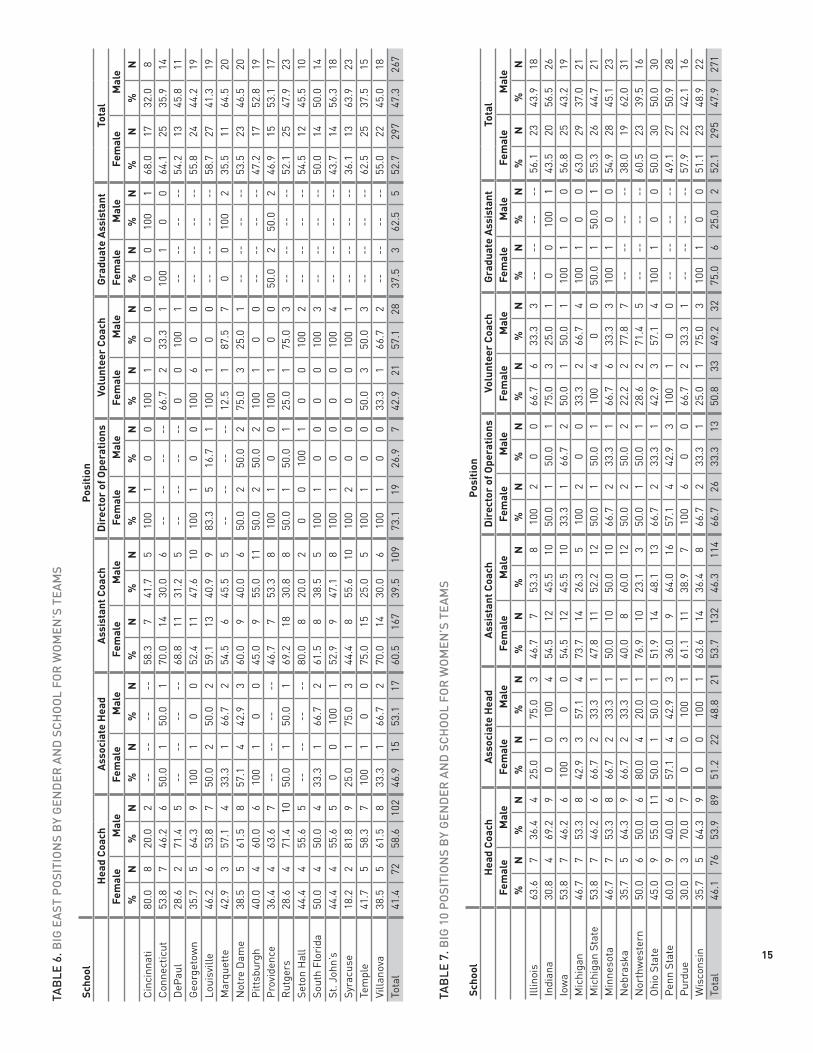
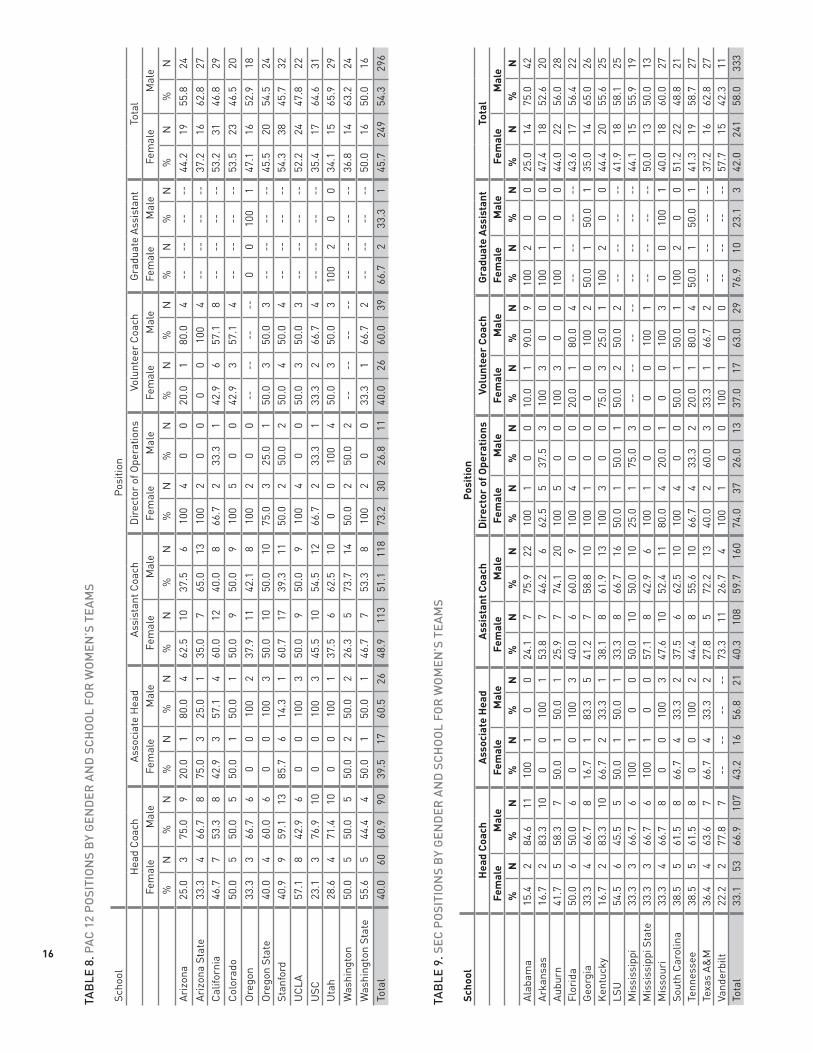
BY CONFERENCEThe Big East (51.2%) and BIG Ten (51.0%) had the highest overall percentage of females on staff and the SEC had the lowest (41.0%, see Table 2 for full data). None of the six conferences employed a majority of female head coaches. The BIG Ten Conference had the most female head coaches (46.1%), while the SEC had the fewest (33.1%). Data was also collected for the athletic director (AD). Only three of 76 schools had a female athletic director (Cal, DePaul, & NC State), and three conferences (BIG Ten, Big East, SEC) had no female AD. Tables 4-9 contain data for all coaching positions by gender for each institution organized by conference affiliation. Using the grading criteria, no conference (see Table D) received an above average grade of an A or B, and none got F's, for percent of women head coaches of women's teams.
TABLE D. GRADE BY CONFERENCE FOR PERCENT OF WOMEN HEAD COACHES
Grade Conference
A
B
C BIG Ten (46.1%), ACC (42%), Big East (41.4%), PAC 12 (40%)
D Big 12 (37.4%), SEC (33.3%)
F
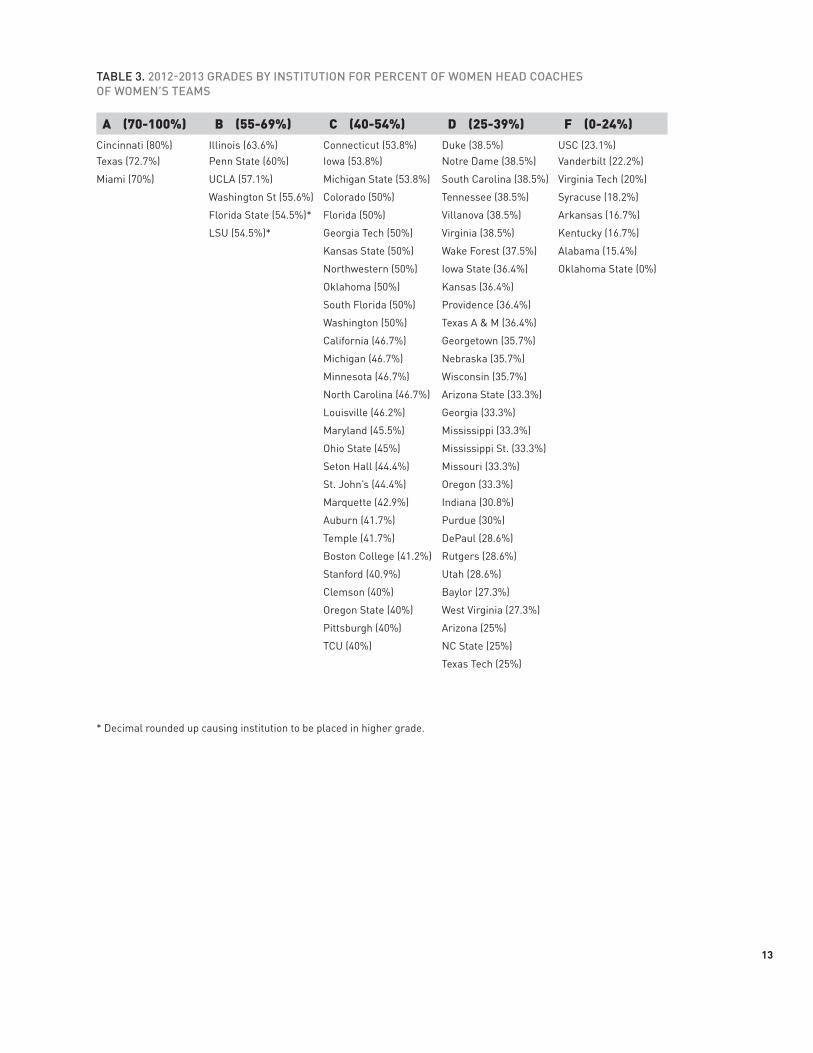
BY INSTITUTION
Based on the percentage of female head coaches, only three of 76 institutions (4%)—Cincinnati (80%), Texas (72.7%) and University of Miami (70%)—received A’s for being above average compared to peer institutions (see Table E). Compared to A-grade institutions, over twice as many institutions (10.5%) received failing grades, including the bottom three—Oklahoma State (0%), Alabama (15.4%), Kentucky and Arkansas (T16.7%). Notably, Oklahoma State did not have any women head coaches for women’s teams. Table 3 contains grades given to each of the 76 institutions. TABLE E. DISTRIBUTION OF GRADES BY INSTITUTION FOR PERCENT OF WOMEN HEAD COACHES
Grade Number of institutions (N = 76) Percent institutions receiving grade
A 3 of 76 4.0%
B 6 7.9%
C 29 38.2%
D 30 39.5%
F 8 10.5%
THE DECLINE OF WOMEN COACHES IN COLLEGIATE ATHLETICS
8
ConclusionThis report added to existing data by providing institutional, conference and sport-specific information on who is coaching women’s teams in big time collegiate athletics. Women are under-represented in big time college coaching—a fact which is true for women coaching women’s teams and incredibly so for women coaching men’s teams. Based on this data, only nine of 76 schools (11.8%) received an A or B grade, while 38 (50%) received D's or F's—grades either barely worthy of merit or failing outright. In all six FBS conferences, women comprised half or fewer of the workforce. In some sports, female coaches were tokens (≤15%), but in other sports female coaches were well represented. The fact that over two-thirds of graduate assistants (GA) and director of operations (DOO) positions are filled by females is good news, but few teams support and fund these important gateway positions. This scarcity of paid entry level positions (that often include graduate tuition, a stipend/salary, and health care) may turn many women away from coaching and decrease the likelihood of them entering coaching as a profession. For example, the highest number of GA and DOO positions are in basketball, and perhaps not coincidentally, this sport has one of the highest percentages of female head coaches.
A key point is reiterated by this data, and supported by other researchers such as Vivan Acosta and Linda Carpenter, Amy Wilson, and Richard Lapchick and colleagues—women head coaches remain under-represented in women’s sports 40+ years after the passage of Title IX. This report provides a “by the numbers” analysis of gender and coaching in big time college sport which is much needed and provides a good starting point, but it does not address the complex reasons why women coaches are leaving the profession, or why women are not applying—or not being hired for—coaching positions.
A number of researchers have addressed the barriers women coaches face and the reasons why they may leave the coaching profession (LaVoi & Dutove, 2012), but additional data is needed to aid in the development of strategies and to answer remaining key questions. These questions include: (a) What process (if any) is used to identify and recruit qualified women into big time (and all) coaching positions; (b) What institutional and organizational support is being provided to help women survive and thrive in coaching positions; (c) What are the values and beliefs of the athletic director around gender and leadership that drive job searches and subsequent hires; (d) What is the composition of the candidate pool for head coaches, and who is interviewed and hired (and who is not); (e) What reasons do female coaches give for accepting or rejecting a job; (f) What criteria are salient for women coaches who want to stay in coaching and are considering a job change or career move; (g) Is coaching men a viable career path: How many women apply to coach men's teams, in what sports, and what percentage of women that do apply are hired; (h) What reasons do women coaches give for not pursuing or applying to coach men's teams; and (i) Is it still true today that female athletes who are coached by women are more likely to pursue coaching as a profession? In addition, data is needed to help dispel and challenge the frequently iterated, damaging and untrue myth that "women aren't interested" in coaching! Evidence-based talking points and strategies
9
A REPORT ON SELECT NCAA DIVISION-I FBS CONFERENCES
must be developed and enacted as there is much we don’t know in order to stop the decline of women in the profession of college coaching.
One point about the grading criteria not included in this report is worth considering for future report cards. Based on Rosabeth Moss Kanter’s (1977) theory of tokenism in the workplace, the goal should not be to have a large majority (e.g., 85-100%) of athletes, regardless of gender, coached by a same-sex coach. As outlined above, tokens experience a host of negative workplace outcomes and some likely face an environment that is less than positive, inclusive, or friendly. Striving toward or maintaining a skewed (i.e., one gender is ≤15%) occupational workplace is incongruous with the goal of having a healthy and diverse workplace climate. We feel the ultimate long-term goal should be to have a gender-balanced coaching staff for both men’s and women’s teams, through implementing a plan that maximizes benefits for both coaches and athletes and provides a legitimate dual career track for women coaches. While this report only looked at employment patterns of coaches for women’s teams, if the entire coaching staff of men’s and women’s teams were considered together, women would be an even greater minority due to the fact that nearly all men’s teams are coached by men. Given this, it is of even greater importance to strive for a gender balanced workplace in college coaching.To this end, athletic directors should be educated about the potential negative impact and consequences that a gender-skewed workforce can have on all coaches and athletes and work to identify, recruit, consider and hire female coaches for both men’s and women’s teams. This report is one mechanism to hold institutions and decision makers accountable in hiring coaches for women's teams.
Together, the Tucker Center for Research on Girls & Women in Sport at the University of Minnesota and the Alliance of Women Coaches, among others, are striving to reverse the trend of the declining percentage of women college coaches, generate awareness, and start a national dialogue this issue. Women who desire to coach should have legitimate opportunities to enter the workforce, experience a supportive, inclusive and positive work climate when they do, and be paid accordingly for their expertise. Our efforts aspire to the tagline from the Wellesley Centers for Women: “A world that is good for women is good for everyone™.”
ReferencesAcosta, R. V., & Carpenter, L.J. (2012). Women in intercollegiate sport: A longitudinal, national study thirty five year
update. Retrieved from http://www.acostacarpenter.orgEverhart, C.B., & Chelladurai, P. (1998). Gender differences in preferences for coaching as an occupation: The role
of self-efficacy, valence, and perceived barriers. Research Quarterly for Exercise and Sport, 69, 188-200.Kanter, R. M. (1977). Some effects of proportions on group life: Skewed sex ratios and responses to token women.
The American Journal of Sociology, 82, 965–990.Lapchick, R., Agusta, R., Kinkopf, N., & McPhee, F. (2013, July). 2012 race and gender report card: College sport.
Retrieved from http://www.tidesport.org/RGRC/2012/2012_College_RGRC.pdfLaVoi, N. M., & Dutove, J. K. (2012). Barriers and supports for female coaches: An ecological model. Sports
Coaching Review, 1(1), 17-37.NCAA (2011). NCAA Sports sponsorship and student athlete participation rates report: 1981-1982 – 2010-2011.
Retrieved from http://www.ncaapublications.com/productdownloads/PR2012.pdfWilson, A. (2012, June). The status of women in intercollegiate athletics as Title IX turns 40. Retrieved from http://
www.ncaapublications.com/productdownloads/TITLEIX.pdf
10
Appendix A
CONFERENCE COMPOSITION 2012-2013
Atlantic Coast Conference (ACC)
Big 12 Big East BIG Ten Pacific 12 (PAC 12) Southeastern Conference (SEC)
Boston College Baylor University Cincinnati University University of Illinois University of Arizona University of Alabama
Clemson University Iowa State University University of Connecticut
University of Indiana Arizona State University of Arkansas
Duke University University of Kansas DePaul University University of Iowa University of California Auburn University
Florida State University Kansas State University University of Louisville University of Michigan University of Oregon University of Florida
Georgia Tech University of Oklahoma Georgetown University Michigan State Oregon State University of Georgia
University of Maryland Oklahoma State University
Marquette University University of Minnesota Stanford University University of Kentucky
University of Miami University of Texas University of Notre Dame
University of Nebraska University of California – Los Angeles
Louisiana State University
University of North Carolina
Texas Tech Providence College Northwestern University
University of Southern California
University of Mississippi
North Carolina State Texas Christian University
Seton Hall University Ohio State University University of Washington
Mississippi State
University of Virginia West Virginia University St. John’s University Penn State University Washington State University of South Carolina
Virginia Tech Temple University Purdue University University of Colorado University of Tennessee
Wake Forest University University of Pittsburgh University of Wisconsin University of Utah Vanderbilt University
Rutgers University University of Missouri
University of South Florida
Texas A&M University
Syracuse University
Villanova University
11
TAB
LE 1
. CO
ACH
PO
SITI
ON
BY
GEN
DER
BY
SPO
RT
Spor
tPo
sitio
n
Hea
d Co
ach
Asso
ciat
e H
ead
Coac
hAs
sist
ant C
oach
Dir
ecto
r of
Ope
ratio
nsVo
lunt
eer
Coac
hGr
adua
te A
ssis
tant
Tota
l
Fem
ale
Mal
eFe
mal
eM
ale
Fem
ale
Mal
eFe
mal
eM
ale
Fem
ale
Mal
eFe
mal
eM
ale
Fem
ale
Mal
e
%N
%N
%N
%N
%N
%N
%N
%N
%N
%N
%N
%N
%N
%N
Bas
ketb
all
60.5
4639
.530
61.1
2238
.914
66.0
132
34.0
6873
.756
26.3
2010
01
00
42.9
657
.18
65.3
263
34.7
140
Bow
ling
00
100
2--
----
----
----
--50
.01
50.0
1--
----
----
----
----
----
----
----
----
----
----
----
--25
.01
75.0
3
Crew
/Row
ing
40.5
1559
.522
66.7
233
.31
71.6
5328
.421
----
----
----
----
75.0
625
.02
100
120
065
.988
34.1
46
Cros
s Co
untr
y 12
.810
87
.268
12.5
187
.57
31.8
2868
.260
53.8
746
.26
30.0
970
.021
50.0
450
.04
26.2
5973
.816
6
Div
ing
9.1
590
.950
----
----
----
----
00
100
210
02
00
50.0
250
.02
----
----
----
----
14.3
985
.754
Eque
stri
an #
71.4
528
.62
100
50
010
010
00
100
20
0--
----
----
----
--10
03
00
93.1
276.
92
Fenc
ing
27.3
372
.78
00
100
212
.52
87.5
14--
----
----
----
--50
.02
50.0
2--
----
----
----
--21
.27
78.8
26
Fiel
d H
ocke
y10
023
00
62.5
537
.53
68.4
2631
.612
00
100
180
.04
20.0
1--
----
----
----
--77
.358
22.7
17
Gol
f78
.852
21.2
1433
.31
66.7
263
.939
36.1
2266
.72
33.3
145
.55
54.5
610
01
00
69.0
100
31.0
45
Gym
nast
ics
50.0
1850
.018
33.3
366
.76
39.2
2060
.831
66.7
433
.32
57.1
442
.93
----
----
----
----
45.0
4955
.060
Ice
Hoc
key
25.0
275
.06
50.0
150
.01
69.2
930
.84
00
100
30
010
02
----
----
----
----
42.9
1257
.116
Lacr
osse
92.6
257.
42
75.0
325
.01
90.4
479.
65
100
50
080
.08
20.0
2--
----
----
----
--89
.888
10.2
10
Rifl
e37
.53
62.5
5--
----
----
----
--10
04
00
----
----
----
----
00
100
10
010
01
50.0
750
.07
Saili
ng*
00
100
3--
----
----
----
--10
02
00
----
----
----
----
----
----
----
----
----
----
----
----
33.3
266
.74
Sand
Vba
ll #
33.3
266
.74
100
10
00
010
03
00
100
150
.01
50.0
1--
----
----
----
--30
.84
69.2
9
Skiin
g0
010
04
----
----
----
----
60.0
330
.02
----
----
----
----
----
----
----
----
----
----
----
----
33.3
366
.76
Socc
er25
.319
74.7
5631
.87
68.2
1541
.851
58.2
7163
.212
36.8
741
.214
58.8
2010
01
00
38.0
104
61.7
169
Soft
ball
71.9
4628
.118
72.0
1828
.07
69.6
7130
.431
90.5
199.
52
64.7
2235
.312
85.7
614
.31
71.9
182
28.1
71
Squa
sh #
00
100
1--
----
----
----
--0
010
01
----
----
----
----
----
----
----
----
----
----
----
----
00
100
2
Swim
min
g13
.89
86.2
5020
.85
79.2
1940
.444
59.6
6570
.07
30.0
326
.74
73.3
1133
.31
66.7
231
.569
68.5
150
Sync
h Sw
im #
100
20
0--
----
----
----
--10
02
00
----
----
----
----
100
10
0--
----
----
----
--10
05
00
Tenn
is42
.933
57.1
4442
.96
57.1
847
.528
52.5
3110
01
00
59.1
1340
.99
50.0
150
.01
46.9
8253
.193
Trac
k &
Fie
ld10
.48
89.6
6917
.95
82.1
2325
.868
74.2
196
52.2
1247
.811
29.3
2470
.758
66.7
433
.32
25.0
120
75.0
360
Volle
ybal
l40
.030
60.0
4550
.011
50.0
1146
.356
53.7
6572
.226
27.8
1033
.312
66.7
2410
01
00
46.7
136
53.3
155
Wat
er P
olo
00
100
850
.01
50.0
142
.93
57.1
4--
----
----
----
--0
010
04
----
----
----
----
19.0
481
.017
Tota
l40
.235
659
.853
044
.095
56.0
121
49.6
699
50.4
709
69.8
155
30.2
6742
.213
257
.818
167
.840
32.2
19
47.6
1477
52.4
1627
*= n
ot N
CAA
spon
sore
d, #
= e
mer
ging
NCA
A sp
ort
12
TABLE 2. POSITIONS BY GENDER AND CONFERENCE FOR WOMEN’S TEAMS
Conference Position
Athletic Director Head Coach Associate Head Coach Assistant Coach
Female Male Female Male Female Male Female Male
% N % N % N % N % N % N % N % N
ACC 8.3 1 91.7 11 42.0 58 58.0 80 38.2 13 61.8 21 45.5 105 54.5 126
Big 12 0 0 100 10 37.4 37 62.6 62 44.4 12 55.6 15 47.4 74 52.6 82
Big East 6.2 1 93.8 15 41.4 72 58.6 102 46.9 15 53.1 17 60.5 167 39.5 109
Big 10 0 0 100 12 46.1 76 53.9 89 51.2 22 48.8 21 53.7 132 46.3 114
PAC-12 8.3 1 91.7 11 40.0 60 60.0 90 39.5 17 60.5 26 48.9 113 51.1 118
SEC 0 0 100 14 33.1 53 66.9 107 43.2 16 56.8 21 40.3 108 59.7 160
Total 3.9 3 96.1 73 40.1 356 59.8 530 44.0 95 56.0 121 49.6 699 50.4 709
POSITIONS BY GENDER AND CONFERENCE
Conference Position
Director of Operations Volunteer Coach Graduate Assistant Total
Female Male Female Male Female Male Female Male
% N % N % N % N % N % N % N % N
ACC 64.7 22 35.3 12 40.4 23 59.6 34 66.7 6 33.3 3 43.9 226 56.1 289
Big 12 65.6 21 34.4 11 38.7 12 61.3 19 72.2 13 27.8 5 45.3 169 54.7 204
Big East 73.1 19 26.9 7 42.9 21 57.1 28 37.5 3 62.5 5 51.2 298 48.8 283
Big 10 66.7 26 33.3 13 50.8 33 49.2 32 75.0 6 25.0 2 51.0 295 49.0 283
PAC-12 73.2 30 26.8 11 40.0 26 60.0 39 66.7 2 33.3 1 45.7 249 54.3 296
SEC 74.0 37 26.0 13 37.0 17 63.0 29 76.9 10 23.1 3 41.0 241 59.0 347
Total 69.8 155 30.2 67 42.2 132 57.8 181 67.8 40 32.2 19 46.5 1,480 53.5 1,700
13
TABLE 3. 2012-2013 GRADES BY INSTITUTION FOR PERCENT OF WOMEN HEAD COACHES OF WOMEN’S TEAMS
A (70-100%) B (55-69%) C (40-54%) D (25-39%) F (0-24%)Cincinnati (80%) Illinois (63.6%) Connecticut (53.8%) Duke (38.5%) USC (23.1%)Texas (72.7%) Penn State (60%) Iowa (53.8%) Notre Dame (38.5%) Vanderbilt (22.2%)
Miami (70%) UCLA (57.1%) Michigan State (53.8%) South Carolina (38.5%) Virginia Tech (20%)
Washington St (55.6%) Colorado (50%) Tennessee (38.5%) Syracuse (18.2%)
Florida State (54.5%)* Florida (50%) Villanova (38.5%) Arkansas (16.7%)
LSU (54.5%)* Georgia Tech (50%) Virginia (38.5%) Kentucky (16.7%)
Kansas State (50%) Wake Forest (37.5%) Alabama (15.4%)
Northwestern (50%) Iowa State (36.4%) Oklahoma State (0%)
Oklahoma (50%) Kansas (36.4%)
South Florida (50%) Providence (36.4%)
Washington (50%) Texas A & M (36.4%)
California (46.7%) Georgetown (35.7%)
Michigan (46.7%) Nebraska (35.7%)
Minnesota (46.7%) Wisconsin (35.7%)
North Carolina (46.7%) Arizona State (33.3%)
Louisville (46.2%) Georgia (33.3%)
Maryland (45.5%) Mississippi (33.3%)
Ohio State (45%) Mississippi St. (33.3%)
Seton Hall (44.4%) Missouri (33.3%)
St. John’s (44.4%) Oregon (33.3%)
Marquette (42.9%) Indiana (30.8%)
Auburn (41.7%) Purdue (30%)
Temple (41.7%) DePaul (28.6%)
Boston College (41.2%) Rutgers (28.6%)
Stanford (40.9%) Utah (28.6%)
Clemson (40%) Baylor (27.3%)
Oregon State (40%) West Virginia (27.3%)
Pittsburgh (40%) Arizona (25%)
TCU (40%) NC State (25%)
Texas Tech (25%)
* Decimal rounded up causing institution to be placed in higher grade.
14
TAB
LE 5
. BIG
12
POSI
TIO
NS
BY
GEN
DER
AN
D S
CHO
OL
FOR
WO
MEN
’S T
EAM
S
Scho
olPo
sitio
nH
ead
Coac
hAs
soci
ate
Hea
dAs
sist
ant C
oach
Dir
ecto
r of
Ope
ratio
nsVo
lunt
eer
Coac
hGr
adua
te A
ssis
tant
Tota
lFe
mal
eM
ale
Fem
ale
Mal
eFe
mal
eM
ale
Fem
ale
Mal
eFe
mal
eM
ale
Fem
ale
Mal
eFe
mal
eM
ale
%N
%N
%N
%N
%N
%N
%N
%N
%N
%N
%N
%N
%N
%N
Bay
lor
27.3
372
.78
33.3
266
.74
50.0
550
.05
20.0
180
.04
25.0
175
.03
100
10
035
.113
64.9
24Io
wa
Stat
e36
.44
63.6
766
.72
33.3
142
.18
57.9
1175
.03
25.0
150
.02
50.0
20
010
01
45.2
1954
.823
Kan
sas
36.4
463
.67
----
----
44.0
1156
.014
100
30
033
.31
66.7
210
01
00
46.5
2053
.523
Kan
sas
Stat
e50
.04
50.0
450
.01
50.0
160
.06
40.0
410
03
00
100
20
010
03
00
67.9
1932
.19
Okl
ahom
a50
.05
50.0
510
02
00
33.3
766
.714
40.0
260
.03
33.3
266
.74
33.3
166
.72
40.4
1959
.628
Okl
ahom
a St
ate
00
100
850
.02
50.0
247
.18
52.9
910
03
00
00
100
110
01
00
41.2
1458
.820
Texa
s72
.78
27.3
350
.01
50.0
171
.410
28.6
410
01
00
----
----
100
10
072
.421
27.6
8Te
xas
Tech
25.0
275
.06
33.3
166
.72
38.5
561
.58
75.0
325
.01
40.0
260
.03
100
30
044
.416
55.6
20TC
U40
.04
60.0
60
010
03
46.2
653
.87
33.3
166
.72
----
----
50.0
150
.01
42.4
1457
.619
Wes
t Vir
gini
a27
.33
72.7
850
.01
50.0
157
.18
42.9
610
01
00
33.3
266
.74
50.0
150
.01
44.4
1655
.620
Tota
l37
.437
62.6
6244
.412
55.6
1547
.474
52.6
8265
.621
34.4
1138
.712
61.3
1972
.213
27.8
546
.817
153
.219
4
TAB
LE 4
. AC
C P
OSI
TIO
NS
BY
GEN
DER
AN
D S
CHO
OL
FOR
WO
MEN
’S T
EAM
S
Scho
olPo
sitio
n
Hea
d Co
ach
Asso
ciat
e H
ead
Assi
stan
t Coa
chD
irec
tor
of O
pera
tions
Volu
ntee
r Co
ach
Grad
uate
Ass
ista
ntTo
tal
Fem
ale
Mal
eFe
mal
eM
ale
Fem
ale
Mal
eFe
mal
eM
ale
Fem
ale
Mal
eFe
mal
eM
ale
Fem
ale
Mal
e
%N
%N
%N
%N
%N
%N
%N
%N
%N
%N
%N
%N
%N
%N
Bos
ton
Colle
ge41
.27
58.8
1010
03
00
75.0
1825
.06
00
100
1--
----
----
----
--62
.228
37.8
17
Clem
son
40.0
460
.06
33.3
166
.72
41.2
758
.810
100
10
0--
----
--10
03
00
47.1
1652
.918
Duk
e38
.55
61.5
80
010
04
52.0
1348
.012
100
20
027
.33
72.7
8--
----
--41
.923
58.1
32
Flor
ida
Stat
e54
.56
45.5
520
.01
80.0
425
.04
75.0
1240
.02
60.0
371
.45
28.6
250
.01
50.0
141
.419
58.6
27
Geo
rgia
Tec
h50
.04
50.0
410
01
00
40.0
660
.09
100
20
066
.72
33.3
1--
----
--51
.715
48.3
14
Mar
ylan
d45
.55
54.5
610
02
00
50.0
1050
.010
50.0
250
.02
75.0
325
.01
----
----
53.7
2246
.319
Mia
mi
70.0
730
.03
00
100
123
.54
76.5
1310
04
00
100
20
0--
----
--44
.115
55.9
19
Nor
th C
arol
ina
46.7
753
.38
25.0
175
.03
50.0
1350
.013
33.3
166
.72
50.0
150
.01
----
----
46.0
2354
.027
NC
Stat
e25
.03
75.0
90
010
02
42.9
957
.112
100
40
018
.22
81.8
950
.02
50.0
237
.020
63.0
34
Virg
inia
38.5
561
.58
40.0
260
.03
42.1
857
.911
60.0
340
.02
44.4
455
.65
----
----
43.1
2256
.929
Virg
inia
Tec
h20
.02
80.0
833
.31
66.7
250
.08
50.0
850
.01
50.0
133
.31
66.7
2--
----
--38
.213
61.8
21
Wak
e Fo
rest
37.5
362
.55
100
10
033
.35
66.7
100
010
01
00
100
5--
----
--30
.09
70.0
21
Tota
l42
.058
58.0
8038
.213
61.8
2145
.510
554
.512
664
.722
35.3
1240
.423
59.6
3466
.76
33.3
345
.122
754
.927
6
15
TAB
LE 6
. BIG
EAS
T PO
SITI
ON
S B
Y G
END
ER A
ND
SCH
OO
L FO
R W
OM
EN’S
TEA
MS
Scho
olPo
sitio
nH
ead
Coac
hAs
soci
ate
Hea
dAs
sist
ant C
oach
Dir
ecto
r of
Ope
ratio
nsVo
lunt
eer
Coac
hGr
adua
te A
ssis
tant
Tota
lFe
mal
eM
ale
Fem
ale
Mal
eFe
mal
eM
ale
Fem
ale
Mal
eFe
mal
eM
ale
Fem
ale
Mal
eFe
mal
eM
ale
%N
%N
%N
%N
%N
%N
%N
%N
%N
%N
%N
%N
%N
%N
Cinc
inna
ti80
.08
20.0
2--
----
--58
.37
41.7
510
01
00
100
10
00
010
01
68.0
1732
.08
Conn
ectic
ut53
.87
46.2
650
.01
50.0
170
.014
30.0
6--
----
--66
.72
33.3
110
01
00
64.1
2535
.914
DeP
aul
28.6
271
.45
----
----
68.8
1131
.25
----
----
00
100
1--
----
--54
.213
45.8
11G
eorg
etow
n35
.75
64.3
910
01
00
52.4
1147
.610
100
10
010
06
00
----
----
55.8
2444
.219
Loui
svill
e46
.26
53.8
750
.02
50.0
259
.113
40.9
983
.35
16.7
110
01
00
----
----
58.7
2741
.319
Mar
quet
te42
.93
57.1
433
.31
66.7
254
.56
45.5
5--
----
--12
.51
87.5
70
010
02
35.5
1164
.520
Not
re D
ame
38.5
561
.58
57.1
442
.93
60.0
940
.06
50.0
250
.02
75.0
325
.01
----
----
53.5
2346
.520
Pitt
sbur
gh40
.04
60.0
610
01
00
45.0
955
.011
50.0
250
.02
100
10
0--
----
--47
.217
52.8
19Pr
ovid
ence
36.4
463
.67
----
----
46.7
753
.38
100
10
010
01
00
50.0
250
.02
46.9
1553
.117
Rut
gers
28.6
471
.410
50.0
150
.01
69.2
1830
.88
50.0
150
.01
25.0
175
.03
----
----
52.1
2547
.923
Seto
n H
all
44.4
455
.65
----
----
80.0
820
.02
00
100
10
010
02
----
----
54.5
1245
.510
Sout
h Fl
orid
a50
.04
50.0
433
.31
66.7
261
.58
38.5
510
01
00
00
100
3--
----
--50
.014
50.0
14St
. Joh
n’s
44.4
455
.65
00
100
152
.99
47.1
810
01
00
00
100
4--
----
--43
.714
56.3
18Sy
racu
se18
.22
81.8
925
.01
75.0
344
.48
55.6
1010
02
00
00
100
1--
----
--36
.113
63.9
23Te
mpl
e41
.75
58.3
710
01
00
75.0
1525
.05
100
10
050
.03
50.0
3--
----
--62
.525
37.5
15Vi
llano
va38
.55
61.5
833
.31
66.7
270
.014
30.0
610
01
00
33.3
166
.72
----
----
55.0
2245
.018
Tota
l41
.472
58.6
102
46.9
1553
.117
60.5
167
39.5
109
73.1
1926
.97
42.9
2157
.128
37.5
362
.55
52.7
297
47.3
267
TAB
LE 7
. BIG
10
PO
SITI
ON
S B
Y G
END
ER A
ND
SCH
OO
L FO
R W
OM
EN’S
TEA
MS
Scho
olPo
sitio
nH
ead
Coac
hAs
soci
ate
Hea
dAs
sist
ant C
oach
Dir
ecto
r of
Ope
ratio
nsVo
lunt
eer
Coac
hGr
adua
te A
ssis
tant
Tota
lFe
mal
eM
ale
Fem
ale
Mal
eFe
mal
eM
ale
Fem
ale
Mal
eFe
mal
eM
ale
Fem
ale
Mal
eFe
mal
eM
ale
%N
%N
%N
%N
%N
%N
%N
%N
%N
%N
%N
%N
%N
%N
Illin
ois
63.6
736
.44
25.0
175
.03
46.7
753
.38
100
20
066
.76
33.3
3--
----
--56
.123
43.9
18In
dian
a30
.84
69.2
90
010
04
54.5
1245
.510
50.0
150
.01
75.0
325
.01
00
100
143
.520
56.5
26Io
wa
53.8
746
.26
100
30
054
.512
45.5
1033
.31
66.7
250
.01
50.0
110
01
00
56.8
2543
.219
Mic
higa
n46
.77
53.3
842
.93
57.1
473
.714
26.3
510
02
00
33.3
266
.74
100
10
063
.029
37.0
21M
ichi
gan
Stat
e53
.87
46.2
666
.72
33.3
147
.811
52.2
1250
.01
50.0
110
04
00
50.0
150
.01
55.3
2644
.721
Min
neso
ta46
.77
53.3
866
.72
33.3
150
.010
50.0
1066
.72
33.3
166
.76
33.3
310
01
00
54.9
2845
.123
Neb
rask
a35
.75
64.3
966
.72
33.3
140
.08
60.0
1250
.02
50.0
222
.22
77.8
7--
----
--38
.019
62.0
31N
orth
wes
tern
50.0
650
.06
80.0
420
.01
76.9
1023
.13
50.0
150
.01
28.6
271
.45
----
----
60.5
2339
.516
Ohi
o St
ate
45.0
955
.011
50.0
150
.01
51.9
1448
.113
66.7
233
.31
42.9
357
.14
100
10
050
.030
50.0
30Pe
nn S
tate
60.0
940
.06
57.1
442
.93
36.0
964
.016
57.1
442
.93
100
10
0--
----
--49
.127
50.9
28Pu
rdue
30.0
370
.07
00
100
161
.111
38.9
710
06
00
66.7
233
.31
----
----
57.9
2242
.116
Wis
cons
in35
.75
64.3
90
010
01
63.6
1436
.48
66.7
233
.31
25.0
175
.03
100
10
051
.123
48.9
22To
tal
46.1
7653
.989
51.2
2248
.821
53.7
132
46.3
114
66.7
2633
.313
50.8
3349
.232
75.0
625
.02
52.1
295
47.9
271
16
TAB
LE 9
. SEC
PO
SITI
ON
S B
Y G
END
ER A
ND
SCH
OO
L FO
R W
OM
EN’S
TEA
MS
Scho
olPo
sitio
nH
ead
Coac
hAs
soci
ate
Hea
dAs
sist
ant C
oach
Dir
ecto
r of
Ope
ratio
nsVo
lunt
eer
Coac
hGr
adua
te A
ssis
tant
Tota
lFe
mal
eM
ale
Fem
ale
Mal
eFe
mal
eM
ale
Fem
ale
Mal
eFe
mal
eM
ale
Fem
ale
Mal
eFe
mal
eM
ale
%N
%N
%N
%N
%N
%N
%N
%N
%N
%N
%N
%N
%N
%N
Alab
ama
15.4
284
.611
100
10
024
.17
75.9
2210
01
00
10.0
190
.09
100
20
025
.014
75.0
42Ar
kans
as16
.72
83.3
100
010
01
53.8
746
.26
62.5
537
.53
100
30
010
01
00
47.4
1852
.620
Aubu
rn41
.75
58.3
750
.01
50.0
125
.97
74.1
2010
05
00
100
30
010
01
00
44.0
2256
.028
Flor
ida
50.0
650
.06
00
100
340
.06
60.0
910
04
00
20.0
180
.04
----
----
43.6
1756
.422
Geo
rgia
33.3
466
.78
16.7
183
.35
41.2
758
.810
100
10
00
010
02
50.0
150
.01
35.0
1465
.026
Ken
tuck
y16
.72
83.3
1066
.72
33.3
138
.18
61.9
1310
03
00
75.0
325
.01
100
20
044
.420
55.6
25LS
U54
.56
45.5
550
.01
50.0
133
.38
66.7
1650
.01
50.0
150
.02
50.0
2--
----
--41
.918
58.1
25M
issi
ssip
pi33
.33
66.7
610
01
00
50.0
1050
.010
25.0
175
.03
----
----
----
----
44.1
1555
.919
Mis
siss
ippi
Sta
te33
.33
66.7
610
01
00
57.1
842
.96
100
10
00
010
01
----
----
50.0
1350
.013
Mis
sour
i33
.34
66.7
80
010
03
47.6
1052
.411
80.0
420
.01
00
100
30
010
01
40.0
1860
.027
Sout
h Ca
rolin
a38
.55
61.5
866
.74
33.3
237
.56
62.5
1010
04
00
50.0
150
.01
100
20
051
.222
48.8
21Te
nnes
see
38.5
561
.58
00
100
244
.48
55.6
1066
.74
33.3
220
.01
80.0
450
.01
50.0
141
.319
58.7
27Te
xas
A&M
36.4
463
.67
66.7
433
.32
27.8
572
.213
40.0
260
.03
33.3
166
.72
----
----
37.2
1662
.827
Vand
erbi
lt22
.22
77.8
7--
----
--73
.311
26.7
410
01
00
100
10
0--
----
--57
.715
42.3
11To
tal
33.1
5366
.910
743
.216
56.8
2140
.310
859
.716
074
.037
26.0
1337
.017
63.0
2976
.910
23.1
342
.024
158
.033
3
TAB
LE 8
. PAC
12
POSI
TIO
NS
BY
GEN
DER
AN
D S
CHO
OL
FOR
WO
MEN
’S T
EAM
S
Scho
olPo
sitio
nH
ead
Coac
hAs
soci
ate
Hea
dAs
sist
ant C
oach
Dir
ecto
r of
Ope
ratio
nsVo
lunt
eer
Coac
hG
radu
ate
Assi
stan
tTo
tal
Fem
ale
Mal
eFe
mal
eM
ale
Fem
ale
Mal
eFe
mal
eM
ale
Fem
ale
Mal
eFe
mal
eM
ale
Fem
ale
Mal
e%
N%
N%
N%
N%
N%
N%
N%
N%
N%
N%
N%
N%
N%
NAr
izon
a 2
7.3
375
.09
20.0
180
.04
62.5
1037
.56
100
40
020
.01
80.0
4--
----
--44
.219
55.8
24Ar
izon
a St
ate
33.3
466
.78
75.0
325
.01
35.0
765
.013
100
20
00
010
04
----
----
37.2
1662
.827
Calif
orni
a46
.77
53.3
842
.93
57.1
460
.012
40.0
866
.72
33.3
142
.96
57.1
8--
----
--53
.231
46.8
29Co
lora
do50
.05
50.0
550
.01
50.0
150
.09
50.0
910
05
00
42.9
357
.14
----
----
53.5
2346
.520
Ore
gon
33.3
366
.76
00
100
237
.911
42.1
810
02
00
----
----
00
100
147
.116
52.9
18O
rego
n St
ate
40.0
460
.06
00
100
350
.010
50.0
1075
.03
25.0
150
.03
50.0
3--
----
--45
.520
54.5
24St
anfo
rd40
.99
59.1
1385
.76
14.3
160
.717
39.3
1150
.02
50.0
250
.04
50.0
4--
----
--54
.338
45.7
32U
CLA
57.1
842
.96
00
100
350
.09
50.0
910
04
00
50.0
350
.03
----
----
52.2
2447
.822
USC
23.1
376
.910
00
100
345
.510
54.5
1266
.72
33.3
133
.32
66.7
4--
----
--35
.417
64.6
31U
tah
28.6
471
.410
00
100
137
.56
62.5
100
010
04
50.0
350
.03
100
20
034
.115
65.9
29W
ashi
ngto
n50
.05
50.0
550
.02
50.0
226
.35
73.7
1450
.02
50.0
2--
----
----
----
--36
.814
63.2
24W
ashi
ngto
n St
ate
55.6
544
.44
50.0
150
.01
46.7
753
.38
100
20
033
.31
66.7
2--
----
--50
.016
50.0
16To
tal
40.0
6060
.990
39.5
1760
.526
48.9
113
51.1
118
73.2
3026
.811
40.0
2660
.039
66.7
233
.31
45.7
249
54.3
296
25.0

TAB
LE 9
. SEC
PO
SITI
ON
S B
Y G
END
ER A
ND
SCH
OO
L FO
R W
OM
EN’S
TEA
MS
Scho
olPo
sitio
nH
ead
Coac
hAs
soci
ate
Hea
dAs
sist
ant C
oach
Dir
ecto
r of
Ope
ratio
nsVo
lunt
eer
Coac
hGr
adua
te A
ssis
tant
Tota
lFe
mal
eM
ale
Fem
ale
Mal
eFe
mal
eM
ale
Fem
ale
Mal
eFe
mal
eM
ale
Fem
ale
Mal
eFe
mal
eM
ale
%N
%N
%N
%N
%N
%N
%N
%N
%N
%N
%N
%N
%N
%N
Alab
ama
15.4
284
.611
100
10
024
.17
75.9
2210
01
00
10.0
190
.09
100
20
025
.014
75.0
42Ar
kans
as16
.72
83.3
100
010
01
53.8
746
.26
62.5
537
.53
100
30
010
01
00
47.4
1852
.620
Aubu
rn41
.75
58.3
750
.01
50.0
125
.97
74.1
2010
05
00
100
30
010
01
00
44.0
2256
.028
Flor
ida
50.0
650
.06
00
100
340
.06
60.0
910
04
00
20.0
180
.04
----
----
43.6
1756
.422
Geo
rgia
33.3
466
.78
16.7
183
.35
41.2
758
.810
100
10
00
010
02
50.0
150
.01
35.0
1465
.026
Ken
tuck
y16
.72
83.3
1066
.72
33.3
138
.18
61.9
1310
03
00
75.0
325
.01
100
20
044
.420
55.6
25LS
U54
.56
45.5
550
.01
50.0
133
.38
66.7
1650
.01
50.0
150
.02
50.0
2--
----
--41
.918
58.1
25M
issi
ssip
pi33
.33
66.7
610
01
00
50.0
1050
.010
25.0
175
.03
----
----
----
----
44.1
1555
.919
Mis
siss
ippi
Sta
te33
.33
66.7
610
01
00
57.1
842
.96
100
10
00
010
01
----
----
50.0
1350
.013
Mis
sour
i33
.34
66.7
80
010
03
47.6
1052
.411
80.0
420
.01
00
100
30
010
01
40.0
1860
.027
Sout
h Ca
rolin
a38
.55
61.5
866
.74
33.3
237
.56
62.5
1010
04
00
50.0
150
.01
100
20
051
.222
48.8
21Te
nnes
see
38.5
561
.58
00
100
244
.48
55.6
1066
.74
33.3
220
.01
80.0
450
.01
50.0
141
.319
58.7
27Te
xas
A&M
36.4
463
.67
66.7
433
.32
27.8
572
.213
40.0
260
.03
33.3
166
.72
----
----
37.2
1662
.827
Vand
erbi
lt22
.22
77.8
7--
----
--73
.311
26.7
410
01
00
100
10
0--
----
--57
.715
42.3
11To
tal
33.1
5366
.910
743
.216
56.8
2140
.310
859
.716
074
.037
26.0
1337
.017
63.0
2976
.910
23.1
342
.024
158
.033
3
A report designed to make a difference in the lives of girls and women in sport and to increase the number of women in the coaching profession