Embed Size (px)
Citation preview
The Demographics
of Aging
Module 2
Nurse Responses to Elder Mistreatment
An IAFN Education Curriculum
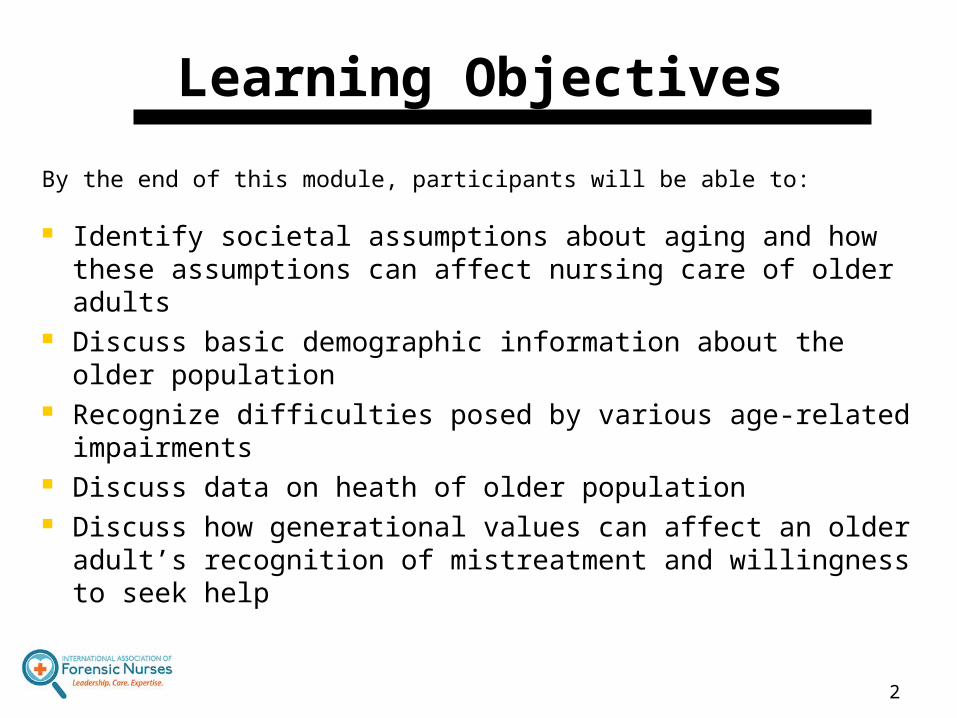
Learning Objectives
By the end of this module, participants will be able to:
Identify societal assumptions about aging and how these assumptions can affect nursing care of older adults
Discuss basic demographic information about the older population
Recognize difficulties posed by various age-related impairments
Discuss data on heath of older population Discuss how generational values can affect an older
adult’s recognition of mistreatment and willingness to seek help
2
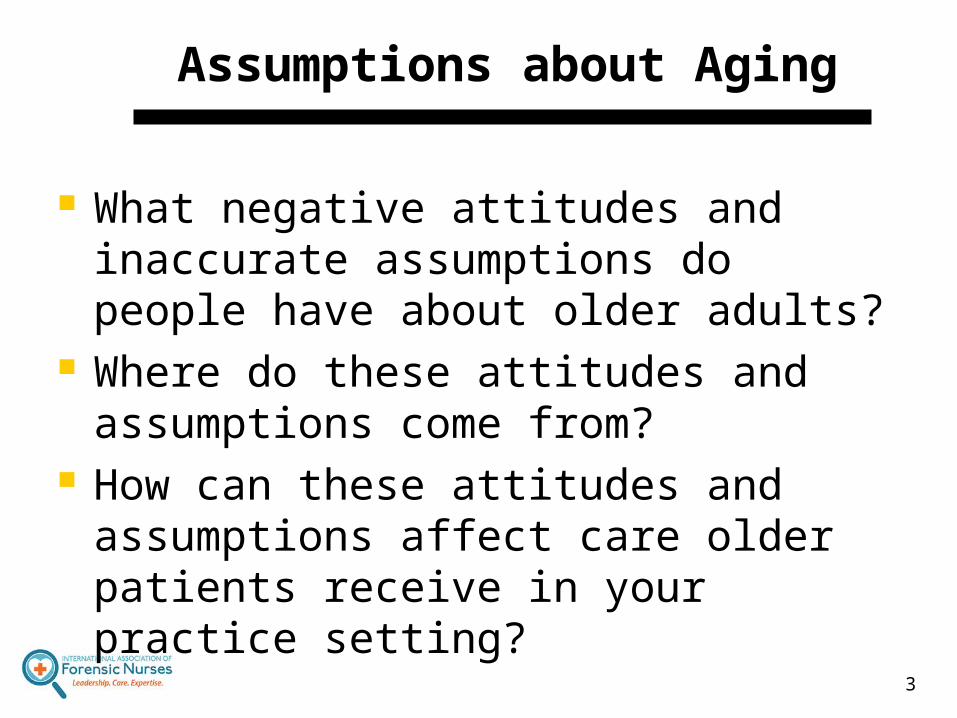
Assumptions about Aging
What negative attitudes and inaccurate assumptions do people have about older adults?
Where do these attitudes and assumptions come from?
How can these attitudes and assumptions affect care older patients receive in your practice setting?
3
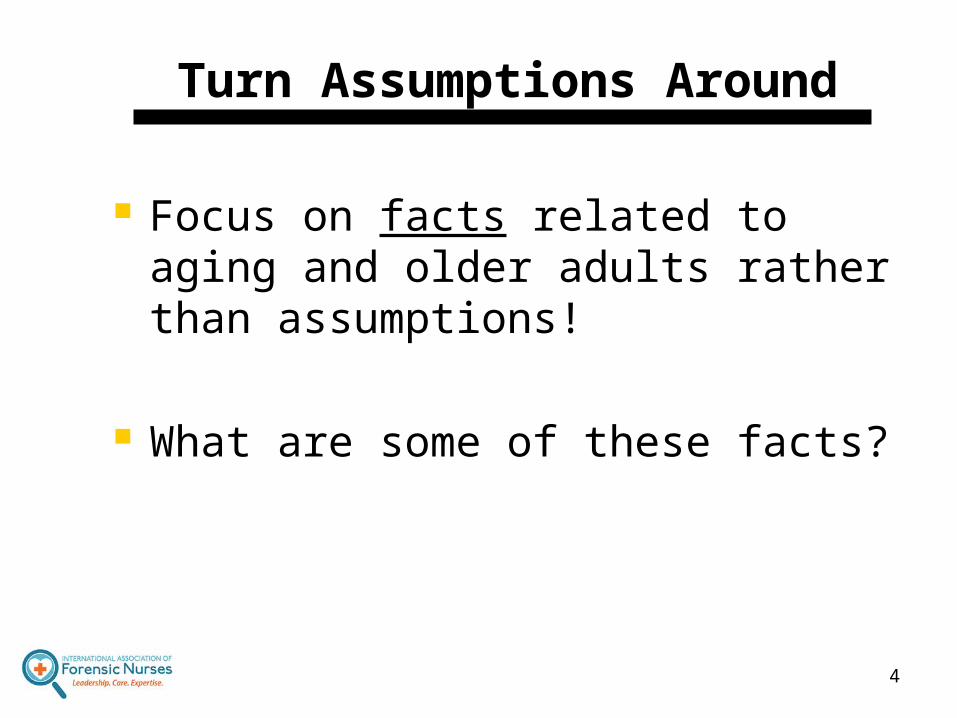
Turn Assumptions Around
Focus on facts related to aging and older adults rather than assumptions!
What are some of these facts?
4
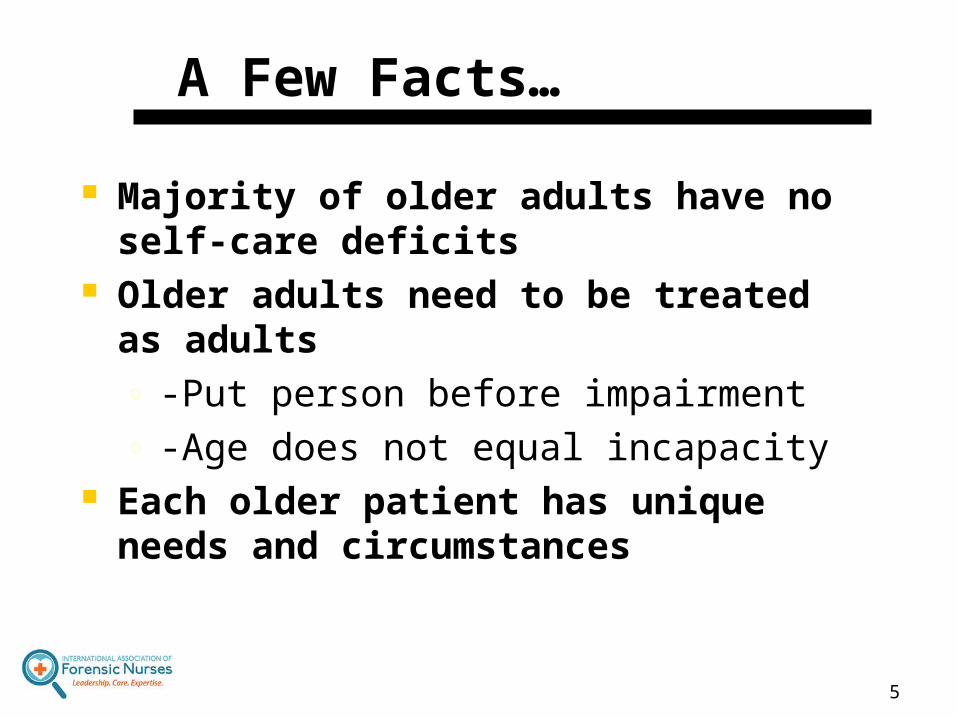
A Few Facts…
Majority of older adults have no self-care deficits
Older adults need to be treated as adultso -Put person before impairmento -Age does not equal incapacity
Each older patient has unique needs and circumstances
5
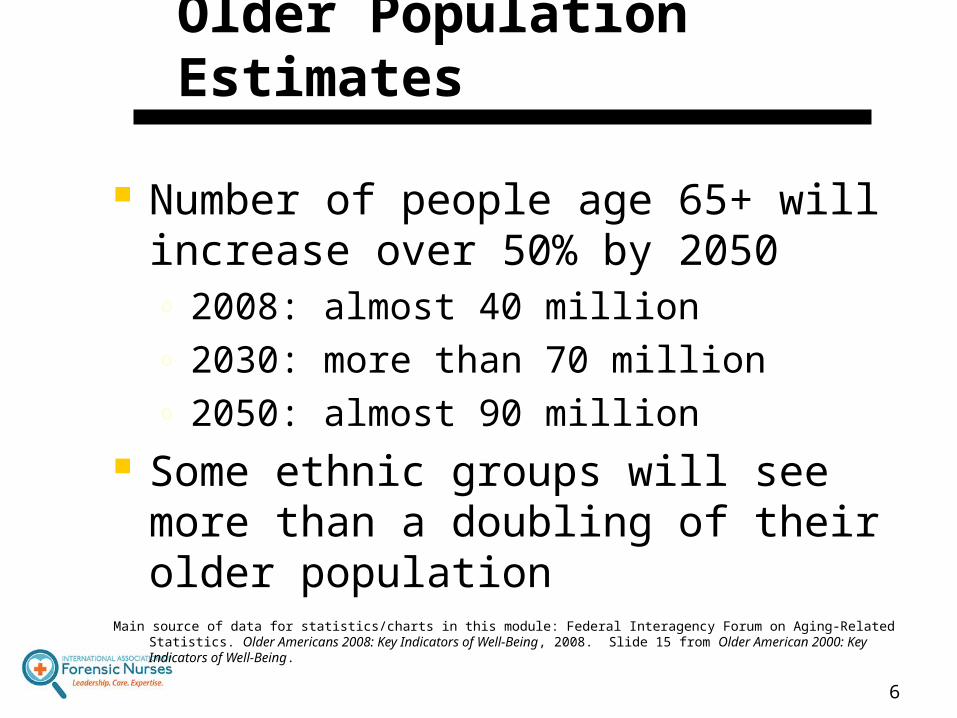
Older Population Estimates
Number of people age 65+ will increase over 50% by 2050 o 2008: almost 40 milliono 2030: more than 70 milliono 2050: almost 90 million
Some ethnic groups will see more than a doubling of their older population
Main source of data for statistics/charts in this module: Federal Interagency Forum on Aging-Related Statistics. Older Americans 2008: Key Indicators of Well-Being, 2008. Slide 15 from Older American 2000: Key Indicators of Well-Being.
6
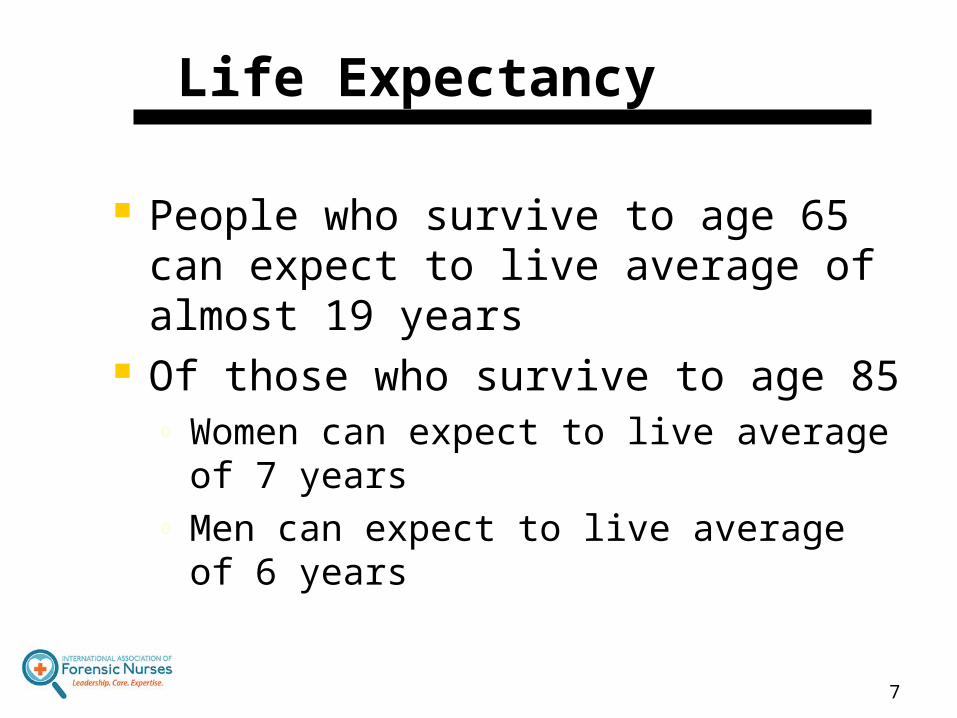
Life Expectancy
People who survive to age 65 can expect to live average of almost 19 years
Of those who survive to age 85o Women can expect to live average of
7 years o Men can expect to live average of 6
years
7
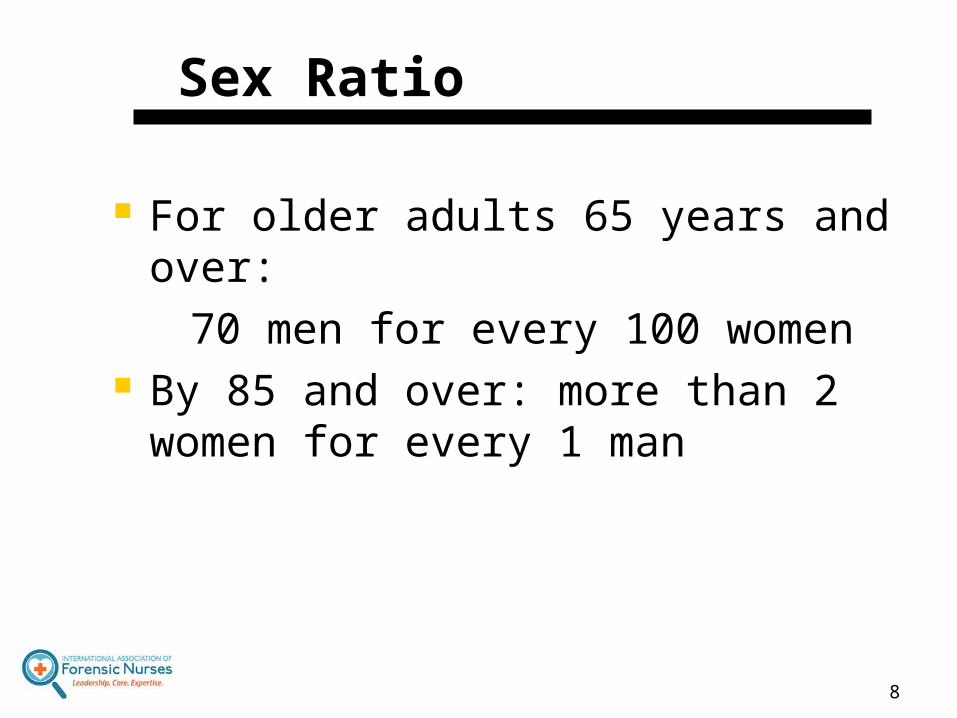
Sex Ratio
For older adults 65 years and over: 70 men for every 100 women By 85 and over: more than 2
women for every 1 man
8
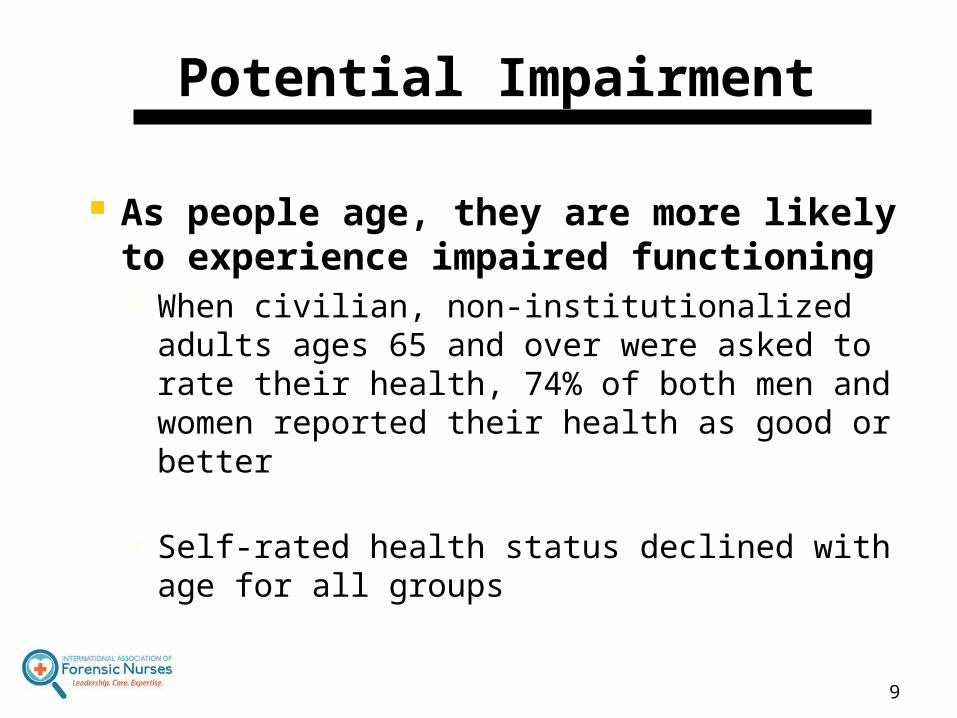
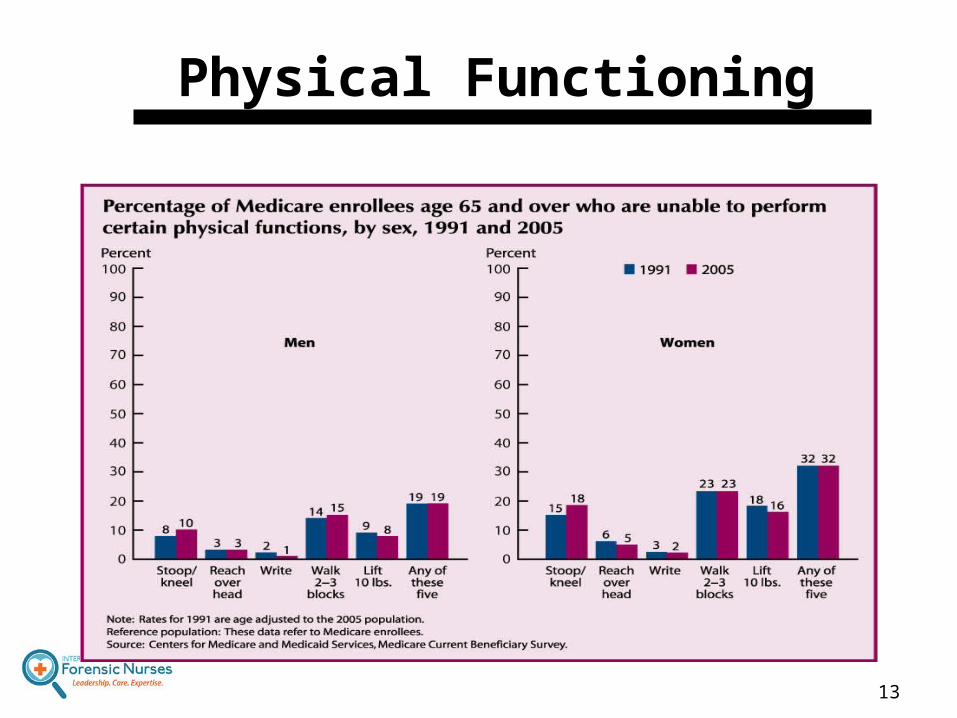
Potential Impairment
As people age, they are more likely to experience impaired functioning o When civilian, non-institutionalized adults
ages 65 and over were asked to rate their health, 74% of both men and women reported their health as good or better
o Self-rated health status declined with age for all groups
9
10
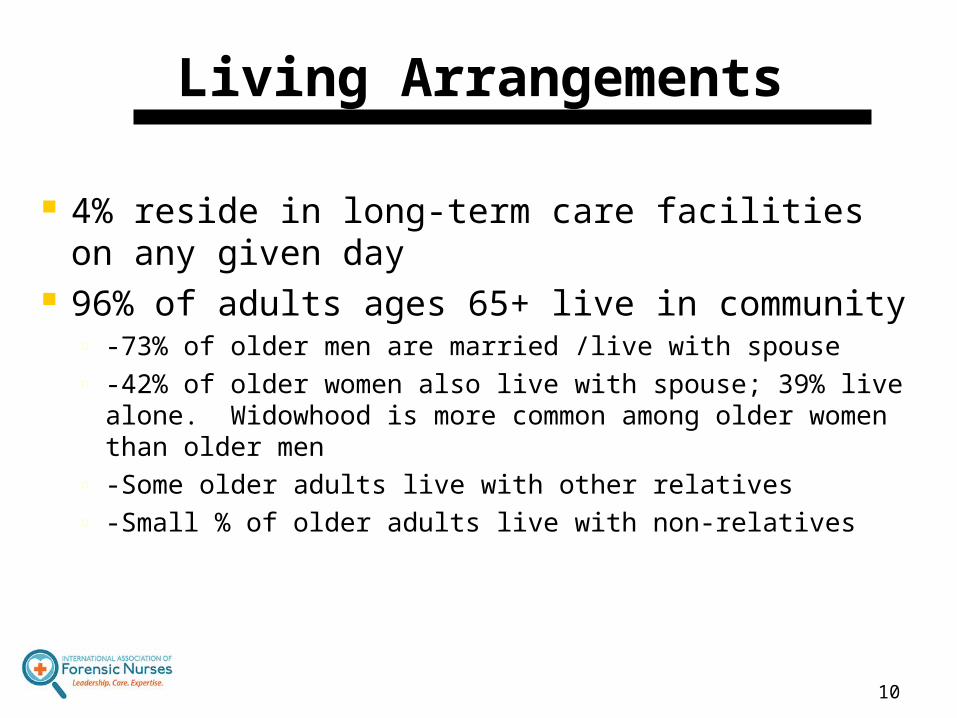
Living Arrangements
4% reside in long-term care facilities on any given day
96% of adults ages 65+ live in communityo -73% of older men are married /live with spouse o -42% of older women also live with spouse; 39% live
alone. Widowhood is more common among older women than older men
o -Some older adults live with other relativeso -Small % of older adults live with non-relatives
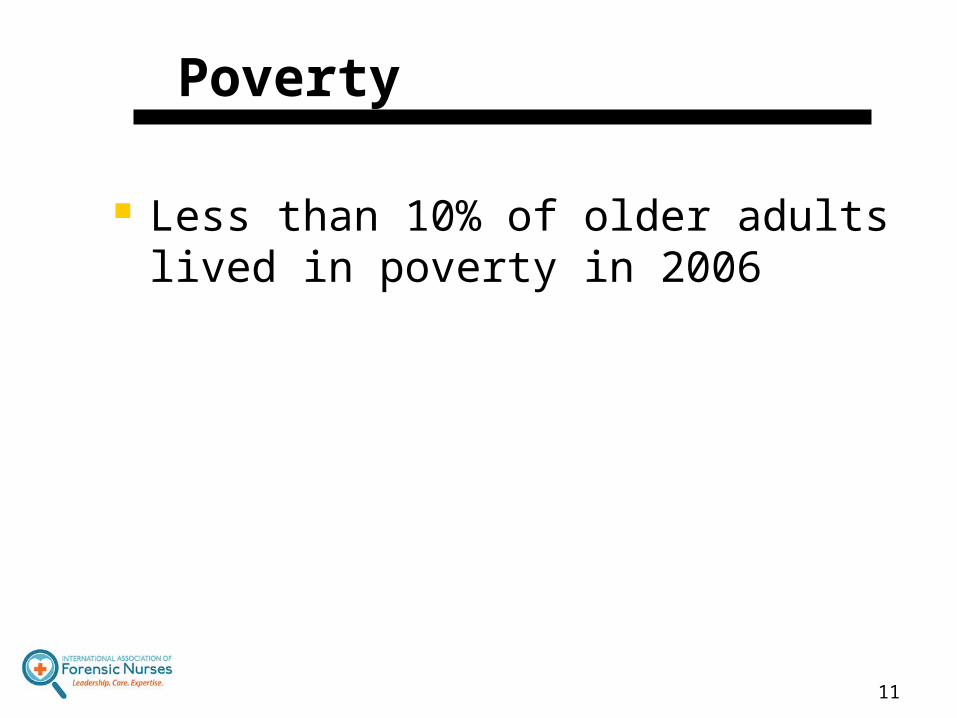
Poverty
Less than 10% of older adults lived in poverty in 2006
11
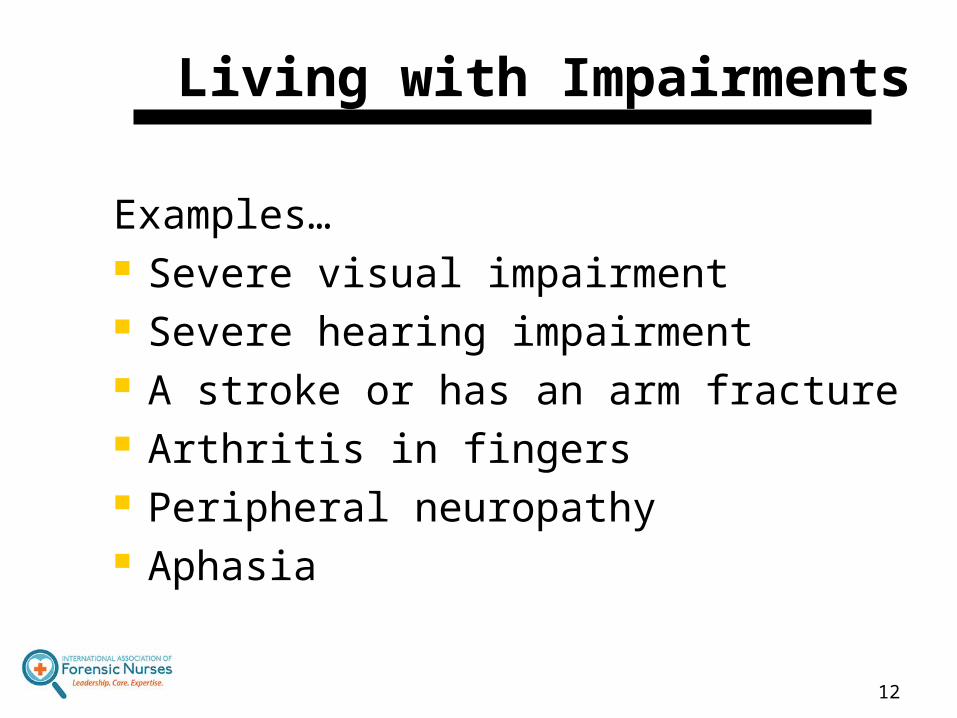
Living with Impairments
Examples… Severe visual impairment Severe hearing impairment A stroke or has an arm fracture Arthritis in fingers Peripheral neuropathy Aphasia
12
Physical Functioning
13
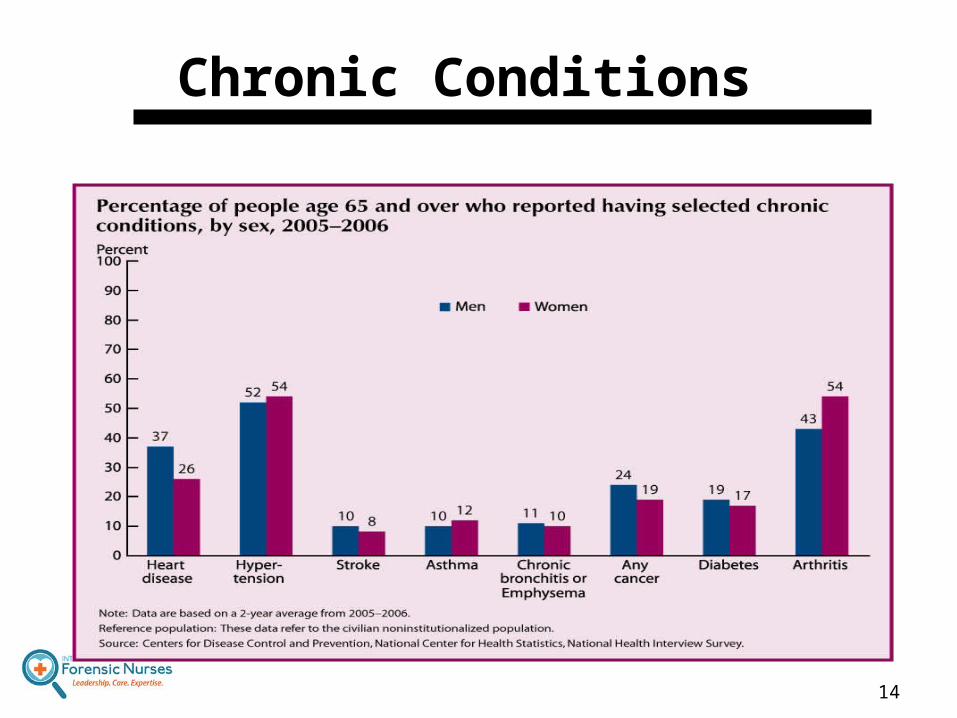
Chronic Conditions
14
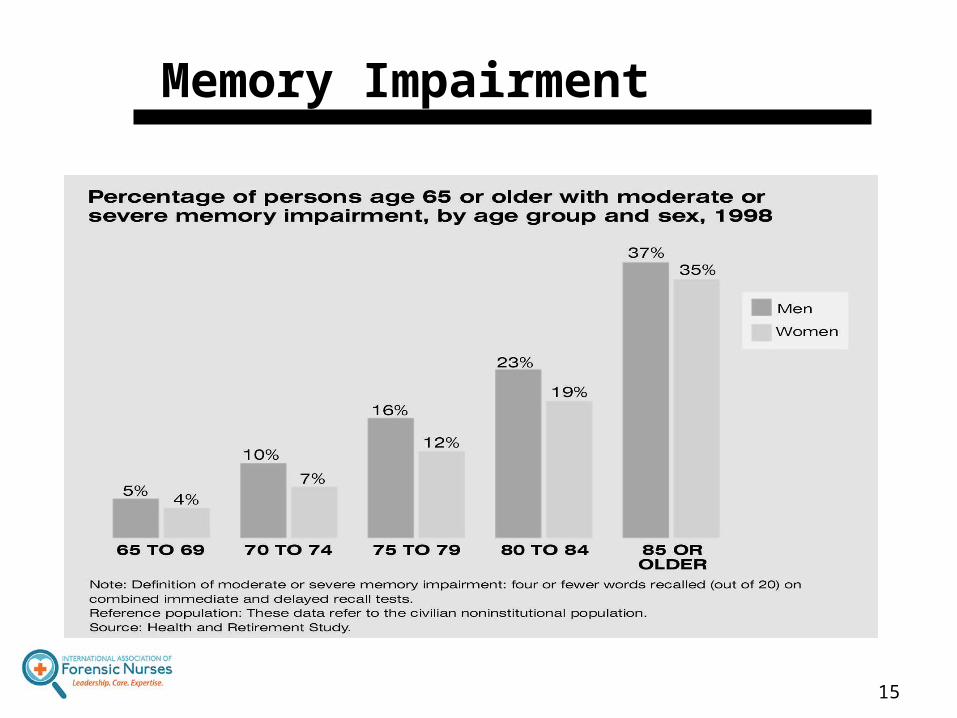
Memory Impairment
15
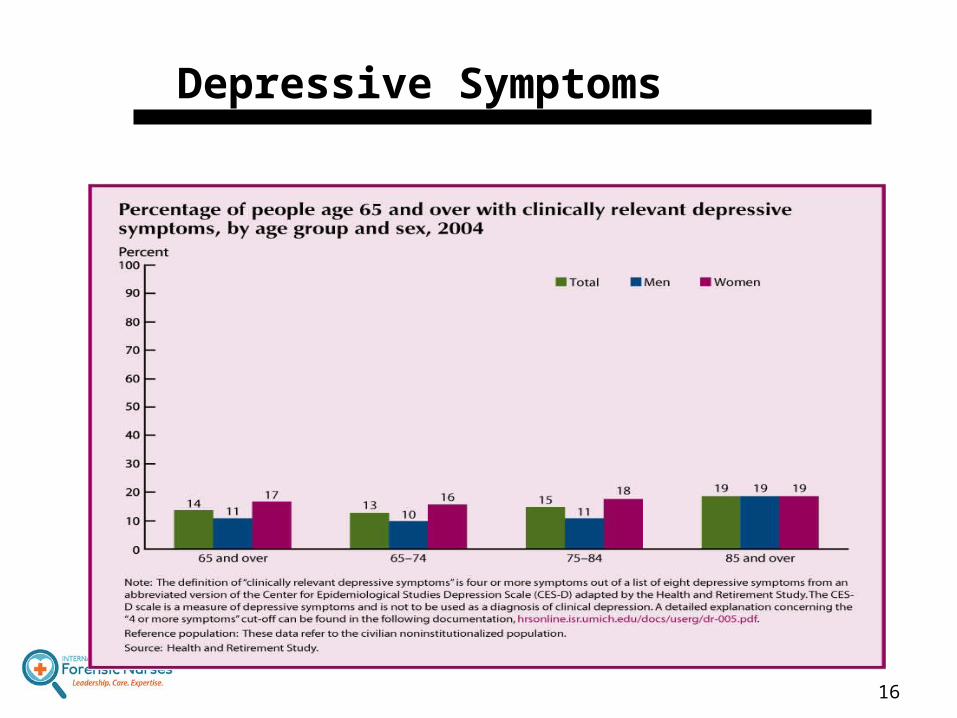
Depressive Symptoms
16
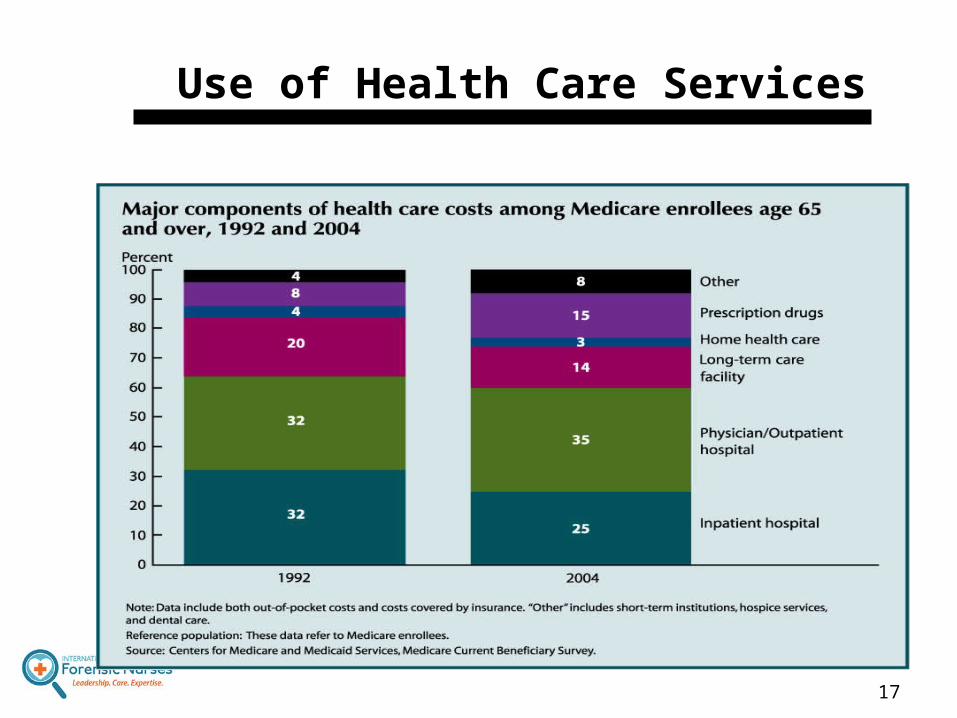
Use of Health Care Services
17
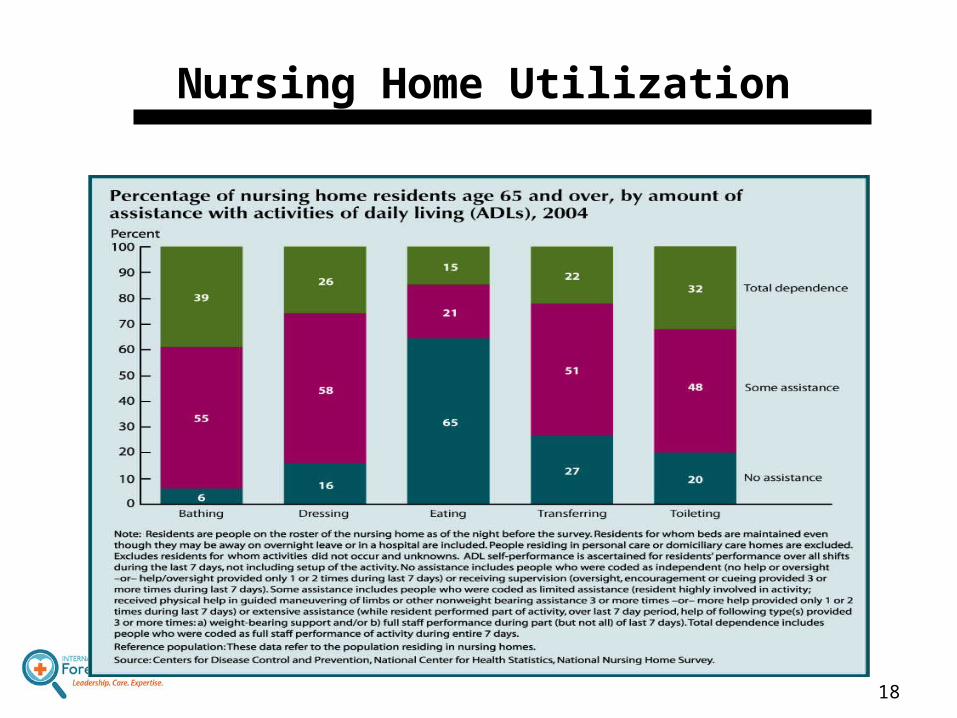
Nursing Home Utilization
18
Generational Values
Historical Timelineo -Grandparents’ years of birtho -Events that occurred at different
points on the line in their liveso -Additional historic events, inventions
and norms of the timeso -Effect of generational values related
to elder mistreatment
19
20
Closing Assessment
Write down one major concept you learned from this module and how you will apply it in your practice