Embed Size (px)
Citation preview
109 Pleasant Street Concord, NH 03301
The Department of Revenue Administration
ANNUAL REPORT 2017
This report is submitted to
Governor Christopher T. Sununu and Members of the Executive Council:
· · · District 1- Joseph D. Kenney
District 2- Andru Volinsky
District 3- Russell E. Prescott
District 4- Christopher C. Pappas
District 5- David K. Wheeler
MISSION
The mission of the Department of Revenue Administration is to fairly and efficiently administer the tax laws of the State of New Hampshire,
collecting the proper amount of taxes due, incurring the least cost to the taxpayers, in a manner that merits the highest degree of public confidence in our integrity. Further, we will provide prompt and
constructive assistance to the municipal units of government in matters of budget, finance, and the appraisal of real estate.
The New Hampshire Department of Revenue Administration
109 Pleasant Street, Concord, NH 03301
1 2017 Department of Revenue Administration Annual Report

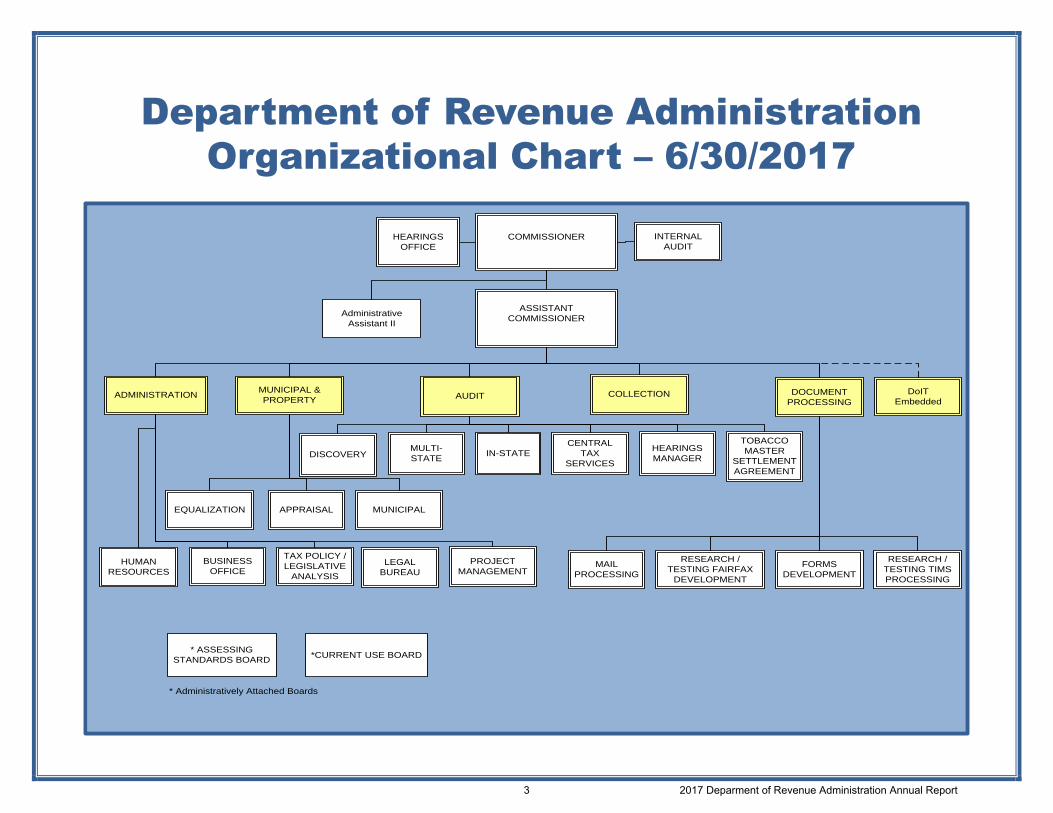
Department of Revenue Administration Organizational Chart – 6/30/2017
COMMISSIONER
ASSISTANT COMMISSIONER
HEARINGS
OFFICE
LEGAL
BUREAU
AUDIT
COLLECTION
DOCUMENT
PROCESSING
MUNICIPAL & PROPERTY
TAX POLICY /LEGISLATIVE
ANALYSIS
ADMINISTRATION
PROJECTMANAGEMENT
HUMAN RESOURCES
DISCOVERY
BUSINESS
OFFICE
IN-STATEMULTI-STATE
CENTRAL
TAX SERVICES
Administrative
Assistant II
* ASSESSING
STANDARDS BOARD
*CURRENT USE BOARD
* Administratively Attached Boards
EQUALIZATION
APPRAISAL
HEARINGS MANAGER
PROCESSING
RESEARCH /
TESTING FAIRFAX DEVELOPMENT
DoIT Embedded
INTERNAL
AUDIT
MUNICIPAL
FORMS
DEVELOPMENT
RESEARCH /
TESTING TIMS PROCESSING
TOBACCO MASTER
SETTLEMENT AGREEMENT
3 2017 Deparment of Revenue Administration Annual Report
Establishes and approves municipal, school, county and village district tax rates. Provides technical assistance, relative to taxation and finance, to the political subdivisions of the state; and prescribes a uniform chart of accounts for all municipalities, schools, counties and village districts. Assists and educates municipalities with the
methods of appraisal and assessment of real property. Provides revaluation monitoring statewide to municipalities and conducts once in five-year assessment reviews. Equalizes the local assessed valuation of each municipality to bring such valuations to the full and true market value of the property. Advises and assists municipalities and taxpayers in timely collection of the excavation tax.
Department Of Revenue Administration, 109 Pleasant Street, Concord, NH 03301 www.revenue.nh.gov | Phone number (603)230-5000
ORGANIZATIONAL CHART DIVISION PRIMARY FUNCTIONS
Performs administrative functions necessary to support Department of Revenue Administration (DRA) operations including accounting, purchasing, administrative hearings, tax policy and legislative analysis, fleet and facility maintenance, human resources, legal services, and project management.
Administration Unit
Municipal and Property Division (M&P)
INSIDE THIS FY 2017 ANNUAL REPORT
Mission Statement……………………………………………… 1 Commissioner’s Letter…………………………………………. 2 Organizational Chart…………………………………………… 3 Division Primary Functions……………………………………. 4 Summary of Taxes Administered…………………………….. 6 2017 Legislative Session in Review…………………………. 13 DRA Highlights FY 2017………………………………………. 19 Office of Revenue Counsel……………………………………. 20 Hearings Bureau………………………………………………... 23 Document Processing Division………………………………... 24 Forms Calendar………………………………………………… 25 Audit Division……………………………………………………. 26 Collections Division…………………………………………….. 27 Municipal and Property Division………………………………. 28 Technology Developments……………………………………. 32 Transparency Reports and Statistics………………………… 33 Legislative History………………………………………………. 49 Property Tax Tables per RSA 21-J:3 XII………………………103 2016 Equalization Survey “including utilities & railroads” Per RSA 21-J:3 XIII……………………………………………...137 2016 Equalization Survey “not including utilities & railroads” Per RSA 21-J:3 XIII……………………………………………...157 Base Valuation for Debt Limits………………………………. 169 2016 Comparison of Full Value Tax Rates…………………. 176
Audit Division Conducts audits of tax returns of individuals, partnerships, estates, trusts, corporations, and documents filed with DRA to ensure compliance with New Hampshire tax laws and rules.
4 2017 Deparment of Revenue Administration Annual Report
Division Primary Functions (Cont.)
Advises and assists municipalities and taxpayers in full and true appraisals and timely collection of timber yield tax. Appraises public utility, railroad property for equalization and state utility property tax, as well as local tax purposes. Assists local municipalities with the administration of the Current Use law (RSA 79-A).
Initiates collection activities in pursuit of delinquent tax returns and outstanding payments for all taxes administered by DRA. Issues wholesale tobacco tax licenses, and meals and rentals tax licenses, and sells tobacco tax stamps.
Collections Division
DRA Training Room
We’re on the Web!
Visit us at:
www.revenue.nh.gov
Provides general assistance to the public for all taxes administered by DRA and maintains taxpayer accounts.
Central Tax Services Unit
Department of Information Technology
(Embedded Personnel) Designs, develops and maintains computerized systems to support the administration of taxes and to automate labor intensive functions.
DRA Law Library
Document Processing Division Processes taxpayer documents in an accurate, efficient, and timely manner.
5 2017 Deparment of Revenue Administration Annual Report

SUMMARY OF TAXES ADMINSTERED BY THE DEPARTMENT OF REVENUE ADMINISTRATION FY 2017
This is only a brief summary of certain New Hampshire taxes administered by the Department of Revenue Administration. This summary is not intended to be relied upon as a full and complete text. Please refer to the applicable forms, instructions, rules and to the laws cited below to determine how this information applies to specific persons or situations. BUSINESS PROFITS TAX - RSA CHAPTER 77-A The Business Profits Tax (BPT) has historically been one of the largest sources of general fund revenue. Enacted in 1970 as a replacement for the municipal property tax on stock-in-trade, farm livestock, poultry, fuel pumps, mills and machinery, the initial rate was established at 6%. The rate steadily increased to a high of 9.56% in Fiscal Year (FY) 1983. The rate then decreased to 7% beginning FY 1995, then increased to 8% for tax years ending on or after July 1, 1999. The rate of 8.5% was effective for all returns and taxes due on account of taxable periods ending on or after July 1, 2001. For taxable periods ending on or after December 31, 2016, the BPT rate is reduced to 8.2%. For taxable periods ending on or after December 31, 2018, the BPT rate is reduced to 7.9%, contingent upon combined unrestricted general and education trust fund revenues of $4.64
billion being collected during the biennium ending June 30, 2017. For taxable periods ending on or after December 31, 2019, the BPT rate is reduced to 7.7% and for taxable periods ending on or after December 31, 2021, the BPT rate is reduced to 7.5%. The BPT is assessed on income from conducting business activity within the state. For multi-state businesses, income is apportioned using a weighted sales factor of two and the standard payroll and property factors. Organizations operating a unitary business must use combined reporting in filing their NH return. Four annual estimate payments are required on liabilities greater than $200, paid at 25% each. BPT return due dates are consistent with federal return due dates based on the taxpayer’s entity type. Business organizations with $50,000 or less of gross business income from all their activities are not required to file a return. Business organizations, however, that realize a gain or loss on the sale or
exchange of an interest in the business organization shall file a return for the taxable period, regardless of whether or not the business organization's gross business income is in excess of $50,000 during the taxable period. BUSINESS ENTERPRISE TAX - RSA CHAPTER 77-E In 1993, a 0.25% tax was enacted on taxable enterprise value tax base, which is the sum of all compensation paid or accrued, interest paid or accrued, and dividends paid after special adjustments and apportionment. Chapter 17, Laws of 1999 increased the rate from 0.25% to 0.5%. The rate was increased to 0.75% in 2001. For taxable periods ending on or after December 31, 2016, the Business Enterprise Tax (BET) rate is reduced to 0.72%. For taxable periods ending on or after December 31, 2018, the BET rate is reduced to .675%, contingent upon combined unrestricted general and education trust fund revenues of $4.64
6 2017 Deparment of Revenue Administration Annual Report
billion being collected during the biennium ending June 30, 2017. For taxable periods ending on or after December 31, 2019, the BET rate is reduced to .6% and for taxable periods ending on or after December 31, 2021, the BET rate is reduced to .5%. In 2001, the filing threshold increased to $150,000 (from $100,000) of gross business receipts or $75,000 (from $50,000) of the enterprise value tax base. In 2013, the filing thresholds increased to $200,000 (from $150,000) of gross business receipts or $100,000 (from $75,000) of the enterprise value tax base and will be adjusted biennially, using the Consumer Price Index, Northeast Region, beginning with taxable periods ending on or after December 31, 2015. Four annual estimate payments are required on liabilities greater than $200 for taxable periods ending before December 31, 2013 and $260 for taxable periods ending on or after December 31, 2013; paid at 25% each on the 15th day of the 4th, 6th, 9th and 12th months of the taxable year. The BET return is due at the same time the BPT return is due. The BET may be used as a credit against the BPT under RSA 77-A:5. Any unused portion of the credit may be carried forward and
allowed against the BPT for five taxable periods from the taxable period in which the BET was paid for credits from taxable periods ending before December 31, 2014 and for ten taxable periods from the taxable period in which the BET was paid for credits from taxable periods ending on or after December 31, 2014.
COMMUNICATIONS SERVICES TAX RSA CHAPTER 82-A First enacted in 1990 at 5.5%, this tax was assessed upon two-way communications services. Chapter 158, Laws of 2001, increased the permanent portion of the tax to 4.5% and continued the surtax of 2.5%, resulting in an overall tax rate of 7% for the period beginning July 1, 2001 and ending June 30, 2003. A permanent rate of 7% was passed effective July 1, 2003. Retailers must register with the Department and are required to collect and remit the tax. Communications Services Tax returns must be filed by the provider on the 15th day
of the month for the preceding calendar month unless the average monthly liability is less than $100. Any provider/retailer who can reasonably estimate its average monthly liability to be in excess of $10,000 is required to make an estimated payment equal to 90% of the actual tax collected. This payment is due on or before the 15th day of the month during which the liability is incurred. EDUCATION PROPERTY TAX RSA 76:3 Under Chapter 17, Laws of 1999, the Education Property Tax was established. The tax is assessed and collected by municipalities to be retained for use by their local school districts. The rate was originally $6.60 per thousand of equalized valuation without utilities. The tax appears on the same bill with the other property taxes administered at the local level. The effective date of this tax was April 1, 1999. Chapter 158, Laws of 2001 reduced the rate from $6.60 per $1,000 of value to $4.92 per $1,000 of value beginning with the April 1, 2003 tax year. The sunset provision of the Education Property Tax was repealed, making the tax a permanent revenue source
7 2017 Deparment of Revenue Administration Annual Report
dedicated to funding education. As of April 1, 2005, the rate was $3.33 per $1,000. Beginning in July of 2005, and every fiscal year thereafter, the Commissioner is required to set the tax rate at a level sufficient to generate revenue of $363,000,000. ELECTRICITY CONSUMPTION TAX RSA CHAPTER 83-E Effective May 1, 2001, the Electricity Consumption Tax is imposed at a rate of $ .00055 per kilowatt hour on persons, including governmental units, distributing, redistributing or transmitting electrical energy for consumption in this state. The tax is paid by the consumer and collected and submitted by distribution companies, except in the case of consumers who generate their own power. These self-generating companies or individuals must submit tax returns on their own behalf. Returns (Form DP-133) must be filed on the 15th day of the second month following the month in which the electrical energy was provided to a consumer and for which tax is due. Effective January 1, 2019, the Electricity Consumption Tax is repealed.
INTEREST & DIVIDENDS TAX RSA CHAPTER 77 The Interest & Dividends (I&D) Tax, which was first enacted in 1923, applied a tax based on the “average rate of property taxation” upon the income and dividend income received by New Hampshire residents from sources other than New Hampshire and Vermont banks. The tax was changed significantly in FY 1995 to eliminate the exemption on income from New Hampshire and Vermont banks. In conjunction with this change, the personal exemption increased from $1,200 to $2,400. The exemption for joint filers increased from $2,400 to $4,800. Estimated I&D Tax payments are due April 15th, June 15th, September 15th and January 15th on tax liabilities greater than $500. The I&D Tax return is due on April 15th. Additional exemptions are available for residents who are 65 years of age, who are blind, and who are handicapped and unable to work, provided
they have not reached their 65th birthday. The current tax rate of 5% has remained the same since FY 1977. For taxable periods ending on or after December 31, 2013 trusts are no longer taxable under the I&D Tax. Instead, interest and dividend income received by the grantors or beneficiaries of trusts, to the extent that they are inhabitants or residents of New Hampshire, is subject to taxation. LOCAL PROPERTY TAX RSA CHAPTER 76 Property taxes, based upon local assessed valuations, are administered and collected by the individual cities and towns. The majority of property taxes collected are based on the market value of the property at its highest and best use. Some property taxes, however, are based on the market value of a property’s actual use, such as current use assessments under RSA Chapter 79-A for certain Farm Land, forest land, and unproductive land. The program is for properties dedicated to remaining as open space. A Land Use Change tax of 10% of the market value of the property is charged upon the occurrence of a disqualifying event (usually a development, use or sale of a portion of a property).
8 2017 Deparment of Revenue Administration Annual Report
Typically ten acres or more of dedicated land is required. Application to local officials on or before April 15th is required. Taxes on the value of standing timber are assessed under RSA chapter 79. These are assessed by local officials, at a rate of 10% of the value of the standing timber. The annual filing of an intent to cut and the subsequent report of timber cut are required. Taxes on the value of gravel and excavated materials are assessed under RSA Chapter 72-B. These are assessed at a rate of at the rate of $.02 per cubic yard of earth excavated. Local Property tax exemptions, credits and deferrals: Elderly Exemption: Effective July 23, 1996, RSA 72:39-a replaced the Standard, Expanded, Adjusted and Optional Adjusted Elderly Exemptions. The statute sets the minimum exemption, which the cities and towns may modify as follows: Amount of exemption from value of residential real estate: Ages 65-74; 75-79; and 80+ Net Income Limits, including Social Security Income or
pension payment Net Asset Limits Blind Exemption RSA 72:37 The exemption for the legally blind must be adopted by the municipality. The exemption is a minimum $15,000 reduction of the assessed value of the residential real estate (RSA 72:29) and could be higher if amended through referendum vote. Deferral for the Elderly or Disabled RSA 72:38-a The assessing officials “... may annually grant a person qualified under this paragraph a tax deferral...” Property taxes are deferred and accrue interest at the rate of 5% per annum. The deferred property tax may not exceed more than 85% of the equity value of the residence. If granted by the assessing officials, the deferral is available to any resident property owner who is 65 years or older, or eligible for benefits for the totally and permanently disabled under the federal social security act, has owned the home for at least five years, and is currently residing there.
Veterans Tax Credit RSA 72:28 Qualifying residents shall receive the following amounts deducted from their tax bills: $50: Basic credit available to all veterans. $700: For the surviving spouse of a veteran, pursuant to RSA 72:29-a, and veterans having a total and permanent service-connected disability pursuant to RSA 72:35. Towns may adopt a local option to increase the above dollar amounts to $500 and $2,000 or to extend the credit to all honorably discharged veterans regardless of dates of service in relation to war-time periods. Disability Exemption: A resident who qualifies under RSA 72:36-a as totally and permanently disabled from service connection, and is paraplegic or having double amputation from military service connected disability or blind (5/200 vision or less) as a result of service connection, and owning a specially adapted home acquired with V.A. assistance is exempt from all taxation on that home.
9 2017 Deparment of Revenue Administration Annual Report

Tax Exemption for Improvements to Assist Persons with Disabilities RSA 72:37-a This exemption is limited to a physically handicapped person who resides at the residential real estate and is applicable to only the value of any special aids required by the resident to enable them to propel themselves. Tax Exemption for Wind-Powered, Solar and Wood Heating Energy System RSAs 72:66, 72:62, 72:70 These exemptions are optional to the cities and towns, and must be voted upon locally.
Tax Exemption for the Disabled RSA 72:37-b Available to persons eligible under the Social Security Act for benefits to the Totally & Permanently Disabled. Applicable only on the applicant’s principal place of abode. The exemption is optional and must be voted on by the municipality, which also determines the amount of the exemption and the income/asset limitations.
MEALS & RENTALS TAX RSA CHAPTER 78-A The Meals and Rentals (M&R) Tax was enacted in 1967 at a rate of 5%. The tax is assessed upon patrons of hotels and restaurants, on certain rentals, and upon meals costing $.36 or more. Chapter 144, Laws of 2009, increased the rate from 8% to the current rate of 9%. An M&R Tax Operators License is required. The M&R Tax is required to be remitted to the State on the 15th day of the month following the collection of tax, accompanied by the M&R Tax return. An M&R Operator is required to
maintain books and records showing the amount of tax collected and to remit the tax monthly to the State, less a 3% commission. MEDICAID ENHANCEMENT TAX RSA CHAPTER 84-A The Medicaid Enhancement Tax (MET) was enacted in 1991 at a rate of 8% of gross patient services
revenue of every hospital. In 1993, the rate was changed to be established by legislation each biennium upon the gross patient services revenue of every hospital for the hospital's fiscal year ending during the first full calendar year preceding the taxable period. If the Legislature failed to set the rate of tax on or before April 1, preceding the first fiscal year of the biennium, the tax rate was to be zero for that biennium. In no event was the rate of the tax be greater than 6 percent for any biennium. In 1998, the law was amended to require the Legislature to set the tax rate on or before May 1. In
2003, the tax rate was changed to 6% of gross patient services revenue. In 2004, the 6% tax on gross patient services revenue was changed to a 6% tax upon the “net” patient services revenue of every hospital. In 2007, the tax rate was reduced to 5.5% of net patient
services revenue. For taxable periods ending June 30, 2014 and prior, hospitals are required to pay 100% of the tax due for the taxable period no later than the 15th day of the fourth month of the taxable period and were required to file a tax return with the Department on or before the 10th day of the month following the
10 2017 Deparment of Revenue Administration Annual Report
NH State Quarter, Est. 2000
expiration of the taxable period. For taxable periods ending June 30, 2015 and after, special hospitals for rehabilitation are no longer included in the definition of “hospital” and hospitals are required to file a return on or before the 15th day of April in the taxable period. In addition, every hospital shall on or before January 15 in the taxable period make a nonbinding estimate of its projected tax payment. The tax rate decreases to 5.45% for the taxable period ending June 30, 2016, to 5.4% for the taxable period ending June 30, 2017 and will remain at 5.4% for the taxable period ending June 30, 2018 and every taxable period thereafter unless the total aggregate uncompensated care for hospitals with both a critical and a noncritical access hospital definition falls below $375 million, at which point the tax rate shall be 5.25%. REAL ESTATE TRANSFER TAX RSA CHAPTER 78-B The Real Estate Transfer Tax (RETT) was first enacted in 1967. Chapter 17, Laws of 1999, increased the permanent tax rate assessed on the sale, granting, and transfer of real estate and any interest in real estate to
$.75 per $100, or fractional part thereof, of the price or consideration. This rate is assessed on both the buyer and seller for a combined tax rate of $1.50 per $100. Where the price or consideration is $4,000 or less, there is a minimum tax of $20 assessed on both the buyer and seller. The tax is paid at the Registry of Deeds office in the county where the property is located. A Declaration of Consideration (Form CD-57) must be filed with the Department by both the purchaser and seller no later than 30 days from the recording of the deed at the Registry of Deeds or transfer of real estate, whichever is later. RAILROAD TAX RSA CHAPTER 82 Every railroad, railway, express, and every parlor, sleeping or dining car company, or other company not a railroad company owning any cars operated for profit on any railroad in the State of New Hampshire shall pay an annual Railroad Tax as of April 1 of each year. The Railroad Tax is on
the market value of the property’s full and true value as defined in RSA 75:1. The tax is imposed at the average rate of taxation at that time upon other property throughout the State. Railroad “property” applies to both railroad companies (an enterprise, corporation, partnership, etc.) and private rail cars operated for profit on any railroad in the State of New Hampshire. TOBACCO TAX - RSA CHAPTER 78 The Tobacco Tax is a direct tax upon the consumer at retail. However, it is pre-collected and paid by the wholesaler. It is presumed the Tobacco Tax has been pre-collected and paid by the wholesaler by the affixing of a Tobacco Tax Stamp on the tobacco product. The Tobacco Tax was first enacted in 1939. Originally the tax was based upon the value at the usual selling price of all tobacco products. In 1975, the tax was changed to a flat rate of $0.12 per package of 20 cigarettes. At that time, there was no tax on other tobacco products. Over the next 34 years the tax was increased from $0.12 to $1.78 per package. In 2011, the Tobacco Tax rate was decreased from $1.78 to $1.68 for each package containing 20 cigarettes or
11 2017 Deparment of Revenue Administration Annual Report
at a rate proportional to such rate for packages containing more or less than 20 cigarettes. As of August 1, 2013 the Tobacco Tax rate increased from $1.68 to $1.78 for each package containing 20 cigarettes, per Chapter 224:379 through 381, Laws of 2011. In 1991, the Legislature enacted a tax on tobacco products other than cigarettes (OTP Tax) at the rate “proportional to the cigarette tax, having such ratio to the usual wholesale price of the tobacco product other than cigarettes as the cigarette tax bears to the usual wholesale price of the cigarettes.” In 2003, the OTP Tax was changed to 19% of the wholesale sales price. The OTP Tax rate was changed again in 2009 to 48.59% of the wholesale sales price, and then in 2010 to a rate of 65.03% of the wholesale sales price. In 2011, the OTP Tax rate was decreased to 48% of the wholesale sales price. As of August 1, 2013, the OTP Tax rate increased from 48% to 65.03% of the wholesale sales price, per Chapter 224:379 through 381, Laws of 2011. Wholesalers are required to report their tax liability for the collection of the OTP Tax on a monthly basis. The return is due on or before the 15th day of the month following the end of the
reporting period. Wholesalers may file quarterly, but permission to file quarterly must be pre-approved, in writing, by the Department.
UTILITY PROPERTY TAX RSA CHAPTER 83-F Utility property is defined as “all real estate, buildings, and structures, machinery, dynamos, apparatus, poles, wires, fixtures of all kinds and descriptions, and pipe lines located within New Hampshire employed in the generation, production, supply, distribution, transmission, or transportation of electric powered or natural gas, crude petroleum and refined petroleum products or combination thereof, water, or sewage.” In 2011, “utility property” was amended to exclude: the electrical generation, production, and supply equipment of an “eligible customer-generator” as defined in RSA 362-A:1-a, II-b; property used for the retail distribution of fuel for personal, non-commercial use, use as a fuel in a
motorized vehicle, home cooking, or heating; and that portion of a manufacturing establishment’s generation, production, supply, distribution, transmission, or transportation of electric power or natural gas, crude petroleum and refined petroleum products or combinations thereof, water, or sewage subject to tax under RSA 72:6, 72:7, and 72:8, but not exempt under RSA 72:23, that is expended, used, or consumed on-site primarily for the operation of the manufacturing establishment and that does not otherwise enter the stream of commerce. The Utility Property Tax rate is $6.60 per $1,000 of value of utility property. On December 1 of each year the Department determines the value of utility property as of the previous April 1. The tax is due annually on or before January 15th. Every corporation or company required to pay Utility Property Tax must file a declaration of its estimated Utility Property Tax for the subsequent taxable period. Quarterly estimated payments of the Utility Property Tax are due on April 15th, June 15th, September 15th, and December 15th.
NH State Insect, the Ladybug
12 2017 Deparment of Revenue Administration Annual Report
New Hampshire FY 2017 Legislative Session in Review
Senate Bill 16 (Chapter 106, Laws of 2017) amends RSA 77-A to reauthorize the Commission to study apportionment of gross business profits under the Business Profits Tax (BPT).
Effective: June 8, 2017
Amends: RSA 77-A
Senate Bill 78 (Chapter 254, Laws of 2017) amends RSA 77-A:11 to provide that all BPT audit records shall be confidential and not disclosed unless required by law and providing for the automatic sealing of any judicial proceeding pertaining to the BPT.
Effective: September 16, 2017
Amends: RSA 77-A:11
Senate Bill 225 (Chapter 257, Sections 49-50, Laws of 2017) amends RSA 77-A:1, I, the definition of “business organization” under the BPT and RSA 77-E:1, III, the definition of “business enterprise” under the Business Enterprise Tax (BET), to provide for the taxation of a new entity type, the foundation, created pursuant to RSA 564-E.
Effective: October 1, 2017
Amends: RSA 77-A:1, I; RSA 77-E:1, III
House Bill 386 (Chapter 63, Laws of 2017) amends RSA 77-G, the Education Tax Credit (ETC) to allow scholarships to be used by eligible students to pay for the cost of college courses, tutoring, or distance education programs. Extends the due date of the ETC application from June 15th to November 15th. Extends the due date to make a donation under the ETC program from not later than July 15th to not later than December 15th. Effective: August 1, 2017 Amends: RSA 77-G
This Legislative Review is published as a convenient reference guide of relevant statutory changes made during the 2017 Legislative Session by the New Hampshire General Court. This review is intended to provide a summary or
synopsis of enacted legislation. It is not intended to be relied upon as a full and complete text or as a substitute for the actual state law. Please refer to the applicable statute and rules to determine how this information applies to specific
persons or situations.
BUSINESS TAXES
13 2017 Deparment of Revenue Administration Annual Report
MEALS AND ROOMS TAX
INTEREST AND DIVIDENDS TAX
House Bill 517 (Chapter 156, Sections 213-218 and 229, Laws of 2017) reduces the rate of the RSA 77-A BPT and the RSA 77-E BET. For taxable periods ending on or after December 31, 2019 the BPT rate is reduced to 7.7% and the BET rate is reduced to .6%. For taxable periods ending on or after December 31, 2021 the BPT rate is reduced to 7.5% and the BET rate is reduced to .5%.
Amends RSA 77-A:3-a to provide that a taxpayer may calculate expense deductions pursuant to Internal Revenue Code (IRC) § 179 not to exceed $500,000 for property placed in service on or after January 1, 2018.
Amends RSA 77-A:1, XX to conform the BPT to the IRC of 1986 in effect on December 31, 2016 for taxable periods beginning on or after January 1, 2018, subject to the adjustments required pursuant to RSA 77-A:3-b.
Effective: Sections 213 and 214 effective July 1, 2019 and applicable to taxable periods ending on or after December 31, 2019; Sections 215 and 216 effective July 1, 2021 and applicable to taxable periods ending on or after December 31, 2021; Section 218 effective January 1, 2018 and applicable to property placed in service on or after January 1, 2018; Section 229 effective June 28, 2017 and applicable to taxable periods beginning on or after January 1, 2018
Amends: RSA 77-A; RSA 77-E
House Bill 654 (Chapter 249, Sections 1-5, Laws of 2017) establishes a Committee to study the regulation and taxation of vacation and short-term rentals. Effective: July 18, 2017 Amends: N/A
Senate Bill 225 (Chapter 257, Section 48, Laws of 2017) amends RSA 77:10 to provide for the taxation of a new entity type, the foundation, created pursuant to RSA 564-E. Foundations shall be taxed under the RSA 77 Interest and Dividends Tax in the same manner as trusts. Effective: October 1, 2017 Amends: RSA 77:10
14 2017 Deparment of Revenue Administration Annual Report
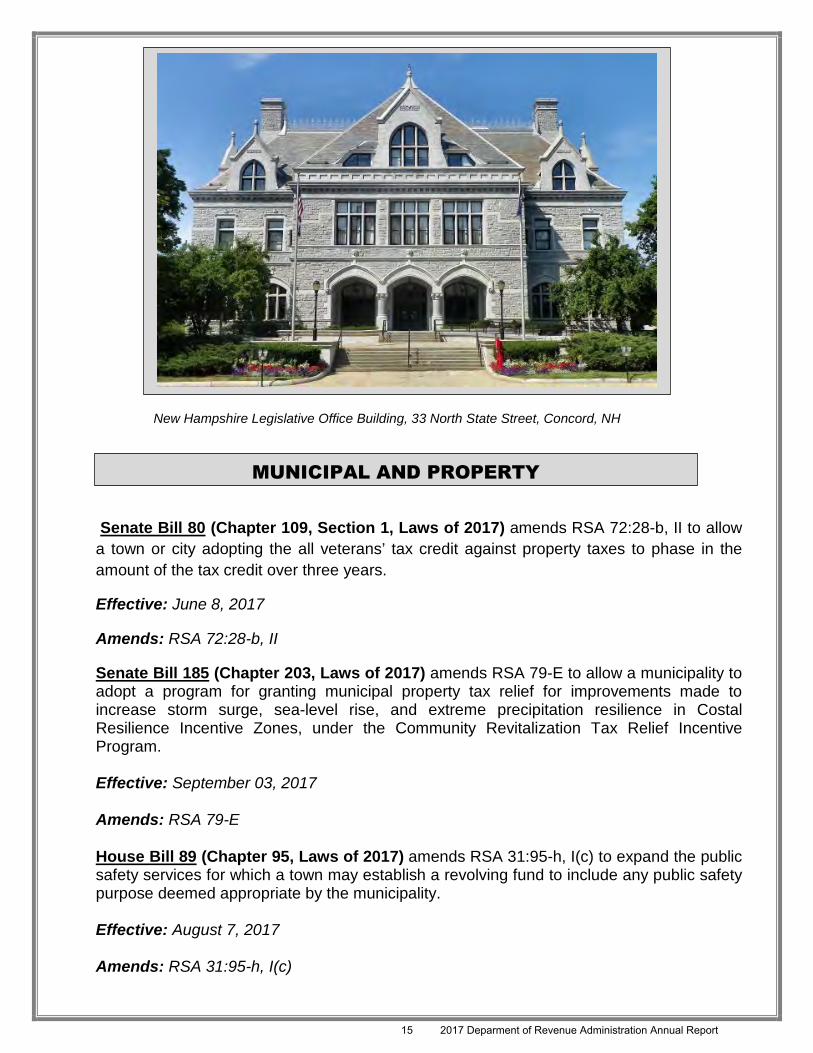
New Hampshire Legislative Office Building, 33 North State Street, Concord, NH
Senate Bill 80 (Chapter 109, Section 1, Laws of 2017) amends RSA 72:28-b, II to allow a town or city adopting the all veterans’ tax credit against property taxes to phase in the amount of the tax credit over three years.
Effective: June 8, 2017
Amends: RSA 72:28-b, II
Senate Bill 185 (Chapter 203, Laws of 2017) amends RSA 79-E to allow a municipality to adopt a program for granting municipal property tax relief for improvements made to increase storm surge, sea-level rise, and extreme precipitation resilience in Costal Resilience Incentive Zones, under the Community Revitalization Tax Relief Incentive Program. Effective: September 03, 2017 Amends: RSA 79-E House Bill 89 (Chapter 95, Laws of 2017) amends RSA 31:95-h, I(c) to expand the public safety services for which a town may establish a revolving fund to include any public safety purpose deemed appropriate by the municipality. Effective: August 7, 2017 Amends: RSA 31:95-h, I(c)
MUNICIPAL AND PROPERTY
15 2017 Deparment of Revenue Administration Annual Report
House Bill 167 (Chapter 97, Laws of 2017) amends RSA 28:3-a to provide the county convention with the authority to require an audit of county accounts. Effective: August 7, 2017 Amends: RSA 28:3-a
House Bill 172 (Chapter 30, Laws of 2017) amends RSA 29 to allow for issuance of tax anticipation notes by the county treasurer upon order of the commissioners with approval of the county convention. Tax anticipation notes may be issued for an aggregate principal amount not to exceed 80% of the total appropriations approved by the county convention for the preceding financial year and must be payable not later than the final day of the applicable budget year.
Effective: July 8, 2017
Amends: RSA 29
House Bill 251 (Chapter 127, Laws of 2017) amends RSA 35 to clarify that appropriations or transfers to capitals reserve funds shall be made by special warrant article. Amends RSA 32 to clarify that appropriations to capital reserve funds are non-lapsing and non-transferrable.
Effective: August 15, 2017
Amends: RSA 35; RSA 32
House Bill 316 (Chapter 179, Laws of 2017) establishes a local option commercial and industrial construction exemption from municipal property taxation. A municipality adopting the property tax exemption for commercial and industrial construction may exempt increases in value in an amount up to 50% of the increase for a period of up to 10 years.
Effective: August 28, 2017
Amends: RSA 72
House Bill 323 (Chapter 132, Laws of 2017) amends RSA 21-J:14-b, I(c), a reference to the Uniform Standards of Professional Appraisal Practice (USPAP) which currently limits the applicability of USPAP to “Standard 6” to instead reference USPAP in its entirety.
Effective: August 15, 2017
Amends: RSA 21-J:14-b, I(c)
16 2017 Deparment of Revenue Administration Annual Report
MISCELLANEOUS
House Bill 329 (Chapter 20, Section 6, Laws of 2017) provides for municipal ratification of meetings and elections scheduled to occur March 14, 2017 that were postponed due to inclement weather.
Effective: April 21, 2017
Amends: N/A
House Bill 568 (Chapter 168, Laws of 2017) amends RSA 72:23, I(b) to clarify that all leases of real or personal property owned by the state, or a county, city, town, school district, or village district, shall provide for the payment of the property tax by the lessee and that failure to include a provision requiring the payment of the property tax in the lease does not affect the occupant’s obligation to pay property taxes for the leased property. Amends RSA 72:23, I(b) to allow for land leased exclusively for agriculture to be exempted from the requirement that the lessee pay the property tax for leased property.
Effective: June 28, 2017
Amends: RSA 72:23, I(b)
House Bill 104 (Chapter 54, Laws of 2017) repeals RSA 77-B, the Commuters Income Tax. The U.S. Supreme Court held that the Commuters Income Tax was unconstitutional in 1975. See Austin v. New Hampshire, 420 U.S. 656 (1975).
Effective: August 1, 2017
Repeals: RSA 77-B
17 2017 Deparment of Revenue Administration Annual Report

ADMINISTRATIVE
House Bill 215 (Chapter 235, Laws of 2017) establishes a Commission to study the legalization, regulation, and taxation of marijuana. The Commissioner of the DRA is a member of the Commission.
Effective: July 18, 2017
Amends: RSA 318-B
House Bill 517 (Chapter 156, Sections 224-227, Laws of 2017) repeals RSA 83-E, the Electricity Consumption Tax.
Effective: January 1, 2019
Repeals: RSA 83-E
Senate Bill 130 (Chapter 150, Section 1, Laws of 2017) establishes the salary grade of the Tax Policy Analyst pursuant to RSA 21-J:6-d.
Effective: August 15, 2017
Amends: RSA 94:1-a, I(b)
House Bill 25 (Chapter 228, Laws of 2017) makes a capital appropriation of $30,160,000 to the DRA to purchase and implement a Revenue Information Management System (RIMS).
Effective: July 1, 2017
Amends: N/A
House Bill 517 (Chapter 156, Sections 113-116, Laws of 2017) amends RSA 21-J to create the Division of Taxpayer Services within the DRA while at the same time eliminated the Document Processing Division and the Central Tax Services Unit, thereby consolidating all DRA areas responsible for routine taxpayer interaction within a single Division.
Effective: July 1, 2017
Amends: RSA 21-J
18 2017 Deparment of Revenue Administration Annual Report
Tax Training Sessions. DRA holds many training sessions that are open to the public regarding Meals and Rentals Tax, Tobacco Tax, Property Tax Exemptions and Credits, The Equalization Process, Real Estate Assessment Review, New Tax Collector Workshops, and Taxation of Utilities and Railroads.
e-File New Hampshire. The DRA has made it easier to pay your Business Enterprise Taxes, Business Profits Taxes, Interest & Dividends Taxes, Meals and Rooms (Rentals) Taxes, and Real Estate Transfer Taxes online. For additional information, visit our
website at www.revenue.nh.gov
Balanced Scorecard. Staff from each unit of the DRA worked diligently to establish and track performance measures for key operational functions, building a Balanced Scorecard which will assist managers and staff in tracking progress and identifying areas for improvements. The Balanced Scorecard will be tracked monthly going forward, and the annual results will be posted to the DRA website to improve our internal transparency with taxpayers.
Executive Branch Regulatory Review. As requested by the Governor, the Department conducted a comprehensive review of all its administrative rules, as well as those of the Assessing Standards Board and the Current Use Board, which are both administratively attached to the Department. Upon completion of this review, the Department determined that these rules are mandated by law. However, the Department was able to clarify and eliminate sections of certain rules, combine multiple rules into a single rule and will conduct an additional review of certain statutes and rules with the goal of identifying changes to promote consistency and ease the implementation and compliance burden on business.
DRA Call Log. During fiscal year 2017, DRA handled a total of 36,624 taxpayer phone calls. A breakdown of the calls is as follows: 19,762 calls were related to general taxpayer questions, 8,934 calls were in response to written correspondence a taxpayer received from the DRA, 4,236 calls were related to tax assessments and the collection of outstanding taxes due and 3,692 calls were questions regarding the low and moderate homeowners property tax relief program, municipal tax rates, property tax assessments, timber and gravel tax, utility property tax, property tax exemptions/credits or current use property questions and finally, technical calls.
The New Hampshire Department of Revenue Administration’s staff will always be ready to take your important phone call. To request forms, please email: [email protected]., or call the Forms Line at (603) 230-5001. If you have any substantive questions or regarding forms, please contact Central Tax Services at (603) 230-5920.
Did you know the DRA collected more than 80% of the state’s general fund revenue?
DRA’s Call Center is open for questions Monday – Friday 8am to 4:30pm.
DRA HIGHLIGHTS FY 2017
19 2017 Deparment of Revenue Administration Annual Report
PO BOX 457, CONCORD, NH 03302-0457 LEGAL BUREAU 603.230.5026
FROM THE LEGAL BUREAU Shaun P. Thomas, Assistant Revenue Counsel
The Office of Revenue Counsel provides legal advice and representation to the Department, including rendering advice and legal opinions to Department personnel; managing bankruptcy cases; drafting and coordinating the adoption of administrative rules; handling Right-to-Know Law requests; representing the Department before the Board of Tax and Land Appeals and the Department’s Hearings Bureau; and providing assistance and advice in connection with audits and other stages of the enforcement and administration of tax laws. In addition, the Office of Revenue Counsel coordinates and assists with the Department of Justice’s representation of the Department and acts as co-counsel in certain cases.
During FY 2017, the Office of Revenue Counsel defended civil cases filed in administrative appeal tribunals and state courts concerning appeals of tax assessments and challenges to state taxing statutes, managed bankruptcy cases in which the Department is a creditor, and
managed the administrative rules process, in addition to providing advice and legal opinions. Often, the cases managed by the Office of Revenue Counsel have the potential for a substantial fiscal impact or significant precedential value. Below is a description of the decisions issued during
FY 2017,as well as a few noteworthy pending cases.
OFFICE OF REVENUE COUNSEL
ADMINISTRATIVE RULEMAKING PROJECTED FOR FY 2018
Rev 100; Organizational Rules (Reorganization) Rev 404; All Veterans’ Tax Credit (Legislative Change) Rev 1100; Financial Source Coding for Local Educational Agencies (Legislative Change) Rev 1700, Rev 2000, and Rev 2200; Financial Accounting (Regulatory Review) Rev 3200; Education Tax Credit Program (Legislative Change)
20 2017 Deparment of Revenue Administration Annual Report

Decisions Issued During FY 2017Municipal Law M&R Operator Guilty Plea Appeal of New Hampshire Electric Cooperative, Inc., NH Supreme Court Case 2015-0625 (6/2/2017); Appeal of Public Service Company Of New Hampshire D/B/A Eversource Energy, NH Supreme Court Case 2015-0626 (6/2/2017). These two consolidated cases involved rulings largely against the taxpayers by the Board of Tax and Land Appeals (“BTLA”) in dozens of separate local property tax abatement appeals for the 2011 and 2012 tax years. On appeal to the Supreme Court, the Department filed amicus briefs supporting the validity of the “unit method” of appraisal, where a utility’s property is valued as a whole and then a portion of that whole unit value is allocated to each individual municipality. The BTLA upheld the town’s valuations in 16 of the 23 appeals filed by the New Hampshire Electric Cooperative, and in 77 of the 86 appeals filed by Eversource Energy, which the Supreme Court affirmed in both cases. In New Hampshire Electric Cooperative, the Supreme Court explicitly noted that the unit method had not been invalidated by the BTLA.
State v. Sophea Yay, No. 216-2016-CR-256 (N.H. Super. Ct. N.D. Hillsborough 1/19/2017). The operator and manager of Central Ale House, located in Manchester, pled guilty to theft and perjury in Hillsborough County Superior Court Northern Division on January 19, 2017. From March of 2014 through August of 2015, Sophea Yay stole a total of $37,101.01, when she collected Meals and Rentals Tax payments from her patrons, but failed to remit a substantial portion of those payments to the Department each month, instead treating the funds as her own. Further, during the underlying investigation, Ms. Yay made a false, material statement when she testified in front of the Grand Jury, by lying about her past involvement in the business. Ms. Yay was sentenced to two concurrent State Prison sentences of 3.5 to 7 years, all of which was suspended on the condition of good behavior for three years. As part of the sentence, Ms. Yay submitted a full restitution payment of $37,101.01.
A Noteworthy Case Pending During FY 2017 MEALS AND ROOMS TAXState of New Hampshire v. Priceline.com, Inc., Expedia, Inc, Orbitz, LLC and Travelocity.com, LLP et al, Merrimack County Superior Court, No. 217-2013-CV-00613. In 2013, the State of New Hampshire filed suit against 11 online travel companies (“OTCs”), including Priceline.com, Inc., Expedia, Inc., Orbitz, LLC, and Travelocity.com, LLP. The State alleges that the OTCs are operating their businesses in such a way as to avoid paying tax due as required by the Meals and Rooms Tax (“MRT”) Law, RSA Chapter 78-A, and are, in fact, collecting the amount of MRT due from consumers. The State alleges that the OTCs sold or provided hotel rooms and motor vehicles to the
public, but did not remit the full amount of the MRT due under RSA 78-A to the State. The State further alleges that the OTCs are engaging in unfair and deceptive trade practices prohibited by the Consumer Protection Act, RSA Chapter 358-A. Beginning on May 1, 2017, the Court held a two-week trial. Following the trial, the Court ordered a schedule for filing post-trial briefs and replies. The State and the OTCs filed their post-trial briefs on June 30, 2017, and August 4, 2017, respectively. The State filed its reply on August 25, 2017, and the OTCs’ reply is due on September 8, 2017. There is no timeline for a decision.
21 2017 Deparment of Revenue Administration Annual Report
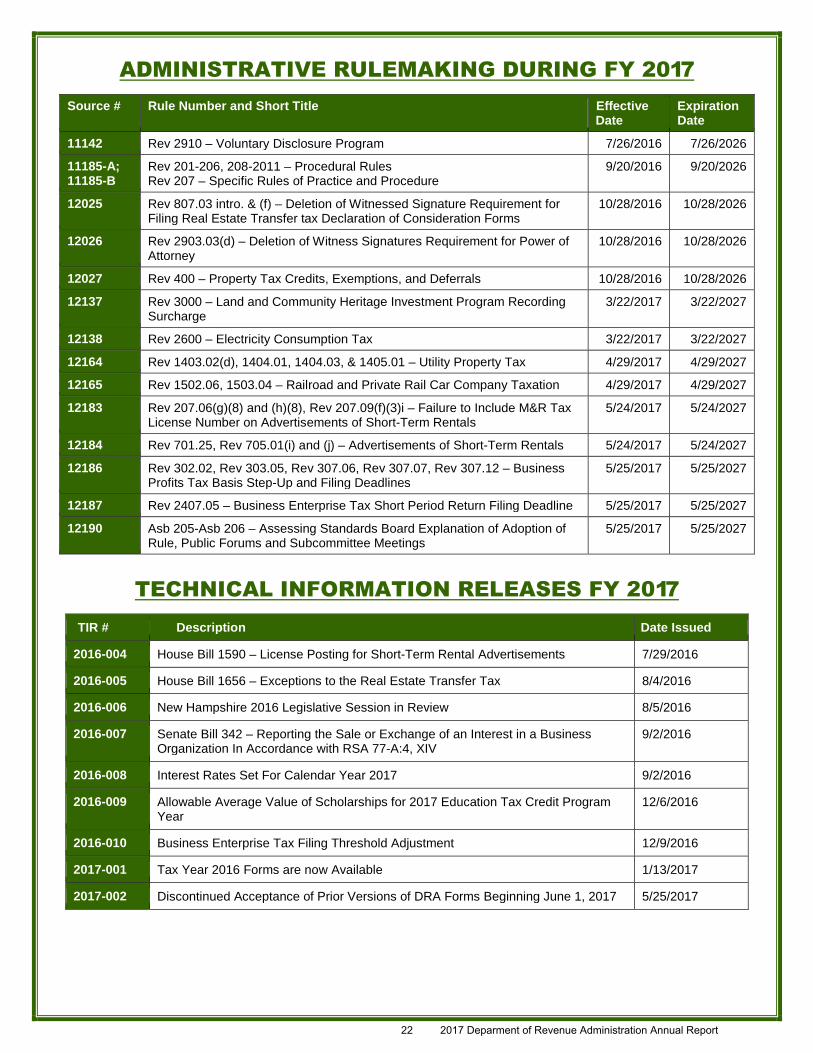
ADMINISTRATIVE RULEMAKING DURING FY 2017 Source # Rule Number and Short Title Effective
Date Expiration Date
11142 Rev 2910 – Voluntary Disclosure Program 7/26/2016 7/26/2026
11185-A; 11185-B
Rev 201-206, 208-2011 – Procedural Rules Rev 207 – Specific Rules of Practice and Procedure
9/20/2016 9/20/2026
12025 Rev 807.03 intro. & (f) – Deletion of Witnessed Signature Requirement for Filing Real Estate Transfer tax Declaration of Consideration Forms
10/28/2016 10/28/2026
12026 Rev 2903.03(d) – Deletion of Witness Signatures Requirement for Power of Attorney
10/28/2016 10/28/2026
12027 Rev 400 – Property Tax Credits, Exemptions, and Deferrals 10/28/2016 10/28/2026
12137 Rev 3000 – Land and Community Heritage Investment Program Recording Surcharge
3/22/2017 3/22/2027
12138 Rev 2600 – Electricity Consumption Tax 3/22/2017 3/22/2027
12164 Rev 1403.02(d), 1404.01, 1404.03, & 1405.01 – Utility Property Tax 4/29/2017 4/29/2027
12165 Rev 1502.06, 1503.04 – Railroad and Private Rail Car Company Taxation 4/29/2017 4/29/2027
12183 Rev 207.06(g)(8) and (h)(8), Rev 207.09(f)(3)i – Failure to Include M&R Tax License Number on Advertisements of Short-Term Rentals
5/24/2017 5/24/2027
12184 Rev 701.25, Rev 705.01(i) and (j) – Advertisements of Short-Term Rentals 5/24/2017 5/24/2027
12186 Rev 302.02, Rev 303.05, Rev 307.06, Rev 307.07, Rev 307.12 – Business Profits Tax Basis Step-Up and Filing Deadlines
5/25/2017 5/25/2027
12187 Rev 2407.05 – Business Enterprise Tax Short Period Return Filing Deadline 5/25/2017 5/25/2027
12190 Asb 205-Asb 206 – Assessing Standards Board Explanation of Adoption of Rule, Public Forums and Subcommittee Meetings
5/25/2017 5/25/2027
TECHNICAL INFORMATION RELEASES FY 2017 TIR # Description Date Issued
2016-004 House Bill 1590 – License Posting for Short-Term Rental Advertisements 7/29/2016
2016-005 House Bill 1656 – Exceptions to the Real Estate Transfer Tax 8/4/2016
2016-006 New Hampshire 2016 Legislative Session in Review 8/5/2016
2016-007 Senate Bill 342 – Reporting the Sale or Exchange of an Interest in a Business Organization In Accordance with RSA 77-A:4, XIV
9/2/2016
2016-008 Interest Rates Set For Calendar Year 2017 9/2/2016
2016-009 Allowable Average Value of Scholarships for 2017 Education Tax Credit Program Year
12/6/2016
2016-010 Business Enterprise Tax Filing Threshold Adjustment 12/9/2016
2017-001 Tax Year 2016 Forms are now Available 1/13/2017
2017-002 Discontinued Acceptance of Prior Versions of DRA Forms Beginning June 1, 2017 5/25/2017
22 2017 Deparment of Revenue Administration Annual Report
HEARINGS BUREAU During FY 2017, the Hearings Bureau continued to increase efficiency to provide better service to the taxpayer given our available resources. We have continued to review administrative tasks and work flow to ensure that our processes are as lean and efficient as possible to maximize our productivity. In FY 2017, the overall time required to produce a Final Order after the close of the record increased to an average of 23.04 days; as compared to 17.20 days in FY
2016. With respect to taxpayer petitions, the time to produce a Final Order after the close of the record averaged 38.68 days, and we met our goal of issuing an order within 60 days 87.88% of the time, which was a decrease from 88.24% in FY 2016. With respect to cases involving license denials, suspensions and revocations, bonds, and tobacco seizures, the time to produce a Final Order after the close of the record averaged 14.06 days, and we met our goal of issuing an order within 14 days 84.48% of the time, which was decrease from 98.11% in FY 2016. However, the total number of final orders issued in FY 2017 also increased by 39.13% from the number issued in FY 2016. In cases in which an order was not issued within the timeframe we have set as a goal, the cause of the delays generally include, but are not limited to, the following: that the order involved complex legal issues which needed additional time to research and write orders, that the Hearing Bureau’s full hearing schedule reduced the time available to research and write orders, and/or delays resulting from the unavailability of necessary personnel. During FY 2017, the Hearings Bureau has continued to make progress in more fully implementing the use of technology in order to increase efficiency. We have implemented an electronic indexing and filing system for older paper case files in order to quickly access older information prior to implementation of our electronic case management systems, and have processed case files dating from 1990 through 2008 so far. The Hearings Bureau’s goal for FY 2018 is to continue to maintain an appeal process which provides a fair and efficient system that ensures the highest degree of confidence in the integrity of this system, and timely performance. This includes continuing to streamline administrative processes in order to allow us to meet our goals of issuing Final Orders on taxpayer petitions within 60 days after the close of the record in each case, and of issuing Final Orders on license denials, suspensions and revocations, bonds, and tobacco seizures, within 14 days after the close of the record in each case. The following statistics summarize the activity of the Hearings Bureau during the past fiscal year as compared to the prior fiscal year: FY16 FY 17 % of Change Appeals Filed 117 154 31.62% Cases closed 116 142 22.41% Cases appealed to Superior Court, BTLA, or Supreme Court 5 9 80.00% Cases open as of 6/30 40 54 35.00% Final Orders Issued for the period of 7/1/2016-6/30/2017 Assessor Decertification, Suspension, or Discipline 0 2 ***1 Business Tax 10 8 -20.00% Business Tax and Meals & Rentals Tax 0 1 ***2 Communication Services Tax 0 1 ***3 Interest & Dividends Tax 2 5 150.00% Meals & Rentals Tax 43 51 18.60% Real Estate Transfer Tax 1 1 0.00% Tobacco Tax 12 27 125.00% Utility Property Tax 1 0 (100.00%) Total Final Orders Issued 69 96 39.13%
1 Please note that mathematically there cannot be a percentage of increase from the number zero. 2 See Footnote 1. 3 See Footnote 1.
23 2017 Deparment of Revenue Administration Annual Report
DOCUMENT PROCESSING DIVISION
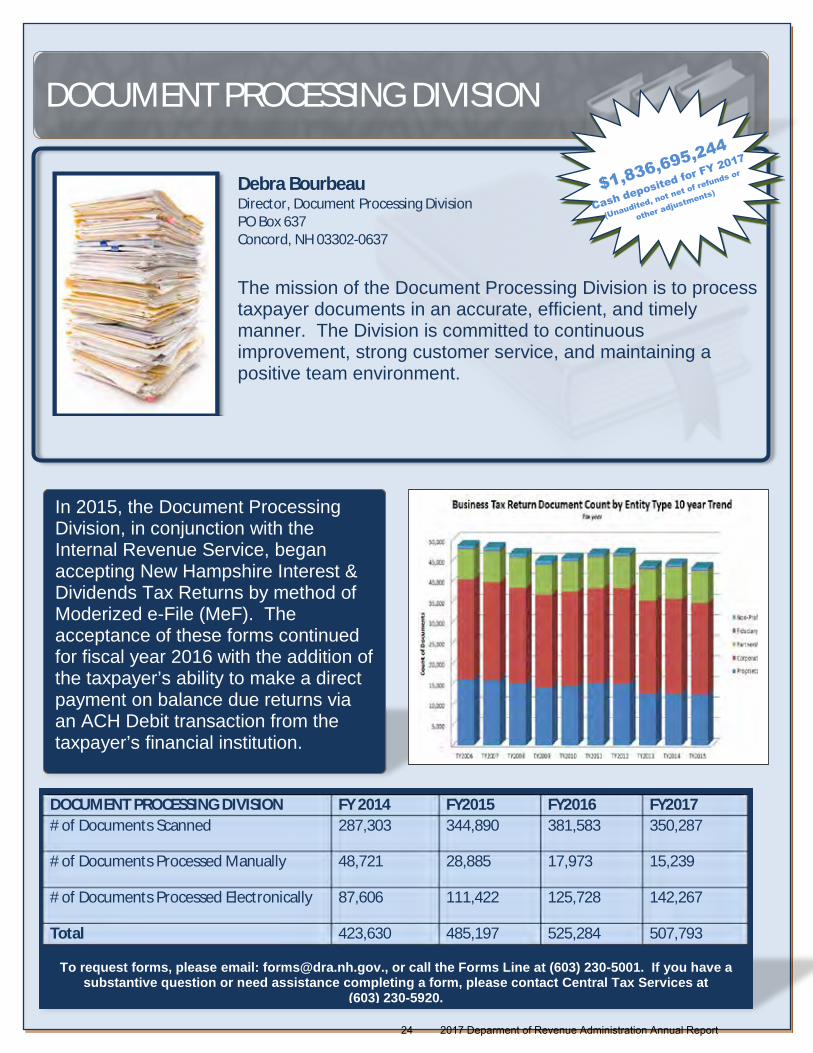
In 2015, the Document Processing Division, in conjunction with the Internal Revenue Service, began accepting New Hampshire Interest & Dividends Tax Returns by method of Moderized e-File (MeF). The acceptance of these forms continued for fiscal year 2016 with the addition of the taxpayer’s ability to make a direct payment on balance due returns via an ACH Debit transaction from the taxpayer’s financial institution.
DOCUMENT PROCESSING DIVISION FY 2014 FY2015 FY2016 FY2017 # of Documents Scanned 287,303 344,890 381,583 350,287
# of Documents Processed Manually 48,721 28,885 17,973 15,239
# of Documents Processed Electronically 87,606 111,422 125,728 142,267
Total 423,630 485,197 525,284 507,793
To request forms, please email: [email protected]., or call the Forms Line at (603) 230-5001. If you have a substantive question or need assistance completing a form, please contact Central Tax Services at
(603) 230-5920.
Debra Bourbeau Director, Document Processing Division PO Box 637 Concord, NH 03302-0637
The mission of the Document Processing Division is to process taxpayer documents in an accurate, efficient, and timely manner. The Division is committed to continuous improvement, strong customer service, and maintaining a positive team environment.
24 2017 Deparment of Revenue Administration Annual Report

FORMS CALENDAR
sCST = Communications Services Tax
vNFQA = Nursing Facility Quality Assessment Business Return Due Dates Assume a Calendar Year Tax Period
2018 Jan
Estimate sCST
Interest & Dividends
Medicaid Enhancement
Return/Form CST
Meals and Rentals
vNFQA
Real Estate Transfer
Utility Property
Wholesalers' Other Tobacco Products
2018 Feb
Estimate CST
Return/Form CST
Electricity Consumption
Meals and Rentals
Real Estate Transfer
Wholesalers' Other Tobacco Products
2018 Mar
Estimate CST
Return/Form CST
Meals and Rentals
Partnerships
Real Estate Transfer
Wholesalers' Other Tobacco Products
2018 Apr
Estimate Corporate CST Fiduciary Interest & Dividends Partnerships Proprietary Railroad Utility Property
Return/Form Corporation
CST
Fiduciary
Interest & Dividends
Proprietorship
Meals and Rentals
Medicaid Enhancement
NFQA
Real Estate Transfer
Wholesalers' Other Tobacco Products
2018 May
Estimate CST
Return/Form CST
Low and Moderate Property Tax Relief
Meals and Rentals
Private Rail Car Railroad Company
Real Estate Transfer
Utility Property Tax Information Update
Wholesalers' Other Tobacco Products
2018 Jun
Estimate Corporate
CST
Fiduciary
Interest & Dividends
Partnerships
Proprietary
Railroad
Utility Property
Return/Form CST
Low and Moderate Property Tax Relief
Meals and Rentals
Real Estate Transfer
Wholesalers' Other Tobacco Products
2018 Jul
Estimate CST
Return/Form CST
Meals and Rentals
NFQA
Real Estate Transfer
Wholesalers' Other Tobacco Products
2018 Aug
Estimate CST
Return/Form CTS Meals and Rentals Real Estate Transfer Wholesalers' Other Tobacco Products
2018 Sep
Estimate Corporate
CST
Fiduciary
Interest & Dividends
Partnerships
Proprietary
Railroad
Utility Property
Return/Form CST Meals and Rentals Real Estate Transfer Wholesalers' Other Tobacco Products
2018 Oct
Estimate CST
Return/Form
CST
Meals and Rentals Partnership Real Estate Transfer NFQA Wholesalers' Other Tobacco Products
2018 Nov
Estimate CST
Return/Form Corporations
CST
Fiduciary
Interest & Dividends
Meals and Rentals
Proprietorship
Real Estate Transfer
Wholesalers' Other Tobacco Products
2018 Dec
Estimate Corporate
CST
Fiduciary
Partnerships
Proprietary
Railroad
Utility Property
Return/Form CST Meals and Rentals Real Estate Transfer Wholesalers' Other Tobacco Products
25 2017 Deparment of Revenue Administration Annual Report
THE AUDIT DIVISION
Director of Audit: Frederick J. Coolbroth, Jr.
Assistant Director of Audit: Kerrin A. Rounds Audit Division PO Box 1388 Concord, NH 03302-1388 603.230.5030 Discovery Bureau PO Box 488 Concord, NH 03302-0488 603.230.5086
AUDIT DIVISION The mission of the Audit Division is to promote taxpayer compliance with New Hampshire’s tax laws through: fair, impartial, and efficient selection and review of taxpayers’ returns; taxpayer education; and discovery of non-filers. The Audit Division is committed to team work, professional development, and high standards of professionalism. Members of the audit staff conduct both desk audits and field audits. The type of audit depends on the nature and scope of the audit and the proficiency of the auditor. In fiscal year 2017, DRA auditors completed the review of 1,094 taxpayers’ returns. Of that number, 840 taxpayers’ returns were audited resulting in assessments totaling $27,185,383 in tax, penalties, and interest as well as reductions to refund requests, net operating loss deductions and business enterprise tax credit carry-forwards totaling $5,642,520. The remaining 254 returns were reviewed, but the Division ultimately did not pursue full formal audits, because there were no apparent issues. The Discovery/Nexus Unit researches federal and state filings, as well as on-line resources, to discover non-filers who may have a duty to file and pay New Hampshire business taxes, meals and rooms taxes, or interest and dividends taxes. As a result of the Unit’s efforts in fiscal year 2017, an additional $4,392,261 in tax, penalties, and interest was collected, of which $208,760 came in through the voluntary disclosure program. The Tobacco Unit conducted 39 compliance checks resulting in 16 seizures of contraband tobacco products. Eight audits of New Hampshire tobacco wholesalers were completed. The Unit also assisted the U.S. Attorney’s Office in tobacco tax evasion cases and conducted joint tobacco/liquor investigations with the state Liquor Commission. The Unit continued to update the new tobacco database to gather additional information on non-participating manufacturers in accordance with the requirements of the Master Settlement Agreement. The Unit offered a tobacco tax training session for tobacco wholesalers and a separate session for New Hampshire tobacco retailers. Members of the Unit attended the Federation of Tax Administrators’ Annual Tobacco Conference as well as the Northeast Regional Tobacco Conference.
26 2017 Deparment of Revenue Administration Annual Report
Ora LeMere, Division Director
1
1 Estimated figures based on reporting changes in FY 2016
Collections Division The mission of the Collections Division is to ensure taxpayer compliance with the tax laws of New Hampshire by fairly and effectively recovering overdue taxes through the uniform application of state laws, rules and policies.
The Division of Collections is established by RSA 21-J:8 with two defined tasks in statute
a) Collecting all outstanding taxes owed to the state, which are within the department’s jurisdiction. b) Securing all delinquent returns required to be filed with the state by any taxpayer.
The division carries out these tasks by: (1) collecting delinquent notices of assessments resulting from tax returns, (2) following up on Meals and Rentals (M&R) tax returns not filed by the 15th of the month as mandated by RSA 78-A, (3) selling tobacco stamps to be affixed to packages of cigarettes and (4) licensing and educating M&R operators charging for taxable meals, room rentals and motor vehicle rentals. The division budget authorized 11 full time positions, 1 unclassified and 10 classified, including 1 unfilled classified positions on June 30, 2017. The division continues to enhance the Balanced Scorecard process and has tracked statistics in the identified areas: Meals and Rentals licenses issued, Meals and Rentals monthly returns filed timely, Tax Notice payments, and the training of Collection staff. The division’s goals for FY 17 included: (1) Reconfigure division and redistribute compliance regions (2) Update Collections manual and implement Compliance Officer performance standards (3) Implement case management system to track activity and productivity of Compliance Officers (4) Review selected business activity of M&R operators for compliance (5) Acquire field equipment and train staff to log field activity (6) Conduct biannual training seminars for newly licensed operators (7) Evaluate effectiveness of outside collection agencies (8) Analyze collection and distraint options (9) Implement monthly and quarterly meetings with staff to review productivity and enhance procedures. Six of the nine goals were executed, leaving three incomplete at the end of the fiscal year. The training program for Compliance Officers is still in the development stages. Various processes were reviewed to achieve the remaining measurable goals, such as the use of mass emails to operators to increase participation and the implementation of payment plan terms that can be used in our legacy system for tracking purposes. Other work process improvements were undertaken to improve overall collection results.
FY2017 Value of Inventory and Collections Delinquent Inventory – beginning July 1, 2016 $21,927,186 Delinquent Inventory – ending June 30, 2017 $24,419,918 Delinquent Payments Collected $8,610,170
FY2017 Statistical Counts New Meals & Rentals Operators Licensed 1,431 Meals and Rentals Unfiled Returns Followed Up 6,484 Delinquent Tax Notices Resolved 9,827 Tax Liens Recorded 312 Tobacco Tax Field Compliance Visits 83 Payment Plans Initiated 109 Collection Calls Placed 5,818 Field Visits Conducted 867
27 2017 Deparment of Revenue Administration Annual Report
Municipal & Property Division
Stephan Hamilton, Director
The mission of the Municipal and Property Division is to assure fairness, equity and proportionality in the assessment and collection of property taxes and the administration of municipal finances in the state by establishing tax rates, providing technical assistance and education to municipal officials, monitoring revaluations, reviewing assessment practices, equalizing local assessed valuation, appraising public utility and railroad property, and administering timber and gravel taxation.
The division consists of two units, Municipal and Property.
The Municipal Bureau establishes and approves municipal, school, county, state, and village district tax rates. It provides technical assistance on taxation and finance to approximately 550 political subdivisions of the state and general supervision to municipal tax collectors. Other services include:
· Prescribing a uniform chart of accounts for all municipalities · Establishing a standard technical assistance manual for municipalities’ use · Reviewing trustee reports of municipal trust funds in conjunction with the Department of Justice Charitable Trust
Unit · Conducting workshops and seminars for municipal officials, including selectman, budget committees, trustees of
trust funds, tax collectors, and school officials.
The Property Assessment Unit oversees the assessment review process and monitors revaluations and revaluation contracts. The Equalization Bureau determines the total equalized value of all taxable property in the state on an annual basis.
This allows shared tax burdens, such as the state education tax and county property taxes, to be apportioned at a single standard, market value. The equalization process includes compiling assessment data, conducting ratio studies, and preparing statistical reports. Other responsibilities include:
· Valuing all utility and railroad properties in order to determine the correct assessment of RSA 82 Railroad Taxes and RSA 83-F Utility Property Taxes;
· Providing administrative support to the municipalities in their assessment and collection of the RSA 79 Timber Tax and the RSA 72-B Excavation Tax;
· Providing direct education on property assessments to municipal officials and assessors, as well as taxation and finance professionals; and,
· Providing support to the Assessing Standards Board and the Current Use Board, two administratively attached boards.
ASSESSING STANDARDS BOARD
Chairman – Betsey Patten Vice-Chairman – Robert Gagne CURRENT USE BOARD
[email protected] Chairman – Stephan Hamilton
28 2017 Deparment of Revenue Administration Annual Report

Accomplishments of FY 2017 Municipal and Property Division
The Division made numerous efforts to improve its services to municipalities and municipal officials and to improve its transparency. Some of these efforts are completed, while others are ongoing. During FY 2017, the Division accomplished the following:
· Completed the readoption process for administrative rules, Rev 400, Property Tax Exemptions and Credits
· Coordinated the transfer of the 2016 Low and Moderate Tax Relief program to the Taxpayer Services Division, including significant knowledge transfer
· Prepared and presented dozens of educational presentations for municipal officials, contractors, agents,
employees, and county and school finance officials. This education also included several direct presentations to taxpayers that included basic revaluation and tax rate calculations
· Developed the ability to present courses prepared by the International Association of Assessing Officials, which
provided greater educational opportunity for professional assessors by sponsoring such courses
· Through a contract with Axiomatic, LLC, managed and improved new municipal finance e-file and data management system known as the Municipal Tax Rate Setting Portal, including upgrades to both the system and associated reports. This effort also Included the training of hundreds of municipal officials both online and at in-person events
· Through the same contract with Axiomatic, LLC, managed and upgraded the Equalization Portal, to include
among other things the ability for users to look-up statewide sale information
· Provided support to the Tax Policy and Legislative Analysis Group in the tracking, analysis and testimony of legislative proposals that involved NHDRA, local tax assessment, local tax collection, and municipal and county finance
· Improved timely filing of municipal finance reports that support tax rate setting
· Assisted in the completion of Phase II of the e-file portal for the filing of Real Estate Transfer Tax documents
· Improved usability of historic data on our website.
· Completed the adoption of administrative rules, Rev 612, Property Assessment, Replacement Cost New (RCN) of
Telecommunications Poles and Conduits and Inventory Form The following are brief descriptions of the efforts that have not been completed by the end of the fiscal year, but are ongoing:
· Presentation of additional advanced property tax assessment classes · Developing and deploying a stronger process to increase our review and follow-up on the results of local audits
· Conversion of standard reports and form letters to incorporate more understandable language and less technical
jargon
· The creation of a central repository for downloading information from our website
· Deployment of regular “Balanced Scorecard” reporting of Division activities
29 2017 Deparment of Revenue Administration Annual Report
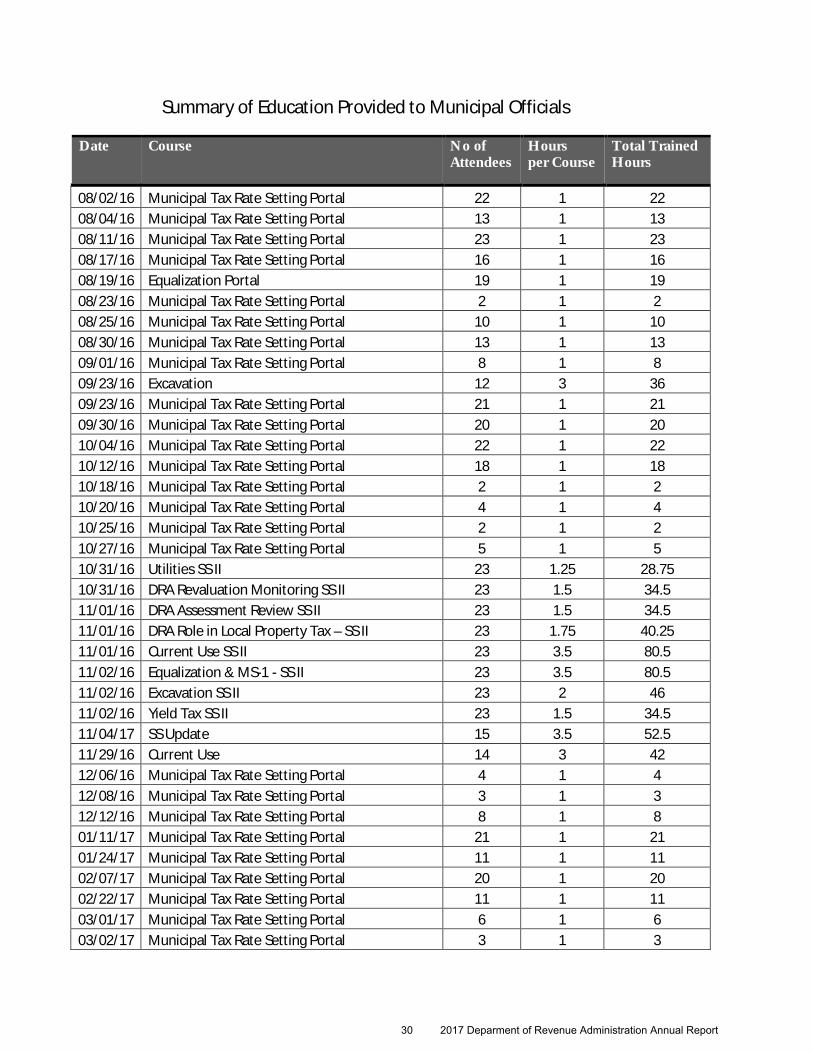
Summary of Education Provided to Municipal Officials
Date Course No of Attendees
Hours per Course
Total Trained Hours
08/02/16 Municipal Tax Rate Setting Portal 22 1 22 08/04/16 Municipal Tax Rate Setting Portal 13 1 13 08/11/16 Municipal Tax Rate Setting Portal 23 1 23 08/17/16 Municipal Tax Rate Setting Portal 16 1 16 08/19/16 Equalization Portal 19 1 19 08/23/16 Municipal Tax Rate Setting Portal 2 1 2 08/25/16 Municipal Tax Rate Setting Portal 10 1 10 08/30/16 Municipal Tax Rate Setting Portal 13 1 13 09/01/16 Municipal Tax Rate Setting Portal 8 1 8 09/23/16 Excavation 12 3 36 09/23/16 Municipal Tax Rate Setting Portal 21 1 21 09/30/16 Municipal Tax Rate Setting Portal 20 1 20 10/04/16 Municipal Tax Rate Setting Portal 22 1 22 10/12/16 Municipal Tax Rate Setting Portal 18 1 18 10/18/16 Municipal Tax Rate Setting Portal 2 1 2 10/20/16 Municipal Tax Rate Setting Portal 4 1 4 10/25/16 Municipal Tax Rate Setting Portal 2 1 2 10/27/16 Municipal Tax Rate Setting Portal 5 1 5 10/31/16 Utilities SS II 23 1.25 28.75 10/31/16 DRA Revaluation Monitoring SS II 23 1.5 34.5 11/01/16 DRA Assessment Review SS II 23 1.5 34.5 11/01/16 DRA Role in Local Property Tax – SS II 23 1.75 40.25 11/01/16 Current Use SS II 23 3.5 80.5 11/02/16 Equalization & MS-1 - SS II 23 3.5 80.5 11/02/16 Excavation SS II 23 2 46 11/02/16 Yield Tax SS II 23 1.5 34.5 11/04/17 SS Update 15 3.5 52.5 11/29/16 Current Use 14 3 42 12/06/16 Municipal Tax Rate Setting Portal 4 1 4 12/08/16 Municipal Tax Rate Setting Portal 3 1 3 12/12/16 Municipal Tax Rate Setting Portal 8 1 8 01/11/17 Municipal Tax Rate Setting Portal 21 1 21 01/24/17 Municipal Tax Rate Setting Portal 11 1 11 02/07/17 Municipal Tax Rate Setting Portal 20 1 20 02/22/17 Municipal Tax Rate Setting Portal 11 1 11 03/01/17 Municipal Tax Rate Setting Portal 6 1 6 03/02/17 Municipal Tax Rate Setting Portal 3 1 3
30 2017 Deparment of Revenue Administration Annual Report

Date Course No of Attendees
Hours per Course
Total Trained Hours
03/15/17 Municipal Tax Rate Setting Portal 2 1 2 03/23/17 Municipal Tax Rate Setting Portal 1 1 1 03/25/17 NHTCA Spring Regional Workshop 40 1 40 03/27/17 New Tax Collectors' Workshop (1/2) 75 3 225 03/28/17 Municipal Tax Rate Setting Portal 6 1 6 03/30/17 Municipal Tax Rate Setting Portal 19 1 19 04/04/17 Municipal Tax Rate Setting Portal 11 1 11 04/05/17 NHTCA Spring Regional Workshop 125 1 125 04/06/17 Municipal Tax Rate Setting Portal 9 1 9 04/11/17 Municipal Tax Rate Setting Portal 5 1 5 04/13/17 Municipal Tax Rate Setting Portal 16 1 16 04/17/17 NHEQ 8 1 8 04/18/17 Professional Loggers Program (PLP) 30 4 120 04/19/17 NHTCA Spring Regional Workshop 85 1 85 04/20/17 Professional Loggers Program (PLP) 32 4 128 04/25/17 NHEQ 1 1 1 04/26/17 NHTCA Spring Regional Workshop 70 1 70 04/27/17 NHEQ 5 1 5 05/04/17 MS-535 250 1 250 05/10/17 Municipal Tax Rate Setting Portal 4 1 4 05/15/17 Poles & Conduit Forum 28 2 56 05/15/17 Taxation of Utilities & Railroad - SS II 7 1.25 8.75 05/15/17 Revaluation Monitoring – SS II 7 1.5 10.5 05/16/17 Assessment Review – SS II 7 1.5 10.5 05/16/17 DRA Role in Local Property Tax – SS II 7 1.5 10.5 05/16/17 Current Use Taxation – SS II 7 3.5 24.5 05/17/17 Equalization & MS1 - SS II 7 3.5 24.5 05/17/17 Excavation Tax – SS II 7 2 14 05/17/17 Yield Tax – SS II 7 1.5 10.5 05/25/17 Municipal Tax Rate Setting Portal 14 1 14 06/02/17 County Administrators 10 1 10 06/05/17 Mascoma School Board Assessing/EQ Presentation 10 2 20 06/06/17 Trustees of the Trust Funds Annual Seminar 40 1 40 06/06/17 Exemptions & Credits 30 3 90 06/12/17 Trustees of the Trust Funds Annual Seminar 100 1 100 06/20/17 Persons & Property Taxable SS I 19 3.5 66.5
06/21/17 State Statutes Books/Annual Inventory/Taxable Property 19 3.5 66.5
06/23/17 1-Day State Statutes 7 3.5 24.5
31 2017 Deparment of Revenue Administration Annual Report
ECHNOLOGY DEVELOPMENTS
The DRA, with the support of the Department of Information Technology (DoIT), uses technology to provide an efficient and streamlined end-to-end tax process, which benefits the NH
taxpayer, by providing modernized operations and accurate information.
During FY 2017 DRA completed Phase III of the Modernized e-File (MeF) system to add Business Enterprise and Business Profits Tax return filings for both Corporate and Partnership entities. The FY2017 filing season continues to reflect an increase in the number of returns received approximately 40,000 returns accepted. For tax year 2017, and over $2.7 million in associated ACH debit payments. In order to continue to expand on the available functionality, planning and development for the filing of Fiduciary and Proprietorship returns through the MeF system began and will be available for Tax Year 2017. During FY 2017, the DRA completed the migration of all miscellaneous tax forms from an outdated scanning application to the core Document Imaging and Electronic Remittance solution.
Also during FY 2017, DRA began an initiative to phase out personal desktop and network printers. When the project is completed, the Department will decommission thirty network printers resulting in an overall cost savings.
Over the upcoming Fiscal Year, DRA in conjunction with DoIT plans to procure a Commercial off the Shelf (COTS) solution to replace the legacy Tax Information Management System (TIMS.) The Department will complete a major upgrade to the Document Imaging and Electronic Remittance application to better position the agency for the new COTS solution.
T State of New Hampshire Department of Information Technology 27 Hazen Drive Concord, New Hampshire 03301
32 2017 Deparment of Revenue Administration Annual Report

Transparency The New Hampshire Department of Revenue Administration's "Transparency" webpage is devoted to the distribution of revenue information with respect to the taxes administered by the Department. This webpage was created to promote transparency by providing the public with on-line access to aggregate tax revenue information, data and reports, which are not confidential. http://www.revenue.nh.gov/transparency/index.htm
33 2017 Deparment of Revenue Administration Annual Report
34 2017 Deparment of Revenue Administration Annual Report

obacco tax is applied to each package of cigarettes and tobacco products other than cigarettes, such as smokeless tobacco and loose tobacco under RSA Chapter 78 and NH Code of Administrative Rules, Rev 1000.
5 Year Analysis for Surrounding State's Tobacco Tax Stamps Sales (Millions)
State FY 2016
FY 2015
FY 2014
FY 2013
FY 2012
Maine 64.9
4% 62.3 -1% 62.9 -2% 64.4 -1% 64.9 -5%
Mass.
174.0
0% 174.7 -4% 181.6 -15% 213.8 -3% 220.5 -1%
New Hampshire
121.8
3% 118.8 -1% 119.9 1% 118.4 -4% 123.8 1%
Vermont
23.4 -8% 25.3 0% 25.3 -4% 26.3 -8% 28.6 -7%
• (FY06) 9/19/05 - $1.00 to $2.00 (previous increase 10/1/01 (FY02)) Maine •(FY09) 7/1/08 - $1.51 to $2.51 (previous increase 7/25/02) • (FY14) 7/31/13 - $2.51 to $3.51 Massachusetts
• (FY14) August 2013 to Current - A stamp rate = $2.23, B stamp rate = $1.78 • (FY12) July 2011 to July 2013 - A stamp rate = $2.10, B stamp rate = $1.68 • (FY10) July 2009 to June 2011 - A stamp rate = $2.23, B stamp rate = $1.78 • (FY09) October 2008 to June 2009 - A stamp rate = $1.65, B stamp rate = $1.33 • (FY08) July 2007 to September 2008 - A stamp rate = $1.35, B stamp rate = $1.08 • (FY06) July 2005 to June 2007 - A stamp rate = $1.00, B stamp rate = 80 cents
New Hampshire
•(FY07) 7/1/06 - $1.19 to $1.79 • (FY08) 7/1/08 - $1.79 to $1.99 • (FY10) 7/1/09 - $1.99 to $2.24 • (FY11) 7/1/11 - $2.24 to $2.62 • (FY15) 7/1/14 - $2.62 to $2.75 • (FY16) 7/1/18 - $2.75 to $3.08
Vermont
T
Tobacco and Other Tobacco Products RSA 78
NH Code of Administrative Rules, Rev 1000
Source: The Tax Burden on Tobacco TOBACCO TAX STAMP RATE INCREASE DURING 5 YEAR ANALYSIS
35 2017 Deparment of Revenue Administration Annual Report
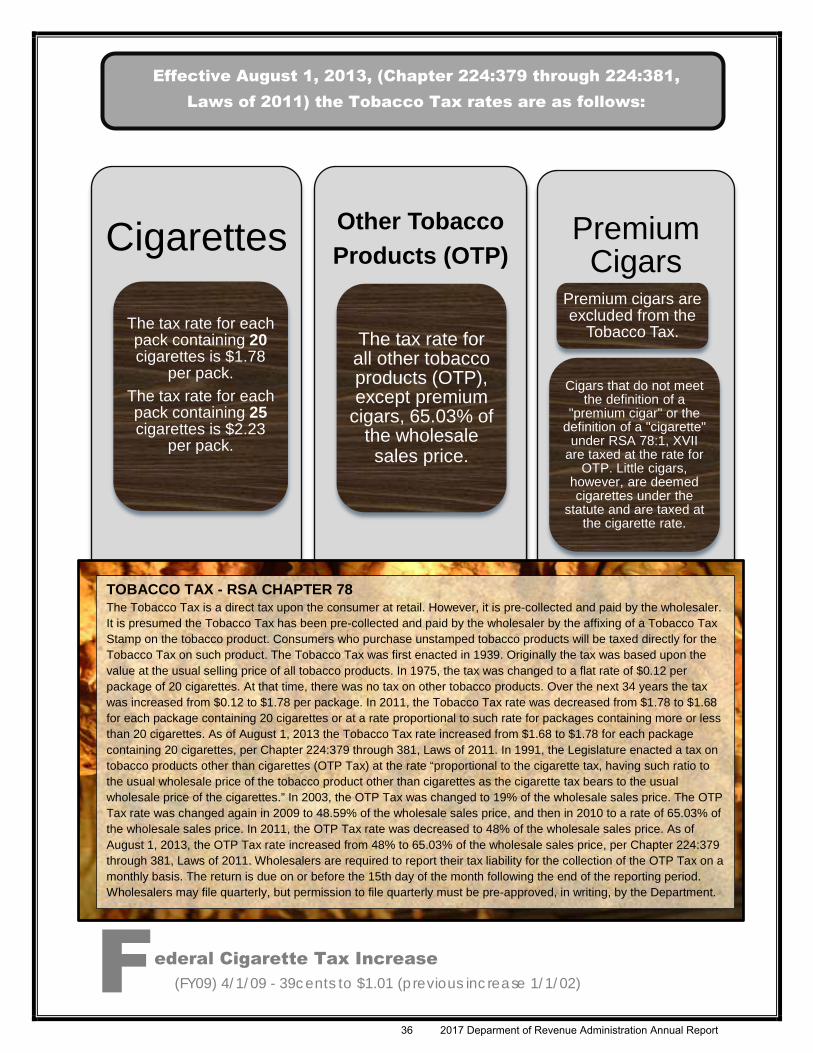
ederal Cigarette Tax Increase (FY09) 4/1/09 - 39cents to $1.01 (previous increase 1/1/02)
F
Cigarettes
The tax rate for each pack containing 20 cigarettes is $1.78
per pack. The tax rate for each pack containing 25 cigarettes is $2.23
per pack.
Other Tobacco Products (OTP)
The tax rate for all other tobacco products (OTP), except premium
cigars, 65.03% of the wholesale sales price.
Premium Cigars
Premium cigars are excluded from the
Tobacco Tax.
Cigars that do not meet the definition of a
"premium cigar" or the definition of a "cigarette"
under RSA 78:1, XVII are taxed at the rate for
OTP. Little cigars, however, are deemed cigarettes under the
statute and are taxed at the cigarette rate.
Effective August 1, 2013, (Chapter 224:379 through 224:381, Laws of 2011) the Tobacco Tax rates are as follows:
TOBACCO TAX - RSA CHAPTER 78 The Tobacco Tax is a direct tax upon the consumer at retail. However, it is pre-collected and paid by the wholesaler. It is presumed the Tobacco Tax has been pre-collected and paid by the wholesaler by the affixing of a Tobacco Tax Stamp on the tobacco product. Consumers who purchase unstamped tobacco products will be taxed directly for the Tobacco Tax on such product. The Tobacco Tax was first enacted in 1939. Originally the tax was based upon the value at the usual selling price of all tobacco products. In 1975, the tax was changed to a flat rate of $0.12 per package of 20 cigarettes. At that time, there was no tax on other tobacco products. Over the next 34 years the tax was increased from $0.12 to $1.78 per package. In 2011, the Tobacco Tax rate was decreased from $1.78 to $1.68 for each package containing 20 cigarettes or at a rate proportional to such rate for packages containing more or less than 20 cigarettes. As of August 1, 2013 the Tobacco Tax rate increased from $1.68 to $1.78 for each package containing 20 cigarettes, per Chapter 224:379 through 381, Laws of 2011. In 1991, the Legislature enacted a tax on tobacco products other than cigarettes (OTP Tax) at the rate “proportional to the cigarette tax, having such ratio to the usual wholesale price of the tobacco product other than cigarettes as the cigarette tax bears to the usual wholesale price of the cigarettes.” In 2003, the OTP Tax was changed to 19% of the wholesale sales price. The OTP Tax rate was changed again in 2009 to 48.59% of the wholesale sales price, and then in 2010 to a rate of 65.03% of the wholesale sales price. In 2011, the OTP Tax rate was decreased to 48% of the wholesale sales price. As of August 1, 2013, the OTP Tax rate increased from 48% to 65.03% of the wholesale sales price, per Chapter 224:379 through 381, Laws of 2011. Wholesalers are required to report their tax liability for the collection of the OTP Tax on a monthly basis. The return is due on or before the 15th day of the month following the end of the reporting period. Wholesalers may file quarterly, but permission to file quarterly must be pre-approved, in writing, by the Department.
36 2017 Deparment of Revenue Administration Annual Report

STATE EXCISE TAX RATES ON CIGARETTES (January 1, 2016)
Alabama (a) TAX RATE (¢ per pack)
RANK STATE
STATE TAX RATE (¢ per pack)
RANK STATE
Alaska 67.5 39 Nebraska 64 40 Arizona 200 12 Nevada 180 18 Arkansas 200 12 New Hampshire 178 19 California 115 32 New Jersey 270 9 Colorado 87 35 New Mexico 166 22 Connecticut(b) 84 37 New York (a) 435 1 Delaware 365 3 North Carolina 45 47 Florida (c) 160 23 North Dakota 44 48 Georgia 133.9 29 Ohio 160 23 Hawaii 37 49 Oklahoma 103 33 Idaho 320 5 Oregon 132 30 Illinois (a) 57 44 Pennsylvania 160 23 Indiana 198 17 Rhode Island 375 2 Iowa 99.5 34 South Carolina 57 44 Kansas 136 28 South Dakota 153 26 Kentucky 129 31 Tennessee(a)(d) 62 41 Louisiana 60 42 Texas 141 27 Maine 86 36 Utah 170 20 Maryland 200 12 Vermont 308 6 Massachusetts 200 12 Virginia (a) 30 50 Michigan 351 4 Washington 302.5 7 Minnesota(e) 200 12 West Virginia 55 46 Mississippi 300 8 Wisconsin 252 10 Missouri(a) 68 38 Wyoming 60 42 Montana 17 51 170 20 District of
Columbia (f) 250 11
U.S. Median 153.0
Source: Compiled by FTA from state sources.
(a) Counties and cities may impose an additional tax on a pack of cigarettes: in Alabama, 1¢ to 25¢; Illinois, 10¢ to $4.18; Missouri, 4¢ to 7¢; New York City, $1.50; Tennessee, 1¢; and Virginia, 2¢ to 15¢. (b) Connecticut tax rate is scheduled to increase to $3.90 per pack on 7/1/16. (c) Florida's rate includes a surcharge of $1 per pack. (d) Dealers pay an additional enforcement and administrative fee of 0.05¢ in Tennessee. (e) In addition, Minnesota imposes an in lieu cigarette sales tax determined annually by the Department. The current rate is 54.3¢ through December 31, 2016. (f) In addition, District of Columbia imposes an in lieu cigarette sales tax calculated every March 31. The current rate is 41¢.
37 2017 Deparment of Revenue Administration Annual Report
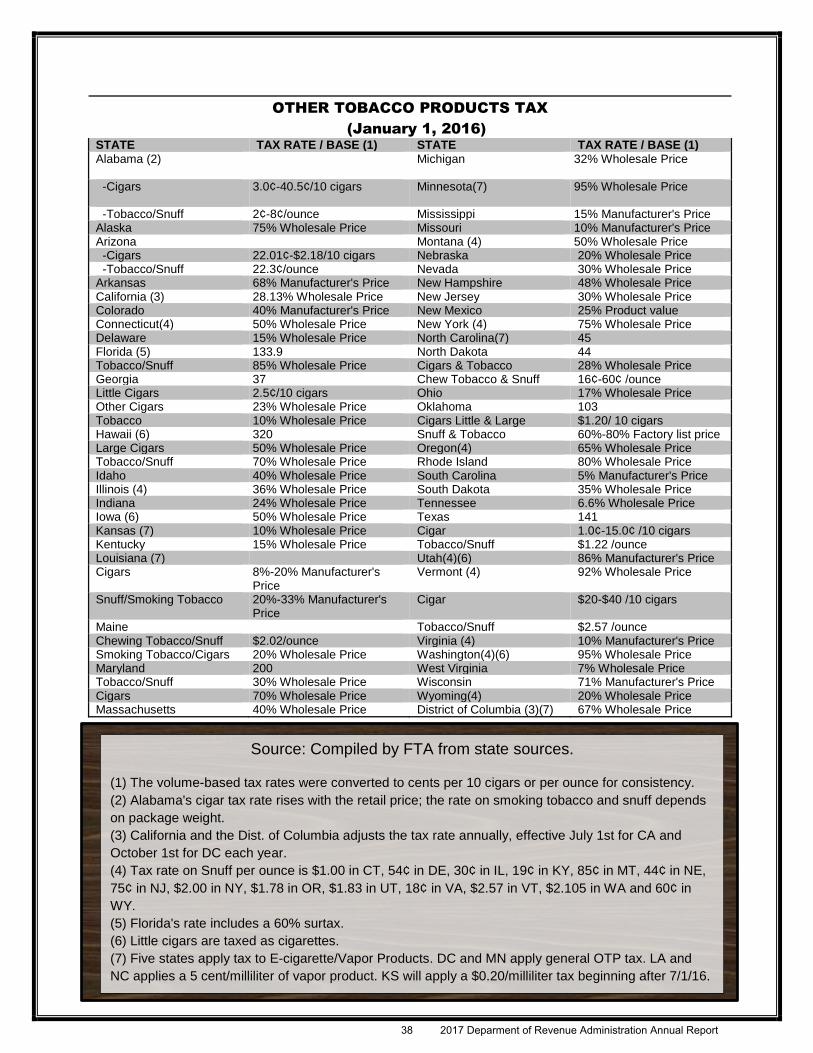
OTHER TOBACCO PRODUCTS TAX (January 1, 2016) STATE TAX RATE / BASE (1) STATE TAX RATE / BASE (1) Alabama (2)
Michigan 32% Wholesale Price
-Cigars
3.0¢-40.5¢/10 cigars Minnesota(7) 95% Wholesale Price
-Tobacco/Snuff 2¢-8¢/ounce Mississippi 15% Manufacturer's Price Alaska 75% Wholesale Price Missouri 10% Manufacturer's Price Arizona Montana (4) 50% Wholesale Price -Cigars 22.01¢-$2.18/10 cigars Nebraska 20% Wholesale Price -Tobacco/Snuff 22.3¢/ounce Nevada 30% Wholesale Price Arkansas 68% Manufacturer's Price New Hampshire 48% Wholesale Price California (3) 28.13% Wholesale Price New Jersey 30% Wholesale Price Colorado 40% Manufacturer's Price New Mexico 25% Product value Connecticut(4) 50% Wholesale Price New York (4) 75% Wholesale Price Delaware 15% Wholesale Price North Carolina(7) 45 Florida (5) 133.9 North Dakota 44 Tobacco/Snuff 85% Wholesale Price Cigars & Tobacco 28% Wholesale Price Georgia 37 Chew Tobacco & Snuff 16¢-60¢ /ounce Little Cigars 2.5¢/10 cigars Ohio 17% Wholesale Price Other Cigars 23% Wholesale Price Oklahoma 103 Tobacco 10% Wholesale Price Cigars Little & Large $1.20/ 10 cigars Hawaii (6) 320 Snuff & Tobacco 60%-80% Factory list price Large Cigars 50% Wholesale Price Oregon(4) 65% Wholesale Price Tobacco/Snuff 70% Wholesale Price Rhode Island 80% Wholesale Price Idaho 40% Wholesale Price South Carolina 5% Manufacturer's Price Illinois (4) 36% Wholesale Price South Dakota 35% Wholesale Price Indiana 24% Wholesale Price Tennessee 6.6% Wholesale Price Iowa (6) 50% Wholesale Price Texas 141 Kansas (7) 10% Wholesale Price Cigar 1.0¢-15.0¢ /10 cigars Kentucky 15% Wholesale Price Tobacco/Snuff $1.22 /ounce Louisiana (7) Utah(4)(6) 86% Manufacturer's Price Cigars 8%-20% Manufacturer's
Price Vermont (4) 92% Wholesale Price
Snuff/Smoking Tobacco 20%-33% Manufacturer's Price
Cigar $20-$40 /10 cigars
Maine Tobacco/Snuff $2.57 /ounce Chewing Tobacco/Snuff $2.02/ounce Virginia (4) 10% Manufacturer's Price Smoking Tobacco/Cigars 20% Wholesale Price Washington(4)(6) 95% Wholesale Price Maryland 200 West Virginia 7% Wholesale Price Tobacco/Snuff 30% Wholesale Price Wisconsin 71% Manufacturer's Price Cigars 70% Wholesale Price Wyoming(4) 20% Wholesale Price Massachusetts 40% Wholesale Price District of Columbia (3)(7) 67% Wholesale Price
Source: Compiled by FTA from state sources.
(1) The volume-based tax rates were converted to cents per 10 cigars or per ounce for consistency. (2) Alabama's cigar tax rate rises with the retail price; the rate on smoking tobacco and snuff depends on package weight. (3) California and the Dist. of Columbia adjusts the tax rate annually, effective July 1st for CA and October 1st for DC each year. (4) Tax rate on Snuff per ounce is $1.00 in CT, 54¢ in DE, 30¢ in IL, 19¢ in KY, 85¢ in MT, 44¢ in NE, 75¢ in NJ, $2.00 in NY, $1.78 in OR, $1.83 in UT, 18¢ in VA, $2.57 in VT, $2.105 in WA and 60¢ in WY. (5) Florida's rate includes a 60% surtax. (6) Little cigars are taxed as cigarettes. (7) Five states apply tax to E-cigarette/Vapor Products. DC and MN apply general OTP tax. LA and NC applies a 5 cent/milliliter of vapor product. KS will apply a $0.20/milliliter tax beginning after 7/1/16.
38 2017 Deparment of Revenue Administration Annual Report
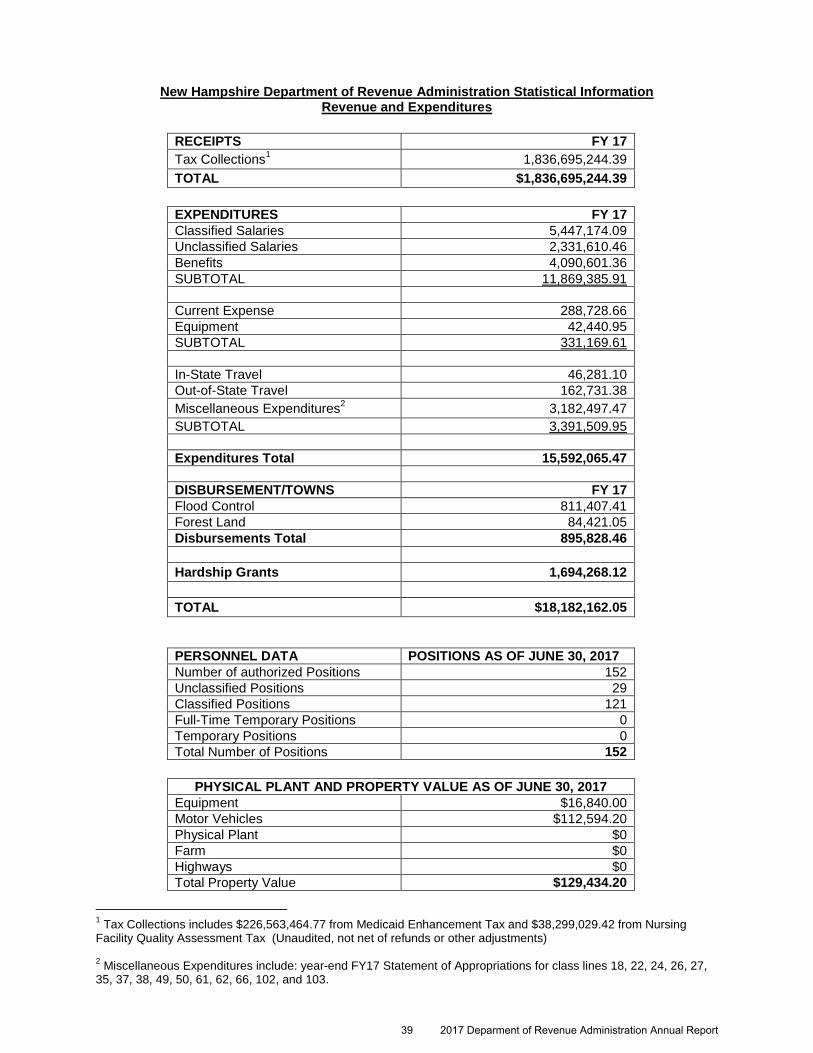
New Hampshire Department of Revenue Administration Statistical Information Revenue and Expenditures
RECEIPTS FY 17 Tax Collections1 1,836,695,244.39 TOTAL $1,836,695,244.39
EXPENDITURES FY 17 Classified Salaries 5,447,174.09 Unclassified Salaries 2,331,610.46 Benefits 4,090,601.36 SUBTOTAL 11,869,385.91 Current Expense 288,728.66 Equipment 42,440.95 SUBTOTAL 331,169.61 In-State Travel 46,281.10 Out-of-State Travel 162,731.38 Miscellaneous Expenditures2 3,182,497.47 SUBTOTAL 3,391,509.95 Expenditures Total 15,592,065.47 DISBURSEMENT/TOWNS FY 17 Flood Control 811,407.41 Forest Land 84,421.05 Disbursements Total 895,828.46 Hardship Grants 1,694,268.12 TOTAL $18,182,162.05
PERSONNEL DATA POSITIONS AS OF JUNE 30, 2017 Number of authorized Positions 152 Unclassified Positions 29 Classified Positions 121 Full-Time Temporary Positions 0 Temporary Positions 0 Total Number of Positions 152
PHYSICAL PLANT AND PROPERTY VALUE AS OF JUNE 30, 2017
Equipment $16,840.00 Motor Vehicles $112,594.20 Physical Plant $0 Farm $0 Highways $0 Total Property Value $129,434.20
1 Tax Collections includes $226,563,464.77 from Medicaid Enhancement Tax and $38,299,029.42 from Nursing Facility Quality Assessment Tax (Unaudited, not net of refunds or other adjustments) 2 Miscellaneous Expenditures include: year-end FY17 Statement of Appropriations for class lines 18, 22, 24, 26, 27, 35, 37, 38, 49, 50, 61, 62, 66, 102, and 103.
39 2017 Deparment of Revenue Administration Annual Report
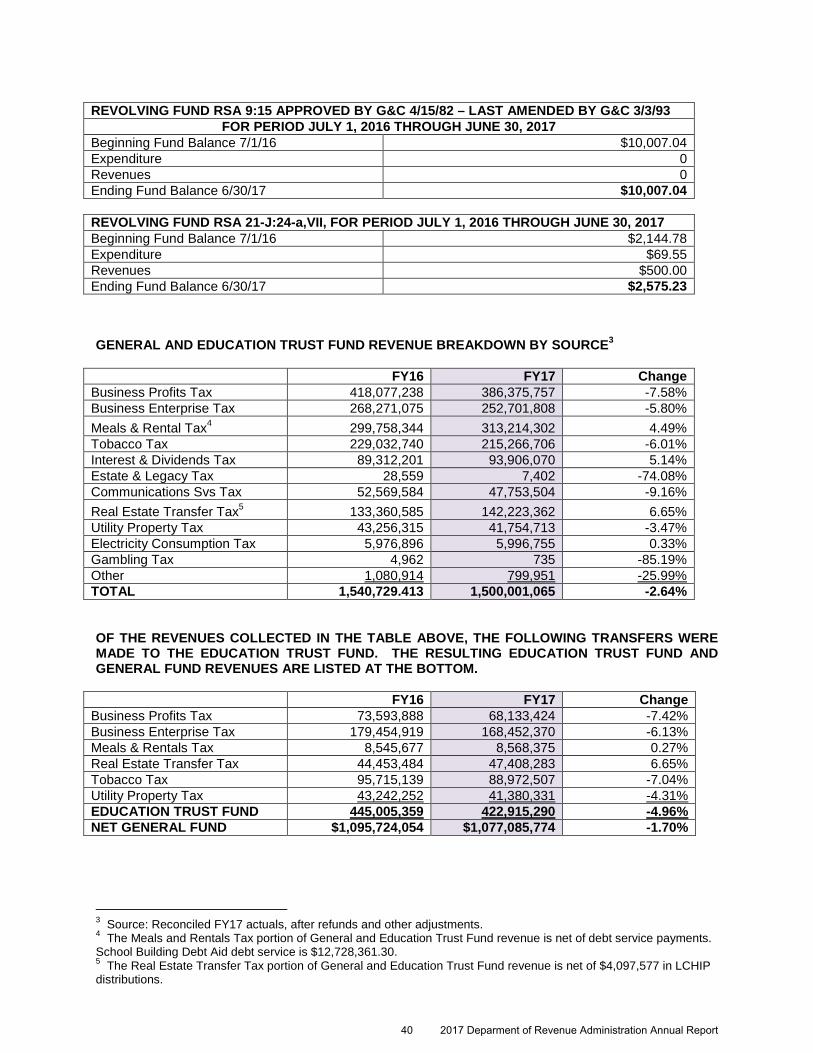
REVOLVING FUND RSA 9:15 APPROVED BY G&C 4/15/82 – LAST AMENDED BY G&C 3/3/93
FOR PERIOD JULY 1, 2016 THROUGH JUNE 30, 2017 Beginning Fund Balance 7/1/16 $10,007.04 Expenditure 0 Revenues 0 Ending Fund Balance 6/30/17 $10,007.04
REVOLVING FUND RSA 21-J:24-a,VII, FOR PERIOD JULY 1, 2016 THROUGH JUNE 30, 2017 Beginning Fund Balance 7/1/16 $2,144.78 Expenditure $69.55 Revenues $500.00 Ending Fund Balance 6/30/17 $2,575.23
GENERAL AND EDUCATION TRUST FUND REVENUE BREAKDOWN BY SOURCE3
FY16 FY17 Change Business Profits Tax 418,077,238 386,375,757 -7.58% Business Enterprise Tax 268,271,075 252,701,808 -5.80% Meals & Rental Tax4 299,758,344 313,214,302 4.49% Tobacco Tax 229,032,740 215,266,706 -6.01% Interest & Dividends Tax 89,312,201 93,906,070 5.14% Estate & Legacy Tax 28,559 7,402 -74.08% Communications Svs Tax 52,569,584 47,753,504 -9.16% Real Estate Transfer Tax5 133,360,585 142,223,362 6.65% Utility Property Tax 43,256,315 41,754,713 -3.47% Electricity Consumption Tax 5,976,896 5,996,755 0.33% Gambling Tax 4,962 735 -85.19% Other 1,080,914 799,951 -25.99% TOTAL 1,540,729.413 1,500,001,065 -2.64% OF THE REVENUES COLLECTED IN THE TABLE ABOVE, THE FOLLOWING TRANSFERS WERE MADE TO THE EDUCATION TRUST FUND. THE RESULTING EDUCATION TRUST FUND AND GENERAL FUND REVENUES ARE LISTED AT THE BOTTOM.
FY16 FY17 Change Business Profits Tax 73,593,888 68,133,424 -7.42% Business Enterprise Tax 179,454,919 168,452,370 -6.13% Meals & Rentals Tax 8,545,677 8,568,375 0.27% Real Estate Transfer Tax 44,453,484 47,408,283 6.65% Tobacco Tax 95,715,139 88,972,507 -7.04% Utility Property Tax 43,242,252 41,380,331 -4.31% EDUCATION TRUST FUND 445,005,359 422,915,290 -4.96% NET GENERAL FUND $1,095,724,054 $1,077,085,774 -1.70%
3 Source: Reconciled FY17 actuals, after refunds and other adjustments. 4 The Meals and Rentals Tax portion of General and Education Trust Fund revenue is net of debt service payments. School Building Debt Aid debt service is $12,728,361.30. 5 The Real Estate Transfer Tax portion of General and Education Trust Fund revenue is net of $4,097,577 in LCHIP distributions.
40 2017 Deparment of Revenue Administration Annual Report
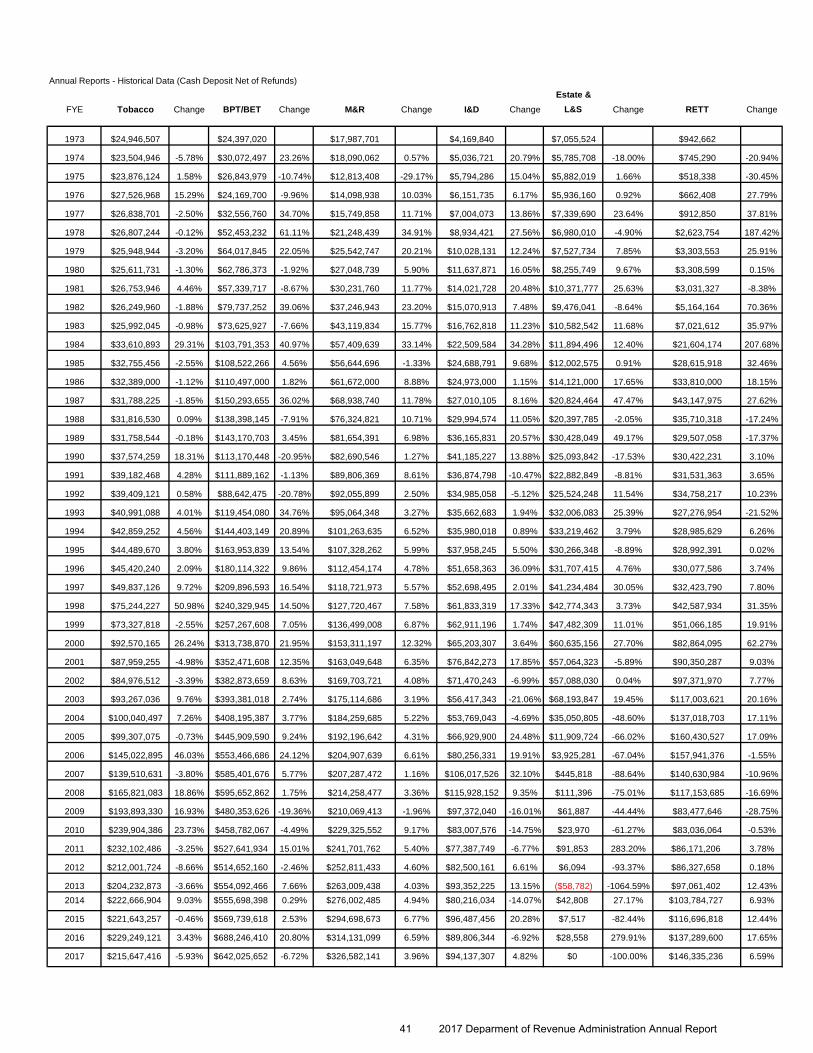
Annual Reports - Historical Data (Cash Deposit Net of Refunds)Estate &
FYE Tobacco Change BPT/BET Change M&R Change I&D Change L&S Change RETT Change
1973 $24,946,507 $24,397,020 $17,987,701 $4,169,840 $7,055,524 $942,662
1974 $23,504,946 -5.78% $30,072,497 23.26% $18,090,062 0.57% $5,036,721 20.79% $5,785,708 -18.00% $745,290 -20.94%
1975 $23,876,124 1.58% $26,843,979 -10.74% $12,813,408 -29.17% $5,794,286 15.04% $5,882,019 1.66% $518,338 -30.45%
1976 $27,526,968 15.29% $24,169,700 -9.96% $14,098,938 10.03% $6,151,735 6.17% $5,936,160 0.92% $662,408 27.79%
1977 $26,838,701 -2.50% $32,556,760 34.70% $15,749,858 11.71% $7,004,073 13.86% $7,339,690 23.64% $912,850 37.81%
1978 $26,807,244 -0.12% $52,453,232 61.11% $21,248,439 34.91% $8,934,421 27.56% $6,980,010 -4.90% $2,623,754 187.42%
1979 $25,948,944 -3.20% $64,017,845 22.05% $25,542,747 20.21% $10,028,131 12.24% $7,527,734 7.85% $3,303,553 25.91%
1980 $25,611,731 -1.30% $62,786,373 -1.92% $27,048,739 5.90% $11,637,871 16.05% $8,255,749 9.67% $3,308,599 0.15%
1981 $26,753,946 4.46% $57,339,717 -8.67% $30,231,760 11.77% $14,021,728 20.48% $10,371,777 25.63% $3,031,327 -8.38%
1982 $26,249,960 -1.88% $79,737,252 39.06% $37,246,943 23.20% $15,070,913 7.48% $9,476,041 -8.64% $5,164,164 70.36%
1983 $25,992,045 -0.98% $73,625,927 -7.66% $43,119,834 15.77% $16,762,818 11.23% $10,582,542 11.68% $7,021,612 35.97%
1984 $33,610,893 29.31% $103,791,353 40.97% $57,409,639 33.14% $22,509,584 34.28% $11,894,496 12.40% $21,604,174 207.68%
1985 $32,755,456 -2.55% $108,522,266 4.56% $56,644,696 -1.33% $24,688,791 9.68% $12,002,575 0.91% $28,615,918 32.46%
1986 $32,389,000 -1.12% $110,497,000 1.82% $61,672,000 8.88% $24,973,000 1.15% $14,121,000 17.65% $33,810,000 18.15%
1987 $31,788,225 -1.85% $150,293,655 36.02% $68,938,740 11.78% $27,010,105 8.16% $20,824,464 47.47% $43,147,975 27.62%
1988 $31,816,530 0.09% $138,398,145 -7.91% $76,324,821 10.71% $29,994,574 11.05% $20,397,785 -2.05% $35,710,318 -17.24%
1989 $31,758,544 -0.18% $143,170,703 3.45% $81,654,391 6.98% $36,165,831 20.57% $30,428,049 49.17% $29,507,058 -17.37%
1990 $37,574,259 18.31% $113,170,448 -20.95% $82,690,546 1.27% $41,185,227 13.88% $25,093,842 -17.53% $30,422,231 3.10%
1991 $39,182,468 4.28% $111,889,162 -1.13% $89,806,369 8.61% $36,874,798 -10.47% $22,882,849 -8.81% $31,531,363 3.65%
1992 $39,409,121 0.58% $88,642,475 -20.78% $92,055,899 2.50% $34,985,058 -5.12% $25,524,248 11.54% $34,758,217 10.23%
1993 $40,991,088 4.01% $119,454,080 34.76% $95,064,348 3.27% $35,662,683 1.94% $32,006,083 25.39% $27,276,954 -21.52%
1994 $42,859,252 4.56% $144,403,149 20.89% $101,263,635 6.52% $35,980,018 0.89% $33,219,462 3.79% $28,985,629 6.26%
1995 $44,489,670 3.80% $163,953,839 13.54% $107,328,262 5.99% $37,958,245 5.50% $30,266,348 -8.89% $28,992,391 0.02%
1996 $45,420,240 2.09% $180,114,322 9.86% $112,454,174 4.78% $51,658,363 36.09% $31,707,415 4.76% $30,077,586 3.74%
1997 $49,837,126 9.72% $209,896,593 16.54% $118,721,973 5.57% $52,698,495 2.01% $41,234,484 30.05% $32,423,790 7.80%
1998 $75,244,227 50.98% $240,329,945 14.50% $127,720,467 7.58% $61,833,319 17.33% $42,774,343 3.73% $42,587,934 31.35%
1999 $73,327,818 -2.55% $257,267,608 7.05% $136,499,008 6.87% $62,911,196 1.74% $47,482,309 11.01% $51,066,185 19.91%
2000 $92,570,165 26.24% $313,738,870 21.95% $153,311,197 12.32% $65,203,307 3.64% $60,635,156 27.70% $82,864,095 62.27%
2001 $87,959,255 -4.98% $352,471,608 12.35% $163,049,648 6.35% $76,842,273 17.85% $57,064,323 -5.89% $90,350,287 9.03%
2002 $84,976,512 -3.39% $382,873,659 8.63% $169,703,721 4.08% $71,470,243 -6.99% $57,088,030 0.04% $97,371,970 7.77%
2003 $93,267,036 9.76% $393,381,018 2.74% $175,114,686 3.19% $56,417,343 -21.06% $68,193,847 19.45% $117,003,621 20.16%
2004 $100,040,497 7.26% $408,195,387 3.77% $184,259,685 5.22% $53,769,043 -4.69% $35,050,805 -48.60% $137,018,703 17.11%
2005 $99,307,075 -0.73% $445,909,590 9.24% $192,196,642 4.31% $66,929,900 24.48% $11,909,724 -66.02% $160,430,527 17.09%
2006 $145,022,895 46.03% $553,466,686 24.12% $204,907,639 6.61% $80,256,331 19.91% $3,925,281 -67.04% $157,941,376 -1.55%
2007 $139,510,631 -3.80% $585,401,676 5.77% $207,287,472 1.16% $106,017,526 32.10% $445,818 -88.64% $140,630,984 -10.96%
2008 $165,821,083 18.86% $595,652,862 1.75% $214,258,477 3.36% $115,928,152 9.35% $111,396 -75.01% $117,153,685 -16.69%
2009 $193,893,330 16.93% $480,353,626 -19.36% $210,069,413 -1.96% $97,372,040 -16.01% $61,887 -44.44% $83,477,646 -28.75%
2010 $239,904,386 23.73% $458,782,067 -4.49% $229,325,552 9.17% $83,007,576 -14.75% $23,970 -61.27% $83,036,064 -0.53%
2011 $232,102,486 -3.25% $527,641,934 15.01% $241,701,762 5.40% $77,387,749 -6.77% $91,853 283.20% $86,171,206 3.78%
2012 $212,001,724 -8.66% $514,652,160 -2.46% $252,811,433 4.60% $82,500,161 6.61% $6,094 -93.37% $86,327,658 0.18%
2013 $204,232,873 -3.66% $554,092,466 7.66% $263,009,438 4.03% $93,352,225 13.15% ($58,782) -1064.59% $97,061,402 12.43%2014 $222,666,904 9.03% $555,698,398 0.29% $276,002,485 4.94% $80,216,034 -14.07% $42,808 27.17% $103,784,727 6.93%
2015 $221,643,257 -0.46% $569,739,618 2.53% $294,698,673 6.77% $96,487,456 20.28% $7,517 -82.44% $116,696,818 12.44%
2016 $229,249,121 3.43% $688,246,410 20.80% $314,131,099 6.59% $89,806,344 -6.92% $28,558 279.91% $137,289,600 17.65%
2017 $215,647,416 -5.93% $642,025,652 -6.72% $326,582,141 3.96% $94,137,307 4.82% $0 -100.00% $146,335,236 6.59%
41 2017 Deparment of Revenue Administration Annual Report

Annual Reports - Historical Data (Cash Deposit Net of Refunds)Utility Misc Total
FYE CST Change Prop Change ECT Change Taxes* Change Taxes Change % Change FYE
1973 $333,678 $79,834,905 1973
1974 $359,720 7.80% $84,979,557 $5,144,652 6.44% 1974
1975 $7,710,438 2043.46% $85,005,761 $26,204 0.03% 1975
1976 $8,815,505 14.33% $89,128,838 $4,123,077 4.85% 1976
1977 $8,872,647 0.65% $101,081,603 $11,952,765 13.41% 1977
1978 $9,138,967 3.00% $130,565,844 $29,484,241 29.17% 1978
1979 $12,042,285 31.77% $151,147,613 $20,581,769 15.76% 1979
1980 $10,538,922 -12.48% $152,573,529 $1,425,916 0.94% 1980
1981 $10,156,720 -3.63% $156,418,864 $3,845,335 2.52% 1981
1982 $8,533,012 -15.99% $187,200,276 $30,781,412 19.68% 1982
1983 $6,433,211 -24.61% $189,651,857 $2,451,581 1.31% 1983
1984 $6,233,320 -3.11% $281,137,838 $91,485,981 48.24% 1984
1985 $6,914,946 10.94% $287,831,332 $6,693,494 2.38% 1985
1986 $7,262,188 5.02% $303,191,188 $15,359,856 5.34% 1986
1987 $6,697,750 -7.77% $365,527,760 $62,336,572 20.56% 1987
1988 $7,605,989 13.56% $358,790,194 -$6,737,566 -1.84% 1988
1989 $8,809,300 15.82% $381,900,647 $23,110,453 6.44% 1989
1990 $8,482,072 -3.71% $363,060,271 -$18,840,376 -4.93% 1990
1991 $22,205,619 $637,500 -92.48% $377,330,276 $14,270,005 3.93% 1991
1992 $26,681,057 20.15% $803,428 26.03% $373,837,793 -$3,492,483 -0.93% 1992
1993 $29,621,244 11.02% $791,530 -1.48% $405,330,148 $31,492,355 8.42% 1993
1994 $30,430,075 2.73% $877,211 10.82% $438,656,024 $33,325,876 8.22% 1994
1995 $32,900,476 8.12% $878,303 0.12% $463,841,048 $25,185,024 5.74% 1995
1996 $35,266,871 7.19% $1,424,895 62.23% $505,612,212 $41,771,164 9.01% 1996
1997 $38,263,312 8.50% $1,995,890 40.07% $562,633,582 $57,021,370 11.28% 1997
1998 $40,219,738 5.11% $1,918,204 -3.89% $650,358,868 $87,725,286 15.59% 1998
1999 $45,824,952 13.94% $1,277,630 -33.39% $686,058,317 $35,699,449 5.49% 1999
2000 $47,416,610 3.47% $31,167,539 $1,027,627 -19.57% $882,058,932 $196,000,615 28.57% 2000
2001 $49,256,789 3.88% $15,625,403 -49.87% $1,210,757 17.82% $927,090,749 $45,031,817 5.11% 2001
2002 $62,508,517 26.90% $18,192,984 16.43% $5,735,676 $1,226,191 1.27% $980,409,577 $53,318,828 5.75% 2002
2003 $63,452,424 1.51% $18,833,596 3.52% $6,024,844 5.04% $815,634 -33.48% $1,025,170,080 $44,760,503 4.57% 2003
2004 $65,595,263 3.38% $20,159,763 7.04% $6,217,227 3.19% $923,468 13.22% $1,041,073,752 $15,903,672 1.55% 2004
2005 $69,557,473 6.04% $20,087,776 -0.36% $6,229,864 0.20% $871,900 -5.58% $1,094,364,702 $53,290,950 5.12% 2005
2006 $70,330,594 1.11% $20,789,572 3.49% $6,344,187 1.84% $360,933 -58.60% $1,243,345,494 $148,980,792 13.61% 2006
2007 $73,369,315 4.32% $21,801,715 4.87% $6,258,150 -1.36% $288,579 -20.05% $1,281,011,866 $37,666,372 3.03% 2007
2008 $79,509,885 8.37% $24,209,319 11.04% $6,285,323 0.43% $515,220 78.54% $1,319,445,402 $38,433,536 3.00% 2008
2009 $80,932,268 1.79% $28,942,542 19.55% $6,073,712 -3.37% $672,438 30.51% $1,181,848,901 -$137,596,501 -10.43% 2009
2010 $78,367,621 -3.17% $29,923,585 3.39% $5,957,300 -1.92% $470,432 -30.04% $1,208,798,552 $26,949,651 2.28% 2010
2011 $78,199,323 -0.21% $32,327,619 8.03% $6,060,651 1.73% $2,361,824 402.05% $1,284,046,410 $75,247,858 6.2250% 2011
2012 $79,224,828 1.31% $33,066,272 2.28% $5,931,956 -2.12% $746,248 -68.40% $1,267,269,029 -$16,777,381 -1.3066% 2012
2013 $60,078,877 -24.17% $33,270,669 0.62% $6,045,591 1.92% $571,980 -23.35% $1,311,656,739 $44,387,710 3.5026% 20132014 $58,730,642 -2.24% $35,789,133 7.57% $6,157,463 1.85% $323,085 -43.51% $1,339,411,679 $27,754,940 2.1160% 2014
2015 $57,799,218 -1.59% $41,256,585 15.28% $6,019,769 -2.24% $441,142 36.54% $1,404,790,053 $65,378,374 4.8811% 2015
2016 $52,571,774 -9.04% $43,256,315 4.85% $5,983,567 -0.60% $785,718 78.11% $1,561,348,506 $156,558,453 11.1446% 2016
2017 $47,776,163 -9.12% $41,754,713 -3.47% $5,996,757 0.22% $404,587 -48.51% $1,520,659,972 -$40,688,535 -125.99% 2017
42 2017 Deparment of Revenue Administration Annual Report
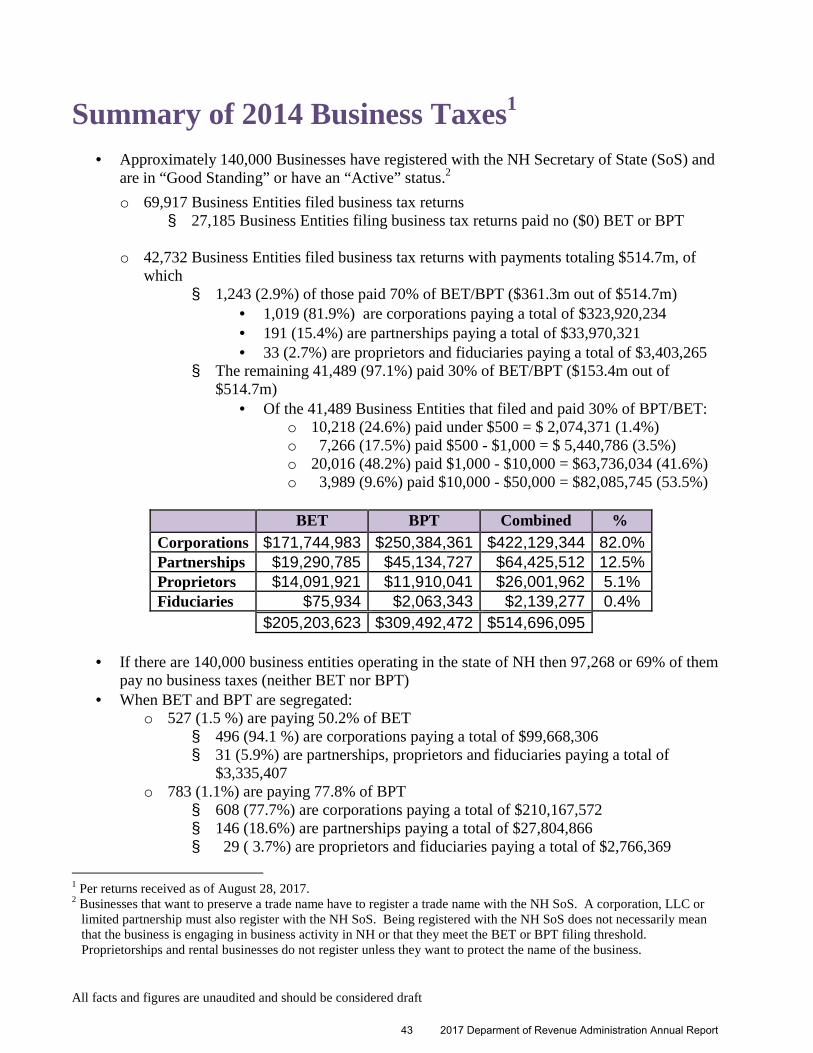
All facts and figures are unaudited and should be considered draft
Summary of 2014 Business Taxes1
· Approximately 140,000 Businesses have registered with the NH Secretary of State (SoS) and are in “Good Standing” or have an “Active” status.2
o 69,917 Business Entities filed business tax returns § 27,185 Business Entities filing business tax returns paid no ($0) BET or BPT
o 42,732 Business Entities filed business tax returns with payments totaling $514.7m, of
which § 1,243 (2.9%) of those paid 70% of BET/BPT ($361.3m out of $514.7m)
· 1,019 (81.9%) are corporations paying a total of $323,920,234 · 191 (15.4%) are partnerships paying a total of $33,970,321 · 33 (2.7%) are proprietors and fiduciaries paying a total of $3,403,265
§ The remaining 41,489 (97.1%) paid 30% of BET/BPT ($153.4m out of $514.7m)
· Of the 41,489 Business Entities that filed and paid 30% of BPT/BET: o 10,218 (24.6%) paid under $500 = $ 2,074,371 (1.4%) o 7,266 (17.5%) paid $500 - $1,000 = $ 5,440,786 (3.5%) o 20,016 (48.2%) paid $1,000 - $10,000 = $63,736,034 (41.6%) o 3,989 (9.6%) paid $10,000 - $50,000 = $82,085,745 (53.5%)
BET BPT Combined % Corporations $171,744,983 $250,384,361 $422,129,344 82.0% Partnerships $19,290,785 $45,134,727 $64,425,512 12.5% Proprietors $14,091,921 $11,910,041 $26,001,962 5.1% Fiduciaries $75,934 $2,063,343 $2,139,277 0.4% $205,203,623 $309,492,472 $514,696,095
· If there are 140,000 business entities operating in the state of NH then 97,268 or 69% of them
pay no business taxes (neither BET nor BPT) · When BET and BPT are segregated:
o 527 (1.5 %) are paying 50.2% of BET § 496 (94.1 %) are corporations paying a total of $99,668,306 § 31 (5.9%) are partnerships, proprietors and fiduciaries paying a total of
$3,335,407 o 783 (1.1%) are paying 77.8% of BPT
§ 608 (77.7%) are corporations paying a total of $210,167,572 § 146 (18.6%) are partnerships paying a total of $27,804,866 § 29 ( 3.7%) are proprietors and fiduciaries paying a total of $2,766,369
1 Per returns received as of August 28, 2017. 2 Businesses that want to preserve a trade name have to register a trade name with the NH SoS. A corporation, LLC or limited partnership must also register with the NH SoS. Being registered with the NH SoS does not necessarily mean
that the business is engaging in business activity in NH or that they meet the BET or BPT filing threshold. Proprietorships and rental businesses do not register unless they want to protect the name of the business.
43 2017 Deparment of Revenue Administration Annual Report
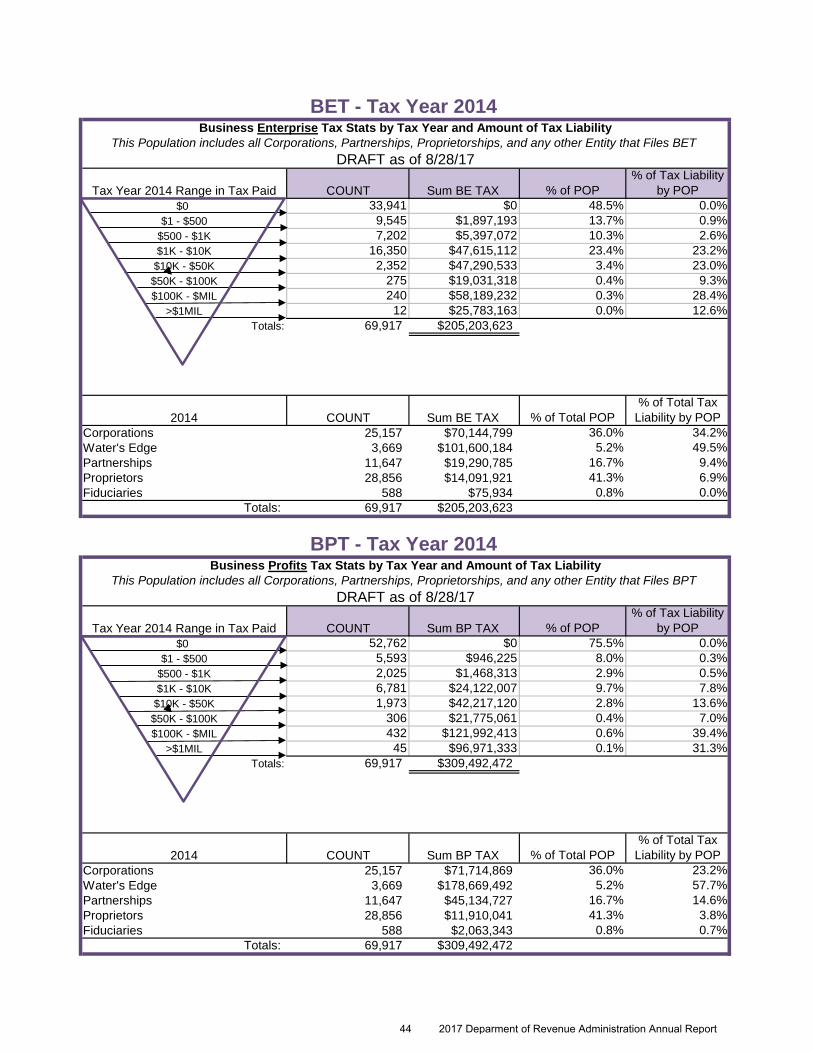
Tax Year 2014 Range in Tax Paid COUNT Sum BE TAX % of POP% of Tax Liability
by POP$0 33,941 $0 48.5% 0.0%
$1 - $500 9,545 $1,897,193 13.7% 0.9%$500 - $1K 7,202 $5,397,072 10.3% 2.6%$1K - $10K 16,350 $47,615,112 23.4% 23.2%$10K - $50K 2,352 $47,290,533 3.4% 23.0%$50K - $100K 275 $19,031,318 0.4% 9.3%$100K - $MIL 240 $58,189,232 0.3% 28.4%
>$1MIL 12 $25,783,163 0.0% 12.6%Totals: 69,917 $205,203,623
2014 COUNT Sum BE TAX % of Total POP% of Total Tax
Liability by POPCorporations 25,157 $70,144,799 36.0% 34.2%Water's Edge 3,669 $101,600,184 5.2% 49.5%Partnerships 11,647 $19,290,785 16.7% 9.4%Proprietors 28,856 $14,091,921 41.3% 6.9%Fiduciaries 588 $75,934 0.8% 0.0%
Totals: 69,917 $205,203,623
Tax Year 2014 Range in Tax Paid COUNT Sum BP TAX % of POP% of Tax Liability
by POP$0 52,762 $0 75.5% 0.0%
$1 - $500 5,593 $946,225 8.0% 0.3%$500 - $1K 2,025 $1,468,313 2.9% 0.5%$1K - $10K 6,781 $24,122,007 9.7% 7.8%$10K - $50K 1,973 $42,217,120 2.8% 13.6%$50K - $100K 306 $21,775,061 0.4% 7.0%$100K - $MIL 432 $121,992,413 0.6% 39.4%
>$1MIL 45 $96,971,333 0.1% 31.3%Totals: 69,917 $309,492,472
2014 COUNT Sum BP TAX % of Total POP% of Total Tax
Liability by POPCorporations 25,157 $71,714,869 36.0% 23.2%Water's Edge 3,669 $178,669,492 5.2% 57.7%Partnerships 11,647 $45,134,727 16.7% 14.6%Proprietors 28,856 $11,910,041 41.3% 3.8%Fiduciaries 588 $2,063,343 0.8% 0.7%
Totals: 69,917 $309,492,472
This Population includes all Corporations, Partnerships, Proprietorships, and any other Entity that Files BPTDRAFT as of 8/28/17
BET - Tax Year 2014Business Enterprise Tax Stats by Tax Year and Amount of Tax Liability
This Population includes all Corporations, Partnerships, Proprietorships, and any other Entity that Files BETDRAFT as of 8/28/17
BPT - Tax Year 2014Business Profits Tax Stats by Tax Year and Amount of Tax Liability
44 2017 Deparment of Revenue Administration Annual Report
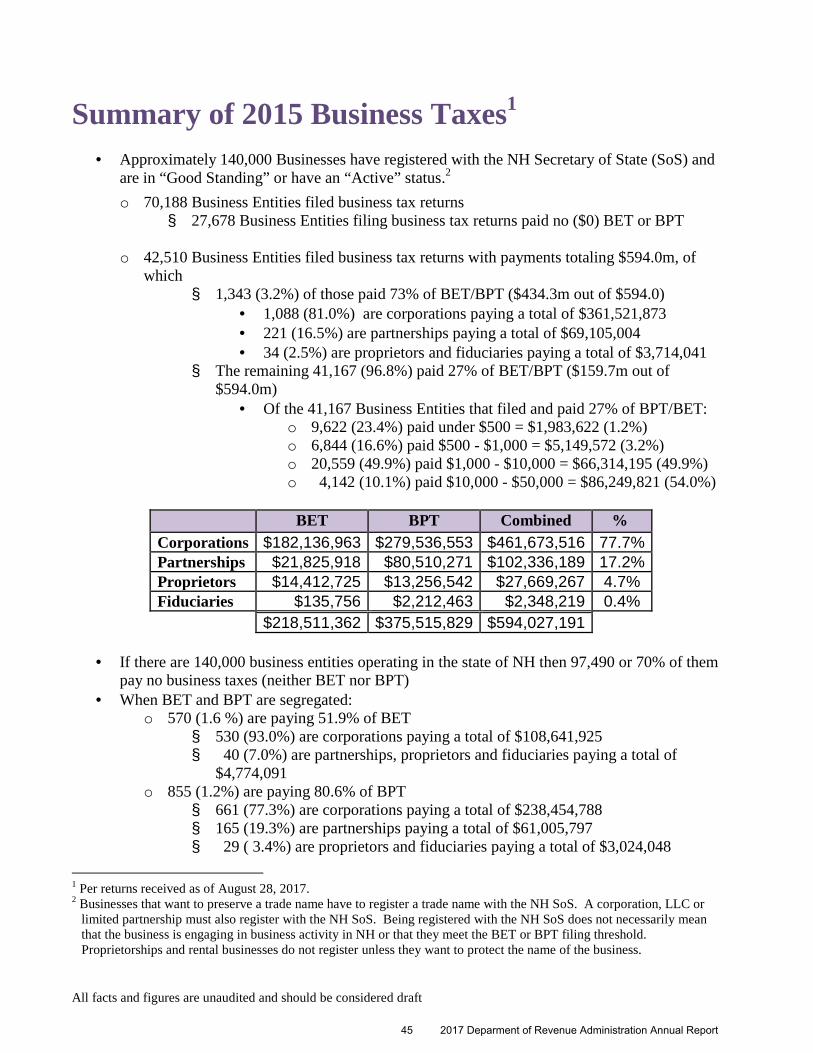
All facts and figures are unaudited and should be considered draft
Summary of 2015 Business Taxes1
· Approximately 140,000 Businesses have registered with the NH Secretary of State (SoS) and are in “Good Standing” or have an “Active” status.2
o 70,188 Business Entities filed business tax returns § 27,678 Business Entities filing business tax returns paid no ($0) BET or BPT
o 42,510 Business Entities filed business tax returns with payments totaling $594.0m, of
which § 1,343 (3.2%) of those paid 73% of BET/BPT ($434.3m out of $594.0)
· 1,088 (81.0%) are corporations paying a total of $361,521,873 · 221 (16.5%) are partnerships paying a total of $69,105,004 · 34 (2.5%) are proprietors and fiduciaries paying a total of $3,714,041
§ The remaining 41,167 (96.8%) paid 27% of BET/BPT ($159.7m out of $594.0m)
· Of the 41,167 Business Entities that filed and paid 27% of BPT/BET: o 9,622 (23.4%) paid under $500 = $1,983,622 (1.2%) o 6,844 (16.6%) paid $500 - $1,000 = $5,149,572 (3.2%) o 20,559 (49.9%) paid $1,000 - $10,000 = $66,314,195 (49.9%) o 4,142 (10.1%) paid $10,000 - $50,000 = $86,249,821 (54.0%)
BET BPT Combined % Corporations $182,136,963 $279,536,553 $461,673,516 77.7% Partnerships $21,825,918 $80,510,271 $102,336,189 17.2% Proprietors $14,412,725 $13,256,542 $27,669,267 4.7% Fiduciaries $135,756 $2,212,463 $2,348,219 0.4% $218,511,362 $375,515,829 $594,027,191
· If there are 140,000 business entities operating in the state of NH then 97,490 or 70% of them
pay no business taxes (neither BET nor BPT) · When BET and BPT are segregated:
o 570 (1.6 %) are paying 51.9% of BET § 530 (93.0%) are corporations paying a total of $108,641,925 § 40 (7.0%) are partnerships, proprietors and fiduciaries paying a total of
$4,774,091 o 855 (1.2%) are paying 80.6% of BPT
§ 661 (77.3%) are corporations paying a total of $238,454,788 § 165 (19.3%) are partnerships paying a total of $61,005,797 § 29 ( 3.4%) are proprietors and fiduciaries paying a total of $3,024,048
1 Per returns received as of August 28, 2017. 2 Businesses that want to preserve a trade name have to register a trade name with the NH SoS. A corporation, LLC or limited partnership must also register with the NH SoS. Being registered with the NH SoS does not necessarily mean
that the business is engaging in business activity in NH or that they meet the BET or BPT filing threshold. Proprietorships and rental businesses do not register unless they want to protect the name of the business.
45 2017 Deparment of Revenue Administration Annual Report
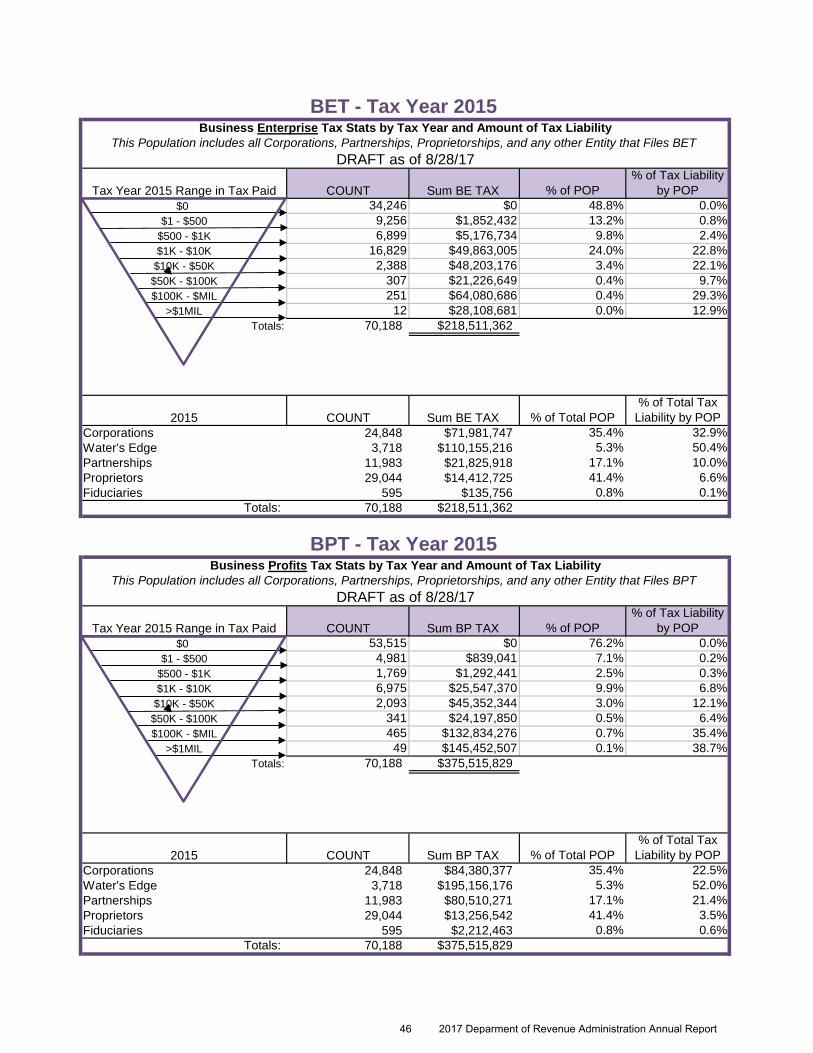
Tax Year 2015 Range in Tax Paid COUNT Sum BE TAX % of POP% of Tax Liability
by POP$0 34,246 $0 48.8% 0.0%
$1 - $500 9,256 $1,852,432 13.2% 0.8%$500 - $1K 6,899 $5,176,734 9.8% 2.4%$1K - $10K 16,829 $49,863,005 24.0% 22.8%$10K - $50K 2,388 $48,203,176 3.4% 22.1%$50K - $100K 307 $21,226,649 0.4% 9.7%$100K - $MIL 251 $64,080,686 0.4% 29.3%
>$1MIL 12 $28,108,681 0.0% 12.9%Totals: 70,188 $218,511,362
2015 COUNT Sum BE TAX % of Total POP% of Total Tax
Liability by POPCorporations 24,848 $71,981,747 35.4% 32.9%Water's Edge 3,718 $110,155,216 5.3% 50.4%Partnerships 11,983 $21,825,918 17.1% 10.0%Proprietors 29,044 $14,412,725 41.4% 6.6%Fiduciaries 595 $135,756 0.8% 0.1%
Totals: 70,188 $218,511,362
Tax Year 2015 Range in Tax Paid COUNT Sum BP TAX % of POP% of Tax Liability
by POP$0 53,515 $0 76.2% 0.0%
$1 - $500 4,981 $839,041 7.1% 0.2%$500 - $1K 1,769 $1,292,441 2.5% 0.3%$1K - $10K 6,975 $25,547,370 9.9% 6.8%$10K - $50K 2,093 $45,352,344 3.0% 12.1%$50K - $100K 341 $24,197,850 0.5% 6.4%$100K - $MIL 465 $132,834,276 0.7% 35.4%
>$1MIL 49 $145,452,507 0.1% 38.7%Totals: 70,188 $375,515,829
2015 COUNT Sum BP TAX % of Total POP% of Total Tax
Liability by POPCorporations 24,848 $84,380,377 35.4% 22.5%Water's Edge 3,718 $195,156,176 5.3% 52.0%Partnerships 11,983 $80,510,271 17.1% 21.4%Proprietors 29,044 $13,256,542 41.4% 3.5%Fiduciaries 595 $2,212,463 0.8% 0.6%
Totals: 70,188 $375,515,829
This Population includes all Corporations, Partnerships, Proprietorships, and any other Entity that Files BPTDRAFT as of 8/28/17
BET - Tax Year 2015Business Enterprise Tax Stats by Tax Year and Amount of Tax Liability
This Population includes all Corporations, Partnerships, Proprietorships, and any other Entity that Files BETDRAFT as of 8/28/17
BPT - Tax Year 2015Business Profits Tax Stats by Tax Year and Amount of Tax Liability
46 2017 Deparment of Revenue Administration Annual Report
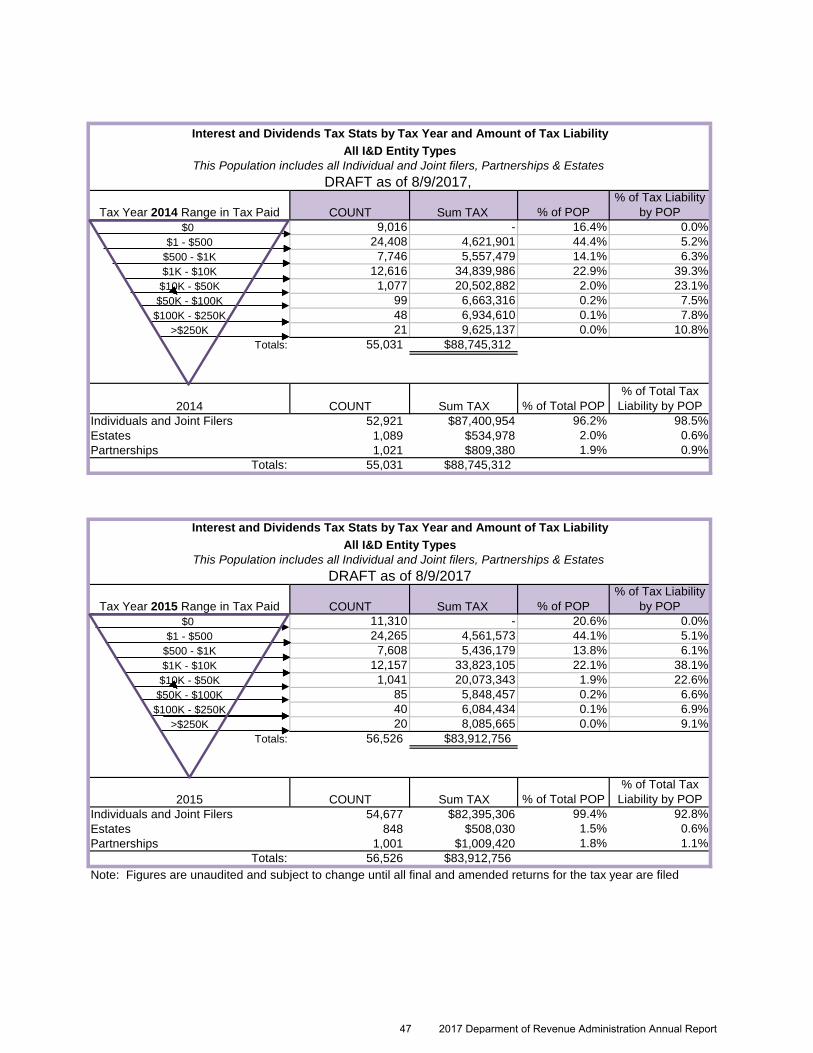
Interest and Dividends Tax Stats by Tax Year and Amount of Tax LiabilityAll I&D Entity Types
Tax Year 2014 Range in Tax Paid COUNT Sum TAX % of POP% of Tax Liability
by POP$0 9,016 - 16.4% 0.0%
$1 - $500 24,408 4,621,901 44.4% 5.2%$500 - $1K 7,746 5,557,479 14.1% 6.3%$1K - $10K 12,616 34,839,986 22.9% 39.3%
$10K - $50K 1,077 20,502,882 2.0% 23.1%$50K - $100K 99 6,663,316 0.2% 7.5%
$100K - $250K 48 6,934,610 0.1% 7.8%>$250K 21 9,625,137 0.0% 10.8%
Totals: 55,031 $88,745,312
2014 COUNT Sum TAX % of Total POP% of Total Tax
Liability by POPIndividuals and Joint Filers 52,921 $87,400,954 96.2% 98.5%Estates 1,089 $534,978 2.0% 0.6%Partnerships 1,021 $809,380 1.9% 0.9%
Totals: 55,031 $88,745,312
Interest and Dividends Tax Stats by Tax Year and Amount of Tax LiabilityAll I&D Entity Types
Tax Year 2015 Range in Tax Paid COUNT Sum TAX % of POP% of Tax Liability
by POP$0 11,310 - 20.6% 0.0%
$1 - $500 24,265 4,561,573 44.1% 5.1%$500 - $1K 7,608 5,436,179 13.8% 6.1%$1K - $10K 12,157 33,823,105 22.1% 38.1%
$10K - $50K 1,041 20,073,343 1.9% 22.6%$50K - $100K 85 5,848,457 0.2% 6.6%
$100K - $250K 40 6,084,434 0.1% 6.9%>$250K 20 8,085,665 0.0% 9.1%
Totals: 56,526 $83,912,756
2015 COUNT Sum TAX % of Total POP% of Total Tax
Liability by POPIndividuals and Joint Filers 54,677 $82,395,306 99.4% 92.8%Estates 848 $508,030 1.5% 0.6%Partnerships 1,001 $1,009,420 1.8% 1.1%
Totals: 56,526 $83,912,756Note: Figures are unaudited and subject to change until all final and amended returns for the tax year are filed
This Population includes all Individual and Joint filers, Partnerships & EstatesDRAFT as of 8/9/2017,
This Population includes all Individual and Joint filers, Partnerships & EstatesDRAFT as of 8/9/2017
47 2017 Deparment of Revenue Administration Annual Report
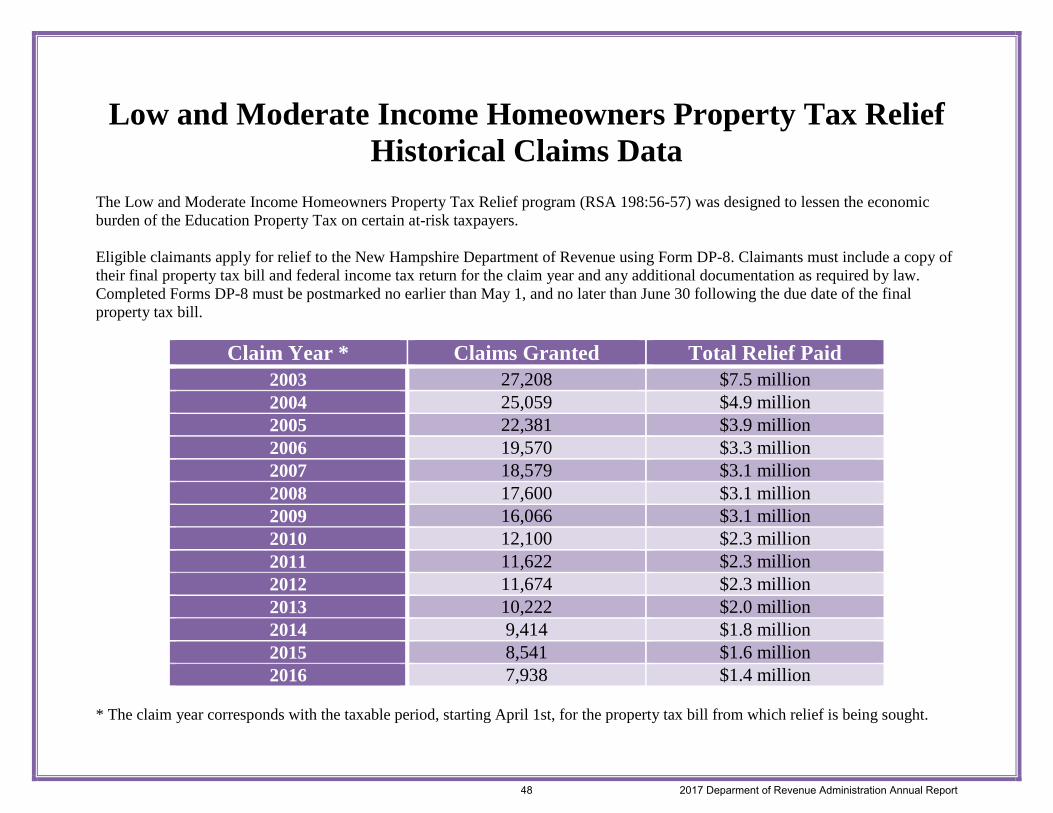
Low and Moderate Income Homeowners Property Tax Relief Historical Claims Data
The Low and Moderate Income Homeowners Property Tax Relief program (RSA 198:56-57) was designed to lessen the economic burden of the Education Property Tax on certain at-risk taxpayers. Eligible claimants apply for relief to the New Hampshire Department of Revenue using Form DP-8. Claimants must include a copy of their final property tax bill and federal income tax return for the claim year and any additional documentation as required by law. Completed Forms DP-8 must be postmarked no earlier than May 1, and no later than June 30 following the due date of the final property tax bill.
Claim Year * Claims Granted Total Relief Paid 2003 27,208 $7.5 million 2004 25,059 $4.9 million 2005 22,381 $3.9 million 2006 19,570 $3.3 million 2007 18,579 $3.1 million 2008 17,600 $3.1 million 2009 16,066 $3.1 million 2010 12,100 $2.3 million 2011 11,622 $2.3 million 2012 11,674 $2.3 million 2013 10,222 $2.0 million 2014 9,414 $1.8 million 2015 8,541 $1.6 million 2016 7,938 $1.4 million
* The claim year corresponds with the taxable period, starting April 1st, for the property tax bill from which relief is being sought.
48 2017 Deparment of Revenue Administration Annual Report
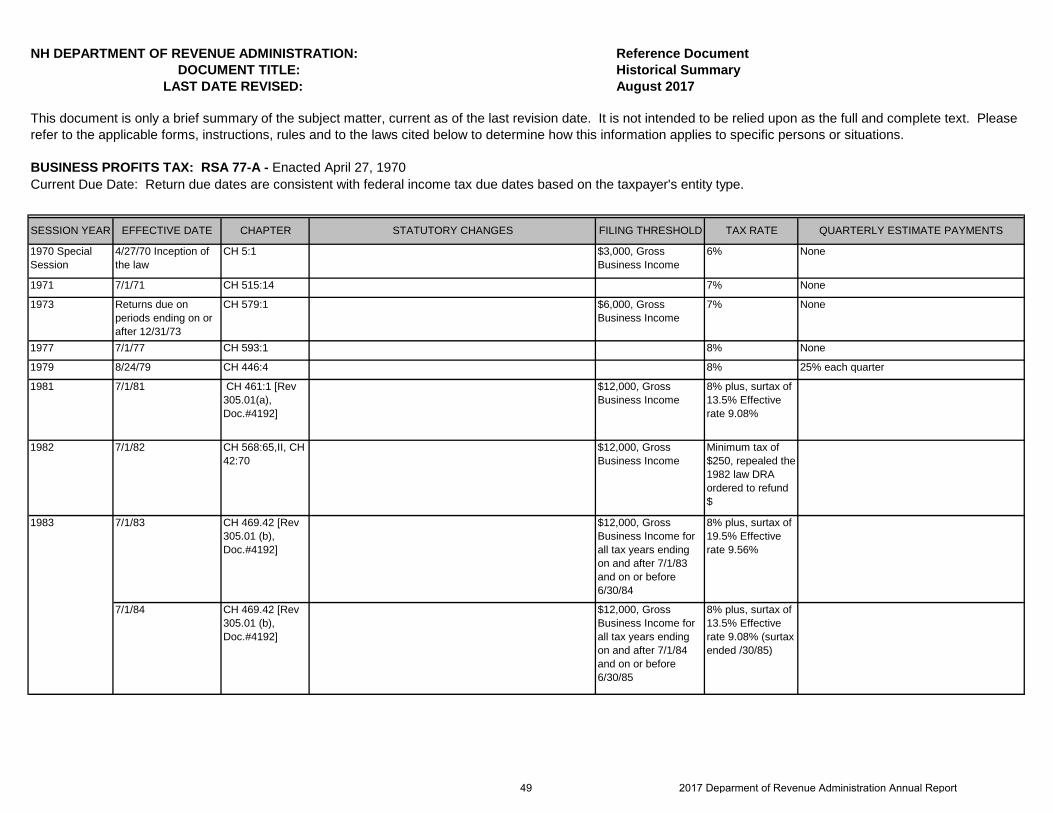
NH DEPARTMENT OF REVENUE ADMINISTRATION: Reference Document DOCUMENT TITLE: Historical Summary LAST DATE REVISED: August 2017
BUSINESS PROFITS TAX: RSA 77-A - Enacted April 27, 1970
SESSION YEAR EFFECTIVE DATE CHAPTER STATUTORY CHANGES FILING THRESHOLD TAX RATE QUARTERLY ESTIMATE PAYMENTS
1970 Special Session
4/27/70 Inception of the law
CH 5:1 $3,000, Gross Business Income
6% None
1971 7/1/71 CH 515:14 7% None
1973 Returns due on periods ending on or after 12/31/73
CH 579:1 $6,000, Gross Business Income
7% None
1977 7/1/77 CH 593:1 8% None
1979 8/24/79 CH 446:4 8% 25% each quarter
1981 7/1/81 CH 461:1 [Rev 305.01(a), Doc.#4192]
$12,000, Gross Business Income
8% plus, surtax of 13.5% Effective rate 9.08%
1982 7/1/82 CH 568:65,II, CH 42:70
$12,000, Gross Business Income
Minimum tax of $250, repealed the 1982 law DRA ordered to refund $
7/1/83 CH 469.42 [Rev 305.01 (b), Doc.#4192]
$12,000, Gross Business Income for all tax years ending on and after 7/1/83 and on or before 6/30/84
8% plus, surtax of 19.5% Effective rate 9.56%
7/1/84 CH 469.42 [Rev 305.01 (b), Doc.#4192]
$12,000, Gross Business Income for all tax years ending on and after 7/1/84 and on or before 6/30/85
8% plus, surtax of 13.5% Effective rate 9.08% (surtax ended /30/85)
This document is only a brief summary of the subject matter, current as of the last revision date. It is not intended to be relied upon as the full and complete text. Please refer to the applicable forms, instructions, rules and to the laws cited below to determine how this information applies to specific persons or situations.
Current Due Date: Return due dates are consistent with federal income tax due dates based on the taxpayer's entity type.
1983
49 2017 Deparment of Revenue Administration Annual Report
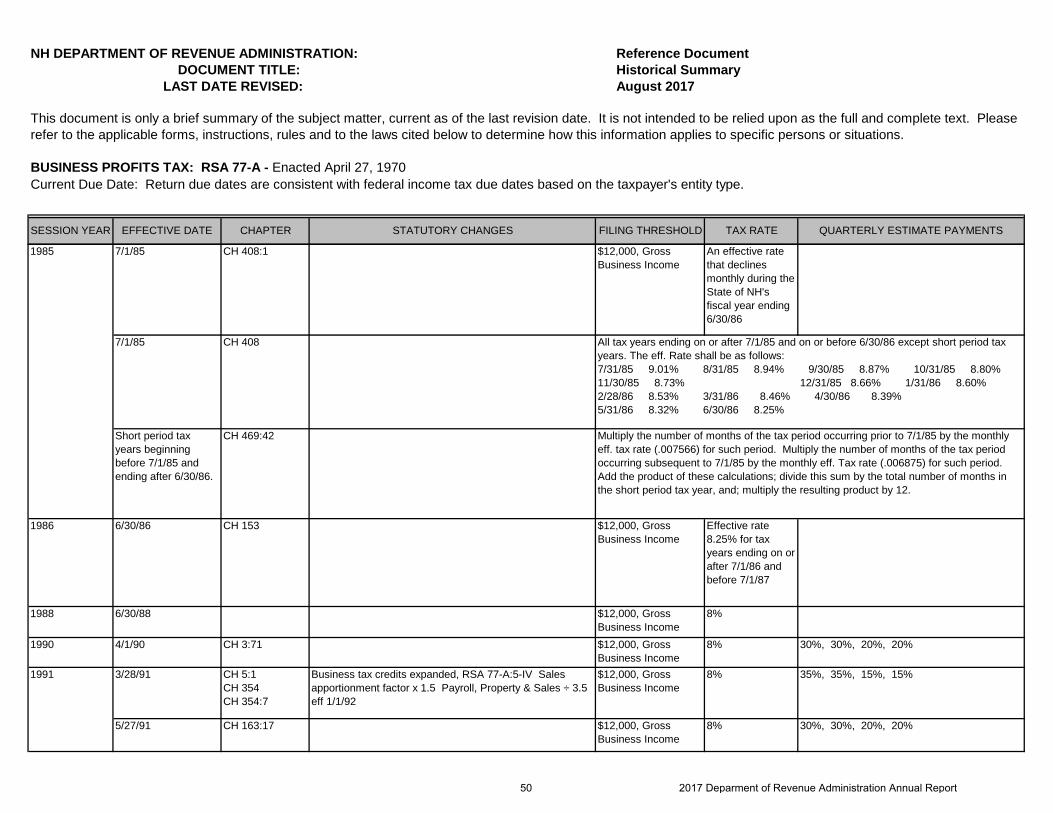
NH DEPARTMENT OF REVENUE ADMINISTRATION: Reference Document DOCUMENT TITLE: Historical Summary LAST DATE REVISED: August 2017
BUSINESS PROFITS TAX: RSA 77-A - Enacted April 27, 1970
SESSION YEAR EFFECTIVE DATE CHAPTER STATUTORY CHANGES FILING THRESHOLD TAX RATE QUARTERLY ESTIMATE PAYMENTS
This document is only a brief summary of the subject matter, current as of the last revision date. It is not intended to be relied upon as the full and complete text. Please refer to the applicable forms, instructions, rules and to the laws cited below to determine how this information applies to specific persons or situations.
Current Due Date: Return due dates are consistent with federal income tax due dates based on the taxpayer's entity type.
7/1/85 CH 408:1 $12,000, Gross Business Income
An effective rate that declines monthly during the State of NH's fiscal year ending 6/30/86
7/1/85 CH 408
Short period tax years beginning before 7/1/85 and ending after 6/30/86.
CH 469:42
1986 6/30/86 CH 153 $12,000, Gross Business Income
Effective rate 8.25% for tax years ending on or after 7/1/86 and before 7/1/87
1988 6/30/88 $12,000, Gross Business Income
8%
1990 4/1/90 CH 3:71 $12,000, Gross Business Income
8% 30%, 30%, 20%, 20%
3/28/91 CH 5:1 CH 354 CH 354:7
Business tax credits expanded, RSA 77-A:5-IV Sales apportionment factor x 1.5 Payroll, Property & Sales ÷ 3.5 eff 1/1/92
$12,000, Gross Business Income
8% 35%, 35%, 15%, 15%
5/27/91 CH 163:17 $12,000, Gross Business Income
8% 30%, 30%, 20%, 20%
All tax years ending on or after 7/1/85 and on or before 6/30/86 except short period tax years. The eff. Rate shall be as follows: 7/31/85 9.01% 8/31/85 8.94% 9/30/85 8.87% 10/31/85 8.80% 11/30/85 8.73% 12/31/85 8.66% 1/31/86 8.60% 2/28/86 8.53% 3/31/86 8.46% 4/30/86 8.39% 5/31/86 8.32% 6/30/86 8.25%
1985
1991
Multiply the number of months of the tax period occurring prior to 7/1/85 by the monthly eff. tax rate (.007566) for such period. Multiply the number of months of the tax period occurring subsequent to 7/1/85 by the monthly eff. Tax rate (.006875) for such period. Add the product of these calculations; divide this sum by the total number of months in the short period tax year, and; multiply the resulting product by 12.
50 2017 Deparment of Revenue Administration Annual Report
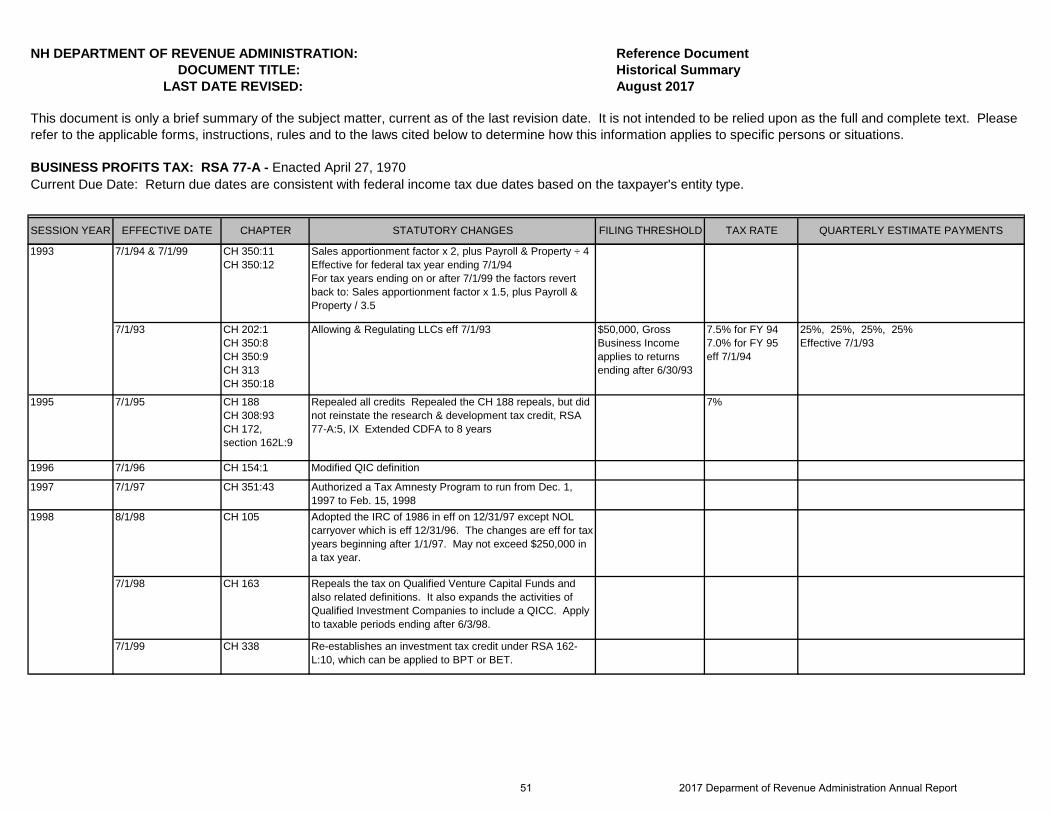
NH DEPARTMENT OF REVENUE ADMINISTRATION: Reference Document DOCUMENT TITLE: Historical Summary LAST DATE REVISED: August 2017
BUSINESS PROFITS TAX: RSA 77-A - Enacted April 27, 1970
SESSION YEAR EFFECTIVE DATE CHAPTER STATUTORY CHANGES FILING THRESHOLD TAX RATE QUARTERLY ESTIMATE PAYMENTS
This document is only a brief summary of the subject matter, current as of the last revision date. It is not intended to be relied upon as the full and complete text. Please refer to the applicable forms, instructions, rules and to the laws cited below to determine how this information applies to specific persons or situations.
Current Due Date: Return due dates are consistent with federal income tax due dates based on the taxpayer's entity type.
7/1/94 & 7/1/99 CH 350:11 CH 350:12
Sales apportionment factor x 2, plus Payroll & Property ÷ 4 Effective for federal tax year ending 7/1/94 For tax years ending on or after 7/1/99 the factors revert back to: Sales apportionment factor x 1.5, plus Payroll & Property / 3.5
7/1/93 CH 202:1 CH 350:8 CH 350:9 CH 313 CH 350:18
Allowing & Regulating LLCs eff 7/1/93 $50,000, Gross Business Income applies to returns ending after 6/30/93
7.5% for FY 94 7.0% for FY 95 eff 7/1/94
25%, 25%, 25%, 25% Effective 7/1/93
1995 7/1/95 CH 188 CH 308:93 CH 172, section 162L:9
Repealed all credits Repealed the CH 188 repeals, but did not reinstate the research & development tax credit, RSA 77-A:5, IX Extended CDFA to 8 years
7%
1996 7/1/96 CH 154:1 Modified QIC definition
1997 7/1/97 CH 351:43 Authorized a Tax Amnesty Program to run from Dec. 1, 1997 to Feb. 15, 1998
8/1/98 CH 105 Adopted the IRC of 1986 in eff on 12/31/97 except NOL carryover which is eff 12/31/96. The changes are eff for tax years beginning after 1/1/97. May not exceed $250,000 in a tax year.
7/1/98 CH 163 Repeals the tax on Qualified Venture Capital Funds and also related definitions. It also expands the activities of Qualified Investment Companies to include a QICC. Apply to taxable periods ending after 6/3/98.
7/1/99 CH 338 Re-establishes an investment tax credit under RSA 162-L:10, which can be applied to BPT or BET.
1993
1998
51 2017 Deparment of Revenue Administration Annual Report
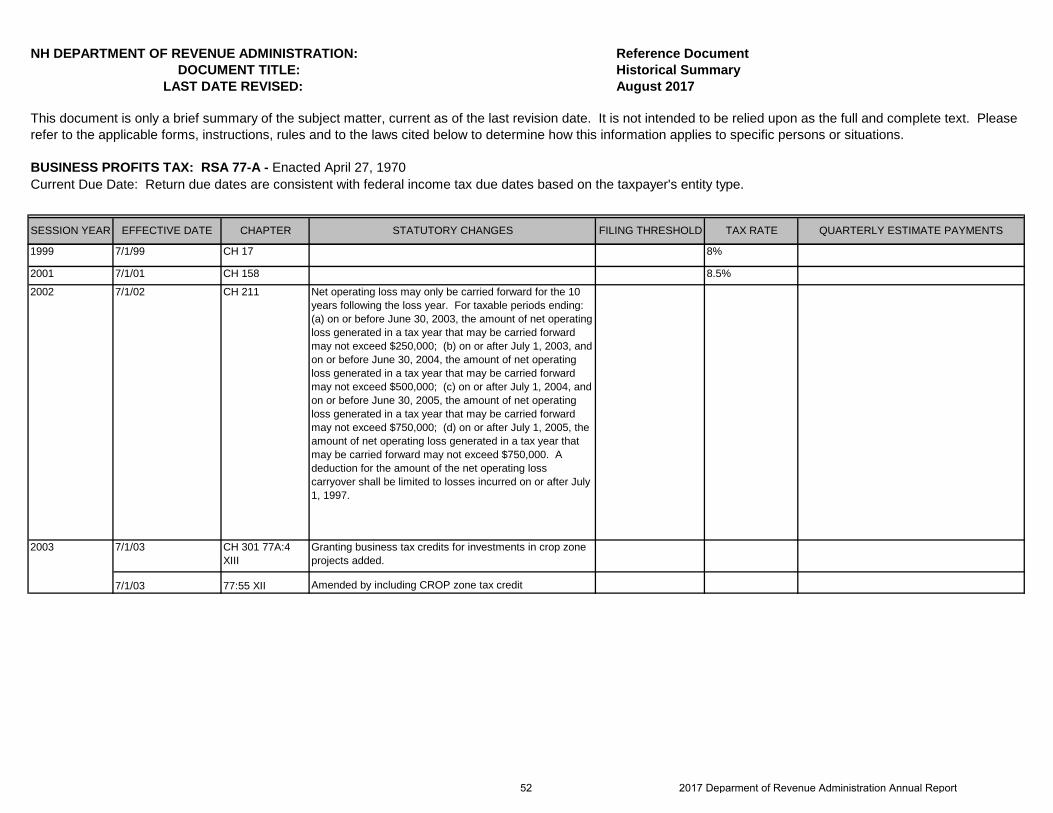
NH DEPARTMENT OF REVENUE ADMINISTRATION: Reference Document DOCUMENT TITLE: Historical Summary LAST DATE REVISED: August 2017
BUSINESS PROFITS TAX: RSA 77-A - Enacted April 27, 1970
SESSION YEAR EFFECTIVE DATE CHAPTER STATUTORY CHANGES FILING THRESHOLD TAX RATE QUARTERLY ESTIMATE PAYMENTS
This document is only a brief summary of the subject matter, current as of the last revision date. It is not intended to be relied upon as the full and complete text. Please refer to the applicable forms, instructions, rules and to the laws cited below to determine how this information applies to specific persons or situations.
Current Due Date: Return due dates are consistent with federal income tax due dates based on the taxpayer's entity type.
1999 7/1/99 CH 17 8%
2001 7/1/01 CH 158 8.5%
2002 7/1/02 CH 211 Net operating loss may only be carried forward for the 10 years following the loss year. For taxable periods ending: (a) on or before June 30, 2003, the amount of net operating loss generated in a tax year that may be carried forward may not exceed $250,000; (b) on or after July 1, 2003, and on or before June 30, 2004, the amount of net operating loss generated in a tax year that may be carried forward may not exceed $500,000; (c) on or after July 1, 2004, and on or before June 30, 2005, the amount of net operating loss generated in a tax year that may be carried forward may not exceed $750,000; (d) on or after July 1, 2005, the amount of net operating loss generated in a tax year that may be carried forward may not exceed $750,000. A deduction for the amount of the net operating loss carryover shall be limited to losses incurred on or after July 1, 1997.
7/1/03 CH 301 77A:4 XIII
Granting business tax credits for investments in crop zone projects added.
7/1/03 77:55 XII Amended by including CROP zone tax credit
2003
52 2017 Deparment of Revenue Administration Annual Report
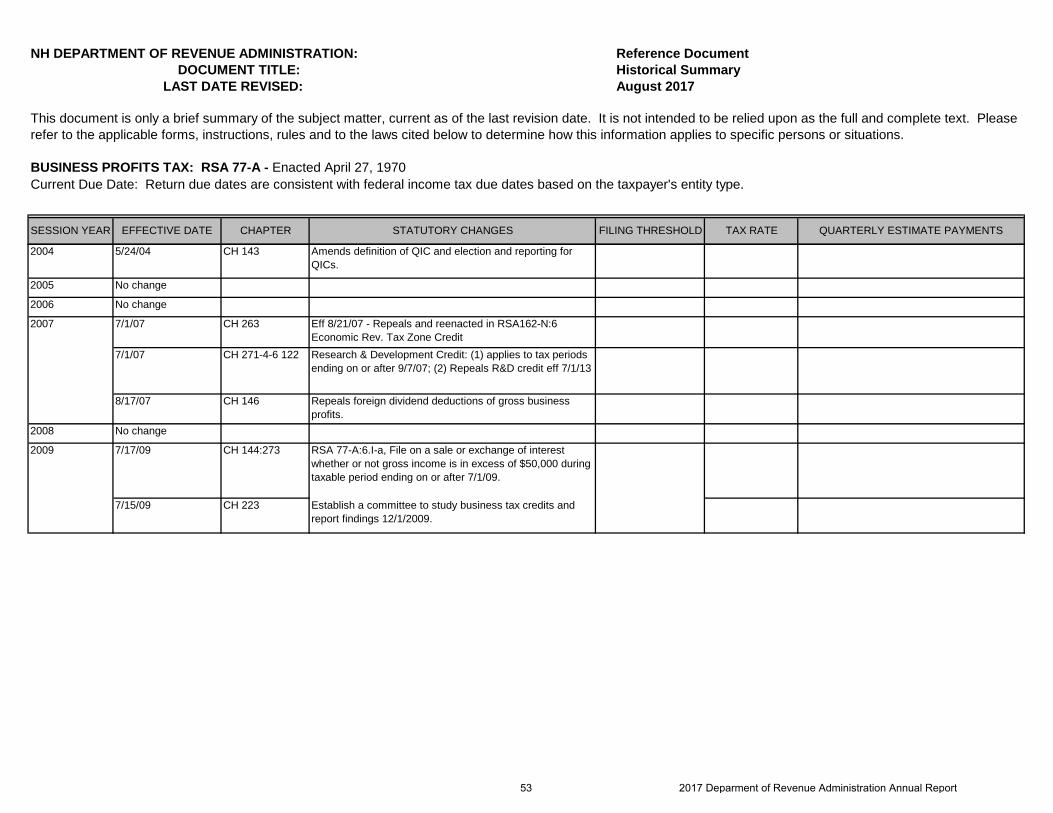
NH DEPARTMENT OF REVENUE ADMINISTRATION: Reference Document DOCUMENT TITLE: Historical Summary LAST DATE REVISED: August 2017
BUSINESS PROFITS TAX: RSA 77-A - Enacted April 27, 1970
SESSION YEAR EFFECTIVE DATE CHAPTER STATUTORY CHANGES FILING THRESHOLD TAX RATE QUARTERLY ESTIMATE PAYMENTS
This document is only a brief summary of the subject matter, current as of the last revision date. It is not intended to be relied upon as the full and complete text. Please refer to the applicable forms, instructions, rules and to the laws cited below to determine how this information applies to specific persons or situations.
Current Due Date: Return due dates are consistent with federal income tax due dates based on the taxpayer's entity type.
2004 5/24/04 CH 143 Amends definition of QIC and election and reporting for QICs.
2005 No change
2006 No change
7/1/07 CH 263 Eff 8/21/07 - Repeals and reenacted in RSA162-N:6 Economic Rev. Tax Zone Credit
7/1/07 CH 271-4-6 122 Research & Development Credit: (1) applies to tax periods ending on or after 9/7/07; (2) Repeals R&D credit eff 7/1/13
8/17/07 CH 146 Repeals foreign dividend deductions of gross business profits.
2008 No change
7/17/09 CH 144:273 RSA 77-A:6.I-a, File on a sale or exchange of interest whether or not gross income is in excess of $50,000 during taxable period ending on or after 7/1/09.
7/15/09 CH 223 Establish a committee to study business tax credits and report findings 12/1/2009.
2009
2007
53 2017 Deparment of Revenue Administration Annual Report

NH DEPARTMENT OF REVENUE ADMINISTRATION: Reference Document DOCUMENT TITLE: Historical Summary LAST DATE REVISED: August 2017
BUSINESS PROFITS TAX: RSA 77-A - Enacted April 27, 1970
SESSION YEAR EFFECTIVE DATE CHAPTER STATUTORY CHANGES FILING THRESHOLD TAX RATE QUARTERLY ESTIMATE PAYMENTS
This document is only a brief summary of the subject matter, current as of the last revision date. It is not intended to be relied upon as the full and complete text. Please refer to the applicable forms, instructions, rules and to the laws cited below to determine how this information applies to specific persons or situations.
Current Due Date: Return due dates are consistent with federal income tax due dates based on the taxpayer's entity type.
7/8/10 CH 286 RSA 77:4-b, allows a business organization engaged in an IRC §1031 Like-Kind Exchange to utilize a single member limited liability company, revocable trust or other entity disregarded for federal tax purposes as the recipient entity. Under the special rule, the recipient entity takes the basis of the relinquished property as held by the parent organization as computed for federal income tax purposes.
7/13/10 CH 311 RSA Chapter 162-N Economic Revitalization Zone Tax Credit amended to extend the availability of the credits for four years and makes certain changes to the eligibility for and determination of the eligible amounts for the credits.
7/20/10 CH 324:2, 4 and 5
RSA 77-A:4, III the amount of the deduction for compensation for personal services shall be determined, as applicable to NH's tax structure, using the standards set forth in IRC §162(a)(1). Beginning on or after 1/1/11 there is a record-keeping safe harbor for deductions up to $50,000 as total compensation for the tax year. Also creates a study committee to study safe harbors and the taxation of investment organizations (report due 11/1/11).
2010
54 2017 Deparment of Revenue Administration Annual Report
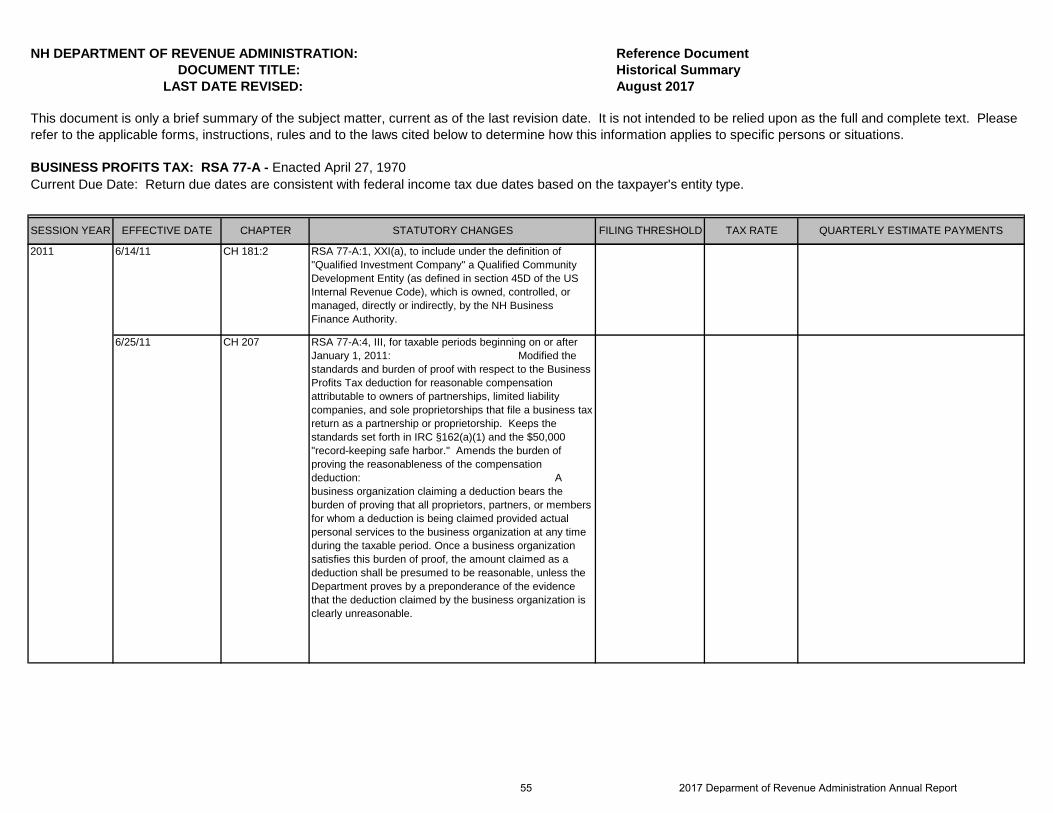
NH DEPARTMENT OF REVENUE ADMINISTRATION: Reference Document DOCUMENT TITLE: Historical Summary LAST DATE REVISED: August 2017
BUSINESS PROFITS TAX: RSA 77-A - Enacted April 27, 1970
SESSION YEAR EFFECTIVE DATE CHAPTER STATUTORY CHANGES FILING THRESHOLD TAX RATE QUARTERLY ESTIMATE PAYMENTS
This document is only a brief summary of the subject matter, current as of the last revision date. It is not intended to be relied upon as the full and complete text. Please refer to the applicable forms, instructions, rules and to the laws cited below to determine how this information applies to specific persons or situations.
Current Due Date: Return due dates are consistent with federal income tax due dates based on the taxpayer's entity type.
6/14/11 CH 181:2 RSA 77-A:1, XXI(a), to include under the definition of "Qualified Investment Company" a Qualified Community Development Entity (as defined in section 45D of the US Internal Revenue Code), which is owned, controlled, or managed, directly or indirectly, by the NH Business Finance Authority.
6/25/11 CH 207 RSA 77-A:4, III, for taxable periods beginning on or after January 1, 2011: Modified the standards and burden of proof with respect to the Business Profits Tax deduction for reasonable compensation attributable to owners of partnerships, limited liability companies, and sole proprietorships that file a business tax return as a partnership or proprietorship. Keeps the standards set forth in IRC §162(a)(1) and the $50,000 "record-keeping safe harbor." Amends the burden of proving the reasonableness of the compensation deduction: A business organization claiming a deduction bears the burden of proving that all proprietors, partners, or members for whom a deduction is being claimed provided actual personal services to the business organization at any time during the taxable period. Once a business organization satisfies this burden of proof, the amount claimed as a deduction shall be presumed to be reasonable, unless the Department proves by a preponderance of the evidence that the deduction claimed by the business organization is clearly unreasonable.
2011
55 2017 Deparment of Revenue Administration Annual Report
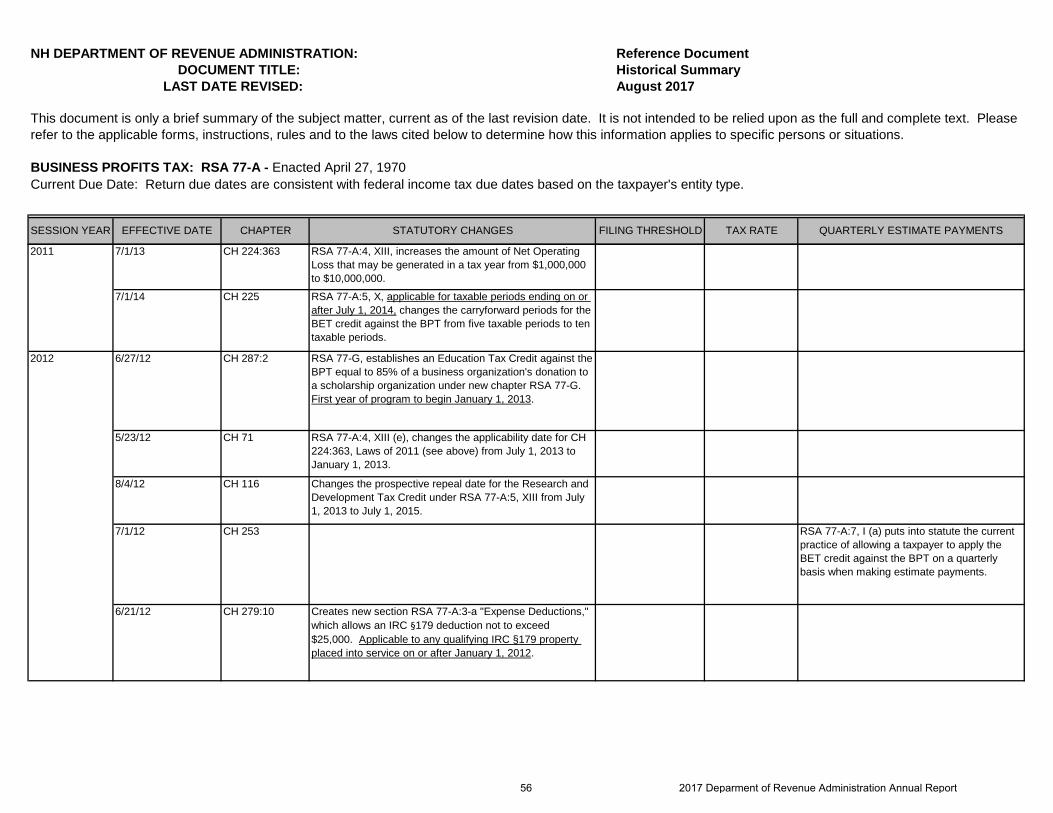
NH DEPARTMENT OF REVENUE ADMINISTRATION: Reference Document DOCUMENT TITLE: Historical Summary LAST DATE REVISED: August 2017
BUSINESS PROFITS TAX: RSA 77-A - Enacted April 27, 1970
SESSION YEAR EFFECTIVE DATE CHAPTER STATUTORY CHANGES FILING THRESHOLD TAX RATE QUARTERLY ESTIMATE PAYMENTS
This document is only a brief summary of the subject matter, current as of the last revision date. It is not intended to be relied upon as the full and complete text. Please refer to the applicable forms, instructions, rules and to the laws cited below to determine how this information applies to specific persons or situations.
Current Due Date: Return due dates are consistent with federal income tax due dates based on the taxpayer's entity type.
7/1/13 CH 224:363 RSA 77-A:4, XIII, increases the amount of Net Operating Loss that may be generated in a tax year from $1,000,000 to $10,000,000.
7/1/14 CH 225 RSA 77-A:5, X, applicable for taxable periods ending on or after July 1, 2014, changes the carryforward periods for the BET credit against the BPT from five taxable periods to ten taxable periods.
6/27/12 CH 287:2 RSA 77-G, establishes an Education Tax Credit against the BPT equal to 85% of a business organization's donation to a scholarship organization under new chapter RSA 77-G. First year of program to begin January 1, 2013.
5/23/12 CH 71 RSA 77-A:4, XIII (e), changes the applicability date for CH 224:363, Laws of 2011 (see above) from July 1, 2013 to January 1, 2013.
8/4/12 CH 116 Changes the prospective repeal date for the Research and Development Tax Credit under RSA 77-A:5, XIII from July 1, 2013 to July 1, 2015.
7/1/12 CH 253 RSA 77-A:7, I (a) puts into statute the current practice of allowing a taxpayer to apply the BET credit against the BPT on a quarterly basis when making estimate payments.
6/21/12 CH 279:10 Creates new section RSA 77-A:3-a "Expense Deductions," which allows an IRC §179 deduction not to exceed $25,000. Applicable to any qualifying IRC §179 property placed into service on or after January 1, 2012.
2011
2012
56 2017 Deparment of Revenue Administration Annual Report
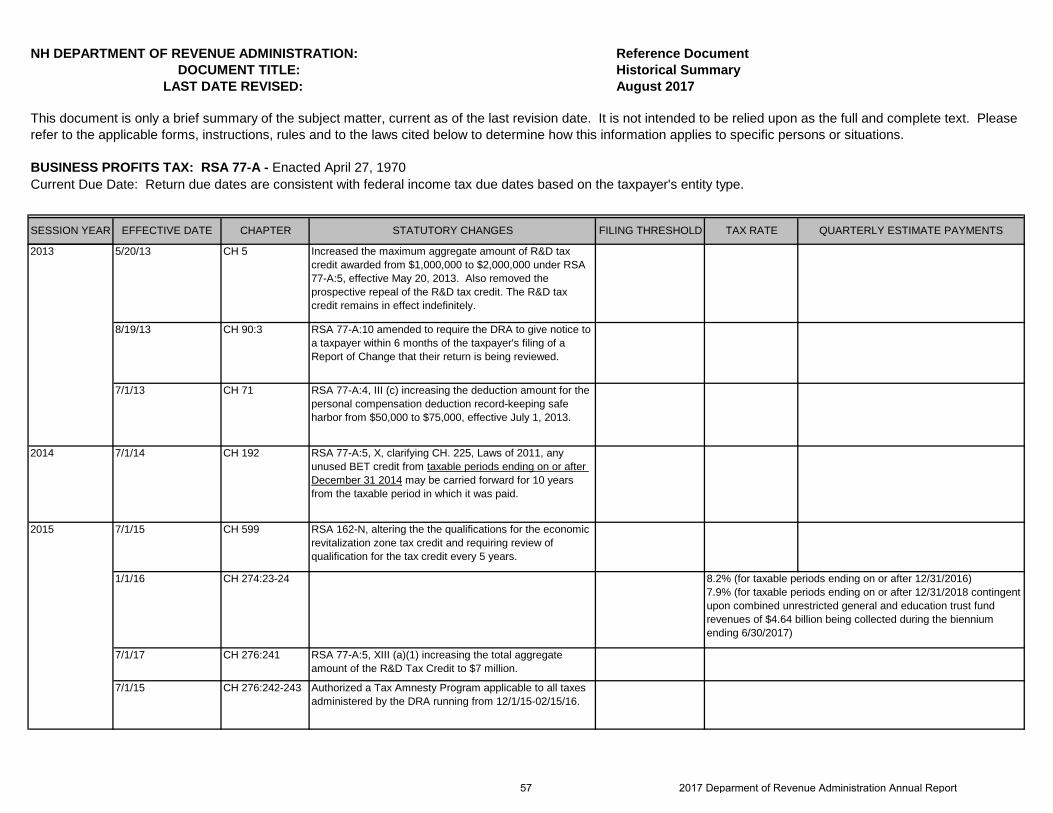
NH DEPARTMENT OF REVENUE ADMINISTRATION: Reference Document DOCUMENT TITLE: Historical Summary LAST DATE REVISED: August 2017
BUSINESS PROFITS TAX: RSA 77-A - Enacted April 27, 1970
SESSION YEAR EFFECTIVE DATE CHAPTER STATUTORY CHANGES FILING THRESHOLD TAX RATE QUARTERLY ESTIMATE PAYMENTS
This document is only a brief summary of the subject matter, current as of the last revision date. It is not intended to be relied upon as the full and complete text. Please refer to the applicable forms, instructions, rules and to the laws cited below to determine how this information applies to specific persons or situations.
Current Due Date: Return due dates are consistent with federal income tax due dates based on the taxpayer's entity type.
5/20/13 CH 5 Increased the maximum aggregate amount of R&D tax credit awarded from $1,000,000 to $2,000,000 under RSA 77-A:5, effective May 20, 2013. Also removed the prospective repeal of the R&D tax credit. The R&D tax credit remains in effect indefinitely.
8/19/13 CH 90:3 RSA 77-A:10 amended to require the DRA to give notice to a taxpayer within 6 months of the taxpayer's filing of a Report of Change that their return is being reviewed.
7/1/13 CH 71 RSA 77-A:4, III (c) increasing the deduction amount for the personal compensation deduction record-keeping safe harbor from $50,000 to $75,000, effective July 1, 2013.
2014 7/1/14 CH 192 RSA 77-A:5, X, clarifying CH. 225, Laws of 2011, any unused BET credit from taxable periods ending on or after December 31 2014 may be carried forward for 10 years from the taxable period in which it was paid.
7/1/15 CH 599 RSA 162-N, altering the the qualifications for the economic revitalization zone tax credit and requiring review of qualification for the tax credit every 5 years.
1/1/16 CH 274:23-24
7/1/17 CH 276:241 RSA 77-A:5, XIII (a)(1) increasing the total aggregate amount of the R&D Tax Credit to $7 million.
7/1/15 CH 276:242-243 Authorized a Tax Amnesty Program applicable to all taxes administered by the DRA running from 12/1/15-02/15/16.
2013
2015
8.2% (for taxable periods ending on or after 12/31/2016) 7.9% (for taxable periods ending on or after 12/31/2018 contingent upon combined unrestricted general and education trust fund revenues of $4.64 billion being collected during the biennium ending 6/30/2017)
57 2017 Deparment of Revenue Administration Annual Report
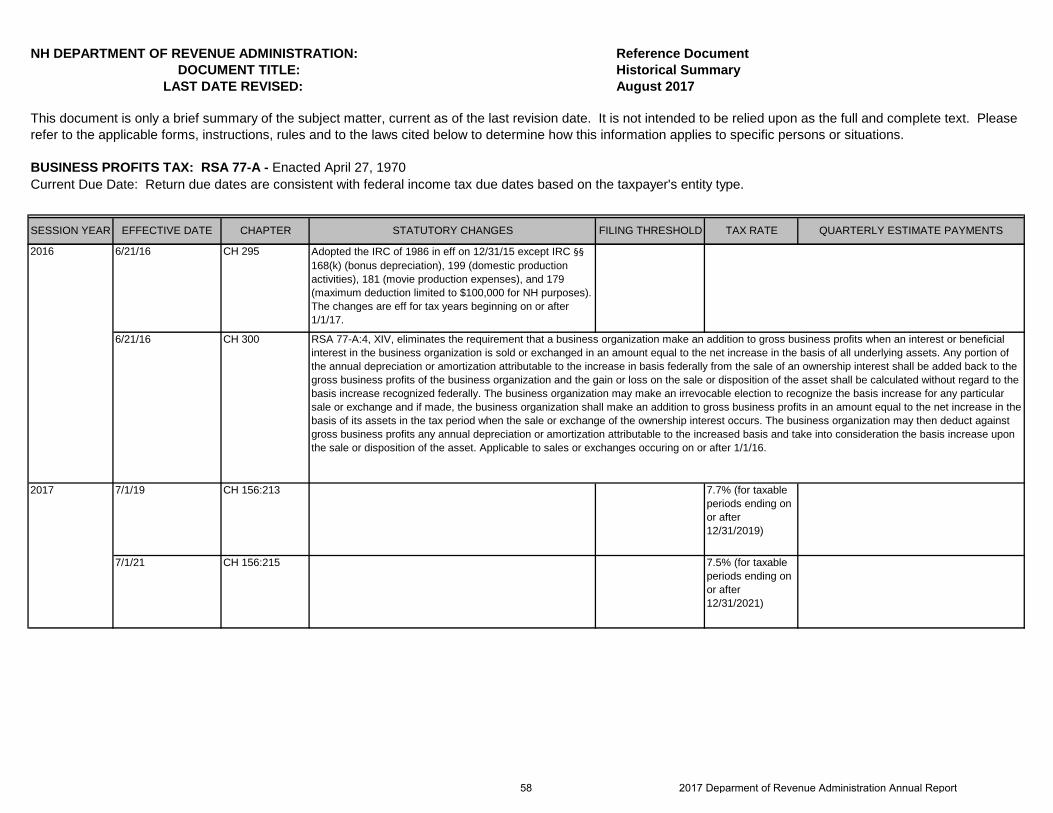
NH DEPARTMENT OF REVENUE ADMINISTRATION: Reference Document DOCUMENT TITLE: Historical Summary LAST DATE REVISED: August 2017
BUSINESS PROFITS TAX: RSA 77-A - Enacted April 27, 1970
SESSION YEAR EFFECTIVE DATE CHAPTER STATUTORY CHANGES FILING THRESHOLD TAX RATE QUARTERLY ESTIMATE PAYMENTS
This document is only a brief summary of the subject matter, current as of the last revision date. It is not intended to be relied upon as the full and complete text. Please refer to the applicable forms, instructions, rules and to the laws cited below to determine how this information applies to specific persons or situations.
Current Due Date: Return due dates are consistent with federal income tax due dates based on the taxpayer's entity type.
6/21/16 CH 295 Adopted the IRC of 1986 in eff on 12/31/15 except IRC §§ 168(k) (bonus depreciation), 199 (domestic production activities), 181 (movie production expenses), and 179 (maximum deduction limited to $100,000 for NH purposes). The changes are eff for tax years beginning on or after 1/1/17.
6/21/16 CH 300
7/1/19 CH 156:213 7.7% (for taxable periods ending on or after 12/31/2019)
7/1/21 CH 156:215 7.5% (for taxable periods ending on or after 12/31/2021)
2017
2016
RSA 77-A:4, XIV, eliminates the requirement that a business organization make an addition to gross business profits when an interest or beneficial interest in the business organization is sold or exchanged in an amount equal to the net increase in the basis of all underlying assets. Any portion of the annual depreciation or amortization attributable to the increase in basis federally from the sale of an ownership interest shall be added back to the gross business profits of the business organization and the gain or loss on the sale or disposition of the asset shall be calculated without regard to the basis increase recognized federally. The business organization may make an irrevocable election to recognize the basis increase for any particular sale or exchange and if made, the business organization shall make an addition to gross business profits in an amount equal to the net increase in the basis of its assets in the tax period when the sale or exchange of the ownership interest occurs. The business organization may then deduct against gross business profits any annual depreciation or amortization attributable to the increased basis and take into consideration the basis increase upon the sale or disposition of the asset. Applicable to sales or exchanges occuring on or after 1/1/16.
58 2017 Deparment of Revenue Administration Annual Report
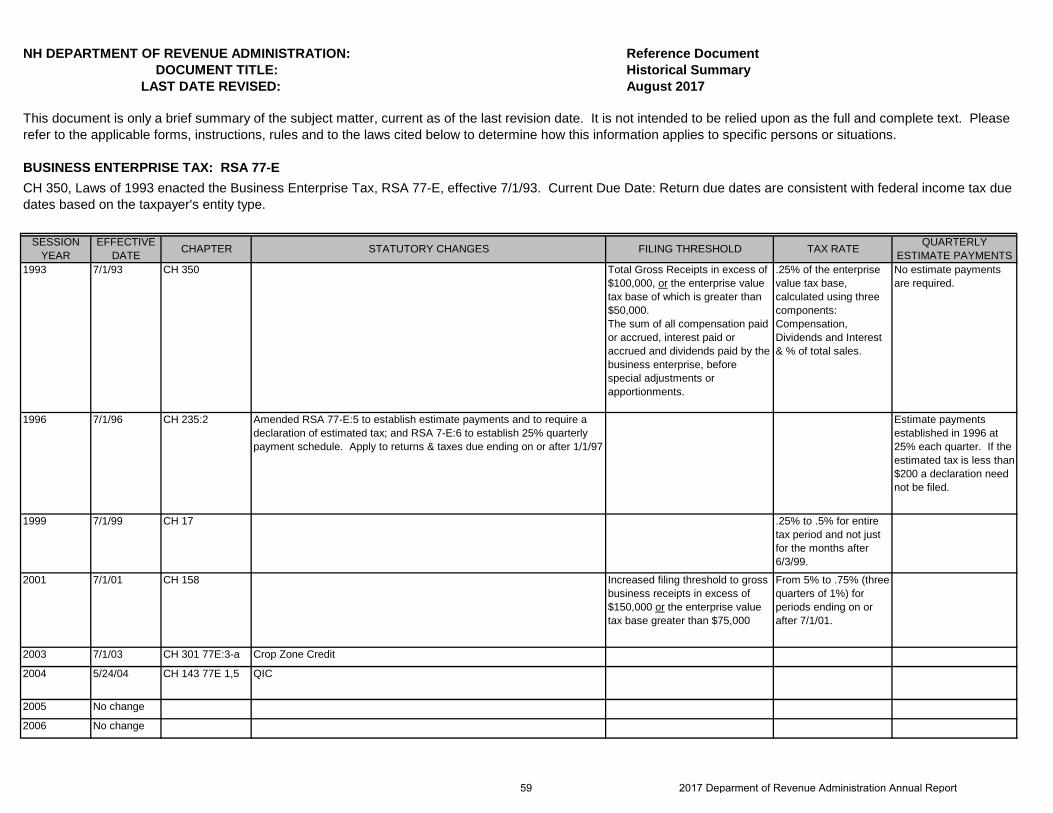
NH DEPARTMENT OF REVENUE ADMINISTRATION: Reference Document DOCUMENT TITLE: Historical Summary LAST DATE REVISED: August 2017
BUSINESS ENTERPRISE TAX: RSA 77-E
SESSION YEAR
EFFECTIVE DATE CHAPTER STATUTORY CHANGES FILING THRESHOLD TAX RATE QUARTERLY
ESTIMATE PAYMENTS1993 7/1/93 CH 350 Total Gross Receipts in excess of
$100,000, or the enterprise value tax base of which is greater than $50,000. The sum of all compensation paid or accrued, interest paid or accrued and dividends paid by the business enterprise, before special adjustments or apportionments.
.25% of the enterprise value tax base, calculated using three components: Compensation, Dividends and Interest & % of total sales.
No estimate payments are required.
1996 7/1/96 CH 235:2 Amended RSA 77-E:5 to establish estimate payments and to require a declaration of estimated tax; and RSA 7-E:6 to establish 25% quarterly payment schedule. Apply to returns & taxes due ending on or after 1/1/97
Estimate payments established in 1996 at 25% each quarter. If the estimated tax is less than $200 a declaration need not be filed.
1999 7/1/99 CH 17 .25% to .5% for entire tax period and not just for the months after 6/3/99.
2001 7/1/01 CH 158 Increased filing threshold to gross business receipts in excess of $150,000 or the enterprise value tax base greater than $75,000
From 5% to .75% (three quarters of 1%) for periods ending on or after 7/1/01.
2003 7/1/03 CH 301 77E:3-a Crop Zone Credit
2004 5/24/04 CH 143 77E 1,5 QIC
2005 No change
2006 No change
This document is only a brief summary of the subject matter, current as of the last revision date. It is not intended to be relied upon as the full and complete text. Please refer to the applicable forms, instructions, rules and to the laws cited below to determine how this information applies to specific persons or situations.
CH 350, Laws of 1993 enacted the Business Enterprise Tax, RSA 77-E, effective 7/1/93. Current Due Date: Return due dates are consistent with federal income tax due dates based on the taxpayer's entity type.
59 2017 Deparment of Revenue Administration Annual Report
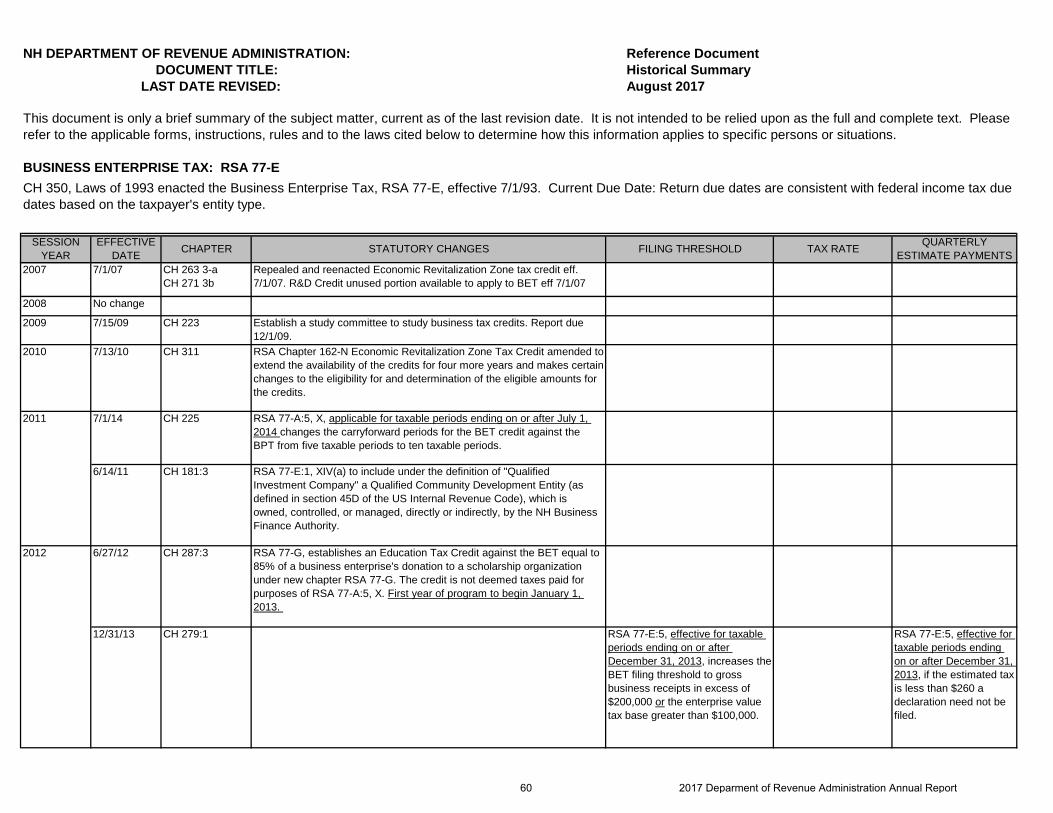
NH DEPARTMENT OF REVENUE ADMINISTRATION: Reference Document DOCUMENT TITLE: Historical Summary LAST DATE REVISED: August 2017
BUSINESS ENTERPRISE TAX: RSA 77-E
SESSION YEAR
EFFECTIVE DATE CHAPTER STATUTORY CHANGES FILING THRESHOLD TAX RATE QUARTERLY
ESTIMATE PAYMENTS
This document is only a brief summary of the subject matter, current as of the last revision date. It is not intended to be relied upon as the full and complete text. Please refer to the applicable forms, instructions, rules and to the laws cited below to determine how this information applies to specific persons or situations.
CH 350, Laws of 1993 enacted the Business Enterprise Tax, RSA 77-E, effective 7/1/93. Current Due Date: Return due dates are consistent with federal income tax due dates based on the taxpayer's entity type.
2007 7/1/07 CH 263 3-a CH 271 3b
Repealed and reenacted Economic Revitalization Zone tax credit eff. 7/1/07. R&D Credit unused portion available to apply to BET eff 7/1/07
2008 No change
2009 7/15/09 CH 223 Establish a study committee to study business tax credits. Report due 12/1/09.
2010 7/13/10 CH 311 RSA Chapter 162-N Economic Revitalization Zone Tax Credit amended to extend the availability of the credits for four more years and makes certain changes to the eligibility for and determination of the eligible amounts for the credits.
7/1/14 CH 225 RSA 77-A:5, X, applicable for taxable periods ending on or after July 1, 2014 changes the carryforward periods for the BET credit against the BPT from five taxable periods to ten taxable periods.
6/14/11 CH 181:3 RSA 77-E:1, XIV(a) to include under the definition of "Qualified Investment Company" a Qualified Community Development Entity (as defined in section 45D of the US Internal Revenue Code), which is owned, controlled, or managed, directly or indirectly, by the NH Business Finance Authority.
6/27/12 CH 287:3 RSA 77-G, establishes an Education Tax Credit against the BET equal to 85% of a business enterprise's donation to a scholarship organization under new chapter RSA 77-G. The credit is not deemed taxes paid for purposes of RSA 77-A:5, X. First year of program to begin January 1, 2013.
12/31/13 CH 279:1 RSA 77-E:5, effective for taxable periods ending on or after December 31, 2013, increases the BET filing threshold to gross business receipts in excess of $200,000 or the enterprise value tax base greater than $100,000.
RSA 77-E:5, effective for taxable periods ending on or after December 31, 2013, if the estimated tax is less than $260 a declaration need not be filed.
2011
2012
60 2017 Deparment of Revenue Administration Annual Report
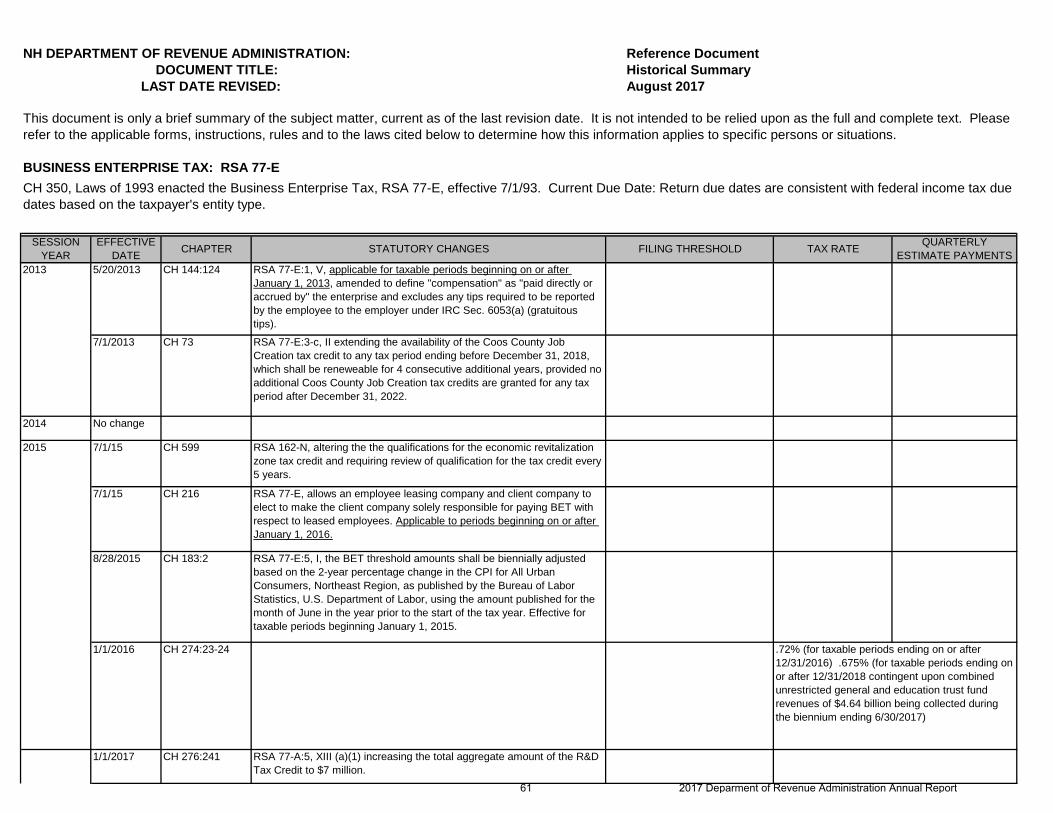
NH DEPARTMENT OF REVENUE ADMINISTRATION: Reference Document DOCUMENT TITLE: Historical Summary LAST DATE REVISED: August 2017
BUSINESS ENTERPRISE TAX: RSA 77-E
SESSION YEAR
EFFECTIVE DATE CHAPTER STATUTORY CHANGES FILING THRESHOLD TAX RATE QUARTERLY
ESTIMATE PAYMENTS
This document is only a brief summary of the subject matter, current as of the last revision date. It is not intended to be relied upon as the full and complete text. Please refer to the applicable forms, instructions, rules and to the laws cited below to determine how this information applies to specific persons or situations.
CH 350, Laws of 1993 enacted the Business Enterprise Tax, RSA 77-E, effective 7/1/93. Current Due Date: Return due dates are consistent with federal income tax due dates based on the taxpayer's entity type.
5/20/2013 CH 144:124 RSA 77-E:1, V, applicable for taxable periods beginning on or after January 1, 2013, amended to define "compensation" as "paid directly or accrued by" the enterprise and excludes any tips required to be reported by the employee to the employer under IRC Sec. 6053(a) (gratuitous tips).
7/1/2013 CH 73 RSA 77-E:3-c, II extending the availability of the Coos County Job Creation tax credit to any tax period ending before December 31, 2018, which shall be reneweable for 4 consecutive additional years, provided no additional Coos County Job Creation tax credits are granted for any tax period after December 31, 2022.
2014 No change
2015 7/1/15 CH 599 RSA 162-N, altering the the qualifications for the economic revitalization zone tax credit and requiring review of qualification for the tax credit every 5 years.
7/1/15 CH 216 RSA 77-E, allows an employee leasing company and client company to elect to make the client company solely responsible for paying BET with respect to leased employees. Applicable to periods beginning on or after January 1, 2016.
8/28/2015 CH 183:2 RSA 77-E:5, I, the BET threshold amounts shall be biennially adjusted based on the 2-year percentage change in the CPI for All Urban Consumers, Northeast Region, as published by the Bureau of Labor Statistics, U.S. Department of Labor, using the amount published for the month of June in the year prior to the start of the tax year. Effective for taxable periods beginning January 1, 2015.
1/1/2016 CH 274:23-24
1/1/2017 CH 276:241 RSA 77-A:5, XIII (a)(1) increasing the total aggregate amount of the R&D Tax Credit to $7 million.
.72% (for taxable periods ending on or after 12/31/2016) .675% (for taxable periods ending on or after 12/31/2018 contingent upon combined unrestricted general and education trust fund revenues of $4.64 billion being collected during the biennium ending 6/30/2017)
2013
61 2017 Deparment of Revenue Administration Annual Report

NH DEPARTMENT OF REVENUE ADMINISTRATION: Reference Document DOCUMENT TITLE: Historical Summary LAST DATE REVISED: August 2017
BUSINESS ENTERPRISE TAX: RSA 77-E
SESSION YEAR
EFFECTIVE DATE CHAPTER STATUTORY CHANGES FILING THRESHOLD TAX RATE QUARTERLY
ESTIMATE PAYMENTS
This document is only a brief summary of the subject matter, current as of the last revision date. It is not intended to be relied upon as the full and complete text. Please refer to the applicable forms, instructions, rules and to the laws cited below to determine how this information applies to specific persons or situations.
CH 350, Laws of 1993 enacted the Business Enterprise Tax, RSA 77-E, effective 7/1/93. Current Due Date: Return due dates are consistent with federal income tax due dates based on the taxpayer's entity type.
7/1/15 CH 276:242-243 Authorized a Tax Amnesty Program applicable to all taxes administered by the DRA running from 12/1/15-02/15/16.
2016 No change
7/1/19 CH156:214 .60% (for taxable periods ending on or after 12/31/2019)
7/1/21 CH 156:216 .50% (for taxable periods ending on or after 12/31/2021)
2017
62 2017 Deparment of Revenue Administration Annual Report

NH DEPARTMENT OF REVENUE ADMINISTRATION: Reference Document DOCUMENT TITLE: Historical Summary LAST DATE REVISED: August 2017
COMMUNICATION SERVICES TAX: RSA: 82-A
SESSION YEAR EFFECTIVE DATE CHAPTER STATUTORY CHANGES FILING THRESHOLD RATE QUARTERLY ESTIMATE PAYMENTS
1990 4/1/1990 for communication services purchased at retail on or after 3/1/90
CH 101 Communication service retailers with sales in excess of $10,000.
3% with a surtax of 66 2/3%
90% of the actual tax collections for the same calendar month of the preceding year; or 90% of the estimated tax collections for the current month.
1991 7/1/91 CH 354:13 Surcharge of 100% for the period beginning 7/1/91 and ending 6/30/93
1993 7/1/93 CH 350:37 5.5% for the period beginning 7/1/93 and ending 6/30/95
1995 7/1/01 CH 96:2 5.5% for the period beginning 7/1/95 and ending 6/30/97
7/1/97 CH 130:2 5.5% for the biennium ending 6/30/99
CH 351:35 Amended the RSA 82-A:2, V (f) exemption for charges paid by coin-operated phones. Repealed RSA 82-A:2 V (g) relative to the exemption from the CST tax for changes paid by coin-operated phones.
CH 351:36 CH 351:37
Amended RSA 82-A:4-a requiring that tax on coin-operated telephone service may be computed to the nearness multiple of $.05 except that, where the tax is midway.
2001 7/1/01 CH 158 Tax shall be 7% for period beginning 7/1/01 and ending 6/30/03
2002 7/1/02 CH 219 Amendment to RSA 82-A:1 imposes tax to source mobile telecommunications services determined under P.L. 106-252 to be the place of primary use.
This document is only a brief summary of the subject matter, current as of the last revision date. It is not intended to be relied upon as the full and complete text. Please refer to the applicable forms, instructions, rules and to the laws cited below to determine how this information applies to specific persons or situations.
CH 9, Laws of 1990 repealed RSA 82 and enacted RSA 82-A, effective 4/1/90, the Communications Services Tax. All real estate not taxed by RSA 82-A can be taxed at the local level. Current Due Date: The 15th day of each month covering the prior month's sales.
1997
63 2017 Deparment of Revenue Administration Annual Report
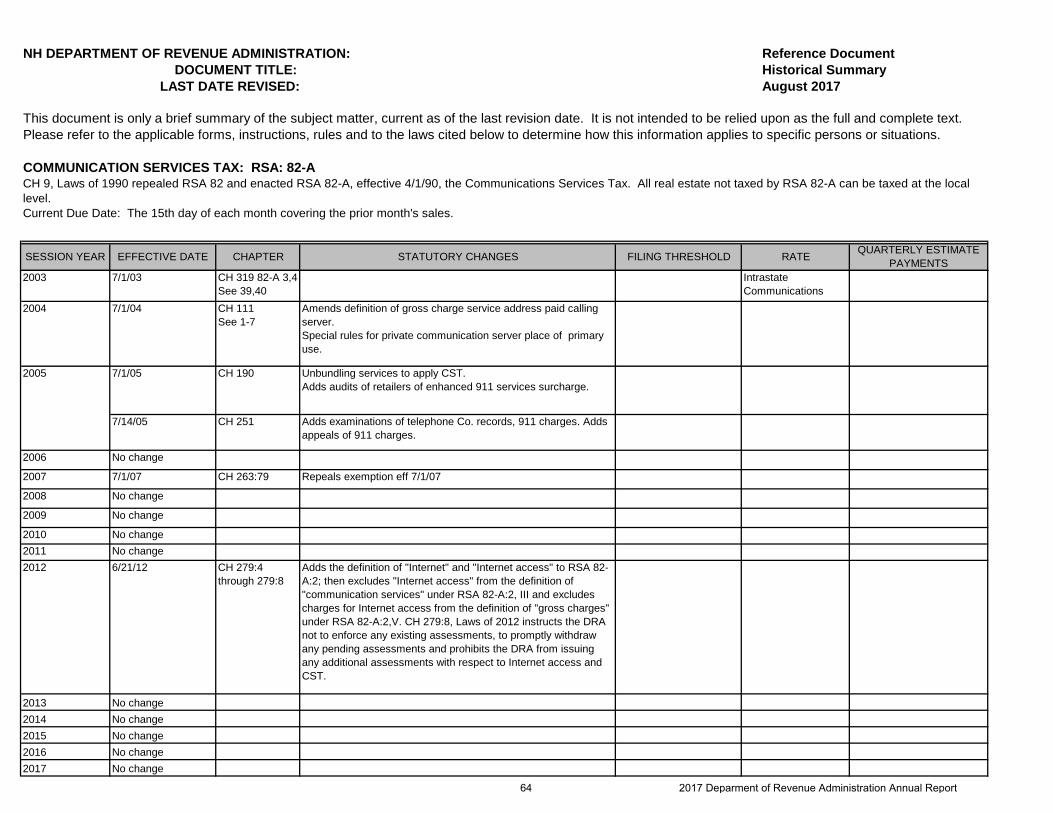
NH DEPARTMENT OF REVENUE ADMINISTRATION: Reference Document DOCUMENT TITLE: Historical Summary LAST DATE REVISED: August 2017
COMMUNICATION SERVICES TAX: RSA: 82-A
SESSION YEAR EFFECTIVE DATE CHAPTER STATUTORY CHANGES FILING THRESHOLD RATE QUARTERLY ESTIMATE PAYMENTS
This document is only a brief summary of the subject matter, current as of the last revision date. It is not intended to be relied upon as the full and complete text. Please refer to the applicable forms, instructions, rules and to the laws cited below to determine how this information applies to specific persons or situations.
CH 9, Laws of 1990 repealed RSA 82 and enacted RSA 82-A, effective 4/1/90, the Communications Services Tax. All real estate not taxed by RSA 82-A can be taxed at the local level. Current Due Date: The 15th day of each month covering the prior month's sales.
2003 7/1/03 CH 319 82-A 3,4 See 39,40
Intrastate Communications S i T 7% 2004 7/1/04 CH 111
See 1-7Amends definition of gross charge service address paid calling server. Special rules for private communication server place of primary use.
7/1/05 CH 190 Unbundling services to apply CST. Adds audits of retailers of enhanced 911 services surcharge.
7/14/05 CH 251 Adds examinations of telephone Co. records, 911 charges. Adds appeals of 911 charges.
2006 No change
2007 7/1/07 CH 263:79 Repeals exemption eff 7/1/07
2008 No change
2009 No change
2010 No change2011 No change2012 6/21/12 CH 279:4
through 279:8Adds the definition of "Internet" and "Internet access" to RSA 82-A:2; then excludes "Internet access" from the definition of "communication services" under RSA 82-A:2, III and excludes charges for Internet access from the definition of "gross charges" under RSA 82-A:2,V. CH 279:8, Laws of 2012 instructs the DRA not to enforce any existing assessments, to promptly withdraw any pending assessments and prohibits the DRA from issuing any additional assessments with respect to Internet access and CST.
2013 No change2014 No change2015 No change2016 No change2017 No change
2005
64 2017 Deparment of Revenue Administration Annual Report
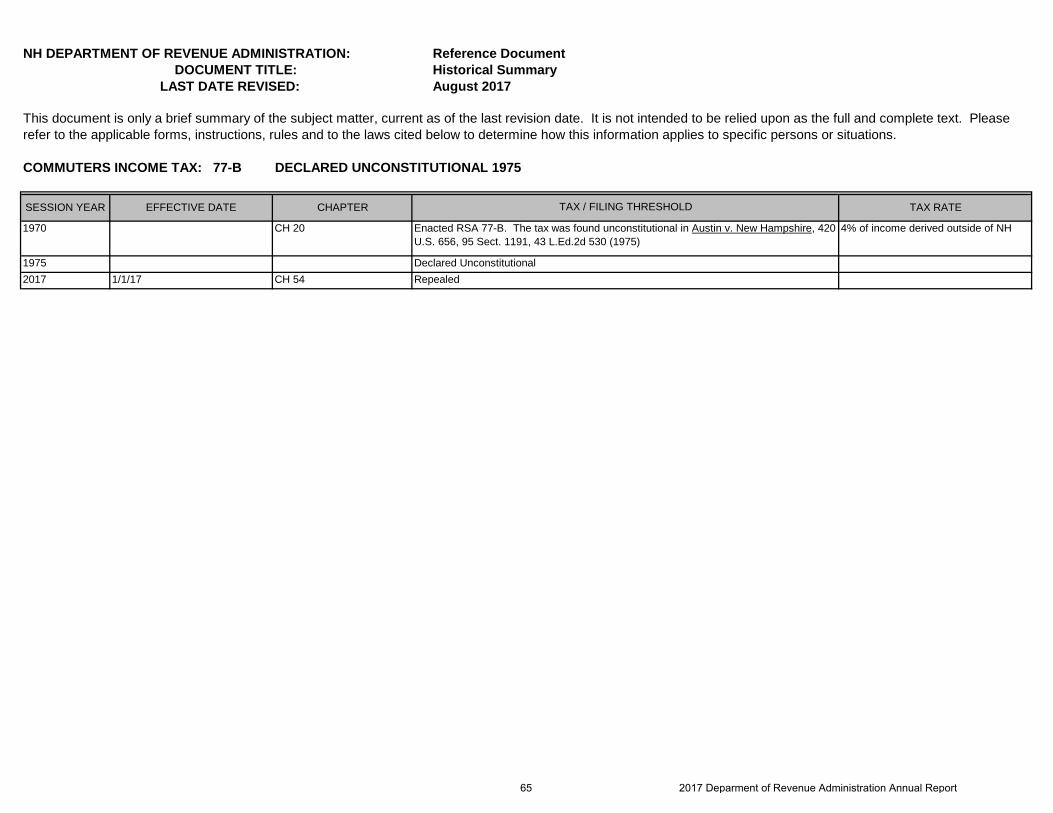
NH DEPARTMENT OF REVENUE ADMINISTRATION: Reference Document DOCUMENT TITLE: Historical Summary LAST DATE REVISED: August 2017
COMMUTERS INCOME TAX: 77-B DECLARED UNCONSTITUTIONAL 1975
SESSION YEAR EFFECTIVE DATE CHAPTER TAX RATE
1970 CH 20 4% of income derived outside of NH
19752017 1/1/17 CH 54
This document is only a brief summary of the subject matter, current as of the last revision date. It is not intended to be relied upon as the full and complete text. Please refer to the applicable forms, instructions, rules and to the laws cited below to determine how this information applies to specific persons or situations.
Enacted RSA 77-B. The tax was found unconstitutional in Austin v. New Hampshire, 420 U.S. 656, 95 Sect. 1191, 43 L.Ed.2d 530 (1975)
Declared Unconstitutional
TAX / FILING THRESHOLD
Repealed
65 2017 Deparment of Revenue Administration Annual Report
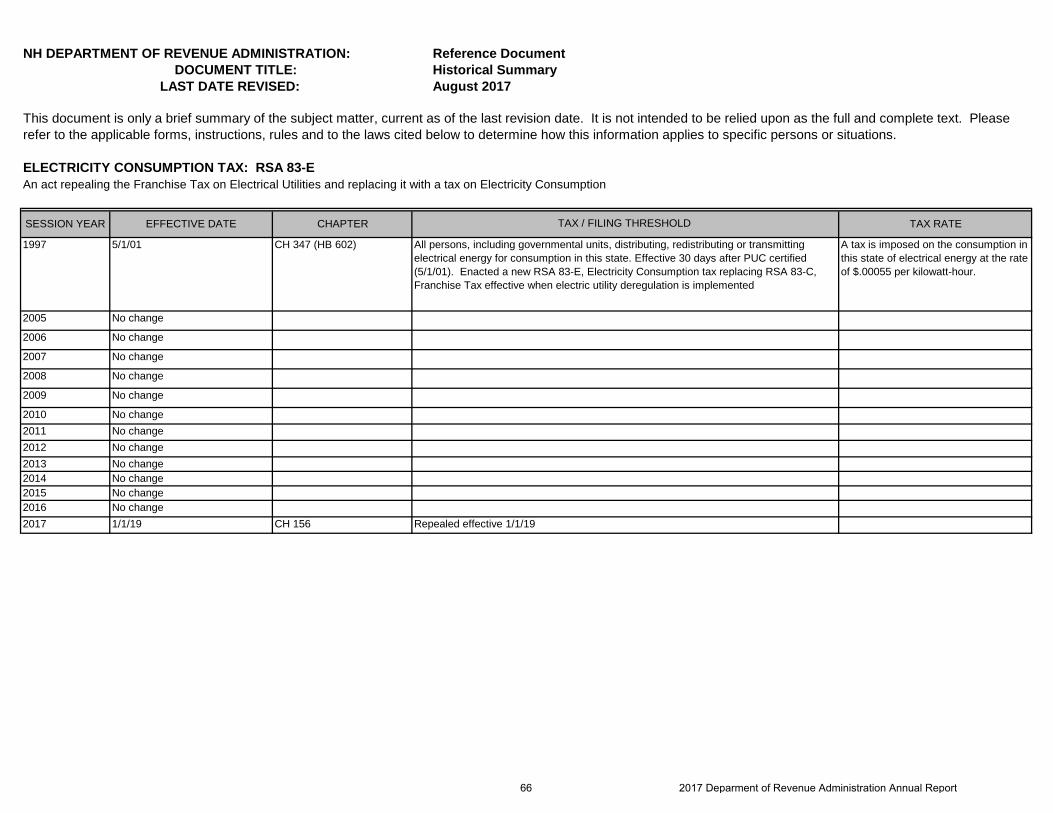
NH DEPARTMENT OF REVENUE ADMINISTRATION: Reference Document DOCUMENT TITLE: Historical Summary LAST DATE REVISED: August 2017
ELECTRICITY CONSUMPTION TAX: RSA 83-EAn act repealing the Franchise Tax on Electrical Utilities and replacing it with a tax on Electricity Consumption
SESSION YEAR EFFECTIVE DATE CHAPTER TAX RATE
1997 5/1/01 CH 347 (HB 602) A tax is imposed on the consumption in this state of electrical energy at the rate of $.00055 per kilowatt-hour.
2005 No change
2006 No change
2007 No change
2008 No change
2009 No change
2010 No change2011 No change2012 No change2013 No change2014 No change2015 No change2016 No change2017 1/1/19 CH 156 Repealed effective 1/1/19
This document is only a brief summary of the subject matter, current as of the last revision date. It is not intended to be relied upon as the full and complete text. Please refer to the applicable forms, instructions, rules and to the laws cited below to determine how this information applies to specific persons or situations.
All persons, including governmental units, distributing, redistributing or transmitting electrical energy for consumption in this state. Effective 30 days after PUC certified (5/1/01). Enacted a new RSA 83-E, Electricity Consumption tax replacing RSA 83-C, Franchise Tax effective when electric utility deregulation is implemented
TAX / FILING THRESHOLD
66 2017 Deparment of Revenue Administration Annual Report
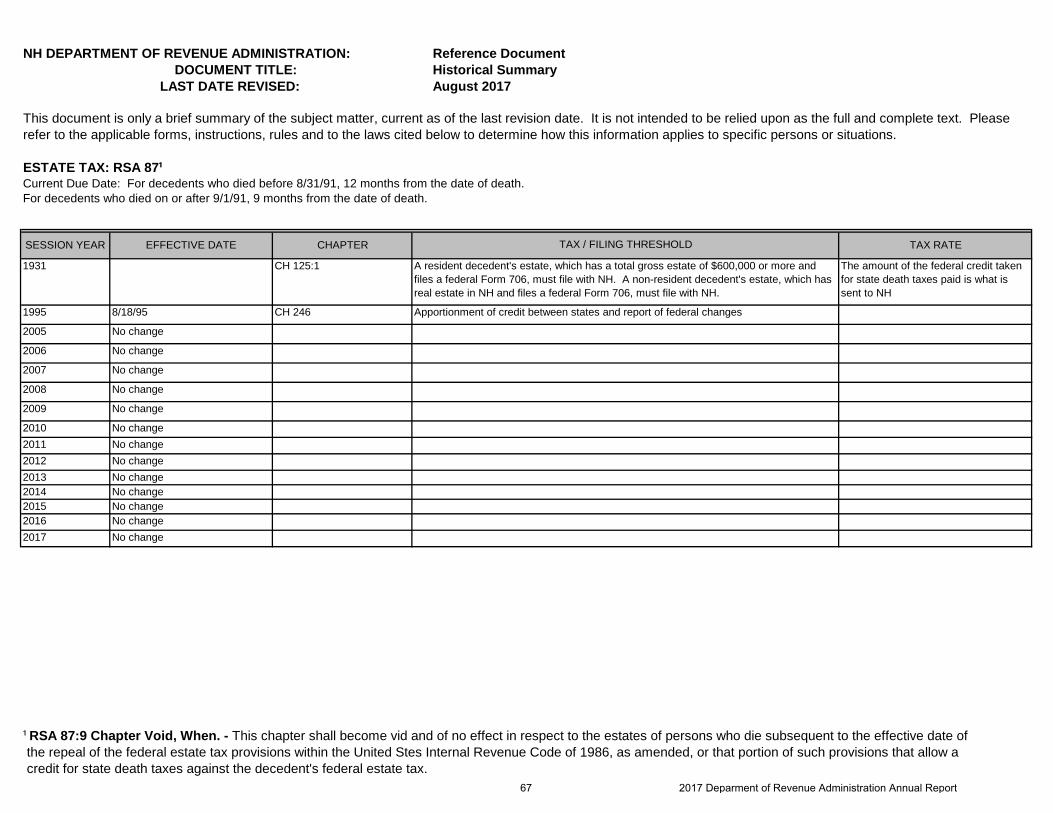
NH DEPARTMENT OF REVENUE ADMINISTRATION: Reference Document DOCUMENT TITLE: Historical Summary LAST DATE REVISED: August 2017
ESTATE TAX: RSA 87¹
SESSION YEAR EFFECTIVE DATE CHAPTER TAX RATE
1931 CH 125:1 The amount of the federal credit taken for state death taxes paid is what is sent to NH
1995 8/18/95 CH 246
2005 No change
2006 No change
2007 No change
2008 No change
2009 No change
2010 No change2011 No change2012 No change2013 No change2014 No change2015 No change2016 No change2017 No change
¹ RSA 87:9 Chapter Void, When. - This chapter shall become vid and of no effect in respect to the estates of persons who die subsequent to the effective date of the repeal of the federal estate tax provisions within the United Stes Internal Revenue Code of 1986, as amended, or that portion of such provisions that allow a credit for state death taxes against the decedent's federal estate tax.
This document is only a brief summary of the subject matter, current as of the last revision date. It is not intended to be relied upon as the full and complete text. Please refer to the applicable forms, instructions, rules and to the laws cited below to determine how this information applies to specific persons or situations.
A resident decedent's estate, which has a total gross estate of $600,000 or more and files a federal Form 706, must file with NH. A non-resident decedent's estate, which has real estate in NH and files a federal Form 706, must file with NH.
Current Due Date: For decedents who died before 8/31/91, 12 months from the date of death. For decedents who died on or after 9/1/91, 9 months from the date of death.
Apportionment of credit between states and report of federal changes
TAX / FILING THRESHOLD
67 2017 Deparment of Revenue Administration Annual Report
NH DEPARTMENT OF REVENUE ADMINISTRATION: Reference Document DOCUMENT TITLE: Historical Summary LAST DATE REVISED: August 2017
This document is only a brief summary of the subject matter, current as of the last revision date. It is not intended to be relied upon as the full and complete text. Please refer to the applicable forms, instructions, rules and to the laws cited below to determine how this information applies to specific persons or situations. Source. 1931, 125:1, RL 88:9. 1995, 246:3, eff. Aug. 18, 1995.
68 2017 Deparment of Revenue Administration Annual Report
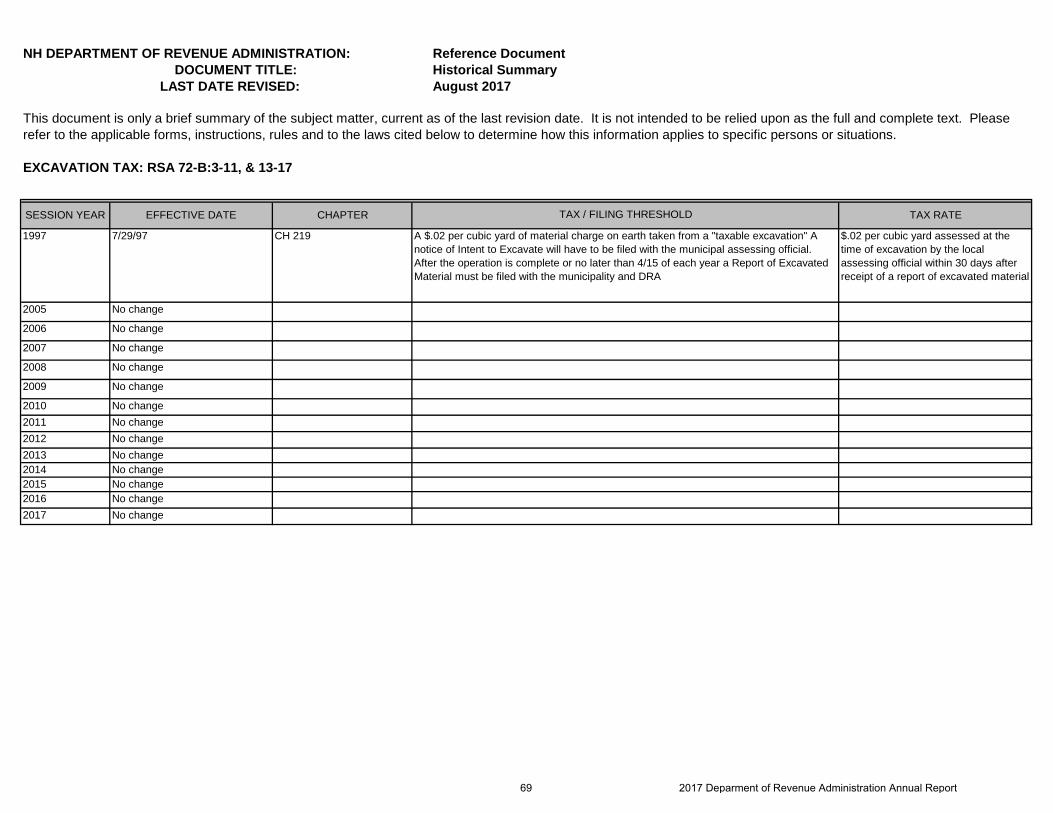
NH DEPARTMENT OF REVENUE ADMINISTRATION: Reference Document DOCUMENT TITLE: Historical Summary LAST DATE REVISED: August 2017
EXCAVATION TAX: RSA 72-B:3-11, & 13-17
SESSION YEAR EFFECTIVE DATE CHAPTER TAX RATE
1997 7/29/97 CH 219 $.02 per cubic yard assessed at the time of excavation by the local assessing official within 30 days after receipt of a report of excavated material
2005 No change
2006 No change
2007 No change
2008 No change
2009 No change
2010 No change2011 No change2012 No change2013 No change2014 No change2015 No change2016 No change2017 No change
This document is only a brief summary of the subject matter, current as of the last revision date. It is not intended to be relied upon as the full and complete text. Please refer to the applicable forms, instructions, rules and to the laws cited below to determine how this information applies to specific persons or situations.
A $.02 per cubic yard of material charge on earth taken from a "taxable excavation" A notice of Intent to Excavate will have to be filed with the municipal assessing official. After the operation is complete or no later than 4/15 of each year a Report of Excavated Material must be filed with the municipality and DRA
TAX / FILING THRESHOLD
69 2017 Deparment of Revenue Administration Annual Report
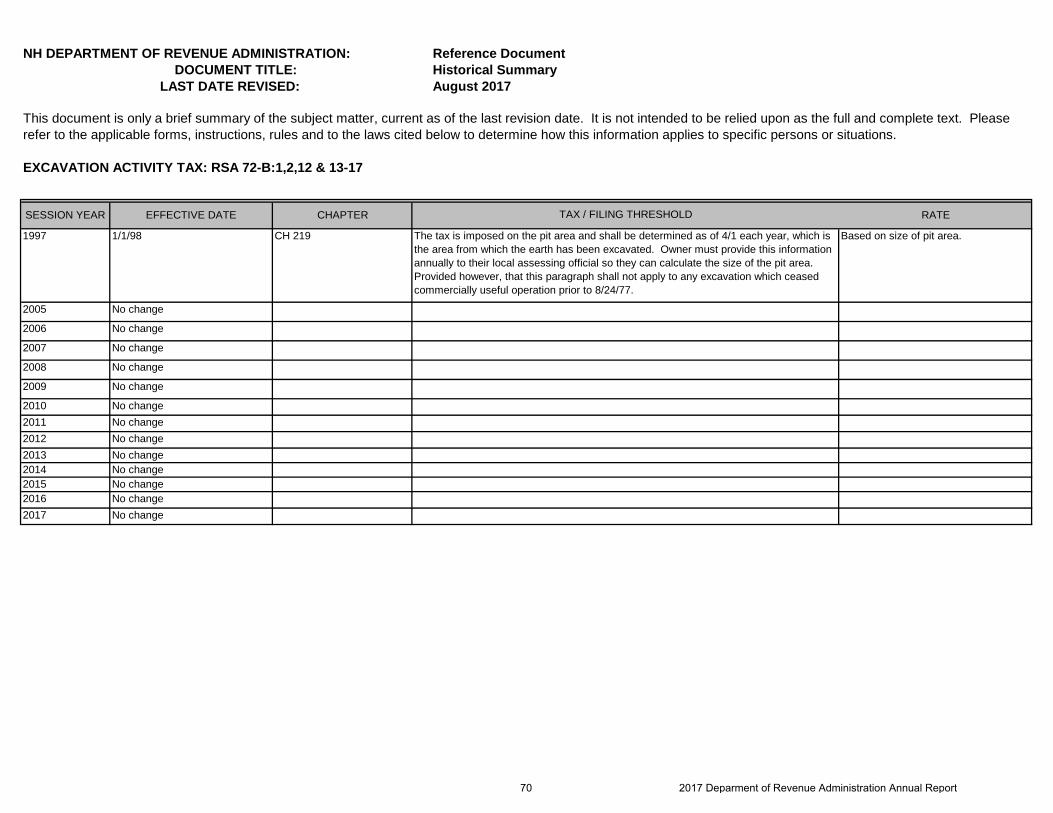
NH DEPARTMENT OF REVENUE ADMINISTRATION: Reference Document DOCUMENT TITLE: Historical Summary LAST DATE REVISED: August 2017
EXCAVATION ACTIVITY TAX: RSA 72-B:1,2,12 & 13-17
SESSION YEAR EFFECTIVE DATE CHAPTER RATE
1997 1/1/98 CH 219 Based on size of pit area.
2005 No change
2006 No change
2007 No change
2008 No change
2009 No change
2010 No change2011 No change2012 No change2013 No change2014 No change2015 No change2016 No change2017 No change
This document is only a brief summary of the subject matter, current as of the last revision date. It is not intended to be relied upon as the full and complete text. Please refer to the applicable forms, instructions, rules and to the laws cited below to determine how this information applies to specific persons or situations.
The tax is imposed on the pit area and shall be determined as of 4/1 each year, which is the area from which the earth has been excavated. Owner must provide this information annually to their local assessing official so they can calculate the size of the pit area. Provided however, that this paragraph shall not apply to any excavation which ceased commercially useful operation prior to 8/24/77.
TAX / FILING THRESHOLD
70 2017 Deparment of Revenue Administration Annual Report
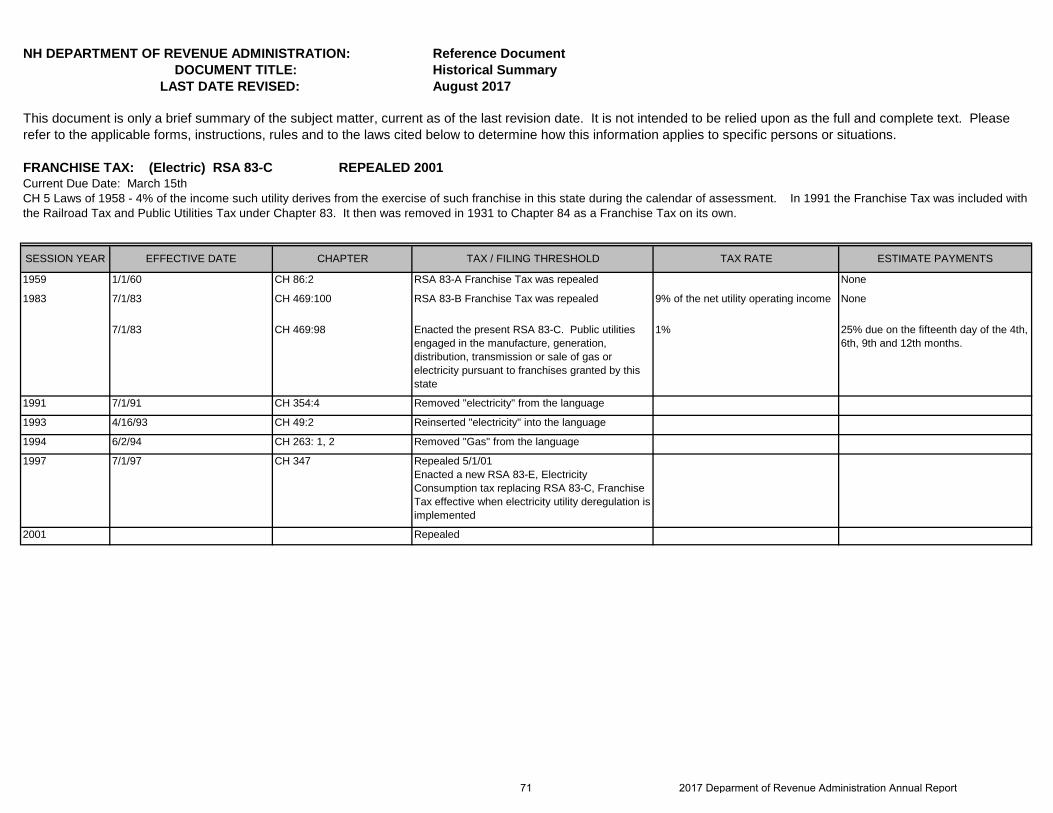
NH DEPARTMENT OF REVENUE ADMINISTRATION: Reference Document DOCUMENT TITLE: Historical Summary LAST DATE REVISED: August 2017
FRANCHISE TAX: (Electric) RSA 83-C REPEALED 2001
SESSION YEAR EFFECTIVE DATE CHAPTER TAX / FILING THRESHOLD TAX RATE ESTIMATE PAYMENTS
1959 1/1/60 CH 86:2 RSA 83-A Franchise Tax was repealed None
1983 7/1/83 CH 469:100 RSA 83-B Franchise Tax was repealed 9% of the net utility operating income None
7/1/83 CH 469:98 Enacted the present RSA 83-C. Public utilities engaged in the manufacture, generation, distribution, transmission or sale of gas or electricity pursuant to franchises granted by this state
1% 25% due on the fifteenth day of the 4th, 6th, 9th and 12th months.
1991 7/1/91 CH 354:4 Removed "electricity" from the language
1993 4/16/93 CH 49:2 Reinserted "electricity" into the language
1994 6/2/94 CH 263: 1, 2 Removed "Gas" from the language
1997 7/1/97 CH 347 Repealed 5/1/01 Enacted a new RSA 83-E, Electricity Consumption tax replacing RSA 83-C, Franchise Tax effective when electricity utility deregulation is implemented
2001 Repealed
This document is only a brief summary of the subject matter, current as of the last revision date. It is not intended to be relied upon as the full and complete text. Please refer to the applicable forms, instructions, rules and to the laws cited below to determine how this information applies to specific persons or situations.
Current Due Date: March 15th CH 5 Laws of 1958 - 4% of the income such utility derives from the exercise of such franchise in this state during the calendar of assessment. In 1991 the Franchise Tax was included with the Railroad Tax and Public Utilities Tax under Chapter 83. It then was removed in 1931 to Chapter 84 as a Franchise Tax on its own.
71 2017 Deparment of Revenue Administration Annual Report
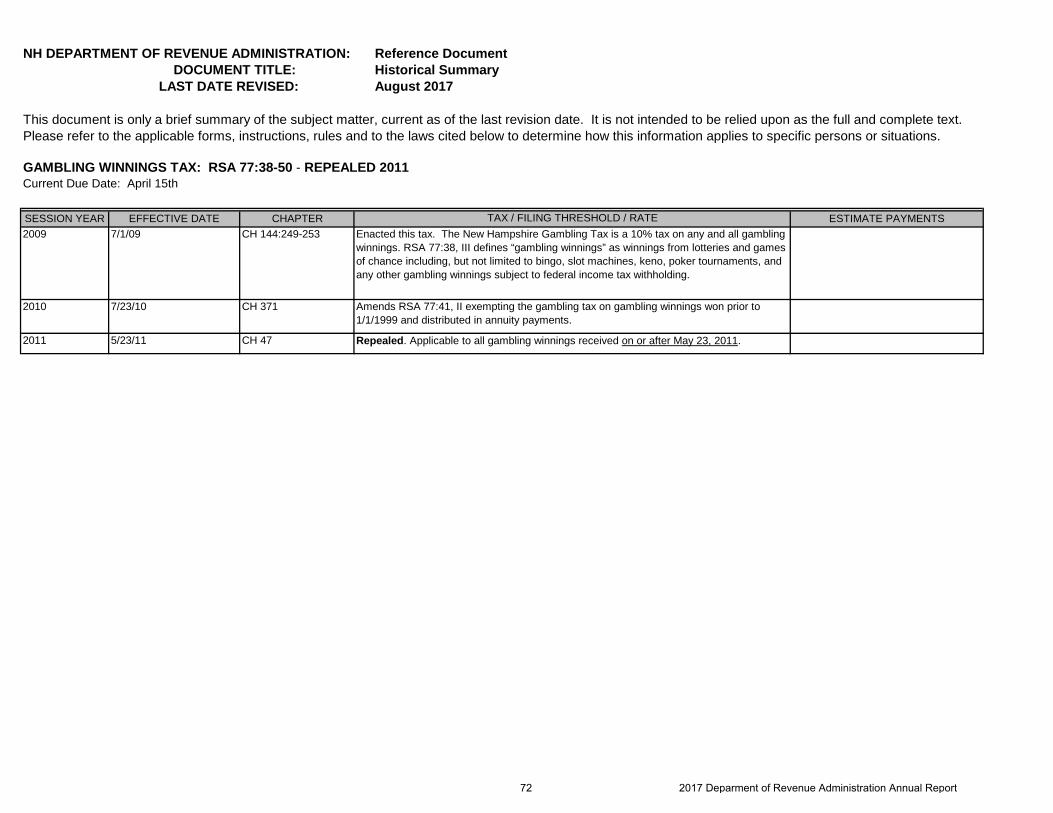
NH DEPARTMENT OF REVENUE ADMINISTRATION: Reference Document DOCUMENT TITLE: Historical Summary LAST DATE REVISED: August 2017
GAMBLING WINNINGS TAX: RSA 77:38-50 - REPEALED 2011
SESSION YEAR EFFECTIVE DATE CHAPTER ESTIMATE PAYMENTS2009 7/1/09 CH 144:249-253
2010 7/23/10 CH 371
2011 5/23/11 CH 47 Repealed. Applicable to all gambling winnings received on or after May 23, 2011.
Enacted this tax. The New Hampshire Gambling Tax is a 10% tax on any and all gambling winnings. RSA 77:38, III defines “gambling winnings” as winnings from lotteries and games of chance including, but not limited to bingo, slot machines, keno, poker tournaments, and any other gambling winnings subject to federal income tax withholding.
Amends RSA 77:41, II exempting the gambling tax on gambling winnings won prior to 1/1/1999 and distributed in annuity payments.
This document is only a brief summary of the subject matter, current as of the last revision date. It is not intended to be relied upon as the full and complete text. Please refer to the applicable forms, instructions, rules and to the laws cited below to determine how this information applies to specific persons or situations.
Current Due Date: April 15th
TAX / FILING THRESHOLD / RATE
72 2017 Deparment of Revenue Administration Annual Report
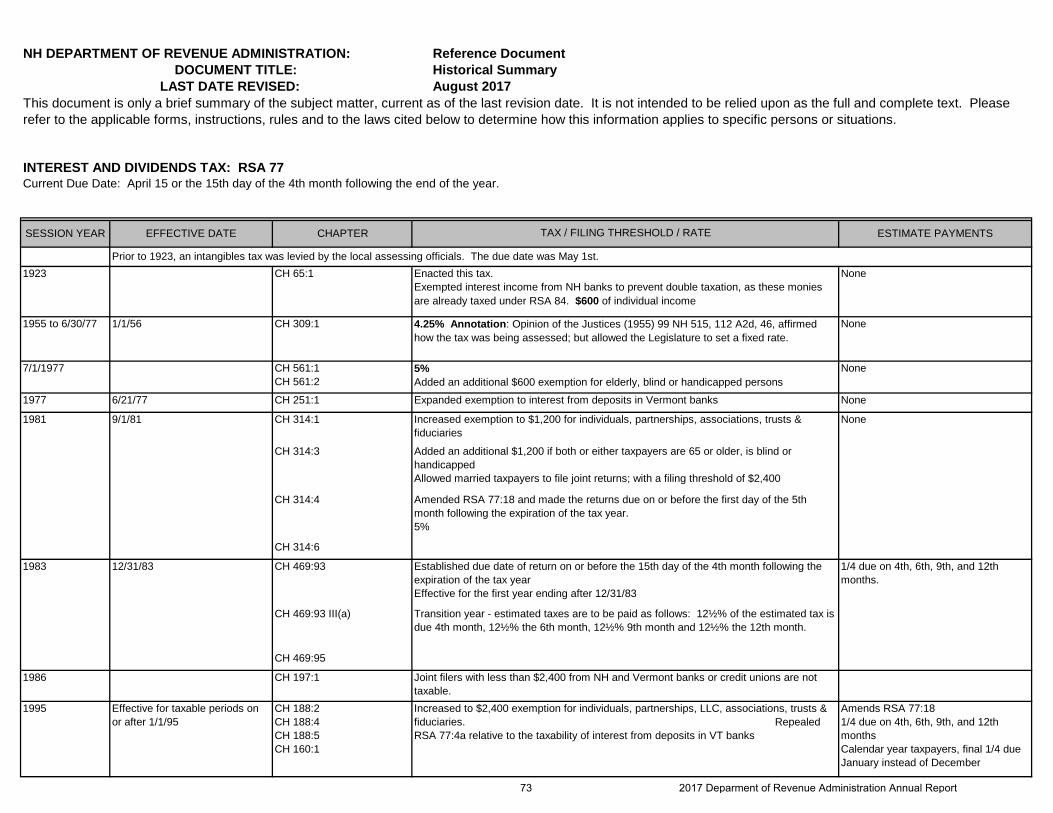
NH DEPARTMENT OF REVENUE ADMINISTRATION: Reference Document DOCUMENT TITLE: Historical Summary LAST DATE REVISED: August 2017
INTEREST AND DIVIDENDS TAX: RSA 77
SESSION YEAR EFFECTIVE DATE CHAPTER ESTIMATE PAYMENTS
1923 CH 65:1 None
1955 to 6/30/77 1/1/56 CH 309:1 None
7/1/1977 CH 561:1 CH 561:2
None
1977 6/21/77 CH 251:1 None
1981 9/1/81 CH 314:1 None
CH 314:3
CH 314:4
CH 314:6
1983 12/31/83 CH 469:93 1/4 due on 4th, 6th, 9th, and 12th months.
CH 469:93 III(a)
CH 469:95
1986 CH 197:1
1995 Effective for taxable periods on or after 1/1/95
CH 188:2 CH 188:4 CH 188:5 CH 160:1
Amends RSA 77:18 1/4 due on 4th, 6th, 9th, and 12th months Calendar year taxpayers, final 1/4 due January instead of December
Transition year - estimated taxes are to be paid as follows: 12½% of the estimated tax is due 4th month, 12½% the 6th month, 12½% 9th month and 12½% the 12th month.
Joint filers with less than $2,400 from NH and Vermont banks or credit unions are not taxable.Increased to $2,400 exemption for individuals, partnerships, LLC, associations, trusts & fiduciaries. Repealed RSA 77:4a relative to the taxability of interest from deposits in VT banks
This document is only a brief summary of the subject matter, current as of the last revision date. It is not intended to be relied upon as the full and complete text. Please refer to the applicable forms, instructions, rules and to the laws cited below to determine how this information applies to specific persons or situations.
Established due date of return on or before the 15th day of the 4th month following the expiration of the tax year Effective for the first year ending after 12/31/83
4.25% Annotation: Opinion of the Justices (1955) 99 NH 515, 112 A2d, 46, affirmed how the tax was being assessed; but allowed the Legislature to set a fixed rate.
5% Added an additional $600 exemption for elderly, blind or handicapped personsExpanded exemption to interest from deposits in Vermont banks
Increased exemption to $1,200 for individuals, partnerships, associations, trusts & fiduciaries
Added an additional $1,200 if both or either taxpayers are 65 or older, is blind or handicapped Allowed married taxpayers to file joint returns; with a filing threshold of $2,400
Amended RSA 77:18 and made the returns due on or before the first day of the 5th month following the expiration of the tax year. 5%
Prior to 1923, an intangibles tax was levied by the local assessing officials. The due date was May 1st.
Current Due Date: April 15 or the 15th day of the 4th month following the end of the year.
TAX / FILING THRESHOLD / RATE
Enacted this tax. Exempted interest income from NH banks to prevent double taxation, as these monies are already taxed under RSA 84. $600 of individual income
73 2017 Deparment of Revenue Administration Annual Report
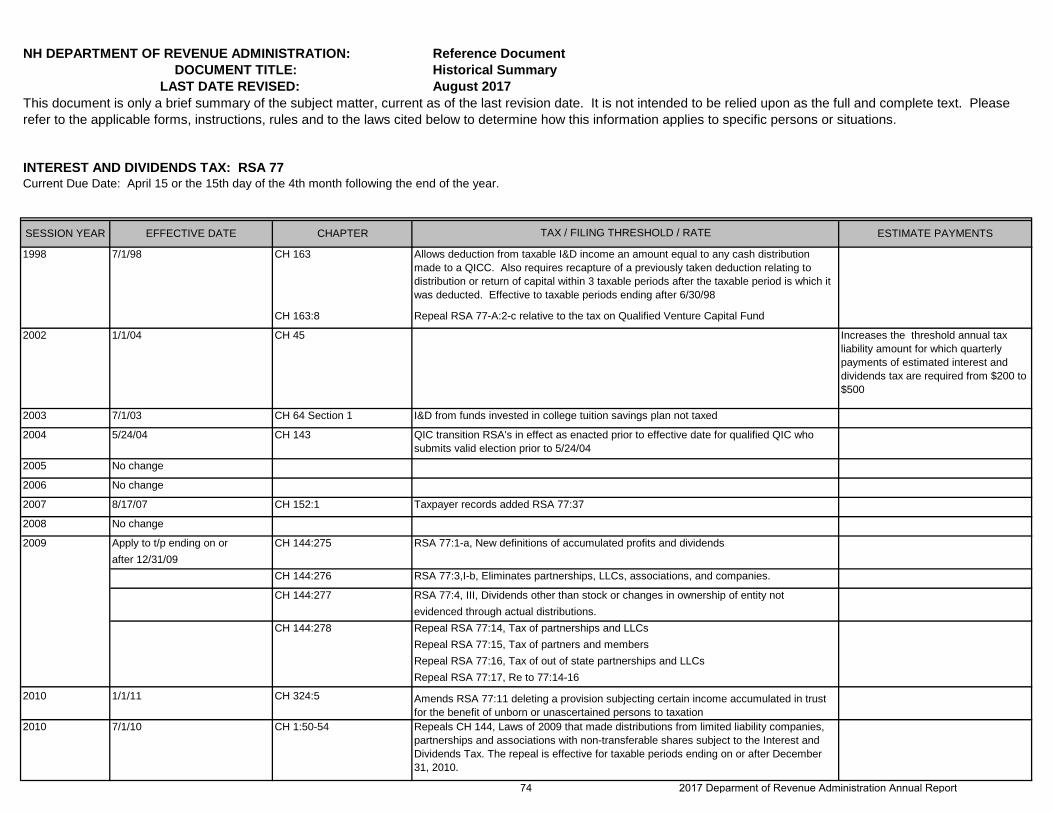
NH DEPARTMENT OF REVENUE ADMINISTRATION: Reference Document DOCUMENT TITLE: Historical Summary LAST DATE REVISED: August 2017
INTEREST AND DIVIDENDS TAX: RSA 77
SESSION YEAR EFFECTIVE DATE CHAPTER ESTIMATE PAYMENTS
This document is only a brief summary of the subject matter, current as of the last revision date. It is not intended to be relied upon as the full and complete text. Please refer to the applicable forms, instructions, rules and to the laws cited below to determine how this information applies to specific persons or situations.
Current Due Date: April 15 or the 15th day of the 4th month following the end of the year.
TAX / FILING THRESHOLD / RATE
1998 7/1/98 CH 163
CH 163:8
2002 1/1/04 CH 45 Increases the threshold annual tax liability amount for which quarterly payments of estimated interest and dividends tax are required from $200 to $500
2003 7/1/03 CH 64 Section 1
2004 5/24/04 CH 143
2005 No change
2006 No change
2007 8/17/07 CH 152:1
2008 No change
Apply to t/p ending on or CH 144:275 RSA 77:1-a, New definitions of accumulated profits and dividendsafter 12/31/09
CH 144:276 RSA 77:3,I-b, Eliminates partnerships, LLCs, associations, and companies.
CH 144:277 RSA 77:4, III, Dividends other than stock or changes in ownership of entity not
CH 144:278 Repeal RSA 77:14, Tax of partnerships and LLCsRepeal RSA 77:15, Tax of partners and membersRepeal RSA 77:16, Tax of out of state partnerships and LLCs
2010 1/1/11 CH 324:5
2010 7/1/10 CH 1:50-54
2009
Allows deduction from taxable I&D income an amount equal to any cash distribution made to a QICC. Also requires recapture of a previously taken deduction relating to distribution or return of capital within 3 taxable periods after the taxable period is which it was deducted. Effective to taxable periods ending after 6/30/98
QIC transition RSA's in effect as enacted prior to effective date for qualified QIC who submits valid election prior to 5/24/04
Repeal RSA 77-A:2-c relative to the tax on Qualified Venture Capital Fund
I&D from funds invested in college tuition savings plan not taxed
Repeals CH 144, Laws of 2009 that made distributions from limited liability companies, partnerships and associations with non-transferable shares subject to the Interest and Dividends Tax. The repeal is effective for taxable periods ending on or after December 31, 2010.
Taxpayer records added RSA 77:37
evidenced through actual distributions.
Repeal RSA 77:17, Re to 77:14-16
Amends RSA 77:11 deleting a provision subjecting certain income accumulated in trust for the benefit of unborn or unascertained persons to taxation
74 2017 Deparment of Revenue Administration Annual Report
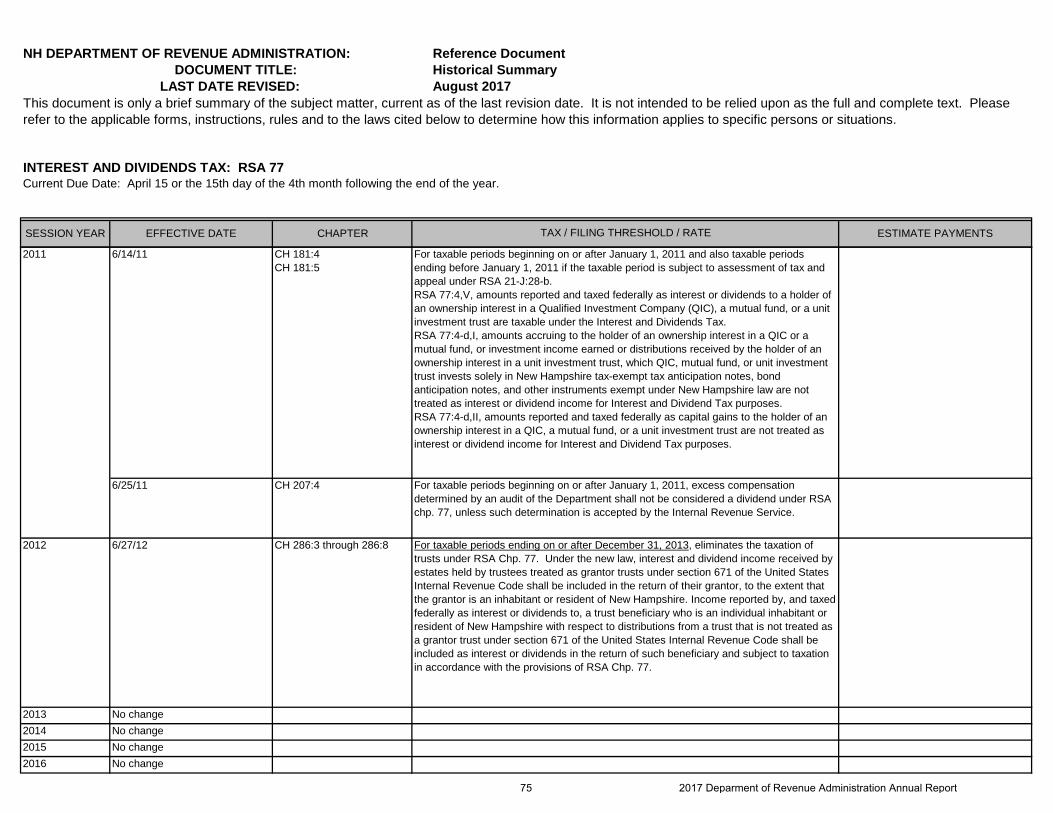
NH DEPARTMENT OF REVENUE ADMINISTRATION: Reference Document DOCUMENT TITLE: Historical Summary LAST DATE REVISED: August 2017
INTEREST AND DIVIDENDS TAX: RSA 77
SESSION YEAR EFFECTIVE DATE CHAPTER ESTIMATE PAYMENTS
This document is only a brief summary of the subject matter, current as of the last revision date. It is not intended to be relied upon as the full and complete text. Please refer to the applicable forms, instructions, rules and to the laws cited below to determine how this information applies to specific persons or situations.
Current Due Date: April 15 or the 15th day of the 4th month following the end of the year.
TAX / FILING THRESHOLD / RATE
6/14/11 CH 181:4 CH 181:5
6/25/11 CH 207:4
2012 6/27/12 CH 286:3 through 286:8
2013 No change2014 No change2015 No change2016 No change
2011
For taxable periods ending on or after December 31, 2013, eliminates the taxation of trusts under RSA Chp. 77. Under the new law, interest and dividend income received by estates held by trustees treated as grantor trusts under section 671 of the United States Internal Revenue Code shall be included in the return of their grantor, to the extent that the grantor is an inhabitant or resident of New Hampshire. Income reported by, and taxed federally as interest or dividends to, a trust beneficiary who is an individual inhabitant or resident of New Hampshire with respect to distributions from a trust that is not treated as a grantor trust under section 671 of the United States Internal Revenue Code shall be included as interest or dividends in the return of such beneficiary and subject to taxation in accordance with the provisions of RSA Chp. 77.
For taxable periods beginning on or after January 1, 2011 and also taxable periods ending before January 1, 2011 if the taxable period is subject to assessment of tax and appeal under RSA 21-J:28-b. RSA 77:4,V, amounts reported and taxed federally as interest or dividends to a holder of an ownership interest in a Qualified Investment Company (QIC), a mutual fund, or a unit investment trust are taxable under the Interest and Dividends Tax. RSA 77:4-d,I, amounts accruing to the holder of an ownership interest in a QIC or a mutual fund, or investment income earned or distributions received by the holder of an ownership interest in a unit investment trust, which QIC, mutual fund, or unit investment trust invests solely in New Hampshire tax-exempt tax anticipation notes, bond anticipation notes, and other instruments exempt under New Hampshire law are not treated as interest or dividend income for Interest and Dividend Tax purposes. RSA 77:4-d,II, amounts reported and taxed federally as capital gains to the holder of an ownership interest in a QIC, a mutual fund, or a unit investment trust are not treated as interest or dividend income for Interest and Dividend Tax purposes.
For taxable periods beginning on or after January 1, 2011, excess compensation determined by an audit of the Department shall not be considered a dividend under RSA chp. 77, unless such determination is accepted by the Internal Revenue Service.
75 2017 Deparment of Revenue Administration Annual Report
NH DEPARTMENT OF REVENUE ADMINISTRATION: Reference Document DOCUMENT TITLE: Historical Summary LAST DATE REVISED: August 2017
INTEREST AND DIVIDENDS TAX: RSA 77
SESSION YEAR EFFECTIVE DATE CHAPTER ESTIMATE PAYMENTS
This document is only a brief summary of the subject matter, current as of the last revision date. It is not intended to be relied upon as the full and complete text. Please refer to the applicable forms, instructions, rules and to the laws cited below to determine how this information applies to specific persons or situations.
Current Due Date: April 15 or the 15th day of the 4th month following the end of the year.
TAX / FILING THRESHOLD / RATE
2017 No change
76 2017 Deparment of Revenue Administration Annual Report

NH DEPARTMENT OF REVENUE ADMINISTRATION: Reference Document DOCUMENT TITLE: Historical Summary LAST DATE REVISED: August 2017
LEGACY & SUCCESSION TAX : RSA 86
SESSION YEAR EFFECTIVE DATE CHAPTER TAX RATE
1905 8.50%
1965 CH 65:1 Increased the rate to 10%
1970 CH 5:4 Increased the rate to 15%
1977 6/30/97 CH 467
1991 7/31/91 CH 348 Increased the rate to 18%
1991 7/2/91 CH 353:1
1995 7/1/95 CH 250:6
1995 7/1/95 CH 250
1997 7/1/97 CH 128
2001 1/1/03 CH 158
2004 1/1/05 CH 99 Section 3
2005 No change
2006 No change
2007 No change
2008 No change
2009 No change
This document is only a brief summary of the subject matter, current as of the last revision date. It is not intended to be relied upon as the full and complete text. Please refer to the applicable forms, instructions, rules and to the laws cited below to determine how this information applies to specific persons or situations.
Repeal RSA 86:6, relative to taxable property under and tax rate of the legacies and successions tax, is repealed. This act shall apply only to estates established as the result of deaths on or after January 1, 2003.
Amended 86:6 I to read: All property within the jurisdiction of the state, real or personal and any interest therein, belonging to domicilliaries of the state. Amended 86:6 II to include the decedent's share of a homestead, which for a period of one year immediately preceding the date of death of the decedent, was jointly owned and occupied as a place of residence by the decedent and by the brother or sister or both, shall be exempt from the tax if said homestead passes to or for the use of said brother or sister.
Significantly restructured how this tax is administered, resulting in extensive redesign of the tax forms
RSA 86:21 amended, effective 7/1/95 requiring executors, administrators and trustees to file an inventory with Probate and DRAClarifications on adopted or step children, allowed compensation and deductions, reports of trusts…
Current Due Date: For decedents who died before 8/31/91, 12 months from the date of death. For decedents who died on or after 9/1/91, 9 months from the date of death.
RSA 86, first enacted in 1905, as far as can be determined, it was enacted at 8½% Executors or administrators of every estate subject to tax under this chapter. A tax liability occurs when a bequest, joint transfer, or the rest and residue is granted to a taxable legatee such as, but not limited to brothers, sisters, aunts, uncles, cousins, friends and neighbors.
If a return is not filed within 9 months, penalties shall not accrue as of the date an estimated tax payment is made of a least 90% of the tax due
TAX / FILING THRESHOLD
Change reference from Natural Parent to Birth Parent
77 2017 Deparment of Revenue Administration Annual Report
NH DEPARTMENT OF REVENUE ADMINISTRATION: Reference Document DOCUMENT TITLE: Historical Summary LAST DATE REVISED: August 2017
LEGACY & SUCCESSION TAX : RSA 86
SESSION YEAR EFFECTIVE DATE CHAPTER TAX RATE
This document is only a brief summary of the subject matter, current as of the last revision date. It is not intended to be relied upon as the full and complete text. Please refer to the applicable forms, instructions, rules and to the laws cited below to determine how this information applies to specific persons or situations.
Current Due Date: For decedents who died before 8/31/91, 12 months from the date of death. For decedents who died on or after 9/1/91, 9 months from the date of death.
TAX / FILING THRESHOLD
2010 No change2011 No change2012 No change
2013 No change2014 No change2015 No change2016 No change2017 No change
78 2017 Deparment of Revenue Administration Annual Report
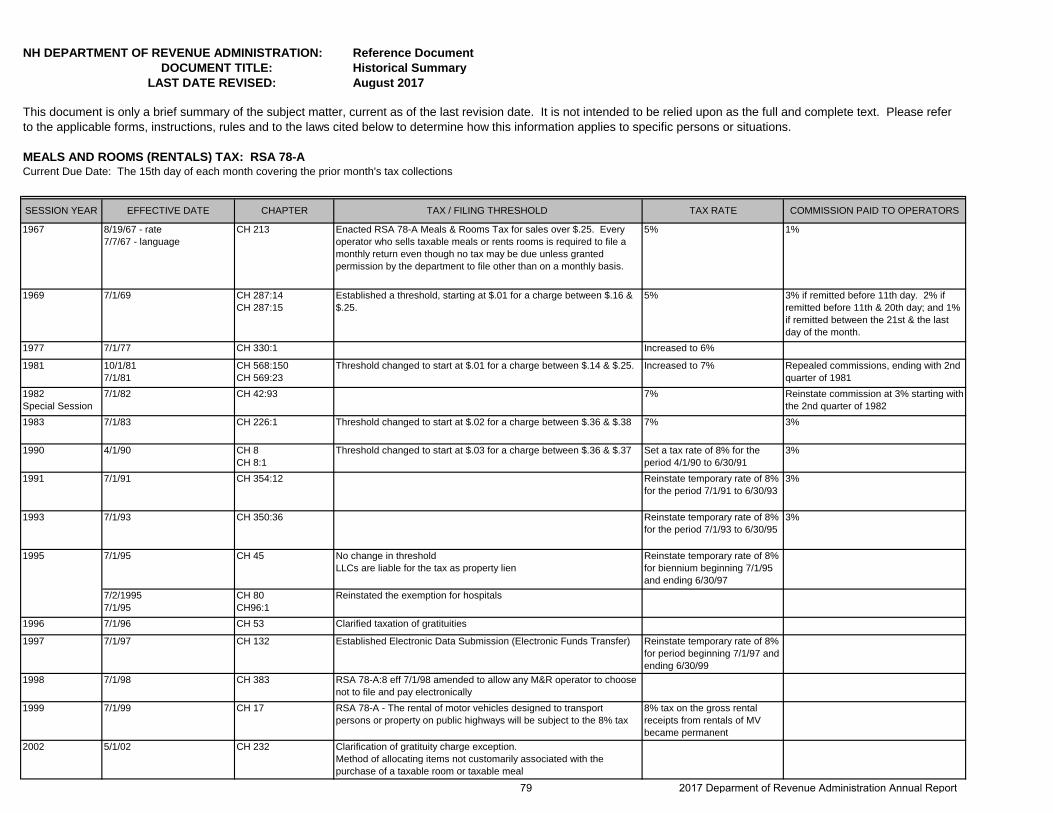
NH DEPARTMENT OF REVENUE ADMINISTRATION: Reference Document DOCUMENT TITLE: Historical Summary LAST DATE REVISED: August 2017
MEALS AND ROOMS (RENTALS) TAX: RSA 78-A
SESSION YEAR EFFECTIVE DATE CHAPTER TAX / FILING THRESHOLD TAX RATE COMMISSION PAID TO OPERATORS
1967 8/19/67 - rate 7/7/67 - language
CH 213 Enacted RSA 78-A Meals & Rooms Tax for sales over $.25. Every operator who sells taxable meals or rents rooms is required to file a monthly return even though no tax may be due unless granted permission by the department to file other than on a monthly basis.
5% 1%
1969 7/1/69 CH 287:14 CH 287:15
Established a threshold, starting at $.01 for a charge between $.16 & $.25.
5% 3% if remitted before 11th day. 2% if remitted before 11th & 20th day; and 1% if remitted between the 21st & the last day of the month.
1977 7/1/77 CH 330:1 Increased to 6%
1981 10/1/81 7/1/81
CH 568:150 CH 569:23
Threshold changed to start at $.01 for a charge between $.14 & $.25. Increased to 7% Repealed commissions, ending with 2nd quarter of 1981
1982 Special Session
7/1/82 CH 42:93 7% Reinstate commission at 3% starting with the 2nd quarter of 1982
1983 7/1/83 CH 226:1 Threshold changed to start at $.02 for a charge between $.36 & $.38 7% 3%
1990 4/1/90 CH 8 CH 8:1
Threshold changed to start at $.03 for a charge between $.36 & $.37 Set a tax rate of 8% for the period 4/1/90 to 6/30/91
3%
1991 7/1/91 CH 354:12 Reinstate temporary rate of 8% for the period 7/1/91 to 6/30/93
3%
1993 7/1/93 CH 350:36 Reinstate temporary rate of 8% for the period 7/1/93 to 6/30/95
3%
7/1/95 CH 45 No change in threshold LLCs are liable for the tax as property lien
Reinstate temporary rate of 8% for biennium beginning 7/1/95 and ending 6/30/97
7/2/1995 7/1/95
CH 80 CH96:1
Reinstated the exemption for hospitals
1996 7/1/96 CH 53 Clarified taxation of gratituities
1997 7/1/97 CH 132 Established Electronic Data Submission (Electronic Funds Transfer) Reinstate temporary rate of 8% for period beginning 7/1/97 and ending 6/30/99
1998 7/1/98 CH 383 RSA 78-A:8 eff 7/1/98 amended to allow any M&R operator to choose not to file and pay electronically
1999 7/1/99 CH 17 RSA 78-A - The rental of motor vehicles designed to transport persons or property on public highways will be subject to the 8% tax
8% tax on the gross rental receipts from rentals of MV became permanent
2002 5/1/02 CH 232 Clarification of gratituity charge exception. Method of allocating items not customarily associated with the purchase of a taxable room or taxable meal
This document is only a brief summary of the subject matter, current as of the last revision date. It is not intended to be relied upon as the full and complete text. Please refer to the applicable forms, instructions, rules and to the laws cited below to determine how this information applies to specific persons or situations.
Current Due Date: The 15th day of each month covering the prior month's tax collections
1995
79 2017 Deparment of Revenue Administration Annual Report

NH DEPARTMENT OF REVENUE ADMINISTRATION: Reference Document DOCUMENT TITLE: Historical Summary LAST DATE REVISED: August 2017
MEALS AND ROOMS (RENTALS) TAX: RSA 78-A
SESSION YEAR EFFECTIVE DATE CHAPTER TAX / FILING THRESHOLD TAX RATE COMMISSION PAID TO OPERATORS
This document is only a brief summary of the subject matter, current as of the last revision date. It is not intended to be relied upon as the full and complete text. Please refer to the applicable forms, instructions, rules and to the laws cited below to determine how this information applies to specific persons or situations.
Current Due Date: The 15th day of each month covering the prior month's tax collections
7/1/03 CH 61 CH 231
If non-profit organization, other than education institutes, selling meals requires liquor license for 3 or less days per year, meals are taxable.
CH 249 Gratituities not taxable under certain conditions
2004 7/1/04 CH 257 Reference to Office of State Planning & Energy programs name change
2005 No change
2006 No change
2007 7/1707 CH 147:1 CH 17:1
Penalty under 21:J:39 Tax in MV rentals exemption
2008 No change
7/1/09 CH 144:4 RSA 78-A:6 Increase from 8 to 9%CH 144:5 RSA 78-A:3,III, To include campsites 9%
6/30/09 CH 144:6 RSA 78-A:26 I (a), General fund 3.15% net income to DRED
6/30/09 CH 144:7 RSA 78-A:26 I (a) Special fund Receives 3.15%
7/1/09 CH 144:8 RSA-A: 26 I & II, Distribution to municipalities until 6/30/2011at no more that 2009 level
1/10/10 CH 144:269 RSA 78-A:8-b, I-a, $5000 bond to secure tax on I&P deed
1/10/10 CH 144:271 RSA 78-A:4 I, No license if unpaid taxes or filed as subterfuge.
5/3/10 CH 6 RSA 78-A:3, III eliminated the Meals and Rentals Tax on campsites1/17/10 CH 48
RSA 78-A:4, IV makes licenses, operator information displayed on licenses and license dispositions (such as issuance, renewal, suspension and revocation) public record. Amends RSA 21-J:14, IV.
5/18/10 CH 58 Repeals RSA 78-A:8-b, 1-a requiring a surety bond.8/20/10 CH 187 Repeals RSA 78-A:8-b, 1-a requiring a surety bond.
2011 7/1/11 CH 224:1,2 CH 224:316
RSA 78-A:26, for each fiscal year of the biennium ending June 30, 2013, the State Treasurer shall fund the distribution of revenue at no more than the fiscal year 2011 distribution. For the biennium ending June 30, 2013, distribution of net income pursuant to RSA 78-A:26, I(a)(2) credited to the Department of Resources and Economic Development, Division of Travel and Tourism Development is supended.RSA 78-A:4, II, repeals the $5.00 fee for a Meals & Rentals Operator’s License.
2010
2003
2009
80 2017 Deparment of Revenue Administration Annual Report
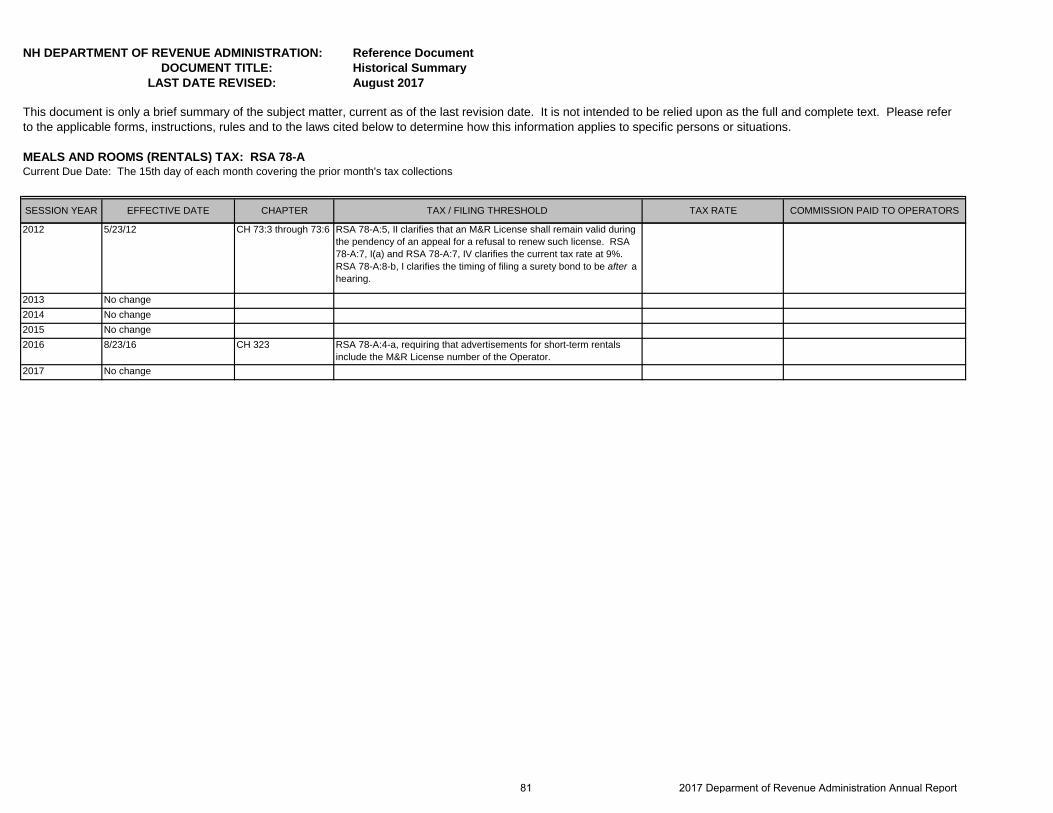
NH DEPARTMENT OF REVENUE ADMINISTRATION: Reference Document DOCUMENT TITLE: Historical Summary LAST DATE REVISED: August 2017
MEALS AND ROOMS (RENTALS) TAX: RSA 78-A
SESSION YEAR EFFECTIVE DATE CHAPTER TAX / FILING THRESHOLD TAX RATE COMMISSION PAID TO OPERATORS
This document is only a brief summary of the subject matter, current as of the last revision date. It is not intended to be relied upon as the full and complete text. Please refer to the applicable forms, instructions, rules and to the laws cited below to determine how this information applies to specific persons or situations.
Current Due Date: The 15th day of each month covering the prior month's tax collections
2012 5/23/12 CH 73:3 through 73:6 RSA 78-A:5, II clarifies that an M&R License shall remain valid during the pendency of an appeal for a refusal to renew such license. RSA 78-A:7, I(a) and RSA 78-A:7, IV clarifies the current tax rate at 9%. RSA 78-A:8-b, I clarifies the timing of filing a surety bond to be after a hearing.
2013 No change2014 No change2015 No change2016 8/23/16 CH 323 RSA 78-A:4-a, requiring that advertisements for short-term rentals
include the M&R License number of the Operator.2017 No change
81 2017 Deparment of Revenue Administration Annual Report

NH DEPARTMENT OF REVENUE ADMINISTRATION: Reference Document DOCUMENT TITLE: Historical Summary LAST DATE REVISED: August 2017
MEDICAID ENHANCEMENT TAX: RSA 84-A
SESSION YEAR EFFECTIVE DATE CHAPTER TAX / FILING THRESHOLD
1991 6/20/91 CH 299 Medicaid Enhancement Tax enacted RSA 84-A. This tax was designed to be paid by electronic transfer to the State Treasurer
1991 11/12/91 CH 390 Supplemental Medicaid Tax enacted RSA 84-B
1993 7/1/93 CH 4:16 Supplemental Medicaid Tax repealed RSA 84-B
1995 5/10/95 CH 80 Setting the rate on or before 4/1 preceding the first fiscal year of the biennium, the rate of tax for the period beginning 7/1/95 and ending 6/30/97
1999
2003 7/1/03 CH 319
2004 7/1/05 CH 260
2005 No change
2006 No change
2007 7/1/07 CH 263:50
2008 No change
2009 No change
2010 7/1/10 CH 1:12 Amends RSA 84-A:3, II-a, tax due no later than the 15th day of the 4th month of the taxable period.
2011 7/1/11 CH 224:34 CH 224:38-40
Transfers the authority for the Medicaid Enhancement Tax Account from the DHHS to the DRA. Amends the definition of “hospital” under RSA 84-A:1, III and the definition of “net patient services revenue” under RSA 84-A:1, IV-a In addition, paragraphs I and II of RSA 84-A:3, as they were applied in 1991 and 1992, were declared null and void.
2012 No change 2013 No change
This document is only a brief summary of the subject matter, current as of the last revision date. It is not intended to be relied upon as the full and complete text. Please refer to the applicable forms, instructions, rules and to the laws cited below to determine how this information applies to specific persons or situations.
8% of gross patient services revenue
Imposed on medical patient discharges in the amount of $250 M, times the number of Medicaid patient discharges of each hospital for the same period during each hospital's fiscal year ending during the first full calendar year preceding the taxable period.
Impose tax of 5.5%
Impose 6% upon gross patient services revenue
6% upon the gross patient services revenue of every hospital
TAX RATE
6% of gross patient services revenue
Impose 6% upon gross patient services revenue
82 2017 Deparment of Revenue Administration Annual Report
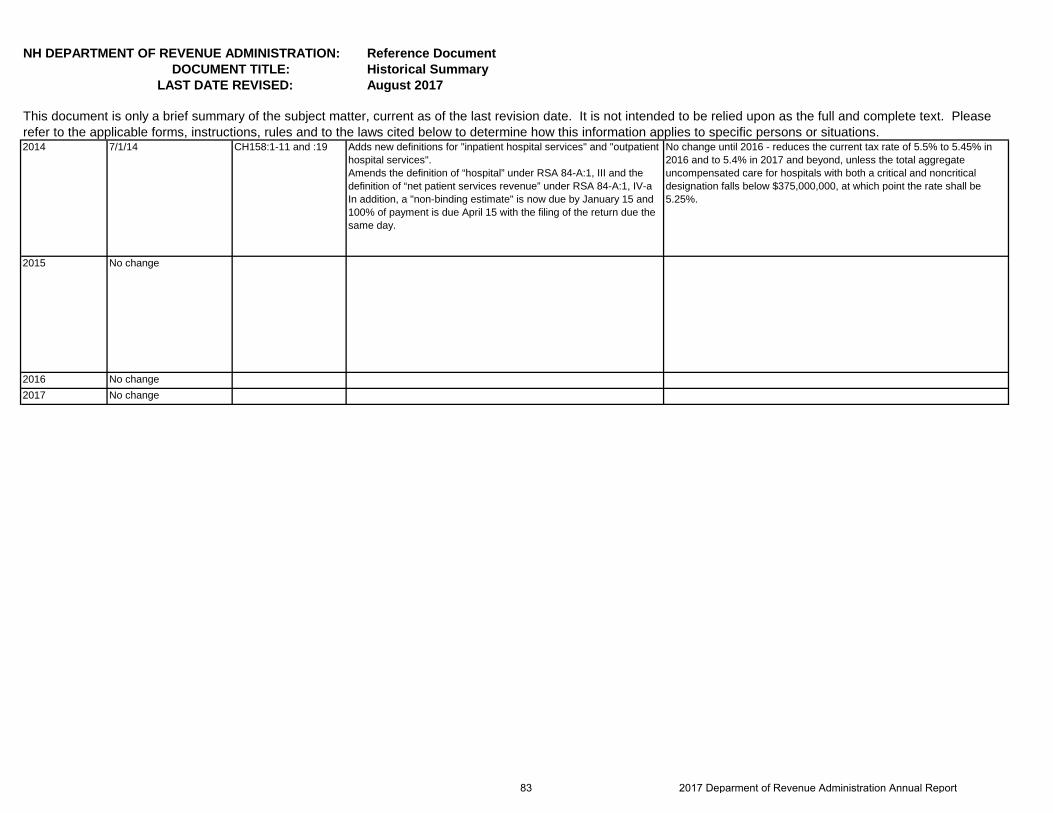
NH DEPARTMENT OF REVENUE ADMINISTRATION: Reference Document DOCUMENT TITLE: Historical Summary LAST DATE REVISED: August 2017
This document is only a brief summary of the subject matter, current as of the last revision date. It is not intended to be relied upon as the full and complete text. Please refer to the applicable forms, instructions, rules and to the laws cited below to determine how this information applies to specific persons or situations.2014 7/1/14 CH158:1-11 and :19 Adds new definitions for "inpatient hospital services" and "outpatient
hospital services". Amends the definition of “hospital” under RSA 84-A:1, III and the definition of “net patient services revenue” under RSA 84-A:1, IV-a In addition, a "non-binding estimate" is now due by January 15 and 100% of payment is due April 15 with the filing of the return due the same day.
2015 No change
2016 No change2017 No change
No change until 2016 - reduces the current tax rate of 5.5% to 5.45% in 2016 and to 5.4% in 2017 and beyond, unless the total aggregate uncompensated care for hospitals with both a critical and noncritical designation falls below $375,000,000, at which point the rate shall be 5.25%.
83 2017 Deparment of Revenue Administration Annual Report
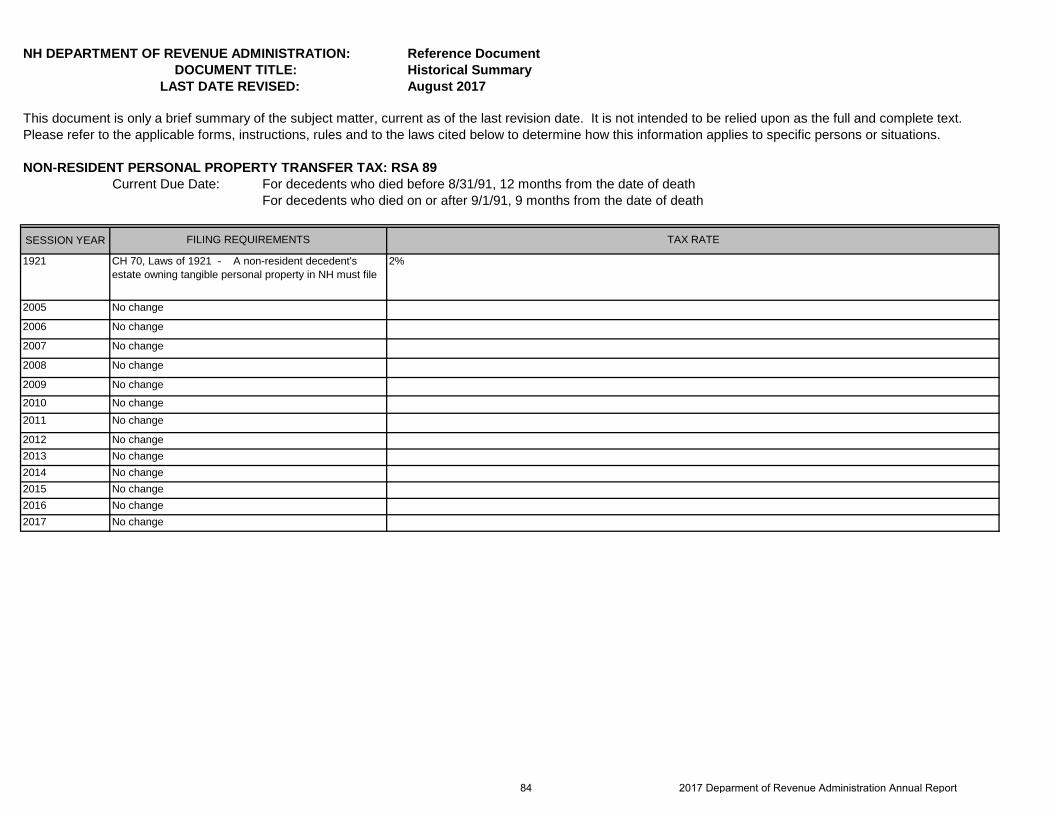
NH DEPARTMENT OF REVENUE ADMINISTRATION: Reference Document DOCUMENT TITLE: Historical Summary LAST DATE REVISED: August 2017
NON-RESIDENT PERSONAL PROPERTY TRANSFER TAX: RSA 89Current Due Date: For decedents who died before 8/31/91, 12 months from the date of death
For decedents who died on or after 9/1/91, 9 months from the date of death
SESSION YEAR
1921
2005
2006
2007
2008
2009
20102011
201220132014201520162017 No change
No change
No change
No change
No changeNo change
No change
No change
No changeNo change
This document is only a brief summary of the subject matter, current as of the last revision date. It is not intended to be relied upon as the full and complete text. Please refer to the applicable forms, instructions, rules and to the laws cited below to determine how this information applies to specific persons or situations.
TAX RATEFILING REQUIREMENTS
CH 70, Laws of 1921 - A non-resident decedent's estate owning tangible personal property in NH must file
2%
No change
No change
No change
84 2017 Deparment of Revenue Administration Annual Report
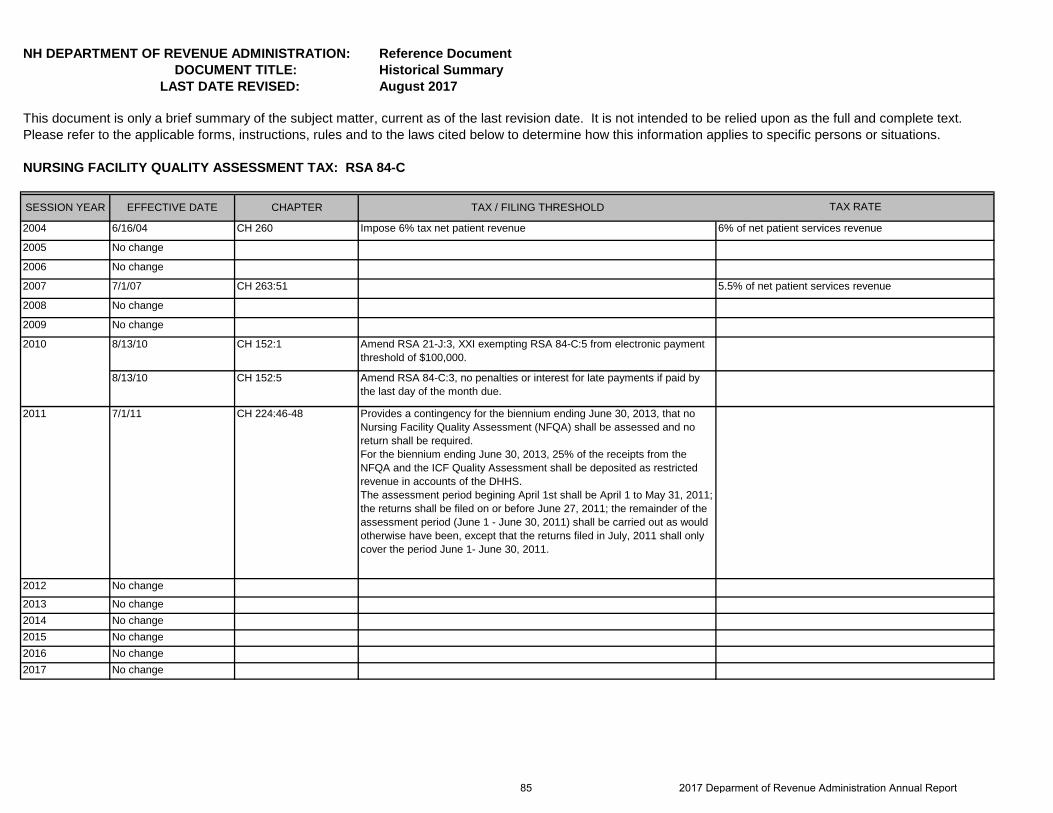
NH DEPARTMENT OF REVENUE ADMINISTRATION: Reference Document DOCUMENT TITLE: Historical Summary LAST DATE REVISED: August 2017
NURSING FACILITY QUALITY ASSESSMENT TAX: RSA 84-C
SESSION YEAR EFFECTIVE DATE CHAPTER TAX / FILING THRESHOLD
2004 6/16/04 CH 260 Impose 6% tax net patient revenue
2005 No change
2006 No change
2007 7/1/07 CH 263:51
2008 No change
2009 No change
8/13/10 CH 152:1 Amend RSA 21-J:3, XXI exempting RSA 84-C:5 from electronic payment threshold of $100,000.
8/13/10 CH 152:5 Amend RSA 84-C:3, no penalties or interest for late payments if paid by the last day of the month due.
2011 7/1/11 CH 224:46-48 Provides a contingency for the biennium ending June 30, 2013, that no Nursing Facility Quality Assessment (NFQA) shall be assessed and no return shall be required. For the biennium ending June 30, 2013, 25% of the receipts from the NFQA and the ICF Quality Assessment shall be deposited as restricted revenue in accounts of the DHHS.The assessment period begining April 1st shall be April 1 to May 31, 2011; the returns shall be filed on or before June 27, 2011; the remainder of the assessment period (June 1 - June 30, 2011) shall be carried out as would otherwise have been, except that the returns filed in July, 2011 shall only cover the period June 1- June 30, 2011.
2012 No change
2013 No change2014 No change2015 No change2016 No change2017 No change
This document is only a brief summary of the subject matter, current as of the last revision date. It is not intended to be relied upon as the full and complete text. Please refer to the applicable forms, instructions, rules and to the laws cited below to determine how this information applies to specific persons or situations.
6% of net patient services revenue
5.5% of net patient services revenue
TAX RATE
2010
85 2017 Deparment of Revenue Administration Annual Report

NH DEPARTMENT OF REVENUE ADMINISTRATION: Reference Document DOCUMENT TITLE: Historical Summary LAST DATE REVISED: August 2017
NUCLEAR STATION PROPERTY TAX : RSA 83-D REPEALED 1999
SESSION YEAR EFFECTIVE DATE CHAPTER TAX / FILING THRESHOLD
1991 7/1/91 CH 354:1 Enacted RSA 83-D, and amended RSA 83-C to remove electric companies
1992 5/19/92 CH 13:10 Repealed relative to the administration of the tax on nuclear station property
For taxable periods ending before 1/1/93
CH 49:4 A tax is imposed upon the value of nuclear station property
For taxable periods ending 12/31/93
A tax is imposed upon the value of nuclear station property
For taxable periods ending 12/31/94
A tax is imposed upon the value of nuclear station property
1/1/93 CH 83-D:4
1999 4/1/99 CH 17 The Nuclear Station Property Tax is repealed eff. 4/1/99
This document is only a brief summary of the subject matter, current as of the last revision date. It is not intended to be relied upon as the full and complete text. Please refer to the applicable forms, instructions, rules and to the laws cited below to determine how this information applies to specific persons or situations.
For taxable periods ending before 1/1/93, 0.64 percent of valuation as of April 1. For taxable period ending 12/31/93, 0.491 percent of valuation as of April 1. For taxable periods ending after 12/31/94, 0.25 percent of valuation as of April 1.
Subject to the utility property tax
.64% of valuation, to be assessed annually as of 4/1
.491% of valuation, to be assessed as of 4/1/93
.491% of valuation, to be assessed as of 4/1/94. For taxable periods ending after 12/31/94 a tax is imposed upon the value of Valuation - for the purposes of the tax assessed prior to 4/1/93, the Commissioner of DRA shall determine the valuation of nuclear station property using the standard estimate pursuant to RSA 75:1. For purposes of the tax imposed by this chapter assessed as of 4/1/93 and for every year thereafter, the valuation of nuclear property shall be $3,000,000,000.
TAX RATE
1993
86 2017 Deparment of Revenue Administration Annual Report
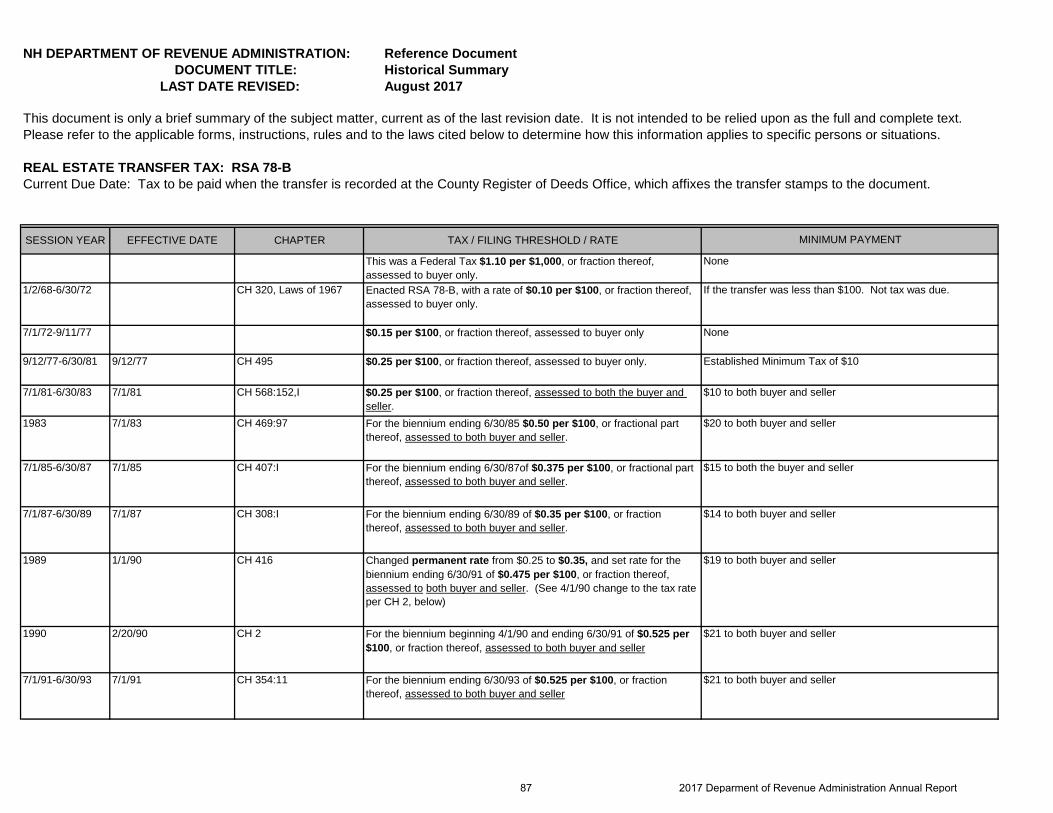
NH DEPARTMENT OF REVENUE ADMINISTRATION: Reference Document DOCUMENT TITLE: Historical Summary LAST DATE REVISED: August 2017
REAL ESTATE TRANSFER TAX: RSA 78-B
SESSION YEAR EFFECTIVE DATE CHAPTER TAX / FILING THRESHOLD / RATE
This was a Federal Tax $1.10 per $1,000, or fraction thereof, assessed to buyer only.
1/2/68-6/30/72 CH 320, Laws of 1967 Enacted RSA 78-B, with a rate of $0.10 per $100, or fraction thereof, assessed to buyer only.
7/1/72-9/11/77 $0.15 per $100, or fraction thereof, assessed to buyer only
9/12/77-6/30/81 9/12/77 CH 495 $0.25 per $100, or fraction thereof, assessed to buyer only.
7/1/81-6/30/83 7/1/81 CH 568:152,I $0.25 per $100, or fraction thereof, assessed to both the buyer and seller.
1983 7/1/83 CH 469:97 For the biennium ending 6/30/85 $0.50 per $100, or fractional part thereof, assessed to both buyer and seller.
7/1/85-6/30/87 7/1/85 CH 407:I For the biennium ending 6/30/87of $0.375 per $100, or fractional part thereof, assessed to both buyer and seller.
7/1/87-6/30/89 7/1/87 CH 308:I For the biennium ending 6/30/89 of $0.35 per $100, or fraction thereof, assessed to both buyer and seller.
1989 1/1/90 CH 416 Changed permanent rate from $0.25 to $0.35, and set rate for the biennium ending 6/30/91 of $0.475 per $100, or fraction thereof, assessed to both buyer and seller. (See 4/1/90 change to the tax rate per CH 2, below)
1990 2/20/90 CH 2 For the biennium beginning 4/1/90 and ending 6/30/91 of $0.525 per $100, or fraction thereof, assessed to both buyer and seller
7/1/91-6/30/93 7/1/91 CH 354:11 For the biennium ending 6/30/93 of $0.525 per $100, or fraction thereof, assessed to both buyer and seller
This document is only a brief summary of the subject matter, current as of the last revision date. It is not intended to be relied upon as the full and complete text. Please refer to the applicable forms, instructions, rules and to the laws cited below to determine how this information applies to specific persons or situations.
MINIMUM PAYMENT
None
If the transfer was less than $100. Not tax was due.
$19 to both buyer and seller
None
Established Minimum Tax of $10
$10 to both buyer and seller
$14 to both buyer and seller
$15 to both the buyer and seller
$20 to both buyer and seller
Current Due Date: Tax to be paid when the transfer is recorded at the County Register of Deeds Office, which affixes the transfer stamps to the document.
$21 to both buyer and seller
$21 to both buyer and seller
87 2017 Deparment of Revenue Administration Annual Report

NH DEPARTMENT OF REVENUE ADMINISTRATION: Reference Document DOCUMENT TITLE: Historical Summary LAST DATE REVISED: August 2017
REAL ESTATE TRANSFER TAX: RSA 78-B
SESSION YEAR EFFECTIVE DATE CHAPTER TAX / FILING THRESHOLD / RATE
This document is only a brief summary of the subject matter, current as of the last revision date. It is not intended to be relied upon as the full and complete text. Please refer to the applicable forms, instructions, rules and to the laws cited below to determine how this information applies to specific persons or situations.
MINIMUM PAYMENT
Current Due Date: Tax to be paid when the transfer is recorded at the County Register of Deeds Office, which affixes the transfer stamps to the document.
7/1/93 CH 350:38 For the biennium ending 6/30/95 of $0.50 per $100, or fractional part thereof, assessed to both buyer and seller
7/1/93 CH 325 Established the real estate transfer questionnaire.
1995 7/1/95 CH 96:3 For the biennium ending 6/30/97 of $0.50 per $100, or fraction thereof, assessed to both buyer and seller
1997 7/1/97 CH 130:3 For the period beginning 7/1/97 and ending 6/30/99, the tax is $0.50 per $100 or fractional part thereof assessed to both buyer and seller
1998 7/18/98 CH 91 Require the filing of a questionnaire with DRA and the local assessor or selectmen.
6/20/1998 6/25/98 CH 238 Provides an exemption from the transfer tax for conveyances of real property from a municipality when the property is repurchased by the former owner after the municipality's acquisition by tax deed.
1999 7/1/99 CH 17 Increased the permanent tax rate assessed on the sale, granting, and transfer of real estate and any interest in real estate to $0.75 per $100, or fractional part thereof, of the price or consideration.
2001 7/1/01 CH 158 Declaration of Consideration Amended. Transfers exempted by RSA 78-B:2, except transfers exempted by RSA 78-B:2
2004 7/1/04 CH 195 Manufactured housing real estate transfer tax
7/1/05 CH 177 Gave tax amnesty to P&I
7/9/05 CH 31 Added procedure for Assessment or refund of tax
2006 7/1/06 CH 149:1 1-aVCH 149:1 V1CH 219:1 2 XIX - new
1994
2005
A "real estate holding company"Exempts certain transfer between charitable organizations
Definition of "sale, granting and transfer"
12/1/05-2/15/06 due by unpaid on or before 7/1/06
Minimum tax of $20 to both buyer and seller
Minimum tax of $20 to both buyer and seller
This rate is assessed on both the buyer and seller for a total tax rate of $1.50 per $100. Where the price or consideration is $4,000 or less, there shall be a minimum tax of $20, which is assessed, on both the buyer and seller, for a total tax of $40.
Minimum tax of $20 to both buyer and seller
88 2017 Deparment of Revenue Administration Annual Report
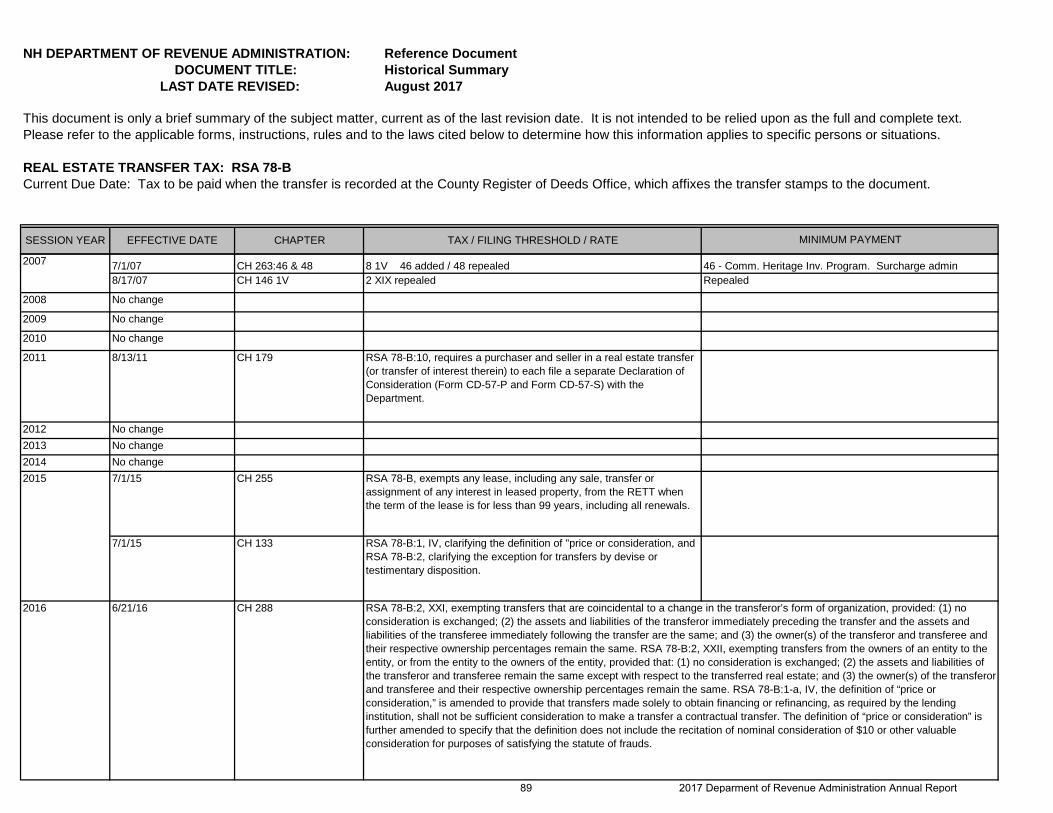
NH DEPARTMENT OF REVENUE ADMINISTRATION: Reference Document DOCUMENT TITLE: Historical Summary LAST DATE REVISED: August 2017
REAL ESTATE TRANSFER TAX: RSA 78-B
SESSION YEAR EFFECTIVE DATE CHAPTER TAX / FILING THRESHOLD / RATE
This document is only a brief summary of the subject matter, current as of the last revision date. It is not intended to be relied upon as the full and complete text. Please refer to the applicable forms, instructions, rules and to the laws cited below to determine how this information applies to specific persons or situations.
MINIMUM PAYMENT
Current Due Date: Tax to be paid when the transfer is recorded at the County Register of Deeds Office, which affixes the transfer stamps to the document.
7/1/07 CH 263:46 & 48 8 1V 46 added / 48 repealed8/17/07 CH 146 1V 2 XIX repealed
2008 No change
2009 No change
2010 No change
2011 8/13/11 CH 179 RSA 78-B:10, requires a purchaser and seller in a real estate transfer (or transfer of interest therein) to each file a separate Declaration of Consideration (Form CD-57-P and Form CD-57-S) with the Department.
2012 No change2013 No change2014 No change
7/1/15 CH 255 RSA 78-B, exempts any lease, including any sale, transfer or assignment of any interest in leased property, from the RETT when the term of the lease is for less than 99 years, including all renewals.
7/1/15 CH 133 RSA 78-B:1, IV, clarifying the definition of "price or consideration, and RSA 78-B:2, clarifying the exception for transfers by devise or testimentary disposition.
2016 6/21/16 CH 288
2015
RSA 78-B:2, XXI, exempting transfers that are coincidental to a change in the transferor’s form of organization, provided: (1) no consideration is exchanged; (2) the assets and liabilities of the transferor immediately preceding the transfer and the assets and liabilities of the transferee immediately following the transfer are the same; and (3) the owner(s) of the transferor and transferee and their respective ownership percentages remain the same. RSA 78-B:2, XXII, exempting transfers from the owners of an entity to the entity, or from the entity to the owners of the entity, provided that: (1) no consideration is exchanged; (2) the assets and liabilities of the transferor and transferee remain the same except with respect to the transferred real estate; and (3) the owner(s) of the transferor and transferee and their respective ownership percentages remain the same. RSA 78-B:1-a, IV, the definition of “price or consideration,” is amended to provide that transfers made solely to obtain financing or refinancing, as required by the lending institution, shall not be sufficient consideration to make a transfer a contractual transfer. The definition of “price or consideration” is further amended to specify that the definition does not include the recitation of nominal consideration of $10 or other valuable consideration for purposes of satisfying the statute of frauds.
2007
Repealed46 - Comm. Heritage Inv. Program. Surcharge admin
89 2017 Deparment of Revenue Administration Annual Report
NH DEPARTMENT OF REVENUE ADMINISTRATION: Reference Document DOCUMENT TITLE: Historical Summary LAST DATE REVISED: August 2017
REAL ESTATE TRANSFER TAX: RSA 78-B
SESSION YEAR EFFECTIVE DATE CHAPTER TAX / FILING THRESHOLD / RATE
This document is only a brief summary of the subject matter, current as of the last revision date. It is not intended to be relied upon as the full and complete text. Please refer to the applicable forms, instructions, rules and to the laws cited below to determine how this information applies to specific persons or situations.
MINIMUM PAYMENT
Current Due Date: Tax to be paid when the transfer is recorded at the County Register of Deeds Office, which affixes the transfer stamps to the document.
2017 No change
90 2017 Deparment of Revenue Administration Annual Report
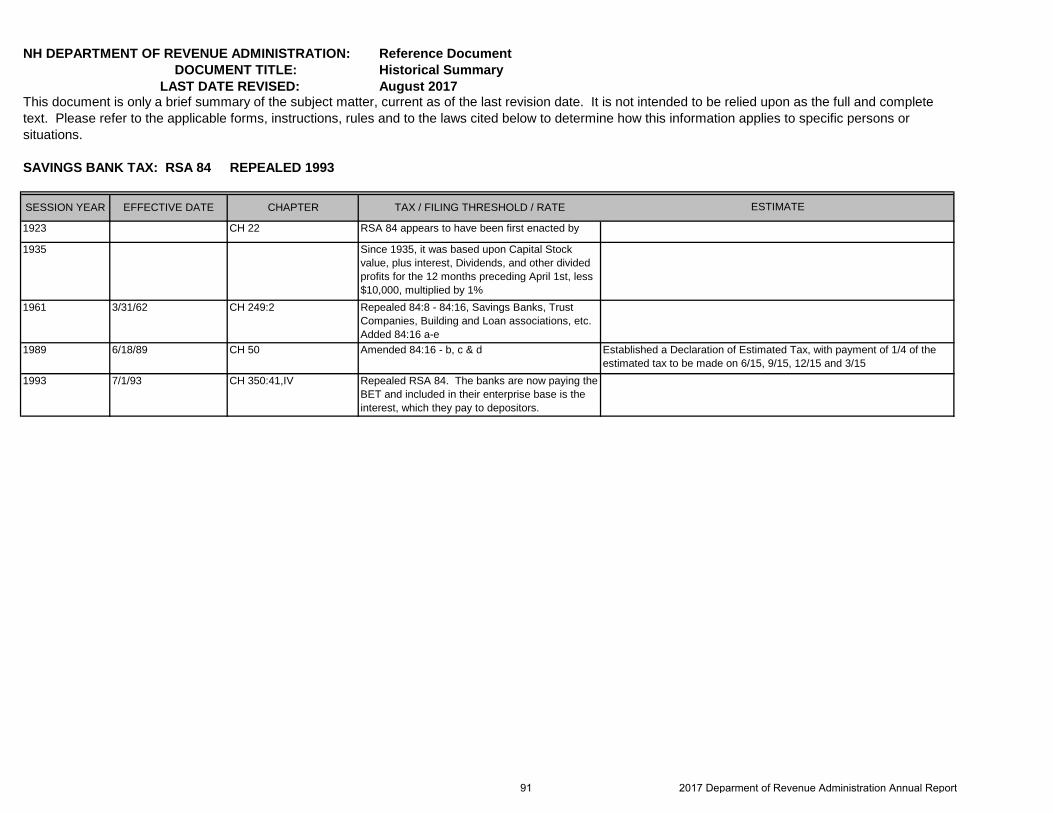
NH DEPARTMENT OF REVENUE ADMINISTRATION: Reference Document DOCUMENT TITLE: Historical Summary LAST DATE REVISED: August 2017
SAVINGS BANK TAX: RSA 84 REPEALED 1993
SESSION YEAR EFFECTIVE DATE CHAPTER TAX / FILING THRESHOLD / RATE
1923 CH 22 RSA 84 appears to have been first enacted by
1935 Since 1935, it was based upon Capital Stock value, plus interest, Dividends, and other divided profits for the 12 months preceding April 1st, less $10,000, multiplied by 1%
1961 3/31/62 CH 249:2 Repealed 84:8 - 84:16, Savings Banks, Trust Companies, Building and Loan associations, etc. Added 84:16 a-e
1989 6/18/89 CH 50 Amended 84:16 - b, c & d
1993 7/1/93 CH 350:41,IV Repealed RSA 84. The banks are now paying the BET and included in their enterprise base is the interest, which they pay to depositors.
Established a Declaration of Estimated Tax, with payment of 1/4 of the estimated tax to be made on 6/15, 9/15, 12/15 and 3/15
This document is only a brief summary of the subject matter, current as of the last revision date. It is not intended to be relied upon as the full and complete text. Please refer to the applicable forms, instructions, rules and to the laws cited below to determine how this information applies to specific persons or situations.
ESTIMATE
91 2017 Deparment of Revenue Administration Annual Report
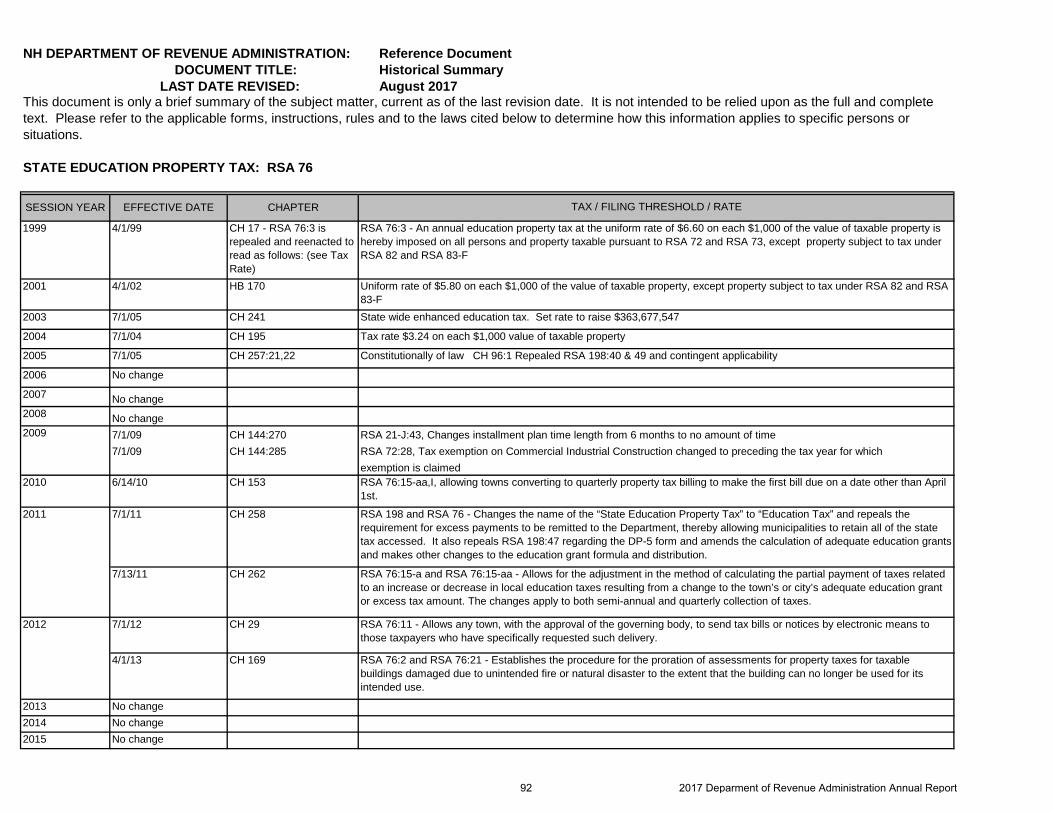
NH DEPARTMENT OF REVENUE ADMINISTRATION: Reference Document DOCUMENT TITLE: Historical Summary LAST DATE REVISED: August 2017
STATE EDUCATION PROPERTY TAX: RSA 76
SESSION YEAR EFFECTIVE DATE CHAPTER
1999 4/1/99 CH 17 - RSA 76:3 is repealed and reenacted to read as follows: (see Tax Rate)
2001 4/1/02 HB 170
2003 7/1/05 CH 241
2004 7/1/04 CH 195
2005 7/1/05 CH 257:21,22
2006 No change
2007 No change2008 No change2009 7/1/09 CH 144:270 RSA 21-J:43, Changes installment plan time length from 6 months to no amount of time
7/1/09 CH 144:285 RSA 72:28, Tax exemption on Commercial Industrial Construction changed to preceding the tax year for which
2010 6/14/10 CH 153
7/1/11 CH 258
7/13/11 CH 262
7/1/12 CH 29
4/1/13 CH 169
2013 No change2014 No change2015 No change
2011
2012
RSA 76:2 and RSA 76:21 - Establishes the procedure for the proration of assessments for property taxes for taxable buildings damaged due to unintended fire or natural disaster to the extent that the building can no longer be used for its intended use.
RSA 76:15-a and RSA 76:15-aa - Allows for the adjustment in the method of calculating the partial payment of taxes related to an increase or decrease in local education taxes resulting from a change to the town’s or city’s adequate education grant or excess tax amount. The changes apply to both semi-annual and quarterly collection of taxes.
RSA 198 and RSA 76 - Changes the name of the “State Education Property Tax” to “Education Tax” and repeals the requirement for excess payments to be remitted to the Department, thereby allowing municipalities to retain all of the state tax accessed. It also repeals RSA 198:47 regarding the DP-5 form and amends the calculation of adequate education grants and makes other changes to the education grant formula and distribution.
RSA 76:15-aa,I, allowing towns converting to quarterly property tax billing to make the first bill due on a date other than April 1st.
exemption is claimed
RSA 76:11 - Allows any town, with the approval of the governing body, to send tax bills or notices by electronic means to those taxpayers who have specifically requested such delivery.
This document is only a brief summary of the subject matter, current as of the last revision date. It is not intended to be relied upon as the full and complete text. Please refer to the applicable forms, instructions, rules and to the laws cited below to determine how this information applies to specific persons or situations.
TAX / FILING THRESHOLD / RATE
RSA 76:3 - An annual education property tax at the uniform rate of $6.60 on each $1,000 of the value of taxable property is hereby imposed on all persons and property taxable pursuant to RSA 72 and RSA 73, except property subject to tax under RSA 82 and RSA 83-F
Uniform rate of $5.80 on each $1,000 of the value of taxable property, except property subject to tax under RSA 82 and RSA 83-F
Constitutionally of law CH 96:1 Repealed RSA 198:40 & 49 and contingent applicability
State wide enhanced education tax. Set rate to raise $363,677,547
Tax rate $3.24 on each $1,000 value of taxable property
92 2017 Deparment of Revenue Administration Annual Report
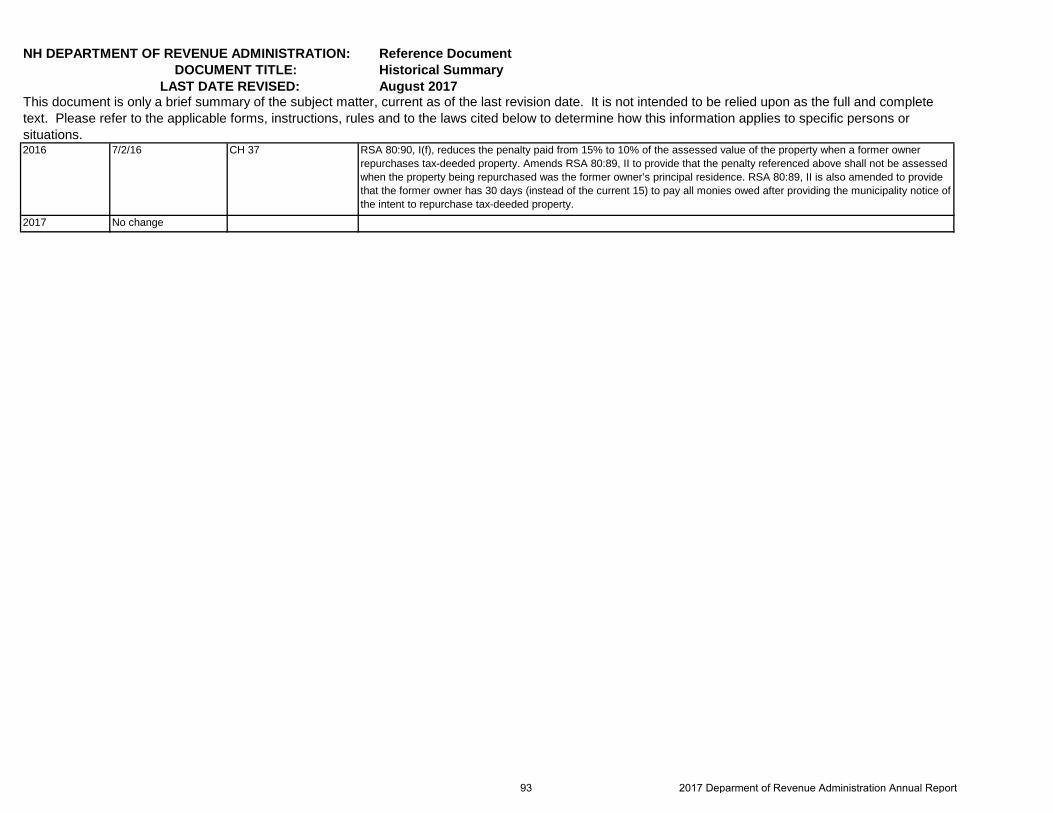
NH DEPARTMENT OF REVENUE ADMINISTRATION: Reference Document DOCUMENT TITLE: Historical Summary LAST DATE REVISED: August 2017
This document is only a brief summary of the subject matter, current as of the last revision date. It is not intended to be relied upon as the full and complete text. Please refer to the applicable forms, instructions, rules and to the laws cited below to determine how this information applies to specific persons or situations. 2016 7/2/16 CH 37
2017 No change
RSA 80:90, I(f), reduces the penalty paid from 15% to 10% of the assessed value of the property when a former owner repurchases tax-deeded property. Amends RSA 80:89, II to provide that the penalty referenced above shall not be assessed when the property being repurchased was the former owner’s principal residence. RSA 80:89, II is also amended to provide that the former owner has 30 days (instead of the current 15) to pay all monies owed after providing the municipality notice of the intent to repurchase tax-deeded property.
93 2017 Deparment of Revenue Administration Annual Report
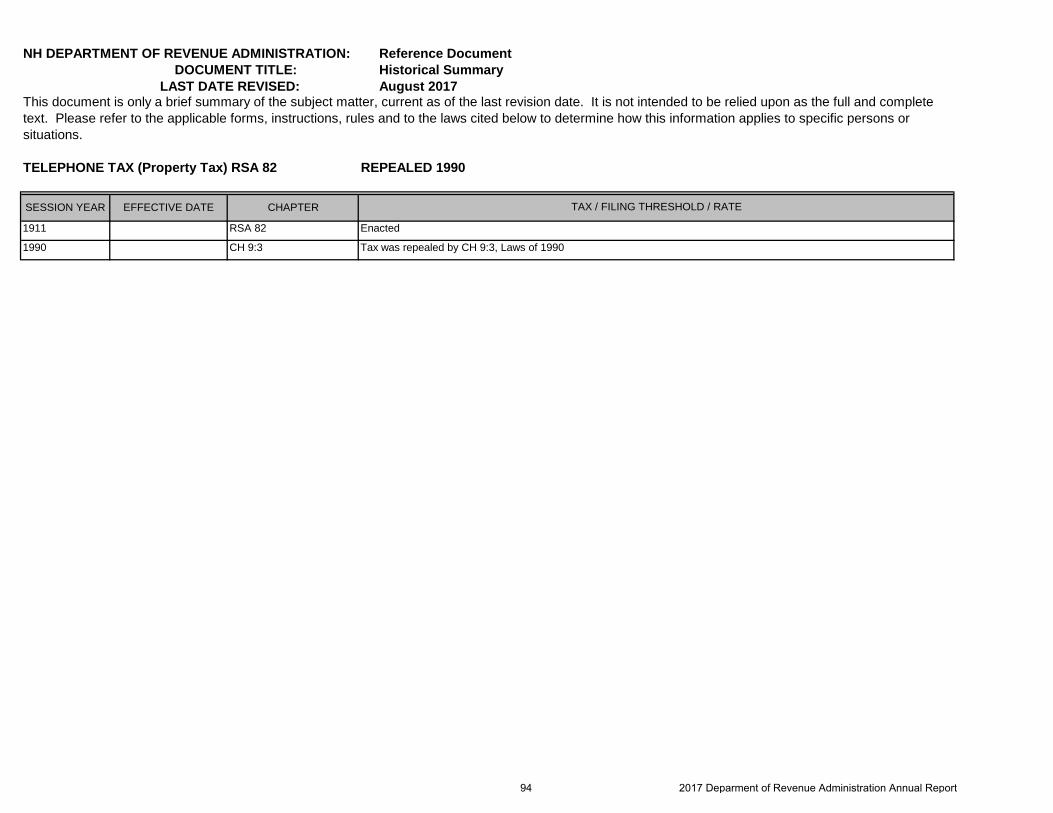
NH DEPARTMENT OF REVENUE ADMINISTRATION: Reference Document DOCUMENT TITLE: Historical Summary LAST DATE REVISED: August 2017
TELEPHONE TAX (Property Tax) RSA 82 REPEALED 1990
SESSION YEAR EFFECTIVE DATE CHAPTER
1911 RSA 82
1990 CH 9:3
This document is only a brief summary of the subject matter, current as of the last revision date. It is not intended to be relied upon as the full and complete text. Please refer to the applicable forms, instructions, rules and to the laws cited below to determine how this information applies to specific persons or situations.
TAX / FILING THRESHOLD / RATE
Enacted
Tax was repealed by CH 9:3, Laws of 1990
94 2017 Deparment of Revenue Administration Annual Report
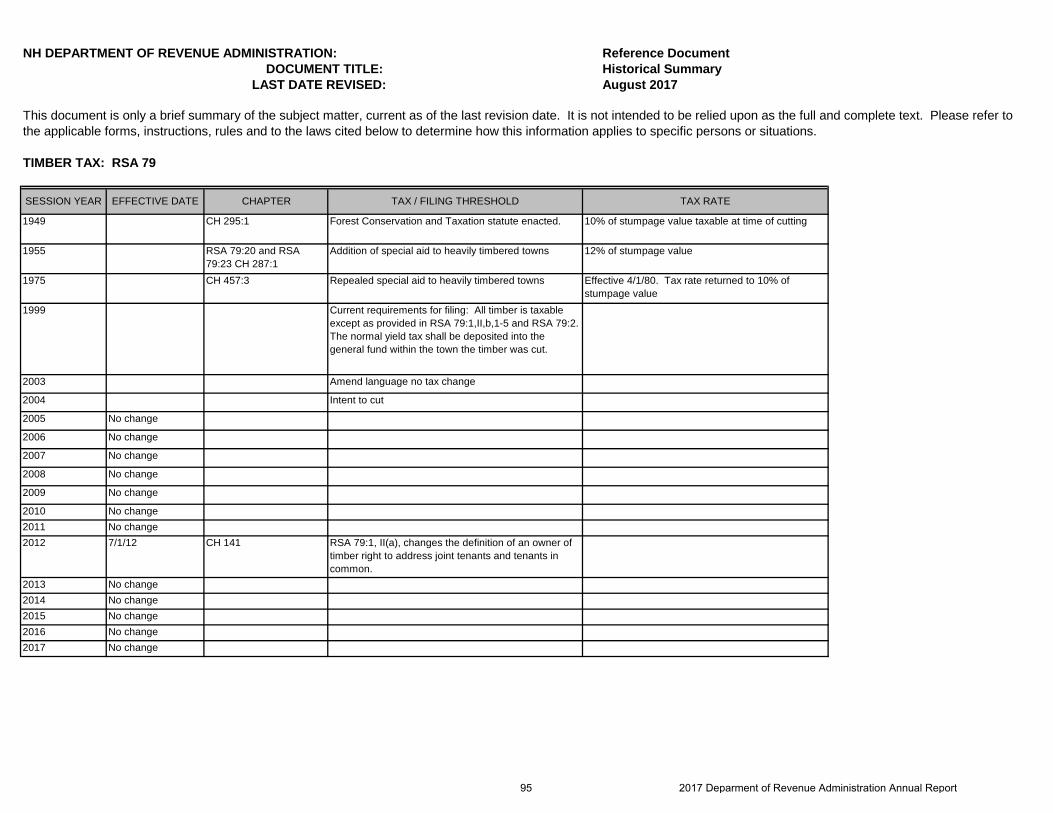
NH DEPARTMENT OF REVENUE ADMINISTRATION: Reference Document DOCUMENT TITLE: Historical Summary LAST DATE REVISED: August 2017
TIMBER TAX: RSA 79
SESSION YEAR EFFECTIVE DATE CHAPTER TAX / FILING THRESHOLD TAX RATE
1949 CH 295:1 Forest Conservation and Taxation statute enacted. 10% of stumpage value taxable at time of cutting
1955 RSA 79:20 and RSA 79:23 CH 287:1
Addition of special aid to heavily timbered towns 12% of stumpage value
1975 CH 457:3 Repealed special aid to heavily timbered towns Effective 4/1/80. Tax rate returned to 10% of stumpage value
1999 Current requirements for filing: All timber is taxable except as provided in RSA 79:1,II,b,1-5 and RSA 79:2. The normal yield tax shall be deposited into the general fund within the town the timber was cut.
2003 Amend language no tax change
2004 Intent to cut
2005 No change
2006 No change
2007 No change
2008 No change
2009 No change
2010 No change2011 No change2012 7/1/12 CH 141 RSA 79:1, II(a), changes the definition of an owner of
timber right to address joint tenants and tenants in common.
2013 No change2014 No change2015 No change2016 No change2017 No change
This document is only a brief summary of the subject matter, current as of the last revision date. It is not intended to be relied upon as the full and complete text. Please refer to the applicable forms, instructions, rules and to the laws cited below to determine how this information applies to specific persons or situations.
95 2017 Deparment of Revenue Administration Annual Report
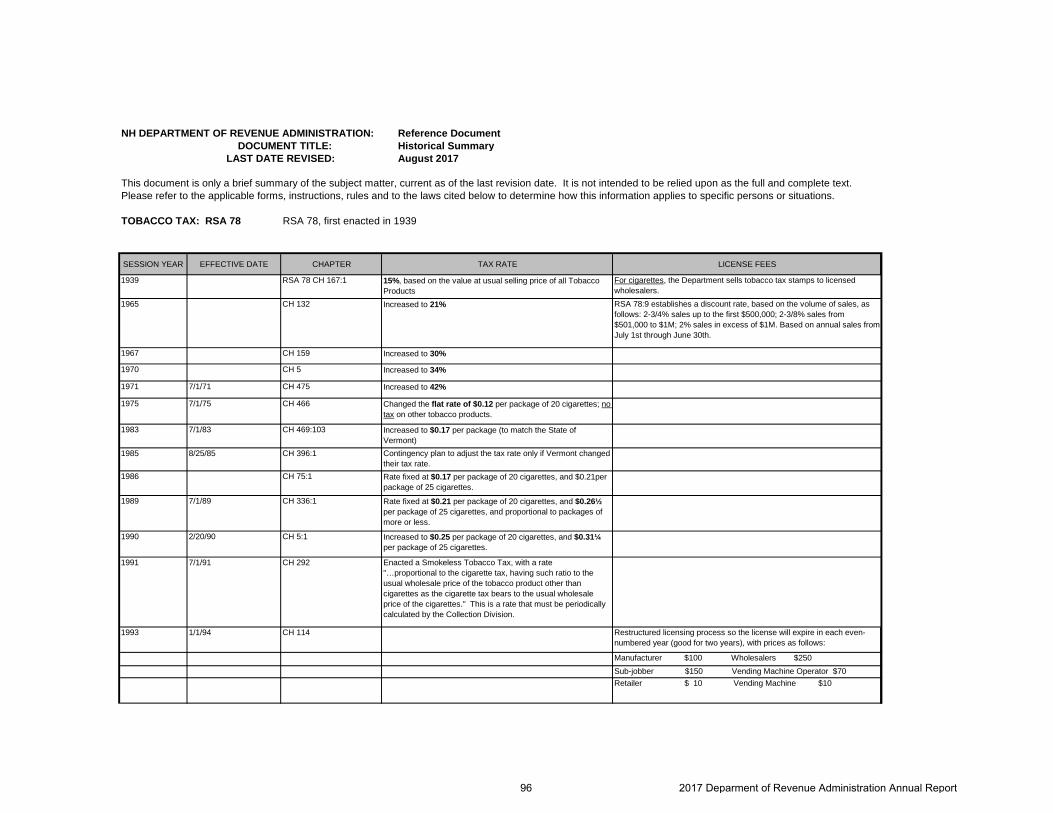
NH DEPARTMENT OF REVENUE ADMINISTRATION: Reference Document DOCUMENT TITLE: Historical Summary LAST DATE REVISED: August 2017
TOBACCO TAX: RSA 78 RSA 78, first enacted in 1939
SESSION YEAR EFFECTIVE DATE CHAPTER TAX RATE LICENSE FEES
1939 RSA 78 CH 167:1 15%, based on the value at usual selling price of all Tobacco Products
1965 CH 132 Increased to 21%
1967 CH 159 Increased to 30%
1970 CH 5 Increased to 34%
1971 7/1/71 CH 475 Increased to 42%
1975 7/1/75 CH 466 Changed the flat rate of $0.12 per package of 20 cigarettes; no tax on other tobacco products.
1983 7/1/83 CH 469:103 Increased to $0.17 per package (to match the State of Vermont)
1985 8/25/85 CH 396:1 Contingency plan to adjust the tax rate only if Vermont changed their tax rate.
1986 CH 75:1 Rate fixed at $0.17 per package of 20 cigarettes, and $0.21per package of 25 cigarettes.
1989 7/1/89 CH 336:1 Rate fixed at $0.21 per package of 20 cigarettes, and $0.26½ per package of 25 cigarettes, and proportional to packages of more or less.
1990 2/20/90 CH 5:1 Increased to $0.25 per package of 20 cigarettes, and $0.31¼ per package of 25 cigarettes.
1991 7/1/91 CH 292 Enacted a Smokeless Tobacco Tax, with a rate "…proportional to the cigarette tax, having such ratio to the usual wholesale price of the tobacco product other than cigarettes as the cigarette tax bears to the usual wholesale price of the cigarettes." This is a rate that must be periodically calculated by the Collection Division.
1993 1/1/94 CH 114 Restructured licensing process so the license will expire in each even-numbered year (good for two years), with prices as follows:
Manufacturer $100 Wholesalers $250 Sub-jobber $150 Vending Machine Operator $70Retailer $ 10 Vending Machine $10
This document is only a brief summary of the subject matter, current as of the last revision date. It is not intended to be relied upon as the full and complete text. Please refer to the applicable forms, instructions, rules and to the laws cited below to determine how this information applies to specific persons or situations.
For cigarettes, the Department sells tobacco tax stamps to licensed wholesalers.RSA 78:9 establishes a discount rate, based on the volume of sales, as follows: 2-3/4% sales up to the first $500,000; 2-3/8% sales from $501,000 to $1M; 2% sales in excess of $1M. Based on annual sales from July 1st through June 30th.
96 2017 Deparment of Revenue Administration Annual Report
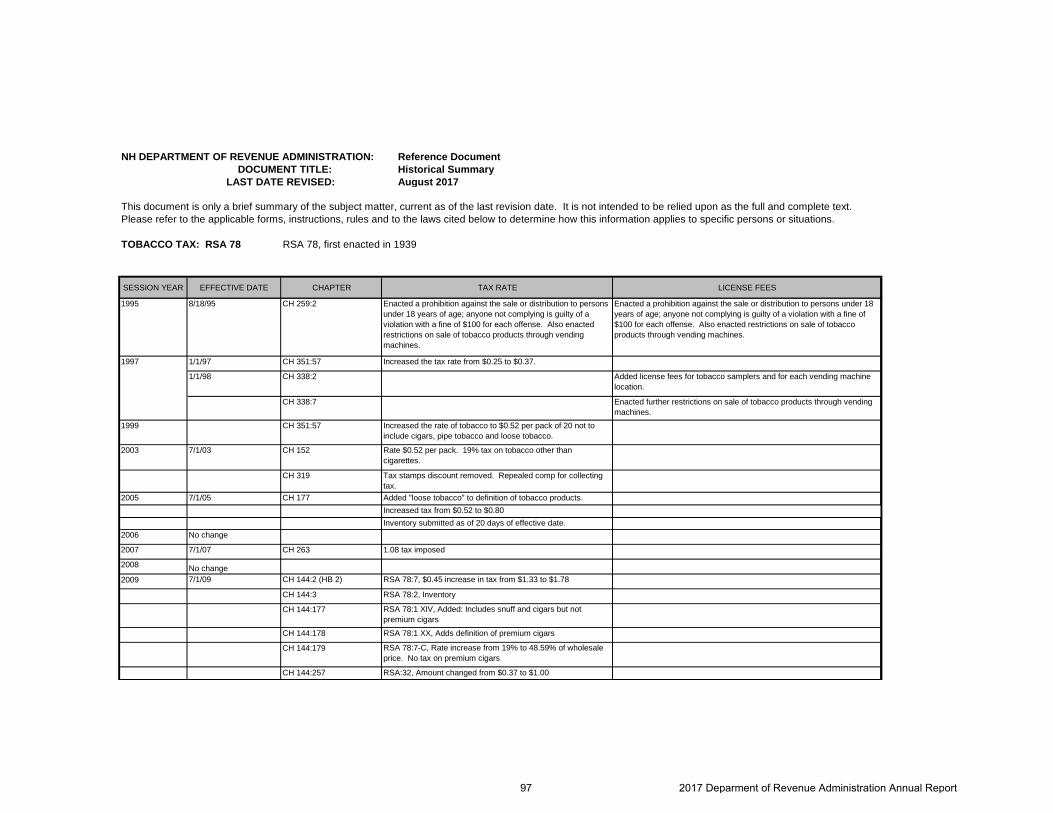
NH DEPARTMENT OF REVENUE ADMINISTRATION: Reference Document DOCUMENT TITLE: Historical Summary LAST DATE REVISED: August 2017
TOBACCO TAX: RSA 78 RSA 78, first enacted in 1939
SESSION YEAR EFFECTIVE DATE CHAPTER TAX RATE LICENSE FEES
This document is only a brief summary of the subject matter, current as of the last revision date. It is not intended to be relied upon as the full and complete text. Please refer to the applicable forms, instructions, rules and to the laws cited below to determine how this information applies to specific persons or situations.
1995 8/18/95 CH 259:2 Enacted a prohibition against the sale or distribution to persons under 18 years of age; anyone not complying is guilty of a violation with a fine of $100 for each offense. Also enacted restrictions on sale of tobacco products through vending machines.
Enacted a prohibition against the sale or distribution to persons under 18 years of age; anyone not complying is guilty of a violation with a fine of $100 for each offense. Also enacted restrictions on sale of tobacco products through vending machines.
1/1/97 CH 351:57 Increased the tax rate from $0.25 to $0.37.
1/1/98 CH 338:2 Added license fees for tobacco samplers and for each vending machine location.
CH 338:7 Enacted further restrictions on sale of tobacco products through vending machines.
1999 CH 351:57 Increased the rate of tobacco to $0.52 per pack of 20 not to include cigars, pipe tobacco and loose tobacco.
2003 7/1/03 CH 152 Rate $0.52 per pack. 19% tax on tobacco other than cigarettes.
CH 319 Tax stamps discount removed. Repealed comp for collecting tax.
2005 7/1/05 CH 177 Added "loose tobacco" to definition of tobacco products.Increased tax from $0.52 to $0.80Inventory submitted as of 20 days of effective date.
2006 No change
2007 7/1/07 CH 263 1.08 tax imposed
2008 No change2009 7/1/09 CH 144:2 (HB 2) RSA 78:7, $0.45 increase in tax from $1.33 to $1.78
CH 144:3 RSA 78:2, Inventory
CH 144:177 RSA 78:1 XIV, Added: Includes snuff and cigars but not premium cigars
CH 144:178 RSA 78:1 XX, Adds definition of premium cigars
CH 144:179 RSA 78:7-C, Rate increase from 19% to 48.59% of wholesale price. No tax on premium cigars
CH 144:257 RSA:32, Amount changed from $0.37 to $1.00
1997
97 2017 Deparment of Revenue Administration Annual Report
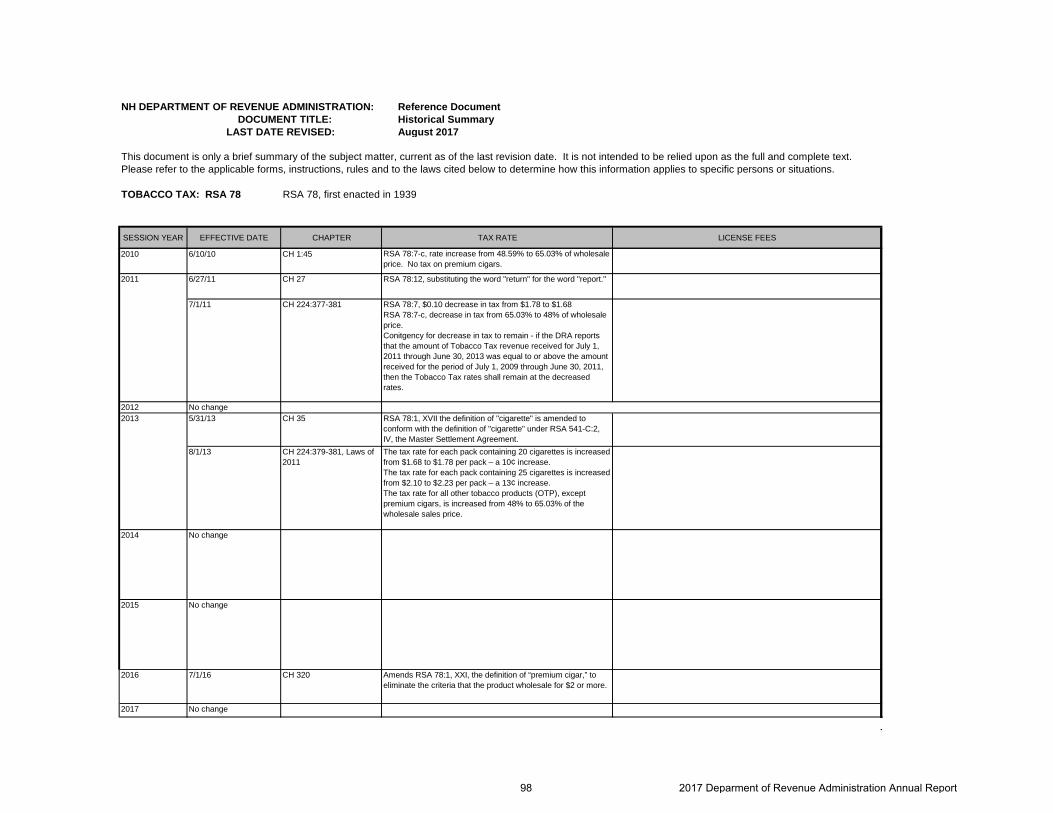
NH DEPARTMENT OF REVENUE ADMINISTRATION: Reference Document DOCUMENT TITLE: Historical Summary LAST DATE REVISED: August 2017
TOBACCO TAX: RSA 78 RSA 78, first enacted in 1939
SESSION YEAR EFFECTIVE DATE CHAPTER TAX RATE LICENSE FEES
This document is only a brief summary of the subject matter, current as of the last revision date. It is not intended to be relied upon as the full and complete text. Please refer to the applicable forms, instructions, rules and to the laws cited below to determine how this information applies to specific persons or situations.
2010 6/10/10 CH 1:45 RSA 78:7-c, rate increase from 48.59% to 65.03% of wholesale price. No tax on premium cigars.
6/27/11 CH 27 RSA 78:12, substituting the word "return" for the word "report."
7/1/11 CH 224:377-381 RSA 78:7, $0.10 decrease in tax from $1.78 to $1.68 RSA 78:7-c, decrease in tax from 65.03% to 48% of wholesale price. Conitgency for decrease in tax to remain - if the DRA reports that the amount of Tobacco Tax revenue received for July 1, 2011 through June 30, 2013 was equal to or above the amount received for the period of July 1, 2009 through June 30, 2011, then the Tobacco Tax rates shall remain at the decreased rates.
2012 No change5/31/13 CH 35 RSA 78:1, XVII the definition of "cigarette" is amended to
conform with the definition of "cigarette" under RSA 541-C:2, IV, the Master Settlement Agreement.
8/1/13 CH 224:379-381, Laws of 2011
The tax rate for each pack containing 20 cigarettes is increased from $1.68 to $1.78 per pack – a 10¢ increase.The tax rate for each pack containing 25 cigarettes is increased from $2.10 to $2.23 per pack – a 13¢ increase.The tax rate for all other tobacco products (OTP), except premium cigars, is increased from 48% to 65.03% of the wholesale sales price.
2014 No change
2015 No change
2016 7/1/16 CH 320 Amends RSA 78:1, XXI, the definition of “premium cigar,” to eliminate the criteria that the product wholesale for $2 or more.
2017 No change
2011
2013
98 2017 Deparment of Revenue Administration Annual Report
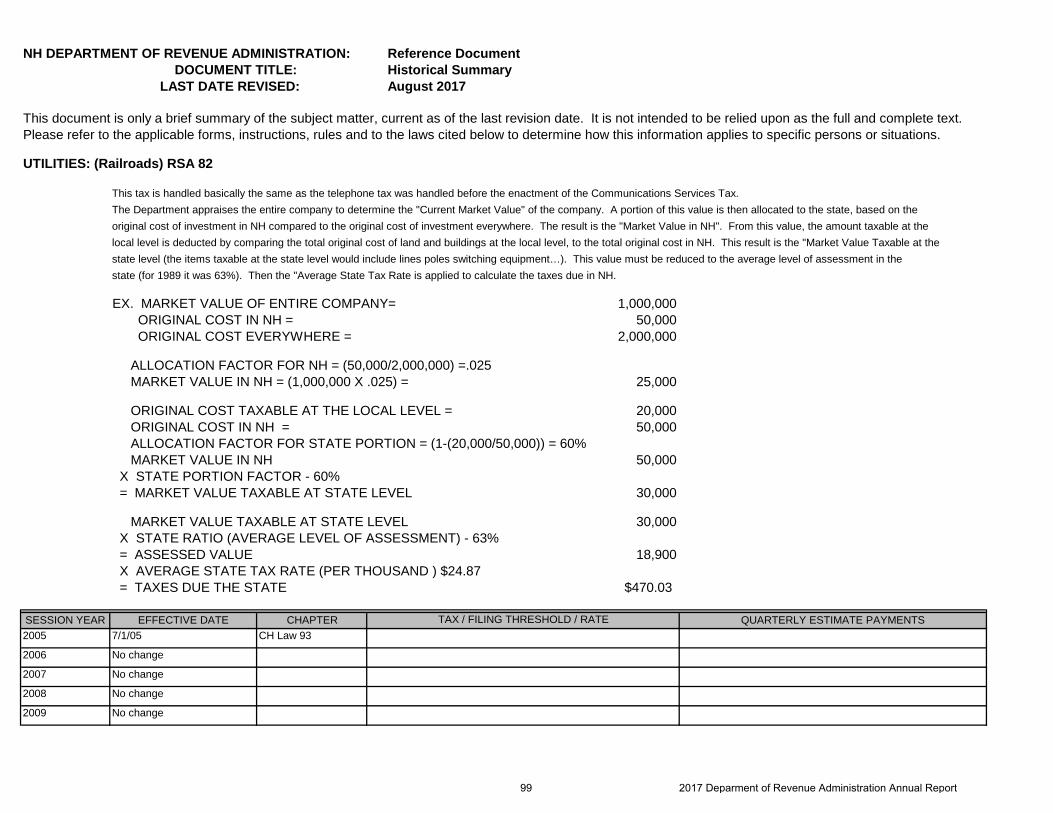
NH DEPARTMENT OF REVENUE ADMINISTRATION: Reference Document DOCUMENT TITLE: Historical Summary LAST DATE REVISED: August 2017
UTILITIES: (Railroads) RSA 82
This tax is handled basically the same as the telephone tax was handled before the enactment of the Communications Services Tax.The Department appraises the entire company to determine the "Current Market Value" of the company. A portion of this value is then allocated to the state, based on the original cost of investment in NH compared to the original cost of investment everywhere. The result is the "Market Value in NH". From this value, the amount taxable at the local level is deducted by comparing the total original cost of land and buildings at the local level, to the total original cost in NH. This result is the "Market Value Taxable at thestate level (the items taxable at the state level would include lines poles switching equipment…). This value must be reduced to the average level of assessment in the state (for 1989 it was 63%). Then the "Average State Tax Rate is applied to calculate the taxes due in NH.
1,000,00050,000
2,000,000
25,000
20,00050,000
50,000
30,000
30,000
18,900
$470.03
SESSION YEAR EFFECTIVE DATE CHAPTER QUARTERLY ESTIMATE PAYMENTS2005 7/1/05 CH Law 93
2006 No change
2007 No change
2008 No change
2009 No change
MARKET VALUE TAXABLE AT STATE LEVEL
= ASSESSED VALUE X STATE RATIO (AVERAGE LEVEL OF ASSESSMENT) - 63%
X AVERAGE STATE TAX RATE (PER THOUSAND ) $24.87 = TAXES DUE THE STATE
TAX / FILING THRESHOLD / RATE
ALLOCATION FACTOR FOR STATE PORTION = (1-(20,000/50,000)) = 60% MARKET VALUE IN NH X STATE PORTION FACTOR - 60% = MARKET VALUE TAXABLE AT STATE LEVEL
This document is only a brief summary of the subject matter, current as of the last revision date. It is not intended to be relied upon as the full and complete text. Please refer to the applicable forms, instructions, rules and to the laws cited below to determine how this information applies to specific persons or situations.
ORIGINAL COST EVERYWHERE =
ORIGINAL COST IN NH =
EX. MARKET VALUE OF ENTIRE COMPANY= ORIGINAL COST IN NH =
ALLOCATION FACTOR FOR NH = (50,000/2,000,000) =.025 MARKET VALUE IN NH = (1,000,000 X .025) =
ORIGINAL COST TAXABLE AT THE LOCAL LEVEL =
99 2017 Deparment of Revenue Administration Annual Report
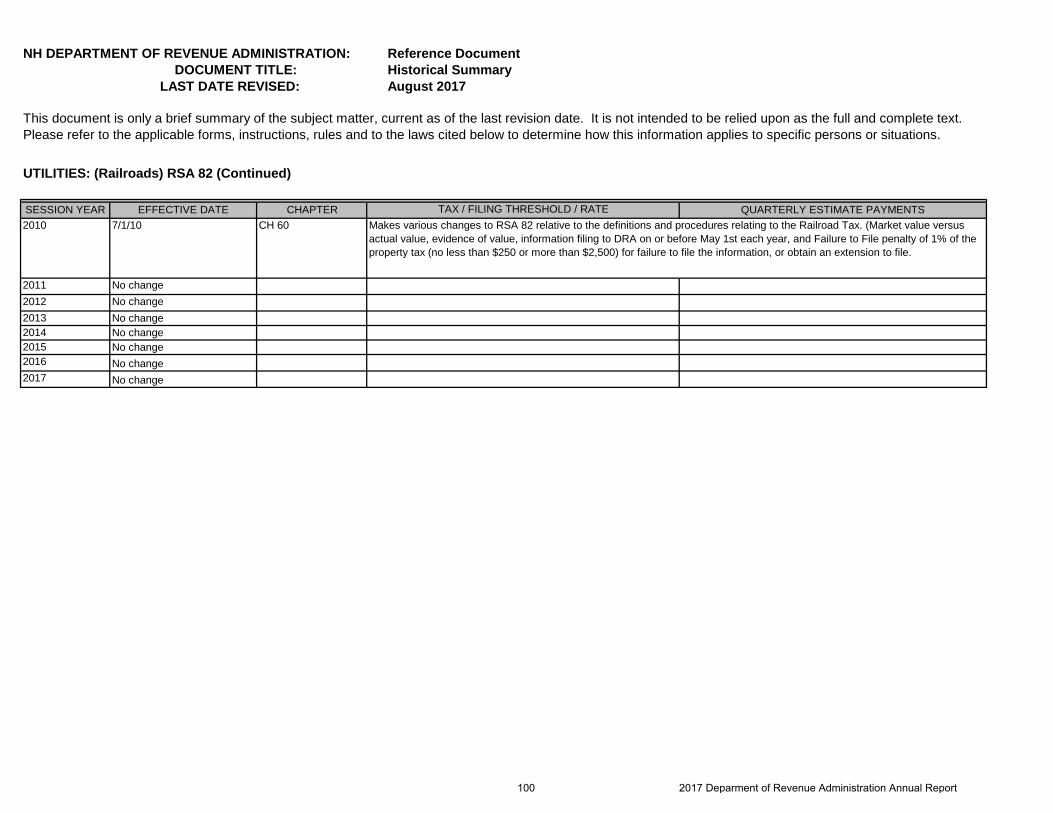
NH DEPARTMENT OF REVENUE ADMINISTRATION: Reference Document DOCUMENT TITLE: Historical Summary LAST DATE REVISED: August 2017
This document is only a brief summary of the subject matter, current as of the last revision date. It is not intended to be relied upon as the full and complete text. Please refer to the applicable forms, instructions, rules and to the laws cited below to determine how this information applies to specific persons or situations.
UTILITIES: (Railroads) RSA 82 (Continued)
SESSION YEAR EFFECTIVE DATE CHAPTER QUARTERLY ESTIMATE PAYMENTS2010 7/1/10 CH 60
2011 No change2012 No change2013 No change2014 No change2015 No change2016 No change2017 No change
Makes various changes to RSA 82 relative to the definitions and procedures relating to the Railroad Tax. (Market value versus actual value, evidence of value, information filing to DRA on or before May 1st each year, and Failure to File penalty of 1% of the property tax (no less than $250 or more than $2,500) for failure to file the information, or obtain an extension to file.
TAX / FILING THRESHOLD / RATE
100 2017 Deparment of Revenue Administration Annual Report
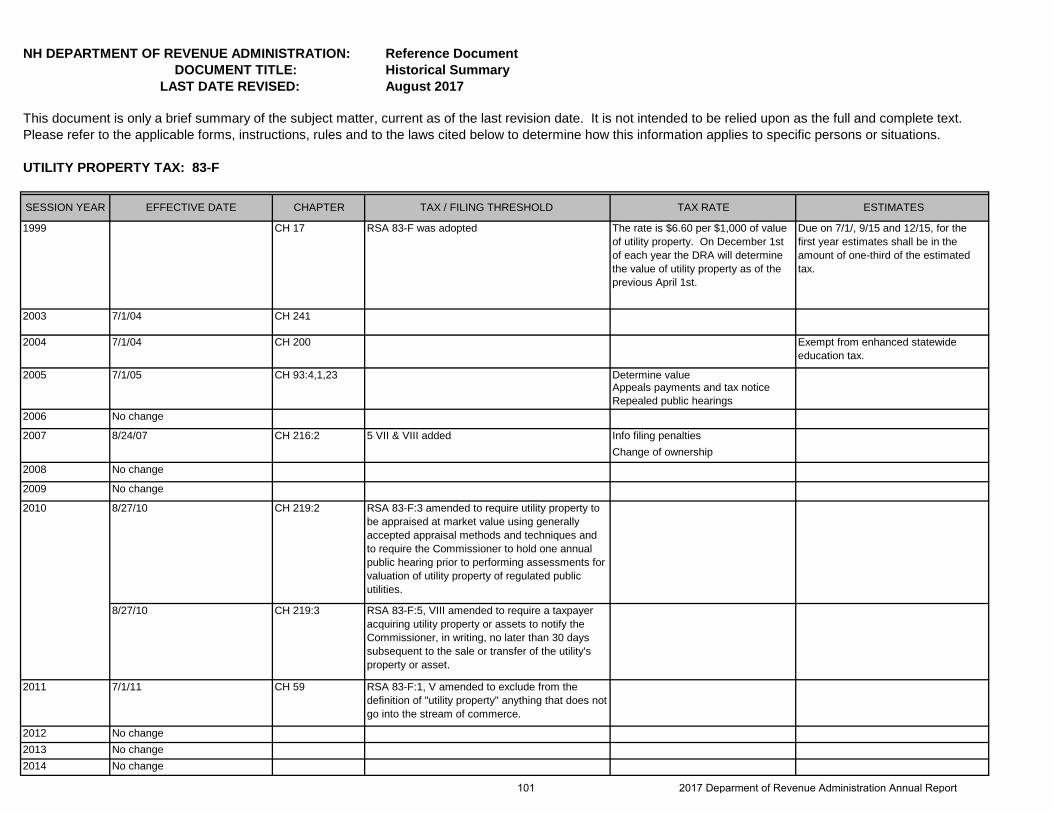
NH DEPARTMENT OF REVENUE ADMINISTRATION: Reference Document DOCUMENT TITLE: Historical Summary LAST DATE REVISED: August 2017
UTILITY PROPERTY TAX: 83-F
SESSION YEAR EFFECTIVE DATE CHAPTER TAX / FILING THRESHOLD TAX RATE ESTIMATES
1999 CH 17 RSA 83-F was adopted The rate is $6.60 per $1,000 of value of utility property. On December 1st of each year the DRA will determine the value of utility property as of the previous April 1st.
Due on 7/1/, 9/15 and 12/15, for the first year estimates shall be in the amount of one-third of the estimated tax.
2003 7/1/04 CH 241
2004 7/1/04 CH 200 Exempt from enhanced statewide education tax.
2005 7/1/05 CH 93:4,1,23 Determine value Appeals payments and tax noticeRepealed public hearings
2006 No change
2007 8/24/07 CH 216:2 5 VII & VIII added Info filing penaltiesChange of ownership
2008 No change
2009 No change
8/27/10 CH 219:2 RSA 83-F:3 amended to require utility property to be appraised at market value using generally accepted appraisal methods and techniques and to require the Commissioner to hold one annual public hearing prior to performing assessments for valuation of utility property of regulated public utilities.
8/27/10 CH 219:3 RSA 83-F:5, VIII amended to require a taxpayer acquiring utility property or assets to notify the Commissioner, in writing, no later than 30 days subsequent to the sale or transfer of the utility's property or asset.
2011 7/1/11 CH 59 RSA 83-F:1, V amended to exclude from the definition of "utility property" anything that does not go into the stream of commerce.
2012 No change2013 No change2014 No change
This document is only a brief summary of the subject matter, current as of the last revision date. It is not intended to be relied upon as the full and complete text. Please refer to the applicable forms, instructions, rules and to the laws cited below to determine how this information applies to specific persons or situations.
2010
101 2017 Deparment of Revenue Administration Annual Report
NH DEPARTMENT OF REVENUE ADMINISTRATION: Reference Document DOCUMENT TITLE: Historical Summary LAST DATE REVISED: August 2017
This document is only a brief summary of the subject matter, current as of the last revision date. It is not intended to be relied upon as the full and complete text. Please refer to the applicable forms, instructions, rules and to the laws cited below to determine how this information applies to specific persons or situations. 2015 No change2016 No change2017 No change
102 2017 Deparment of Revenue Administration Annual Report
This report presents the 2016 Tables by Counties as compiled by the New Hampshire Department of Revenue Administration pursuant to RSA 21-J:3 XII, Which states:
“XII. File with the secretary of state his report showing all the taxable property in the state and its assessed value, it tabulated form, and such other statistics and information as may be deemed of interest. This report shall be filed not later than 30 days after all necessary figures become available.”
Annually, each municipality is required to certify to the Department of Revenue Administration the assessed valuation of all taxable property in that municipality. This information is reported on the Summary Inventory of Valuation, MS-1 Report.
Assessment information is also gathered regarding exemptions and tax credits as well as taxes raised by each municipality. An exemption is an amount deducted from a taxpayer’s assessment vs. a tax credit which is an amount deducted from the taxes due by a taxpayer.
The following is an explanation of the information contained in this report.
Land Valuation: The sum of the taxable land valuations for the following land subcategories:
Current Use: RSA 79-A Conservation Restriction: RSA 79-B Discretionary Easement: RSA 79-C Discretionary Preservation Easement: RSA 79-D Taxation of Farm Structures & Land Under Farm Structures: RSA 79-F Residential Commercial / Industrial
2016 Property Tax Tables
By County, Valuations, Taxes and
Tax Rates State of New Hampshire
103 2017 Deparment of Revenue Administration Annual Report
The values in the above are prior to the application of any exemption and do not include any utility land value. Building Valuation: The sum of the taxable building valuations for the following building subcategories: Residential Manufactured (Mfg) Housing: RSA 674:31 Commercial / Industrial Discretionary Preservation Easement: RSA 79-D Taxation of Farm Structures & Land Under Farm Structures: RSA 79-F The values in the above are prior to the application of any exemption and do not include any utility building value. Public Utilities: The sum of all utility values classified as public water, gas, electric, oil, pipeline or other pursuant to RSA 83-F. Other utilities include that the Department of Revenue Administration has not appraised. Some examples of other utilities include hydro plants, water and certain gas companies. Mature Wood & Timer: RSA 79:5 Gross Valuation: The valuation of all taxable property in each municipality prior to adjustments for property tax exemptions. Educational & Special Exemptions: The sum of the following exemptions:
RSA 72:36-a, Certain Disabled Veterans RSA 72:38-b, Improvements to assist the deaf RSA 72:37-a, Improvements to assist persons with disabilities RSA 72:23 IV, School Dining, Dormitory and Kitchen Exemption (maximum $150,000 per property)
RSA 72:12-a, Water & Air Pollution Control Facilities Exemption
Modified Assessed Valuation: The sum of gross valuation minus the educational and special exemptions. The modified assessed valuation is the basis for calculating the equalized values for each municipality.
Local Optional Exemptions or Exemptions with Optional Elements: Each municipality has adopted an elderly exemption. The amount of the exemption and the specific criteria (asset and income limits) to qualify are determined locally within statutory requirements. Each municipality may adopt the other exemptions listed below in this section:
RSA 72:37, Blind Exemption RSA 72:37-b, Disabled Exemption
104 2017 Deparment of Revenue Administration Annual Report
RSA 72:38-b, Deaf Exemption RSA 72:39-a & b, Elderly Exemption RSA 72:70, Wood-Heating Energy Systems Exemption RSA 72:62, Solar Energy Systems Exemption RSA 72:66, Wind-Powered Energy Systems Exemption
RSA 72:23 IV, Additional School Dining, Dormitory and kitchen Exemption (maximum $150,000 per property)
Net Local Assessed Valuation: The sum of the modified assessed valuation minus the value of the blind, elderly and local optional exemptions.
Gross Property Taxes: The sum of the net tax commitment plus the veteran’s tax credits. The Department of Revenue’s Municipal Services Division establishes the property tax rate using this figure.
Less Veterans Tax Credits: The sum of tax credits granted pursuant to RSA 72:28, RSA 72:29-a, RSA 72:32 and RSA 72:35.
Net Tax Commitment: The sum of the gross property taxes minus the sum of the veteran’s credits. The amount a municipality must actually raise in taxes equals the sum of the amount appropriated by the municipal legislative body minus any revenues.
Actual Tax Rate: The sum of the municipal, county, local, and state school education tax rate. This tax rate does not include any village district or precinct tax rate.
Residents Tax: The sum of monies collected by a municipality for the Resident’s Tax pursuant to RSA 72:1.
County Summary: The total of each of the above listed for all ten counties in the state. The county tax rate listed is the average county Tax rate and is calculated by taking the sum of the tax rates for all municipalities in a county and dividing by the number of municipalities.
Educational & Special Exemptions Report: A breakdown of the educational and special exemptions granted by municipalities. These are not optional.
Local optional Exemptions Report: A breakdown of what each municipality currently grants. These are optional, and must be adopted by legislative body of the municipality.
For further explanation about any information contained in this report, please contact the Department of Revenue Administration, Municipal & Property Division at 603-230-5950.
105 2017 Deparment of Revenue Administration Annual Report
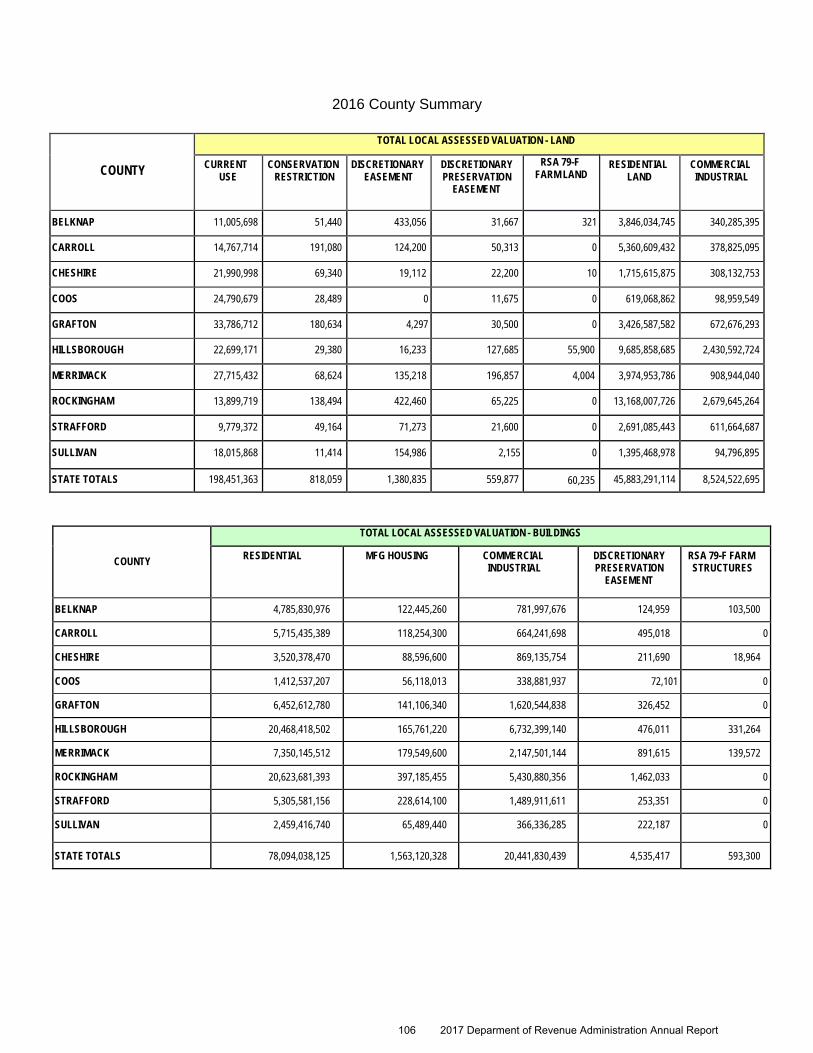
2016 County Summary
COUNTY
TOTAL LOCAL ASSESSED VALUATION - BUILDINGS
RESIDENTIAL MFG HOUSING COMMERCIAL INDUSTRIAL
DISCRETIONARY PRESERVATION
EASEMENT
RSA 79-F FARM STRUCTURES
BELKNAP 4,785,830,976 122,445,260 781,997,676 124,959 103,500
CARROLL 5,715,435,389 118,254,300 664,241,698 495,018 0
CHESHIRE 3,520,378,470 88,596,600 869,135,754 211,690 18,964
COOS 1,412,537,207 56,118,013 338,881,937 72,101 0
GRAFTON 6,452,612,780 141,106,340 1,620,544,838 326,452 0
HILLSBOROUGH 20,468,418,502 165,761,220 6,732,399,140 476,011 331,264
MERRIMACK 7,350,145,512 179,549,600 2,147,501,144 891,615 139,572
ROCKINGHAM 20,623,681,393 397,185,455 5,430,880,356 1,462,033 0
STRAFFORD 5,305,581,156 228,614,100 1,489,911,611 253,351 0
SULLIVAN 2,459,416,740 65,489,440 366,336,285 222,187 0
STATE TOTALS
78,094,038,125
1,563,120,328
20,441,830,439
4,535,417
593,300
COUNTY
TOTAL LOCAL ASSESSED VALUATION - LAND
CURRENT USE
CONSERVATION RESTRICTION
DISCRETIONARY EASEMENT
DISCRETIONARY PRESERVATION
EASEMENT
RSA 79-F FARM LAND
RESIDENTIAL LAND
COMMERCIAL INDUSTRIAL
BELKNAP 11,005,698 51,440 433,056 31,667 321 3,846,034,745 340,285,395
CARROLL 14,767,714 191,080 124,200 50,313 0 5,360,609,432 378,825,095
CHESHIRE 21,990,998 69,340 19,112 22,200 10 1,715,615,875 308,132,753
COOS 24,790,679 28,489 0 11,675 0 619,068,862 98,959,549
GRAFTON 33,786,712 180,634 4,297 30,500 0 3,426,587,582 672,676,293
HILLSBOROUGH 22,699,171 29,380 16,233 127,685 55,900 9,685,858,685 2,430,592,724
MERRIMACK 27,715,432 68,624 135,218 196,857 4,004 3,974,953,786 908,944,040
ROCKINGHAM 13,899,719 138,494 422,460 65,225 0 13,168,007,726 2,679,645,264
STRAFFORD 9,779,372 49,164 71,273 21,600 0 2,691,085,443 611,664,687
SULLIVAN 18,015,868 11,414 154,986 2,155 0 1,395,468,978 94,796,895
STATE TOTALS 198,451,363 818,059 1,380,835 559,877 60,235 45,883,291,114 8,524,522,695
106 2017 Deparment of Revenue Administration Annual Report
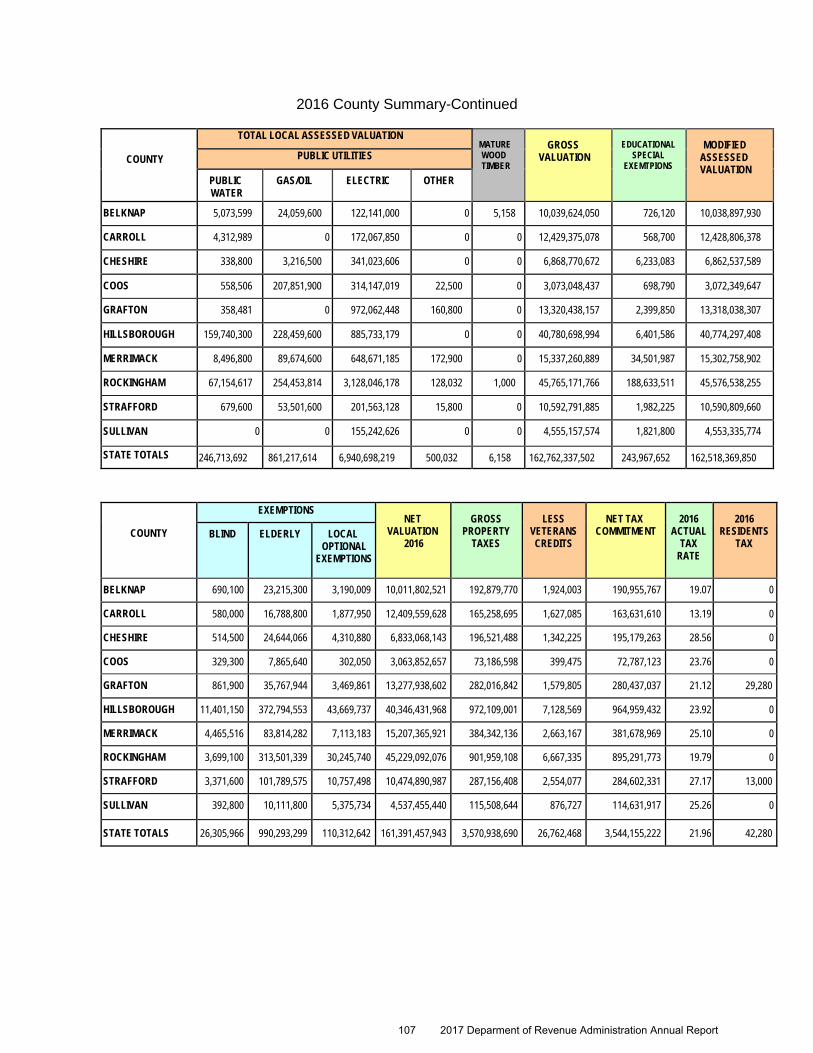
2016 County Summary-Continued
COUNTY
TOTAL LOCAL ASSESSED VALUATION MATURE WOOD TIMBER
GROSS
VALUATION
EDUCATIONAL
SPECIAL EXEMTPIONS
MODIFIED
ASSESSED VALUATION
PUBLIC UTILITIES
PUBLIC WATER
GAS/OIL ELECTRIC OTHER
BELKNAP 5,073,599 24,059,600 122,141,000 0 5,158 10,039,624,050 726,120 10,038,897,930
CARROLL 4,312,989 0 172,067,850 0 0 12,429,375,078 568,700 12,428,806,378
CHESHIRE 338,800 3,216,500 341,023,606 0 0 6,868,770,672 6,233,083 6,862,537,589
COOS 558,506 207,851,900 314,147,019 22,500 0 3,073,048,437 698,790 3,072,349,647
GRAFTON 358,481 0 972,062,448 160,800 0 13,320,438,157 2,399,850 13,318,038,307
HILLSBOROUGH 159,740,300 228,459,600 885,733,179 0 0 40,780,698,994 6,401,586 40,774,297,408
MERRIMACK 8,496,800 89,674,600 648,671,185 172,900 0 15,337,260,889 34,501,987 15,302,758,902
ROCKINGHAM 67,154,617 254,453,814 3,128,046,178 128,032 1,000 45,765,171,766 188,633,511 45,576,538,255
STRAFFORD 679,600 53,501,600 201,563,128 15,800 0 10,592,791,885 1,982,225 10,590,809,660
SULLIVAN 0 0 155,242,626 0 0 4,555,157,574 1,821,800 4,553,335,774
STATE TOTALS 246,713,692 861,217,614 6,940,698,219 500,032 6,158 162,762,337,502 243,967,652 162,518,369,850
COUNTY
EXEMPTIONS NET
VALUATION 2016
GROSS
PROPERTY TAXES
LESS
VETERANS CREDITS
NET TAX
COMMITMENT
2016
ACTUAL TAX
RATE
2016
RESIDENTS TAX
BLIND ELDERLY LOCAL OPTIONAL
EXEMPTIONS
BELKNAP 690,100 23,215,300 3,190,009 10,011,802,521 192,879,770 1,924,003 190,955,767 19.07 0
CARROLL 580,000 16,788,800 1,877,950 12,409,559,628 165,258,695 1,627,085 163,631,610 13.19 0
CHESHIRE 514,500 24,644,066 4,310,880 6,833,068,143 196,521,488 1,342,225 195,179,263 28.56 0
COOS 329,300 7,865,640 302,050 3,063,852,657 73,186,598 399,475 72,787,123 23.76 0
GRAFTON 861,900 35,767,944 3,469,861 13,277,938,602 282,016,842 1,579,805 280,437,037 21.12 29,280
HILLSBOROUGH 11,401,150 372,794,553 43,669,737 40,346,431,968 972,109,001 7,128,569 964,959,432 23.92 0
MERRIMACK 4,465,516 83,814,282 7,113,183 15,207,365,921 384,342,136 2,663,167 381,678,969 25.10 0
ROCKINGHAM 3,699,100 313,501,339 30,245,740 45,229,092,076 901,959,108 6,667,335 895,291,773 19.79 0
STRAFFORD 3,371,600 101,789,575 10,757,498 10,474,890,987 287,156,408 2,554,077 284,602,331 27.17 13,000
SULLIVAN 392,800 10,111,800 5,375,734 4,537,455,440 115,508,644 876,727 114,631,917 25.26 0
STATE TOTALS
26,305,966
990,293,299
110,312,642
161,391,457,943
3,570,938,690
26,762,468
3,544,155,222
21.96
42,280
107 2017 Deparment of Revenue Administration Annual Report
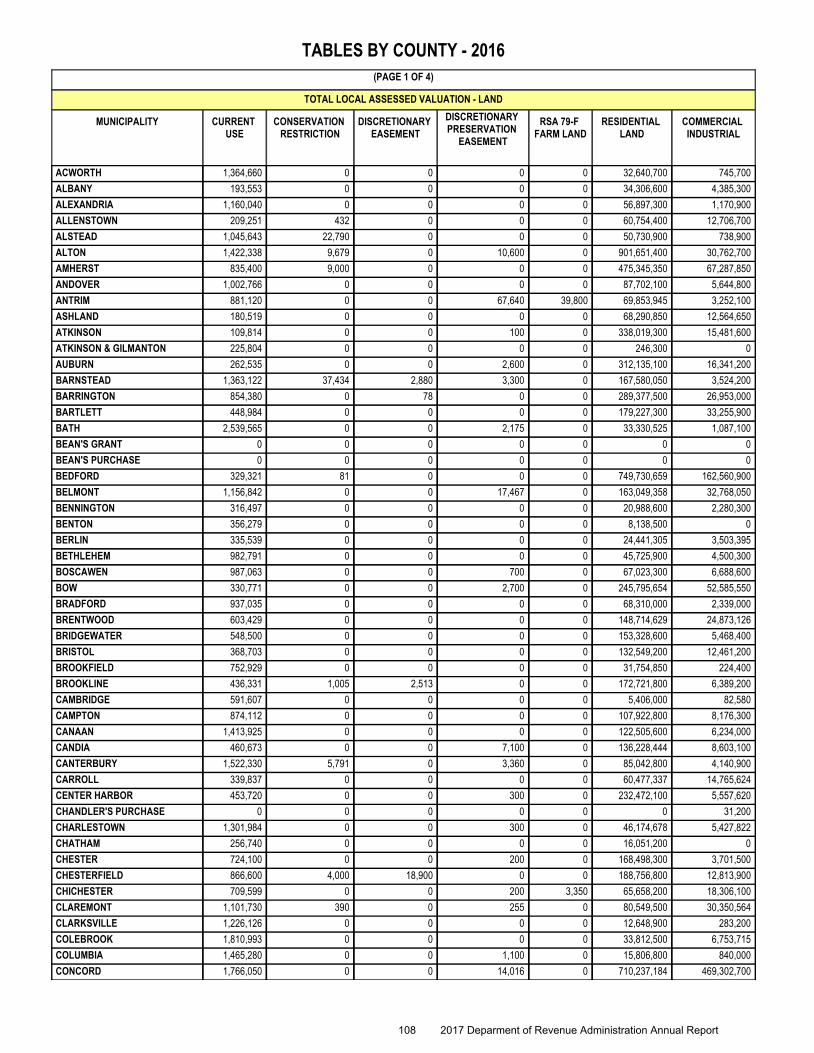
CURRENT USE
CONSERVATION RESTRICTION
DISCRETIONARY EASEMENT
DISCRETIONARY PRESERVATION
EASEMENT
RESIDENTIAL LAND
COMMERCIAL INDUSTRIAL
TOTAL LOCAL ASSESSED VALUATION - LAND
(PAGE 1 OF 4)
TABLES BY COUNTY - 2016
RSA 79-F FARM LAND
MUNICIPALITY
ACWORTH 1,364,660 0 0 0 32,640,700 745,7000
ALBANY 193,553 0 0 0 34,306,600 4,385,3000
ALEXANDRIA 1,160,040 0 0 0 56,897,300 1,170,9000
ALLENSTOWN 209,251 432 0 0 60,754,400 12,706,7000
ALSTEAD 1,045,643 22,790 0 0 50,730,900 738,9000
ALTON 1,422,338 9,679 0 10,600 901,651,400 30,762,7000
AMHERST 835,400 9,000 0 0 475,345,350 67,287,8500
ANDOVER 1,002,766 0 0 0 87,702,100 5,644,8000
ANTRIM 881,120 0 0 67,640 69,853,945 3,252,10039,800
ASHLAND 180,519 0 0 0 68,290,850 12,564,6500
ATKINSON 109,814 0 0 100 338,019,300 15,481,6000
ATKINSON & GILMANTON 225,804 0 0 0 246,300 00
AUBURN 262,535 0 0 2,600 312,135,100 16,341,2000
BARNSTEAD 1,363,122 37,434 2,880 3,300 167,580,050 3,524,2000
BARRINGTON 854,380 0 78 0 289,377,500 26,953,0000
BARTLETT 448,984 0 0 0 179,227,300 33,255,9000
BATH 2,539,565 0 0 2,175 33,330,525 1,087,1000
BEAN'S GRANT 0 0 0 0 0 00
BEAN'S PURCHASE 0 0 0 0 0 00
BEDFORD 329,321 81 0 0 749,730,659 162,560,9000
BELMONT 1,156,842 0 0 17,467 163,049,358 32,768,0500
BENNINGTON 316,497 0 0 0 20,988,600 2,280,3000
BENTON 356,279 0 0 0 8,138,500 00
BERLIN 335,539 0 0 0 24,441,305 3,503,3950
BETHLEHEM 982,791 0 0 0 45,725,900 4,500,3000
BOSCAWEN 987,063 0 0 700 67,023,300 6,688,6000
BOW 330,771 0 0 2,700 245,795,654 52,585,5500
BRADFORD 937,035 0 0 0 68,310,000 2,339,0000
BRENTWOOD 603,429 0 0 0 148,714,629 24,873,1260
BRIDGEWATER 548,500 0 0 0 153,328,600 5,468,4000
BRISTOL 368,703 0 0 0 132,549,200 12,461,2000
BROOKFIELD 752,929 0 0 0 31,754,850 224,4000
BROOKLINE 436,331 1,005 2,513 0 172,721,800 6,389,2000
CAMBRIDGE 591,607 0 0 0 5,406,000 82,5800
CAMPTON 874,112 0 0 0 107,922,800 8,176,3000
CANAAN 1,413,925 0 0 0 122,505,600 6,234,0000
CANDIA 460,673 0 0 7,100 136,228,444 8,603,1000
CANTERBURY 1,522,330 5,791 0 3,360 85,042,800 4,140,9000
CARROLL 339,837 0 0 0 60,477,337 14,765,6240
CENTER HARBOR 453,720 0 0 300 232,472,100 5,557,6200
CHANDLER'S PURCHASE 0 0 0 0 0 31,2000
CHARLESTOWN 1,301,984 0 0 300 46,174,678 5,427,8220
CHATHAM 256,740 0 0 0 16,051,200 00
CHESTER 724,100 0 0 200 168,498,300 3,701,5000
CHESTERFIELD 866,600 4,000 18,900 0 188,756,800 12,813,9000
CHICHESTER 709,599 0 0 200 65,658,200 18,306,1003,350
CLAREMONT 1,101,730 390 0 255 80,549,500 30,350,5640
CLARKSVILLE 1,226,126 0 0 0 12,648,900 283,2000
COLEBROOK 1,810,993 0 0 0 33,812,500 6,753,7150
COLUMBIA 1,465,280 0 0 1,100 15,806,800 840,0000
CONCORD 1,766,050 0 0 14,016 710,237,184 469,302,7000
108 2017 Deparment of Revenue Administration Annual Report
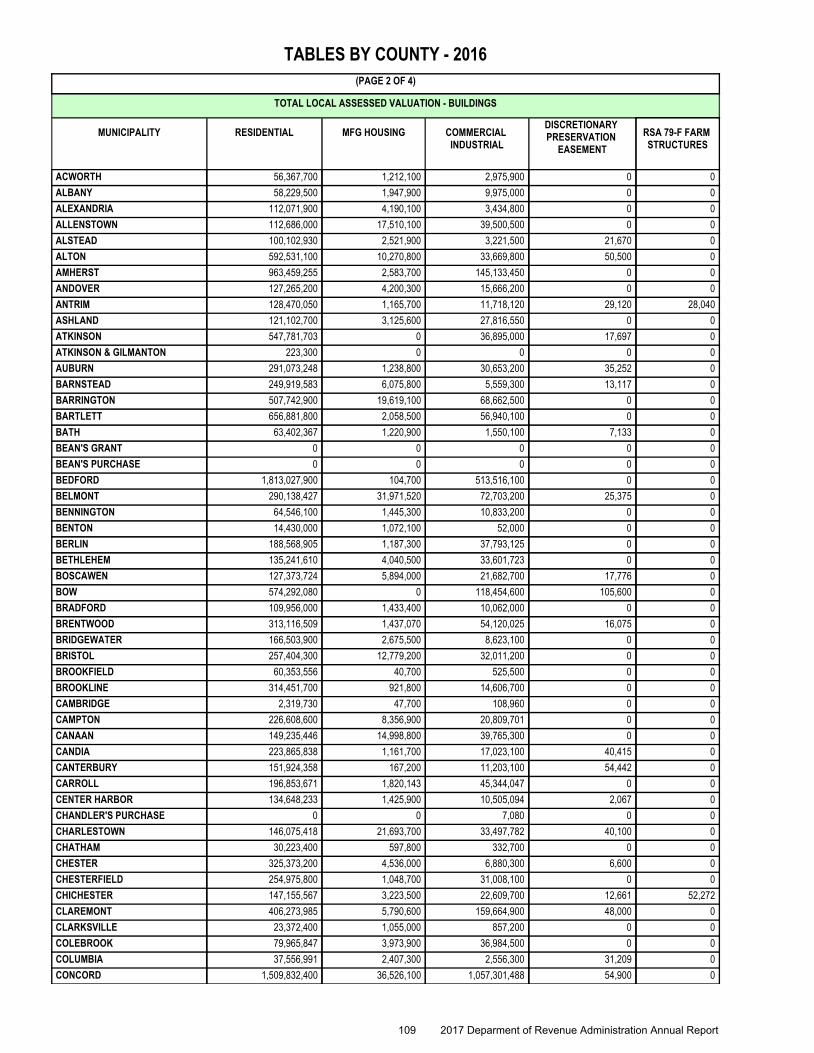
RESIDENTIAL MFG HOUSING COMMERCIAL INDUSTRIAL
DISCRETIONARY PRESERVATION
EASEMENT
TOTAL LOCAL ASSESSED VALUATION - BUILDINGS
(PAGE 2 OF 4)
TABLES BY COUNTY - 2016
RSA 79-F FARM STRUCTURES
MUNICIPALITY
ACWORTH 56,367,700 1,212,100 2,975,900 0 0
ALBANY 58,229,500 1,947,900 9,975,000 0 0
ALEXANDRIA 112,071,900 4,190,100 3,434,800 0 0
ALLENSTOWN 112,686,000 17,510,100 39,500,500 0 0
ALSTEAD 100,102,930 2,521,900 3,221,500 21,670 0
ALTON 592,531,100 10,270,800 33,669,800 50,500 0
AMHERST 963,459,255 2,583,700 145,133,450 0 0
ANDOVER 127,265,200 4,200,300 15,666,200 0 0
ANTRIM 128,470,050 1,165,700 11,718,120 29,120 28,040
ASHLAND 121,102,700 3,125,600 27,816,550 0 0
ATKINSON 547,781,703 0 36,895,000 17,697 0
ATKINSON & GILMANTON 223,300 0 0 0 0
AUBURN 291,073,248 1,238,800 30,653,200 35,252 0
BARNSTEAD 249,919,583 6,075,800 5,559,300 13,117 0
BARRINGTON 507,742,900 19,619,100 68,662,500 0 0
BARTLETT 656,881,800 2,058,500 56,940,100 0 0
BATH 63,402,367 1,220,900 1,550,100 7,133 0
BEAN'S GRANT 0 0 0 0 0
BEAN'S PURCHASE 0 0 0 0 0
BEDFORD 1,813,027,900 104,700 513,516,100 0 0
BELMONT 290,138,427 31,971,520 72,703,200 25,375 0
BENNINGTON 64,546,100 1,445,300 10,833,200 0 0
BENTON 14,430,000 1,072,100 52,000 0 0
BERLIN 188,568,905 1,187,300 37,793,125 0 0
BETHLEHEM 135,241,610 4,040,500 33,601,723 0 0
BOSCAWEN 127,373,724 5,894,000 21,682,700 17,776 0
BOW 574,292,080 0 118,454,600 105,600 0
BRADFORD 109,956,000 1,433,400 10,062,000 0 0
BRENTWOOD 313,116,509 1,437,070 54,120,025 16,075 0
BRIDGEWATER 166,503,900 2,675,500 8,623,100 0 0
BRISTOL 257,404,300 12,779,200 32,011,200 0 0
BROOKFIELD 60,353,556 40,700 525,500 0 0
BROOKLINE 314,451,700 921,800 14,606,700 0 0
CAMBRIDGE 2,319,730 47,700 108,960 0 0
CAMPTON 226,608,600 8,356,900 20,809,701 0 0
CANAAN 149,235,446 14,998,800 39,765,300 0 0
CANDIA 223,865,838 1,161,700 17,023,100 40,415 0
CANTERBURY 151,924,358 167,200 11,203,100 54,442 0
CARROLL 196,853,671 1,820,143 45,344,047 0 0
CENTER HARBOR 134,648,233 1,425,900 10,505,094 2,067 0
CHANDLER'S PURCHASE 0 0 7,080 0 0
CHARLESTOWN 146,075,418 21,693,700 33,497,782 40,100 0
CHATHAM 30,223,400 597,800 332,700 0 0
CHESTER 325,373,200 4,536,000 6,880,300 6,600 0
CHESTERFIELD 254,975,800 1,048,700 31,008,100 0 0
CHICHESTER 147,155,567 3,223,500 22,609,700 12,661 52,272
CLAREMONT 406,273,985 5,790,600 159,664,900 48,000 0
CLARKSVILLE 23,372,400 1,055,000 857,200 0 0
COLEBROOK 79,965,847 3,973,900 36,984,500 0 0
COLUMBIA 37,556,991 2,407,300 2,556,300 31,209 0
CONCORD 1,509,832,400 36,526,100 1,057,301,488 54,900 0
109 2017 Deparment of Revenue Administration Annual Report

PUBLIC WATER
GAS ELECTRIC OTHER
MATURE WOOD TIMBER
TOTAL LOCAL ASSESSED VALUATION
(PAGE 3 OF 4)
GROSS VALUATION
MODIFIED ASSESSED VALUATION
EDUCATIONAL SPECIAL
EXEMTPIONS
TABLES BY COUNTY - 2016
MUNICIPALITYPUBLIC UTILITIES
ACWORTH 0 0 2,154,758 0 0 97,461,518 0 97,461,518
ALBANY 37,100 0 2,707,200 0 0 111,782,153 0 111,782,153
ALEXANDRIA 0 0 21,658,600 0 0 200,583,640 0 200,583,640
ALLENSTOWN 0 2,328,400 5,727,500 0 0 251,423,283 0 251,423,283
ALSTEAD 0 0 3,464,000 0 0 161,870,233 0 161,870,233
ALTON 0 0 7,480,000 0 0 1,577,858,917 0 1,577,858,917
AMHERST 8,222,500 4,250,700 36,500,000 0 0 1,703,627,205 0 1,703,627,205
ANDOVER 0 0 12,342,300 0 0 253,823,666 150,000 253,673,666
ANTRIM 0 0 11,957,440 0 0 227,463,075 0 227,463,075
ASHLAND 0 0 5,059,356 0 0 238,140,225 745,350 237,394,875
ATKINSON 3,322,800 296,300 5,882,800 0 0 947,807,114 174,200 947,632,914
ATKINSON & GILMANTON 0 0 0 0 0 695,404 0 695,404
AUBURN 0 76,400 7,916,300 0 0 659,734,635 134,376 659,600,259
BARNSTEAD 3,602,082 0 5,454,100 0 0 443,134,968 202,500 442,932,468
BARRINGTON 0 0 10,460,300 0 0 923,669,758 0 923,669,758
BARTLETT 0 0 7,120,000 0 0 935,932,584 0 935,932,584
BATH 0 0 17,917,900 0 0 121,057,765 0 121,057,765
BEAN'S GRANT 0 0 509 0 0 509 0 509
BEAN'S PURCHASE 0 0 0 0 0 0 0 0
BEDFORD 5,954,100 3,400,000 32,361,700 0 0 3,280,985,461 677,200 3,280,308,261
BELMONT 448,147 1,554,300 7,417,200 0 0 601,249,886 0 601,249,886
BENNINGTON 0 0 3,636,400 0 0 104,046,397 0 104,046,397
BENTON 0 0 1,031,200 0 0 25,080,079 0 25,080,079
BERLIN 0 18,557,400 123,764,500 0 0 398,151,469 698,790 397,452,679
BETHLEHEM 128,981 0 6,313,000 160,800 0 230,695,605 150,000 230,545,605
BOSCAWEN 0 566,100 6,173,800 0 0 236,407,763 0 236,407,763
BOW 1,061,600 4,997,000 201,122,300 78,300 0 1,198,826,155 25,484,649 1,173,341,506
BRADFORD 0 0 4,916,500 0 0 197,953,935 0 197,953,935
BRENTWOOD 0 239,700 22,305,100 0 0 565,425,663 0 565,425,663
BRIDGEWATER 0 0 6,981,700 0 0 344,129,700 0 344,129,700
BRISTOL 0 0 21,638,300 0 0 469,212,103 5,500 469,206,603
BROOKFIELD 0 0 1,360,400 0 0 95,012,335 0 95,012,335
BROOKLINE 0 0 8,249,800 0 0 517,780,849 0 517,780,849
CAMBRIDGE 0 0 164,915 0 0 8,721,492 0 8,721,492
CAMPTON 32,600 0 8,687,500 0 0 381,468,513 0 381,468,513
CANAAN 0 0 7,993,100 0 0 342,146,171 150,000 341,996,171
CANDIA 0 0 7,254,916 0 1,000 394,646,286 0 394,646,286
CANTERBURY 0 227,600 5,930,500 0 0 260,222,381 28,606 260,193,775
CARROLL 558,506 0 2,675,755 0 0 322,834,920 0 322,834,920
CENTER HARBOR 0 0 1,681,000 0 0 386,746,034 0 386,746,034
CHANDLER'S PURCHASE 0 0 2,096 0 0 40,376 0 40,376
CHARLESTOWN 0 0 27,137,200 0 0 281,348,984 0 281,348,984
CHATHAM 0 0 803,300 0 0 48,265,140 0 48,265,140
CHESTER 68,700 0 43,806,200 0 0 553,595,100 0 553,595,100
CHESTERFIELD 0 0 5,102,619 0 0 494,595,419 0 494,595,419
CHICHESTER 0 0 4,579,000 0 0 262,310,149 629,650 261,680,499
CLAREMONT 0 0 14,128,800 0 0 697,908,724 0 697,908,724
CLARKSVILLE 0 0 1,544,100 0 0 40,986,926 0 40,986,926
COLEBROOK 0 10,112,400 5,597,500 0 0 179,011,355 0 179,011,355
COLUMBIA 0 21,867,700 3,100,700 0 0 85,633,380 0 85,633,380
CONCORD 0 43,667,400 133,349,800 0 0 3,962,052,038 6,754,100 3,955,297,938
110 2017 Deparment of Revenue Administration Annual Report
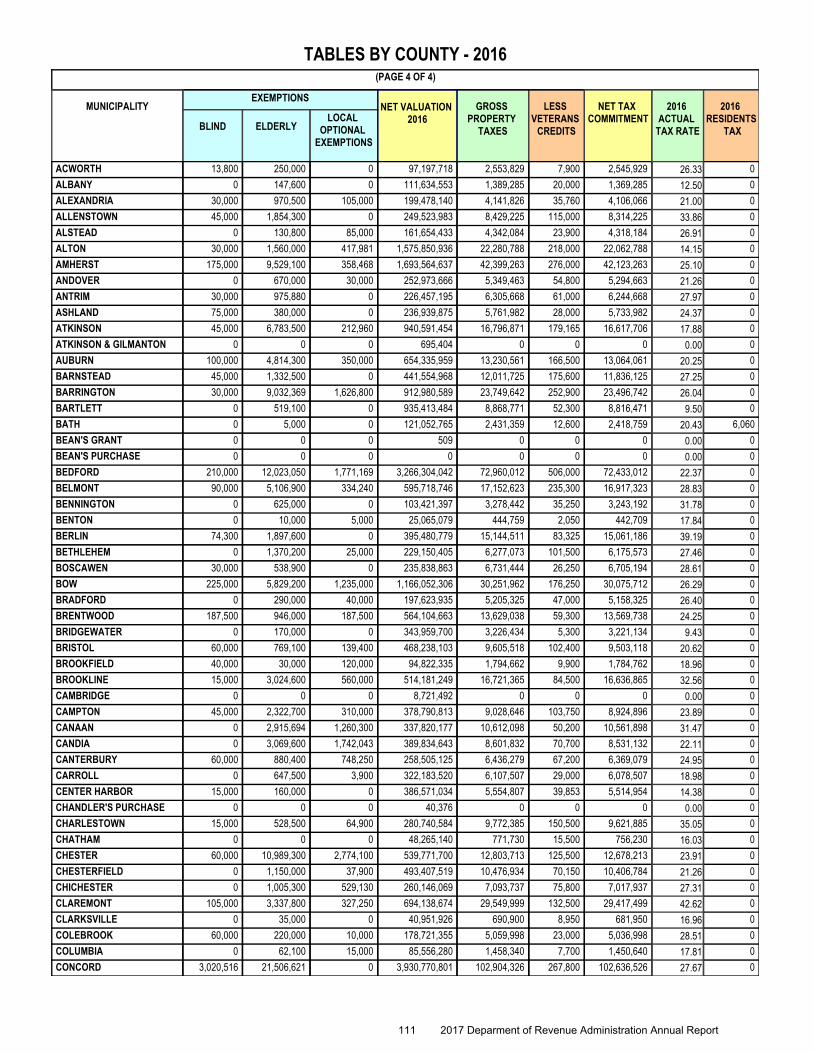
NET VALUATION 2016
GROSS PROPERTY
TAXES
LESS VETERANS
CREDITS
EXEMPTIONS
(PAGE 4 OF 4)
NET TAX COMMITMENT
2016 RESIDENTS
TAX
2016 ACTUAL
TAX RATEBLIND ELDERLYLOCAL
OPTIONAL EXEMPTIONS
TABLES BY COUNTY - 2016
MUNICIPALITY
ACWORTH 13,800 250,000 0 97,197,718 2,553,829 7,900 2,545,929 026.33
ALBANY 0 147,600 0 111,634,553 1,389,285 20,000 1,369,285 012.50
ALEXANDRIA 30,000 970,500 105,000 199,478,140 4,141,826 35,760 4,106,066 021.00
ALLENSTOWN 45,000 1,854,300 0 249,523,983 8,429,225 115,000 8,314,225 033.86
ALSTEAD 0 130,800 85,000 161,654,433 4,342,084 23,900 4,318,184 026.91
ALTON 30,000 1,560,000 417,981 1,575,850,936 22,280,788 218,000 22,062,788 014.15
AMHERST 175,000 9,529,100 358,468 1,693,564,637 42,399,263 276,000 42,123,263 025.10
ANDOVER 0 670,000 30,000 252,973,666 5,349,463 54,800 5,294,663 021.26
ANTRIM 30,000 975,880 0 226,457,195 6,305,668 61,000 6,244,668 027.97
ASHLAND 75,000 380,000 0 236,939,875 5,761,982 28,000 5,733,982 024.37
ATKINSON 45,000 6,783,500 212,960 940,591,454 16,796,871 179,165 16,617,706 017.88
ATKINSON & GILMANTON 0 0 0 695,404 0 0 0 00.00
AUBURN 100,000 4,814,300 350,000 654,335,959 13,230,561 166,500 13,064,061 020.25
BARNSTEAD 45,000 1,332,500 0 441,554,968 12,011,725 175,600 11,836,125 027.25
BARRINGTON 30,000 9,032,369 1,626,800 912,980,589 23,749,642 252,900 23,496,742 026.04
BARTLETT 0 519,100 0 935,413,484 8,868,771 52,300 8,816,471 09.50
BATH 0 5,000 0 121,052,765 2,431,359 12,600 2,418,759 6,06020.43
BEAN'S GRANT 0 0 0 509 0 0 0 00.00
BEAN'S PURCHASE 0 0 0 0 0 0 0 00.00
BEDFORD 210,000 12,023,050 1,771,169 3,266,304,042 72,960,012 506,000 72,433,012 022.37
BELMONT 90,000 5,106,900 334,240 595,718,746 17,152,623 235,300 16,917,323 028.83
BENNINGTON 0 625,000 0 103,421,397 3,278,442 35,250 3,243,192 031.78
BENTON 0 10,000 5,000 25,065,079 444,759 2,050 442,709 017.84
BERLIN 74,300 1,897,600 0 395,480,779 15,144,511 83,325 15,061,186 039.19
BETHLEHEM 0 1,370,200 25,000 229,150,405 6,277,073 101,500 6,175,573 027.46
BOSCAWEN 30,000 538,900 0 235,838,863 6,731,444 26,250 6,705,194 028.61
BOW 225,000 5,829,200 1,235,000 1,166,052,306 30,251,962 176,250 30,075,712 026.29
BRADFORD 0 290,000 40,000 197,623,935 5,205,325 47,000 5,158,325 026.40
BRENTWOOD 187,500 946,000 187,500 564,104,663 13,629,038 59,300 13,569,738 024.25
BRIDGEWATER 0 170,000 0 343,959,700 3,226,434 5,300 3,221,134 09.43
BRISTOL 60,000 769,100 139,400 468,238,103 9,605,518 102,400 9,503,118 020.62
BROOKFIELD 40,000 30,000 120,000 94,822,335 1,794,662 9,900 1,784,762 018.96
BROOKLINE 15,000 3,024,600 560,000 514,181,249 16,721,365 84,500 16,636,865 032.56
CAMBRIDGE 0 0 0 8,721,492 0 0 0 00.00
CAMPTON 45,000 2,322,700 310,000 378,790,813 9,028,646 103,750 8,924,896 023.89
CANAAN 0 2,915,694 1,260,300 337,820,177 10,612,098 50,200 10,561,898 031.47
CANDIA 0 3,069,600 1,742,043 389,834,643 8,601,832 70,700 8,531,132 022.11
CANTERBURY 60,000 880,400 748,250 258,505,125 6,436,279 67,200 6,369,079 024.95
CARROLL 0 647,500 3,900 322,183,520 6,107,507 29,000 6,078,507 018.98
CENTER HARBOR 15,000 160,000 0 386,571,034 5,554,807 39,853 5,514,954 014.38
CHANDLER'S PURCHASE 0 0 0 40,376 0 0 0 00.00
CHARLESTOWN 15,000 528,500 64,900 280,740,584 9,772,385 150,500 9,621,885 035.05
CHATHAM 0 0 0 48,265,140 771,730 15,500 756,230 016.03
CHESTER 60,000 10,989,300 2,774,100 539,771,700 12,803,713 125,500 12,678,213 023.91
CHESTERFIELD 0 1,150,000 37,900 493,407,519 10,476,934 70,150 10,406,784 021.26
CHICHESTER 0 1,005,300 529,130 260,146,069 7,093,737 75,800 7,017,937 027.31
CLAREMONT 105,000 3,337,800 327,250 694,138,674 29,549,999 132,500 29,417,499 042.62
CLARKSVILLE 0 35,000 0 40,951,926 690,900 8,950 681,950 016.96
COLEBROOK 60,000 220,000 10,000 178,721,355 5,059,998 23,000 5,036,998 028.51
COLUMBIA 0 62,100 15,000 85,556,280 1,458,340 7,700 1,450,640 017.81
CONCORD 3,020,516 21,506,621 0 3,930,770,801 102,904,326 267,800 102,636,526 027.67
111 2017 Deparment of Revenue Administration Annual Report
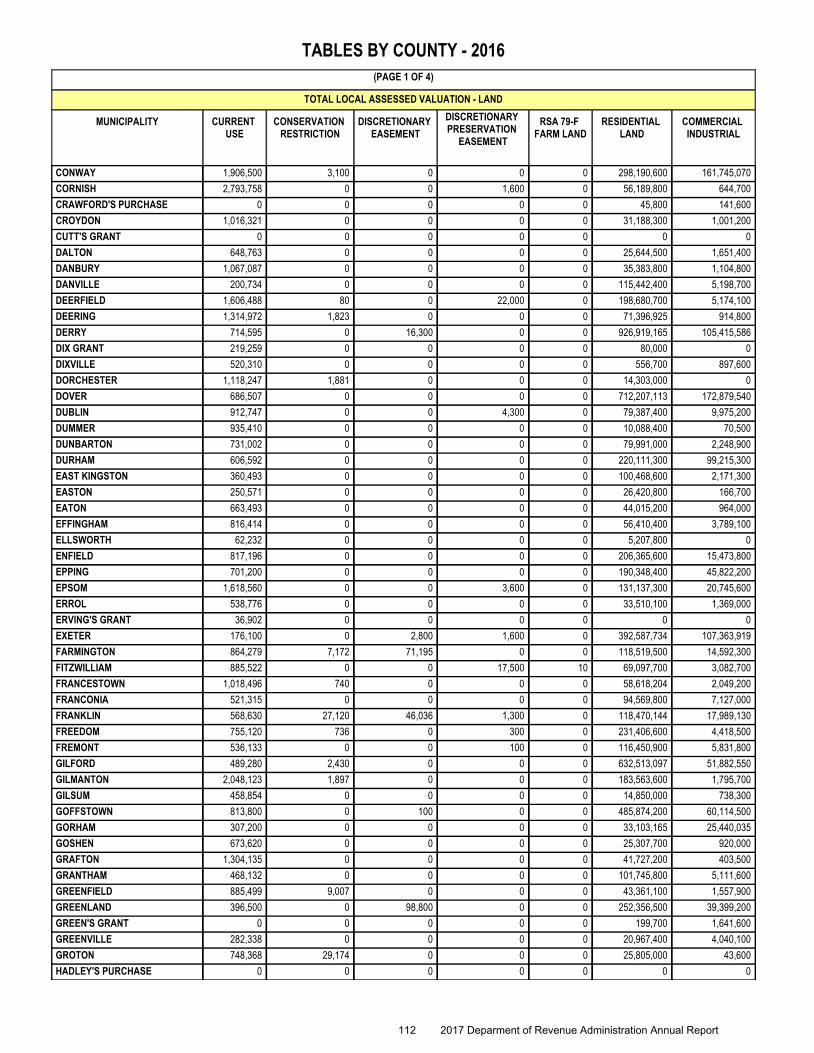
CURRENT USE
CONSERVATION RESTRICTION
DISCRETIONARY EASEMENT
DISCRETIONARY PRESERVATION
EASEMENT
RESIDENTIAL LAND
COMMERCIAL INDUSTRIAL
TOTAL LOCAL ASSESSED VALUATION - LAND
(PAGE 1 OF 4)
TABLES BY COUNTY - 2016
RSA 79-F FARM LAND
MUNICIPALITY
CONWAY 1,906,500 3,100 0 0 298,190,600 161,745,0700
CORNISH 2,793,758 0 0 1,600 56,189,800 644,7000
CRAWFORD'S PURCHASE 0 0 0 0 45,800 141,6000
CROYDON 1,016,321 0 0 0 31,188,300 1,001,2000
CUTT'S GRANT 0 0 0 0 0 00
DALTON 648,763 0 0 0 25,644,500 1,651,4000
DANBURY 1,067,087 0 0 0 35,383,800 1,104,8000
DANVILLE 200,734 0 0 0 115,442,400 5,198,7000
DEERFIELD 1,606,488 80 0 22,000 198,680,700 5,174,1000
DEERING 1,314,972 1,823 0 0 71,396,925 914,8000
DERRY 714,595 0 16,300 0 926,919,165 105,415,5860
DIX GRANT 219,259 0 0 0 80,000 00
DIXVILLE 520,310 0 0 0 556,700 897,6000
DORCHESTER 1,118,247 1,881 0 0 14,303,000 00
DOVER 686,507 0 0 0 712,207,113 172,879,5400
DUBLIN 912,747 0 0 4,300 79,387,400 9,975,2000
DUMMER 935,410 0 0 0 10,088,400 70,5000
DUNBARTON 731,002 0 0 0 79,991,000 2,248,9000
DURHAM 606,592 0 0 0 220,111,300 99,215,3000
EAST KINGSTON 360,493 0 0 0 100,468,600 2,171,3000
EASTON 250,571 0 0 0 26,420,800 166,7000
EATON 663,493 0 0 0 44,015,200 964,0000
EFFINGHAM 816,414 0 0 0 56,410,400 3,789,1000
ELLSWORTH 62,232 0 0 0 5,207,800 00
ENFIELD 817,196 0 0 0 206,365,600 15,473,8000
EPPING 701,200 0 0 0 190,348,400 45,822,2000
EPSOM 1,618,560 0 0 3,600 131,137,300 20,745,6000
ERROL 538,776 0 0 0 33,510,100 1,369,0000
ERVING'S GRANT 36,902 0 0 0 0 00
EXETER 176,100 0 2,800 1,600 392,587,734 107,363,9190
FARMINGTON 864,279 7,172 71,195 0 118,519,500 14,592,3000
FITZWILLIAM 885,522 0 0 17,500 69,097,700 3,082,70010
FRANCESTOWN 1,018,496 740 0 0 58,618,204 2,049,2000
FRANCONIA 521,315 0 0 0 94,569,800 7,127,0000
FRANKLIN 568,630 27,120 46,036 1,300 118,470,144 17,989,1300
FREEDOM 755,120 736 0 300 231,406,600 4,418,5000
FREMONT 536,133 0 0 100 116,450,900 5,831,8000
GILFORD 489,280 2,430 0 0 632,513,097 51,882,5500
GILMANTON 2,048,123 1,897 0 0 183,563,600 1,795,7000
GILSUM 458,854 0 0 0 14,850,000 738,3000
GOFFSTOWN 813,800 0 100 0 485,874,200 60,114,5000
GORHAM 307,200 0 0 0 33,103,165 25,440,0350
GOSHEN 673,620 0 0 0 25,307,700 920,0000
GRAFTON 1,304,135 0 0 0 41,727,200 403,5000
GRANTHAM 468,132 0 0 0 101,745,800 5,111,6000
GREENFIELD 885,499 9,007 0 0 43,361,100 1,557,9000
GREENLAND 396,500 0 98,800 0 252,356,500 39,399,2000
GREEN'S GRANT 0 0 0 0 199,700 1,641,6000
GREENVILLE 282,338 0 0 0 20,967,400 4,040,1000
GROTON 748,368 29,174 0 0 25,805,000 43,6000
HADLEY'S PURCHASE 0 0 0 0 0 00
112 2017 Deparment of Revenue Administration Annual Report
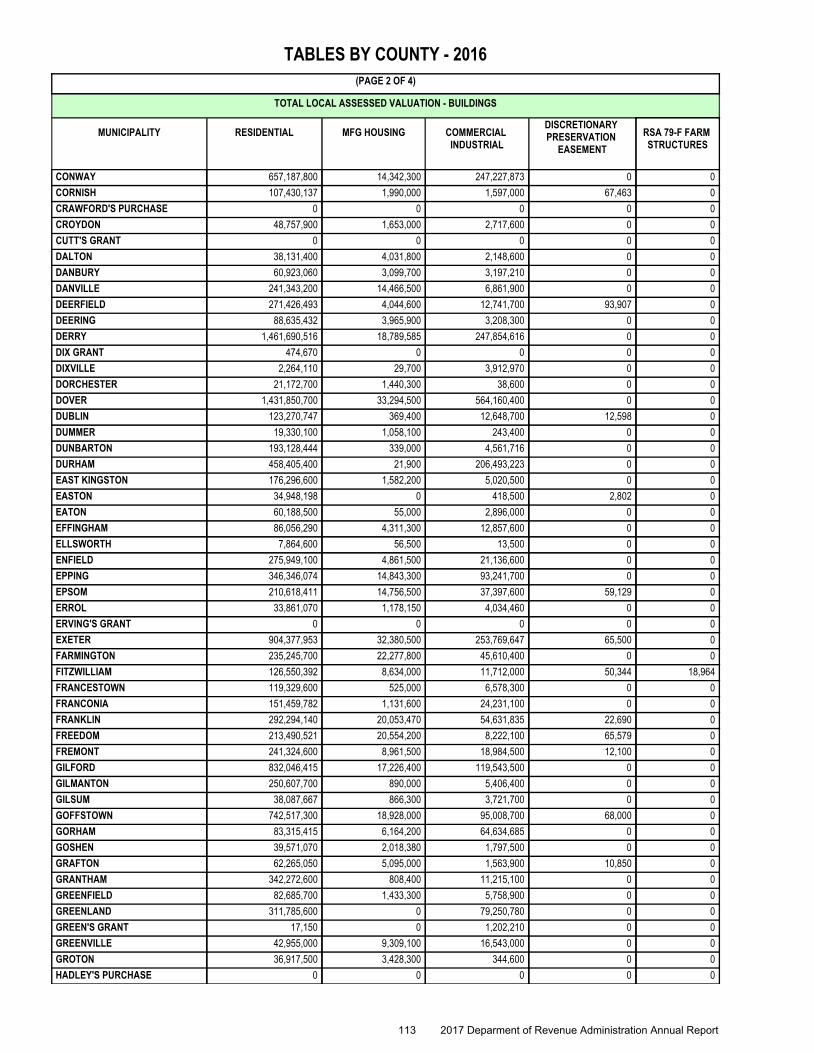
RESIDENTIAL MFG HOUSING COMMERCIAL INDUSTRIAL
DISCRETIONARY PRESERVATION
EASEMENT
TOTAL LOCAL ASSESSED VALUATION - BUILDINGS
(PAGE 2 OF 4)
TABLES BY COUNTY - 2016
RSA 79-F FARM STRUCTURES
MUNICIPALITY
CONWAY 657,187,800 14,342,300 247,227,873 0 0
CORNISH 107,430,137 1,990,000 1,597,000 67,463 0
CRAWFORD'S PURCHASE 0 0 0 0 0
CROYDON 48,757,900 1,653,000 2,717,600 0 0
CUTT'S GRANT 0 0 0 0 0
DALTON 38,131,400 4,031,800 2,148,600 0 0
DANBURY 60,923,060 3,099,700 3,197,210 0 0
DANVILLE 241,343,200 14,466,500 6,861,900 0 0
DEERFIELD 271,426,493 4,044,600 12,741,700 93,907 0
DEERING 88,635,432 3,965,900 3,208,300 0 0
DERRY 1,461,690,516 18,789,585 247,854,616 0 0
DIX GRANT 474,670 0 0 0 0
DIXVILLE 2,264,110 29,700 3,912,970 0 0
DORCHESTER 21,172,700 1,440,300 38,600 0 0
DOVER 1,431,850,700 33,294,500 564,160,400 0 0
DUBLIN 123,270,747 369,400 12,648,700 12,598 0
DUMMER 19,330,100 1,058,100 243,400 0 0
DUNBARTON 193,128,444 339,000 4,561,716 0 0
DURHAM 458,405,400 21,900 206,493,223 0 0
EAST KINGSTON 176,296,600 1,582,200 5,020,500 0 0
EASTON 34,948,198 0 418,500 2,802 0
EATON 60,188,500 55,000 2,896,000 0 0
EFFINGHAM 86,056,290 4,311,300 12,857,600 0 0
ELLSWORTH 7,864,600 56,500 13,500 0 0
ENFIELD 275,949,100 4,861,500 21,136,600 0 0
EPPING 346,346,074 14,843,300 93,241,700 0 0
EPSOM 210,618,411 14,756,500 37,397,600 59,129 0
ERROL 33,861,070 1,178,150 4,034,460 0 0
ERVING'S GRANT 0 0 0 0 0
EXETER 904,377,953 32,380,500 253,769,647 65,500 0
FARMINGTON 235,245,700 22,277,800 45,610,400 0 0
FITZWILLIAM 126,550,392 8,634,000 11,712,000 50,344 18,964
FRANCESTOWN 119,329,600 525,000 6,578,300 0 0
FRANCONIA 151,459,782 1,131,600 24,231,100 0 0
FRANKLIN 292,294,140 20,053,470 54,631,835 22,690 0
FREEDOM 213,490,521 20,554,200 8,222,100 65,579 0
FREMONT 241,324,600 8,961,500 18,984,500 12,100 0
GILFORD 832,046,415 17,226,400 119,543,500 0 0
GILMANTON 250,607,700 890,000 5,406,400 0 0
GILSUM 38,087,667 866,300 3,721,700 0 0
GOFFSTOWN 742,517,300 18,928,000 95,008,700 68,000 0
GORHAM 83,315,415 6,164,200 64,634,685 0 0
GOSHEN 39,571,070 2,018,380 1,797,500 0 0
GRAFTON 62,265,050 5,095,000 1,563,900 10,850 0
GRANTHAM 342,272,600 808,400 11,215,100 0 0
GREENFIELD 82,685,700 1,433,300 5,758,900 0 0
GREENLAND 311,785,600 0 79,250,780 0 0
GREEN'S GRANT 17,150 0 1,202,210 0 0
GREENVILLE 42,955,000 9,309,100 16,543,000 0 0
GROTON 36,917,500 3,428,300 344,600 0 0
HADLEY'S PURCHASE 0 0 0 0 0
113 2017 Deparment of Revenue Administration Annual Report
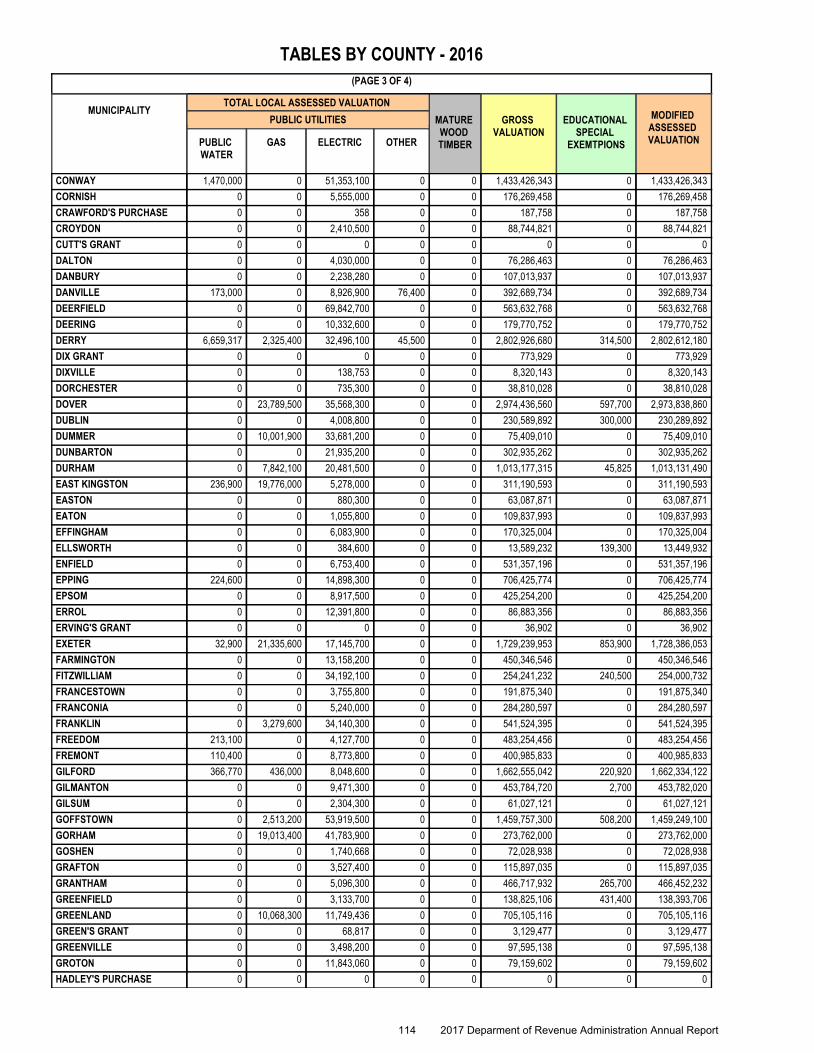
PUBLIC WATER
GAS ELECTRIC OTHER
MATURE WOOD TIMBER
TOTAL LOCAL ASSESSED VALUATION
(PAGE 3 OF 4)
GROSS VALUATION
MODIFIED ASSESSED VALUATION
EDUCATIONAL SPECIAL
EXEMTPIONS
TABLES BY COUNTY - 2016
MUNICIPALITYPUBLIC UTILITIES
CONWAY 1,470,000 0 51,353,100 0 0 1,433,426,343 0 1,433,426,343
CORNISH 0 0 5,555,000 0 0 176,269,458 0 176,269,458
CRAWFORD'S PURCHASE 0 0 358 0 0 187,758 0 187,758
CROYDON 0 0 2,410,500 0 0 88,744,821 0 88,744,821
CUTT'S GRANT 0 0 0 0 0 0 0 0
DALTON 0 0 4,030,000 0 0 76,286,463 0 76,286,463
DANBURY 0 0 2,238,280 0 0 107,013,937 0 107,013,937
DANVILLE 173,000 0 8,926,900 76,400 0 392,689,734 0 392,689,734
DEERFIELD 0 0 69,842,700 0 0 563,632,768 0 563,632,768
DEERING 0 0 10,332,600 0 0 179,770,752 0 179,770,752
DERRY 6,659,317 2,325,400 32,496,100 45,500 0 2,802,926,680 314,500 2,802,612,180
DIX GRANT 0 0 0 0 0 773,929 0 773,929
DIXVILLE 0 0 138,753 0 0 8,320,143 0 8,320,143
DORCHESTER 0 0 735,300 0 0 38,810,028 0 38,810,028
DOVER 0 23,789,500 35,568,300 0 0 2,974,436,560 597,700 2,973,838,860
DUBLIN 0 0 4,008,800 0 0 230,589,892 300,000 230,289,892
DUMMER 0 10,001,900 33,681,200 0 0 75,409,010 0 75,409,010
DUNBARTON 0 0 21,935,200 0 0 302,935,262 0 302,935,262
DURHAM 0 7,842,100 20,481,500 0 0 1,013,177,315 45,825 1,013,131,490
EAST KINGSTON 236,900 19,776,000 5,278,000 0 0 311,190,593 0 311,190,593
EASTON 0 0 880,300 0 0 63,087,871 0 63,087,871
EATON 0 0 1,055,800 0 0 109,837,993 0 109,837,993
EFFINGHAM 0 0 6,083,900 0 0 170,325,004 0 170,325,004
ELLSWORTH 0 0 384,600 0 0 13,589,232 139,300 13,449,932
ENFIELD 0 0 6,753,400 0 0 531,357,196 0 531,357,196
EPPING 224,600 0 14,898,300 0 0 706,425,774 0 706,425,774
EPSOM 0 0 8,917,500 0 0 425,254,200 0 425,254,200
ERROL 0 0 12,391,800 0 0 86,883,356 0 86,883,356
ERVING'S GRANT 0 0 0 0 0 36,902 0 36,902
EXETER 32,900 21,335,600 17,145,700 0 0 1,729,239,953 853,900 1,728,386,053
FARMINGTON 0 0 13,158,200 0 0 450,346,546 0 450,346,546
FITZWILLIAM 0 0 34,192,100 0 0 254,241,232 240,500 254,000,732
FRANCESTOWN 0 0 3,755,800 0 0 191,875,340 0 191,875,340
FRANCONIA 0 0 5,240,000 0 0 284,280,597 0 284,280,597
FRANKLIN 0 3,279,600 34,140,300 0 0 541,524,395 0 541,524,395
FREEDOM 213,100 0 4,127,700 0 0 483,254,456 0 483,254,456
FREMONT 110,400 0 8,773,800 0 0 400,985,833 0 400,985,833
GILFORD 366,770 436,000 8,048,600 0 0 1,662,555,042 220,920 1,662,334,122
GILMANTON 0 0 9,471,300 0 0 453,784,720 2,700 453,782,020
GILSUM 0 0 2,304,300 0 0 61,027,121 0 61,027,121
GOFFSTOWN 0 2,513,200 53,919,500 0 0 1,459,757,300 508,200 1,459,249,100
GORHAM 0 19,013,400 41,783,900 0 0 273,762,000 0 273,762,000
GOSHEN 0 0 1,740,668 0 0 72,028,938 0 72,028,938
GRAFTON 0 0 3,527,400 0 0 115,897,035 0 115,897,035
GRANTHAM 0 0 5,096,300 0 0 466,717,932 265,700 466,452,232
GREENFIELD 0 0 3,133,700 0 0 138,825,106 431,400 138,393,706
GREENLAND 0 10,068,300 11,749,436 0 0 705,105,116 0 705,105,116
GREEN'S GRANT 0 0 68,817 0 0 3,129,477 0 3,129,477
GREENVILLE 0 0 3,498,200 0 0 97,595,138 0 97,595,138
GROTON 0 0 11,843,060 0 0 79,159,602 0 79,159,602
HADLEY'S PURCHASE 0 0 0 0 0 0 0 0
114 2017 Deparment of Revenue Administration Annual Report
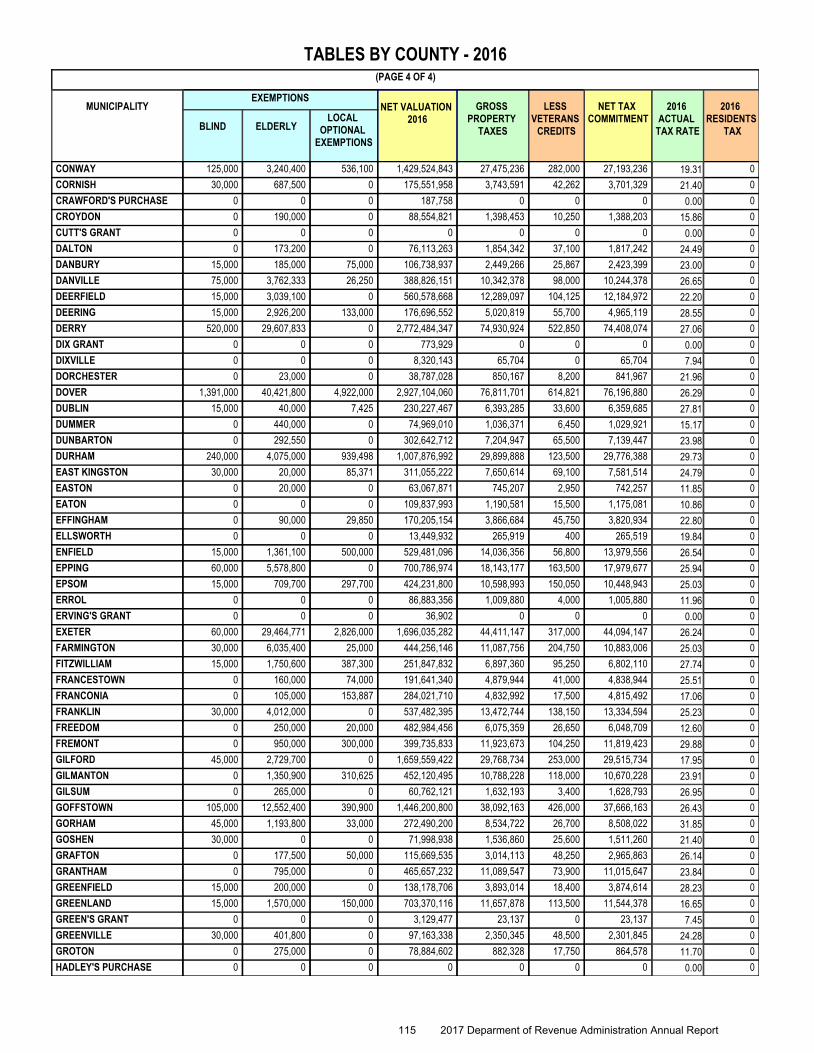
NET VALUATION 2016
GROSS PROPERTY
TAXES
LESS VETERANS
CREDITS
EXEMPTIONS
(PAGE 4 OF 4)
NET TAX COMMITMENT
2016 RESIDENTS
TAX
2016 ACTUAL
TAX RATEBLIND ELDERLYLOCAL
OPTIONAL EXEMPTIONS
TABLES BY COUNTY - 2016
MUNICIPALITY
CONWAY 125,000 3,240,400 536,100 1,429,524,843 27,475,236 282,000 27,193,236 019.31
CORNISH 30,000 687,500 0 175,551,958 3,743,591 42,262 3,701,329 021.40
CRAWFORD'S PURCHASE 0 0 0 187,758 0 0 0 00.00
CROYDON 0 190,000 0 88,554,821 1,398,453 10,250 1,388,203 015.86
CUTT'S GRANT 0 0 0 0 0 0 0 00.00
DALTON 0 173,200 0 76,113,263 1,854,342 37,100 1,817,242 024.49
DANBURY 15,000 185,000 75,000 106,738,937 2,449,266 25,867 2,423,399 023.00
DANVILLE 75,000 3,762,333 26,250 388,826,151 10,342,378 98,000 10,244,378 026.65
DEERFIELD 15,000 3,039,100 0 560,578,668 12,289,097 104,125 12,184,972 022.20
DEERING 15,000 2,926,200 133,000 176,696,552 5,020,819 55,700 4,965,119 028.55
DERRY 520,000 29,607,833 0 2,772,484,347 74,930,924 522,850 74,408,074 027.06
DIX GRANT 0 0 0 773,929 0 0 0 00.00
DIXVILLE 0 0 0 8,320,143 65,704 0 65,704 07.94
DORCHESTER 0 23,000 0 38,787,028 850,167 8,200 841,967 021.96
DOVER 1,391,000 40,421,800 4,922,000 2,927,104,060 76,811,701 614,821 76,196,880 026.29
DUBLIN 15,000 40,000 7,425 230,227,467 6,393,285 33,600 6,359,685 027.81
DUMMER 0 440,000 0 74,969,010 1,036,371 6,450 1,029,921 015.17
DUNBARTON 0 292,550 0 302,642,712 7,204,947 65,500 7,139,447 023.98
DURHAM 240,000 4,075,000 939,498 1,007,876,992 29,899,888 123,500 29,776,388 029.73
EAST KINGSTON 30,000 20,000 85,371 311,055,222 7,650,614 69,100 7,581,514 024.79
EASTON 0 20,000 0 63,067,871 745,207 2,950 742,257 011.85
EATON 0 0 0 109,837,993 1,190,581 15,500 1,175,081 010.86
EFFINGHAM 0 90,000 29,850 170,205,154 3,866,684 45,750 3,820,934 022.80
ELLSWORTH 0 0 0 13,449,932 265,919 400 265,519 019.84
ENFIELD 15,000 1,361,100 500,000 529,481,096 14,036,356 56,800 13,979,556 026.54
EPPING 60,000 5,578,800 0 700,786,974 18,143,177 163,500 17,979,677 025.94
EPSOM 15,000 709,700 297,700 424,231,800 10,598,993 150,050 10,448,943 025.03
ERROL 0 0 0 86,883,356 1,009,880 4,000 1,005,880 011.96
ERVING'S GRANT 0 0 0 36,902 0 0 0 00.00
EXETER 60,000 29,464,771 2,826,000 1,696,035,282 44,411,147 317,000 44,094,147 026.24
FARMINGTON 30,000 6,035,400 25,000 444,256,146 11,087,756 204,750 10,883,006 025.03
FITZWILLIAM 15,000 1,750,600 387,300 251,847,832 6,897,360 95,250 6,802,110 027.74
FRANCESTOWN 0 160,000 74,000 191,641,340 4,879,944 41,000 4,838,944 025.51
FRANCONIA 0 105,000 153,887 284,021,710 4,832,992 17,500 4,815,492 017.06
FRANKLIN 30,000 4,012,000 0 537,482,395 13,472,744 138,150 13,334,594 025.23
FREEDOM 0 250,000 20,000 482,984,456 6,075,359 26,650 6,048,709 012.60
FREMONT 0 950,000 300,000 399,735,833 11,923,673 104,250 11,819,423 029.88
GILFORD 45,000 2,729,700 0 1,659,559,422 29,768,734 253,000 29,515,734 017.95
GILMANTON 0 1,350,900 310,625 452,120,495 10,788,228 118,000 10,670,228 023.91
GILSUM 0 265,000 0 60,762,121 1,632,193 3,400 1,628,793 026.95
GOFFSTOWN 105,000 12,552,400 390,900 1,446,200,800 38,092,163 426,000 37,666,163 026.43
GORHAM 45,000 1,193,800 33,000 272,490,200 8,534,722 26,700 8,508,022 031.85
GOSHEN 30,000 0 0 71,998,938 1,536,860 25,600 1,511,260 021.40
GRAFTON 0 177,500 50,000 115,669,535 3,014,113 48,250 2,965,863 026.14
GRANTHAM 0 795,000 0 465,657,232 11,089,547 73,900 11,015,647 023.84
GREENFIELD 15,000 200,000 0 138,178,706 3,893,014 18,400 3,874,614 028.23
GREENLAND 15,000 1,570,000 150,000 703,370,116 11,657,878 113,500 11,544,378 016.65
GREEN'S GRANT 0 0 0 3,129,477 23,137 0 23,137 07.45
GREENVILLE 30,000 401,800 0 97,163,338 2,350,345 48,500 2,301,845 024.28
GROTON 0 275,000 0 78,884,602 882,328 17,750 864,578 011.70
HADLEY'S PURCHASE 0 0 0 0 0 0 0 00.00
115 2017 Deparment of Revenue Administration Annual Report
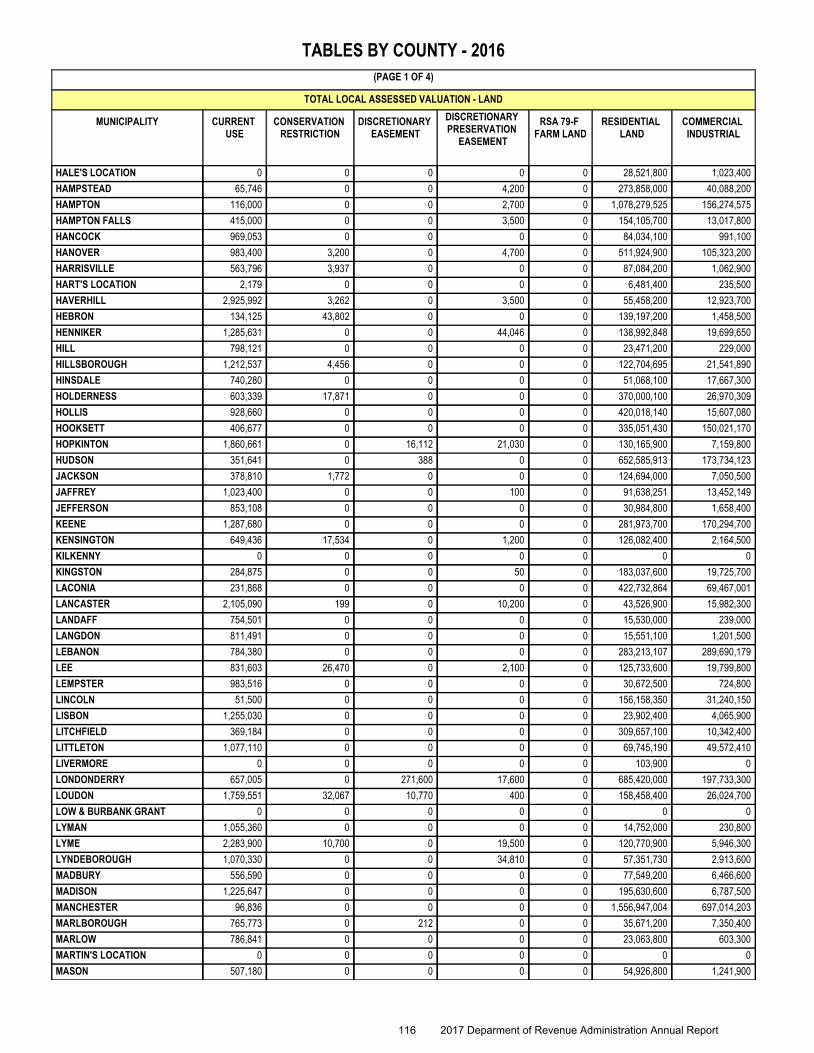
CURRENT USE
CONSERVATION RESTRICTION
DISCRETIONARY EASEMENT
DISCRETIONARY PRESERVATION
EASEMENT
RESIDENTIAL LAND
COMMERCIAL INDUSTRIAL
TOTAL LOCAL ASSESSED VALUATION - LAND
(PAGE 1 OF 4)
TABLES BY COUNTY - 2016
RSA 79-F FARM LAND
MUNICIPALITY
HALE'S LOCATION 0 0 0 0 28,521,800 1,023,4000
HAMPSTEAD 65,746 0 0 4,200 273,858,000 40,088,2000
HAMPTON 116,000 0 0 2,700 1,078,279,525 156,274,5750
HAMPTON FALLS 415,000 0 0 3,500 154,105,700 13,017,8000
HANCOCK 969,053 0 0 0 84,034,100 991,1000
HANOVER 983,400 3,200 0 4,700 511,924,900 105,323,2000
HARRISVILLE 563,796 3,937 0 0 87,084,200 1,062,9000
HART'S LOCATION 2,179 0 0 0 6,481,400 235,5000
HAVERHILL 2,925,992 3,262 0 3,500 55,458,200 12,923,7000
HEBRON 134,125 43,802 0 0 139,197,200 1,458,5000
HENNIKER 1,285,631 0 0 44,046 138,992,848 19,699,6500
HILL 798,121 0 0 0 23,471,200 229,0000
HILLSBOROUGH 1,212,537 4,456 0 0 122,704,695 21,541,8900
HINSDALE 740,280 0 0 0 51,068,100 17,667,3000
HOLDERNESS 603,339 17,871 0 0 370,000,100 26,970,3090
HOLLIS 928,660 0 0 0 420,018,140 15,607,0800
HOOKSETT 406,677 0 0 0 335,051,430 150,021,1700
HOPKINTON 1,860,661 0 16,112 21,030 130,165,900 7,159,8000
HUDSON 351,641 0 388 0 652,585,913 173,734,1230
JACKSON 378,810 1,772 0 0 124,694,000 7,050,5000
JAFFREY 1,023,400 0 0 100 91,638,251 13,452,1490
JEFFERSON 853,108 0 0 0 30,984,800 1,658,4000
KEENE 1,287,680 0 0 0 281,973,700 170,294,7000
KENSINGTON 649,436 17,534 0 1,200 126,082,400 2,164,5000
KILKENNY 0 0 0 0 0 00
KINGSTON 284,875 0 0 50 183,037,600 19,725,7000
LACONIA 231,868 0 0 0 422,732,864 69,467,0010
LANCASTER 2,105,090 199 0 10,200 43,526,900 15,982,3000
LANDAFF 754,501 0 0 0 15,530,000 239,0000
LANGDON 811,491 0 0 0 15,551,100 1,201,5000
LEBANON 784,380 0 0 0 283,213,107 289,690,1790
LEE 831,603 26,470 0 2,100 125,733,600 19,799,8000
LEMPSTER 983,516 0 0 0 30,672,500 724,8000
LINCOLN 51,500 0 0 0 156,158,350 31,240,1500
LISBON 1,255,030 0 0 0 23,902,400 4,065,9000
LITCHFIELD 369,184 0 0 0 309,657,100 10,342,4000
LITTLETON 1,077,110 0 0 0 69,745,190 49,572,4100
LIVERMORE 0 0 0 0 103,900 00
LONDONDERRY 657,005 0 271,600 17,600 685,420,000 197,733,3000
LOUDON 1,759,551 32,067 10,770 400 158,458,400 26,024,7000
LOW & BURBANK GRANT 0 0 0 0 0 00
LYMAN 1,055,360 0 0 0 14,752,000 230,8000
LYME 2,283,900 10,700 0 19,500 120,770,900 5,946,3000
LYNDEBOROUGH 1,070,330 0 0 34,810 57,351,730 2,913,6000
MADBURY 556,590 0 0 0 77,549,200 6,466,6000
MADISON 1,225,647 0 0 0 195,630,600 6,787,5000
MANCHESTER 96,836 0 0 0 1,556,947,004 697,014,2030
MARLBOROUGH 765,773 0 212 0 35,671,200 7,350,4000
MARLOW 786,841 0 0 0 23,063,800 603,3000
MARTIN'S LOCATION 0 0 0 0 0 00
MASON 507,180 0 0 0 54,926,800 1,241,9000
116 2017 Deparment of Revenue Administration Annual Report
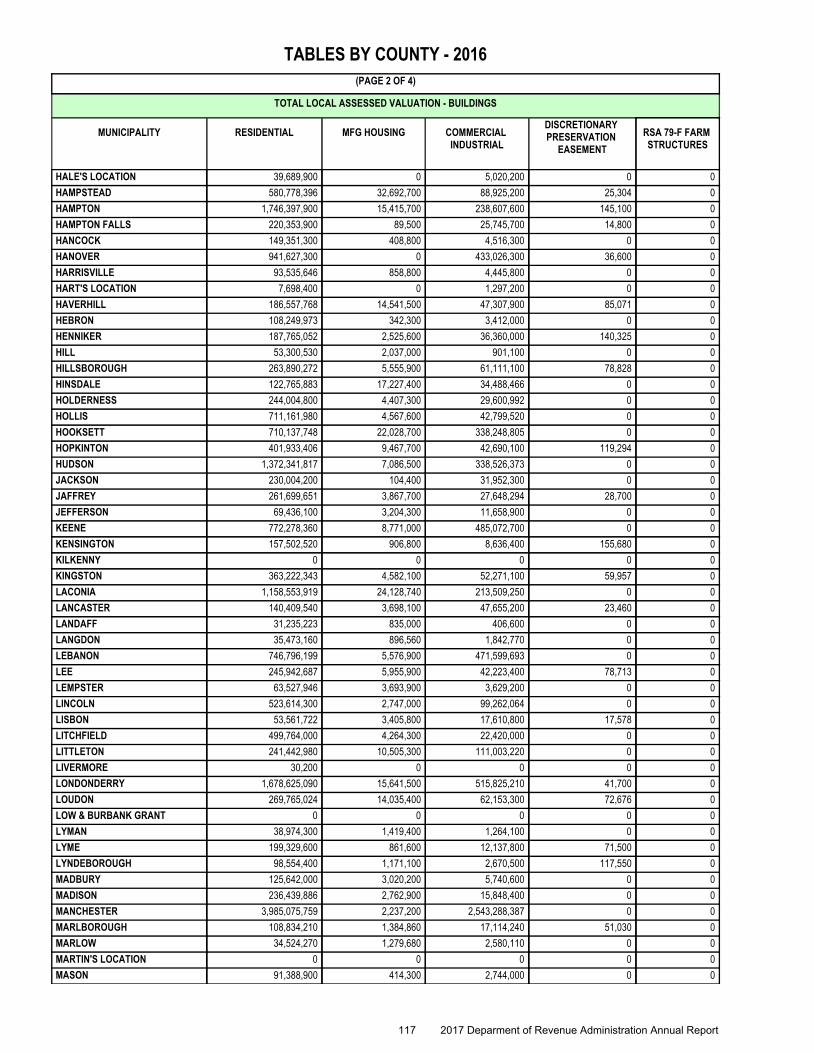
RESIDENTIAL MFG HOUSING COMMERCIAL INDUSTRIAL
DISCRETIONARY PRESERVATION
EASEMENT
TOTAL LOCAL ASSESSED VALUATION - BUILDINGS
(PAGE 2 OF 4)
TABLES BY COUNTY - 2016
RSA 79-F FARM STRUCTURES
MUNICIPALITY
HALE'S LOCATION 39,689,900 0 5,020,200 0 0
HAMPSTEAD 580,778,396 32,692,700 88,925,200 25,304 0
HAMPTON 1,746,397,900 15,415,700 238,607,600 145,100 0
HAMPTON FALLS 220,353,900 89,500 25,745,700 14,800 0
HANCOCK 149,351,300 408,800 4,516,300 0 0
HANOVER 941,627,300 0 433,026,300 36,600 0
HARRISVILLE 93,535,646 858,800 4,445,800 0 0
HART'S LOCATION 7,698,400 0 1,297,200 0 0
HAVERHILL 186,557,768 14,541,500 47,307,900 85,071 0
HEBRON 108,249,973 342,300 3,412,000 0 0
HENNIKER 187,765,052 2,525,600 36,360,000 140,325 0
HILL 53,300,530 2,037,000 901,100 0 0
HILLSBOROUGH 263,890,272 5,555,900 61,111,100 78,828 0
HINSDALE 122,765,883 17,227,400 34,488,466 0 0
HOLDERNESS 244,004,800 4,407,300 29,600,992 0 0
HOLLIS 711,161,980 4,567,600 42,799,520 0 0
HOOKSETT 710,137,748 22,028,700 338,248,805 0 0
HOPKINTON 401,933,406 9,467,700 42,690,100 119,294 0
HUDSON 1,372,341,817 7,086,500 338,526,373 0 0
JACKSON 230,004,200 104,400 31,952,300 0 0
JAFFREY 261,699,651 3,867,700 27,648,294 28,700 0
JEFFERSON 69,436,100 3,204,300 11,658,900 0 0
KEENE 772,278,360 8,771,000 485,072,700 0 0
KENSINGTON 157,502,520 906,800 8,636,400 155,680 0
KILKENNY 0 0 0 0 0
KINGSTON 363,222,343 4,582,100 52,271,100 59,957 0
LACONIA 1,158,553,919 24,128,740 213,509,250 0 0
LANCASTER 140,409,540 3,698,100 47,655,200 23,460 0
LANDAFF 31,235,223 835,000 406,600 0 0
LANGDON 35,473,160 896,560 1,842,770 0 0
LEBANON 746,796,199 5,576,900 471,599,693 0 0
LEE 245,942,687 5,955,900 42,223,400 78,713 0
LEMPSTER 63,527,946 3,693,900 3,629,200 0 0
LINCOLN 523,614,300 2,747,000 99,262,064 0 0
LISBON 53,561,722 3,405,800 17,610,800 17,578 0
LITCHFIELD 499,764,000 4,264,300 22,420,000 0 0
LITTLETON 241,442,980 10,505,300 111,003,220 0 0
LIVERMORE 30,200 0 0 0 0
LONDONDERRY 1,678,625,090 15,641,500 515,825,210 41,700 0
LOUDON 269,765,024 14,035,400 62,153,300 72,676 0
LOW & BURBANK GRANT 0 0 0 0 0
LYMAN 38,974,300 1,419,400 1,264,100 0 0
LYME 199,329,600 861,600 12,137,800 71,500 0
LYNDEBOROUGH 98,554,400 1,171,100 2,670,500 117,550 0
MADBURY 125,642,000 3,020,200 5,740,600 0 0
MADISON 236,439,886 2,762,900 15,848,400 0 0
MANCHESTER 3,985,075,759 2,237,200 2,543,288,387 0 0
MARLBOROUGH 108,834,210 1,384,860 17,114,240 51,030 0
MARLOW 34,524,270 1,279,680 2,580,110 0 0
MARTIN'S LOCATION 0 0 0 0 0
MASON 91,388,900 414,300 2,744,000 0 0
117 2017 Deparment of Revenue Administration Annual Report
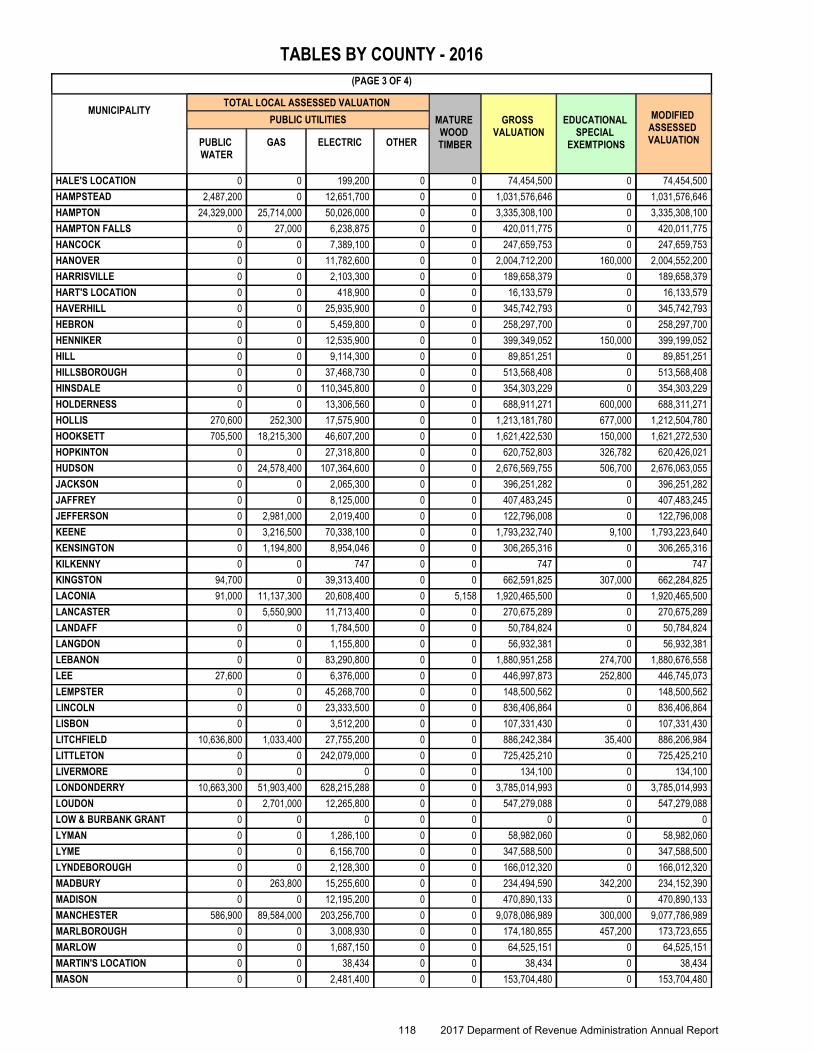
PUBLIC WATER
GAS ELECTRIC OTHER
MATURE WOOD TIMBER
TOTAL LOCAL ASSESSED VALUATION
(PAGE 3 OF 4)
GROSS VALUATION
MODIFIED ASSESSED VALUATION
EDUCATIONAL SPECIAL
EXEMTPIONS
TABLES BY COUNTY - 2016
MUNICIPALITYPUBLIC UTILITIES
HALE'S LOCATION 0 0 199,200 0 0 74,454,500 0 74,454,500
HAMPSTEAD 2,487,200 0 12,651,700 0 0 1,031,576,646 0 1,031,576,646
HAMPTON 24,329,000 25,714,000 50,026,000 0 0 3,335,308,100 0 3,335,308,100
HAMPTON FALLS 0 27,000 6,238,875 0 0 420,011,775 0 420,011,775
HANCOCK 0 0 7,389,100 0 0 247,659,753 0 247,659,753
HANOVER 0 0 11,782,600 0 0 2,004,712,200 160,000 2,004,552,200
HARRISVILLE 0 0 2,103,300 0 0 189,658,379 0 189,658,379
HART'S LOCATION 0 0 418,900 0 0 16,133,579 0 16,133,579
HAVERHILL 0 0 25,935,900 0 0 345,742,793 0 345,742,793
HEBRON 0 0 5,459,800 0 0 258,297,700 0 258,297,700
HENNIKER 0 0 12,535,900 0 0 399,349,052 150,000 399,199,052
HILL 0 0 9,114,300 0 0 89,851,251 0 89,851,251
HILLSBOROUGH 0 0 37,468,730 0 0 513,568,408 0 513,568,408
HINSDALE 0 0 110,345,800 0 0 354,303,229 0 354,303,229
HOLDERNESS 0 0 13,306,560 0 0 688,911,271 600,000 688,311,271
HOLLIS 270,600 252,300 17,575,900 0 0 1,213,181,780 677,000 1,212,504,780
HOOKSETT 705,500 18,215,300 46,607,200 0 0 1,621,422,530 150,000 1,621,272,530
HOPKINTON 0 0 27,318,800 0 0 620,752,803 326,782 620,426,021
HUDSON 0 24,578,400 107,364,600 0 0 2,676,569,755 506,700 2,676,063,055
JACKSON 0 0 2,065,300 0 0 396,251,282 0 396,251,282
JAFFREY 0 0 8,125,000 0 0 407,483,245 0 407,483,245
JEFFERSON 0 2,981,000 2,019,400 0 0 122,796,008 0 122,796,008
KEENE 0 3,216,500 70,338,100 0 0 1,793,232,740 9,100 1,793,223,640
KENSINGTON 0 1,194,800 8,954,046 0 0 306,265,316 0 306,265,316
KILKENNY 0 0 747 0 0 747 0 747
KINGSTON 94,700 0 39,313,400 0 0 662,591,825 307,000 662,284,825
LACONIA 91,000 11,137,300 20,608,400 0 5,158 1,920,465,500 0 1,920,465,500
LANCASTER 0 5,550,900 11,713,400 0 0 270,675,289 0 270,675,289
LANDAFF 0 0 1,784,500 0 0 50,784,824 0 50,784,824
LANGDON 0 0 1,155,800 0 0 56,932,381 0 56,932,381
LEBANON 0 0 83,290,800 0 0 1,880,951,258 274,700 1,880,676,558
LEE 27,600 0 6,376,000 0 0 446,997,873 252,800 446,745,073
LEMPSTER 0 0 45,268,700 0 0 148,500,562 0 148,500,562
LINCOLN 0 0 23,333,500 0 0 836,406,864 0 836,406,864
LISBON 0 0 3,512,200 0 0 107,331,430 0 107,331,430
LITCHFIELD 10,636,800 1,033,400 27,755,200 0 0 886,242,384 35,400 886,206,984
LITTLETON 0 0 242,079,000 0 0 725,425,210 0 725,425,210
LIVERMORE 0 0 0 0 0 134,100 0 134,100
LONDONDERRY 10,663,300 51,903,400 628,215,288 0 0 3,785,014,993 0 3,785,014,993
LOUDON 0 2,701,000 12,265,800 0 0 547,279,088 0 547,279,088
LOW & BURBANK GRANT 0 0 0 0 0 0 0 0
LYMAN 0 0 1,286,100 0 0 58,982,060 0 58,982,060
LYME 0 0 6,156,700 0 0 347,588,500 0 347,588,500
LYNDEBOROUGH 0 0 2,128,300 0 0 166,012,320 0 166,012,320
MADBURY 0 263,800 15,255,600 0 0 234,494,590 342,200 234,152,390
MADISON 0 0 12,195,200 0 0 470,890,133 0 470,890,133
MANCHESTER 586,900 89,584,000 203,256,700 0 0 9,078,086,989 300,000 9,077,786,989
MARLBOROUGH 0 0 3,008,930 0 0 174,180,855 457,200 173,723,655
MARLOW 0 0 1,687,150 0 0 64,525,151 0 64,525,151
MARTIN'S LOCATION 0 0 38,434 0 0 38,434 0 38,434
MASON 0 0 2,481,400 0 0 153,704,480 0 153,704,480
118 2017 Deparment of Revenue Administration Annual Report

NET VALUATION 2016
GROSS PROPERTY
TAXES
LESS VETERANS
CREDITS
EXEMPTIONS
(PAGE 4 OF 4)
NET TAX COMMITMENT
2016 RESIDENTS
TAX
2016 ACTUAL
TAX RATEBLIND ELDERLYLOCAL
OPTIONAL EXEMPTIONS
TABLES BY COUNTY - 2016
MUNICIPALITY
HALE'S LOCATION 0 0 0 74,454,500 316,003 12,500 303,503 04.25
HAMPSTEAD 150,000 9,083,100 150,000 1,022,193,546 24,701,205 241,500 24,459,705 024.20
HAMPTON 200,000 29,995,000 3,235,600 3,301,877,500 52,878,041 438,485 52,439,556 016.08
HAMPTON FALLS 15,000 2,980,000 363,000 416,653,775 8,942,579 51,100 8,891,479 021.50
HANCOCK 15,000 330,000 0 247,314,753 5,697,636 30,400 5,667,236 023.11
HANOVER 60,000 1,105,000 165,000 2,003,222,200 39,472,672 79,500 39,393,172 019.72
HARRISVILLE 0 90,000 0 189,568,379 3,331,566 7,600 3,323,966 017.60
HART'S LOCATION 0 0 0 16,133,579 57,958 100 57,858 03.65
HAVERHILL 30,000 895,100 0 344,817,693 10,200,566 147,500 10,053,066 23,22029.76
HEBRON 0 0 0 258,297,700 2,136,315 4,850 2,131,465 08.32
HENNIKER 150,000 4,630,999 904,253 393,513,800 13,086,607 43,400 13,043,207 033.33
HILL 0 20,000 0 89,831,251 2,252,314 18,200 2,234,114 025.30
HILLSBOROUGH 30,000 2,252,850 604,555 510,681,003 14,990,998 168,500 14,822,498 029.52
HINSDALE 0 716,000 165,000 353,422,229 9,277,107 64,600 9,212,507 026.93
HOLDERNESS 30,000 76,400 173,574 688,031,297 9,722,485 47,000 9,675,485 014.18
HOLLIS 28,000 8,578,800 152,640 1,203,745,340 28,161,040 174,000 27,987,040 023.43
HOOKSETT 350,000 22,945,200 0 1,597,977,330 42,000,249 194,750 41,805,499 026.39
HOPKINTON 210,000 6,148,000 138,100 613,929,921 20,528,505 179,000 20,349,505 033.55
HUDSON 1,785,000 28,252,500 4,305,000 2,641,720,555 57,716,659 549,000 57,167,659 021.97
JACKSON 0 69,300 0 396,181,982 4,456,259 20,150 4,436,109 011.26
JAFFREY 60,000 1,141,100 225,456 406,056,689 13,380,208 127,200 13,253,008 033.00
JEFFERSON 0 662,500 0 122,133,508 2,478,702 5,000 2,473,702 020.39
KEENE 214,500 3,641,800 733,525 1,788,633,815 64,909,646 229,775 64,679,871 036.39
KENSINGTON 0 3,828,700 0 302,436,616 7,085,522 42,095 7,043,427 023.51
KILKENNY 0 0 0 747 0 0 0 00.00
KINGSTON 90,000 2,344,500 1,640,000 658,210,325 16,685,844 105,700 16,580,144 025.50
LACONIA 280,000 5,350,000 0 1,914,835,500 42,433,895 416,450 42,017,445 022.20
LANCASTER 0 441,200 143,150 270,090,939 6,878,059 26,900 6,851,159 025.61
LANDAFF 0 20,000 0 50,764,824 997,664 6,300 991,364 019.73
LANGDON 0 353,500 0 56,578,881 1,679,248 21,000 1,658,248 029.73
LEBANON 96,800 9,283,500 0 1,871,296,258 52,435,501 60,200 52,375,301 028.13
LEE 15,000 8,901,802 0 437,828,271 12,791,300 92,350 12,698,950 029.25
LEMPSTER 0 301,500 0 148,199,062 3,548,660 20,500 3,528,160 024.66
LINCOLN 0 1,632,000 75,000 834,699,864 10,954,625 38,000 10,916,625 013.19
LISBON 15,000 447,400 0 106,869,030 3,056,224 17,200 3,039,024 028.68
LITCHFIELD 45,000 4,211,300 0 881,950,684 18,957,485 114,752 18,842,733 021.60
LITTLETON 120,000 3,670,800 0 721,634,410 18,092,350 153,000 17,939,350 025.91
LIVERMORE 0 0 0 134,100 0 0 0 00.00
LONDONDERRY 250,000 18,455,450 2,945,380 3,763,364,163 79,385,702 449,875 78,935,827 021.50
LOUDON 15,000 1,124,600 91,300 546,048,188 11,365,634 164,500 11,201,134 020.98
LOW & BURBANK GRANT 0 0 0 0 0 0 0 00.00
LYMAN 0 150,000 0 58,832,060 1,128,125 14,400 1,113,725 019.23
LYME 145,100 3,503,900 332,300 343,607,200 8,733,709 41,000 8,692,709 025.46
LYNDEBOROUGH 0 280,000 30,000 165,702,320 4,591,623 31,000 4,560,623 027.74
MADBURY 0 1,580,190 0 232,572,200 6,612,924 32,250 6,580,674 028.59
MADISON 0 373,000 0 470,517,133 7,761,641 85,665 7,675,976 016.56
MANCHESTER 5,260,550 108,106,592 18,059,325 8,946,360,522 206,340,964 1,213,126 205,127,838 023.14
MARLBOROUGH 30,000 221,480 1,300 173,470,875 5,228,732 56,900 5,171,832 030.18
MARLOW 0 94,230 0 64,430,921 1,411,515 12,200 1,399,315 021.97
MARTIN'S LOCATION 0 0 0 38,434 0 0 0 00.00
MASON 0 489,500 10,000 153,204,980 3,856,912 36,500 3,820,412 025.21
119 2017 Deparment of Revenue Administration Annual Report
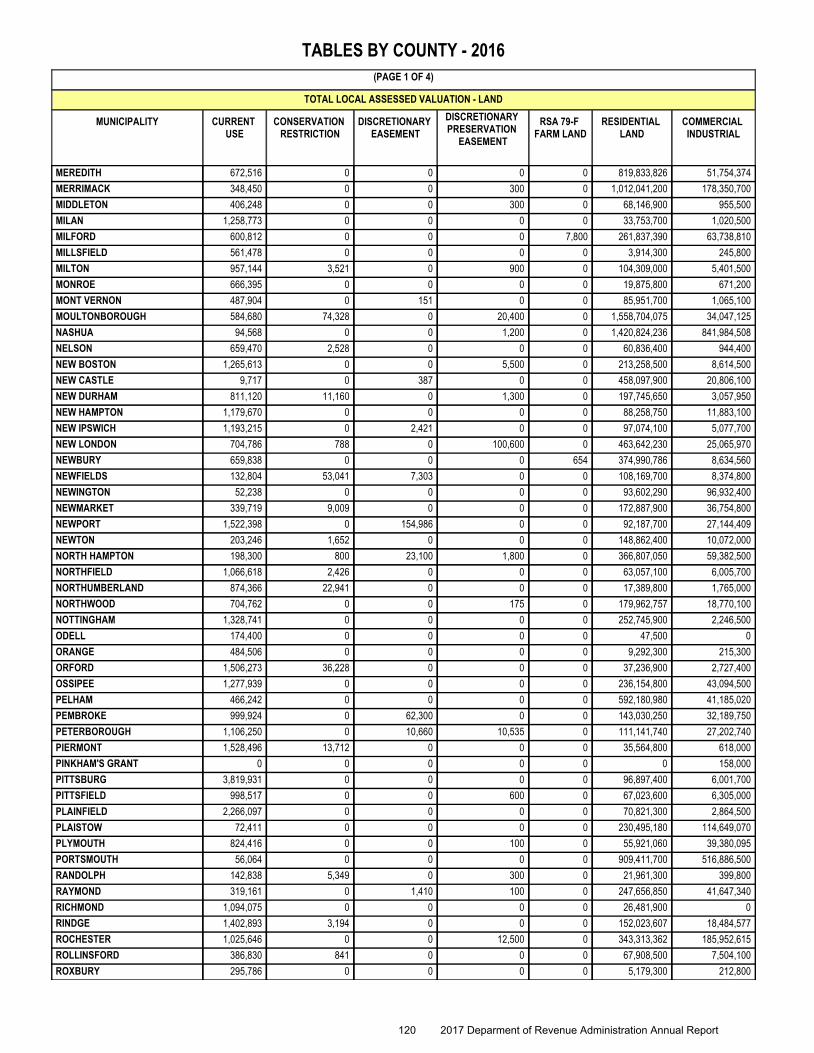
CURRENT USE
CONSERVATION RESTRICTION
DISCRETIONARY EASEMENT
DISCRETIONARY PRESERVATION
EASEMENT
RESIDENTIAL LAND
COMMERCIAL INDUSTRIAL
TOTAL LOCAL ASSESSED VALUATION - LAND
(PAGE 1 OF 4)
TABLES BY COUNTY - 2016
RSA 79-F FARM LAND
MUNICIPALITY
MEREDITH 672,516 0 0 0 819,833,826 51,754,3740
MERRIMACK 348,450 0 0 300 1,012,041,200 178,350,7000
MIDDLETON 406,248 0 0 300 68,146,900 955,5000
MILAN 1,258,773 0 0 0 33,753,700 1,020,5000
MILFORD 600,812 0 0 0 261,837,390 63,738,8107,800
MILLSFIELD 561,478 0 0 0 3,914,300 245,8000
MILTON 957,144 3,521 0 900 104,309,000 5,401,5000
MONROE 666,395 0 0 0 19,875,800 671,2000
MONT VERNON 487,904 0 151 0 85,951,700 1,065,1000
MOULTONBOROUGH 584,680 74,328 0 20,400 1,558,704,075 34,047,1250
NASHUA 94,568 0 0 1,200 1,420,824,236 841,984,5080
NELSON 659,470 2,528 0 0 60,836,400 944,4000
NEW BOSTON 1,265,613 0 0 5,500 213,258,500 8,614,5000
NEW CASTLE 9,717 0 387 0 458,097,900 20,806,1000
NEW DURHAM 811,120 11,160 0 1,300 197,745,650 3,057,9500
NEW HAMPTON 1,179,670 0 0 0 88,258,750 11,883,1000
NEW IPSWICH 1,193,215 0 2,421 0 97,074,100 5,077,7000
NEW LONDON 704,786 788 0 100,600 463,642,230 25,065,9700
NEWBURY 659,838 0 0 0 374,990,786 8,634,560654
NEWFIELDS 132,804 53,041 7,303 0 108,169,700 8,374,8000
NEWINGTON 52,238 0 0 0 93,602,290 96,932,4000
NEWMARKET 339,719 9,009 0 0 172,887,900 36,754,8000
NEWPORT 1,522,398 0 154,986 0 92,187,700 27,144,4090
NEWTON 203,246 1,652 0 0 148,862,400 10,072,0000
NORTH HAMPTON 198,300 800 23,100 1,800 366,807,050 59,382,5000
NORTHFIELD 1,066,618 2,426 0 0 63,057,100 6,005,7000
NORTHUMBERLAND 874,366 22,941 0 0 17,389,800 1,765,0000
NORTHWOOD 704,762 0 0 175 179,962,757 18,770,1000
NOTTINGHAM 1,328,741 0 0 0 252,745,900 2,246,5000
ODELL 174,400 0 0 0 47,500 00
ORANGE 484,506 0 0 0 9,292,300 215,3000
ORFORD 1,506,273 36,228 0 0 37,236,900 2,727,4000
OSSIPEE 1,277,939 0 0 0 236,154,800 43,094,5000
PELHAM 466,242 0 0 0 592,180,980 41,185,0200
PEMBROKE 999,924 0 62,300 0 143,030,250 32,189,7500
PETERBOROUGH 1,106,250 0 10,660 10,535 111,141,740 27,202,7400
PIERMONT 1,528,496 13,712 0 0 35,564,800 618,0000
PINKHAM'S GRANT 0 0 0 0 0 158,0000
PITTSBURG 3,819,931 0 0 0 96,897,400 6,001,7000
PITTSFIELD 998,517 0 0 600 67,023,600 6,305,0000
PLAINFIELD 2,266,097 0 0 0 70,821,300 2,864,5000
PLAISTOW 72,411 0 0 0 230,495,180 114,649,0700
PLYMOUTH 824,416 0 0 100 55,921,060 39,380,0950
PORTSMOUTH 56,064 0 0 0 909,411,700 516,886,5000
RANDOLPH 142,838 5,349 0 300 21,961,300 399,8000
RAYMOND 319,161 0 1,410 100 247,656,850 41,647,3400
RICHMOND 1,094,075 0 0 0 26,481,900 00
RINDGE 1,402,893 3,194 0 0 152,023,607 18,484,5770
ROCHESTER 1,025,646 0 0 12,500 343,313,362 185,952,6150
ROLLINSFORD 386,830 841 0 0 67,908,500 7,504,1000
ROXBURY 295,786 0 0 0 5,179,300 212,8000
120 2017 Deparment of Revenue Administration Annual Report

RESIDENTIAL MFG HOUSING COMMERCIAL INDUSTRIAL
DISCRETIONARY PRESERVATION
EASEMENT
TOTAL LOCAL ASSESSED VALUATION - BUILDINGS
(PAGE 2 OF 4)
TABLES BY COUNTY - 2016
RSA 79-F FARM STRUCTURES
MUNICIPALITY
MEREDITH 790,693,954 7,590,000 94,689,532 16,200 0
MERRIMACK 1,434,527,502 9,303,400 587,636,885 5,300 0
MIDDLETON 82,723,478 4,840,700 4,525,900 31,222 0
MILAN 57,642,500 4,589,200 5,053,000 0 0
MILFORD 784,514,090 14,696,100 192,050,310 0 190,200
MILLSFIELD 3,095,000 90,930 183,900 0 0
MILTON 200,377,984 12,673,300 30,731,700 6,516 0
MONROE 45,972,700 1,629,900 4,725,500 0 0
MONT VERNON 161,510,040 1,506,620 1,349,890 0 0
MOULTONBOROUGH 1,148,979,831 15,845,600 55,340,125 79,144 0
NASHUA 3,824,480,900 47,604,900 1,832,985,451 10,650 0
NELSON 54,512,923 611,900 1,992,500 0 0
NEW BOSTON 373,794,249 2,337,100 20,941,600 25,951 0
NEW CASTLE 185,268,801 0 57,937,000 0 0
NEW DURHAM 189,881,630 4,031,400 8,402,770 21,400 0
NEW HAMPTON 135,535,945 5,031,200 41,500,400 0 0
NEW IPSWICH 246,285,400 4,442,600 17,498,100 0 0
NEW LONDON 581,193,960 0 45,694,540 161,100 0
NEWBURY 314,317,100 325,700 20,969,600 0 87,300
NEWFIELDS 116,252,900 248,600 13,676,700 0 0
NEWINGTON 90,591,700 160,900 257,140,700 0 0
NEWMARKET 434,986,100 7,613,200 81,887,200 0 0
NEWPORT 191,574,700 12,310,700 89,578,233 0 0
NEWTON 306,646,500 2,522,500 22,850,700 1,000 0
NORTH HAMPTON 475,561,150 29,815,100 84,024,150 577,100 0
NORTHFIELD 166,476,200 8,120,300 24,692,400 0 0
NORTHUMBERLAND 47,146,700 2,927,900 12,037,500 0 0
NORTHWOOD 205,328,596 12,650,600 44,213,700 36,498 0
NOTTINGHAM 331,367,300 3,411,600 7,520,300 0 0
ODELL 1,813,420 0 0 0 0
ORANGE 19,082,900 1,208,300 456,700 0 0
ORFORD 82,248,857 2,252,500 6,974,800 38,143 0
OSSIPEE 278,555,600 19,211,200 52,639,700 0 0
PELHAM 926,481,363 322,300 67,150,037 0 0
PEMBROKE 300,291,110 1,727,900 93,834,890 0 0
PETERBOROUGH 370,381,542 440,900 106,935,517 55,311 0
PIERMONT 53,391,200 1,058,800 2,039,100 0 0
PINKHAM'S GRANT 0 0 2,468,150 0 0
PITTSBURG 117,854,400 3,761,000 11,782,700 0 0
PITTSFIELD 132,556,400 4,801,100 38,432,600 6,000 0
PLAINFIELD 175,535,176 3,675,400 10,148,100 66,624 0
PLAISTOW 443,824,500 555,200 175,245,020 0 0
PLYMOUTH 203,514,040 5,412,200 101,316,255 11,000 0
PORTSMOUTH 1,655,759,700 14,329,500 1,509,444,816 0 0
RANDOLPH 41,550,072 520,500 1,614,900 4,328 0
RAYMOND 503,392,080 34,030,600 81,366,420 25,400 0
RICHMOND 62,085,200 1,591,300 284,500 0 0
RINDGE 286,189,416 3,155,900 67,305,027 0 0
ROCHESTER 1,031,904,104 104,203,700 316,319,296 21,300 0
ROLLINSFORD 128,639,400 868,700 22,506,000 0 0
ROXBURY 15,450,900 296,100 892,100 0 0
121 2017 Deparment of Revenue Administration Annual Report
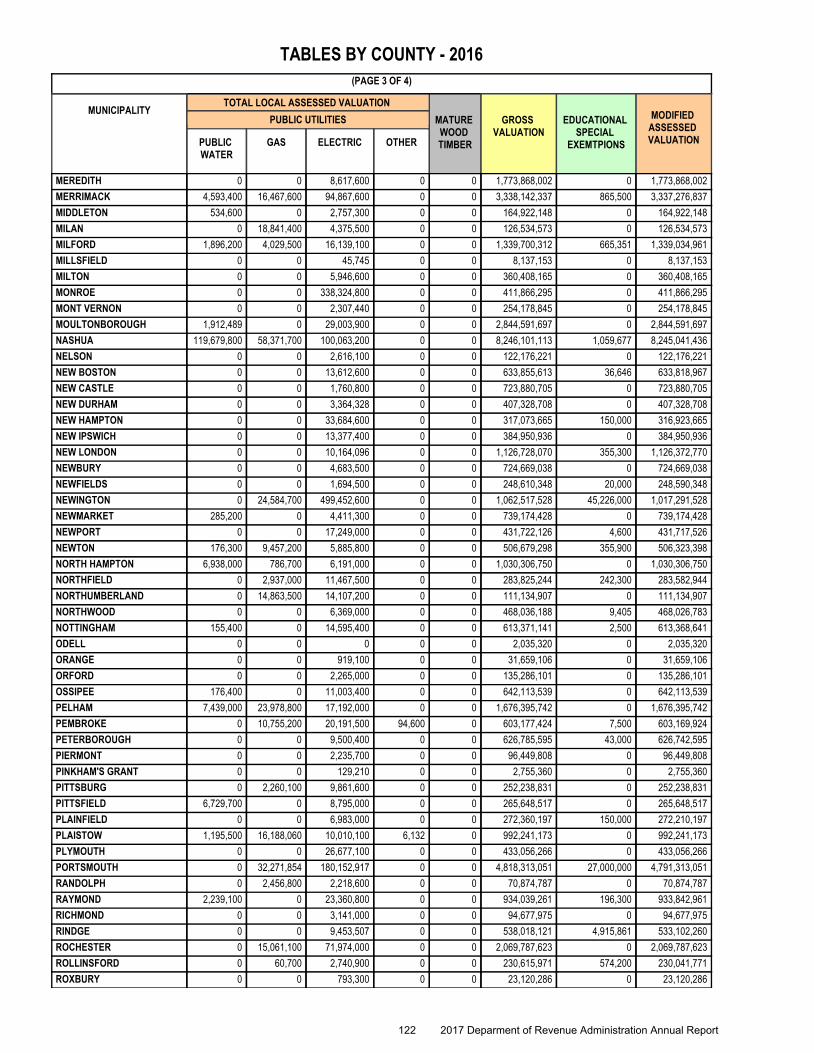
PUBLIC WATER
GAS ELECTRIC OTHER
MATURE WOOD TIMBER
TOTAL LOCAL ASSESSED VALUATION
(PAGE 3 OF 4)
GROSS VALUATION
MODIFIED ASSESSED VALUATION
EDUCATIONAL SPECIAL
EXEMTPIONS
TABLES BY COUNTY - 2016
MUNICIPALITYPUBLIC UTILITIES
MEREDITH 0 0 8,617,600 0 0 1,773,868,002 0 1,773,868,002
MERRIMACK 4,593,400 16,467,600 94,867,600 0 0 3,338,142,337 865,500 3,337,276,837
MIDDLETON 534,600 0 2,757,300 0 0 164,922,148 0 164,922,148
MILAN 0 18,841,400 4,375,500 0 0 126,534,573 0 126,534,573
MILFORD 1,896,200 4,029,500 16,139,100 0 0 1,339,700,312 665,351 1,339,034,961
MILLSFIELD 0 0 45,745 0 0 8,137,153 0 8,137,153
MILTON 0 0 5,946,600 0 0 360,408,165 0 360,408,165
MONROE 0 0 338,324,800 0 0 411,866,295 0 411,866,295
MONT VERNON 0 0 2,307,440 0 0 254,178,845 0 254,178,845
MOULTONBOROUGH 1,912,489 0 29,003,900 0 0 2,844,591,697 0 2,844,591,697
NASHUA 119,679,800 58,371,700 100,063,200 0 0 8,246,101,113 1,059,677 8,245,041,436
NELSON 0 0 2,616,100 0 0 122,176,221 0 122,176,221
NEW BOSTON 0 0 13,612,600 0 0 633,855,613 36,646 633,818,967
NEW CASTLE 0 0 1,760,800 0 0 723,880,705 0 723,880,705
NEW DURHAM 0 0 3,364,328 0 0 407,328,708 0 407,328,708
NEW HAMPTON 0 0 33,684,600 0 0 317,073,665 150,000 316,923,665
NEW IPSWICH 0 0 13,377,400 0 0 384,950,936 0 384,950,936
NEW LONDON 0 0 10,164,096 0 0 1,126,728,070 355,300 1,126,372,770
NEWBURY 0 0 4,683,500 0 0 724,669,038 0 724,669,038
NEWFIELDS 0 0 1,694,500 0 0 248,610,348 20,000 248,590,348
NEWINGTON 0 24,584,700 499,452,600 0 0 1,062,517,528 45,226,000 1,017,291,528
NEWMARKET 285,200 0 4,411,300 0 0 739,174,428 0 739,174,428
NEWPORT 0 0 17,249,000 0 0 431,722,126 4,600 431,717,526
NEWTON 176,300 9,457,200 5,885,800 0 0 506,679,298 355,900 506,323,398
NORTH HAMPTON 6,938,000 786,700 6,191,000 0 0 1,030,306,750 0 1,030,306,750
NORTHFIELD 0 2,937,000 11,467,500 0 0 283,825,244 242,300 283,582,944
NORTHUMBERLAND 0 14,863,500 14,107,200 0 0 111,134,907 0 111,134,907
NORTHWOOD 0 0 6,369,000 0 0 468,036,188 9,405 468,026,783
NOTTINGHAM 155,400 0 14,595,400 0 0 613,371,141 2,500 613,368,641
ODELL 0 0 0 0 0 2,035,320 0 2,035,320
ORANGE 0 0 919,100 0 0 31,659,106 0 31,659,106
ORFORD 0 0 2,265,000 0 0 135,286,101 0 135,286,101
OSSIPEE 176,400 0 11,003,400 0 0 642,113,539 0 642,113,539
PELHAM 7,439,000 23,978,800 17,192,000 0 0 1,676,395,742 0 1,676,395,742
PEMBROKE 0 10,755,200 20,191,500 94,600 0 603,177,424 7,500 603,169,924
PETERBOROUGH 0 0 9,500,400 0 0 626,785,595 43,000 626,742,595
PIERMONT 0 0 2,235,700 0 0 96,449,808 0 96,449,808
PINKHAM'S GRANT 0 0 129,210 0 0 2,755,360 0 2,755,360
PITTSBURG 0 2,260,100 9,861,600 0 0 252,238,831 0 252,238,831
PITTSFIELD 6,729,700 0 8,795,000 0 0 265,648,517 0 265,648,517
PLAINFIELD 0 0 6,983,000 0 0 272,360,197 150,000 272,210,197
PLAISTOW 1,195,500 16,188,060 10,010,100 6,132 0 992,241,173 0 992,241,173
PLYMOUTH 0 0 26,677,100 0 0 433,056,266 0 433,056,266
PORTSMOUTH 0 32,271,854 180,152,917 0 0 4,818,313,051 27,000,000 4,791,313,051
RANDOLPH 0 2,456,800 2,218,600 0 0 70,874,787 0 70,874,787
RAYMOND 2,239,100 0 23,360,800 0 0 934,039,261 196,300 933,842,961
RICHMOND 0 0 3,141,000 0 0 94,677,975 0 94,677,975
RINDGE 0 0 9,453,507 0 0 538,018,121 4,915,861 533,102,260
ROCHESTER 0 15,061,100 71,974,000 0 0 2,069,787,623 0 2,069,787,623
ROLLINSFORD 0 60,700 2,740,900 0 0 230,615,971 574,200 230,041,771
ROXBURY 0 0 793,300 0 0 23,120,286 0 23,120,286
122 2017 Deparment of Revenue Administration Annual Report
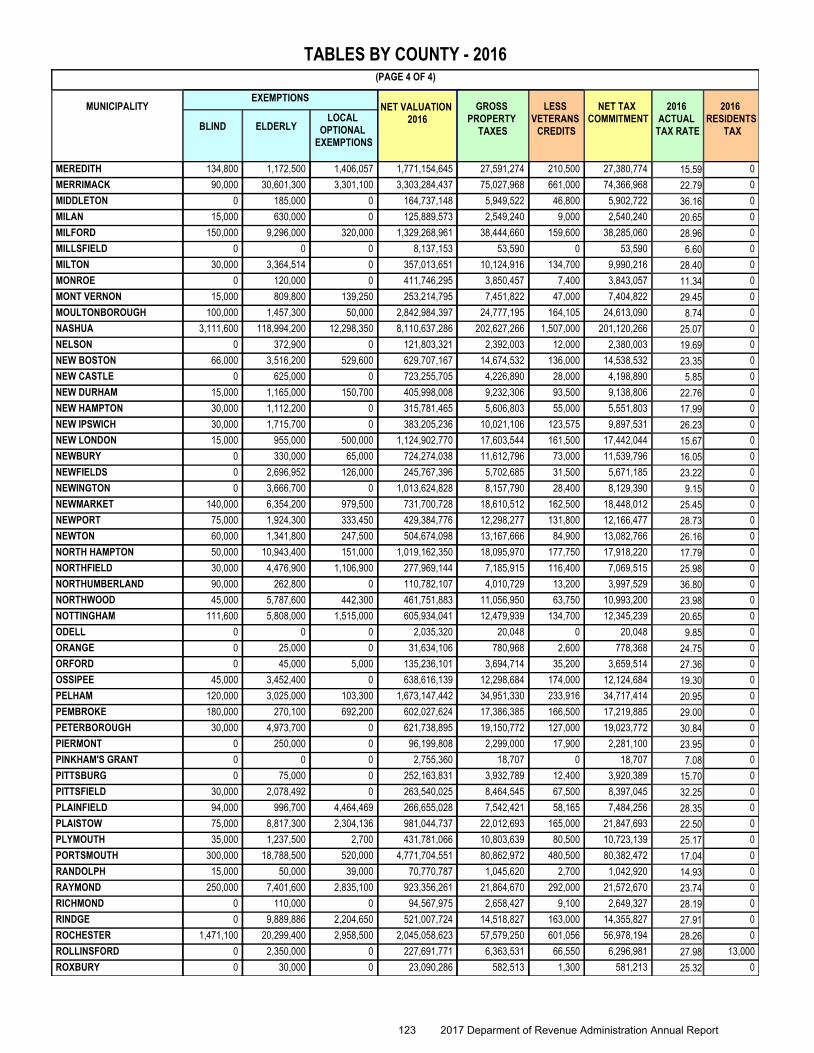
NET VALUATION 2016
GROSS PROPERTY
TAXES
LESS VETERANS
CREDITS
EXEMPTIONS
(PAGE 4 OF 4)
NET TAX COMMITMENT
2016 RESIDENTS
TAX
2016 ACTUAL
TAX RATEBLIND ELDERLYLOCAL
OPTIONAL EXEMPTIONS
TABLES BY COUNTY - 2016
MUNICIPALITY
MEREDITH 134,800 1,172,500 1,406,057 1,771,154,645 27,591,274 210,500 27,380,774 015.59
MERRIMACK 90,000 30,601,300 3,301,100 3,303,284,437 75,027,968 661,000 74,366,968 022.79
MIDDLETON 0 185,000 0 164,737,148 5,949,522 46,800 5,902,722 036.16
MILAN 15,000 630,000 0 125,889,573 2,549,240 9,000 2,540,240 020.65
MILFORD 150,000 9,296,000 320,000 1,329,268,961 38,444,660 159,600 38,285,060 028.96
MILLSFIELD 0 0 0 8,137,153 53,590 0 53,590 06.60
MILTON 30,000 3,364,514 0 357,013,651 10,124,916 134,700 9,990,216 028.40
MONROE 0 120,000 0 411,746,295 3,850,457 7,400 3,843,057 011.34
MONT VERNON 15,000 809,800 139,250 253,214,795 7,451,822 47,000 7,404,822 029.45
MOULTONBOROUGH 100,000 1,457,300 50,000 2,842,984,397 24,777,195 164,105 24,613,090 08.74
NASHUA 3,111,600 118,994,200 12,298,350 8,110,637,286 202,627,266 1,507,000 201,120,266 025.07
NELSON 0 372,900 0 121,803,321 2,392,003 12,000 2,380,003 019.69
NEW BOSTON 66,000 3,516,200 529,600 629,707,167 14,674,532 136,000 14,538,532 023.35
NEW CASTLE 0 625,000 0 723,255,705 4,226,890 28,000 4,198,890 05.85
NEW DURHAM 15,000 1,165,000 150,700 405,998,008 9,232,306 93,500 9,138,806 022.76
NEW HAMPTON 30,000 1,112,200 0 315,781,465 5,606,803 55,000 5,551,803 017.99
NEW IPSWICH 30,000 1,715,700 0 383,205,236 10,021,106 123,575 9,897,531 026.23
NEW LONDON 15,000 955,000 500,000 1,124,902,770 17,603,544 161,500 17,442,044 015.67
NEWBURY 0 330,000 65,000 724,274,038 11,612,796 73,000 11,539,796 016.05
NEWFIELDS 0 2,696,952 126,000 245,767,396 5,702,685 31,500 5,671,185 023.22
NEWINGTON 0 3,666,700 0 1,013,624,828 8,157,790 28,400 8,129,390 09.15
NEWMARKET 140,000 6,354,200 979,500 731,700,728 18,610,512 162,500 18,448,012 025.45
NEWPORT 75,000 1,924,300 333,450 429,384,776 12,298,277 131,800 12,166,477 028.73
NEWTON 60,000 1,341,800 247,500 504,674,098 13,167,666 84,900 13,082,766 026.16
NORTH HAMPTON 50,000 10,943,400 151,000 1,019,162,350 18,095,970 177,750 17,918,220 017.79
NORTHFIELD 30,000 4,476,900 1,106,900 277,969,144 7,185,915 116,400 7,069,515 025.98
NORTHUMBERLAND 90,000 262,800 0 110,782,107 4,010,729 13,200 3,997,529 036.80
NORTHWOOD 45,000 5,787,600 442,300 461,751,883 11,056,950 63,750 10,993,200 023.98
NOTTINGHAM 111,600 5,808,000 1,515,000 605,934,041 12,479,939 134,700 12,345,239 020.65
ODELL 0 0 0 2,035,320 20,048 0 20,048 09.85
ORANGE 0 25,000 0 31,634,106 780,968 2,600 778,368 024.75
ORFORD 0 45,000 5,000 135,236,101 3,694,714 35,200 3,659,514 027.36
OSSIPEE 45,000 3,452,400 0 638,616,139 12,298,684 174,000 12,124,684 019.30
PELHAM 120,000 3,025,000 103,300 1,673,147,442 34,951,330 233,916 34,717,414 020.95
PEMBROKE 180,000 270,100 692,200 602,027,624 17,386,385 166,500 17,219,885 029.00
PETERBOROUGH 30,000 4,973,700 0 621,738,895 19,150,772 127,000 19,023,772 030.84
PIERMONT 0 250,000 0 96,199,808 2,299,000 17,900 2,281,100 023.95
PINKHAM'S GRANT 0 0 0 2,755,360 18,707 0 18,707 07.08
PITTSBURG 0 75,000 0 252,163,831 3,932,789 12,400 3,920,389 015.70
PITTSFIELD 30,000 2,078,492 0 263,540,025 8,464,545 67,500 8,397,045 032.25
PLAINFIELD 94,000 996,700 4,464,469 266,655,028 7,542,421 58,165 7,484,256 028.35
PLAISTOW 75,000 8,817,300 2,304,136 981,044,737 22,012,693 165,000 21,847,693 022.50
PLYMOUTH 35,000 1,237,500 2,700 431,781,066 10,803,639 80,500 10,723,139 025.17
PORTSMOUTH 300,000 18,788,500 520,000 4,771,704,551 80,862,972 480,500 80,382,472 017.04
RANDOLPH 15,000 50,000 39,000 70,770,787 1,045,620 2,700 1,042,920 014.93
RAYMOND 250,000 7,401,600 2,835,100 923,356,261 21,864,670 292,000 21,572,670 023.74
RICHMOND 0 110,000 0 94,567,975 2,658,427 9,100 2,649,327 028.19
RINDGE 0 9,889,886 2,204,650 521,007,724 14,518,827 163,000 14,355,827 027.91
ROCHESTER 1,471,100 20,299,400 2,958,500 2,045,058,623 57,579,250 601,056 56,978,194 028.26
ROLLINSFORD 0 2,350,000 0 227,691,771 6,363,531 66,550 6,296,981 13,00027.98
ROXBURY 0 30,000 0 23,090,286 582,513 1,300 581,213 025.32
123 2017 Deparment of Revenue Administration Annual Report
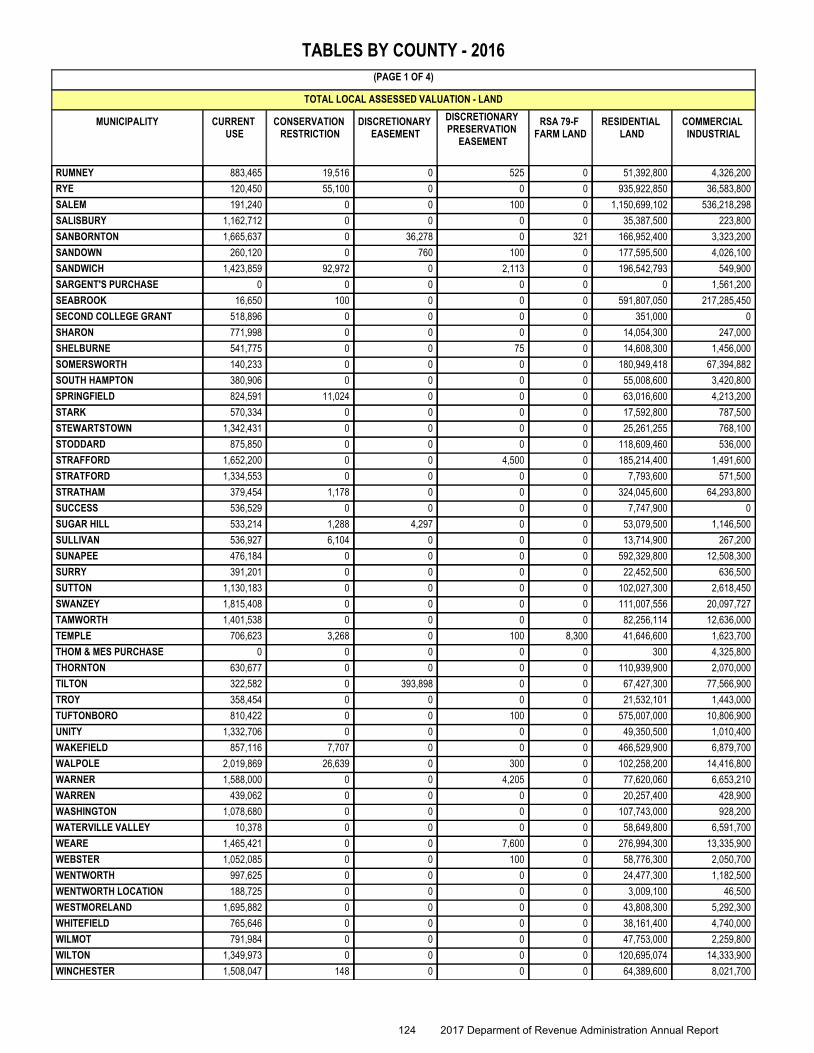
CURRENT USE
CONSERVATION RESTRICTION
DISCRETIONARY EASEMENT
DISCRETIONARY PRESERVATION
EASEMENT
RESIDENTIAL LAND
COMMERCIAL INDUSTRIAL
TOTAL LOCAL ASSESSED VALUATION - LAND
(PAGE 1 OF 4)
TABLES BY COUNTY - 2016
RSA 79-F FARM LAND
MUNICIPALITY
RUMNEY 883,465 19,516 0 525 51,392,800 4,326,2000
RYE 120,450 55,100 0 0 935,922,850 36,583,8000
SALEM 191,240 0 0 100 1,150,699,102 536,218,2980
SALISBURY 1,162,712 0 0 0 35,387,500 223,8000
SANBORNTON 1,665,637 0 36,278 0 166,952,400 3,323,200321
SANDOWN 260,120 0 760 100 177,595,500 4,026,1000
SANDWICH 1,423,859 92,972 0 2,113 196,542,793 549,9000
SARGENT'S PURCHASE 0 0 0 0 0 1,561,2000
SEABROOK 16,650 100 0 0 591,807,050 217,285,4500
SECOND COLLEGE GRANT 518,896 0 0 0 351,000 00
SHARON 771,998 0 0 0 14,054,300 247,0000
SHELBURNE 541,775 0 0 75 14,608,300 1,456,0000
SOMERSWORTH 140,233 0 0 0 180,949,418 67,394,8820
SOUTH HAMPTON 380,906 0 0 0 55,008,600 3,420,8000
SPRINGFIELD 824,591 11,024 0 0 63,016,600 4,213,2000
STARK 570,334 0 0 0 17,592,800 787,5000
STEWARTSTOWN 1,342,431 0 0 0 25,261,255 768,1000
STODDARD 875,850 0 0 0 118,609,460 536,0000
STRAFFORD 1,652,200 0 0 4,500 185,214,400 1,491,6000
STRATFORD 1,334,553 0 0 0 7,793,600 571,5000
STRATHAM 379,454 1,178 0 0 324,045,600 64,293,8000
SUCCESS 536,529 0 0 0 7,747,900 00
SUGAR HILL 533,214 1,288 4,297 0 53,079,500 1,146,5000
SULLIVAN 536,927 6,104 0 0 13,714,900 267,2000
SUNAPEE 476,184 0 0 0 592,329,800 12,508,3000
SURRY 391,201 0 0 0 22,452,500 636,5000
SUTTON 1,130,183 0 0 0 102,027,300 2,618,4500
SWANZEY 1,815,408 0 0 0 111,007,556 20,097,7270
TAMWORTH 1,401,538 0 0 0 82,256,114 12,636,0000
TEMPLE 706,623 3,268 0 100 41,646,600 1,623,7008,300
THOM & MES PURCHASE 0 0 0 0 300 4,325,8000
THORNTON 630,677 0 0 0 110,939,900 2,070,0000
TILTON 322,582 0 393,898 0 67,427,300 77,566,9000
TROY 358,454 0 0 0 21,532,101 1,443,0000
TUFTONBORO 810,422 0 0 100 575,007,000 10,806,9000
UNITY 1,332,706 0 0 0 49,350,500 1,010,4000
WAKEFIELD 857,116 7,707 0 0 466,529,900 6,879,7000
WALPOLE 2,019,869 26,639 0 300 102,258,200 14,416,8000
WARNER 1,588,000 0 0 4,205 77,620,060 6,653,2100
WARREN 439,062 0 0 0 20,257,400 428,9000
WASHINGTON 1,078,680 0 0 0 107,743,000 928,2000
WATERVILLE VALLEY 10,378 0 0 0 58,649,800 6,591,7000
WEARE 1,465,421 0 0 7,600 276,994,300 13,335,9000
WEBSTER 1,052,085 0 0 100 58,776,300 2,050,7000
WENTWORTH 997,625 0 0 0 24,477,300 1,182,5000
WENTWORTH LOCATION 188,725 0 0 0 3,009,100 46,5000
WESTMORELAND 1,695,882 0 0 0 43,808,300 5,292,3000
WHITEFIELD 765,646 0 0 0 38,161,400 4,740,0000
WILMOT 791,984 0 0 0 47,753,000 2,259,8000
WILTON 1,349,973 0 0 0 120,695,074 14,333,9000
WINCHESTER 1,508,047 148 0 0 64,389,600 8,021,7000
124 2017 Deparment of Revenue Administration Annual Report
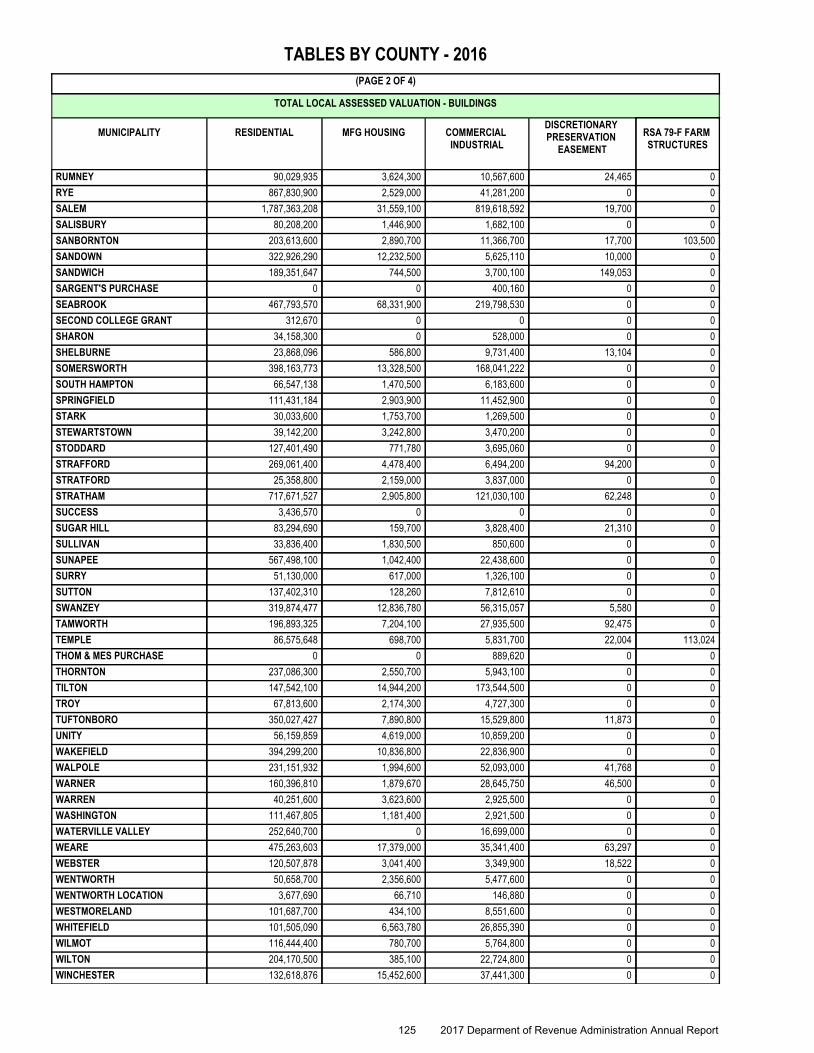
RESIDENTIAL MFG HOUSING COMMERCIAL INDUSTRIAL
DISCRETIONARY PRESERVATION
EASEMENT
TOTAL LOCAL ASSESSED VALUATION - BUILDINGS
(PAGE 2 OF 4)
TABLES BY COUNTY - 2016
RSA 79-F FARM STRUCTURES
MUNICIPALITY
RUMNEY 90,029,935 3,624,300 10,567,600 24,465 0
RYE 867,830,900 2,529,000 41,281,200 0 0
SALEM 1,787,363,208 31,559,100 819,618,592 19,700 0
SALISBURY 80,208,200 1,446,900 1,682,100 0 0
SANBORNTON 203,613,600 2,890,700 11,366,700 17,700 103,500
SANDOWN 322,926,290 12,232,500 5,625,110 10,000 0
SANDWICH 189,351,647 744,500 3,700,100 149,053 0
SARGENT'S PURCHASE 0 0 400,160 0 0
SEABROOK 467,793,570 68,331,900 219,798,530 0 0
SECOND COLLEGE GRANT 312,670 0 0 0 0
SHARON 34,158,300 0 528,000 0 0
SHELBURNE 23,868,096 586,800 9,731,400 13,104 0
SOMERSWORTH 398,163,773 13,328,500 168,041,222 0 0
SOUTH HAMPTON 66,547,138 1,470,500 6,183,600 0 0
SPRINGFIELD 111,431,184 2,903,900 11,452,900 0 0
STARK 30,033,600 1,753,700 1,269,500 0 0
STEWARTSTOWN 39,142,200 3,242,800 3,470,200 0 0
STODDARD 127,401,490 771,780 3,695,060 0 0
STRAFFORD 269,061,400 4,478,400 6,494,200 94,200 0
STRATFORD 25,358,800 2,159,000 3,837,000 0 0
STRATHAM 717,671,527 2,905,800 121,030,100 62,248 0
SUCCESS 3,436,570 0 0 0 0
SUGAR HILL 83,294,690 159,700 3,828,400 21,310 0
SULLIVAN 33,836,400 1,830,500 850,600 0 0
SUNAPEE 567,498,100 1,042,400 22,438,600 0 0
SURRY 51,130,000 617,000 1,326,100 0 0
SUTTON 137,402,310 128,260 7,812,610 0 0
SWANZEY 319,874,477 12,836,780 56,315,057 5,580 0
TAMWORTH 196,893,325 7,204,100 27,935,500 92,475 0
TEMPLE 86,575,648 698,700 5,831,700 22,004 113,024
THOM & MES PURCHASE 0 0 889,620 0 0
THORNTON 237,086,300 2,550,700 5,943,100 0 0
TILTON 147,542,100 14,944,200 173,544,500 0 0
TROY 67,813,600 2,174,300 4,727,300 0 0
TUFTONBORO 350,027,427 7,890,800 15,529,800 11,873 0
UNITY 56,159,859 4,619,000 10,859,200 0 0
WAKEFIELD 394,299,200 10,836,800 22,836,900 0 0
WALPOLE 231,151,932 1,994,600 52,093,000 41,768 0
WARNER 160,396,810 1,879,670 28,645,750 46,500 0
WARREN 40,251,600 3,623,600 2,925,500 0 0
WASHINGTON 111,467,805 1,181,400 2,921,500 0 0
WATERVILLE VALLEY 252,640,700 0 16,699,000 0 0
WEARE 475,263,603 17,379,000 35,341,400 63,297 0
WEBSTER 120,507,878 3,041,400 3,349,900 18,522 0
WENTWORTH 50,658,700 2,356,600 5,477,600 0 0
WENTWORTH LOCATION 3,677,690 66,710 146,880 0 0
WESTMORELAND 101,687,700 434,100 8,551,600 0 0
WHITEFIELD 101,505,090 6,563,780 26,855,390 0 0
WILMOT 116,444,400 780,700 5,764,800 0 0
WILTON 204,170,500 385,100 22,724,800 0 0
WINCHESTER 132,618,876 15,452,600 37,441,300 0 0
125 2017 Deparment of Revenue Administration Annual Report
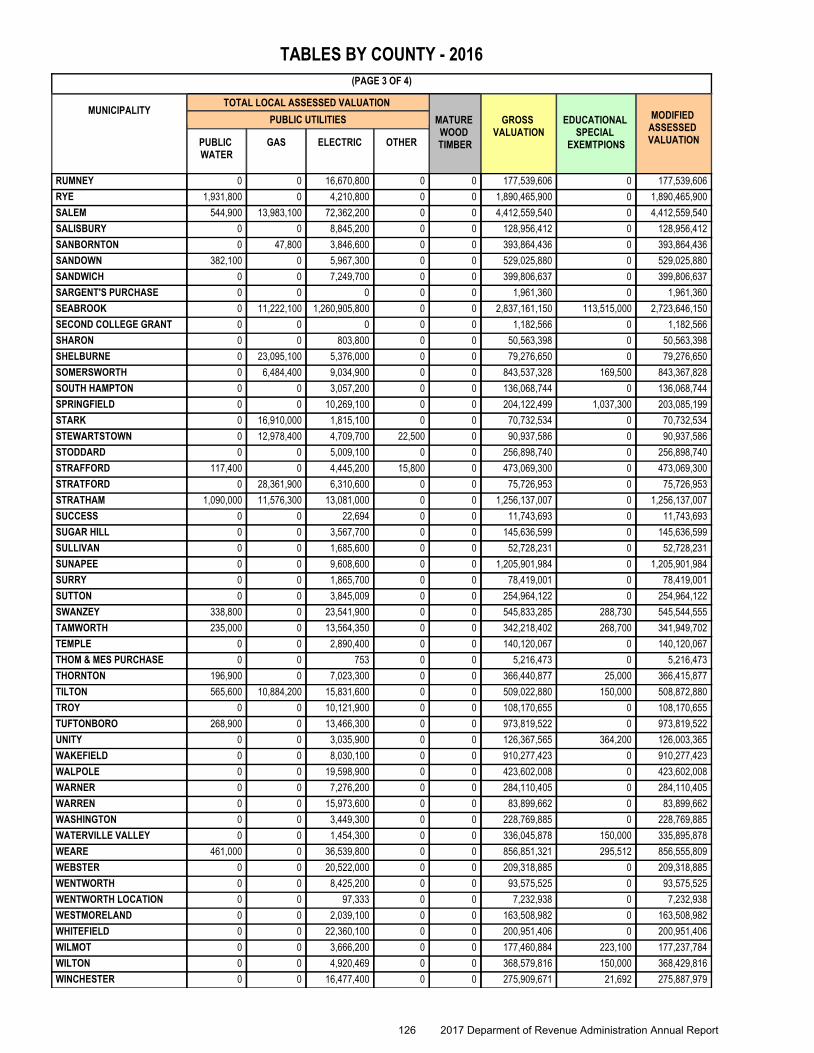
PUBLIC WATER
GAS ELECTRIC OTHER
MATURE WOOD TIMBER
TOTAL LOCAL ASSESSED VALUATION
(PAGE 3 OF 4)
GROSS VALUATION
MODIFIED ASSESSED VALUATION
EDUCATIONAL SPECIAL
EXEMTPIONS
TABLES BY COUNTY - 2016
MUNICIPALITYPUBLIC UTILITIES
RUMNEY 0 0 16,670,800 0 0 177,539,606 0 177,539,606
RYE 1,931,800 0 4,210,800 0 0 1,890,465,900 0 1,890,465,900
SALEM 544,900 13,983,100 72,362,200 0 0 4,412,559,540 0 4,412,559,540
SALISBURY 0 0 8,845,200 0 0 128,956,412 0 128,956,412
SANBORNTON 0 47,800 3,846,600 0 0 393,864,436 0 393,864,436
SANDOWN 382,100 0 5,967,300 0 0 529,025,880 0 529,025,880
SANDWICH 0 0 7,249,700 0 0 399,806,637 0 399,806,637
SARGENT'S PURCHASE 0 0 0 0 0 1,961,360 0 1,961,360
SEABROOK 0 11,222,100 1,260,905,800 0 0 2,837,161,150 113,515,000 2,723,646,150
SECOND COLLEGE GRANT 0 0 0 0 0 1,182,566 0 1,182,566
SHARON 0 0 803,800 0 0 50,563,398 0 50,563,398
SHELBURNE 0 23,095,100 5,376,000 0 0 79,276,650 0 79,276,650
SOMERSWORTH 0 6,484,400 9,034,900 0 0 843,537,328 169,500 843,367,828
SOUTH HAMPTON 0 0 3,057,200 0 0 136,068,744 0 136,068,744
SPRINGFIELD 0 0 10,269,100 0 0 204,122,499 1,037,300 203,085,199
STARK 0 16,910,000 1,815,100 0 0 70,732,534 0 70,732,534
STEWARTSTOWN 0 12,978,400 4,709,700 22,500 0 90,937,586 0 90,937,586
STODDARD 0 0 5,009,100 0 0 256,898,740 0 256,898,740
STRAFFORD 117,400 0 4,445,200 15,800 0 473,069,300 0 473,069,300
STRATFORD 0 28,361,900 6,310,600 0 0 75,726,953 0 75,726,953
STRATHAM 1,090,000 11,576,300 13,081,000 0 0 1,256,137,007 0 1,256,137,007
SUCCESS 0 0 22,694 0 0 11,743,693 0 11,743,693
SUGAR HILL 0 0 3,567,700 0 0 145,636,599 0 145,636,599
SULLIVAN 0 0 1,685,600 0 0 52,728,231 0 52,728,231
SUNAPEE 0 0 9,608,600 0 0 1,205,901,984 0 1,205,901,984
SURRY 0 0 1,865,700 0 0 78,419,001 0 78,419,001
SUTTON 0 0 3,845,009 0 0 254,964,122 0 254,964,122
SWANZEY 338,800 0 23,541,900 0 0 545,833,285 288,730 545,544,555
TAMWORTH 235,000 0 13,564,350 0 0 342,218,402 268,700 341,949,702
TEMPLE 0 0 2,890,400 0 0 140,120,067 0 140,120,067
THOM & MES PURCHASE 0 0 753 0 0 5,216,473 0 5,216,473
THORNTON 196,900 0 7,023,300 0 0 366,440,877 25,000 366,415,877
TILTON 565,600 10,884,200 15,831,600 0 0 509,022,880 150,000 508,872,880
TROY 0 0 10,121,900 0 0 108,170,655 0 108,170,655
TUFTONBORO 268,900 0 13,466,300 0 0 973,819,522 0 973,819,522
UNITY 0 0 3,035,900 0 0 126,367,565 364,200 126,003,365
WAKEFIELD 0 0 8,030,100 0 0 910,277,423 0 910,277,423
WALPOLE 0 0 19,598,900 0 0 423,602,008 0 423,602,008
WARNER 0 0 7,276,200 0 0 284,110,405 0 284,110,405
WARREN 0 0 15,973,600 0 0 83,899,662 0 83,899,662
WASHINGTON 0 0 3,449,300 0 0 228,769,885 0 228,769,885
WATERVILLE VALLEY 0 0 1,454,300 0 0 336,045,878 150,000 335,895,878
WEARE 461,000 0 36,539,800 0 0 856,851,321 295,512 856,555,809
WEBSTER 0 0 20,522,000 0 0 209,318,885 0 209,318,885
WENTWORTH 0 0 8,425,200 0 0 93,575,525 0 93,575,525
WENTWORTH LOCATION 0 0 97,333 0 0 7,232,938 0 7,232,938
WESTMORELAND 0 0 2,039,100 0 0 163,508,982 0 163,508,982
WHITEFIELD 0 0 22,360,100 0 0 200,951,406 0 200,951,406
WILMOT 0 0 3,666,200 0 0 177,460,884 223,100 177,237,784
WILTON 0 0 4,920,469 0 0 368,579,816 150,000 368,429,816
WINCHESTER 0 0 16,477,400 0 0 275,909,671 21,692 275,887,979
126 2017 Deparment of Revenue Administration Annual Report

NET VALUATION 2016
GROSS PROPERTY
TAXES
LESS VETERANS
CREDITS
EXEMPTIONS
(PAGE 4 OF 4)
NET TAX COMMITMENT
2016 RESIDENTS
TAX
2016 ACTUAL
TAX RATEBLIND ELDERLYLOCAL
OPTIONAL EXEMPTIONS
TABLES BY COUNTY - 2016
MUNICIPALITY
RUMNEY 30,000 325,000 16,000 177,168,606 4,171,184 54,045 4,117,139 023.76
RYE 30,000 6,183,200 112,300 1,884,140,400 20,107,325 159,000 19,948,325 010.68
SALEM 540,000 18,770,200 429,000 4,392,820,340 89,537,652 606,500 88,931,152 020.43
SALISBURY 0 966,000 280,000 127,710,412 3,115,516 45,100 3,070,416 024.56
SANBORNTON 0 450,000 361,506 393,052,930 9,278,377 104,300 9,174,077 023.63
SANDOWN 45,000 9,419,700 0 519,561,180 15,134,276 135,000 14,999,276 029.16
SANDWICH 0 230,000 460,000 399,116,637 5,754,408 65,415 5,688,993 014.46
SARGENT'S PURCHASE 0 0 0 1,961,360 0 0 0 00.00
SEABROOK 45,000 21,248,900 3,069,300 2,699,282,950 37,246,000 246,500 36,999,500 014.79
SECOND COLLEGE GRANT 0 0 0 1,182,566 0 0 0 00.00
SHARON 0 60,000 0 50,503,398 1,054,602 4,800 1,049,802 020.92
SHELBURNE 0 50,000 58,000 79,168,650 1,171,380 4,700 1,166,680 015.58
SOMERSWORTH 149,500 3,724,100 0 839,494,228 26,927,774 248,900 26,678,874 032.12
SOUTH HAMPTON 0 2,801,600 50,000 133,217,144 2,421,365 18,340 2,403,025 018.23
SPRINGFIELD 0 240,000 122,575 202,722,624 4,497,362 36,500 4,460,862 022.29
STARK 15,000 55,000 0 70,662,534 1,186,563 7,300 1,179,263 017.42
STEWARTSTOWN 0 85,000 0 90,852,586 2,129,231 18,350 2,110,881 023.88
STODDARD 0 610,000 90,000 256,198,740 3,828,699 19,450 3,809,249 014.99
STRAFFORD 0 655,000 135,000 472,279,300 10,025,898 42,000 9,983,898 021.25
STRATFORD 15,000 232,200 0 75,479,753 1,685,421 6,150 1,679,271 023.51
STRATHAM 75,000 3,859,100 0 1,252,202,907 25,484,949 191,000 25,293,949 020.40
SUCCESS 0 0 0 11,743,693 63,475 0 63,475 05.41
SUGAR HILL 0 20,000 0 145,616,599 3,086,218 14,400 3,071,818 021.25
SULLIVAN 0 294,273 120,000 52,313,958 1,648,165 7,900 1,640,265 031.58
SUNAPEE 30,000 300,000 0 1,205,571,984 18,096,110 92,250 18,003,860 015.03
SURRY 0 5,000 21,674 78,392,327 1,420,620 25,200 1,395,420 018.18
SUTTON 0 550,000 0 254,414,122 6,854,596 62,000 6,792,596 026.98
SWANZEY 90,000 1,700,500 28,200 543,725,855 15,639,813 117,250 15,522,563 028.87
TAMWORTH 30,000 845,500 480,500 340,593,702 7,781,480 84,500 7,696,980 022.94
TEMPLE 0 50,000 0 140,070,067 3,497,414 6,500 3,490,914 025.02
THOM & MES PURCHASE 0 0 0 5,216,473 20,602 0 20,602 03.95
THORNTON 15,000 734,300 151,700 365,514,877 7,071,665 72,800 6,998,865 019.39
TILTON 20,300 2,890,600 359,600 505,602,380 10,412,516 98,000 10,314,516 020.72
TROY 45,000 217,200 0 107,908,455 3,928,935 34,850 3,894,085 036.62
TUFTONBORO 90,000 301,800 0 973,427,722 10,117,964 98,500 10,019,464 010.43
UNITY 0 77,000 0 125,926,365 3,786,875 53,200 3,733,675 030.13
WAKEFIELD 45,000 1,775,800 19,000 908,437,623 11,736,875 204,625 11,532,250 012.94
WALPOLE 15,000 240,000 0 423,347,008 10,249,427 99,400 10,150,027 024.31
WARNER 30,000 1,042,020 290,350 282,748,035 7,713,960 78,100 7,635,860 027.34
WARREN 0 210,000 0 83,689,662 1,938,382 22,800 1,915,582 023.57
WASHINGTON 0 130,000 63,090 228,576,795 4,415,027 20,400 4,394,627 019.35
WATERVILLE VALLEY 0 0 0 335,895,878 4,698,746 8,000 4,690,746 014.00
WEARE 15,000 4,468,081 529,080 851,543,648 18,968,000 190,500 18,777,500 022.37
WEBSTER 15,000 408,000 60,000 208,835,885 4,750,992 53,000 4,697,992 022.97
WENTWORTH 15,000 35,000 0 93,525,525 2,091,755 11,800 2,079,955 022.58
WENTWORTH LOCATION 0 0 0 7,232,938 44,377 50 44,327 06.17
WESTMORELAND 0 75,000 0 163,433,982 4,053,152 15,200 4,037,952 024.83
WHITEFIELD 0 652,740 0 200,298,666 4,912,653 67,500 4,845,153 024.77
WILMOT 0 95,000 30,000 177,112,784 4,292,867 30,550 4,262,317 024.29
WILTON 15,000 365,000 0 368,049,816 9,683,311 58,400 9,624,911 026.34
WINCHESTER 30,000 1,858,297 203,450 273,796,232 8,320,277 113,000 8,207,277 030.53
127 2017 Deparment of Revenue Administration Annual Report
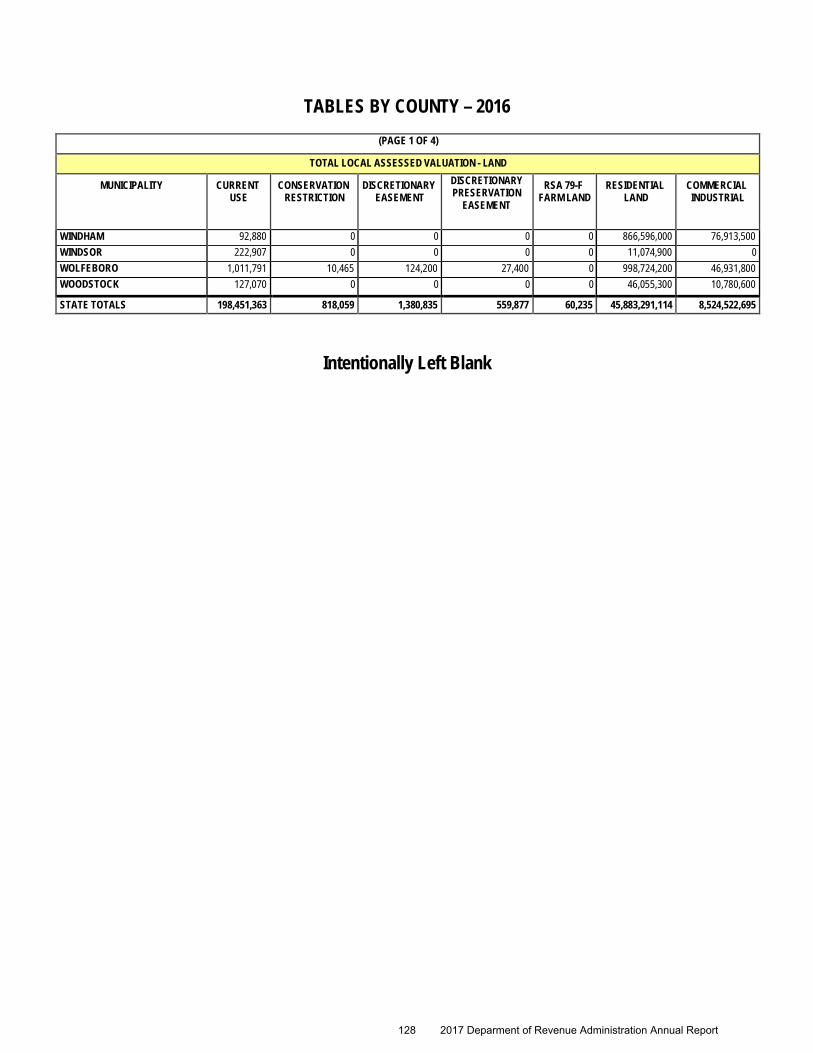
TABLES BY COUNTY – 2016 (PAGE 1 OF 4)
TOTAL LOCAL ASSESSED VALUATION - LAND
MUNICIPALITY CURRENT USE
CONSERVATION RESTRICTION
DISCRETIONARY EASEMENT
DISCRETIONARY PRESERVATION
EASEMENT
RSA 79-F FARM LAND
RESIDENTIAL LAND
COMMERCIAL INDUSTRIAL
WINDHAM 92,880 0 0 0 0 866,596,000 76,913,500 WINDSOR 222,907 0 0 0 0 11,074,900 0 WOLFEBORO 1,011,791 10,465 124,200 27,400 0 998,724,200 46,931,800 WOODSTOCK 127,070 0 0 0 0 46,055,300 10,780,600
STATE TOTALS 198,451,363 818,059 1,380,835 559,877 60,235 45,883,291,114 8,524,522,695
Intentionally Left Blank
128 2017 Deparment of Revenue Administration Annual Report
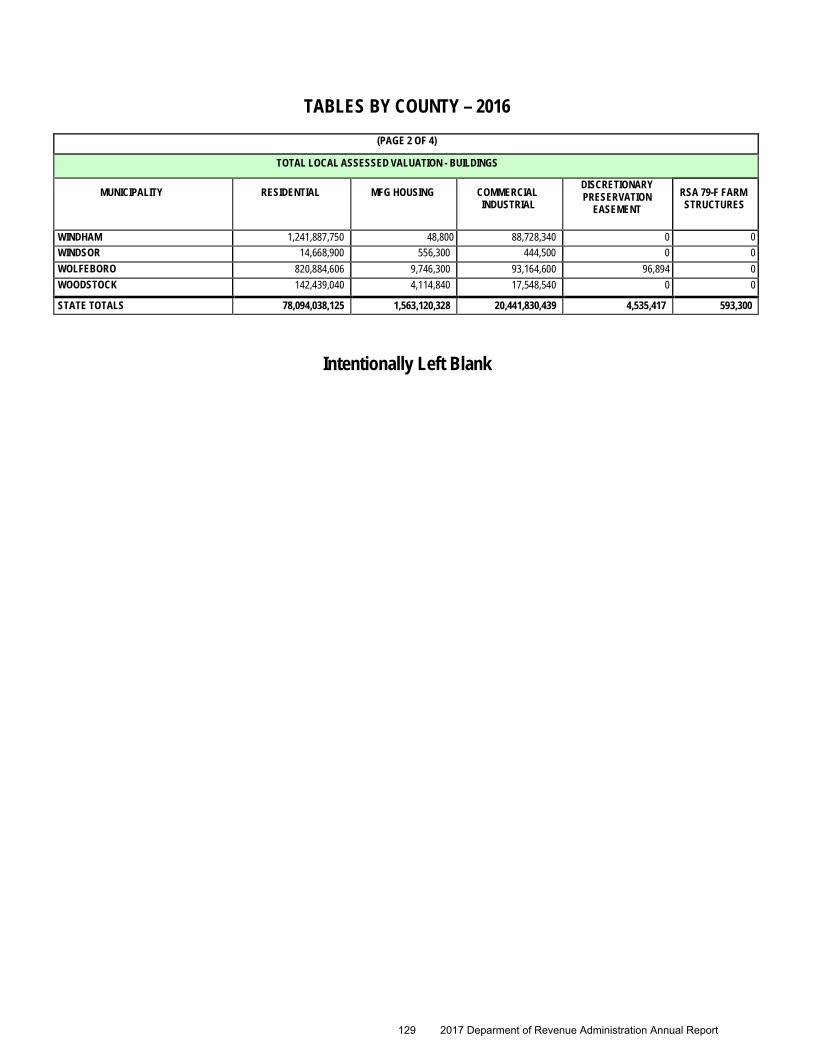
TABLES BY COUNTY – 2016 (PAGE 2 OF 4)
TOTAL LOCAL ASSESSED VALUATION - BUILDINGS
MUNICIPALITY
RESIDENTIAL
MFG HOUSING
COMMERCIAL INDUSTRIAL
DISCRETIONARY PRESERVATION
EASEMENT
RSA 79-F FARM STRUCTURES
WINDHAM 1,241,887,750 48,800 88,728,340 0 0 WINDSOR 14,668,900 556,300 444,500 0 0 WOLFEBORO 820,884,606 9,746,300 93,164,600 96,894 0 WOODSTOCK 142,439,040 4,114,840 17,548,540 0 0
STATE TOTALS 78,094,038,125 1,563,120,328 20,441,830,439 4,535,417 593,300
Intentionally Left Blank
129 2017 Deparment of Revenue Administration Annual Report

TABLES BY COUNTY – 2016 (PAGE 3 OF 4)
MUNICIPALITY
TOTAL LOCAL ASSESSED VALUATION MATURE WOOD TIMBER
GROSS
VALUATION
EDUCATIONAL
SPECIAL EXEMTPIONS
MODIFIED
ASSESSED VALUATION
PUBLIC UTILITIES
PUBLIC WATER
GAS ELECTRIC OTHER
WINDHAM 3,813,500 1,426,900 12,902,100 0 0 2,292,409,770 524,430 2,291,885,340 WINDSOR 0 0 753,900 0 0 27,721,407 150,000 27,571,407 WOLFEBORO 0 0 260,100 0 0 1,970,982,356 300,000 1,970,682,356 WOODSTOCK 0 0 3,953,472 0 0 225,018,862 0 225,018,862
STATE TOTALS 246,713,692 861,217,614 6,940,698,219 500,032 6,158 162,762,337,502 243,967,652 162,518,369,850
Intentionally Left Blank
130 2017 Deparment of Revenue Administration Annual Report
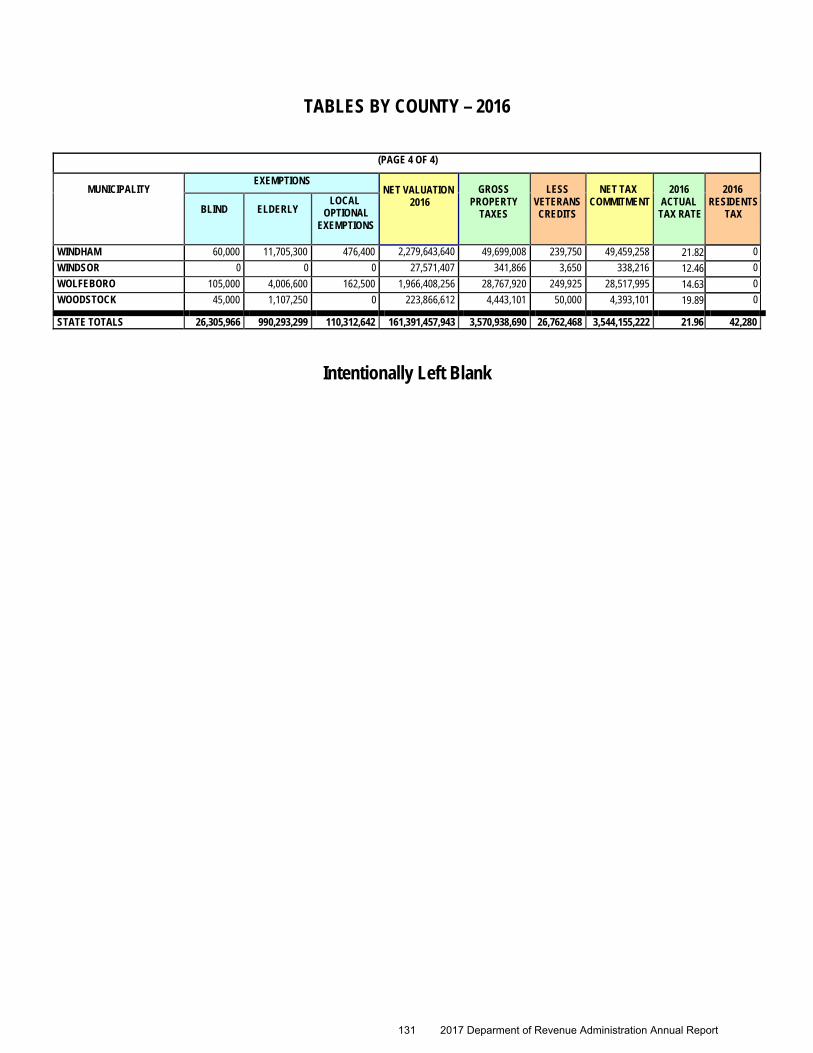
TABLES BY COUNTY – 2016
Intentionally Left Blank
(PAGE 4 OF 4)
MUNICIPALITY EXEMPTIONS
NET VALUATION 2016
GROSS
PROPERTY TAXES
LESS
VETERANS CREDITS
NET TAX
COMMITMENT
2016
ACTUAL TAX RATE
2016
RESIDENTS TAX
BLIND
ELDERLY
LOCAL OPTIONAL
EXEMPTIONS
WINDHAM 60,000 11,705,300 476,400 2,279,643,640 49,699,008 239,750 49,459,258 21.82 0 WINDSOR 0 0 0 27,571,407 341,866 3,650 338,216 12.46 0 WOLFEBORO 105,000 4,006,600 162,500 1,966,408,256 28,767,920 249,925 28,517,995 14.63 0 WOODSTOCK 45,000 1,107,250 0 223,866,612 4,443,101 50,000 4,393,101 19.89 0
STATE TOTALS 26,305,966 990,293,299 110,312,642 161,391,457,943 3,570,938,690 26,762,468 3,544,155,222 21.96 42,280
131 2017 Deparment of Revenue Administration Annual Report
State of New Hampshire
2016 Equalization Survey
of New Hampshire
Municipal & Property Division
132 2017 Deparment of Revenue Administration Annual Report
NEW HAMPSHIRE PROPERTY TAX SYSTEM SUMMARY
May 1, 2017
The following explanation summarizes the budget, assessment, equalization and assessment review processes to assist taxpayers in understanding New Hampshire’s property tax system. STEP I: THE BUDGET PROCESS Every property owner is responsible for paying a portion of the money necessary to operate their town or city, their school district, their village district (if any) and their county. Each town or city, school district, village district and county must establish a budget, hold public hearings on the budget and submit the budget to their legislative body for approval. Who are the legislative bodies that vote the appropriations necessary to fund the town or city, school and county budgets? For a town, the annual town meeting is the legislative body, which appropriates money to operate the town. The annual school district meeting does the same for the schools, and the annual village district meeting does the same for districts. Generally for a city, or a town with a town council form of government, the council or board of mayor and alderman vote the appropriations. The county delegation comprised of the State Representatives from the county, appropriate the money necessary to fund county government. This amount is apportioned to each town or city in that county based on its proportion of the total equalized property value in that county. It is these appropriations, voted by either your elected representatives at county delegation meetings and council meetings, or voted by you at your annual town and annual school district meetings, which establish the basis for property taxes in New Hampshire. STEP II: THE ASSESSMENT PROCESS Your property taxes are based upon the assessed value of your property as of April 1. This means that your tax bill, generally due in December, reflects the assessment of your property on the previous April 1. For example, if you built a garage on May 15 of this year, you would not be assessed taxes on that garage until next year, since the garage did not exist on April 1. It is the responsibility of the selectmen or the assessor to annually determine the local assessed value of the property within your municipality as of April 1 each year. This assessment is best determined by a complete revaluation or update of all property within your town or city. During a revaluation, property is physically reviewed and then valued based upon either the sale prices of other comparable properties or by other means. Theoretically, the intent of a revaluation is to assess property at its “full and true” value, often referred to as “market” value. But more importantly, the purpose of a revaluation is to insure that property within your municipality is assessed proportionally so that each property owner bears their share of the property tax burden based upon the “value” of their property. A complete annual revaluation can be costly and time consuming. Consequently, a complete revaluation is not conducted every year. A revaluation establishes base year property values. In the years following a revaluation, the assessors value the pick-ups: the new construction, the subdivisions, and other changes to the property. Depending on the amount of change reflected in current sales, assessors may also conduct
133 2017 Deparment of Revenue Administration Annual Report

partial revaluations or statistical updates. In any event assessors must maintain proportionality among all property values on an annual basis. Pick-ups (new construction and improvements) are assessed as of April l. Unless all properties are updated to current market value; pick-ups are valued not at current year values, but valued at the revaluation year values. That way, if a revaluation had been done in 2016, a 3-bedroom cape style home built in 2015 will be assessed comparably to a 3-bedroom cape style home built in 2015. This assumes all other factors affecting the value of the home are the same, such as the neighborhood, the amount of land, the quality of construction, the number of bathrooms, etc. STEP III: THE TAX RATE The appropriations voted by the town or city, the school district, village district (if any) and the county, less revenue from all other sources, equals the amount of money needed to be raised by taxes. The money needed to be raised by taxes is then divided by the local assessed property values to arrive at the property tax rates. For example, if an annual town meeting appropriated $1,000,000 to fund town appropriations and anticipates receiving $300,000 from motor vehicle registrations, other fees, gifts and grants to the town, then the balance of money needed to be raised by taxes would be $700,000. This amount divided by a local assessed property value of $25,000,000, for example, would equal a tax rate of $28.00. Property tax rates are normally expressed per $1,000 of valuation. The equation for determining the local property tax rate is as follows: VOTED APPROPRIATIONS minus ALL OTHER REVENUE x 1,000 = PROPERTY TAX RATE LOCAL ASSESSED PROPERTY VALUE By law, your property tax bill must show the assessed value of your property, along with the tax rate for each component of the tax: the town/city, village districts (if any), county, local education and state education tax rates. STEP IV: EXEMPTIONS AND TAX CREDITS An exemption is a reduction in the local assessed value of property, while a credit is a reduction of the amount of tax due. Every municipality offers some form of an exemption for elderly property owners meeting certain qualifications, and a tax credit for veterans. In addition, municipalities may adopt and grant the following exemptions: blind, disabled, deaf, wood-heating energy system, wind-powered energy system, and solar energy system exemptions. Property tax credits are available to qualifying veterans or their surviving spouses. Applications for an exemption or a tax credit must be made to the municipality by April 15th prior to that year’s tax bill. A tax deferral may be granted for elderly or disabled taxpayers meeting certain criteria on an application submitted to the municipality by March 1st prior to that year’s tax bill. Education property tax relief is available to low and moderate income homeowners who: . Own a homestead or an interest in a homestead subject to the education property tax; . Have resided in the homestead on April 1 of the year for which the claim is made; and . Had a total “household income” of
1. $20,000 or less if a single person; 2. $40,000 or less if married or head of a New Hampshire household.
134 2017 Deparment of Revenue Administration Annual Report
Forms for the low and moderate income homeowner’s property tax relief program are available by May 1st on the Department of Revenue Administration’s website at http://revenue.nh.gov/. The form [DP-8] is a fillable PDF form which can be opened, completed, and saved. Pursuant to RSA 198:57, VI, education property tax relief claims must be filed with the Department of Revenue Administration between May 1st and June 30th following the due date of the final tax bill as defined in RSA 76:1-a for state education property taxes. The Department of Revenue Administration rules for the low and moderate income homeowner’s property tax relief are located at Rev 1200. STEP V: THE EQUALIZATION PROCESS All towns and cities do not conduct revaluations in the same year. Some may be assessing property close to full value (because they just conducted a revaluation) while other towns and cities are assessing property at more or less than full value (because their revaluation is not current). This inconsistency makes it difficult to compare towns and cities to one another since the local assessed valuations are based upon different revaluation years. The annual equalization survey conducted by the Department of Revenue Administration addresses this inconsistency by adjusting each municipality’s total local assessed property value to full value. The sole purpose for equalizing local assessed property values is to ensure that public taxes and state revenues shared by towns and cities will be reasonably apportioned. This includes state education tax, county tax, some cooperative school district taxes and some village districts taxes. The equalization process involves a detailed study of property sales throughout the state and compares those sales with the local property assessments. A by-product of the equalization process is the determination of a ratio. Generally, the ratio shows the average level at which the town or city assessed property in the previous year in comparison to full value. Ratios for each municipality are issued by the department generally by April as a result of the Equalization Process. For more information, contact the Department at (603) 230-5950 or visit our web site at http://revenue.nh.gov/ For example, a ratio of 90% would indicate that the town generally assessed property at approximately 90% of full value. The ratio does not necessarily apply to any specific property assessment, but rather indicates the average level of assessment throughout the town or city. Over a period of several years, as the value of property increases or decreases due to market fluctuations, the ratio (the comparison of the local assessed value to full value) also fluctuates. A ratio of 100% indicates that, on the average, the municipality is assessing at full value. A ratio below 100% indicates average assessments are below full value, and a ratio above 100% indicates average assessments are above full value. Neither a high nor a low ratio, in itself, should be cause for alarm. Whether a town or city is assessing at 110% or 90% of full value is really not significant. What’s important is that the assessments are proportional, so that each property owner bears their share of the property tax burden based upon the value of their property. STEP VI: ASSESSMENT REVIEW As a result of the Supreme Court’s decision in Sirrell v. State of New Hampshire, RSA 75:8-a was adopted which requires all towns and cities in New Hampshire to reappraise all real estate within the municipality so that the assessments are at the full and true value at least as often as every fifth year. The Department of Revenue Administration is mandated by RSA 21:J:11-a & b to review and report the degree to which assessments of municipalities achieve compliance with applicable statutes and rules. The third five-year cycle
135 2017 Deparment of Revenue Administration Annual Report
began in 2013. Approximately one-fourth of the towns and cities will be scheduled for this Assessment Review in 2013, 2014, 2015, and 2016 respectively. The Assessing Standards Board (ASB) has adopted recommended standards to be met by towns and cities for their assessment review. The Department’s staff conducts field reviews of the records and assessing practices of all towns and cities in accordance with the ASB recommended standards and reports their findings to the municipalities and to the ASB. This report becomes a public document upon its issuance. STEP VII: PROPERTY ASSESSMENT APPEAL PROCESS There is a two-level appeal process available to any property owner who believes the assessment of their property is in error. The first level of appeal to request an abatement of property taxes must be made to the local assessing officials. The request for abatement must be made in writing by March 1st after the date the tax bills were mailed. If the local assessing officials neglect or refuse to satisfactorily abate the tax, the second level of appeal is either to the Board of Tax and Land Appeals or to the Superior Court in the county where the property is located. An opinion that property taxes are “too high” is not adequate grounds to justify an abatement. The “amount of tax” is usually not appealable since the amount of money needed to fund local government operations is determined by the local legislative bodies through the budget process. Generally, there must be an error in the assessment of your property in order to qualify for an abatement. CONCLUSION Property taxation in New Hampshire is a process involving all levels of government, from the voters at town and school district meeting, city councilors, and local assessing officials, to state legislators and court officials. It is a yearly process beginning with the preparation of the budget and voting of appropriations, continuing with the assessment of property and the setting of the tax rates, and concluding with the appeal process. Residents and non-residents, homeowners and landlords, commercial and industrial businesses, all bear the responsibility for paying their proportional share of property taxes.
136 2017 Deparment of Revenue Administration Annual Report

2016
EQUALIZATION SURVEY
“Including Utility & Railroad”
STATE OF NEW HAMPSHIRE
DEPARTMENT OF
REVENUE ADMINISTRATION
137 2017 Deparment of Revenue Administration Annual Report
2016 E Q U A L I Z A T I O N S U R V E Y
“INCLUDING UTILITIES AND RAILROADS”
May 1, 2017 This report presents the results of the 2016 Equalization Survey “including utilities and railroads”. It was conducted by the New Hampshire Department of Revenue Administration pursuant to RSA 21-J:3 XIII (Revised 4/1/99) which states:
"XIII. Equalize annually by May 1 the valuation of the property as assessed in the several towns, cities, and unincorporated places in the state including the value of property exempt pursuant to RSA 72:37, 72:37-b, 72:39-a, 72:62, 72:66 and 72:70 by adding to or deducting from the aggregate valuation of the property in towns, cities and unincorporated places such sums as will bring such valuations to the true and market value of the property, and by making such adjustments in the value of other property from which the towns, cities, and unincorporated places receive taxes or payments in lieu of taxes as may be equitable and just, so that any public taxes that may be apportioned among them shall be equal and just. In carrying out the duty to equalize the valuation of property, the commissioner shall follow the procedures set forth in RSA 21-J:9-a.”
To accomplish the foregoing, assessment ratio studies were conducted to determine how the average level of assessment for all cities and towns compares with the statutory 100% ratio so that taxes can be apportioned equitably. The Department of Revenue Administration has completed its process of calculating the total equalized valuation of all the municipalities and unincorporated places throughout the state. The ratios reported for each municipality in this survey were derived by comparing the sale prices of sales of land, land and buildings and manufactured housing, covering the period of October 1, 2015, to September 30, 2016, against the actual assessments levied by the municipalities. Sales information was verified by the grantee whenever possible by means of the Inventory of Property Transfer, Form PA-34. Our goal is to use only arm’s-length sales that transferred for market value in this analysis. Every effort has been made to exclude non-arm's length transactions including but not limited to: sales involving courts and government agencies, sales between relatives or corporate affiliates, sales settling an estate, forced sales, etc. Every municipality was notified of its 2016 sales assessment ratio. These ratios were used in conjunction with other Department of Revenue adjustments to determine each municipality’s total equalized value for purposes of RSA 21-J:3 XIII. The following is an explanation of the information contained in this report. MODIFIED ASSESSED VALUATION: The modified assessed valuation for each municipality as reported to the Department of Revenue Administration on the municipality’s 2016 Summary Inventory of Valuation (MS-1 Report).
138 2017 Deparment of Revenue Administration Annual Report

“GROSS LOCAL ASSESSED VALUATION” - Sum of all assessed values in the municipality - Certain Disabled Veteran’s: RSA 72:36-a - Improvements to Assist Persons who are Deaf: RSA 72:38-b V - Improvements to Assist Persons with Disabilities Exemption: RSA 72:37-a - School Dining/Dormitory/Kitchen Exemption: RSA 72:23 IV ($150,000 max per exemption) - Water & Air Pollution Control Exemption: RSA 72:12-a = “MODIFIED ASSESSED VALUATION”
- Blind Exemption: RSA 72:37 - Elderly Exemption: RSA 72:39-a & b - Deaf Exemption: RSA 72:38-b - Disabled Exemption: RSA 72:37-b - Wood-Heating Energy System Exemption: RSA 72:70 - Solar Energy System Exemption: RSA 72:62 - Wind Powered Energy System Exemption: RSA 72:66 - Additional School Dining/Dormitory/Kitchen Exemption: RSA 72:23 IV (Exemption amount > $150,000)
= “NET LOCAL ASSESSED VALUATION” The municipal, county and local school tax rates are computed using the net local assessed valuation.
TAX INCREMENT FINANCE DISTRICTS (TIFS): RSA 162-K:10 III - The retained captured assessed value is added to the modified assessed value and will be equalized for all TIF districts created after 4/29/99. The original assessed value plus any unretained value is used to set a municipality’s tax rates.
DRA INVENTORY ADJUSTMENT: The sum of the adjustments of the modified local assessed valuation is divided into three categories.
Category 1: The total modified local assessed value of land (excluding land in current use, conservation restriction assessment, discretionary easements and utilities) buildings and manufactured housing is equalized by the 2016 equalization ratio. This category includes discretionary preservation easements, taxation of farm structures, land under farm structures. The difference between the modified local assessed valuation of land, buildings and manufactured housing and the equalized value equals the DRA adjustment for land, buildings, and manufactured housing.
Category 2: An adjustment for land assessed at current use, conservation restriction
assessment, and discretionary easement values are made. This adjustment is calculated by dividing the total net local assessed valuation for land in these two categories by the 2015 equalization ratio to obtain the equalized value of current use, conservation restriction assessments, and discretionary easements. If a municipality has had a full revaluation or cyclical revaluation as defined by Rev 601.11 and 601.08, a ratio of 100.0 is used.
The difference between the local assessed value of the land and the equalized
value equals the DRA adjustment for current use, conservation restriction
139 2017 Deparment of Revenue Administration Annual Report

assessments, and discretionary easements. Category 3: A DRA adjustment for public utilities, as defined by RSA 83-F, is made by
comparing the market value of the utility as determined by the DRA to the net local assessed value of the utility. The difference between the assessed value and the market value equals the adjustment. The value of public utilities is not added into the “Total Equalized Value Not Including Utility Value or Equalized Railroad Taxes.”
EQUALIZED ASSESSED VALUATION: The sum of the “modified local assessed valuation” plus the DRA inventory adjustment. The equalized assessed valuation represents the equalized value of all “taxable” properties in a municipality. PAYMENT IN LIEU OF TAXES: The equalized value for payments received in lieu of taxes includes State & Federal Forest Land Reimbursements, Recreation Land Reimbursements, Flood Land Reimbursements, renewable energy facilities (if applicable) and others. RAILROAD TAX: The equalized value for monies received from the railroad tax. This figure is not included in the “Total Equalized Valuation Not Including Utility Values and Equalized Railroad Taxes.” TOTAL EQUALIZED VALUATIONS INCLUDING UTILITY VALUE AND EQUALIZED RAILROAD TAXES: The sum of the equalized assessed valuation, the equalized value of payments in lieu of taxes and the equalized value of the railroad tax monies. The Total Equalized Valuation including the value of utilities and equalized value of railroad monies reimbursed to municipalities represents the equalized value of all property in a municipality including utilities and will be used to:
• Apportion county taxes for the 2017 tax year; • Calculate state reimbursements, and; • Apportion cooperative school taxes for the 2018 tax year.
LOCAL TAX RATE: The actual tax rate as calculated by the Department of Revenue Administration, Municipal Services Division. The tax rate includes the municipal, county, local school and state education property tax rates. EQUALIZATION RATIO: The 2016 equalization ratio as determined by a ratio study conducted by the Department of Revenue Administration’s equalization staff. FULL VALUE TAX RATE: The 2016 gross local property taxes to be raised as reported by the Department of Revenue Administration, Municipal & Property Division, divided by the total equalized valuation including utility values and equalized railroad taxes. This figure represents the estimated tax rate for a municipality if all the taxable property was assessed at 100% and includes the equalized value of properties for which a payment in lieu of property taxes is made. % PROPORTION TO COUNTY TAX: The percentage of proportion to $1,000 of tax that is to be allocated to each town within the county comparing each municipality’s total equalized value to the total equalized value of the county. % PROPORTION TO STATE TAX: The percentage of proportion to $1,000 of tax that is to be allocated to each town within the state by comparing the town’s total equalized value to the total equalized value of the state.
140 2017 Deparment of Revenue Administration Annual Report
COUNTY & STATE TAX RATE: The sum of the 2016 gross property taxes to be raised by each municipality in each county and the state divided by the total net local assessed value for each municipality in each county and the state. STATE & COUNTY RATIOS: The state and county gross assessed values divided by the total equalized valuation. The state and county ratios are calculated for statistical purposes only. They are not applied to any figure as part of the equalization process.
APPEAL OF TOTAL EQUALIZED VALUATION
Municipalities were sent their 2016 Notification of Total Equalized Valuations on April 26, 2017.
Per RSA 71-B:5, II, any municipality aggrieved by the total equalized valuation as determined by the DRA must appeal to the Board of Tax and Land Appeals in writing within 30 days of the town’s notification of the municipality’s total equalized valuation.
The appeal period is not extended due to any communication, either verbal or written, between the DRA and a municipality regarding the total equalized valuation.
141 2017 Deparment of Revenue Administration Annual Report
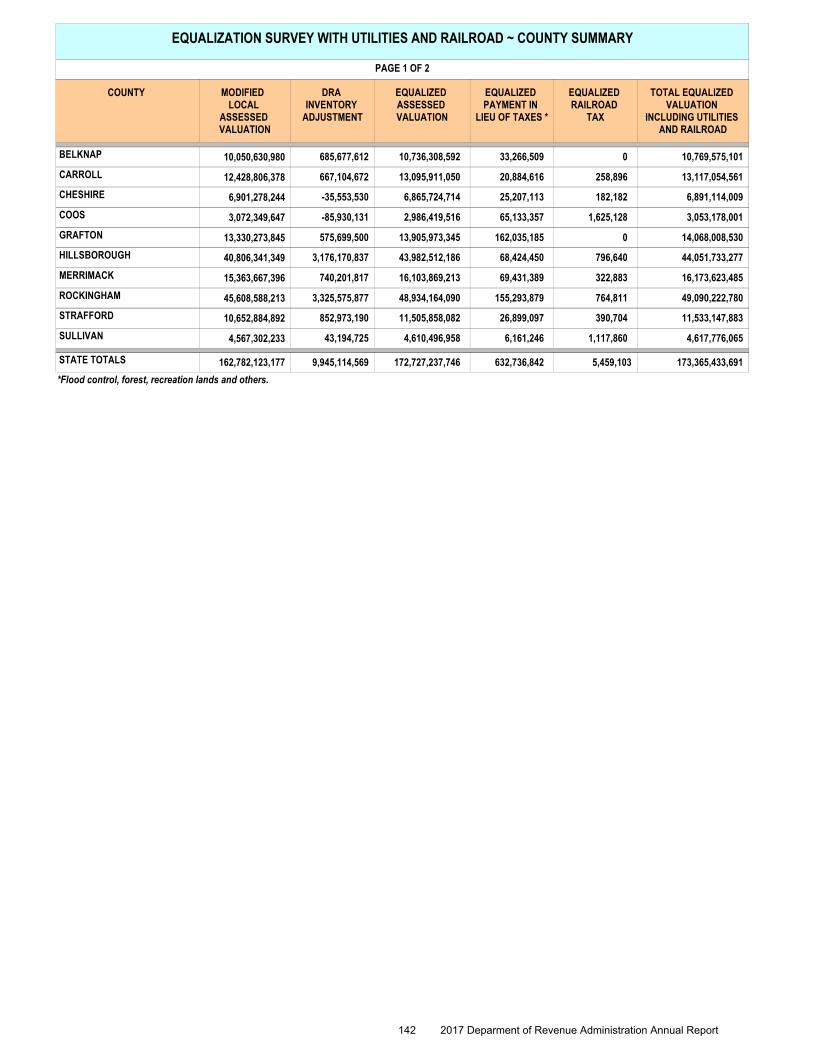
EQUALIZATION SURVEY WITH UTILITIES AND RAILROAD ~ COUNTY SUMMARY
PAGE 1 OF 2
COUNTY MODIFIED LOCAL
ASSESSED VALUATION
DRA INVENTORY
ADJUSTMENT
EQUALIZED ASSESSED VALUATION
EQUALIZED PAYMENT IN
LIEU OF TAXES *
EQUALIZED RAILROAD
TAX
TOTAL EQUALIZED VALUATION
INCLUDING UTILITIES AND RAILROAD
10,050,630,980 685,677,612 10,736,308,592 33,266,509 10,769,575,1010BELKNAP
12,428,806,378 667,104,672 13,095,911,050 20,884,616 13,117,054,561258,896CARROLL
6,901,278,244 -35,553,530 6,865,724,714 25,207,113 6,891,114,009182,182CHESHIRE
3,072,349,647 -85,930,131 2,986,419,516 65,133,357 3,053,178,0011,625,128COOS
13,330,273,845 575,699,500 13,905,973,345 162,035,185 14,068,008,5300GRAFTON
40,806,341,349 3,176,170,837 43,982,512,186 68,424,450 44,051,733,277796,640HILLSBOROUGH
15,363,667,396 740,201,817 16,103,869,213 69,431,389 16,173,623,485322,883MERRIMACK
45,608,588,213 3,325,575,877 48,934,164,090 155,293,879 49,090,222,780764,811ROCKINGHAM
10,652,884,892 852,973,190 11,505,858,082 26,899,097 11,533,147,883390,704STRAFFORD
4,567,302,233 43,194,725 4,610,496,958 6,161,246 4,617,776,0651,117,860SULLIVAN
STATE TOTALS 162,782,123,177 9,945,114,569 172,727,237,746 632,736,842 173,365,433,6915,459,103
*Flood control, forest, recreation lands and others.
142 2017 Deparment of Revenue Administration Annual Report
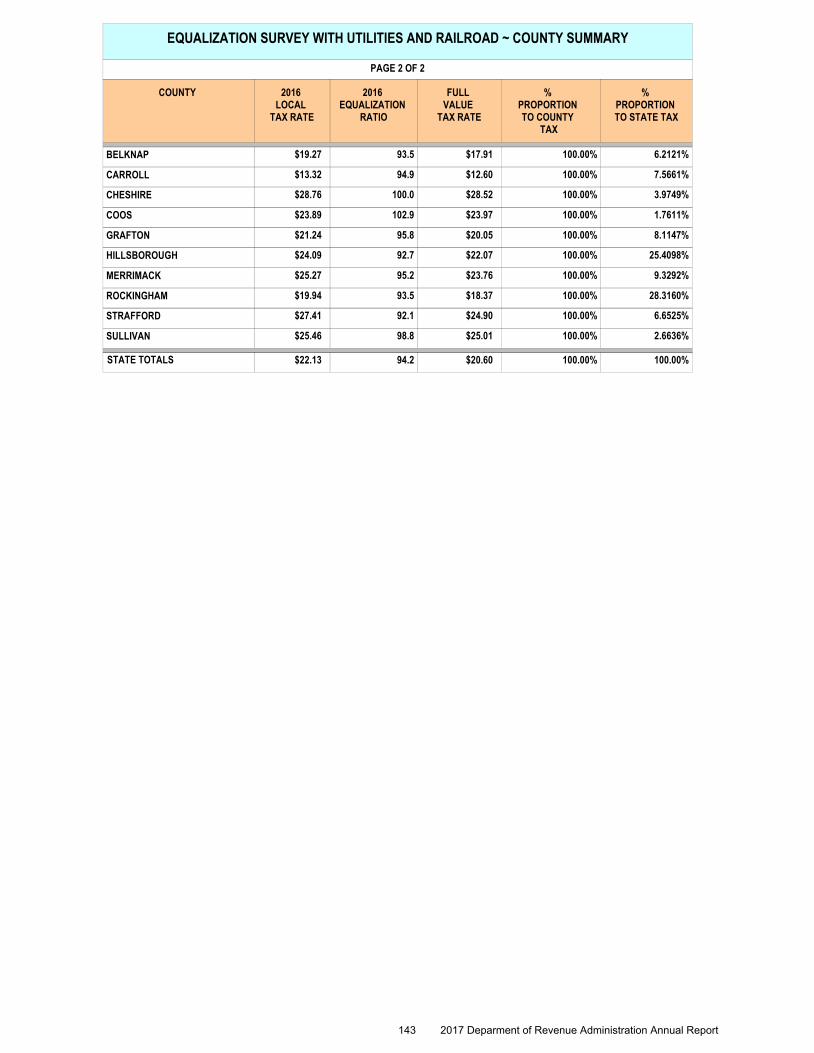
EQUALIZATION SURVEY WITH UTILITIES AND RAILROAD ~ COUNTY SUMMARY
PAGE 2 OF 2
COUNTY 2016 LOCAL
TAX RATE
2016 EQUALIZATION
RATIO
FULL VALUE
TAX RATE
% PROPORTION TO COUNTY
TAX
% PROPORTION TO STATE TAX
93.5$19.27 $17.91 100.00% 6.2121%BELKNAP
94.9$13.32 $12.60 100.00% 7.5661%CARROLL
100.0$28.76 $28.52 100.00% 3.9749%CHESHIRE
102.9$23.89 $23.97 100.00% 1.7611%COOS
95.8$21.24 $20.05 100.00% 8.1147%GRAFTON
92.7$24.09 $22.07 100.00% 25.4098%HILLSBOROUGH
95.2$25.27 $23.76 100.00% 9.3292%MERRIMACK
93.5$19.94 $18.37 100.00% 28.3160%ROCKINGHAM
92.1$27.41 $24.90 100.00% 6.6525%STRAFFORD
98.8$25.46 $25.01 100.00% 2.6636%SULLIVAN
$22.13 94.2 $20.60STATE TOTALS 100.00%100.00%
143 2017 Deparment of Revenue Administration Annual Report

EQUALIZATION SURVEY WITH UTILITIES AND RAILROAD SUMMARY
PAGE 1 OF 2
MODIFIED LOCAL
ASSESSED VALUATION
DRA INVENTORY
ADJUSTMENT
EQUALIZED ASSESSED VALUATION
EQUALIZED PAYMENT IN
LIEU OF TAXES *
EQUALIZED RAILROAD
TAX
TOTAL EQUALIZED VALUATION
INCLUDING UTILITIES AND RAILROAD
MUNICIPALITY
97,461,518 6,316,454 103,777,972 5,376 103,783,3480ACWORTH
111,782,153 437,527 112,219,680 1,152,630 113,372,3110ALBANY
200,583,640 -6,883,460 193,700,180 177,643 193,877,8230ALEXANDRIA
251,423,283 27,087,681 278,510,964 348,975 278,859,9390ALLENSTOWN
161,870,233 2,152,174 164,022,407 60 164,022,4670ALSTEAD
1,577,858,917 79,291,441 1,657,150,358 360,574 1,657,510,9320ALTON
1,703,627,205 52,993,570 1,756,620,775 1,343,578 1,757,997,93033,577AMHERST
253,673,666 -14,764,239 238,909,427 7,107 238,916,5350ANDOVER
227,463,075 960,123 228,423,198 165,012 228,588,2100ANTRIM
237,394,875 7,374,584 244,769,459 2,528,226 247,297,6850ASHLAND
947,632,914 36,252,264 983,885,178 0 983,888,1212,943ATKINSON
695,404 111,508 806,912 0 806,9120ATKINSON & GILMANTON
659,600,259 63,859,941 723,460,200 21,754,500 745,214,7010AUBURN
442,932,468 36,947,816 479,880,284 0 479,880,2840BARNSTEAD
923,669,758 43,857,542 967,527,300 850,484 968,377,7830BARRINGTON
935,932,584 94,825,241 1,030,757,825 815,393 1,031,573,2180BARTLETT
121,057,765 -11,436,650 109,621,115 4,955,140 114,576,2550BATH
509 57 566 0 5660BEAN'S GRANT
0 0 0 0 00BEAN'S PURCHASE
3,294,309,561 593,256,329 3,887,565,890 3,218 3,887,593,20624,098BEDFORD
601,249,886 47,117,519 648,367,405 898,156 649,265,5600BELMONT
104,046,397 9,348,722 113,395,119 17,501 113,412,6190BENNINGTON
25,080,079 3,181,285 28,261,364 699,043 28,960,4070BENTON
397,452,679 -114,402,996 283,049,683 31,914,981 315,048,26283,598BERLIN
230,545,605 29,270,927 259,816,532 1,371,955 261,188,4860BETHLEHEM
236,407,763 17,560,911 253,968,674 2,255,745 256,230,1575,738BOSCAWEN
1,173,341,506 52,149,732 1,225,491,238 2,962 1,225,599,333105,133BOW
197,953,935 10,295,687 208,249,622 25,947 208,275,5700BRADFORD
565,425,663 12,445,461 577,871,124 0 577,871,1240BRENTWOOD
344,129,700 10,244,164 354,373,864 0 354,373,8640BRIDGEWATER
469,206,603 1,776,828 470,983,431 1,281,319 472,264,7510BRISTOL
95,012,335 2,707,445 97,719,780 0 97,719,7800BROOKFIELD
517,780,849 71,869,226 589,650,075 0 589,650,0750BROOKLINE
8,721,492 1,546,024 10,267,516 0 10,267,5160CAMBRIDGE
381,468,513 21,546,090 403,014,603 513,738 403,528,3410CAMPTON
341,996,171 4,773,345 346,769,516 73,200 346,842,7170CANAAN
394,646,286 79,325,575 473,971,861 8,312 473,980,1720CANDIA
260,193,775 -520,537 259,673,238 366,706 260,039,9440CANTERBURY
322,834,920 31,608,321 354,443,241 1,759,776 356,203,0170CARROLL
386,746,034 35,533,831 422,279,865 114,123 422,393,9880CENTER HARBOR
40,376 7,258 47,634 0 47,6340CHANDLER'S PURCHASE
281,348,984 -1,718,120 279,630,864 337,346 280,863,762895,552CHARLESTOWN
48,265,140 3,088,687 51,353,827 761,182 52,115,0090CHATHAM
553,595,100 17,189,448 570,784,548 0 570,784,5480CHESTER
*Flood control, forest, recreation lands and others.
144 2017 Deparment of Revenue Administration Annual Report
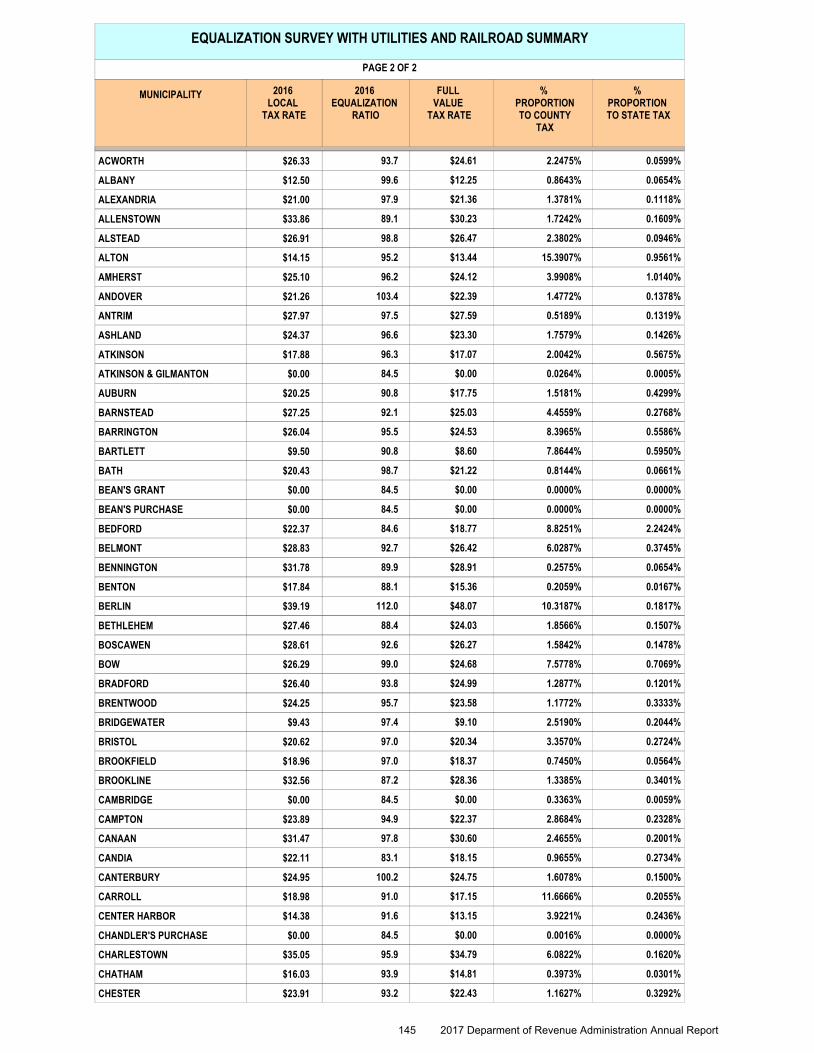
EQUALIZATION SURVEY WITH UTILITIES AND RAILROAD SUMMARY
PAGE 2 OF 2
2016 LOCAL
TAX RATE
2016 EQUALIZATION
RATIO
FULL VALUE
TAX RATE
% PROPORTION TO COUNTY
TAX
% PROPORTION TO STATE TAX
MUNICIPALITY
93.7 $24.61 2.2475% 0.0599%ACWORTH $26.33
99.6 $12.25 0.8643% 0.0654%ALBANY $12.50
97.9 $21.36 1.3781% 0.1118%ALEXANDRIA $21.00
89.1 $30.23 1.7242% 0.1609%ALLENSTOWN $33.86
98.8 $26.47 2.3802% 0.0946%ALSTEAD $26.91
95.2 $13.44 15.3907% 0.9561%ALTON $14.15
96.2 $24.12 3.9908% 1.0140%AMHERST $25.10
103.4 $22.39 1.4772% 0.1378%ANDOVER $21.26
97.5 $27.59 0.5189% 0.1319%ANTRIM $27.97
96.6 $23.30 1.7579% 0.1426%ASHLAND $24.37
96.3 $17.07 2.0042% 0.5675%ATKINSON $17.88
84.5 $0.00 0.0264% 0.0005%ATKINSON & GILMANTON $0.00
90.8 $17.75 1.5181% 0.4299%AUBURN $20.25
92.1 $25.03 4.4559% 0.2768%BARNSTEAD $27.25
95.5 $24.53 8.3965% 0.5586%BARRINGTON $26.04
90.8 $8.60 7.8644% 0.5950%BARTLETT $9.50
98.7 $21.22 0.8144% 0.0661%BATH $20.43
84.5 $0.00 0.0000% 0.0000%BEAN'S GRANT $0.00
84.5 $0.00 0.0000% 0.0000%BEAN'S PURCHASE $0.00
84.6 $18.77 8.8251% 2.2424%BEDFORD $22.37
92.7 $26.42 6.0287% 0.3745%BELMONT $28.83
89.9 $28.91 0.2575% 0.0654%BENNINGTON $31.78
88.1 $15.36 0.2059% 0.0167%BENTON $17.84
112.0 $48.07 10.3187% 0.1817%BERLIN $39.19
88.4 $24.03 1.8566% 0.1507%BETHLEHEM $27.46
92.6 $26.27 1.5842% 0.1478%BOSCAWEN $28.61
99.0 $24.68 7.5778% 0.7069%BOW $26.29
93.8 $24.99 1.2877% 0.1201%BRADFORD $26.40
95.7 $23.58 1.1772% 0.3333%BRENTWOOD $24.25
97.4 $9.10 2.5190% 0.2044%BRIDGEWATER $9.43
97.0 $20.34 3.3570% 0.2724%BRISTOL $20.62
97.0 $18.37 0.7450% 0.0564%BROOKFIELD $18.96
87.2 $28.36 1.3385% 0.3401%BROOKLINE $32.56
84.5 $0.00 0.3363% 0.0059%CAMBRIDGE $0.00
94.9 $22.37 2.8684% 0.2328%CAMPTON $23.89
97.8 $30.60 2.4655% 0.2001%CANAAN $31.47
83.1 $18.15 0.9655% 0.2734%CANDIA $22.11
100.2 $24.75 1.6078% 0.1500%CANTERBURY $24.95
91.0 $17.15 11.6666% 0.2055%CARROLL $18.98
91.6 $13.15 3.9221% 0.2436%CENTER HARBOR $14.38
84.5 $0.00 0.0016% 0.0000%CHANDLER'S PURCHASE $0.00
95.9 $34.79 6.0822% 0.1620%CHARLESTOWN $35.05
93.9 $14.81 0.3973% 0.0301%CHATHAM $16.03
93.2 $22.43 1.1627% 0.3292%CHESTER $23.91
145 2017 Deparment of Revenue Administration Annual Report
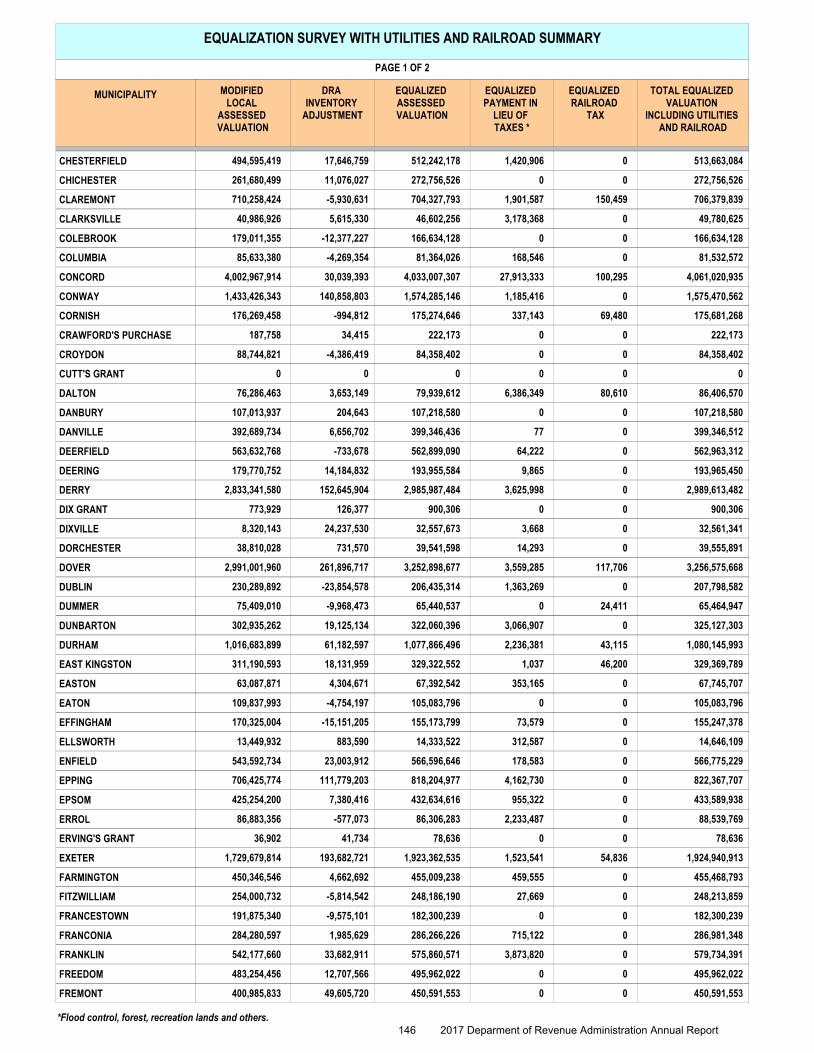
EQUALIZATION SURVEY WITH UTILITIES AND RAILROAD SUMMARY
PAGE 1 OF 2
MODIFIED LOCAL
ASSESSED VALUATION
DRA INVENTORY
ADJUSTMENT
EQUALIZED ASSESSED VALUATION
EQUALIZED PAYMENT IN
LIEU OF TAXES *
EQUALIZED RAILROAD
TAX
TOTAL EQUALIZED VALUATION
INCLUDING UTILITIES AND RAILROAD
MUNICIPALITY
494,595,419 17,646,759 512,242,178 1,420,906 513,663,0840CHESTERFIELD
261,680,499 11,076,027 272,756,526 0 272,756,5260CHICHESTER
710,258,424 -5,930,631 704,327,793 1,901,587 706,379,839150,459CLAREMONT
40,986,926 5,615,330 46,602,256 3,178,368 49,780,6250CLARKSVILLE
179,011,355 -12,377,227 166,634,128 0 166,634,1280COLEBROOK
85,633,380 -4,269,354 81,364,026 168,546 81,532,5720COLUMBIA
4,002,967,914 30,039,393 4,033,007,307 27,913,333 4,061,020,935100,295CONCORD
1,433,426,343 140,858,803 1,574,285,146 1,185,416 1,575,470,5620CONWAY
176,269,458 -994,812 175,274,646 337,143 175,681,26869,480CORNISH
187,758 34,415 222,173 0 222,1730CRAWFORD'S PURCHASE
88,744,821 -4,386,419 84,358,402 0 84,358,4020CROYDON
0 0 0 0 00CUTT'S GRANT
76,286,463 3,653,149 79,939,612 6,386,349 86,406,57080,610DALTON
107,013,937 204,643 107,218,580 0 107,218,5800DANBURY
392,689,734 6,656,702 399,346,436 77 399,346,5120DANVILLE
563,632,768 -733,678 562,899,090 64,222 562,963,3120DEERFIELD
179,770,752 14,184,832 193,955,584 9,865 193,965,4500DEERING
2,833,341,580 152,645,904 2,985,987,484 3,625,998 2,989,613,4820DERRY
773,929 126,377 900,306 0 900,3060DIX GRANT
8,320,143 24,237,530 32,557,673 3,668 32,561,3410DIXVILLE
38,810,028 731,570 39,541,598 14,293 39,555,8910DORCHESTER
2,991,001,960 261,896,717 3,252,898,677 3,559,285 3,256,575,668117,706DOVER
230,289,892 -23,854,578 206,435,314 1,363,269 207,798,5820DUBLIN
75,409,010 -9,968,473 65,440,537 0 65,464,94724,411DUMMER
302,935,262 19,125,134 322,060,396 3,066,907 325,127,3030DUNBARTON
1,016,683,899 61,182,597 1,077,866,496 2,236,381 1,080,145,99343,115DURHAM
311,190,593 18,131,959 329,322,552 1,037 329,369,78946,200EAST KINGSTON
63,087,871 4,304,671 67,392,542 353,165 67,745,7070EASTON
109,837,993 -4,754,197 105,083,796 0 105,083,7960EATON
170,325,004 -15,151,205 155,173,799 73,579 155,247,3780EFFINGHAM
13,449,932 883,590 14,333,522 312,587 14,646,1090ELLSWORTH
543,592,734 23,003,912 566,596,646 178,583 566,775,2290ENFIELD
706,425,774 111,779,203 818,204,977 4,162,730 822,367,7070EPPING
425,254,200 7,380,416 432,634,616 955,322 433,589,9380EPSOM
86,883,356 -577,073 86,306,283 2,233,487 88,539,7690ERROL
36,902 41,734 78,636 0 78,6360ERVING'S GRANT
1,729,679,814 193,682,721 1,923,362,535 1,523,541 1,924,940,91354,836EXETER
450,346,546 4,662,692 455,009,238 459,555 455,468,7930FARMINGTON
254,000,732 -5,814,542 248,186,190 27,669 248,213,8590FITZWILLIAM
191,875,340 -9,575,101 182,300,239 0 182,300,2390FRANCESTOWN
284,280,597 1,985,629 286,266,226 715,122 286,981,3480FRANCONIA
542,177,660 33,682,911 575,860,571 3,873,820 579,734,3910FRANKLIN
483,254,456 12,707,566 495,962,022 0 495,962,0220FREEDOM
400,985,833 49,605,720 450,591,553 0 450,591,5530FREMONT
*Flood control, forest, recreation lands and others.
146 2017 Deparment of Revenue Administration Annual Report
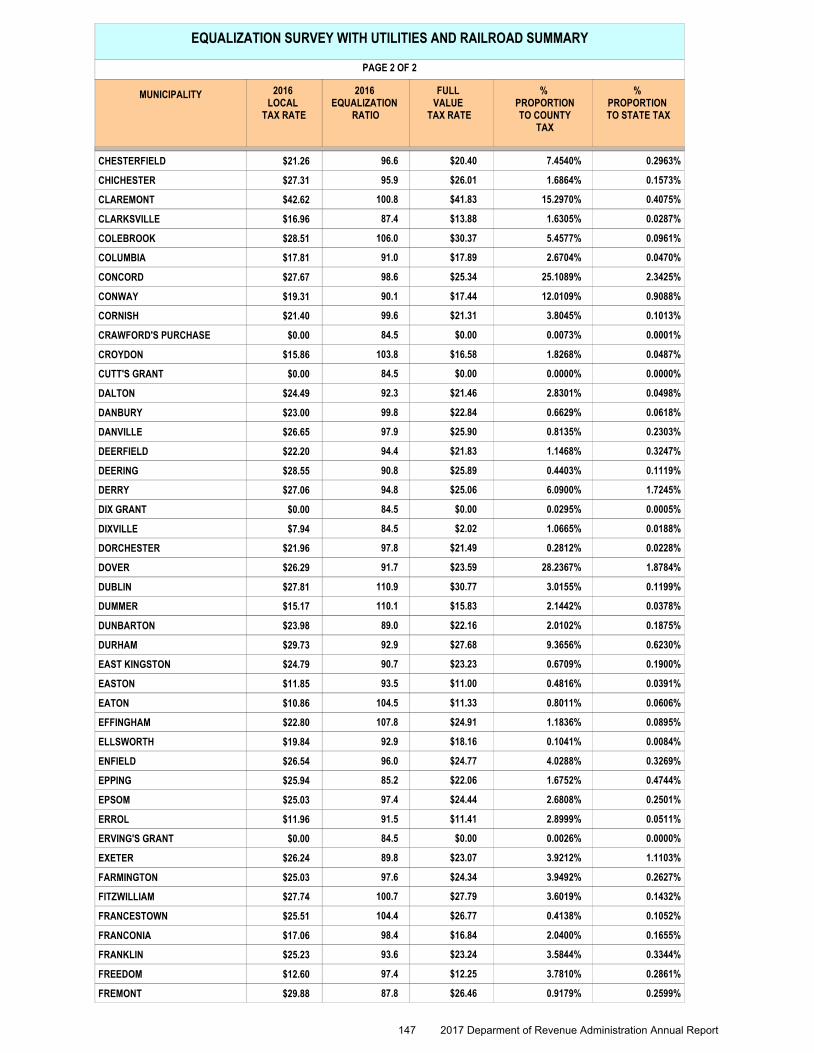
EQUALIZATION SURVEY WITH UTILITIES AND RAILROAD SUMMARY
PAGE 2 OF 2
2016 LOCAL
TAX RATE
2016 EQUALIZATION
RATIO
FULL VALUE
TAX RATE
% PROPORTION TO COUNTY
TAX
% PROPORTION TO STATE TAX
MUNICIPALITY
96.6 $20.40 7.4540% 0.2963%CHESTERFIELD $21.26
95.9 $26.01 1.6864% 0.1573%CHICHESTER $27.31
100.8 $41.83 15.2970% 0.4075%CLAREMONT $42.62
87.4 $13.88 1.6305% 0.0287%CLARKSVILLE $16.96
106.0 $30.37 5.4577% 0.0961%COLEBROOK $28.51
91.0 $17.89 2.6704% 0.0470%COLUMBIA $17.81
98.6 $25.34 25.1089% 2.3425%CONCORD $27.67
90.1 $17.44 12.0109% 0.9088%CONWAY $19.31
99.6 $21.31 3.8045% 0.1013%CORNISH $21.40
84.5 $0.00 0.0073% 0.0001%CRAWFORD'S PURCHASE $0.00
103.8 $16.58 1.8268% 0.0487%CROYDON $15.86
84.5 $0.00 0.0000% 0.0000%CUTT'S GRANT $0.00
92.3 $21.46 2.8301% 0.0498%DALTON $24.49
99.8 $22.84 0.6629% 0.0618%DANBURY $23.00
97.9 $25.90 0.8135% 0.2303%DANVILLE $26.65
94.4 $21.83 1.1468% 0.3247%DEERFIELD $22.20
90.8 $25.89 0.4403% 0.1119%DEERING $28.55
94.8 $25.06 6.0900% 1.7245%DERRY $27.06
84.5 $0.00 0.0295% 0.0005%DIX GRANT $0.00
84.5 $2.02 1.0665% 0.0188%DIXVILLE $7.94
97.8 $21.49 0.2812% 0.0228%DORCHESTER $21.96
91.7 $23.59 28.2367% 1.8784%DOVER $26.29
110.9 $30.77 3.0155% 0.1199%DUBLIN $27.81
110.1 $15.83 2.1442% 0.0378%DUMMER $15.17
89.0 $22.16 2.0102% 0.1875%DUNBARTON $23.98
92.9 $27.68 9.3656% 0.6230%DURHAM $29.73
90.7 $23.23 0.6709% 0.1900%EAST KINGSTON $24.79
93.5 $11.00 0.4816% 0.0391%EASTON $11.85
104.5 $11.33 0.8011% 0.0606%EATON $10.86
107.8 $24.91 1.1836% 0.0895%EFFINGHAM $22.80
92.9 $18.16 0.1041% 0.0084%ELLSWORTH $19.84
96.0 $24.77 4.0288% 0.3269%ENFIELD $26.54
85.2 $22.06 1.6752% 0.4744%EPPING $25.94
97.4 $24.44 2.6808% 0.2501%EPSOM $25.03
91.5 $11.41 2.8999% 0.0511%ERROL $11.96
84.5 $0.00 0.0026% 0.0000%ERVING'S GRANT $0.00
89.8 $23.07 3.9212% 1.1103%EXETER $26.24
97.6 $24.34 3.9492% 0.2627%FARMINGTON $25.03
100.7 $27.79 3.6019% 0.1432%FITZWILLIAM $27.74
104.4 $26.77 0.4138% 0.1052%FRANCESTOWN $25.51
98.4 $16.84 2.0400% 0.1655%FRANCONIA $17.06
93.6 $23.24 3.5844% 0.3344%FRANKLIN $25.23
97.4 $12.25 3.7810% 0.2861%FREEDOM $12.60
87.8 $26.46 0.9179% 0.2599%FREMONT $29.88
147 2017 Deparment of Revenue Administration Annual Report

EQUALIZATION SURVEY WITH UTILITIES AND RAILROAD SUMMARY
PAGE 1 OF 2
MODIFIED LOCAL
ASSESSED VALUATION
DRA INVENTORY
ADJUSTMENT
EQUALIZED ASSESSED VALUATION
EQUALIZED PAYMENT IN
LIEU OF TAXES *
EQUALIZED RAILROAD
TAX
TOTAL EQUALIZED VALUATION
INCLUDING UTILITIES AND RAILROAD
MUNICIPALITY
1,662,334,122 109,988,450 1,772,322,572 1,954,238 1,774,276,8100GILFORD
453,782,020 2,874,976 456,656,996 91,273 456,748,2680GILMANTON
61,027,121 359,248 61,386,369 0 61,386,3690GILSUM
1,459,249,100 75,815,361 1,535,064,461 0 1,535,064,4610GOFFSTOWN
273,762,000 -33,226,133 240,535,867 436,606 241,079,177106,704GORHAM
72,028,938 1,770,467 73,799,405 15,803 73,815,2080GOSHEN
115,897,035 3,224,037 119,121,072 0 119,121,0720GRAFTON
466,452,232 18,388,780 484,841,012 0 484,841,0120GRANTHAM
138,393,706 8,903,070 147,296,776 9,203,478 156,545,56245,308GREENFIELD
705,105,116 87,566,042 792,671,158 0 792,696,94925,791GREENLAND
3,129,477 569,154 3,698,631 58,400 3,757,0300GREEN'S GRANT
97,595,138 3,872,131 101,467,269 1,395,357 102,862,6260GREENVILLE
79,159,602 -7,650,728 71,508,874 68,770,208 140,279,0810GROTON
0 0 0 0 00HADLEY'S PURCHASE
74,454,500 -202,722 74,251,778 32,407 74,284,1850HALE'S LOCATION
1,031,576,646 115,959,430 1,147,536,076 1,968,832 1,149,504,9080HAMPSTEAD
3,335,308,100 21,745,804 3,357,053,904 17,527,435 3,374,610,10328,764HAMPTON
420,011,775 42,665,087 462,676,862 869,051 463,545,9130HAMPTON FALLS
247,659,753 -9,848,464 237,811,289 1,581,207 239,392,4960HANCOCK
2,004,552,200 467,148,846 2,471,701,046 3,393,747 2,475,094,7930HANOVER
189,658,379 2,472,964 192,131,343 187,031 192,318,3740HARRISVILLE
16,133,579 25 16,133,604 264,025 16,397,6290HART'S LOCATION
345,742,793 -11,321,177 334,421,616 500,150 334,921,7660HAVERHILL
258,297,700 -283,422 258,014,278 6,149,637 264,163,9150HEBRON
399,199,052 21,402,349 420,601,401 2,896,415 423,497,8160HENNIKER
89,851,251 -7,606,834 82,244,417 1,450,399 83,694,8160HILL
513,568,408 -19,232,601 494,335,807 108,905 494,444,7120HILLSBOROUGH
355,317,063 -21,387,458 333,929,605 36,877 333,966,4810HINSDALE
688,311,271 60,761,701 749,072,972 116,175 749,189,1470HOLDERNESS
1,212,504,780 108,549,702 1,321,054,482 897 1,321,056,5681,188HOLLIS
1,621,272,530 330,320,514 1,951,593,044 26,538 1,951,731,299111,717HOOKSETT
620,426,021 31,412,928 651,838,949 10,378,749 662,217,6980HOPKINTON
2,676,063,055 296,437,993 2,972,501,048 633,896 2,973,134,9440HUDSON
396,251,282 22,484,457 418,735,739 826,868 419,562,6070JACKSON
407,483,245 28,979,487 436,462,732 4,603 436,467,3350JAFFREY
122,796,008 -4,212,917 118,583,091 642,300 119,225,3910JEFFERSON
1,825,508,640 -33,212,037 1,792,296,603 11,890,716 1,804,187,3190KEENE
306,265,316 38,214,515 344,479,831 0 344,479,8310KENSINGTON
747 84 831 0 8310KILKENNY
662,284,825 95,830,483 758,115,308 1,339 758,151,34634,700KINGSTON
1,932,198,550 136,159,825 2,068,358,375 17,959,522 2,086,317,8970LACONIA
270,675,289 -18,486,482 252,188,807 3,135,008 255,323,8150LANCASTER
50,784,824 -1,187,463 49,597,361 110,835 49,708,1960LANDAFF
56,932,381 754,574 57,686,955 11,733 57,698,6880LANGDON
*Flood control, forest, recreation lands and others.
148 2017 Deparment of Revenue Administration Annual Report
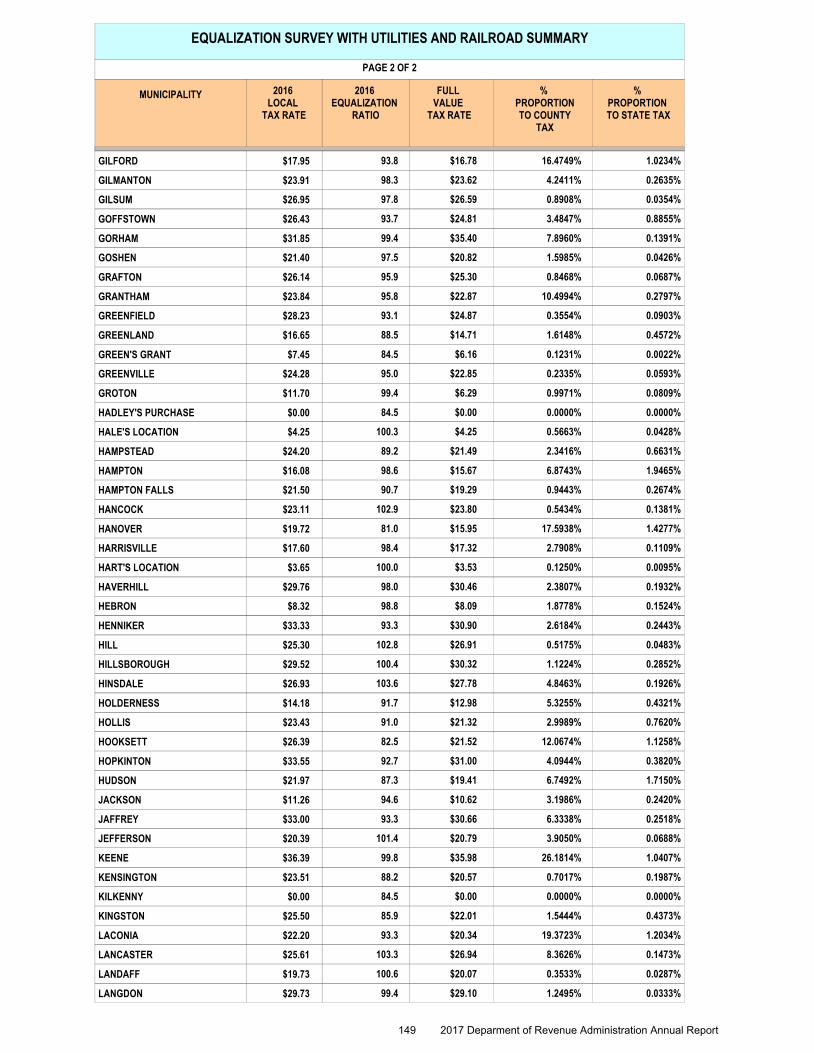
EQUALIZATION SURVEY WITH UTILITIES AND RAILROAD SUMMARY
PAGE 2 OF 2
2016 LOCAL
TAX RATE
2016 EQUALIZATION
RATIO
FULL VALUE
TAX RATE
% PROPORTION TO COUNTY
TAX
% PROPORTION TO STATE TAX
MUNICIPALITY
93.8 $16.78 16.4749% 1.0234%GILFORD $17.95
98.3 $23.62 4.2411% 0.2635%GILMANTON $23.91
97.8 $26.59 0.8908% 0.0354%GILSUM $26.95
93.7 $24.81 3.4847% 0.8855%GOFFSTOWN $26.43
99.4 $35.40 7.8960% 0.1391%GORHAM $31.85
97.5 $20.82 1.5985% 0.0426%GOSHEN $21.40
95.9 $25.30 0.8468% 0.0687%GRAFTON $26.14
95.8 $22.87 10.4994% 0.2797%GRANTHAM $23.84
93.1 $24.87 0.3554% 0.0903%GREENFIELD $28.23
88.5 $14.71 1.6148% 0.4572%GREENLAND $16.65
84.5 $6.16 0.1231% 0.0022%GREEN'S GRANT $7.45
95.0 $22.85 0.2335% 0.0593%GREENVILLE $24.28
99.4 $6.29 0.9971% 0.0809%GROTON $11.70
84.5 $0.00 0.0000% 0.0000%HADLEY'S PURCHASE $0.00
100.3 $4.25 0.5663% 0.0428%HALE'S LOCATION $4.25
89.2 $21.49 2.3416% 0.6631%HAMPSTEAD $24.20
98.6 $15.67 6.8743% 1.9465%HAMPTON $16.08
90.7 $19.29 0.9443% 0.2674%HAMPTON FALLS $21.50
102.9 $23.80 0.5434% 0.1381%HANCOCK $23.11
81.0 $15.95 17.5938% 1.4277%HANOVER $19.72
98.4 $17.32 2.7908% 0.1109%HARRISVILLE $17.60
100.0 $3.53 0.1250% 0.0095%HART'S LOCATION $3.65
98.0 $30.46 2.3807% 0.1932%HAVERHILL $29.76
98.8 $8.09 1.8778% 0.1524%HEBRON $8.32
93.3 $30.90 2.6184% 0.2443%HENNIKER $33.33
102.8 $26.91 0.5175% 0.0483%HILL $25.30
100.4 $30.32 1.1224% 0.2852%HILLSBOROUGH $29.52
103.6 $27.78 4.8463% 0.1926%HINSDALE $26.93
91.7 $12.98 5.3255% 0.4321%HOLDERNESS $14.18
91.0 $21.32 2.9989% 0.7620%HOLLIS $23.43
82.5 $21.52 12.0674% 1.1258%HOOKSETT $26.39
92.7 $31.00 4.0944% 0.3820%HOPKINTON $33.55
87.3 $19.41 6.7492% 1.7150%HUDSON $21.97
94.6 $10.62 3.1986% 0.2420%JACKSON $11.26
93.3 $30.66 6.3338% 0.2518%JAFFREY $33.00
101.4 $20.79 3.9050% 0.0688%JEFFERSON $20.39
99.8 $35.98 26.1814% 1.0407%KEENE $36.39
88.2 $20.57 0.7017% 0.1987%KENSINGTON $23.51
84.5 $0.00 0.0000% 0.0000%KILKENNY $0.00
85.9 $22.01 1.5444% 0.4373%KINGSTON $25.50
93.3 $20.34 19.3723% 1.2034%LACONIA $22.20
103.3 $26.94 8.3626% 0.1473%LANCASTER $25.61
100.6 $20.07 0.3533% 0.0287%LANDAFF $19.73
99.4 $29.10 1.2495% 0.0333%LANGDON $29.73
149 2017 Deparment of Revenue Administration Annual Report
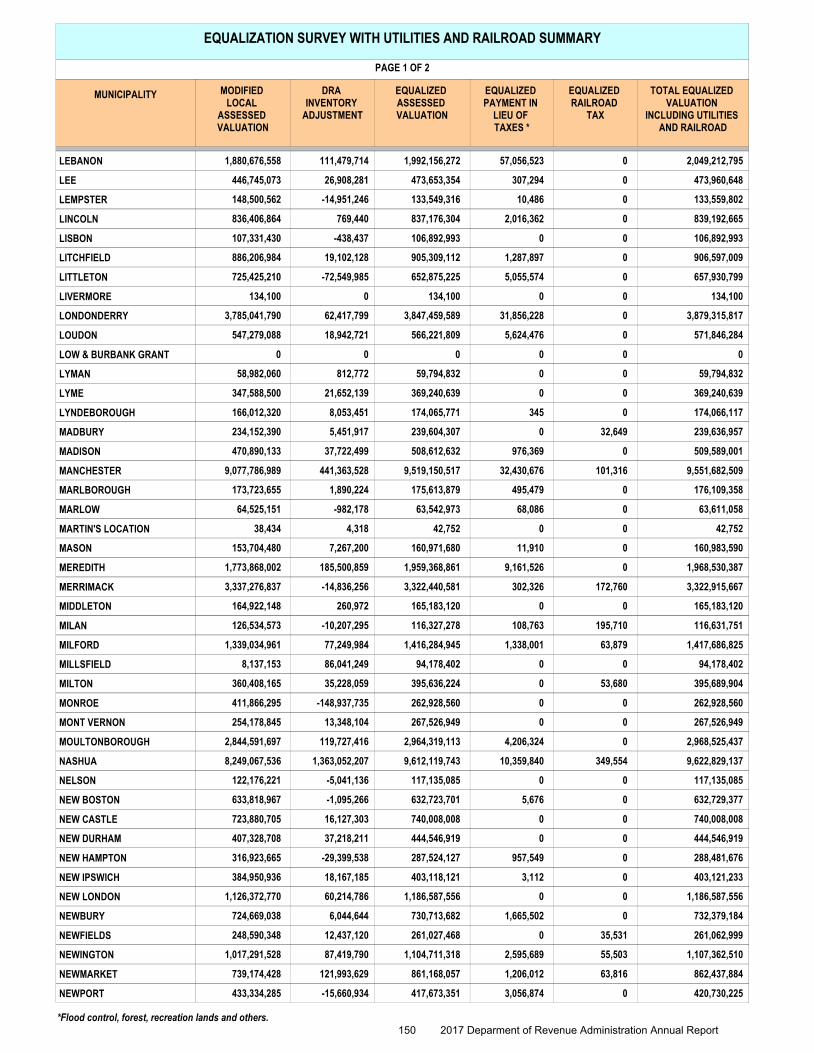
EQUALIZATION SURVEY WITH UTILITIES AND RAILROAD SUMMARY
PAGE 1 OF 2
MODIFIED LOCAL
ASSESSED VALUATION
DRA INVENTORY
ADJUSTMENT
EQUALIZED ASSESSED VALUATION
EQUALIZED PAYMENT IN
LIEU OF TAXES *
EQUALIZED RAILROAD
TAX
TOTAL EQUALIZED VALUATION
INCLUDING UTILITIES AND RAILROAD
MUNICIPALITY
1,880,676,558 111,479,714 1,992,156,272 57,056,523 2,049,212,7950LEBANON
446,745,073 26,908,281 473,653,354 307,294 473,960,6480LEE
148,500,562 -14,951,246 133,549,316 10,486 133,559,8020LEMPSTER
836,406,864 769,440 837,176,304 2,016,362 839,192,6650LINCOLN
107,331,430 -438,437 106,892,993 0 106,892,9930LISBON
886,206,984 19,102,128 905,309,112 1,287,897 906,597,0090LITCHFIELD
725,425,210 -72,549,985 652,875,225 5,055,574 657,930,7990LITTLETON
134,100 0 134,100 0 134,1000LIVERMORE
3,785,041,790 62,417,799 3,847,459,589 31,856,228 3,879,315,8170LONDONDERRY
547,279,088 18,942,721 566,221,809 5,624,476 571,846,2840LOUDON
0 0 0 0 00LOW & BURBANK GRANT
58,982,060 812,772 59,794,832 0 59,794,8320LYMAN
347,588,500 21,652,139 369,240,639 0 369,240,6390LYME
166,012,320 8,053,451 174,065,771 345 174,066,1170LYNDEBOROUGH
234,152,390 5,451,917 239,604,307 0 239,636,95732,649MADBURY
470,890,133 37,722,499 508,612,632 976,369 509,589,0010MADISON
9,077,786,989 441,363,528 9,519,150,517 32,430,676 9,551,682,509101,316MANCHESTER
173,723,655 1,890,224 175,613,879 495,479 176,109,3580MARLBOROUGH
64,525,151 -982,178 63,542,973 68,086 63,611,0580MARLOW
38,434 4,318 42,752 0 42,7520MARTIN'S LOCATION
153,704,480 7,267,200 160,971,680 11,910 160,983,5900MASON
1,773,868,002 185,500,859 1,959,368,861 9,161,526 1,968,530,3870MEREDITH
3,337,276,837 -14,836,256 3,322,440,581 302,326 3,322,915,667172,760MERRIMACK
164,922,148 260,972 165,183,120 0 165,183,1200MIDDLETON
126,534,573 -10,207,295 116,327,278 108,763 116,631,751195,710MILAN
1,339,034,961 77,249,984 1,416,284,945 1,338,001 1,417,686,82563,879MILFORD
8,137,153 86,041,249 94,178,402 0 94,178,4020MILLSFIELD
360,408,165 35,228,059 395,636,224 0 395,689,90453,680MILTON
411,866,295 -148,937,735 262,928,560 0 262,928,5600MONROE
254,178,845 13,348,104 267,526,949 0 267,526,9490MONT VERNON
2,844,591,697 119,727,416 2,964,319,113 4,206,324 2,968,525,4370MOULTONBOROUGH
8,249,067,536 1,363,052,207 9,612,119,743 10,359,840 9,622,829,137349,554NASHUA
122,176,221 -5,041,136 117,135,085 0 117,135,0850NELSON
633,818,967 -1,095,266 632,723,701 5,676 632,729,3770NEW BOSTON
723,880,705 16,127,303 740,008,008 0 740,008,0080NEW CASTLE
407,328,708 37,218,211 444,546,919 0 444,546,9190NEW DURHAM
316,923,665 -29,399,538 287,524,127 957,549 288,481,6760NEW HAMPTON
384,950,936 18,167,185 403,118,121 3,112 403,121,2330NEW IPSWICH
1,126,372,770 60,214,786 1,186,587,556 0 1,186,587,5560NEW LONDON
724,669,038 6,044,644 730,713,682 1,665,502 732,379,1840NEWBURY
248,590,348 12,437,120 261,027,468 0 261,062,99935,531NEWFIELDS
1,017,291,528 87,419,790 1,104,711,318 2,595,689 1,107,362,51055,503NEWINGTON
739,174,428 121,993,629 861,168,057 1,206,012 862,437,88463,816NEWMARKET
433,334,285 -15,660,934 417,673,351 3,056,874 420,730,2250NEWPORT
*Flood control, forest, recreation lands and others.
150 2017 Deparment of Revenue Administration Annual Report
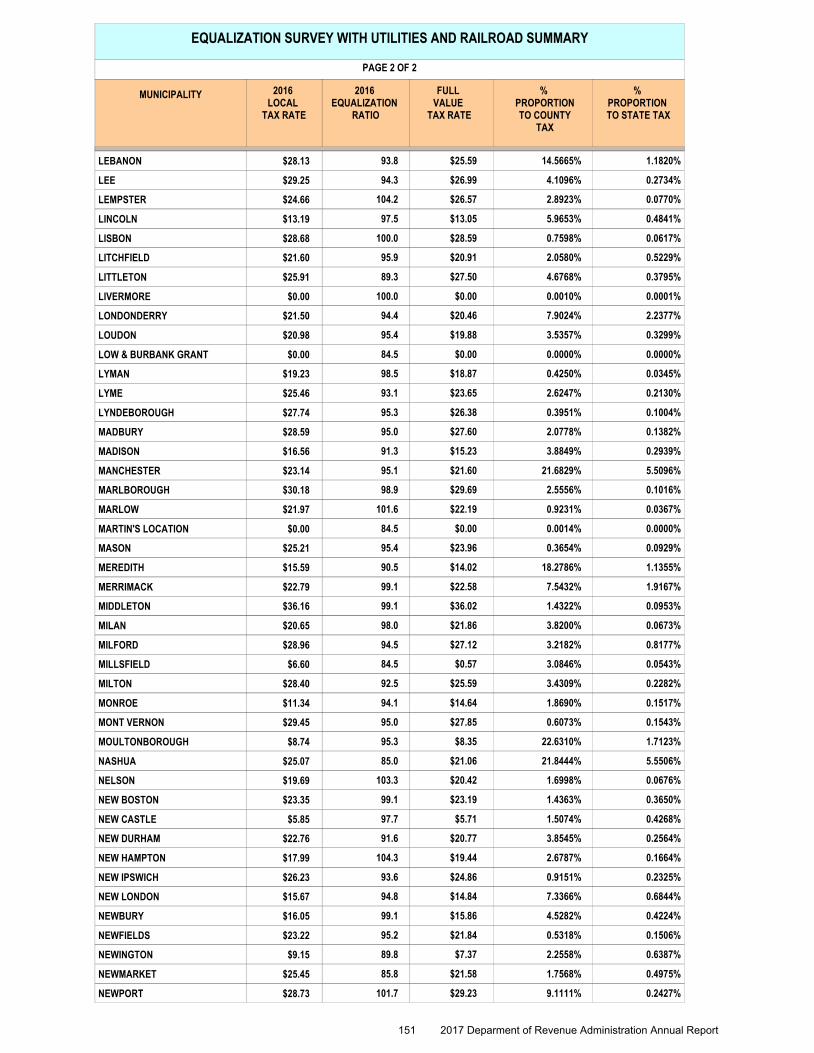
EQUALIZATION SURVEY WITH UTILITIES AND RAILROAD SUMMARY
PAGE 2 OF 2
2016 LOCAL
TAX RATE
2016 EQUALIZATION
RATIO
FULL VALUE
TAX RATE
% PROPORTION TO COUNTY
TAX
% PROPORTION TO STATE TAX
MUNICIPALITY
93.8 $25.59 14.5665% 1.1820%LEBANON $28.13
94.3 $26.99 4.1096% 0.2734%LEE $29.25
104.2 $26.57 2.8923% 0.0770%LEMPSTER $24.66
97.5 $13.05 5.9653% 0.4841%LINCOLN $13.19
100.0 $28.59 0.7598% 0.0617%LISBON $28.68
95.9 $20.91 2.0580% 0.5229%LITCHFIELD $21.60
89.3 $27.50 4.6768% 0.3795%LITTLETON $25.91
100.0 $0.00 0.0010% 0.0001%LIVERMORE $0.00
94.4 $20.46 7.9024% 2.2377%LONDONDERRY $21.50
95.4 $19.88 3.5357% 0.3299%LOUDON $20.98
84.5 $0.00 0.0000% 0.0000%LOW & BURBANK GRANT $0.00
98.5 $18.87 0.4250% 0.0345%LYMAN $19.23
93.1 $23.65 2.6247% 0.2130%LYME $25.46
95.3 $26.38 0.3951% 0.1004%LYNDEBOROUGH $27.74
95.0 $27.60 2.0778% 0.1382%MADBURY $28.59
91.3 $15.23 3.8849% 0.2939%MADISON $16.56
95.1 $21.60 21.6829% 5.5096%MANCHESTER $23.14
98.9 $29.69 2.5556% 0.1016%MARLBOROUGH $30.18
101.6 $22.19 0.9231% 0.0367%MARLOW $21.97
84.5 $0.00 0.0014% 0.0000%MARTIN'S LOCATION $0.00
95.4 $23.96 0.3654% 0.0929%MASON $25.21
90.5 $14.02 18.2786% 1.1355%MEREDITH $15.59
99.1 $22.58 7.5432% 1.9167%MERRIMACK $22.79
99.1 $36.02 1.4322% 0.0953%MIDDLETON $36.16
98.0 $21.86 3.8200% 0.0673%MILAN $20.65
94.5 $27.12 3.2182% 0.8177%MILFORD $28.96
84.5 $0.57 3.0846% 0.0543%MILLSFIELD $6.60
92.5 $25.59 3.4309% 0.2282%MILTON $28.40
94.1 $14.64 1.8690% 0.1517%MONROE $11.34
95.0 $27.85 0.6073% 0.1543%MONT VERNON $29.45
95.3 $8.35 22.6310% 1.7123%MOULTONBOROUGH $8.74
85.0 $21.06 21.8444% 5.5506%NASHUA $25.07
103.3 $20.42 1.6998% 0.0676%NELSON $19.69
99.1 $23.19 1.4363% 0.3650%NEW BOSTON $23.35
97.7 $5.71 1.5074% 0.4268%NEW CASTLE $5.85
91.6 $20.77 3.8545% 0.2564%NEW DURHAM $22.76
104.3 $19.44 2.6787% 0.1664%NEW HAMPTON $17.99
93.6 $24.86 0.9151% 0.2325%NEW IPSWICH $26.23
94.8 $14.84 7.3366% 0.6844%NEW LONDON $15.67
99.1 $15.86 4.5282% 0.4224%NEWBURY $16.05
95.2 $21.84 0.5318% 0.1506%NEWFIELDS $23.22
89.8 $7.37 2.2558% 0.6387%NEWINGTON $9.15
85.8 $21.58 1.7568% 0.4975%NEWMARKET $25.45
101.7 $29.23 9.1111% 0.2427%NEWPORT $28.73
151 2017 Deparment of Revenue Administration Annual Report

EQUALIZATION SURVEY WITH UTILITIES AND RAILROAD SUMMARY
PAGE 1 OF 2
MODIFIED LOCAL
ASSESSED VALUATION
DRA INVENTORY
ADJUSTMENT
EQUALIZED ASSESSED VALUATION
EQUALIZED PAYMENT IN
LIEU OF TAXES *
EQUALIZED RAILROAD
TAX
TOTAL EQUALIZED VALUATION
INCLUDING UTILITIES AND RAILROAD
MUNICIPALITY
506,323,398 26,718,418 533,041,816 0 533,081,65939,844NEWTON
1,030,306,750 174,941,253 1,205,248,003 0 1,205,314,71066,707NORTH HAMPTON
283,582,944 25,286,333 308,869,277 2,500,071 311,369,3490NORTHFIELD
111,134,907 -6,807,720 104,327,187 453,305 104,877,25996,767NORTHUMBERLAND
468,026,783 26,800,101 494,826,884 345,315 495,172,1990NORTHWOOD
613,368,641 12,431,322 625,799,963 197,410 625,997,3740NOTTINGHAM
2,035,320 398,534 2,433,854 497,882 2,931,7360ODELL
31,659,106 70,015 31,729,121 129,255 31,858,3750ORANGE
135,286,101 7,436,089 142,722,190 130,491 142,852,6810ORFORD
642,113,539 38,079,616 680,193,155 53,690 680,289,38042,535OSSIPEE
1,676,395,742 12,333,880 1,688,729,622 1,284,474 1,690,014,0970PELHAM
615,755,177 49,403,012 665,158,189 1,668,238 666,826,4270PEMBROKE
640,759,136 39,627,430 680,386,566 2,128,461 682,515,0270PETERBOROUGH
96,449,808 -1,819,607 94,630,201 58,309 94,688,5090PIERMONT
2,755,360 496,236 3,251,596 3,508,569 6,760,1660PINKHAM'S GRANT
252,238,831 25,730,296 277,969,127 4,846,868 282,815,9950PITTSBURG
265,648,517 -13,374,828 252,273,689 306,137 252,579,8260PITTSFIELD
272,210,197 7,792,501 280,002,698 38,990 280,041,6880PLAINFIELD
992,241,173 44,005,573 1,036,246,746 0 1,036,307,07060,324PLAISTOW
433,056,266 42,084,202 475,140,468 2,376,926 477,517,3940PLYMOUTH
4,791,313,051 860,666,719 5,651,979,770 60,832,945 5,713,043,888231,173PORTSMOUTH
70,874,787 -4,979,600 65,895,187 1,667,463 67,562,6500RANDOLPH
933,842,961 12,901,517 946,744,478 434,345 947,178,8230RAYMOND
94,677,975 3,184,865 97,862,840 0 97,862,8400RICHMOND
533,102,260 19,392,444 552,494,704 388,098 552,882,8020RINDGE
2,111,147,346 253,952,929 2,365,100,275 15,803,985 2,380,977,98073,720ROCHESTER
230,041,771 43,932,221 273,973,992 0 274,016,27642,284ROLLINSFORD
23,120,286 -1,066,197 22,054,089 3,235,657 25,289,7460ROXBURY
177,539,606 -4,775,768 172,763,838 318,142 173,081,9800RUMNEY
1,890,465,900 287,100,694 2,177,566,594 2,003,508 2,179,578,3018,199RYE
4,412,559,540 329,452,268 4,742,011,808 3,712,171 4,745,723,9790SALEM
128,956,412 4,736,460 133,692,872 2,343,621 136,036,4930SALISBURY
393,864,436 65,278,378 459,142,814 1,576,954 460,719,7670SANBORNTON
529,025,880 114,052,929 643,078,809 0 643,078,8090SANDOWN
399,806,637 7,134,036 406,940,673 622,124 407,562,7970SANDWICH
1,961,360 359,776 2,321,136 0 2,321,1360SARGENT'S PURCHASE
2,723,646,150 -295,454,743 2,428,191,407 0 2,428,191,4070SEABROOK
1,182,566 180,035 1,362,601 0 1,362,6010SECOND COLLEGE GRANT
50,563,398 -71,024 50,492,374 76,807 50,569,1810SHARON
79,276,650 -11,842,390 67,434,260 372,867 68,109,442302,314SHELBURNE
843,367,828 43,231,864 886,599,692 3,682,113 890,309,35527,549SOMERSWORTH
136,068,744 14,594,341 150,663,085 1,700 150,664,7850SOUTH HAMPTON
203,085,199 5,675,373 208,760,572 305,696 209,068,6372,369SPRINGFIELD
70,732,534 -3,934,694 66,797,840 526,057 67,657,559333,662STARK
*Flood control, forest, recreation lands and others.
152 2017 Deparment of Revenue Administration Annual Report
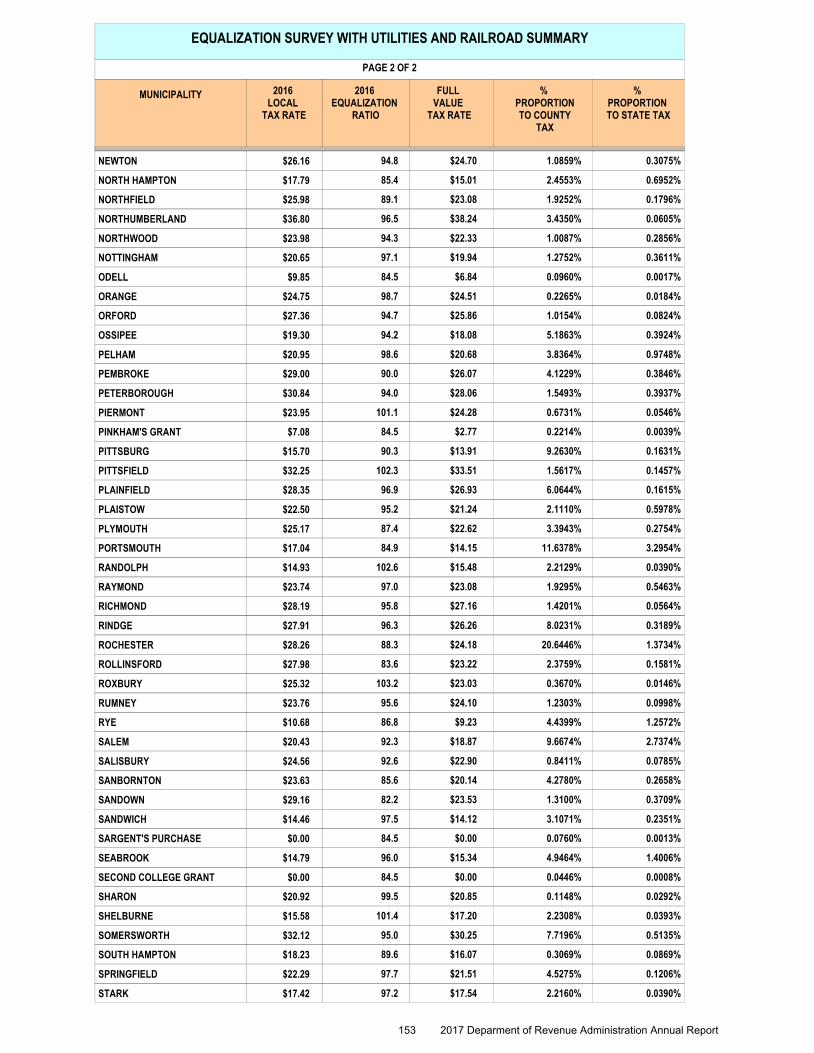
EQUALIZATION SURVEY WITH UTILITIES AND RAILROAD SUMMARY
PAGE 2 OF 2
2016 LOCAL
TAX RATE
2016 EQUALIZATION
RATIO
FULL VALUE
TAX RATE
% PROPORTION TO COUNTY
TAX
% PROPORTION TO STATE TAX
MUNICIPALITY
94.8 $24.70 1.0859% 0.3075%NEWTON $26.16
85.4 $15.01 2.4553% 0.6952%NORTH HAMPTON $17.79
89.1 $23.08 1.9252% 0.1796%NORTHFIELD $25.98
96.5 $38.24 3.4350% 0.0605%NORTHUMBERLAND $36.80
94.3 $22.33 1.0087% 0.2856%NORTHWOOD $23.98
97.1 $19.94 1.2752% 0.3611%NOTTINGHAM $20.65
84.5 $6.84 0.0960% 0.0017%ODELL $9.85
98.7 $24.51 0.2265% 0.0184%ORANGE $24.75
94.7 $25.86 1.0154% 0.0824%ORFORD $27.36
94.2 $18.08 5.1863% 0.3924%OSSIPEE $19.30
98.6 $20.68 3.8364% 0.9748%PELHAM $20.95
90.0 $26.07 4.1229% 0.3846%PEMBROKE $29.00
94.0 $28.06 1.5493% 0.3937%PETERBOROUGH $30.84
101.1 $24.28 0.6731% 0.0546%PIERMONT $23.95
84.5 $2.77 0.2214% 0.0039%PINKHAM'S GRANT $7.08
90.3 $13.91 9.2630% 0.1631%PITTSBURG $15.70
102.3 $33.51 1.5617% 0.1457%PITTSFIELD $32.25
96.9 $26.93 6.0644% 0.1615%PLAINFIELD $28.35
95.2 $21.24 2.1110% 0.5978%PLAISTOW $22.50
87.4 $22.62 3.3943% 0.2754%PLYMOUTH $25.17
84.9 $14.15 11.6378% 3.2954%PORTSMOUTH $17.04
102.6 $15.48 2.2129% 0.0390%RANDOLPH $14.93
97.0 $23.08 1.9295% 0.5463%RAYMOND $23.74
95.8 $27.16 1.4201% 0.0564%RICHMOND $28.19
96.3 $26.26 8.0231% 0.3189%RINDGE $27.91
88.3 $24.18 20.6446% 1.3734%ROCHESTER $28.26
83.6 $23.22 2.3759% 0.1581%ROLLINSFORD $27.98
103.2 $23.03 0.3670% 0.0146%ROXBURY $25.32
95.6 $24.10 1.2303% 0.0998%RUMNEY $23.76
86.8 $9.23 4.4399% 1.2572%RYE $10.68
92.3 $18.87 9.6674% 2.7374%SALEM $20.43
92.6 $22.90 0.8411% 0.0785%SALISBURY $24.56
85.6 $20.14 4.2780% 0.2658%SANBORNTON $23.63
82.2 $23.53 1.3100% 0.3709%SANDOWN $29.16
97.5 $14.12 3.1071% 0.2351%SANDWICH $14.46
84.5 $0.00 0.0760% 0.0013%SARGENT'S PURCHASE $0.00
96.0 $15.34 4.9464% 1.4006%SEABROOK $14.79
84.5 $0.00 0.0446% 0.0008%SECOND COLLEGE GRANT $0.00
99.5 $20.85 0.1148% 0.0292%SHARON $20.92
101.4 $17.20 2.2308% 0.0393%SHELBURNE $15.58
95.0 $30.25 7.7196% 0.5135%SOMERSWORTH $32.12
89.6 $16.07 0.3069% 0.0869%SOUTH HAMPTON $18.23
97.7 $21.51 4.5275% 0.1206%SPRINGFIELD $22.29
97.2 $17.54 2.2160% 0.0390%STARK $17.42
153 2017 Deparment of Revenue Administration Annual Report
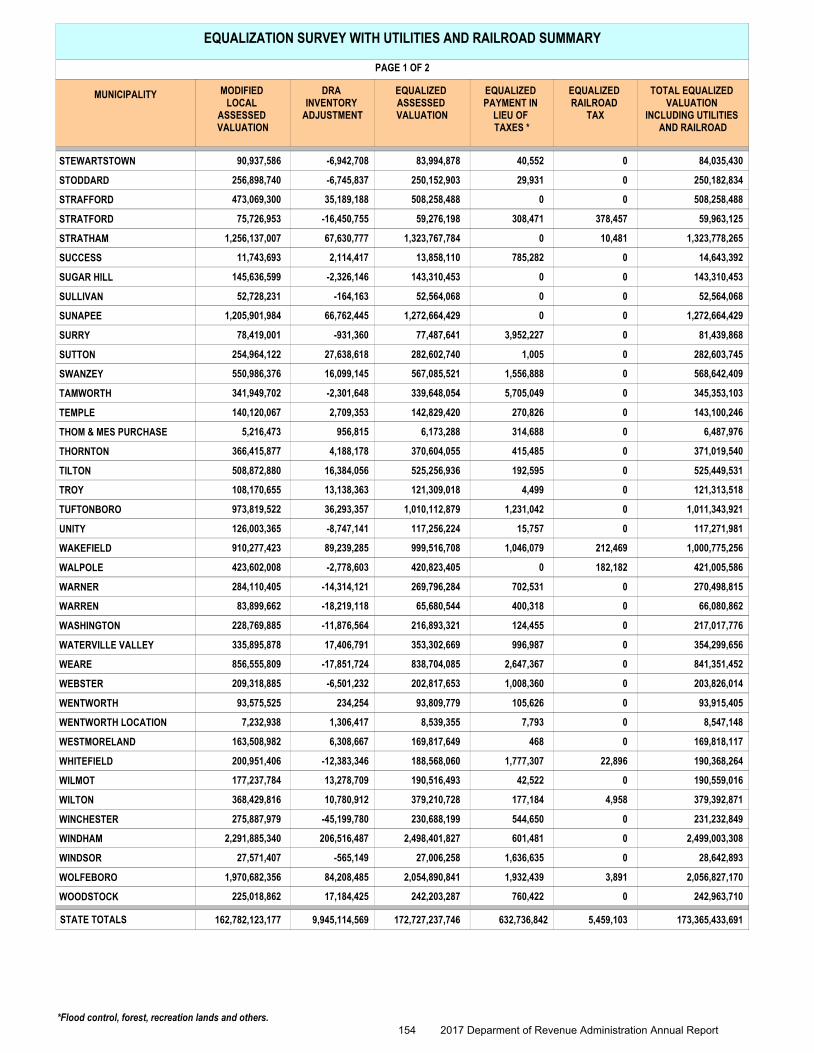
EQUALIZATION SURVEY WITH UTILITIES AND RAILROAD SUMMARY
PAGE 1 OF 2
MODIFIED LOCAL
ASSESSED VALUATION
DRA INVENTORY
ADJUSTMENT
EQUALIZED ASSESSED VALUATION
EQUALIZED PAYMENT IN
LIEU OF TAXES *
EQUALIZED RAILROAD
TAX
TOTAL EQUALIZED VALUATION
INCLUDING UTILITIES AND RAILROAD
MUNICIPALITY
90,937,586 -6,942,708 83,994,878 40,552 84,035,4300STEWARTSTOWN
256,898,740 -6,745,837 250,152,903 29,931 250,182,8340STODDARD
473,069,300 35,189,188 508,258,488 0 508,258,4880STRAFFORD
75,726,953 -16,450,755 59,276,198 308,471 59,963,125378,457STRATFORD
1,256,137,007 67,630,777 1,323,767,784 0 1,323,778,26510,481STRATHAM
11,743,693 2,114,417 13,858,110 785,282 14,643,3920SUCCESS
145,636,599 -2,326,146 143,310,453 0 143,310,4530SUGAR HILL
52,728,231 -164,163 52,564,068 0 52,564,0680SULLIVAN
1,205,901,984 66,762,445 1,272,664,429 0 1,272,664,4290SUNAPEE
78,419,001 -931,360 77,487,641 3,952,227 81,439,8680SURRY
254,964,122 27,638,618 282,602,740 1,005 282,603,7450SUTTON
550,986,376 16,099,145 567,085,521 1,556,888 568,642,4090SWANZEY
341,949,702 -2,301,648 339,648,054 5,705,049 345,353,1030TAMWORTH
140,120,067 2,709,353 142,829,420 270,826 143,100,2460TEMPLE
5,216,473 956,815 6,173,288 314,688 6,487,9760THOM & MES PURCHASE
366,415,877 4,188,178 370,604,055 415,485 371,019,5400THORNTON
508,872,880 16,384,056 525,256,936 192,595 525,449,5310TILTON
108,170,655 13,138,363 121,309,018 4,499 121,313,5180TROY
973,819,522 36,293,357 1,010,112,879 1,231,042 1,011,343,9210TUFTONBORO
126,003,365 -8,747,141 117,256,224 15,757 117,271,9810UNITY
910,277,423 89,239,285 999,516,708 1,046,079 1,000,775,256212,469WAKEFIELD
423,602,008 -2,778,603 420,823,405 0 421,005,586182,182WALPOLE
284,110,405 -14,314,121 269,796,284 702,531 270,498,8150WARNER
83,899,662 -18,219,118 65,680,544 400,318 66,080,8620WARREN
228,769,885 -11,876,564 216,893,321 124,455 217,017,7760WASHINGTON
335,895,878 17,406,791 353,302,669 996,987 354,299,6560WATERVILLE VALLEY
856,555,809 -17,851,724 838,704,085 2,647,367 841,351,4520WEARE
209,318,885 -6,501,232 202,817,653 1,008,360 203,826,0140WEBSTER
93,575,525 234,254 93,809,779 105,626 93,915,4050WENTWORTH
7,232,938 1,306,417 8,539,355 7,793 8,547,1480WENTWORTH LOCATION
163,508,982 6,308,667 169,817,649 468 169,818,1170WESTMORELAND
200,951,406 -12,383,346 188,568,060 1,777,307 190,368,26422,896WHITEFIELD
177,237,784 13,278,709 190,516,493 42,522 190,559,0160WILMOT
368,429,816 10,780,912 379,210,728 177,184 379,392,8714,958WILTON
275,887,979 -45,199,780 230,688,199 544,650 231,232,8490WINCHESTER
2,291,885,340 206,516,487 2,498,401,827 601,481 2,499,003,3080WINDHAM
27,571,407 -565,149 27,006,258 1,636,635 28,642,8930WINDSOR
1,970,682,356 84,208,485 2,054,890,841 1,932,439 2,056,827,1703,891WOLFEBORO
225,018,862 17,184,425 242,203,287 760,422 242,963,7100WOODSTOCK
STATE TOTALS 162,782,123,177 9,945,114,569 632,736,842 5,459,103 173,365,433,691172,727,237,746
*Flood control, forest, recreation lands and others.
154 2017 Deparment of Revenue Administration Annual Report
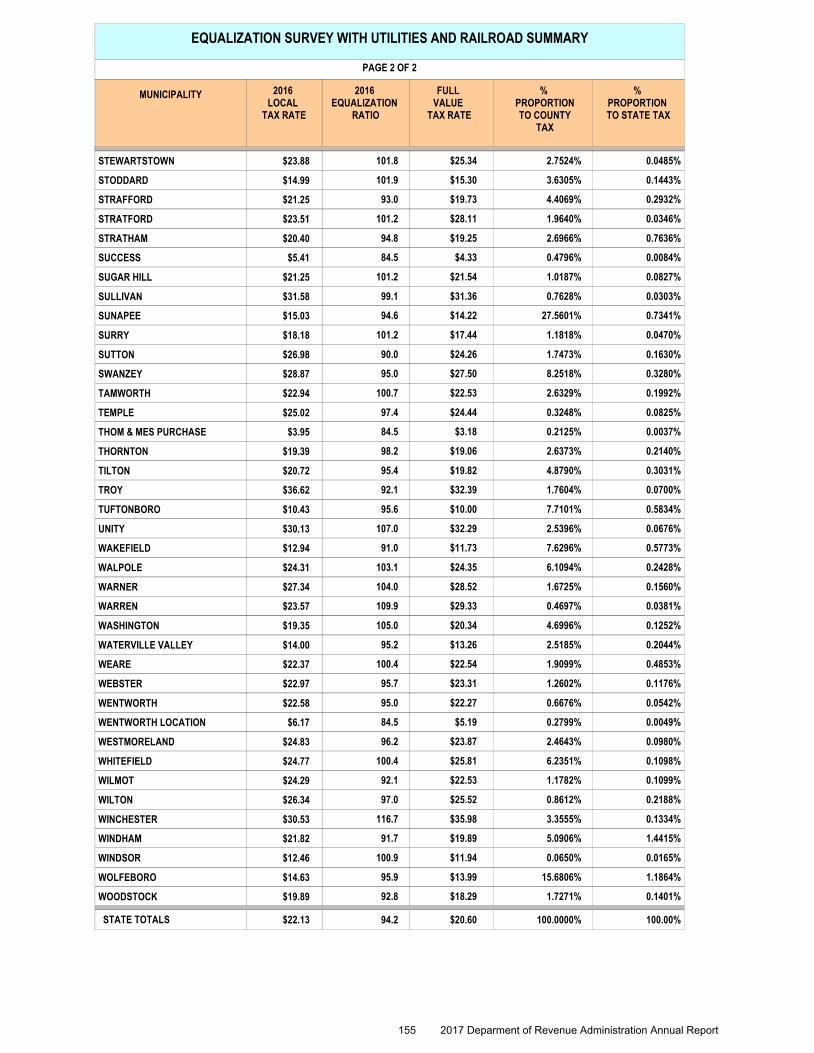
EQUALIZATION SURVEY WITH UTILITIES AND RAILROAD SUMMARY
PAGE 2 OF 2
2016 LOCAL
TAX RATE
2016 EQUALIZATION
RATIO
FULL VALUE
TAX RATE
% PROPORTION TO COUNTY
TAX
% PROPORTION TO STATE TAX
MUNICIPALITY
101.8 $25.34 2.7524% 0.0485%STEWARTSTOWN $23.88
101.9 $15.30 3.6305% 0.1443%STODDARD $14.99
93.0 $19.73 4.4069% 0.2932%STRAFFORD $21.25
101.2 $28.11 1.9640% 0.0346%STRATFORD $23.51
94.8 $19.25 2.6966% 0.7636%STRATHAM $20.40
84.5 $4.33 0.4796% 0.0084%SUCCESS $5.41
101.2 $21.54 1.0187% 0.0827%SUGAR HILL $21.25
99.1 $31.36 0.7628% 0.0303%SULLIVAN $31.58
94.6 $14.22 27.5601% 0.7341%SUNAPEE $15.03
101.2 $17.44 1.1818% 0.0470%SURRY $18.18
90.0 $24.26 1.7473% 0.1630%SUTTON $26.98
95.0 $27.50 8.2518% 0.3280%SWANZEY $28.87
100.7 $22.53 2.6329% 0.1992%TAMWORTH $22.94
97.4 $24.44 0.3248% 0.0825%TEMPLE $25.02
84.5 $3.18 0.2125% 0.0037%THOM & MES PURCHASE $3.95
98.2 $19.06 2.6373% 0.2140%THORNTON $19.39
95.4 $19.82 4.8790% 0.3031%TILTON $20.72
92.1 $32.39 1.7604% 0.0700%TROY $36.62
95.6 $10.00 7.7101% 0.5834%TUFTONBORO $10.43
107.0 $32.29 2.5396% 0.0676%UNITY $30.13
91.0 $11.73 7.6296% 0.5773%WAKEFIELD $12.94
103.1 $24.35 6.1094% 0.2428%WALPOLE $24.31
104.0 $28.52 1.6725% 0.1560%WARNER $27.34
109.9 $29.33 0.4697% 0.0381%WARREN $23.57
105.0 $20.34 4.6996% 0.1252%WASHINGTON $19.35
95.2 $13.26 2.5185% 0.2044%WATERVILLE VALLEY $14.00
100.4 $22.54 1.9099% 0.4853%WEARE $22.37
95.7 $23.31 1.2602% 0.1176%WEBSTER $22.97
95.0 $22.27 0.6676% 0.0542%WENTWORTH $22.58
84.5 $5.19 0.2799% 0.0049%WENTWORTH LOCATION $6.17
96.2 $23.87 2.4643% 0.0980%WESTMORELAND $24.83
100.4 $25.81 6.2351% 0.1098%WHITEFIELD $24.77
92.1 $22.53 1.1782% 0.1099%WILMOT $24.29
97.0 $25.52 0.8612% 0.2188%WILTON $26.34
116.7 $35.98 3.3555% 0.1334%WINCHESTER $30.53
91.7 $19.89 5.0906% 1.4415%WINDHAM $21.82
100.9 $11.94 0.0650% 0.0165%WINDSOR $12.46
95.9 $13.99 15.6806% 1.1864%WOLFEBORO $14.63
92.8 $18.29 1.7271% 0.1401%WOODSTOCK $19.89
$22.13 94.2 $20.60STATE TOTALS 100.00%100.0000%
155 2017 Deparment of Revenue Administration Annual Report

MUNICIPALITYTOTAL EQUALIZED VALUATION INCLUDING UTILITIES USED TO
APPORTION LOCAL SCHOOL TAX
TOTAL EQUALIZED VALUATION NOT INCLUDING UTILITIES USED TO APPORTION STATE SCHOOL
TAX
BASE VALUATION FOR DEBT LIMIT FOR SCHOOL
PURPOSES ONLY
CONCORD - CONCORD UNION SCHOOL DISTRICT 3,681,748,187 3,588,187,526 3,656,368,189
PENACOOK - MERRIMACK VALLEY SCHOOL DISTRICT 383,148,915 330,498,368 380,515,285
LOUDON SCHOOL DISTRICT 567,971,082 559,594,941 562,346,606
2016 SCHOOL SET-OFF DISTRICTS TOTAL EQUALIZED VALUATION FOR SCHOOL PURPOSES
156 2017 Deparment of Revenue Administration Annual Report
2016
EQUALIZATION SURVEY
“Not Including Utility & Railroad”
STATE OF NEW HAMPSHIRE
DEPARTMENT OF
REVENUE ADMINISTRATION
157 2017 Deparment of Revenue Administration Annual Report

2016 E Q U A L I Z A T I O N S U R V E Y
“NOT INCLUDING UTILITIES AND RAILROADS”
May 1, 2017 This report presents the results of the 2016 Equalization Survey “not including utilities and railroads”. It was conducted by the New Hampshire Department of Revenue Administration pursuant to RSA 21-J:3 XIII (Revised 4/1/99) which states:
"XIII. Equalize annually by May 1 the valuation of the property as assessed in the several towns, cities, and unincorporated places in the state including the value of property exempt pursuant to RSA 72:37, 72:37-b, 72:39-a, 72:62, 72:66 and 72:70 by adding to or deducting from the aggregate valuation of the property in towns, cities and unincorporated places such sums as will bring such valuations to the true and market value of the property, and by making such adjustments in the value of other property from which the towns, cities, and unincorporated places receive taxes or payments in lieu of taxes as may be equitable and just, so that any public taxes that may be apportioned among them shall be equal and just. In carrying out the duty to equalize the valuation of property, the commissioner shall follow the procedures set forth in RSA 21-J:9-a.”
To accomplish the foregoing, assessment ratio studies were conducted to determine how the average level of assessment for all cities and towns compares with the statutory 100% ratio so that taxes can be apportioned equitably. The Department of Revenue Administration has completed its process of calculating the total equalized valuation of all the municipalities and unincorporated places throughout the state. The ratios reported for each municipality in this survey were derived by comparing the sale prices of sales of land, land and buildings and manufactured housing, covering the period of October 1, 2015, to September 30, 2016, against the actual assessments levied by the municipalities. Sales information was verified by the grantee whenever possible by means of the Inventory of Property Transfer, Form PA-34. Our goal is to use only arm’s-length sales that transferred for market value in this analysis. Every effort has been made to exclude non-arm's length transactions including but not limited to: sales involving courts and government agencies, sales between relatives or corporate affiliates, sales settling an estate, forced sales, etc. Every municipality was notified of its 2016 sales assessment ratio. These ratios were used in conjunction with other Department of Revenue adjustments to determine each municipality’s total equalized value for purposes of RSA 21-J:3 XIII. The following is an explanation of the information contained in this report. MODIFIED ASSESSED VALUATION: The modified assessed valuation for each municipality as reported to the Department of Revenue Administration on the municipality’s 2016 Summary Inventory of Valuation (MS-1 Report) “not including utility values taxed pursuant to RSA 83-F.”
158 2017 Deparment of Revenue Administration Annual Report
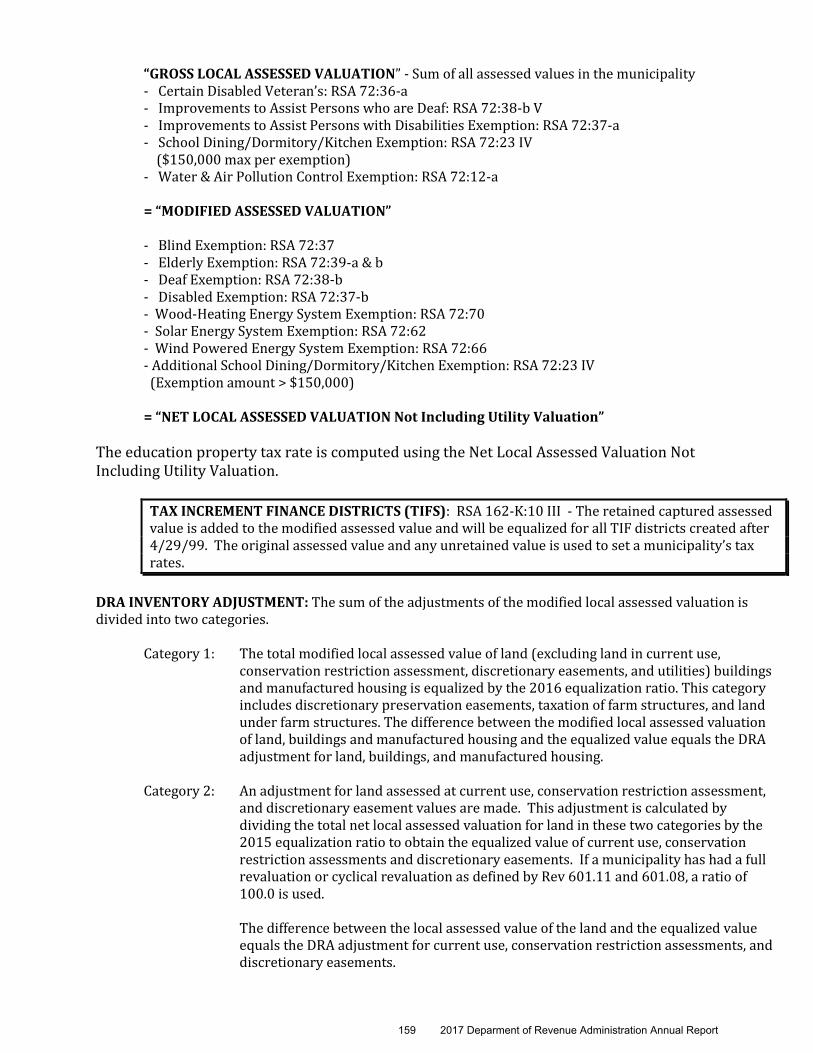
“GROSS LOCAL ASSESSED VALUATION” - Sum of all assessed values in the municipality - Certain Disabled Veteran’s: RSA 72:36-a - Improvements to Assist Persons who are Deaf: RSA 72:38-b V - Improvements to Assist Persons with Disabilities Exemption: RSA 72:37-a - School Dining/Dormitory/Kitchen Exemption: RSA 72:23 IV ($150,000 max per exemption) - Water & Air Pollution Control Exemption: RSA 72:12-a = “MODIFIED ASSESSED VALUATION”
- Blind Exemption: RSA 72:37 - Elderly Exemption: RSA 72:39-a & b - Deaf Exemption: RSA 72:38-b - Disabled Exemption: RSA 72:37-b - Wood-Heating Energy System Exemption: RSA 72:70 - Solar Energy System Exemption: RSA 72:62 - Wind Powered Energy System Exemption: RSA 72:66 - Additional School Dining/Dormitory/Kitchen Exemption: RSA 72:23 IV (Exemption amount > $150,000)
= “NET LOCAL ASSESSED VALUATION Not Including Utility Valuation”
The education property tax rate is computed using the Net Local Assessed Valuation Not Including Utility Valuation.
TAX INCREMENT FINANCE DISTRICTS (TIFS): RSA 162-K:10 III - The retained captured assessed value is added to the modified assessed value and will be equalized for all TIF districts created after 4/29/99. The original assessed value and any unretained value is used to set a municipality’s tax rates.
DRA INVENTORY ADJUSTMENT: The sum of the adjustments of the modified local assessed valuation is divided into two categories.
Category 1: The total modified local assessed value of land (excluding land in current use, conservation restriction assessment, discretionary easements, and utilities) buildings and manufactured housing is equalized by the 2016 equalization ratio. This category includes discretionary preservation easements, taxation of farm structures, and land under farm structures. The difference between the modified local assessed valuation of land, buildings and manufactured housing and the equalized value equals the DRA adjustment for land, buildings, and manufactured housing.
Category 2: An adjustment for land assessed at current use, conservation restriction assessment,
and discretionary easement values are made. This adjustment is calculated by dividing the total net local assessed valuation for land in these two categories by the 2015 equalization ratio to obtain the equalized value of current use, conservation restriction assessments and discretionary easements. If a municipality has had a full revaluation or cyclical revaluation as defined by Rev 601.11 and 601.08, a ratio of 100.0 is used.
The difference between the local assessed value of the land and the equalized value
equals the DRA adjustment for current use, conservation restriction assessments, and discretionary easements.
159 2017 Deparment of Revenue Administration Annual Report
EQUALIZED ASSESSED VALUATION: The sum of the “modified local assessed valuation” plus the DRA inventory adjustment. The equalized assessed valuation represents the equalized value of all “taxable” properties in a municipality. PAYMENT IN LIEU OF TAXES: The equalized value for payments received in lieu of taxes includes State & Federal Forest Land Reimbursements, Recreation Land Reimbursements, Flood Land Reimbursements, renewable energy facilities (if applicable) and others. TOTAL EQUALIZED VALUATIONS NOT INCLUDING UTILITY VALUE AND EQUALIZED RAILROAD TAXES: The sum of the equalized assessed valuation and the equalized value of payments in lieu of taxes. The 2016 “total equalized valuation not including utility and equalized value of railroad monies reimbursed to municipalities” will be used to apportion the state education property tax for the tax year 2018. The 2015 total equalized valuation not including utilities and the value of railroad monies reimbursed to municipalities will be used to apportion the state education property tax for the tax year 2017. EQUALIZATION RATIO: The 2016 equalization ratio as determined by a ratio study conducted by the Department of Revenue Administration’s equalization staff. % PROPORTION TO STATE TAX: The percentage of proportion to $1,000 of tax that is to be allocated to each town within the state by comparing the town’s total equalized value to the total equalized value of the state. STATE & COUNTY RATIOS: The state and county gross assessed values divided by the total equalized valuation. The state and county ratios are calculated for statistical purposes only. They are not applied to any figure as part of the equalization process.
APPEAL OF TOTAL EQUALIZED VALUATION
Municipalities were sent their 2016 Notification of Total Equalized Valuations on April 26, 2017.
Per RSA 71-B:5, II, any municipality aggrieved by the total equalized valuation as determined by the DRA must appeal to the Board of Tax and Land Appeals in writing within 30 days of the town’s notification of the municipality’s total equalized valuation.
The appeal period is not extended due to any communication, either verbal or written, between the DRA and a municipality regarding the total equalized valuation.
160 2017 Deparment of Revenue Administration Annual Report
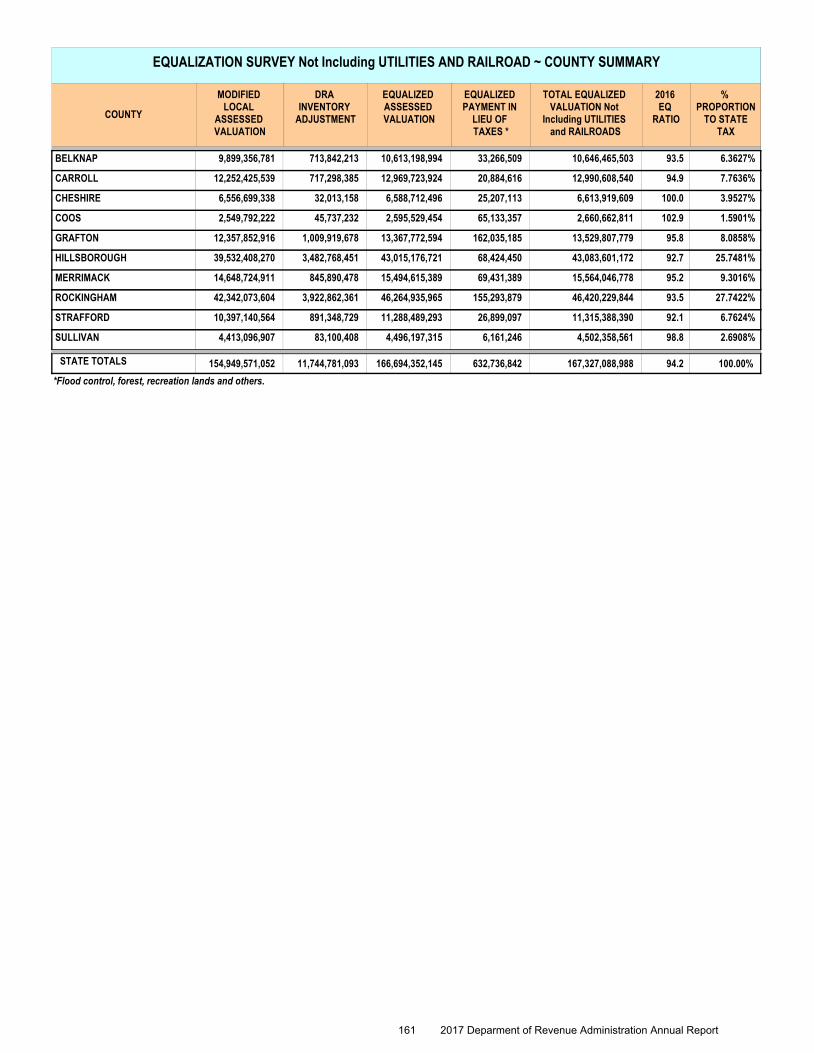
EQUALIZATION SURVEY Not Including UTILITIES AND RAILROAD ~ COUNTY SUMMARY
MODIFIED LOCAL
ASSESSED VALUATION
DRA INVENTORY
ADJUSTMENT
EQUALIZED ASSESSED VALUATION
EQUALIZED PAYMENT IN
LIEU OF TAXES *
TOTAL EQUALIZED VALUATION Not
Including UTILITIES and RAILROADS
2016 EQ
RATIO
% PROPORTION
TO STATE TAX
COUNTY
BELKNAP 9,899,356,781 713,842,213 10,613,198,994 33,266,509 10,646,465,503 93.5 6.3627%
CARROLL 12,252,425,539 717,298,385 12,969,723,924 20,884,616 12,990,608,540 94.9 7.7636%
CHESHIRE 6,556,699,338 32,013,158 6,588,712,496 25,207,113 6,613,919,609 100.0 3.9527%
COOS 2,549,792,222 45,737,232 2,595,529,454 65,133,357 2,660,662,811 102.9 1.5901%
GRAFTON 12,357,852,916 1,009,919,678 13,367,772,594 162,035,185 13,529,807,779 95.8 8.0858%
HILLSBOROUGH 39,532,408,270 3,482,768,451 43,015,176,721 68,424,450 43,083,601,172 92.7 25.7481%
MERRIMACK 14,648,724,911 845,890,478 15,494,615,389 69,431,389 15,564,046,778 95.2 9.3016%
ROCKINGHAM 42,342,073,604 3,922,862,361 46,264,935,965 155,293,879 46,420,229,844 93.5 27.7422%
STRAFFORD 10,397,140,564 891,348,729 11,288,489,293 26,899,097 11,315,388,390 92.1 6.7624%
SULLIVAN 4,413,096,907 83,100,408 4,496,197,315 6,161,246 4,502,358,561 98.8 2.6908%
94.2STATE TOTALS 154,949,571,052 11,744,781,093 166,694,352,145 632,736,842 167,327,088,988 100.00%
*Flood control, forest, recreation lands and others.
161 2017 Deparment of Revenue Administration Annual Report
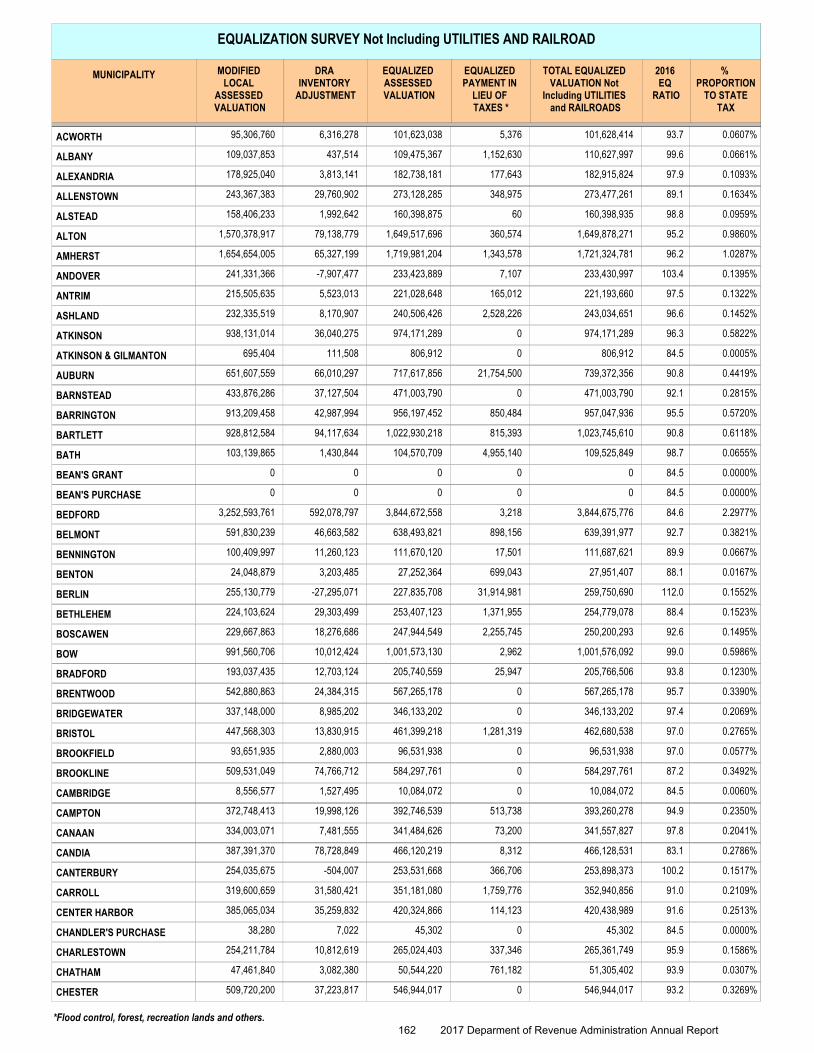
EQUALIZATION SURVEY Not Including UTILITIES AND RAILROAD
MODIFIED LOCAL
ASSESSED VALUATION
DRA INVENTORY
ADJUSTMENT
EQUALIZED ASSESSED VALUATION
EQUALIZED PAYMENT IN
LIEU OF TAXES *
TOTAL EQUALIZED VALUATION Not
Including UTILITIES and RAILROADS
2016 EQ
RATIO
% PROPORTION
TO STATE TAX
MUNICIPALITY
ACWORTH 6,316,278 101,623,038 101,628,4145,37695,306,760 93.7 0.0607%
ALBANY 437,514 109,475,367 110,627,9971,152,630109,037,853 99.6 0.0661%
ALEXANDRIA 3,813,141 182,738,181 182,915,824177,643178,925,040 97.9 0.1093%
ALLENSTOWN 29,760,902 273,128,285 273,477,261348,975243,367,383 89.1 0.1634%
ALSTEAD 1,992,642 160,398,875 160,398,93560158,406,233 98.8 0.0959%
ALTON 79,138,779 1,649,517,696 1,649,878,271360,5741,570,378,917 95.2 0.9860%
AMHERST 65,327,199 1,719,981,204 1,721,324,7811,343,5781,654,654,005 96.2 1.0287%
ANDOVER -7,907,477 233,423,889 233,430,9977,107241,331,366 103.4 0.1395%
ANTRIM 5,523,013 221,028,648 221,193,660165,012215,505,635 97.5 0.1322%
ASHLAND 8,170,907 240,506,426 243,034,6512,528,226232,335,519 96.6 0.1452%
ATKINSON 36,040,275 974,171,289 974,171,2890938,131,014 96.3 0.5822%
ATKINSON & GILMANTON 111,508 806,912 806,9120695,404 84.5 0.0005%
AUBURN 66,010,297 717,617,856 739,372,35621,754,500651,607,559 90.8 0.4419%
BARNSTEAD 37,127,504 471,003,790 471,003,7900433,876,286 92.1 0.2815%
BARRINGTON 42,987,994 956,197,452 957,047,936850,484913,209,458 95.5 0.5720%
BARTLETT 94,117,634 1,022,930,218 1,023,745,610815,393928,812,584 90.8 0.6118%
BATH 1,430,844 104,570,709 109,525,8494,955,140103,139,865 98.7 0.0655%
BEAN'S GRANT 0 0 000 84.5 0.0000%
BEAN'S PURCHASE 0 0 000 84.5 0.0000%
BEDFORD 592,078,797 3,844,672,558 3,844,675,7763,2183,252,593,761 84.6 2.2977%
BELMONT 46,663,582 638,493,821 639,391,977898,156591,830,239 92.7 0.3821%
BENNINGTON 11,260,123 111,670,120 111,687,62117,501100,409,997 89.9 0.0667%
BENTON 3,203,485 27,252,364 27,951,407699,04324,048,879 88.1 0.0167%
BERLIN -27,295,071 227,835,708 259,750,69031,914,981255,130,779 112.0 0.1552%
BETHLEHEM 29,303,499 253,407,123 254,779,0781,371,955224,103,624 88.4 0.1523%
BOSCAWEN 18,276,686 247,944,549 250,200,2932,255,745229,667,863 92.6 0.1495%
BOW 10,012,424 1,001,573,130 1,001,576,0922,962991,560,706 99.0 0.5986%
BRADFORD 12,703,124 205,740,559 205,766,50625,947193,037,435 93.8 0.1230%
BRENTWOOD 24,384,315 567,265,178 567,265,1780542,880,863 95.7 0.3390%
BRIDGEWATER 8,985,202 346,133,202 346,133,2020337,148,000 97.4 0.2069%
BRISTOL 13,830,915 461,399,218 462,680,5381,281,319447,568,303 97.0 0.2765%
BROOKFIELD 2,880,003 96,531,938 96,531,938093,651,935 97.0 0.0577%
BROOKLINE 74,766,712 584,297,761 584,297,7610509,531,049 87.2 0.3492%
CAMBRIDGE 1,527,495 10,084,072 10,084,07208,556,577 84.5 0.0060%
CAMPTON 19,998,126 392,746,539 393,260,278513,738372,748,413 94.9 0.2350%
CANAAN 7,481,555 341,484,626 341,557,82773,200334,003,071 97.8 0.2041%
CANDIA 78,728,849 466,120,219 466,128,5318,312387,391,370 83.1 0.2786%
CANTERBURY -504,007 253,531,668 253,898,373366,706254,035,675 100.2 0.1517%
CARROLL 31,580,421 351,181,080 352,940,8561,759,776319,600,659 91.0 0.2109%
CENTER HARBOR 35,259,832 420,324,866 420,438,989114,123385,065,034 91.6 0.2513%
CHANDLER'S PURCHASE 7,022 45,302 45,302038,280 84.5 0.0000%
CHARLESTOWN 10,812,619 265,024,403 265,361,749337,346254,211,784 95.9 0.1586%
CHATHAM 3,082,380 50,544,220 51,305,402761,18247,461,840 93.9 0.0307%
CHESTER 37,223,817 546,944,017 546,944,0170509,720,200 93.2 0.3269%
*Flood control, forest, recreation lands and others.
162 2017 Deparment of Revenue Administration Annual Report
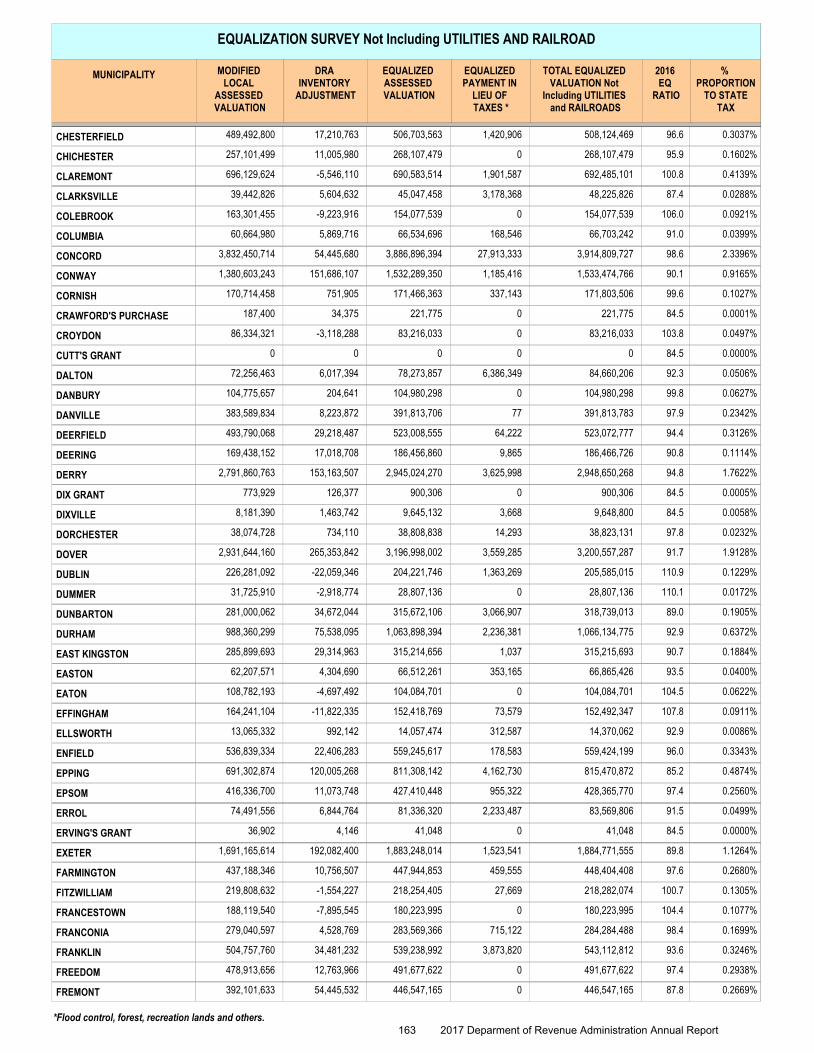
EQUALIZATION SURVEY Not Including UTILITIES AND RAILROAD
MODIFIED LOCAL
ASSESSED VALUATION
DRA INVENTORY
ADJUSTMENT
EQUALIZED ASSESSED VALUATION
EQUALIZED PAYMENT IN
LIEU OF TAXES *
TOTAL EQUALIZED VALUATION Not
Including UTILITIES and RAILROADS
2016 EQ
RATIO
% PROPORTION
TO STATE TAX
MUNICIPALITY
CHESTERFIELD 17,210,763 506,703,563 508,124,4691,420,906489,492,800 96.6 0.3037%
CHICHESTER 11,005,980 268,107,479 268,107,4790257,101,499 95.9 0.1602%
CLAREMONT -5,546,110 690,583,514 692,485,1011,901,587696,129,624 100.8 0.4139%
CLARKSVILLE 5,604,632 45,047,458 48,225,8263,178,36839,442,826 87.4 0.0288%
COLEBROOK -9,223,916 154,077,539 154,077,5390163,301,455 106.0 0.0921%
COLUMBIA 5,869,716 66,534,696 66,703,242168,54660,664,980 91.0 0.0399%
CONCORD 54,445,680 3,886,896,394 3,914,809,72727,913,3333,832,450,714 98.6 2.3396%
CONWAY 151,686,107 1,532,289,350 1,533,474,7661,185,4161,380,603,243 90.1 0.9165%
CORNISH 751,905 171,466,363 171,803,506337,143170,714,458 99.6 0.1027%
CRAWFORD'S PURCHASE 34,375 221,775 221,7750187,400 84.5 0.0001%
CROYDON -3,118,288 83,216,033 83,216,033086,334,321 103.8 0.0497%
CUTT'S GRANT 0 0 000 84.5 0.0000%
DALTON 6,017,394 78,273,857 84,660,2066,386,34972,256,463 92.3 0.0506%
DANBURY 204,641 104,980,298 104,980,2980104,775,657 99.8 0.0627%
DANVILLE 8,223,872 391,813,706 391,813,78377383,589,834 97.9 0.2342%
DEERFIELD 29,218,487 523,008,555 523,072,77764,222493,790,068 94.4 0.3126%
DEERING 17,018,708 186,456,860 186,466,7269,865169,438,152 90.8 0.1114%
DERRY 153,163,507 2,945,024,270 2,948,650,2683,625,9982,791,860,763 94.8 1.7622%
DIX GRANT 126,377 900,306 900,3060773,929 84.5 0.0005%
DIXVILLE 1,463,742 9,645,132 9,648,8003,6688,181,390 84.5 0.0058%
DORCHESTER 734,110 38,808,838 38,823,13114,29338,074,728 97.8 0.0232%
DOVER 265,353,842 3,196,998,002 3,200,557,2873,559,2852,931,644,160 91.7 1.9128%
DUBLIN -22,059,346 204,221,746 205,585,0151,363,269226,281,092 110.9 0.1229%
DUMMER -2,918,774 28,807,136 28,807,136031,725,910 110.1 0.0172%
DUNBARTON 34,672,044 315,672,106 318,739,0133,066,907281,000,062 89.0 0.1905%
DURHAM 75,538,095 1,063,898,394 1,066,134,7752,236,381988,360,299 92.9 0.6372%
EAST KINGSTON 29,314,963 315,214,656 315,215,6931,037285,899,693 90.7 0.1884%
EASTON 4,304,690 66,512,261 66,865,426353,16562,207,571 93.5 0.0400%
EATON -4,697,492 104,084,701 104,084,7010108,782,193 104.5 0.0622%
EFFINGHAM -11,822,335 152,418,769 152,492,34773,579164,241,104 107.8 0.0911%
ELLSWORTH 992,142 14,057,474 14,370,062312,58713,065,332 92.9 0.0086%
ENFIELD 22,406,283 559,245,617 559,424,199178,583536,839,334 96.0 0.3343%
EPPING 120,005,268 811,308,142 815,470,8724,162,730691,302,874 85.2 0.4874%
EPSOM 11,073,748 427,410,448 428,365,770955,322416,336,700 97.4 0.2560%
ERROL 6,844,764 81,336,320 83,569,8062,233,48774,491,556 91.5 0.0499%
ERVING'S GRANT 4,146 41,048 41,048036,902 84.5 0.0000%
EXETER 192,082,400 1,883,248,014 1,884,771,5551,523,5411,691,165,614 89.8 1.1264%
FARMINGTON 10,756,507 447,944,853 448,404,408459,555437,188,346 97.6 0.2680%
FITZWILLIAM -1,554,227 218,254,405 218,282,07427,669219,808,632 100.7 0.1305%
FRANCESTOWN -7,895,545 180,223,995 180,223,9950188,119,540 104.4 0.1077%
FRANCONIA 4,528,769 283,569,366 284,284,488715,122279,040,597 98.4 0.1699%
FRANKLIN 34,481,232 539,238,992 543,112,8123,873,820504,757,760 93.6 0.3246%
FREEDOM 12,763,966 491,677,622 491,677,6220478,913,656 97.4 0.2938%
FREMONT 54,445,532 446,547,165 446,547,1650392,101,633 87.8 0.2669%
*Flood control, forest, recreation lands and others.
163 2017 Deparment of Revenue Administration Annual Report
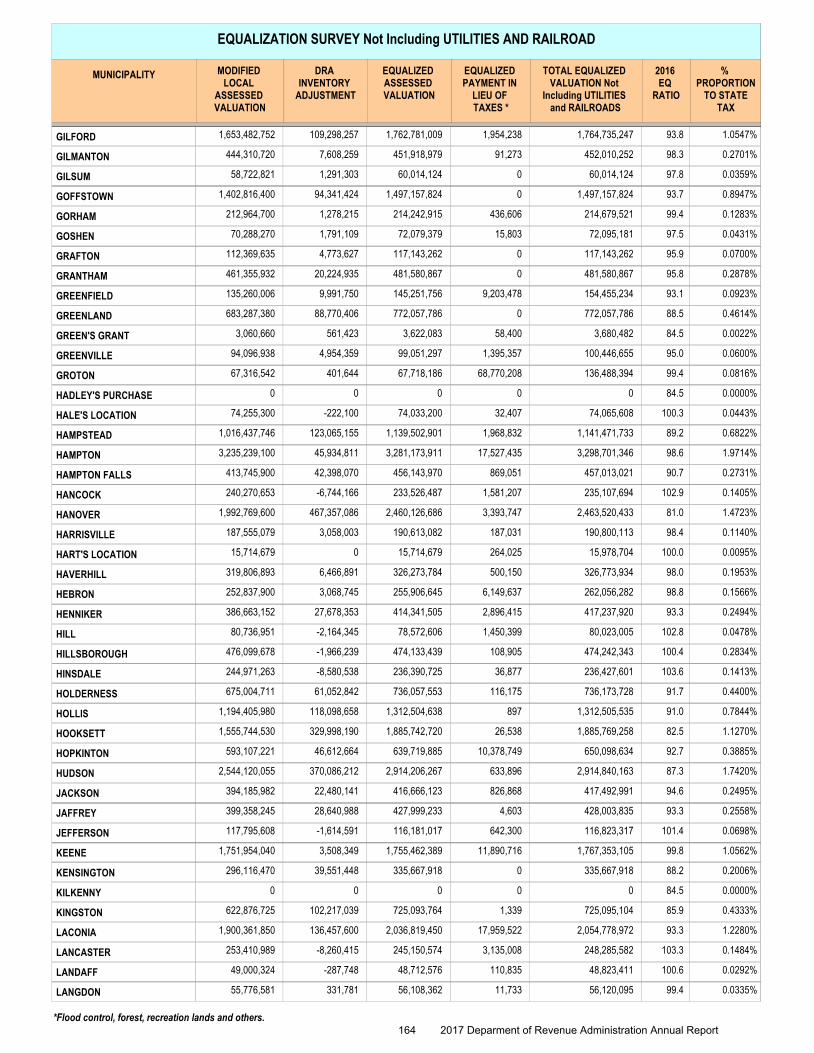
EQUALIZATION SURVEY Not Including UTILITIES AND RAILROAD
MODIFIED LOCAL
ASSESSED VALUATION
DRA INVENTORY
ADJUSTMENT
EQUALIZED ASSESSED VALUATION
EQUALIZED PAYMENT IN
LIEU OF TAXES *
TOTAL EQUALIZED VALUATION Not
Including UTILITIES and RAILROADS
2016 EQ
RATIO
% PROPORTION
TO STATE TAX
MUNICIPALITY
GILFORD 109,298,257 1,762,781,009 1,764,735,2471,954,2381,653,482,752 93.8 1.0547%
GILMANTON 7,608,259 451,918,979 452,010,25291,273444,310,720 98.3 0.2701%
GILSUM 1,291,303 60,014,124 60,014,124058,722,821 97.8 0.0359%
GOFFSTOWN 94,341,424 1,497,157,824 1,497,157,82401,402,816,400 93.7 0.8947%
GORHAM 1,278,215 214,242,915 214,679,521436,606212,964,700 99.4 0.1283%
GOSHEN 1,791,109 72,079,379 72,095,18115,80370,288,270 97.5 0.0431%
GRAFTON 4,773,627 117,143,262 117,143,2620112,369,635 95.9 0.0700%
GRANTHAM 20,224,935 481,580,867 481,580,8670461,355,932 95.8 0.2878%
GREENFIELD 9,991,750 145,251,756 154,455,2349,203,478135,260,006 93.1 0.0923%
GREENLAND 88,770,406 772,057,786 772,057,7860683,287,380 88.5 0.4614%
GREEN'S GRANT 561,423 3,622,083 3,680,48258,4003,060,660 84.5 0.0022%
GREENVILLE 4,954,359 99,051,297 100,446,6551,395,35794,096,938 95.0 0.0600%
GROTON 401,644 67,718,186 136,488,39468,770,20867,316,542 99.4 0.0816%
HADLEY'S PURCHASE 0 0 000 84.5 0.0000%
HALE'S LOCATION -222,100 74,033,200 74,065,60832,40774,255,300 100.3 0.0443%
HAMPSTEAD 123,065,155 1,139,502,901 1,141,471,7331,968,8321,016,437,746 89.2 0.6822%
HAMPTON 45,934,811 3,281,173,911 3,298,701,34617,527,4353,235,239,100 98.6 1.9714%
HAMPTON FALLS 42,398,070 456,143,970 457,013,021869,051413,745,900 90.7 0.2731%
HANCOCK -6,744,166 233,526,487 235,107,6941,581,207240,270,653 102.9 0.1405%
HANOVER 467,357,086 2,460,126,686 2,463,520,4333,393,7471,992,769,600 81.0 1.4723%
HARRISVILLE 3,058,003 190,613,082 190,800,113187,031187,555,079 98.4 0.1140%
HART'S LOCATION 0 15,714,679 15,978,704264,02515,714,679 100.0 0.0095%
HAVERHILL 6,466,891 326,273,784 326,773,934500,150319,806,893 98.0 0.1953%
HEBRON 3,068,745 255,906,645 262,056,2826,149,637252,837,900 98.8 0.1566%
HENNIKER 27,678,353 414,341,505 417,237,9202,896,415386,663,152 93.3 0.2494%
HILL -2,164,345 78,572,606 80,023,0051,450,39980,736,951 102.8 0.0478%
HILLSBOROUGH -1,966,239 474,133,439 474,242,343108,905476,099,678 100.4 0.2834%
HINSDALE -8,580,538 236,390,725 236,427,60136,877244,971,263 103.6 0.1413%
HOLDERNESS 61,052,842 736,057,553 736,173,728116,175675,004,711 91.7 0.4400%
HOLLIS 118,098,658 1,312,504,638 1,312,505,5358971,194,405,980 91.0 0.7844%
HOOKSETT 329,998,190 1,885,742,720 1,885,769,25826,5381,555,744,530 82.5 1.1270%
HOPKINTON 46,612,664 639,719,885 650,098,63410,378,749593,107,221 92.7 0.3885%
HUDSON 370,086,212 2,914,206,267 2,914,840,163633,8962,544,120,055 87.3 1.7420%
JACKSON 22,480,141 416,666,123 417,492,991826,868394,185,982 94.6 0.2495%
JAFFREY 28,640,988 427,999,233 428,003,8354,603399,358,245 93.3 0.2558%
JEFFERSON -1,614,591 116,181,017 116,823,317642,300117,795,608 101.4 0.0698%
KEENE 3,508,349 1,755,462,389 1,767,353,10511,890,7161,751,954,040 99.8 1.0562%
KENSINGTON 39,551,448 335,667,918 335,667,9180296,116,470 88.2 0.2006%
KILKENNY 0 0 000 84.5 0.0000%
KINGSTON 102,217,039 725,093,764 725,095,1041,339622,876,725 85.9 0.4333%
LACONIA 136,457,600 2,036,819,450 2,054,778,97217,959,5221,900,361,850 93.3 1.2280%
LANCASTER -8,260,415 245,150,574 248,285,5823,135,008253,410,989 103.3 0.1484%
LANDAFF -287,748 48,712,576 48,823,411110,83549,000,324 100.6 0.0292%
LANGDON 331,781 56,108,362 56,120,09511,73355,776,581 99.4 0.0335%
*Flood control, forest, recreation lands and others.
164 2017 Deparment of Revenue Administration Annual Report
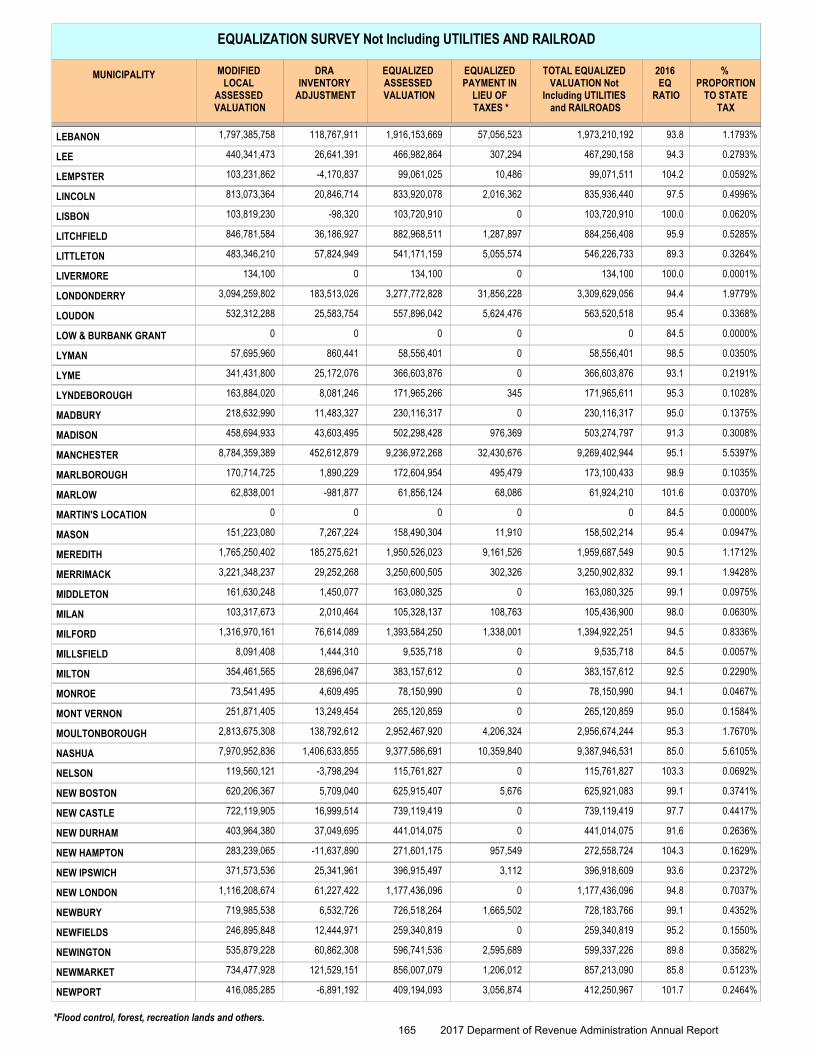
EQUALIZATION SURVEY Not Including UTILITIES AND RAILROAD
MODIFIED LOCAL
ASSESSED VALUATION
DRA INVENTORY
ADJUSTMENT
EQUALIZED ASSESSED VALUATION
EQUALIZED PAYMENT IN
LIEU OF TAXES *
TOTAL EQUALIZED VALUATION Not
Including UTILITIES and RAILROADS
2016 EQ
RATIO
% PROPORTION
TO STATE TAX
MUNICIPALITY
LEBANON 118,767,911 1,916,153,669 1,973,210,19257,056,5231,797,385,758 93.8 1.1793%
LEE 26,641,391 466,982,864 467,290,158307,294440,341,473 94.3 0.2793%
LEMPSTER -4,170,837 99,061,025 99,071,51110,486103,231,862 104.2 0.0592%
LINCOLN 20,846,714 833,920,078 835,936,4402,016,362813,073,364 97.5 0.4996%
LISBON -98,320 103,720,910 103,720,9100103,819,230 100.0 0.0620%
LITCHFIELD 36,186,927 882,968,511 884,256,4081,287,897846,781,584 95.9 0.5285%
LITTLETON 57,824,949 541,171,159 546,226,7335,055,574483,346,210 89.3 0.3264%
LIVERMORE 0 134,100 134,1000134,100 100.0 0.0001%
LONDONDERRY 183,513,026 3,277,772,828 3,309,629,05631,856,2283,094,259,802 94.4 1.9779%
LOUDON 25,583,754 557,896,042 563,520,5185,624,476532,312,288 95.4 0.3368%
LOW & BURBANK GRANT 0 0 000 84.5 0.0000%
LYMAN 860,441 58,556,401 58,556,401057,695,960 98.5 0.0350%
LYME 25,172,076 366,603,876 366,603,8760341,431,800 93.1 0.2191%
LYNDEBOROUGH 8,081,246 171,965,266 171,965,611345163,884,020 95.3 0.1028%
MADBURY 11,483,327 230,116,317 230,116,3170218,632,990 95.0 0.1375%
MADISON 43,603,495 502,298,428 503,274,797976,369458,694,933 91.3 0.3008%
MANCHESTER 452,612,879 9,236,972,268 9,269,402,94432,430,6768,784,359,389 95.1 5.5397%
MARLBOROUGH 1,890,229 172,604,954 173,100,433495,479170,714,725 98.9 0.1035%
MARLOW -981,877 61,856,124 61,924,21068,08662,838,001 101.6 0.0370%
MARTIN'S LOCATION 0 0 000 84.5 0.0000%
MASON 7,267,224 158,490,304 158,502,21411,910151,223,080 95.4 0.0947%
MEREDITH 185,275,621 1,950,526,023 1,959,687,5499,161,5261,765,250,402 90.5 1.1712%
MERRIMACK 29,252,268 3,250,600,505 3,250,902,832302,3263,221,348,237 99.1 1.9428%
MIDDLETON 1,450,077 163,080,325 163,080,3250161,630,248 99.1 0.0975%
MILAN 2,010,464 105,328,137 105,436,900108,763103,317,673 98.0 0.0630%
MILFORD 76,614,089 1,393,584,250 1,394,922,2511,338,0011,316,970,161 94.5 0.8336%
MILLSFIELD 1,444,310 9,535,718 9,535,71808,091,408 84.5 0.0057%
MILTON 28,696,047 383,157,612 383,157,6120354,461,565 92.5 0.2290%
MONROE 4,609,495 78,150,990 78,150,990073,541,495 94.1 0.0467%
MONT VERNON 13,249,454 265,120,859 265,120,8590251,871,405 95.0 0.1584%
MOULTONBOROUGH 138,792,612 2,952,467,920 2,956,674,2444,206,3242,813,675,308 95.3 1.7670%
NASHUA 1,406,633,855 9,377,586,691 9,387,946,53110,359,8407,970,952,836 85.0 5.6105%
NELSON -3,798,294 115,761,827 115,761,8270119,560,121 103.3 0.0692%
NEW BOSTON 5,709,040 625,915,407 625,921,0835,676620,206,367 99.1 0.3741%
NEW CASTLE 16,999,514 739,119,419 739,119,4190722,119,905 97.7 0.4417%
NEW DURHAM 37,049,695 441,014,075 441,014,0750403,964,380 91.6 0.2636%
NEW HAMPTON -11,637,890 271,601,175 272,558,724957,549283,239,065 104.3 0.1629%
NEW IPSWICH 25,341,961 396,915,497 396,918,6093,112371,573,536 93.6 0.2372%
NEW LONDON 61,227,422 1,177,436,096 1,177,436,09601,116,208,674 94.8 0.7037%
NEWBURY 6,532,726 726,518,264 728,183,7661,665,502719,985,538 99.1 0.4352%
NEWFIELDS 12,444,971 259,340,819 259,340,8190246,895,848 95.2 0.1550%
NEWINGTON 60,862,308 596,741,536 599,337,2262,595,689535,879,228 89.8 0.3582%
NEWMARKET 121,529,151 856,007,079 857,213,0901,206,012734,477,928 85.8 0.5123%
NEWPORT -6,891,192 409,194,093 412,250,9673,056,874416,085,285 101.7 0.2464%
*Flood control, forest, recreation lands and others.
165 2017 Deparment of Revenue Administration Annual Report
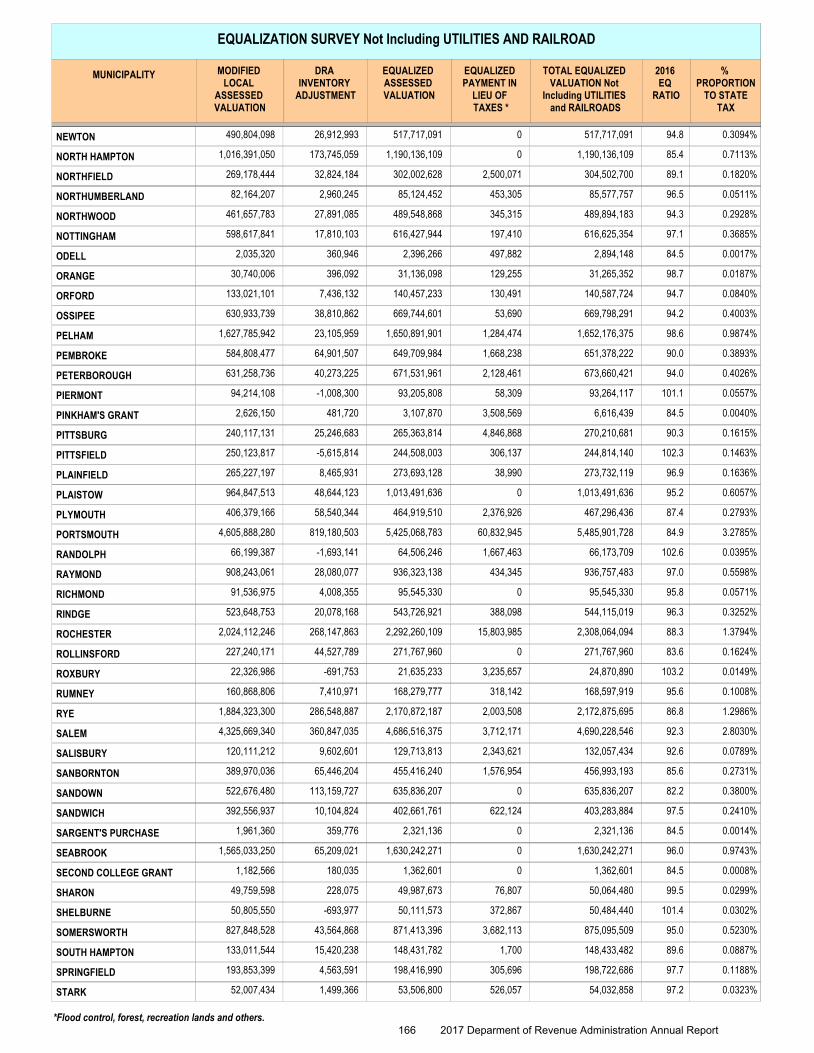
EQUALIZATION SURVEY Not Including UTILITIES AND RAILROAD
MODIFIED LOCAL
ASSESSED VALUATION
DRA INVENTORY
ADJUSTMENT
EQUALIZED ASSESSED VALUATION
EQUALIZED PAYMENT IN
LIEU OF TAXES *
TOTAL EQUALIZED VALUATION Not
Including UTILITIES and RAILROADS
2016 EQ
RATIO
% PROPORTION
TO STATE TAX
MUNICIPALITY
NEWTON 26,912,993 517,717,091 517,717,0910490,804,098 94.8 0.3094%
NORTH HAMPTON 173,745,059 1,190,136,109 1,190,136,10901,016,391,050 85.4 0.7113%
NORTHFIELD 32,824,184 302,002,628 304,502,7002,500,071269,178,444 89.1 0.1820%
NORTHUMBERLAND 2,960,245 85,124,452 85,577,757453,30582,164,207 96.5 0.0511%
NORTHWOOD 27,891,085 489,548,868 489,894,183345,315461,657,783 94.3 0.2928%
NOTTINGHAM 17,810,103 616,427,944 616,625,354197,410598,617,841 97.1 0.3685%
ODELL 360,946 2,396,266 2,894,148497,8822,035,320 84.5 0.0017%
ORANGE 396,092 31,136,098 31,265,352129,25530,740,006 98.7 0.0187%
ORFORD 7,436,132 140,457,233 140,587,724130,491133,021,101 94.7 0.0840%
OSSIPEE 38,810,862 669,744,601 669,798,29153,690630,933,739 94.2 0.4003%
PELHAM 23,105,959 1,650,891,901 1,652,176,3751,284,4741,627,785,942 98.6 0.9874%
PEMBROKE 64,901,507 649,709,984 651,378,2221,668,238584,808,477 90.0 0.3893%
PETERBOROUGH 40,273,225 671,531,961 673,660,4212,128,461631,258,736 94.0 0.4026%
PIERMONT -1,008,300 93,205,808 93,264,11758,30994,214,108 101.1 0.0557%
PINKHAM'S GRANT 481,720 3,107,870 6,616,4393,508,5692,626,150 84.5 0.0040%
PITTSBURG 25,246,683 265,363,814 270,210,6814,846,868240,117,131 90.3 0.1615%
PITTSFIELD -5,615,814 244,508,003 244,814,140306,137250,123,817 102.3 0.1463%
PLAINFIELD 8,465,931 273,693,128 273,732,11938,990265,227,197 96.9 0.1636%
PLAISTOW 48,644,123 1,013,491,636 1,013,491,6360964,847,513 95.2 0.6057%
PLYMOUTH 58,540,344 464,919,510 467,296,4362,376,926406,379,166 87.4 0.2793%
PORTSMOUTH 819,180,503 5,425,068,783 5,485,901,72860,832,9454,605,888,280 84.9 3.2785%
RANDOLPH -1,693,141 64,506,246 66,173,7091,667,46366,199,387 102.6 0.0395%
RAYMOND 28,080,077 936,323,138 936,757,483434,345908,243,061 97.0 0.5598%
RICHMOND 4,008,355 95,545,330 95,545,330091,536,975 95.8 0.0571%
RINDGE 20,078,168 543,726,921 544,115,019388,098523,648,753 96.3 0.3252%
ROCHESTER 268,147,863 2,292,260,109 2,308,064,09415,803,9852,024,112,246 88.3 1.3794%
ROLLINSFORD 44,527,789 271,767,960 271,767,9600227,240,171 83.6 0.1624%
ROXBURY -691,753 21,635,233 24,870,8903,235,65722,326,986 103.2 0.0149%
RUMNEY 7,410,971 168,279,777 168,597,919318,142160,868,806 95.6 0.1008%
RYE 286,548,887 2,170,872,187 2,172,875,6952,003,5081,884,323,300 86.8 1.2986%
SALEM 360,847,035 4,686,516,375 4,690,228,5463,712,1714,325,669,340 92.3 2.8030%
SALISBURY 9,602,601 129,713,813 132,057,4342,343,621120,111,212 92.6 0.0789%
SANBORNTON 65,446,204 455,416,240 456,993,1931,576,954389,970,036 85.6 0.2731%
SANDOWN 113,159,727 635,836,207 635,836,2070522,676,480 82.2 0.3800%
SANDWICH 10,104,824 402,661,761 403,283,884622,124392,556,937 97.5 0.2410%
SARGENT'S PURCHASE 359,776 2,321,136 2,321,13601,961,360 84.5 0.0014%
SEABROOK 65,209,021 1,630,242,271 1,630,242,27101,565,033,250 96.0 0.9743%
SECOND COLLEGE GRANT 180,035 1,362,601 1,362,60101,182,566 84.5 0.0008%
SHARON 228,075 49,987,673 50,064,48076,80749,759,598 99.5 0.0299%
SHELBURNE -693,977 50,111,573 50,484,440372,86750,805,550 101.4 0.0302%
SOMERSWORTH 43,564,868 871,413,396 875,095,5093,682,113827,848,528 95.0 0.5230%
SOUTH HAMPTON 15,420,238 148,431,782 148,433,4821,700133,011,544 89.6 0.0887%
SPRINGFIELD 4,563,591 198,416,990 198,722,686305,696193,853,399 97.7 0.1188%
STARK 1,499,366 53,506,800 54,032,858526,05752,007,434 97.2 0.0323%
*Flood control, forest, recreation lands and others.
166 2017 Deparment of Revenue Administration Annual Report
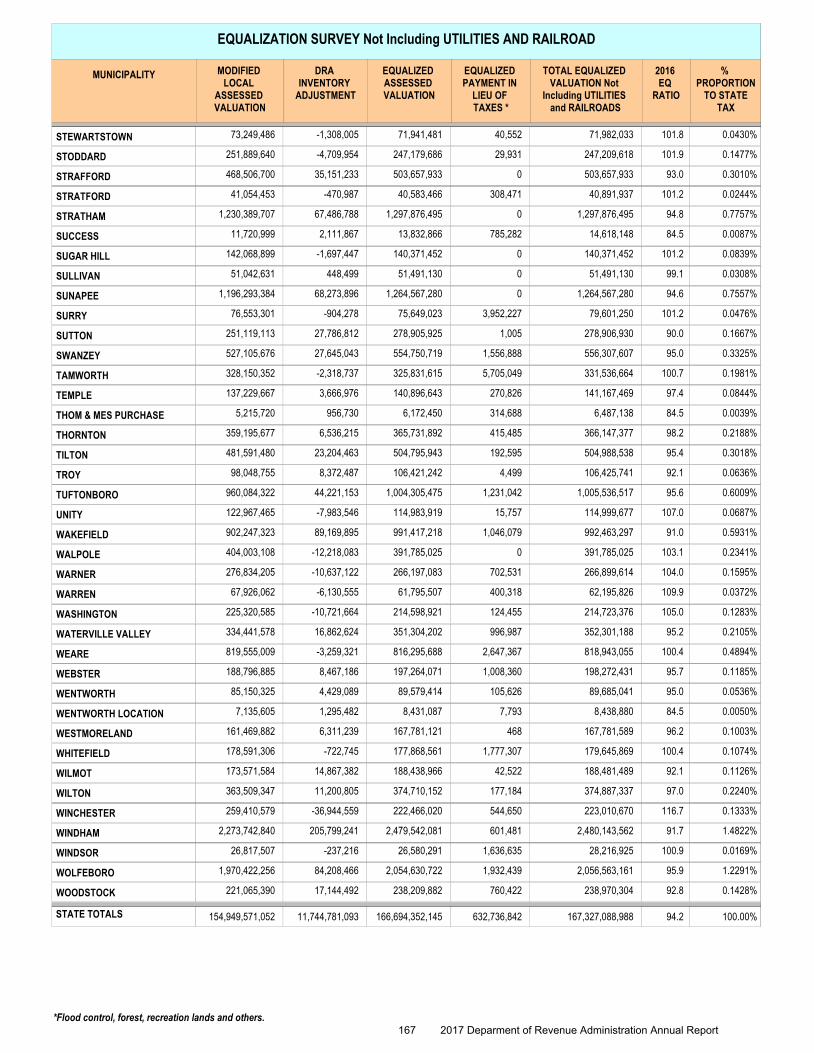
EQUALIZATION SURVEY Not Including UTILITIES AND RAILROAD
MODIFIED LOCAL
ASSESSED VALUATION
DRA INVENTORY
ADJUSTMENT
EQUALIZED ASSESSED VALUATION
EQUALIZED PAYMENT IN
LIEU OF TAXES *
TOTAL EQUALIZED VALUATION Not
Including UTILITIES and RAILROADS
2016 EQ
RATIO
% PROPORTION
TO STATE TAX
MUNICIPALITY
STEWARTSTOWN -1,308,005 71,941,481 71,982,03340,55273,249,486 101.8 0.0430%
STODDARD -4,709,954 247,179,686 247,209,61829,931251,889,640 101.9 0.1477%
STRAFFORD 35,151,233 503,657,933 503,657,9330468,506,700 93.0 0.3010%
STRATFORD -470,987 40,583,466 40,891,937308,47141,054,453 101.2 0.0244%
STRATHAM 67,486,788 1,297,876,495 1,297,876,49501,230,389,707 94.8 0.7757%
SUCCESS 2,111,867 13,832,866 14,618,148785,28211,720,999 84.5 0.0087%
SUGAR HILL -1,697,447 140,371,452 140,371,4520142,068,899 101.2 0.0839%
SULLIVAN 448,499 51,491,130 51,491,130051,042,631 99.1 0.0308%
SUNAPEE 68,273,896 1,264,567,280 1,264,567,28001,196,293,384 94.6 0.7557%
SURRY -904,278 75,649,023 79,601,2503,952,22776,553,301 101.2 0.0476%
SUTTON 27,786,812 278,905,925 278,906,9301,005251,119,113 90.0 0.1667%
SWANZEY 27,645,043 554,750,719 556,307,6071,556,888527,105,676 95.0 0.3325%
TAMWORTH -2,318,737 325,831,615 331,536,6645,705,049328,150,352 100.7 0.1981%
TEMPLE 3,666,976 140,896,643 141,167,469270,826137,229,667 97.4 0.0844%
THOM & MES PURCHASE 956,730 6,172,450 6,487,138314,6885,215,720 84.5 0.0039%
THORNTON 6,536,215 365,731,892 366,147,377415,485359,195,677 98.2 0.2188%
TILTON 23,204,463 504,795,943 504,988,538192,595481,591,480 95.4 0.3018%
TROY 8,372,487 106,421,242 106,425,7414,49998,048,755 92.1 0.0636%
TUFTONBORO 44,221,153 1,004,305,475 1,005,536,5171,231,042960,084,322 95.6 0.6009%
UNITY -7,983,546 114,983,919 114,999,67715,757122,967,465 107.0 0.0687%
WAKEFIELD 89,169,895 991,417,218 992,463,2971,046,079902,247,323 91.0 0.5931%
WALPOLE -12,218,083 391,785,025 391,785,0250404,003,108 103.1 0.2341%
WARNER -10,637,122 266,197,083 266,899,614702,531276,834,205 104.0 0.1595%
WARREN -6,130,555 61,795,507 62,195,826400,31867,926,062 109.9 0.0372%
WASHINGTON -10,721,664 214,598,921 214,723,376124,455225,320,585 105.0 0.1283%
WATERVILLE VALLEY 16,862,624 351,304,202 352,301,188996,987334,441,578 95.2 0.2105%
WEARE -3,259,321 816,295,688 818,943,0552,647,367819,555,009 100.4 0.4894%
WEBSTER 8,467,186 197,264,071 198,272,4311,008,360188,796,885 95.7 0.1185%
WENTWORTH 4,429,089 89,579,414 89,685,041105,62685,150,325 95.0 0.0536%
WENTWORTH LOCATION 1,295,482 8,431,087 8,438,8807,7937,135,605 84.5 0.0050%
WESTMORELAND 6,311,239 167,781,121 167,781,589468161,469,882 96.2 0.1003%
WHITEFIELD -722,745 177,868,561 179,645,8691,777,307178,591,306 100.4 0.1074%
WILMOT 14,867,382 188,438,966 188,481,48942,522173,571,584 92.1 0.1126%
WILTON 11,200,805 374,710,152 374,887,337177,184363,509,347 97.0 0.2240%
WINCHESTER -36,944,559 222,466,020 223,010,670544,650259,410,579 116.7 0.1333%
WINDHAM 205,799,241 2,479,542,081 2,480,143,562601,4812,273,742,840 91.7 1.4822%
WINDSOR -237,216 26,580,291 28,216,9251,636,63526,817,507 100.9 0.0169%
WOLFEBORO 84,208,466 2,054,630,722 2,056,563,1611,932,4391,970,422,256 95.9 1.2291%
WOODSTOCK 17,144,492 238,209,882 238,970,304760,422221,065,390 92.8 0.1428%
94.2STATE TOTALS 154,949,571,052 11,744,781,093 166,694,352,145 632,736,842 167,327,088,988 100.00%
*Flood control, forest, recreation lands and others.
167 2017 Deparment of Revenue Administration Annual Report
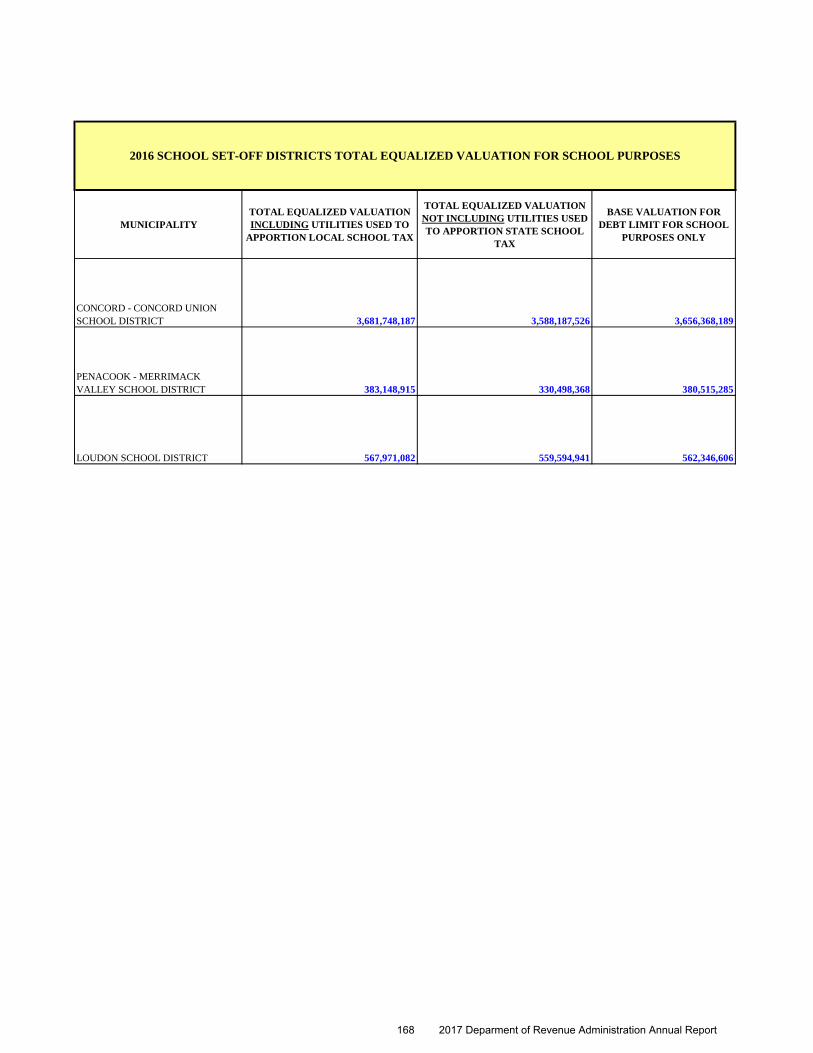
MUNICIPALITYTOTAL EQUALIZED VALUATION INCLUDING UTILITIES USED TO
APPORTION LOCAL SCHOOL TAX
TOTAL EQUALIZED VALUATION NOT INCLUDING UTILITIES USED TO APPORTION STATE SCHOOL
TAX
BASE VALUATION FOR DEBT LIMIT FOR SCHOOL
PURPOSES ONLY
CONCORD - CONCORD UNION SCHOOL DISTRICT 3,681,748,187 3,588,187,526 3,656,368,189
PENACOOK - MERRIMACK VALLEY SCHOOL DISTRICT 383,148,915 330,498,368 380,515,285
LOUDON SCHOOL DISTRICT 567,971,082 559,594,941 562,346,606
2016 SCHOOL SET-OFF DISTRICTS TOTAL EQUALIZED VALUATION FOR SCHOOL PURPOSES
168 2017 Deparment of Revenue Administration Annual Report
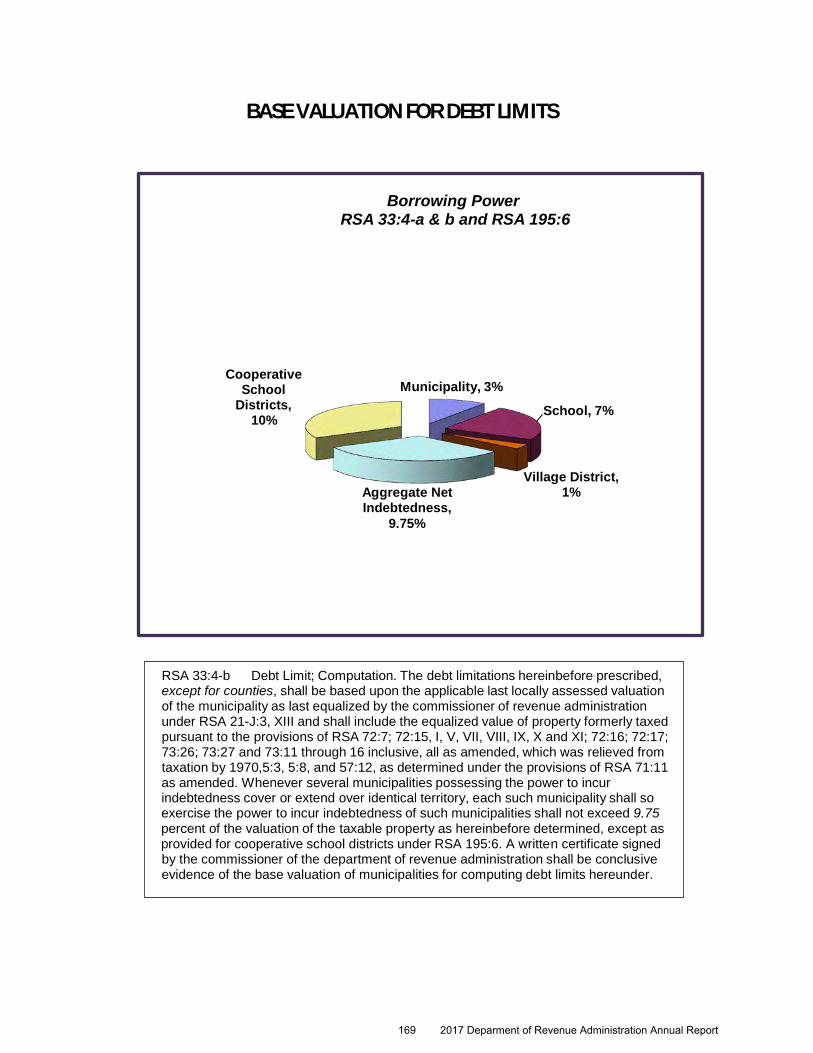
BASE VALUATION FOR DEBT LIMITS
Borrowing Power RSA 33:4-a & b and RSA 195:6
Cooperative School
Districts, 10%
Municipality, 3%
Aggregate Net Indebtedness,
9.75%
School, 7% Village District,
1%
RSA 33:4-b Debt Limit; Computation. The debt limitations hereinbefore prescribed, except for counties, shall be based upon the applicable last locally assessed valuation of the municipality as last equalized by the commissioner of revenue administration under RSA 21-J:3, XIII and shall include the equalized value of property formerly taxed pursuant to the provisions of RSA 72:7; 72:15, I, V, VII, VIII, IX, X and XI; 72:16; 72:17; 73:26; 73:27 and 73:11 through 16 inclusive, all as amended, which was relieved from taxation by 1970,5:3, 5:8, and 57:12, as determined under the provisions of RSA 71:11 as amended. Whenever several municipalities possessing the power to incur indebtedness cover or extend over identical territory, each such municipality shall so exercise the power to incur indebtedness of such municipalities shall not exceed 9.75 percent of the valuation of the taxable property as hereinbefore determined, except as provided for cooperative school districts under RSA 195:6. A written certificate signed by the commissioner of the department of revenue administration shall be conclusive evidence of the base valuation of municipalities for computing debt limits hereunder.
169 2017 Deparment of Revenue Administration Annual Report

MODIFIED
LOCAL
ASSESSED
VALUATION
DRA
INVENTORY
ADJUSTMENT
EQUALIZED
ASSESSED
VALUATION
SHARED
REVENUES
ADJUSTMENT
RSA 31-A
BASE
VALUATION
FOR DEBT
LIMITS
MUNICIPALITY
2016 BASE VALUATION FOR DEBT LIMITS ~ By MUNICIPALITY
ACWORTH 97,461,518 6,316,454 103,777,972 0 103,777,972ALBANY 111,782,153 437,527 112,219,680 0 112,219,680ALEXANDRIA 200,583,640 -6,883,460 193,700,180 0 193,700,180ALLENSTOWN 251,423,283 27,087,681 278,510,964 0 278,510,964ALSTEAD 161,870,233 2,152,174 164,022,407 0 164,022,407ALTON 1,577,858,917 79,291,441 1,657,150,358 0 1,657,150,358AMHERST 1,703,627,205 52,993,570 1,756,620,775 0 1,756,620,775ANDOVER 253,673,666 -14,764,239 238,909,427 0 238,909,427ANTRIM 227,463,075 960,123 228,423,198 0 228,423,198ASHLAND 237,394,875 7,374,584 244,769,459 0 244,769,459ATKINSON 947,632,914 36,252,264 983,885,178 0 983,885,178ATKINSON & GILMANTON 695,404 111,508 806,912 0 806,912AUBURN 659,600,259 63,859,941 723,460,200 0 723,460,200BARNSTEAD 442,932,468 36,947,816 479,880,284 0 479,880,284BARRINGTON 923,669,758 43,857,542 967,527,300 0 967,527,300BARTLETT 935,932,584 94,825,241 1,030,757,825 0 1,030,757,825BATH 121,057,765 -11,436,650 109,621,115 0 109,621,115BEAN'S GRANT 509 57 566 0 566BEAN'S PURCHASE 0 0 0 0 0BEDFORD 3,294,309,561 593,256,329 3,887,565,890 0 3,887,565,890BELMONT 601,249,886 47,117,519 648,367,405 0 648,367,405BENNINGTON 104,046,397 9,348,722 113,395,119 0 113,395,119BENTON 25,080,079 3,181,285 28,261,364 0 28,261,364BERLIN 397,452,679 -114,402,996 283,049,683 0 283,049,683BETHLEHEM 230,545,605 29,270,927 259,816,532 0 259,816,532BOSCAWEN 236,407,763 17,560,911 253,968,674 0 253,968,674BOW 1,173,341,506 52,149,732 1,225,491,238 0 1,225,491,238BRADFORD 197,953,935 10,295,687 208,249,622 0 208,249,622BRENTWOOD 565,425,663 12,445,461 577,871,124 0 577,871,124BRIDGEWATER 344,129,700 10,244,164 354,373,864 0 354,373,864BRISTOL 469,206,603 1,776,828 470,983,431 0 470,983,431BROOKFIELD 95,012,335 2,707,445 97,719,780 0 97,719,780BROOKLINE 517,780,849 71,869,226 589,650,075 0 589,650,075CAMBRIDGE 8,721,492 1,546,024 10,267,516 0 10,267,516CAMPTON 381,468,513 21,546,090 403,014,603 0 403,014,603CANAAN 341,996,171 4,773,345 346,769,516 0 346,769,516CANDIA 394,646,286 79,325,575 473,971,861 0 473,971,861CANTERBURY 260,193,775 -520,537 259,673,238 0 259,673,238CARROLL 322,834,920 31,608,321 354,443,241 0 354,443,241CENTER HARBOR 386,746,034 35,533,831 422,279,865 0 422,279,865CHANDLER'S PURCHASE 40,376 7,258 47,634 0 47,634CHARLESTOWN 281,348,984 -1,718,120 279,630,864 0 279,630,864CHATHAM 48,265,140 3,088,687 51,353,827 0 51,353,827CHESTER 553,595,100 17,189,448 570,784,548 0 570,784,548CHESTERFIELD 494,595,419 17,646,759 512,242,178 0 512,242,178CHICHESTER 261,680,499 11,076,027 272,756,526 0 272,756,526CLAREMONT 710,258,424 -5,930,631 704,327,793 0 704,327,793CLARKSVILLE 40,986,926 5,615,330 46,602,256 0 46,602,256
170 2017 Deparment of Revenue Administration Annual Report

MODIFIED
LOCAL
ASSESSED
VALUATION
DRA
INVENTORY
ADJUSTMENT
EQUALIZED
ASSESSED
VALUATION
SHARED
REVENUES
ADJUSTMENT
RSA 31-A
BASE
VALUATION
FOR DEBT
LIMITS
MUNICIPALITY
2016 BASE VALUATION FOR DEBT LIMITS ~ By MUNICIPALITY
COLEBROOK 179,011,355 -12,377,227 166,634,128 0 166,634,128COLUMBIA 85,633,380 -4,269,354 81,364,026 0 81,364,026CONCORD 4,002,967,914 30,039,393 4,033,007,307 0 4,033,007,307CONWAY 1,433,426,343 140,858,803 1,574,285,146 0 1,574,285,146CORNISH 176,269,458 -994,812 175,274,646 0 175,274,646CRAWFORD'S PURCHASE 187,758 34,415 222,173 0 222,173CROYDON 88,744,821 -4,386,419 84,358,402 0 84,358,402CUTT'S GRANT 0 0 0 0 0DALTON 76,286,463 3,653,149 79,939,612 0 79,939,612DANBURY 107,013,937 204,643 107,218,580 0 107,218,580DANVILLE 392,689,734 6,656,702 399,346,436 0 399,346,436DEERFIELD 563,632,768 -733,678 562,899,090 0 562,899,090DEERING 179,770,752 14,184,832 193,955,584 0 193,955,584DERRY 2,833,341,580 152,645,904 2,985,987,484 0 2,985,987,484DIX GRANT 773,929 126,377 900,306 0 900,306DIXVILLE 8,320,143 24,237,530 32,557,673 0 32,557,673DORCHESTER 38,810,028 731,570 39,541,598 0 39,541,598DOVER 2,991,001,960 261,896,717 3,252,898,677 0 3,252,898,677DUBLIN 230,289,892 -23,854,578 206,435,314 0 206,435,314DUMMER 75,409,010 -9,968,473 65,440,537 0 65,440,537DUNBARTON 302,935,262 19,125,134 322,060,396 0 322,060,396DURHAM 1,016,683,899 61,182,597 1,077,866,496 0 1,077,866,496EAST KINGSTON 311,190,593 18,131,959 329,322,552 0 329,322,552EASTON 63,087,871 4,304,671 67,392,542 0 67,392,542EATON 109,837,993 -4,754,197 105,083,796 0 105,083,796EFFINGHAM 170,325,004 -15,151,205 155,173,799 0 155,173,799ELLSWORTH 13,449,932 883,590 14,333,522 0 14,333,522ENFIELD 543,592,734 23,003,912 566,596,646 0 566,596,646EPPING 706,425,774 111,779,203 818,204,977 0 818,204,977EPSOM 425,254,200 7,380,416 432,634,616 0 432,634,616ERROL 86,883,356 -577,073 86,306,283 0 86,306,283ERVING'S GRANT 36,902 41,734 78,636 0 78,636EXETER 1,729,679,814 193,682,721 1,923,362,535 0 1,923,362,535FARMINGTON 450,346,546 4,662,692 455,009,238 0 455,009,238FITZWILLIAM 254,000,732 -5,814,542 248,186,190 0 248,186,190FRANCESTOWN 191,875,340 -9,575,101 182,300,239 0 182,300,239FRANCONIA 284,280,597 1,985,629 286,266,226 0 286,266,226FRANKLIN 542,177,660 33,682,911 575,860,571 0 575,860,571FREEDOM 483,254,456 12,707,566 495,962,022 0 495,962,022FREMONT 400,985,833 49,605,720 450,591,553 0 450,591,553GILFORD 1,662,334,122 109,988,450 1,772,322,572 0 1,772,322,572GILMANTON 453,782,020 2,874,976 456,656,996 0 456,656,996GILSUM 61,027,121 359,248 61,386,369 0 61,386,369GOFFSTOWN 1,459,249,100 75,815,361 1,535,064,461 0 1,535,064,461GORHAM 273,762,000 -33,226,133 240,535,867 0 240,535,867GOSHEN 72,028,938 1,770,467 73,799,405 0 73,799,405GRAFTON 115,897,035 3,224,037 119,121,072 0 119,121,072GRANTHAM 466,452,232 18,388,780 484,841,012 0 484,841,012
171 2017 Deparment of Revenue Administration Annual Report

MODIFIED
LOCAL
ASSESSED
VALUATION
DRA
INVENTORY
ADJUSTMENT
EQUALIZED
ASSESSED
VALUATION
SHARED
REVENUES
ADJUSTMENT
RSA 31-A
BASE
VALUATION
FOR DEBT
LIMITS
MUNICIPALITY
2016 BASE VALUATION FOR DEBT LIMITS ~ By MUNICIPALITY
GREENFIELD 138,393,706 8,903,070 147,296,776 0 147,296,776GREENLAND 705,105,116 87,566,042 792,671,158 0 792,671,158GREEN'S GRANT 3,129,477 569,154 3,698,631 0 3,698,631GREENVILLE 97,595,138 3,872,131 101,467,269 0 101,467,269GROTON 79,159,602 -7,650,728 71,508,874 0 71,508,874HADLEY'S PURCHASE 0 0 0 0 0HALE'S LOCATION 74,454,500 -202,722 74,251,778 0 74,251,778HAMPSTEAD 1,031,576,646 115,959,430 1,147,536,076 0 1,147,536,076HAMPTON 3,335,308,100 21,745,804 3,357,053,904 0 3,357,053,904HAMPTON FALLS 420,011,775 42,665,087 462,676,862 0 462,676,862HANCOCK 247,659,753 -9,848,464 237,811,289 0 237,811,289HANOVER 2,004,552,200 467,148,846 2,471,701,046 0 2,471,701,046HARRISVILLE 189,658,379 2,472,964 192,131,343 0 192,131,343HART'S LOCATION 16,133,579 25 16,133,604 0 16,133,604HAVERHILL 345,742,793 -11,321,177 334,421,616 0 334,421,616HEBRON 258,297,700 -283,422 258,014,278 0 258,014,278HENNIKER 399,199,052 21,402,349 420,601,401 0 420,601,401HILL 89,851,251 -7,606,834 82,244,417 0 82,244,417HILLSBOROUGH 513,568,408 -19,232,601 494,335,807 0 494,335,807HINSDALE 355,317,063 -21,387,458 333,929,605 0 333,929,605HOLDERNESS 688,311,271 60,761,701 749,072,972 0 749,072,972HOLLIS 1,212,504,780 108,549,702 1,321,054,482 0 1,321,054,482HOOKSETT 1,621,272,530 330,320,514 1,951,593,044 0 1,951,593,044HOPKINTON 620,426,021 31,412,928 651,838,949 0 651,838,949HUDSON 2,676,063,055 296,437,993 2,972,501,048 0 2,972,501,048JACKSON 396,251,282 22,484,457 418,735,739 0 418,735,739JAFFREY 407,483,245 28,979,487 436,462,732 0 436,462,732JEFFERSON 122,796,008 -4,212,917 118,583,091 0 118,583,091KEENE 1,825,508,640 -33,212,037 1,792,296,603 0 1,792,296,603KENSINGTON 306,265,316 38,214,515 344,479,831 0 344,479,831KILKENNY 747 84 831 0 831KINGSTON 662,284,825 95,830,483 758,115,308 0 758,115,308LACONIA 1,932,198,550 136,159,825 2,068,358,375 0 2,068,358,375LANCASTER 270,675,289 -18,486,482 252,188,807 0 252,188,807LANDAFF 50,784,824 -1,187,463 49,597,361 0 49,597,361LANGDON 56,932,381 754,574 57,686,955 0 57,686,955LEBANON 1,880,676,558 111,479,714 1,992,156,272 0 1,992,156,272LEE 446,745,073 26,908,281 473,653,354 0 473,653,354LEMPSTER 148,500,562 -14,951,246 133,549,316 0 133,549,316LINCOLN 836,406,864 769,440 837,176,304 0 837,176,304LISBON 107,331,430 -438,437 106,892,993 0 106,892,993LITCHFIELD 886,206,984 19,102,128 905,309,112 0 905,309,112LITTLETON 725,425,210 -72,549,985 652,875,225 0 652,875,225LIVERMORE 134,100 0 134,100 0 134,100LONDONDERRY 3,785,041,790 62,417,799 3,847,459,589 0 3,847,459,589LOUDON 547,279,088 18,942,721 566,221,809 0 566,221,809LOW & BURBANK GRANT 0 0 0 0 0LYMAN 58,982,060 812,772 59,794,832 0 59,794,832
172 2017 Deparment of Revenue Administration Annual Report
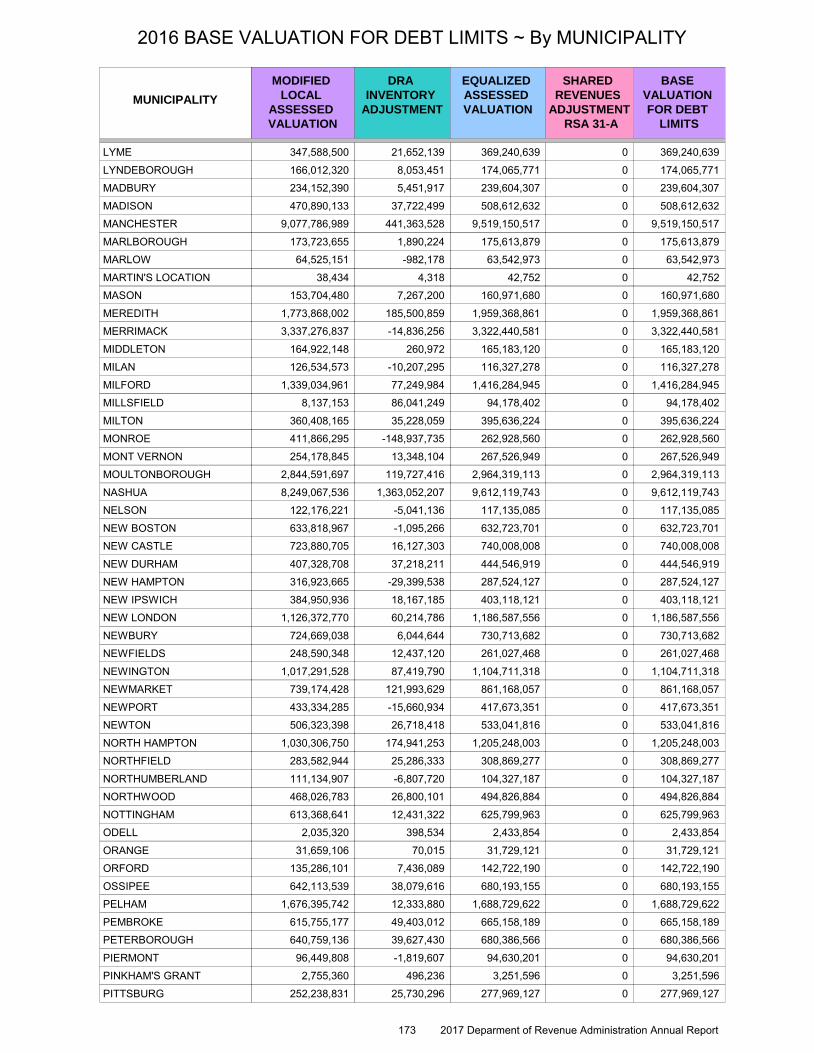
MODIFIED
LOCAL
ASSESSED
VALUATION
DRA
INVENTORY
ADJUSTMENT
EQUALIZED
ASSESSED
VALUATION
SHARED
REVENUES
ADJUSTMENT
RSA 31-A
BASE
VALUATION
FOR DEBT
LIMITS
MUNICIPALITY
2016 BASE VALUATION FOR DEBT LIMITS ~ By MUNICIPALITY
LYME 347,588,500 21,652,139 369,240,639 0 369,240,639LYNDEBOROUGH 166,012,320 8,053,451 174,065,771 0 174,065,771MADBURY 234,152,390 5,451,917 239,604,307 0 239,604,307MADISON 470,890,133 37,722,499 508,612,632 0 508,612,632MANCHESTER 9,077,786,989 441,363,528 9,519,150,517 0 9,519,150,517MARLBOROUGH 173,723,655 1,890,224 175,613,879 0 175,613,879MARLOW 64,525,151 -982,178 63,542,973 0 63,542,973MARTIN'S LOCATION 38,434 4,318 42,752 0 42,752MASON 153,704,480 7,267,200 160,971,680 0 160,971,680MEREDITH 1,773,868,002 185,500,859 1,959,368,861 0 1,959,368,861MERRIMACK 3,337,276,837 -14,836,256 3,322,440,581 0 3,322,440,581MIDDLETON 164,922,148 260,972 165,183,120 0 165,183,120MILAN 126,534,573 -10,207,295 116,327,278 0 116,327,278MILFORD 1,339,034,961 77,249,984 1,416,284,945 0 1,416,284,945MILLSFIELD 8,137,153 86,041,249 94,178,402 0 94,178,402MILTON 360,408,165 35,228,059 395,636,224 0 395,636,224MONROE 411,866,295 -148,937,735 262,928,560 0 262,928,560MONT VERNON 254,178,845 13,348,104 267,526,949 0 267,526,949MOULTONBOROUGH 2,844,591,697 119,727,416 2,964,319,113 0 2,964,319,113NASHUA 8,249,067,536 1,363,052,207 9,612,119,743 0 9,612,119,743NELSON 122,176,221 -5,041,136 117,135,085 0 117,135,085NEW BOSTON 633,818,967 -1,095,266 632,723,701 0 632,723,701NEW CASTLE 723,880,705 16,127,303 740,008,008 0 740,008,008NEW DURHAM 407,328,708 37,218,211 444,546,919 0 444,546,919NEW HAMPTON 316,923,665 -29,399,538 287,524,127 0 287,524,127NEW IPSWICH 384,950,936 18,167,185 403,118,121 0 403,118,121NEW LONDON 1,126,372,770 60,214,786 1,186,587,556 0 1,186,587,556NEWBURY 724,669,038 6,044,644 730,713,682 0 730,713,682NEWFIELDS 248,590,348 12,437,120 261,027,468 0 261,027,468NEWINGTON 1,017,291,528 87,419,790 1,104,711,318 0 1,104,711,318NEWMARKET 739,174,428 121,993,629 861,168,057 0 861,168,057NEWPORT 433,334,285 -15,660,934 417,673,351 0 417,673,351NEWTON 506,323,398 26,718,418 533,041,816 0 533,041,816NORTH HAMPTON 1,030,306,750 174,941,253 1,205,248,003 0 1,205,248,003NORTHFIELD 283,582,944 25,286,333 308,869,277 0 308,869,277NORTHUMBERLAND 111,134,907 -6,807,720 104,327,187 0 104,327,187NORTHWOOD 468,026,783 26,800,101 494,826,884 0 494,826,884NOTTINGHAM 613,368,641 12,431,322 625,799,963 0 625,799,963ODELL 2,035,320 398,534 2,433,854 0 2,433,854ORANGE 31,659,106 70,015 31,729,121 0 31,729,121ORFORD 135,286,101 7,436,089 142,722,190 0 142,722,190OSSIPEE 642,113,539 38,079,616 680,193,155 0 680,193,155PELHAM 1,676,395,742 12,333,880 1,688,729,622 0 1,688,729,622PEMBROKE 615,755,177 49,403,012 665,158,189 0 665,158,189PETERBOROUGH 640,759,136 39,627,430 680,386,566 0 680,386,566PIERMONT 96,449,808 -1,819,607 94,630,201 0 94,630,201PINKHAM'S GRANT 2,755,360 496,236 3,251,596 0 3,251,596PITTSBURG 252,238,831 25,730,296 277,969,127 0 277,969,127
173 2017 Deparment of Revenue Administration Annual Report
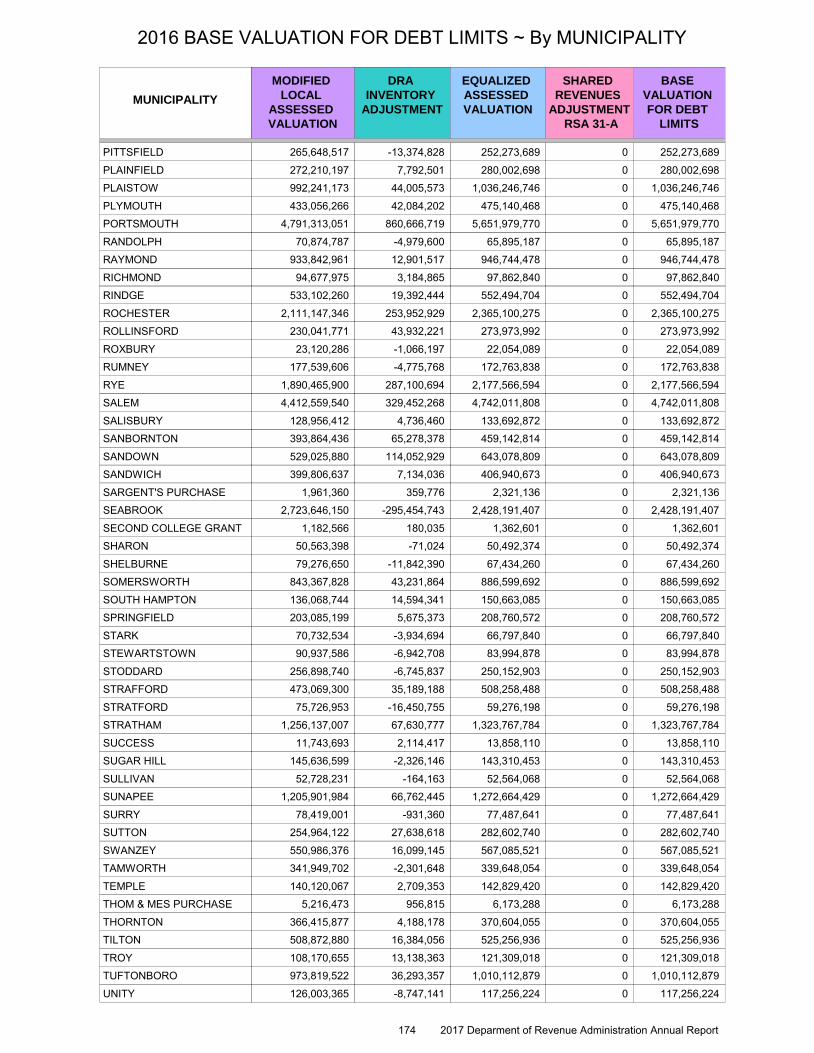
MODIFIED
LOCAL
ASSESSED
VALUATION
DRA
INVENTORY
ADJUSTMENT
EQUALIZED
ASSESSED
VALUATION
SHARED
REVENUES
ADJUSTMENT
RSA 31-A
BASE
VALUATION
FOR DEBT
LIMITS
MUNICIPALITY
2016 BASE VALUATION FOR DEBT LIMITS ~ By MUNICIPALITY
PITTSFIELD 265,648,517 -13,374,828 252,273,689 0 252,273,689PLAINFIELD 272,210,197 7,792,501 280,002,698 0 280,002,698PLAISTOW 992,241,173 44,005,573 1,036,246,746 0 1,036,246,746PLYMOUTH 433,056,266 42,084,202 475,140,468 0 475,140,468PORTSMOUTH 4,791,313,051 860,666,719 5,651,979,770 0 5,651,979,770RANDOLPH 70,874,787 -4,979,600 65,895,187 0 65,895,187RAYMOND 933,842,961 12,901,517 946,744,478 0 946,744,478RICHMOND 94,677,975 3,184,865 97,862,840 0 97,862,840RINDGE 533,102,260 19,392,444 552,494,704 0 552,494,704ROCHESTER 2,111,147,346 253,952,929 2,365,100,275 0 2,365,100,275ROLLINSFORD 230,041,771 43,932,221 273,973,992 0 273,973,992ROXBURY 23,120,286 -1,066,197 22,054,089 0 22,054,089RUMNEY 177,539,606 -4,775,768 172,763,838 0 172,763,838RYE 1,890,465,900 287,100,694 2,177,566,594 0 2,177,566,594SALEM 4,412,559,540 329,452,268 4,742,011,808 0 4,742,011,808SALISBURY 128,956,412 4,736,460 133,692,872 0 133,692,872SANBORNTON 393,864,436 65,278,378 459,142,814 0 459,142,814SANDOWN 529,025,880 114,052,929 643,078,809 0 643,078,809SANDWICH 399,806,637 7,134,036 406,940,673 0 406,940,673SARGENT'S PURCHASE 1,961,360 359,776 2,321,136 0 2,321,136SEABROOK 2,723,646,150 -295,454,743 2,428,191,407 0 2,428,191,407SECOND COLLEGE GRANT 1,182,566 180,035 1,362,601 0 1,362,601SHARON 50,563,398 -71,024 50,492,374 0 50,492,374SHELBURNE 79,276,650 -11,842,390 67,434,260 0 67,434,260SOMERSWORTH 843,367,828 43,231,864 886,599,692 0 886,599,692SOUTH HAMPTON 136,068,744 14,594,341 150,663,085 0 150,663,085SPRINGFIELD 203,085,199 5,675,373 208,760,572 0 208,760,572STARK 70,732,534 -3,934,694 66,797,840 0 66,797,840STEWARTSTOWN 90,937,586 -6,942,708 83,994,878 0 83,994,878STODDARD 256,898,740 -6,745,837 250,152,903 0 250,152,903STRAFFORD 473,069,300 35,189,188 508,258,488 0 508,258,488STRATFORD 75,726,953 -16,450,755 59,276,198 0 59,276,198STRATHAM 1,256,137,007 67,630,777 1,323,767,784 0 1,323,767,784SUCCESS 11,743,693 2,114,417 13,858,110 0 13,858,110SUGAR HILL 145,636,599 -2,326,146 143,310,453 0 143,310,453SULLIVAN 52,728,231 -164,163 52,564,068 0 52,564,068SUNAPEE 1,205,901,984 66,762,445 1,272,664,429 0 1,272,664,429SURRY 78,419,001 -931,360 77,487,641 0 77,487,641SUTTON 254,964,122 27,638,618 282,602,740 0 282,602,740SWANZEY 550,986,376 16,099,145 567,085,521 0 567,085,521TAMWORTH 341,949,702 -2,301,648 339,648,054 0 339,648,054TEMPLE 140,120,067 2,709,353 142,829,420 0 142,829,420THOM & MES PURCHASE 5,216,473 956,815 6,173,288 0 6,173,288THORNTON 366,415,877 4,188,178 370,604,055 0 370,604,055TILTON 508,872,880 16,384,056 525,256,936 0 525,256,936TROY 108,170,655 13,138,363 121,309,018 0 121,309,018TUFTONBORO 973,819,522 36,293,357 1,010,112,879 0 1,010,112,879UNITY 126,003,365 -8,747,141 117,256,224 0 117,256,224
174 2017 Deparment of Revenue Administration Annual Report

MODIFIED
LOCAL
ASSESSED
VALUATION
DRA
INVENTORY
ADJUSTMENT
EQUALIZED
ASSESSED
VALUATION
SHARED
REVENUES
ADJUSTMENT
RSA 31-A
BASE
VALUATION
FOR DEBT
LIMITS
MUNICIPALITY
2016 BASE VALUATION FOR DEBT LIMITS ~ By MUNICIPALITY
WAKEFIELD 910,277,423 89,239,285 999,516,708 0 999,516,708WALPOLE 423,602,008 -2,778,603 420,823,405 0 420,823,405WARNER 284,110,405 -14,314,121 269,796,284 0 269,796,284WARREN 83,899,662 -18,219,118 65,680,544 0 65,680,544WASHINGTON 228,769,885 -11,876,564 216,893,321 0 216,893,321WATERVILLE VALLEY 335,895,878 17,406,791 353,302,669 0 353,302,669WEARE 856,555,809 -17,851,724 838,704,085 0 838,704,085WEBSTER 209,318,885 -6,501,232 202,817,653 0 202,817,653WENTWORTH 93,575,525 234,254 93,809,779 0 93,809,779WENTWORTH LOCATION 7,232,938 1,306,417 8,539,355 0 8,539,355WESTMORELAND 163,508,982 6,308,667 169,817,649 0 169,817,649WHITEFIELD 200,951,406 -12,383,346 188,568,060 0 188,568,060WILMOT 177,237,784 13,278,709 190,516,493 0 190,516,493WILTON 368,429,816 10,780,912 379,210,728 0 379,210,728WINCHESTER 275,887,979 -45,199,780 230,688,199 0 230,688,199WINDHAM 2,291,885,340 206,516,487 2,498,401,827 0 2,498,401,827WINDSOR 27,571,407 -565,149 27,006,258 0 27,006,258WOLFEBORO 1,970,682,356 84,208,485 2,054,890,841 0 2,054,890,841WOODSTOCK 225,018,862 17,184,425 242,203,287 0 242,203,287
162,782,123,177STATE TOTALS 9,945,114,569 172,727,237,746 0 172,727,237,746
175 2017 Deparment of Revenue Administration Annual Report
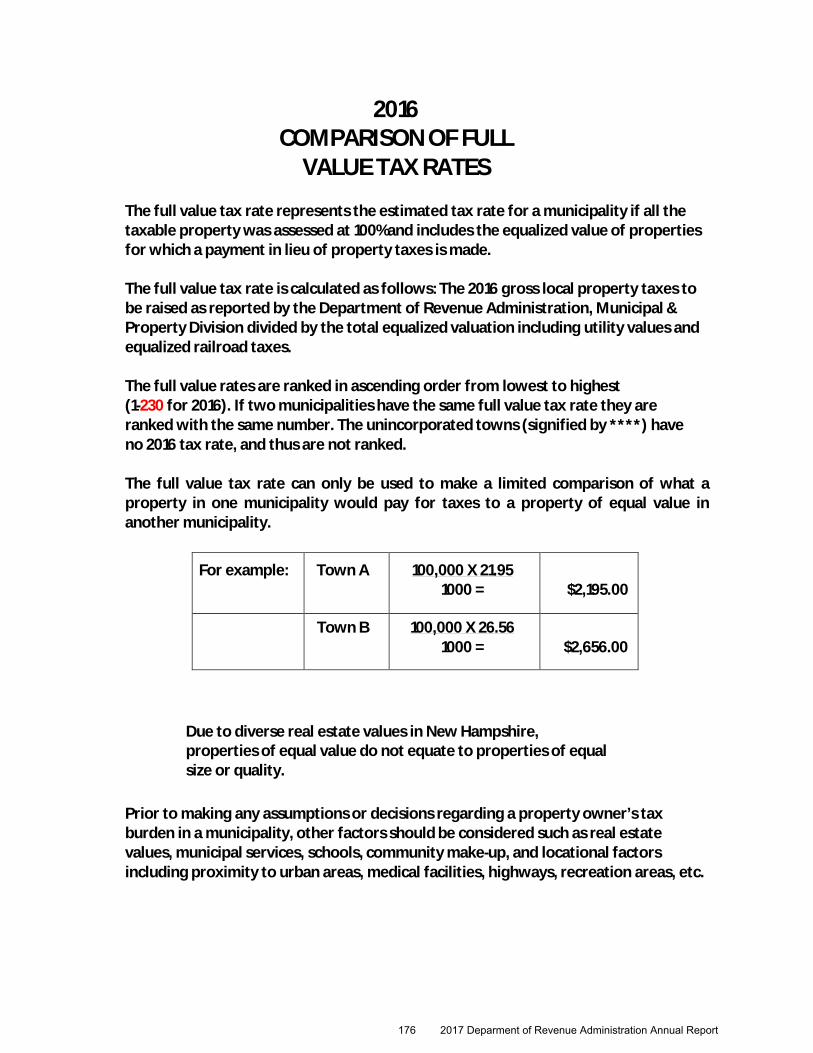
2016 COMPARISON OF FULL
VALUE TAX RATES
The full value tax rate represents the estimated tax rate for a municipality if all the taxable property was assessed at 100% and includes the equalized value of properties for which a payment in lieu of property taxes is made.
The full value tax rate is calculated as follows: The 2016 gross local property taxes to be raised as reported by the Department of Revenue Administration, Municipal & Property Division divided by the total equalized valuation including utility values and equalized railroad taxes.
The full value rates are ranked in ascending order from lowest to highest (1-230 for 2016). If two municipalities have the same full value tax rate they are ranked with the same number. The unincorporated towns (signified by ****) have no 2016 tax rate, and thus are not ranked.
The full value tax rate can only be used to make a limited comparison of what a property in one municipality would pay for taxes to a property of equal value in another municipality.
For example:
Town A
100,000 X 21.95 1000 =
$2,195.00
Town B 100,000 X 26.56 1000 =
$2,656.00
Due to diverse real estate values in New Hampshire, properties of equal value do not equate to properties of equal size or quality.
Prior to making any assumptions or decisions regarding a property owner’s tax burden in a municipality, other factors should be considered such as real estate values, municipal services, schools, community make-up, and locational factors including proximity to urban areas, medical facilities, highways, recreation areas, etc.
176 2017 Deparment of Revenue Administration Annual Report
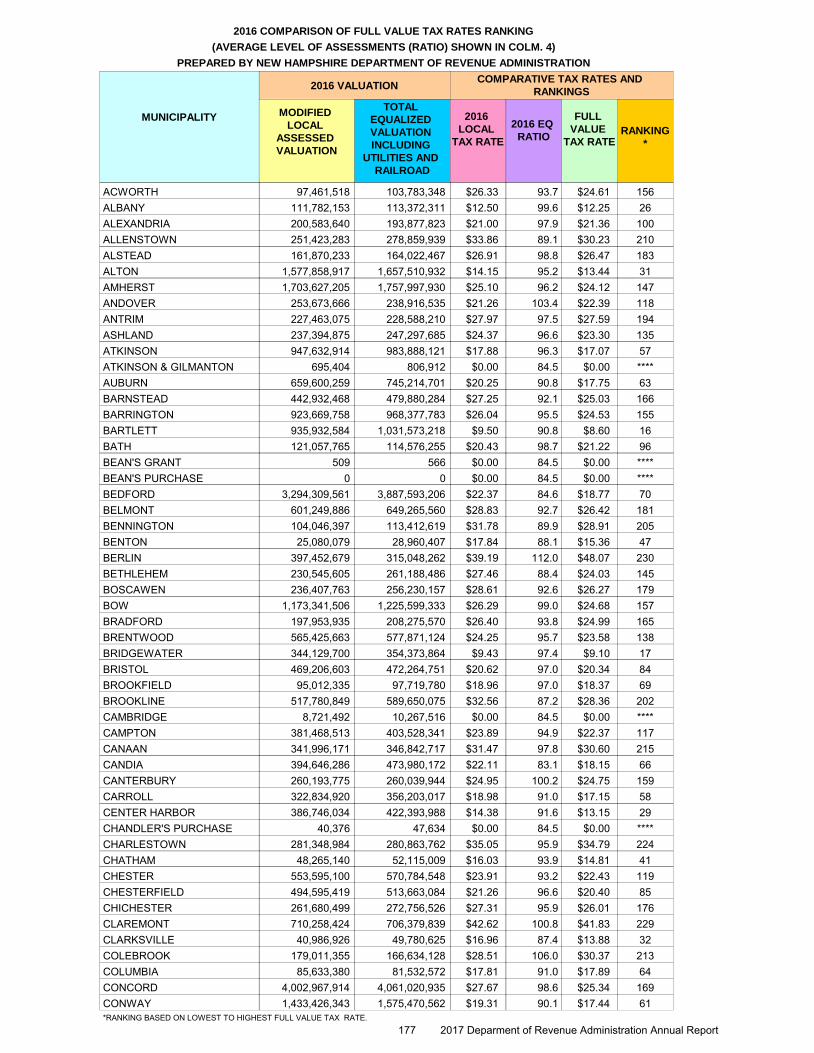
MUNICIPALITY MODIFIED
LOCAL
ASSESSED
VALUATION
TOTAL
EQUALIZED
VALUATION
INCLUDING
UTILITIES AND
RAILROAD
2016
LOCAL
TAX RATE
2016 EQ
RATIO
FULL
VALUE
TAX RATERANKING
*
2016 VALUATIONCOMPARATIVE TAX RATES AND
RANKINGS
2016 COMPARISON OF FULL VALUE TAX RATES RANKING
(AVERAGE LEVEL OF ASSESSMENTS (RATIO) SHOWN IN COLM. 4)
PREPARED BY NEW HAMPSHIRE DEPARTMENT OF REVENUE ADMINISTRATION
ACWORTH 97,461,518 103,783,348 $26.33 93.7 $24.61 156ALBANY 111,782,153 113,372,311 $12.50 99.6 $12.25 26ALEXANDRIA 200,583,640 193,877,823 $21.00 97.9 $21.36 100ALLENSTOWN 251,423,283 278,859,939 $33.86 89.1 $30.23 210ALSTEAD 161,870,233 164,022,467 $26.91 98.8 $26.47 183ALTON 1,577,858,917 1,657,510,932 $14.15 95.2 $13.44 31AMHERST 1,703,627,205 1,757,997,930 $25.10 96.2 $24.12 147ANDOVER 253,673,666 238,916,535 $21.26 103.4 $22.39 118ANTRIM 227,463,075 228,588,210 $27.97 97.5 $27.59 194ASHLAND 237,394,875 247,297,685 $24.37 96.6 $23.30 135ATKINSON 947,632,914 983,888,121 $17.88 96.3 $17.07 57ATKINSON & GILMANTON 695,404 806,912 $0.00 84.5 $0.00 ****AUBURN 659,600,259 745,214,701 $20.25 90.8 $17.75 63BARNSTEAD 442,932,468 479,880,284 $27.25 92.1 $25.03 166BARRINGTON 923,669,758 968,377,783 $26.04 95.5 $24.53 155BARTLETT 935,932,584 1,031,573,218 $9.50 90.8 $8.60 16BATH 121,057,765 114,576,255 $20.43 98.7 $21.22 96BEAN'S GRANT 509 566 $0.00 84.5 $0.00 ****BEAN'S PURCHASE 0 0 $0.00 84.5 $0.00 ****BEDFORD 3,294,309,561 3,887,593,206 $22.37 84.6 $18.77 70BELMONT 601,249,886 649,265,560 $28.83 92.7 $26.42 181BENNINGTON 104,046,397 113,412,619 $31.78 89.9 $28.91 205BENTON 25,080,079 28,960,407 $17.84 88.1 $15.36 47BERLIN 397,452,679 315,048,262 $39.19 112.0 $48.07 230BETHLEHEM 230,545,605 261,188,486 $27.46 88.4 $24.03 145BOSCAWEN 236,407,763 256,230,157 $28.61 92.6 $26.27 179BOW 1,173,341,506 1,225,599,333 $26.29 99.0 $24.68 157BRADFORD 197,953,935 208,275,570 $26.40 93.8 $24.99 165BRENTWOOD 565,425,663 577,871,124 $24.25 95.7 $23.58 138BRIDGEWATER 344,129,700 354,373,864 $9.43 97.4 $9.10 17BRISTOL 469,206,603 472,264,751 $20.62 97.0 $20.34 84BROOKFIELD 95,012,335 97,719,780 $18.96 97.0 $18.37 69BROOKLINE 517,780,849 589,650,075 $32.56 87.2 $28.36 202CAMBRIDGE 8,721,492 10,267,516 $0.00 84.5 $0.00 ****CAMPTON 381,468,513 403,528,341 $23.89 94.9 $22.37 117CANAAN 341,996,171 346,842,717 $31.47 97.8 $30.60 215CANDIA 394,646,286 473,980,172 $22.11 83.1 $18.15 66CANTERBURY 260,193,775 260,039,944 $24.95 100.2 $24.75 159CARROLL 322,834,920 356,203,017 $18.98 91.0 $17.15 58CENTER HARBOR 386,746,034 422,393,988 $14.38 91.6 $13.15 29CHANDLER'S PURCHASE 40,376 47,634 $0.00 84.5 $0.00 ****CHARLESTOWN 281,348,984 280,863,762 $35.05 95.9 $34.79 224CHATHAM 48,265,140 52,115,009 $16.03 93.9 $14.81 41CHESTER 553,595,100 570,784,548 $23.91 93.2 $22.43 119CHESTERFIELD 494,595,419 513,663,084 $21.26 96.6 $20.40 85CHICHESTER 261,680,499 272,756,526 $27.31 95.9 $26.01 176CLAREMONT 710,258,424 706,379,839 $42.62 100.8 $41.83 229CLARKSVILLE 40,986,926 49,780,625 $16.96 87.4 $13.88 32COLEBROOK 179,011,355 166,634,128 $28.51 106.0 $30.37 213COLUMBIA 85,633,380 81,532,572 $17.81 91.0 $17.89 64CONCORD 4,002,967,914 4,061,020,935 $27.67 98.6 $25.34 169CONWAY 1,433,426,343 1,575,470,562 $19.31 90.1 $17.44 61*RANKING BASED ON LOWEST TO HIGHEST FULL VALUE TAX RATE.
177 2017 Deparment of Revenue Administration Annual Report

MUNICIPALITY MODIFIED
LOCAL
ASSESSED
VALUATION
TOTAL
EQUALIZED
VALUATION
INCLUDING
UTILITIES AND
RAILROAD
2016
LOCAL
TAX RATE
2016 EQ
RATIO
FULL
VALUE
TAX RATERANKING
*
2016 VALUATIONCOMPARATIVE TAX RATES AND
RANKINGS
2016 COMPARISON OF FULL VALUE TAX RATES RANKING
(AVERAGE LEVEL OF ASSESSMENTS (RATIO) SHOWN IN COLM. 4)
PREPARED BY NEW HAMPSHIRE DEPARTMENT OF REVENUE ADMINISTRATION
CORNISH 176,269,458 175,681,268 $21.40 99.6 $21.31 98CRAWFORD'S PURCHASE 187,758 222,173 $0.00 84.5 $0.00 ****CROYDON 88,744,821 84,358,402 $15.86 103.8 $16.58 54CUTT'S GRANT 0 0 $0.00 84.5 $0.00 ****DALTON 76,286,463 86,406,570 $24.49 92.3 $21.46 101DANBURY 107,013,937 107,218,580 $23.00 99.8 $22.84 124DANVILLE 392,689,734 399,346,512 $26.65 97.9 $25.90 175DEERFIELD 563,632,768 562,963,312 $22.20 94.4 $21.83 108DEERING 179,770,752 193,965,450 $28.55 90.8 $25.89 174DERRY 2,833,341,580 2,989,613,482 $27.06 94.8 $25.06 167DIX GRANT 773,929 900,306 $0.00 84.5 $0.00 ****DIXVILLE 8,320,143 32,561,341 $7.94 84.5 $2.02 2DORCHESTER 38,810,028 39,555,891 $21.96 97.8 $21.49 102DOVER 2,991,001,960 3,256,575,668 $26.29 91.7 $23.59 139DUBLIN 230,289,892 207,798,582 $27.81 110.9 $30.77 217DUMMER 75,409,010 65,464,947 $15.17 110.1 $15.83 50DUNBARTON 302,935,262 325,127,303 $23.98 89.0 $22.16 113DURHAM 1,016,683,899 1,080,145,993 $29.73 92.9 $27.68 196EAST KINGSTON 311,190,593 329,369,789 $24.79 90.7 $23.23 133EASTON 63,087,871 67,745,707 $11.85 93.5 $11.00 21EATON 109,837,993 105,083,796 $10.86 104.5 $11.33 22EFFINGHAM 170,325,004 155,247,378 $22.80 107.8 $24.91 164ELLSWORTH 13,449,932 14,646,109 $19.84 92.9 $18.16 67ENFIELD 543,592,734 566,775,229 $26.54 96.0 $24.77 160EPPING 706,425,774 822,367,707 $25.94 85.2 $22.06 112EPSOM 425,254,200 433,589,938 $25.03 97.4 $24.44 153ERROL 86,883,356 88,539,769 $11.96 91.5 $11.41 23ERVING'S GRANT 36,902 78,636 $0.00 84.5 $0.00 ****EXETER 1,729,679,814 1,924,940,913 $26.24 89.8 $23.07 129FARMINGTON 450,346,546 455,468,793 $25.03 97.6 $24.34 151FITZWILLIAM 254,000,732 248,213,859 $27.74 100.7 $27.79 198FRANCESTOWN 191,875,340 182,300,239 $25.51 104.4 $26.77 186FRANCONIA 284,280,597 286,981,348 $17.06 98.4 $16.84 56FRANKLIN 542,177,660 579,734,391 $25.23 93.6 $23.24 134FREEDOM 483,254,456 495,962,022 $12.60 97.4 $12.25 26FREMONT 400,985,833 450,591,553 $29.88 87.8 $26.46 182GILFORD 1,662,334,122 1,774,276,810 $17.95 93.8 $16.78 55GILMANTON 453,782,020 456,748,268 $23.91 98.3 $23.62 140GILSUM 61,027,121 61,386,369 $26.95 97.8 $26.59 185GOFFSTOWN 1,459,249,100 1,535,064,461 $26.43 93.7 $24.81 161GORHAM 273,762,000 241,079,177 $31.85 99.4 $35.40 225GOSHEN 72,028,938 73,815,208 $21.40 97.5 $20.82 92GRAFTON 115,897,035 119,121,072 $26.14 95.9 $25.30 168GRANTHAM 466,452,232 484,841,012 $23.84 95.8 $22.87 126GREENFIELD 138,393,706 156,545,562 $28.23 93.1 $24.87 163GREENLAND 705,105,116 792,696,949 $16.65 88.5 $14.71 40GREEN'S GRANT 3,129,477 3,757,030 $7.45 84.5 $6.16 10GREENVILLE 97,595,138 102,862,626 $24.28 95.0 $22.85 125GROTON 79,159,602 140,279,081 $11.70 99.4 $6.29 11HADLEY'S PURCHASE 0 0 $0.00 84.5 $0.00 ****HALE'S LOCATION 74,454,500 74,284,185 $4.25 100.3 $4.25 6HAMPSTEAD 1,031,576,646 1,149,504,908 $24.20 89.2 $21.49 102*RANKING BASED ON LOWEST TO HIGHEST FULL VALUE TAX RATE.
178 2017 Deparment of Revenue Administration Annual Report
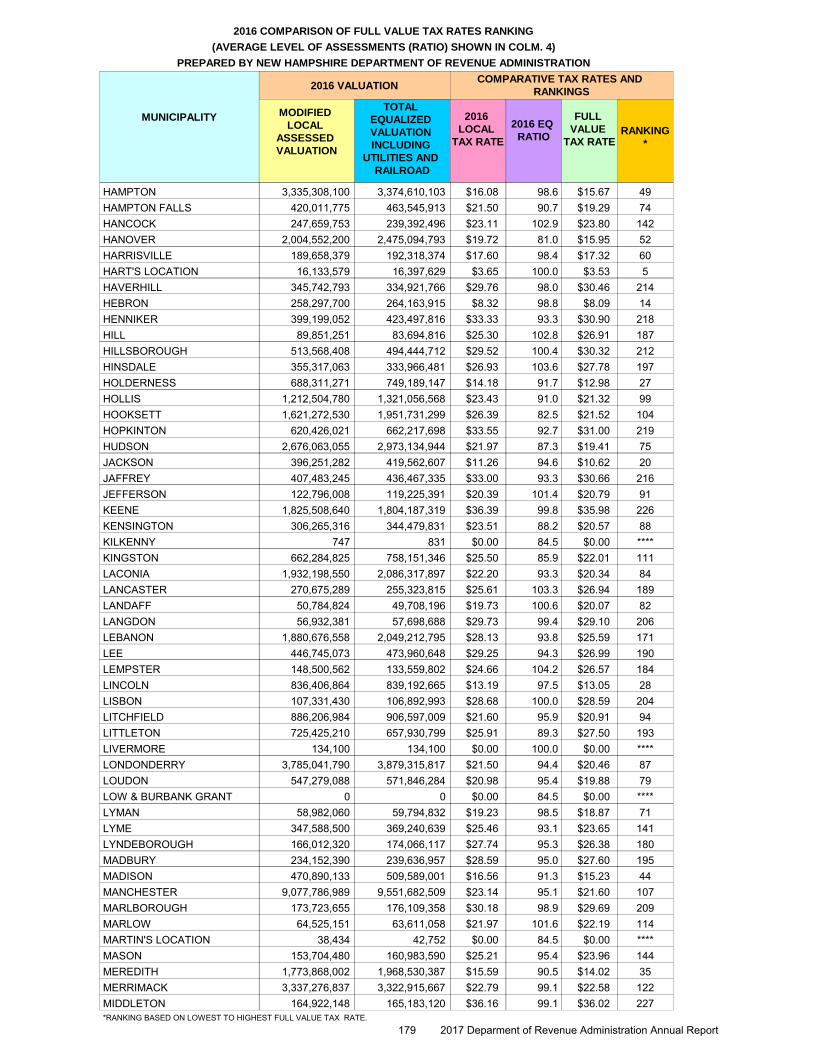
MUNICIPALITY MODIFIED
LOCAL
ASSESSED
VALUATION
TOTAL
EQUALIZED
VALUATION
INCLUDING
UTILITIES AND
RAILROAD
2016
LOCAL
TAX RATE
2016 EQ
RATIO
FULL
VALUE
TAX RATERANKING
*
2016 VALUATIONCOMPARATIVE TAX RATES AND
RANKINGS
2016 COMPARISON OF FULL VALUE TAX RATES RANKING
(AVERAGE LEVEL OF ASSESSMENTS (RATIO) SHOWN IN COLM. 4)
PREPARED BY NEW HAMPSHIRE DEPARTMENT OF REVENUE ADMINISTRATION
HAMPTON 3,335,308,100 3,374,610,103 $16.08 98.6 $15.67 49HAMPTON FALLS 420,011,775 463,545,913 $21.50 90.7 $19.29 74HANCOCK 247,659,753 239,392,496 $23.11 102.9 $23.80 142HANOVER 2,004,552,200 2,475,094,793 $19.72 81.0 $15.95 52HARRISVILLE 189,658,379 192,318,374 $17.60 98.4 $17.32 60HART'S LOCATION 16,133,579 16,397,629 $3.65 100.0 $3.53 5HAVERHILL 345,742,793 334,921,766 $29.76 98.0 $30.46 214HEBRON 258,297,700 264,163,915 $8.32 98.8 $8.09 14HENNIKER 399,199,052 423,497,816 $33.33 93.3 $30.90 218HILL 89,851,251 83,694,816 $25.30 102.8 $26.91 187HILLSBOROUGH 513,568,408 494,444,712 $29.52 100.4 $30.32 212HINSDALE 355,317,063 333,966,481 $26.93 103.6 $27.78 197HOLDERNESS 688,311,271 749,189,147 $14.18 91.7 $12.98 27HOLLIS 1,212,504,780 1,321,056,568 $23.43 91.0 $21.32 99HOOKSETT 1,621,272,530 1,951,731,299 $26.39 82.5 $21.52 104HOPKINTON 620,426,021 662,217,698 $33.55 92.7 $31.00 219HUDSON 2,676,063,055 2,973,134,944 $21.97 87.3 $19.41 75JACKSON 396,251,282 419,562,607 $11.26 94.6 $10.62 20JAFFREY 407,483,245 436,467,335 $33.00 93.3 $30.66 216JEFFERSON 122,796,008 119,225,391 $20.39 101.4 $20.79 91KEENE 1,825,508,640 1,804,187,319 $36.39 99.8 $35.98 226KENSINGTON 306,265,316 344,479,831 $23.51 88.2 $20.57 88KILKENNY 747 831 $0.00 84.5 $0.00 ****KINGSTON 662,284,825 758,151,346 $25.50 85.9 $22.01 111LACONIA 1,932,198,550 2,086,317,897 $22.20 93.3 $20.34 84LANCASTER 270,675,289 255,323,815 $25.61 103.3 $26.94 189LANDAFF 50,784,824 49,708,196 $19.73 100.6 $20.07 82LANGDON 56,932,381 57,698,688 $29.73 99.4 $29.10 206LEBANON 1,880,676,558 2,049,212,795 $28.13 93.8 $25.59 171LEE 446,745,073 473,960,648 $29.25 94.3 $26.99 190LEMPSTER 148,500,562 133,559,802 $24.66 104.2 $26.57 184LINCOLN 836,406,864 839,192,665 $13.19 97.5 $13.05 28LISBON 107,331,430 106,892,993 $28.68 100.0 $28.59 204LITCHFIELD 886,206,984 906,597,009 $21.60 95.9 $20.91 94LITTLETON 725,425,210 657,930,799 $25.91 89.3 $27.50 193LIVERMORE 134,100 134,100 $0.00 100.0 $0.00 ****LONDONDERRY 3,785,041,790 3,879,315,817 $21.50 94.4 $20.46 87LOUDON 547,279,088 571,846,284 $20.98 95.4 $19.88 79LOW & BURBANK GRANT 0 0 $0.00 84.5 $0.00 ****LYMAN 58,982,060 59,794,832 $19.23 98.5 $18.87 71LYME 347,588,500 369,240,639 $25.46 93.1 $23.65 141LYNDEBOROUGH 166,012,320 174,066,117 $27.74 95.3 $26.38 180MADBURY 234,152,390 239,636,957 $28.59 95.0 $27.60 195MADISON 470,890,133 509,589,001 $16.56 91.3 $15.23 44MANCHESTER 9,077,786,989 9,551,682,509 $23.14 95.1 $21.60 107MARLBOROUGH 173,723,655 176,109,358 $30.18 98.9 $29.69 209MARLOW 64,525,151 63,611,058 $21.97 101.6 $22.19 114MARTIN'S LOCATION 38,434 42,752 $0.00 84.5 $0.00 ****MASON 153,704,480 160,983,590 $25.21 95.4 $23.96 144MEREDITH 1,773,868,002 1,968,530,387 $15.59 90.5 $14.02 35MERRIMACK 3,337,276,837 3,322,915,667 $22.79 99.1 $22.58 122MIDDLETON 164,922,148 165,183,120 $36.16 99.1 $36.02 227*RANKING BASED ON LOWEST TO HIGHEST FULL VALUE TAX RATE.
179 2017 Deparment of Revenue Administration Annual Report

MUNICIPALITY MODIFIED
LOCAL
ASSESSED
VALUATION
TOTAL
EQUALIZED
VALUATION
INCLUDING
UTILITIES AND
RAILROAD
2016
LOCAL
TAX RATE
2016 EQ
RATIO
FULL
VALUE
TAX RATERANKING
*
2016 VALUATIONCOMPARATIVE TAX RATES AND
RANKINGS
2016 COMPARISON OF FULL VALUE TAX RATES RANKING
(AVERAGE LEVEL OF ASSESSMENTS (RATIO) SHOWN IN COLM. 4)
PREPARED BY NEW HAMPSHIRE DEPARTMENT OF REVENUE ADMINISTRATION
MILAN 126,534,573 116,631,751 $20.65 98.0 $21.86 110MILFORD 1,339,034,961 1,417,686,825 $28.96 94.5 $27.12 191MILLSFIELD 8,137,153 94,178,402 $6.60 84.5 $0.57 1MILTON 360,408,165 395,689,904 $28.40 92.5 $25.59 171MONROE 411,866,295 262,928,560 $11.34 94.1 $14.64 39MONT VERNON 254,178,845 267,526,949 $29.45 95.0 $27.85 199MOULTONBOROUGH 2,844,591,697 2,968,525,437 $8.74 95.3 $8.35 15NASHUA 8,249,067,536 9,622,829,137 $25.07 85.0 $21.06 95NELSON 122,176,221 117,135,085 $19.69 103.3 $20.42 86NEW BOSTON 633,818,967 632,729,377 $23.35 99.1 $23.19 131NEW CASTLE 723,880,705 740,008,008 $5.85 97.7 $5.71 9NEW DURHAM 407,328,708 444,546,919 $22.76 91.6 $20.77 90NEW HAMPTON 316,923,665 288,481,676 $17.99 104.3 $19.44 76NEW IPSWICH 384,950,936 403,121,233 $26.23 93.6 $24.86 162NEW LONDON 1,126,372,770 1,186,587,556 $15.67 94.8 $14.84 42NEWBURY 724,669,038 732,379,184 $16.05 99.1 $15.86 51NEWFIELDS 248,590,348 261,062,999 $23.22 95.2 $21.84 109NEWINGTON 1,017,291,528 1,107,362,510 $9.15 89.8 $7.37 13NEWMARKET 739,174,428 862,437,884 $25.45 85.8 $21.58 106NEWPORT 433,334,285 420,730,225 $28.73 101.7 $29.23 207NEWTON 506,323,398 533,081,659 $26.16 94.8 $24.70 158NORTH HAMPTON 1,030,306,750 1,205,314,710 $17.79 85.4 $15.01 43NORTHFIELD 283,582,944 311,369,349 $25.98 89.1 $23.08 130NORTHUMBERLAND 111,134,907 104,877,259 $36.80 96.5 $38.24 228NORTHWOOD 468,026,783 495,172,199 $23.98 94.3 $22.33 116NOTTINGHAM 613,368,641 625,997,374 $20.65 97.1 $19.94 81ODELL 2,035,320 2,931,736 $9.85 84.5 $6.84 12ORANGE 31,659,106 31,858,375 $24.75 98.7 $24.51 154ORFORD 135,286,101 142,852,681 $27.36 94.7 $25.86 173OSSIPEE 642,113,539 680,289,380 $19.30 94.2 $18.08 65PELHAM 1,676,395,742 1,690,014,097 $20.95 98.6 $20.68 89PEMBROKE 615,755,177 666,826,427 $29.00 90.0 $26.07 177PETERBOROUGH 640,759,136 682,515,027 $30.84 94.0 $28.06 200PIERMONT 96,449,808 94,688,509 $23.95 101.1 $24.28 150PINKHAM'S GRANT 2,755,360 6,760,166 $7.08 84.5 $2.77 3PITTSBURG 252,238,831 282,815,995 $15.70 90.3 $13.91 33PITTSFIELD 265,648,517 252,579,826 $32.25 102.3 $33.51 223PLAINFIELD 272,210,197 280,041,688 $28.35 96.9 $26.93 188PLAISTOW 992,241,173 1,036,307,070 $22.50 95.2 $21.24 97PLYMOUTH 433,056,266 477,517,394 $25.17 87.4 $22.62 123PORTSMOUTH 4,791,313,051 5,713,043,888 $17.04 84.9 $14.15 37RANDOLPH 70,874,787 67,562,650 $14.93 102.6 $15.48 48RAYMOND 933,842,961 947,178,823 $23.74 97.0 $23.08 130RICHMOND 94,677,975 97,862,840 $28.19 95.8 $27.16 192RINDGE 533,102,260 552,882,802 $27.91 96.3 $26.26 178ROCHESTER 2,111,147,346 2,380,977,980 $28.26 88.3 $24.18 148ROLLINSFORD 230,041,771 274,016,276 $27.98 83.6 $23.22 132ROXBURY 23,120,286 25,289,746 $25.32 103.2 $23.03 128RUMNEY 177,539,606 173,081,980 $23.76 95.6 $24.10 146RYE 1,890,465,900 2,179,578,301 $10.68 86.8 $9.23 18SALEM 4,412,559,540 4,745,723,979 $20.43 92.3 $18.87 71SALISBURY 128,956,412 136,036,493 $24.56 92.6 $22.90 127*RANKING BASED ON LOWEST TO HIGHEST FULL VALUE TAX RATE.
180 2017 Deparment of Revenue Administration Annual Report
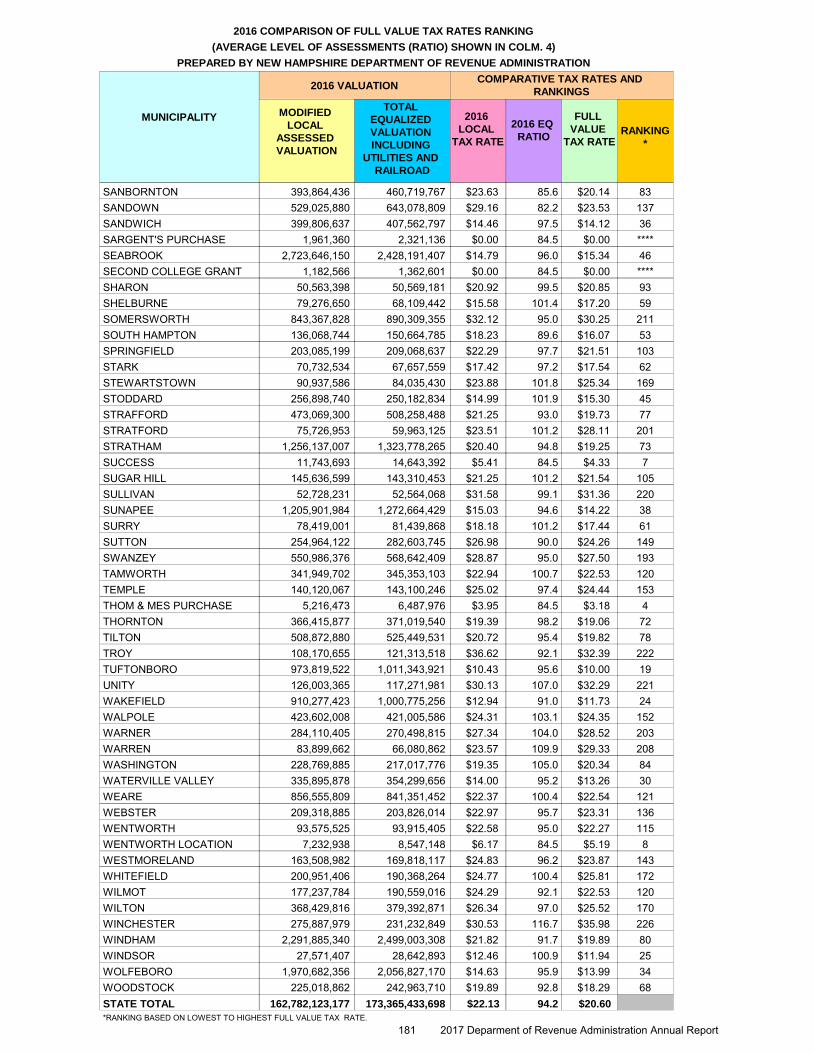
MUNICIPALITY MODIFIED
LOCAL
ASSESSED
VALUATION
TOTAL
EQUALIZED
VALUATION
INCLUDING
UTILITIES AND
RAILROAD
2016
LOCAL
TAX RATE
2016 EQ
RATIO
FULL
VALUE
TAX RATERANKING
*
2016 VALUATIONCOMPARATIVE TAX RATES AND
RANKINGS
2016 COMPARISON OF FULL VALUE TAX RATES RANKING
(AVERAGE LEVEL OF ASSESSMENTS (RATIO) SHOWN IN COLM. 4)
PREPARED BY NEW HAMPSHIRE DEPARTMENT OF REVENUE ADMINISTRATION
SANBORNTON 393,864,436 460,719,767 $23.63 85.6 $20.14 83SANDOWN 529,025,880 643,078,809 $29.16 82.2 $23.53 137SANDWICH 399,806,637 407,562,797 $14.46 97.5 $14.12 36SARGENT'S PURCHASE 1,961,360 2,321,136 $0.00 84.5 $0.00 ****SEABROOK 2,723,646,150 2,428,191,407 $14.79 96.0 $15.34 46SECOND COLLEGE GRANT 1,182,566 1,362,601 $0.00 84.5 $0.00 ****SHARON 50,563,398 50,569,181 $20.92 99.5 $20.85 93SHELBURNE 79,276,650 68,109,442 $15.58 101.4 $17.20 59SOMERSWORTH 843,367,828 890,309,355 $32.12 95.0 $30.25 211SOUTH HAMPTON 136,068,744 150,664,785 $18.23 89.6 $16.07 53SPRINGFIELD 203,085,199 209,068,637 $22.29 97.7 $21.51 103STARK 70,732,534 67,657,559 $17.42 97.2 $17.54 62STEWARTSTOWN 90,937,586 84,035,430 $23.88 101.8 $25.34 169STODDARD 256,898,740 250,182,834 $14.99 101.9 $15.30 45STRAFFORD 473,069,300 508,258,488 $21.25 93.0 $19.73 77STRATFORD 75,726,953 59,963,125 $23.51 101.2 $28.11 201STRATHAM 1,256,137,007 1,323,778,265 $20.40 94.8 $19.25 73SUCCESS 11,743,693 14,643,392 $5.41 84.5 $4.33 7SUGAR HILL 145,636,599 143,310,453 $21.25 101.2 $21.54 105SULLIVAN 52,728,231 52,564,068 $31.58 99.1 $31.36 220SUNAPEE 1,205,901,984 1,272,664,429 $15.03 94.6 $14.22 38SURRY 78,419,001 81,439,868 $18.18 101.2 $17.44 61SUTTON 254,964,122 282,603,745 $26.98 90.0 $24.26 149SWANZEY 550,986,376 568,642,409 $28.87 95.0 $27.50 193TAMWORTH 341,949,702 345,353,103 $22.94 100.7 $22.53 120TEMPLE 140,120,067 143,100,246 $25.02 97.4 $24.44 153THOM & MES PURCHASE 5,216,473 6,487,976 $3.95 84.5 $3.18 4THORNTON 366,415,877 371,019,540 $19.39 98.2 $19.06 72TILTON 508,872,880 525,449,531 $20.72 95.4 $19.82 78TROY 108,170,655 121,313,518 $36.62 92.1 $32.39 222TUFTONBORO 973,819,522 1,011,343,921 $10.43 95.6 $10.00 19UNITY 126,003,365 117,271,981 $30.13 107.0 $32.29 221WAKEFIELD 910,277,423 1,000,775,256 $12.94 91.0 $11.73 24WALPOLE 423,602,008 421,005,586 $24.31 103.1 $24.35 152WARNER 284,110,405 270,498,815 $27.34 104.0 $28.52 203WARREN 83,899,662 66,080,862 $23.57 109.9 $29.33 208WASHINGTON 228,769,885 217,017,776 $19.35 105.0 $20.34 84WATERVILLE VALLEY 335,895,878 354,299,656 $14.00 95.2 $13.26 30WEARE 856,555,809 841,351,452 $22.37 100.4 $22.54 121WEBSTER 209,318,885 203,826,014 $22.97 95.7 $23.31 136WENTWORTH 93,575,525 93,915,405 $22.58 95.0 $22.27 115WENTWORTH LOCATION 7,232,938 8,547,148 $6.17 84.5 $5.19 8WESTMORELAND 163,508,982 169,818,117 $24.83 96.2 $23.87 143WHITEFIELD 200,951,406 190,368,264 $24.77 100.4 $25.81 172WILMOT 177,237,784 190,559,016 $24.29 92.1 $22.53 120WILTON 368,429,816 379,392,871 $26.34 97.0 $25.52 170WINCHESTER 275,887,979 231,232,849 $30.53 116.7 $35.98 226WINDHAM 2,291,885,340 2,499,003,308 $21.82 91.7 $19.89 80WINDSOR 27,571,407 28,642,893 $12.46 100.9 $11.94 25WOLFEBORO 1,970,682,356 2,056,827,170 $14.63 95.9 $13.99 34WOODSTOCK 225,018,862 242,963,710 $19.89 92.8 $18.29 68STATE TOTAL 162,782,123,177 173,365,433,698 $22.13 94.2 $20.60
*RANKING BASED ON LOWEST TO HIGHEST FULL VALUE TAX RATE.181 2017 Deparment of Revenue Administration Annual Report