Embed Size (px)
Citation preview
American Journal of Operations Research, 2016, 6, 425-435 http://www.scirp.org/journal/ajor
ISSN Online: 2160-8849 ISSN Print: 2160-8830
DOI: 10.4236/ajor.2016.66039 October 28, 2016
The Design of a Novel Bearing Manufacturing Line Based on Simulation
Abeshek Ram Natarajan
Department of Mechanical Engineering, SSN College of Engineering, Chennai, India
Abstract This paper is a case study of the production line at an automotive ancillary manu-facturing plant. At first, the production line is studied for possible areas of improve-ment. Time study data are collected for each process and the best set-up is calculated to make the plant leaner. Furthermore, suggestions are made to procure machines from the market that make the plant leaner and more efficient. To make the sugges-tions indubitable, a time study calculation is done for the new machine layout.
Keywords Production Line, Simulation, GPSS, Throughput
1. Introduction
Kaizen-Continuous improvement is the essence of successful manufacturing industries worldwide. There always exist some scopes for improvement in the company, hence efforts to improve should never be allowed to cease. The manufacturing industry is a major contributor to the growth of the Indian economy. Also, amongst the manufac-turing industries, it is the automotive industry that contributes a larger percent. Despite having continued this trend for decades, the automotive industry still faces the difficul-ty of improving production. When the automotive industry is only predicted to grow from here, it is only obvious that its contribution to India’s GDP will increase. Howev-er, this also means that the country’s reliance on the industry will increase. Therefore, in this age of price competitiveness, it is important to avoid the company’s profit slip due to the inability to produce parts on time. Hence, efficient balancing of the produc-tion line is of utmost importance. This paper uses simulation approach to effectively improve the output rate of the plant to satisfy the production goal of a bearing manu-facturing company.
How to cite this paper: Natarajan, A.R. (2016) The Design of a Novel Bearing Man-ufacturing Line Based on Simulation. American Journal of Operations Research, 6, 425-435. http://dx.doi.org/10.4236/ajor.2016.66039 Received: September 15, 2016 Accepted: October 25, 2016 Published: October 28, 2016 Copyright © 2016 by author and Scientific Research Publishing Inc. This work is licensed under the Creative Commons Attribution International License (CC BY 4.0). http://creativecommons.org/licenses/by/4.0/
Open Access
A. R. Natarajan
426
2. Literature Review
This section reviews literature of simulation approach for improving the productivity of different production/service systems.
Panneerselvam and Veerapandian [1] considered the simulation of a season ticket issue counter of a transport organization at Chennai. They analyzed the behavior of male queues and female queues at different time intervals (one hour interval) from 3 P.M. to 8 P.M. and suggested to operate variable number of counters depending on the estimated queue length. The simulation logic has been implemented in FORTRAN language. Senthilkumar [2] developed an algorithm for multiple AGVS (Automated Guided Vehicle System) scheduling, which uses Floyd’s algorithm as a subroutine to find the shortest distance between any pair of nodes in the distance network of the shop floor where the AGVs operate. This uses simulation approach to sample the demand points. The simulation logic has been implemented in Basic language. Panneerselvam and Senthilkumar [3] developed a text book titled ‘System Simulation, Modeling and Languages’, which presents several practical examples and case studies where the simu-lation approach can be used. The examples cover applications in shop floors and service systems using high level languages, GPSS (General Purpose Simulation System), Arena, etc, which is instrumental in understanding the use of GPSS. Gordon Geoffrey [4] and Jerry Banks [5] gave the concept of simulation and introduce different simulation lan-guages. Furthermore, Panneerselvam [6] [7] gave a brief introduction to simulation and presented case studies which have been essential to learning the method of simulation. Moreover, Scriber [8] gave a complete account of GPSS covering all the blocks. Khalili and Zahedi [9] presented a simulation model for a mattress production line using Promodel simulation software. They analyzed the existing system and modified the system using simulation to cope with the demand of mattress for the next five years. Gingu and Zapciu [10] considered a layout design problem and obtained bottleneck locations using simulation to obtain a revised cellular layout.
The literature presented above justifies the need of simulation in industries and also presents foundations of the simulation approach. In this paper, the application of the simulation approach using GPSS to improve the throughput of a production line man-ufacturing a bearing is presented.
3. Problem Identification
The output of the line manufacturing an engine thrust bearing is unable to meet the demand of its customers. Moreover, the line supervisor is not convinced about the op-timality of the lot size that is fixed while producing the bearing. The process times of different operations of the production line of the bearing are probabilistic. Hence, in this paper, an attempt has been made to simulate the production for the existing layout of the production line. After an analysis of the results about the average waiting time and average waiting number of jobs before different operations of the production line, another simulation model is to be constructed again to minimize the time taken which will improve the production volume of the line.
A. R. Natarajan
427
4. Data Collection
This section presents data that are collected from the production line of the bearing (job). The inter-arrival time of the job to the first machine of the line follows uniform distribution with a mean of 6.79 sec and a half width of 0.375 sec.
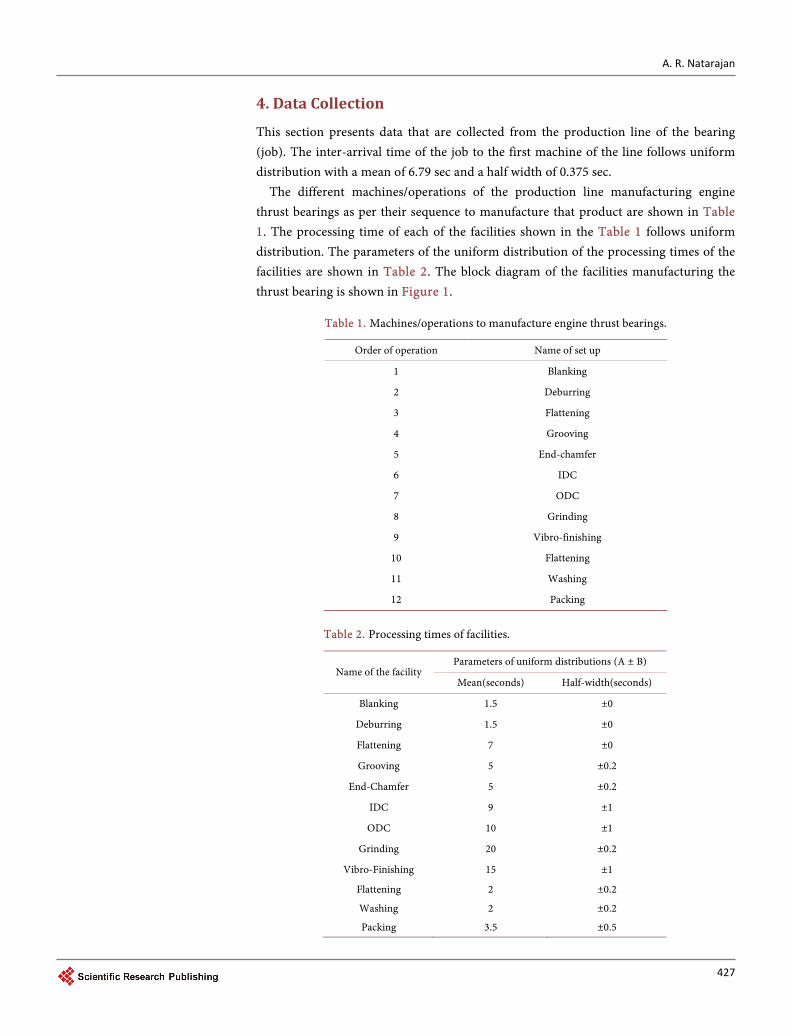
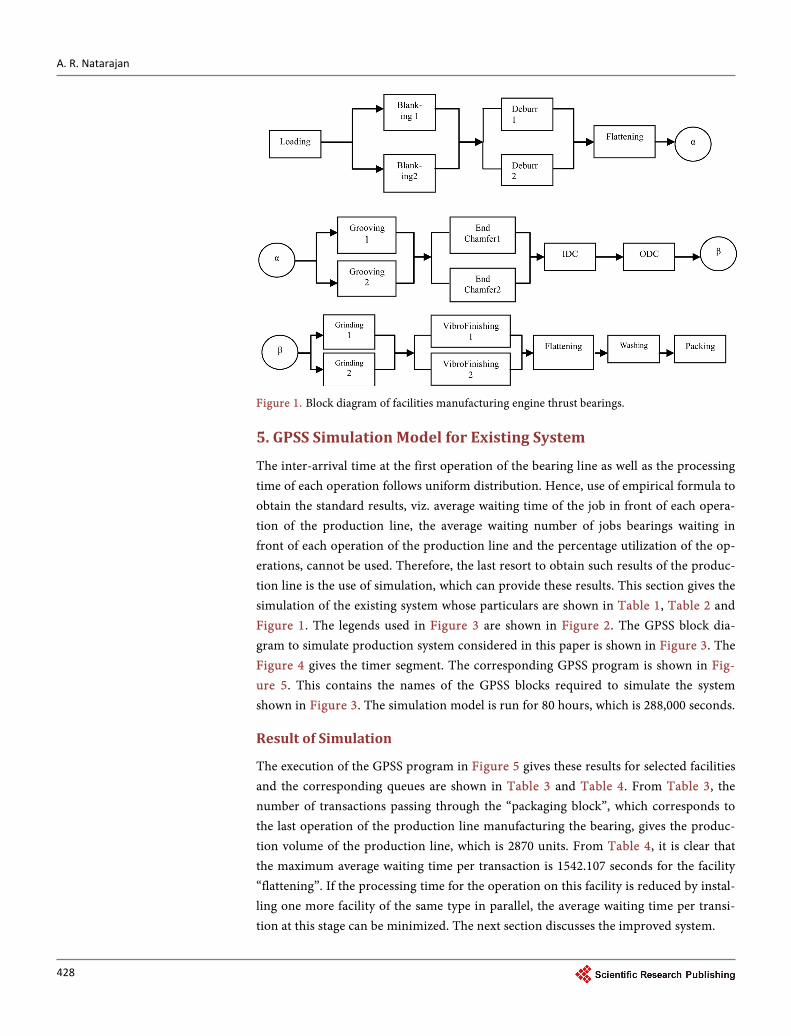
The different machines/operations of the production line manufacturing engine thrust bearings as per their sequence to manufacture that product are shown in Table 1. The processing time of each of the facilities shown in the Table 1 follows uniform distribution. The parameters of the uniform distribution of the processing times of the facilities are shown in Table 2. The block diagram of the facilities manufacturing the thrust bearing is shown in Figure 1.
Table 1. Machines/operations to manufacture engine thrust bearings.
Order of operation Name of set up
1 Blanking
2 Deburring
3 Flattening
4 Grooving
5 End-chamfer
6 IDC
7 ODC
8 Grinding
9 Vibro-finishing
10 Flattening
11 Washing
12 Packing
Table 2. Processing times of facilities.
Name of the facility Parameters of uniform distributions (A ± B)
Mean(seconds) Half-width(seconds)
Blanking 1.5 ±0
Deburring 1.5 ±0
Flattening 7 ±0
Grooving 5 ±0.2
End-Chamfer 5 ±0.2
IDC 9 ±1
ODC 10 ±1
Grinding 20 ±0.2
Vibro-Finishing 15 ±1
Flattening 2 ±0.2
Washing 2 ±0.2
Packing 3.5 ±0.5
A. R. Natarajan
428
Figure 1. Block diagram of facilities manufacturing engine thrust bearings.
5. GPSS Simulation Model for Existing System
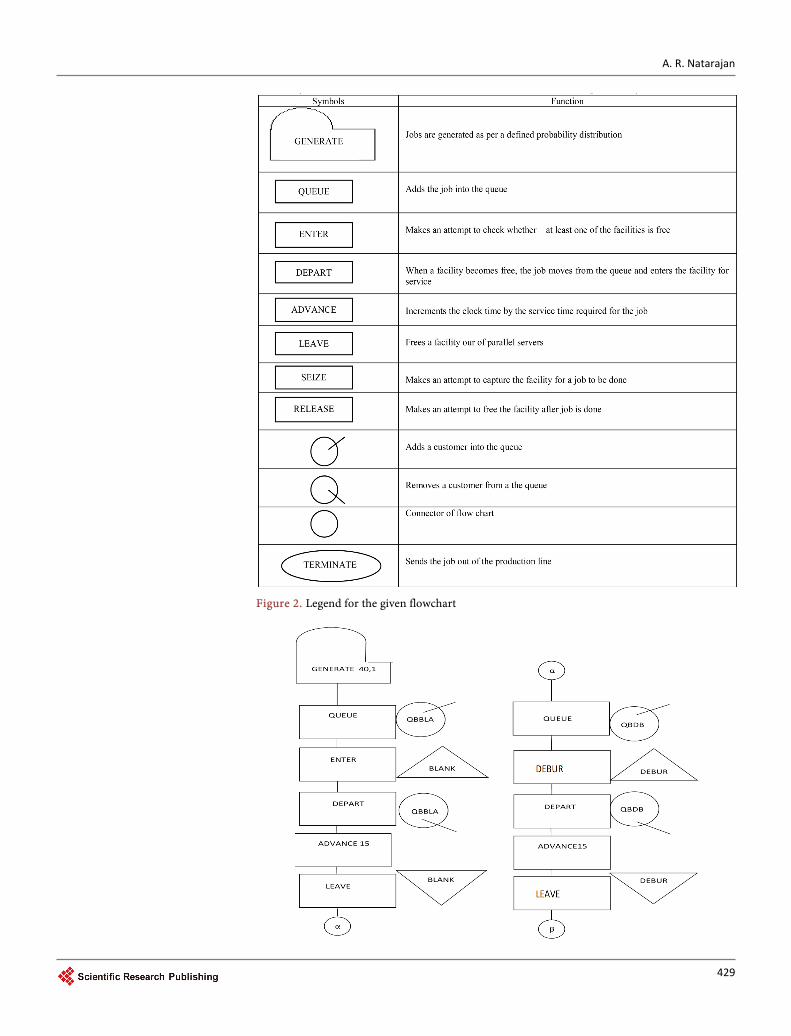
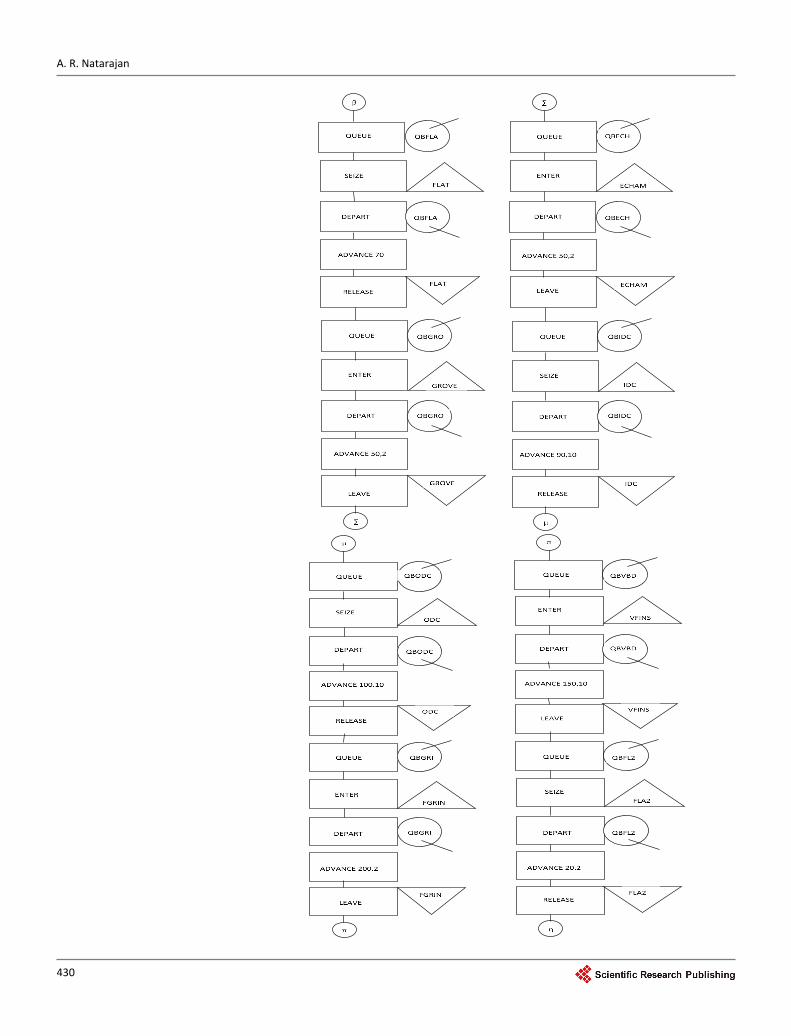
The inter-arrival time at the first operation of the bearing line as well as the processing time of each operation follows uniform distribution. Hence, use of empirical formula to obtain the standard results, viz. average waiting time of the job in front of each opera-tion of the production line, the average waiting number of jobs bearings waiting in front of each operation of the production line and the percentage utilization of the op-erations, cannot be used. Therefore, the last resort to obtain such results of the produc-tion line is the use of simulation, which can provide these results. This section gives the simulation of the existing system whose particulars are shown in Table 1, Table 2 and Figure 1. The legends used in Figure 3 are shown in Figure 2. The GPSS block dia-gram to simulate production system considered in this paper is shown in Figure 3. The Figure 4 gives the timer segment. The corresponding GPSS program is shown in Fig-ure 5. This contains the names of the GPSS blocks required to simulate the system shown in Figure 3. The simulation model is run for 80 hours, which is 288,000 seconds.
Result of Simulation
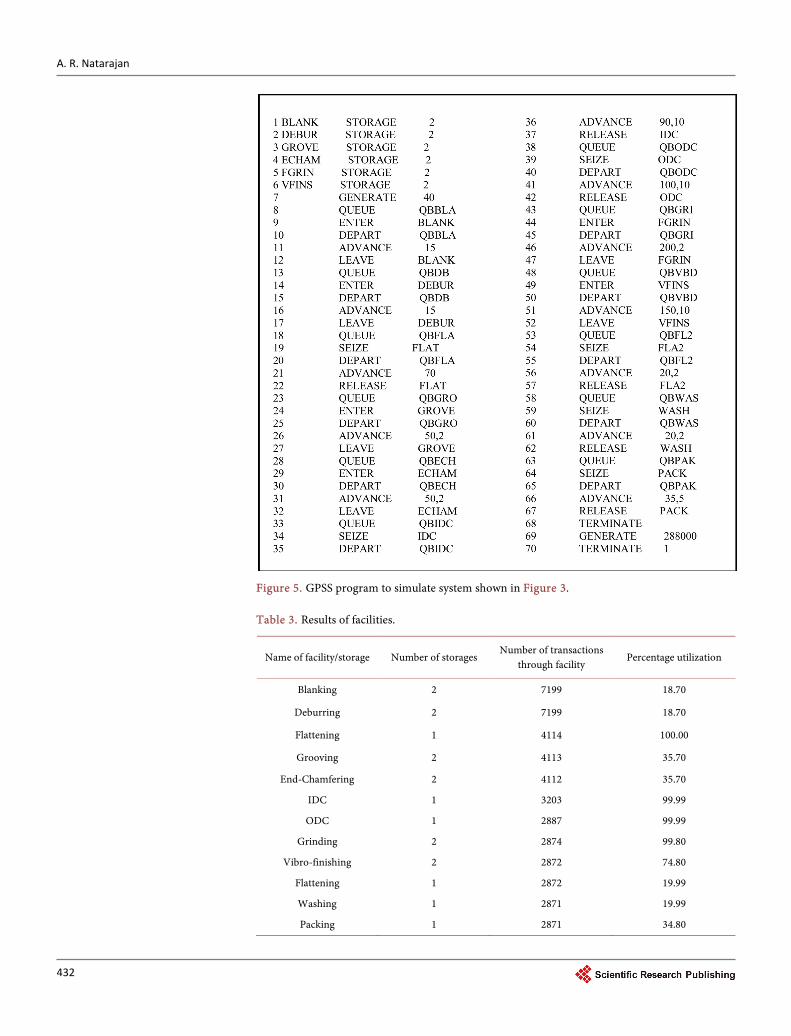
The execution of the GPSS program in Figure 5 gives these results for selected facilities and the corresponding queues are shown in Table 3 and Table 4. From Table 3, the number of transactions passing through the “packaging block”, which corresponds to the last operation of the production line manufacturing the bearing, gives the produc-tion volume of the production line, which is 2870 units. From Table 4, it is clear that the maximum average waiting time per transaction is 1542.107 seconds for the facility “flattening”. If the processing time for the operation on this facility is reduced by instal-ling one more facility of the same type in parallel, the average waiting time per transi-tion at this stage can be minimized. The next section discusses the improved system.
A. R. Natarajan
429
Figure 2. Legend for the given flowchart
A. R. Natarajan
430
A. R. Natarajan
431
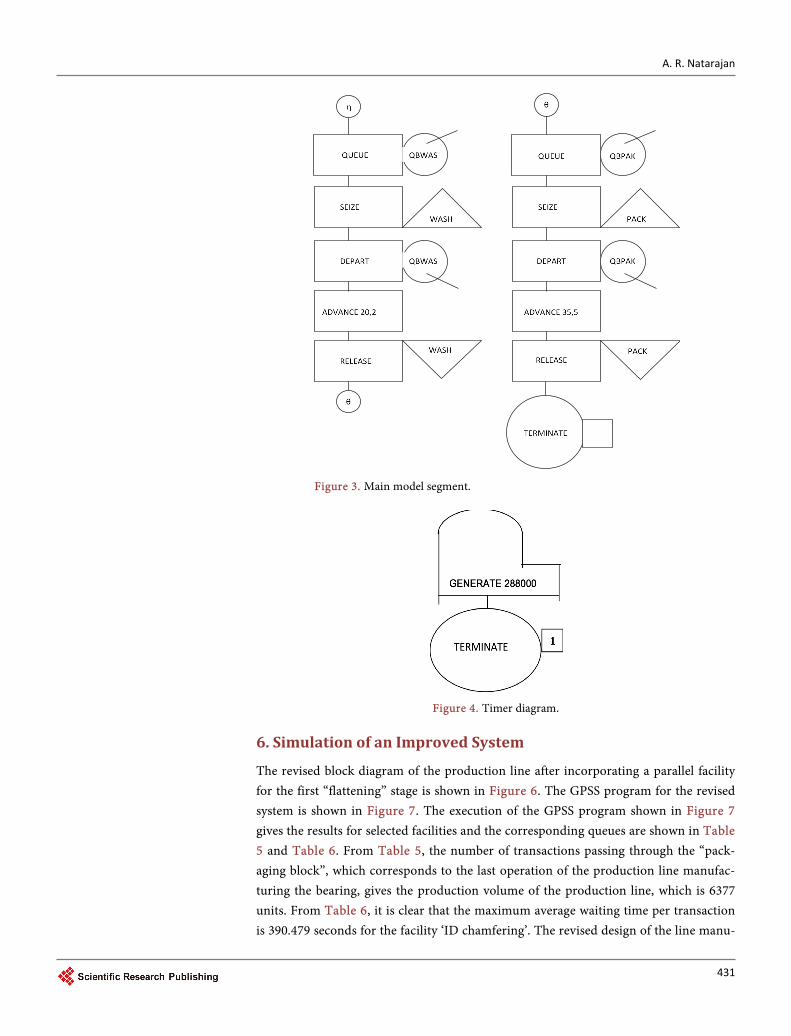
Figure 3. Main model segment.
Figure 4. Timer diagram.
6. Simulation of an Improved System
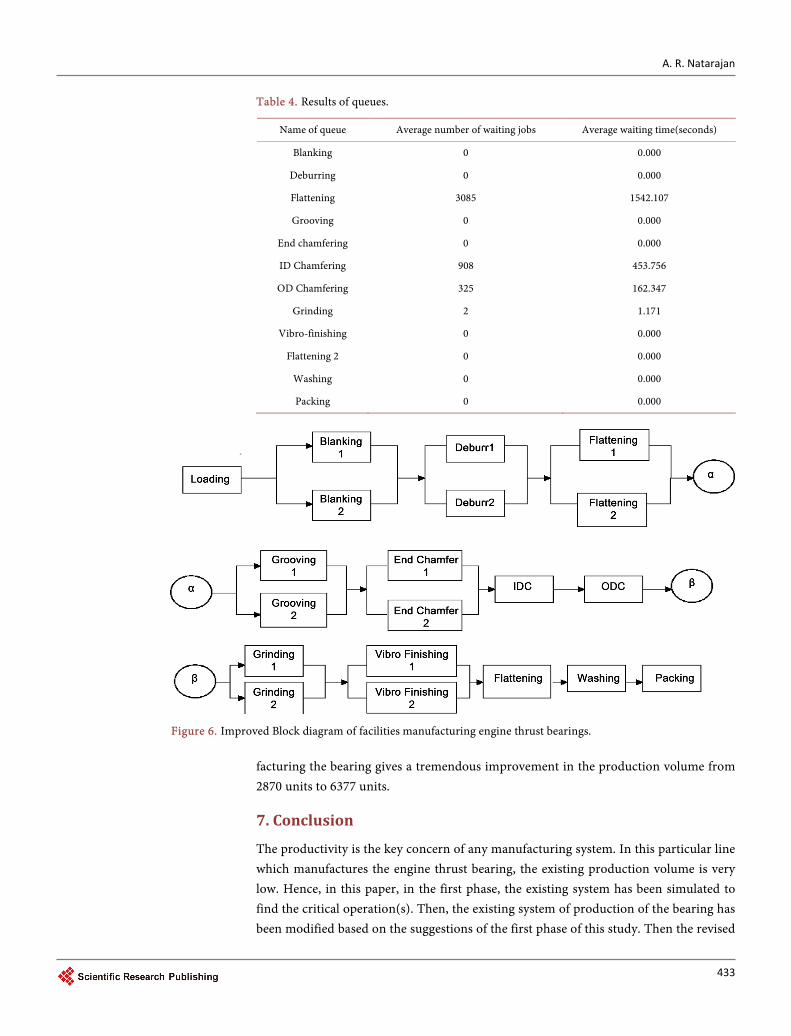
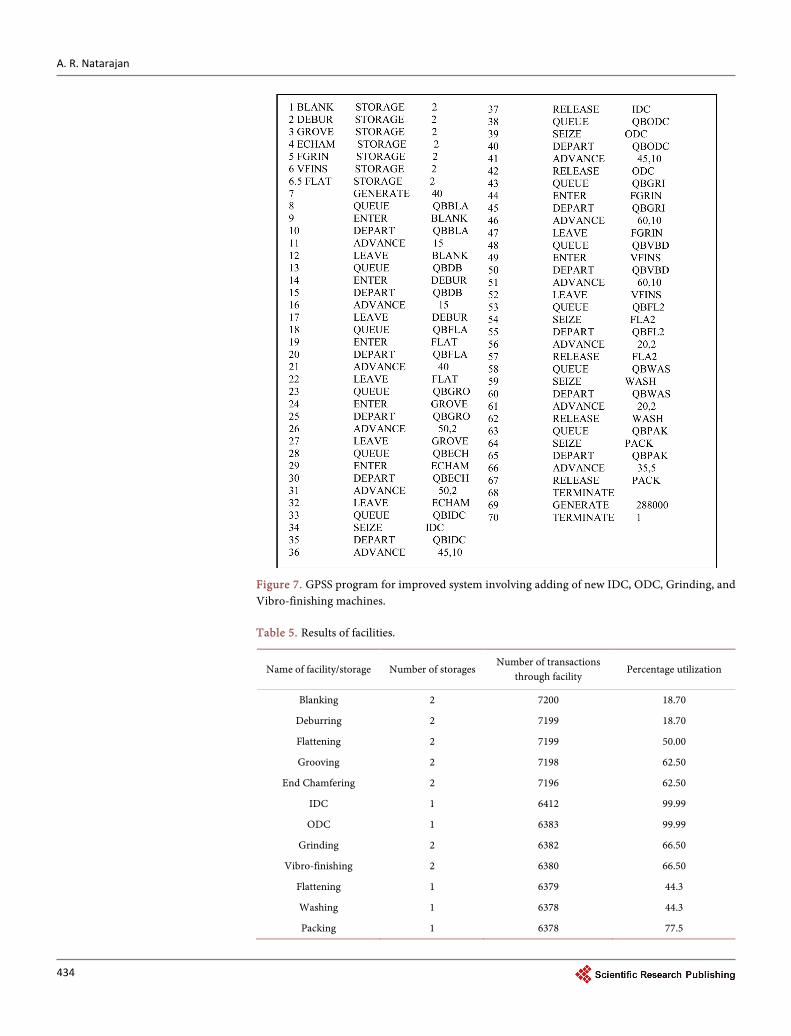
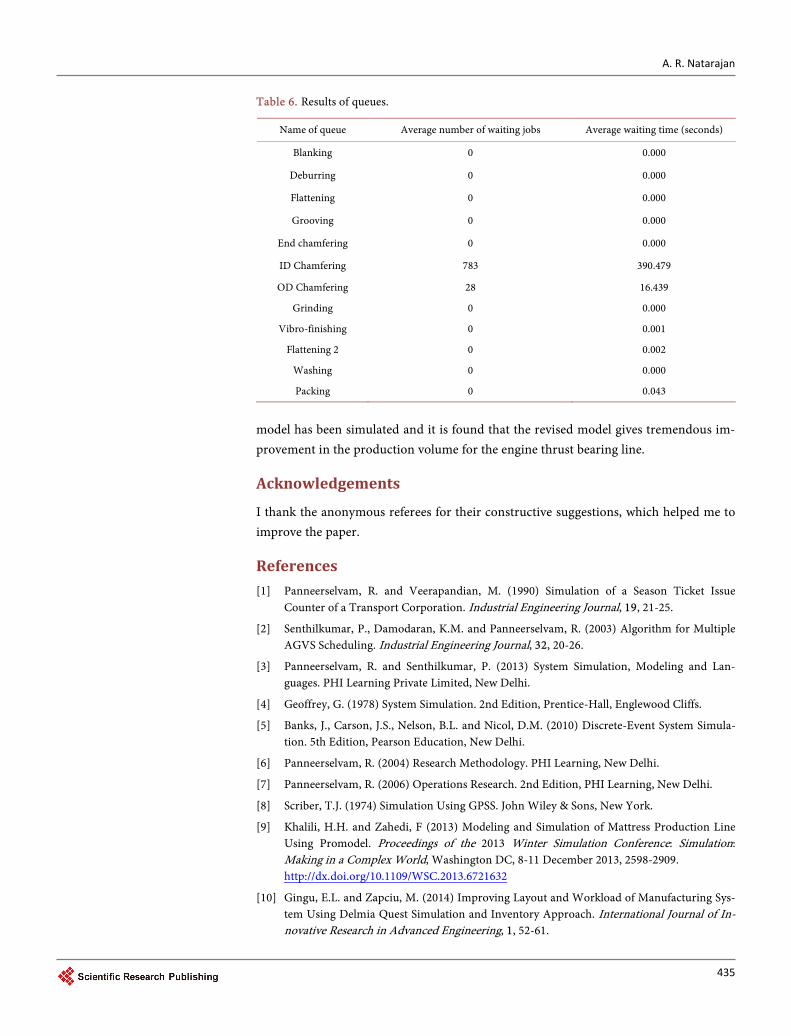
The revised block diagram of the production line after incorporating a parallel facility for the first “flattening” stage is shown in Figure 6. The GPSS program for the revised system is shown in Figure 7. The execution of the GPSS program shown in Figure 7 gives the results for selected facilities and the corresponding queues are shown in Table 5 and Table 6. From Table 5, the number of transactions passing through the “pack-aging block”, which corresponds to the last operation of the production line manufac-turing the bearing, gives the production volume of the production line, which is 6377 units. From Table 6, it is clear that the maximum average waiting time per transaction is 390.479 seconds for the facility ‘ID chamfering’. The revised design of the line manu-
A. R. Natarajan
432
Figure 5. GPSS program to simulate system shown in Figure 3.
Table 3. Results of facilities.
Name of facility/storage Number of storages Number of transactions
through facility Percentage utilization
Blanking 2 7199 18.70
Deburring 2 7199 18.70
Flattening 1 4114 100.00
Grooving 2 4113 35.70
End-Chamfering 2 4112 35.70
IDC 1 3203 99.99
ODC 1 2887 99.99
Grinding 2 2874 99.80
Vibro-finishing 2 2872 74.80
Flattening 1 2872 19.99
Washing 1 2871 19.99
Packing 1 2871 34.80
A. R. Natarajan
433
Table 4. Results of queues.
Name of queue Average number of waiting jobs Average waiting time(seconds)
Blanking 0 0.000
Deburring 0 0.000
Flattening 3085 1542.107
Grooving 0 0.000
End chamfering 0 0.000
ID Chamfering 908 453.756
OD Chamfering 325 162.347
Grinding 2 1.171
Vibro-finishing 0 0.000
Flattening 2 0 0.000
Washing 0 0.000
Packing 0 0.000
Figure 6. Improved Block diagram of facilities manufacturing engine thrust bearings.
facturing the bearing gives a tremendous improvement in the production volume from 2870 units to 6377 units.
7. Conclusion
The productivity is the key concern of any manufacturing system. In this particular line which manufactures the engine thrust bearing, the existing production volume is very low. Hence, in this paper, in the first phase, the existing system has been simulated to find the critical operation(s). Then, the existing system of production of the bearing has been modified based on the suggestions of the first phase of this study. Then the revised
A. R. Natarajan
434
Figure 7. GPSS program for improved system involving adding of new IDC, ODC, Grinding, and Vibro-finishing machines.
Table 5. Results of facilities.
Name of facility/storage Number of storages Number of transactions
through facility Percentage utilization
Blanking 2 7200 18.70
Deburring 2 7199 18.70
Flattening 2 7199 50.00
Grooving 2 7198 62.50
End Chamfering 2 7196 62.50
IDC 1 6412 99.99
ODC 1 6383 99.99
Grinding 2 6382 66.50
Vibro-finishing 2 6380 66.50
Flattening 1 6379 44.3
Washing 1 6378 44.3
Packing 1 6378 77.5
A. R. Natarajan
435
Table 6. Results of queues.
Name of queue Average number of waiting jobs Average waiting time (seconds)
Blanking 0 0.000
Deburring 0 0.000
Flattening 0 0.000
Grooving 0 0.000
End chamfering 0 0.000
ID Chamfering 783 390.479
OD Chamfering 28 16.439
Grinding 0 0.000
Vibro-finishing 0 0.001
Flattening 2 0 0.002
Washing 0 0.000
Packing 0 0.043
model has been simulated and it is found that the revised model gives tremendous im-provement in the production volume for the engine thrust bearing line.
Acknowledgements
I thank the anonymous referees for their constructive suggestions, which helped me to improve the paper.
References [1] Panneerselvam, R. and Veerapandian, M. (1990) Simulation of a Season Ticket Issue
Counter of a Transport Corporation. Industrial Engineering Journal, 19, 21-25.
[2] Senthilkumar, P., Damodaran, K.M. and Panneerselvam, R. (2003) Algorithm for Multiple AGVS Scheduling. Industrial Engineering Journal, 32, 20-26.
[3] Panneerselvam, R. and Senthilkumar, P. (2013) System Simulation, Modeling and Lan-guages. PHI Learning Private Limited, New Delhi.
[4] Geoffrey, G. (1978) System Simulation. 2nd Edition, Prentice-Hall, Englewood Cliffs.
[5] Banks, J., Carson, J.S., Nelson, B.L. and Nicol, D.M. (2010) Discrete-Event System Simula-tion. 5th Edition, Pearson Education, New Delhi.
[6] Panneerselvam, R. (2004) Research Methodology. PHI Learning, New Delhi.
[7] Panneerselvam, R. (2006) Operations Research. 2nd Edition, PHI Learning, New Delhi.
[8] Scriber, T.J. (1974) Simulation Using GPSS. John Wiley & Sons, New York.
[9] Khalili, H.H. and Zahedi, F (2013) Modeling and Simulation of Mattress Production Line Using Promodel. Proceedings of the 2013 Winter Simulation Conference: Simulation: Making in a Complex World, Washington DC, 8-11 December 2013, 2598-2909. http://dx.doi.org/10.1109/WSC.2013.6721632
[10] Gingu, E.L. and Zapciu, M. (2014) Improving Layout and Workload of Manufacturing Sys-tem Using Delmia Quest Simulation and Inventory Approach. International Journal of In-novative Research in Advanced Engineering, 1, 52-61.
Submit or recommend next manuscript to SCIRP and we will provide best service for you:
Accepting pre-submission inquiries through Email, Facebook, LinkedIn, Twitter, etc. A wide selection of journals (inclusive of 9 subjects, more than 200 journals) Providing 24-hour high-quality service User-friendly online submission system Fair and swift peer-review system Efficient typesetting and proofreading procedure Display of the result of downloads and visits, as well as the number of cited articles Maximum dissemination of your research work
Submit your manuscript at: http://papersubmission.scirp.org/ Or contact [email protected]