Embed Size (px)
Citation preview

The Design of Optimal Material Combinations for the Membrane Electrode Assembly of a Proton Exchange
Membrane Fuel Cell
by Elizabeth Stockton Howard May 2006
Advisor: Jay B. Benziger
Submitted in partial fulfillment of the requirements for the degree of Bachelor of Science in Engineering.
Department of Chemical Engineering and
Environmental Studies Certificate Program Princeton University


This thesis represents my own work in accordance with University regulations. I authorize Princeton University to lend this thesis to other institutions or individuals for the purpose of scholarly research.
Elizabeth Stockton Howard
I further authorize Princeton University to reproduce this thesis by photocopying or by other means, in total or in part, at the request of other institutions or individuals for the purpose of scholarly research.
Elizabeth Stockton Howard
ii

iii

Princeton University requires the signatures of all persons using or photocopying this thesis. Please sign below and give address and date.
iv

v

I would like to dedicate this work to my older brother George, my parents, and my peers in the Chemical Engineering department whose positivism, humor, and laid-back attitudes have been the key to my survival through
four years in Chemical Engineering at Princeton.
vi

vii

Acknowledgements
I would like to thank Professor Jay B. Benziger for being my advisor and
professor through four years at Princeton, Professor Andrew Bocarsly for supervising my
experimental work in the Bocarsly Fuel Cell Laboratory, Paul Majsztrik for his unlimited
patience, assistance, and company, Barclay Satterfield and Erin Kimball for their
assistance in the Benziger lab, the School of Engineering and Science administrative
staff, particularly Dean Bogucki, Vanessa Carter, Sharon Kulik and Hema Ramamurthy,
and last but not least, my peers in the Chemical Engineering department for making it all
worth it.
viii

ix

Abstract Fuel cells efficiently convert fuel (usually hydrogen) directly into DC electricity
and are intrinsically nonpolluting. Polymer electrolyte membrane fuel cells incorporate a
polymer exchange membrane electrolyte and therefore are lightweight and operate
between 60 and 100 0C, which makes them ideal candidates for use in automobiles.
However, the price of fuel cell materials such as the polymer membrane and the catalyst
materials must be reduced and oxygen reduction reaction (ORR) kinetics at the cathode
must be facilitated in order to boost fuel cell performance. Platinum, an expensive but
common catalyst in polymer electrolyte membrane fuel cells, is highly adsorptive of
intermediates and therefore inhibits the already slow ORR. The adsorptive character of
platinum alloys is weaker, allowing the ORR rate to increase. Gold, which is less
expensive than platinum, lacks adsorptive character but when combined with other metals
in alloys does not lead to an increase in catalytic activity compared to platinum. Gold,
when combined in an isopropanol slurry with platinum and applied to the surface of the
cathode was found to increase the catalytic activity significantly. Mixtures containing
various percent weights gold to platinum were tested at four conditions. The best results
were obtained at the low temperature, low relative humidity testing condition. Maximum
power density increased with weight percent gold, peaked between 40 wt. % gold and 60
wt. % gold, then decreased with further increase in weight percent gold. The 40 wt. %
gold cathode catalyst offers as much as a 54% improvement in power density over the
platinum cathode catalyst. The 60 wt. % gold cathode catalyst offers as much as a 66%
improvement over the platinum cathode catalyst. Although many barriers lie between
current energy technologies and a fuel cell powered future, incorporating gold in the
catalyst layer at the cathode proves to be a significant step forward.
x

Table of Contents
A. Acknowledgements
viii Abstract x
I. Introduction A. What Is A Fuel Cell? 1 B. Advantages 4 C. Hydrogen as a Fuel 6 D. Types of Fuel Cells 10 E. PEMFCs 12
II. Background A. Membrane Electrode Assemblies 17
B. Polymer Electrolyte Membranes 18 C. Electrode Structure 22
D.The Catalyst Layer 1. The Role of Catalysts in a PEMFC 25 2. Platinum and Platinum Alloy Catalysts 32 3. Gold and Gold Alloy Catalysts 36
III. Laboratory Procedure 39
IV. Results and Discussion 46
V. Conclusion 78
xi

List of Tables Table 1. Exchange Current Densities for the 28 Hydrogen-electrode Reaction on Some Metals in H2SO4 at 25 0C Table 2. Exchange Current Densities for the 28 Oxygen-electrode Reaction on Some Metals at 25 0C Table 3. A Comparison of Exchange Current 31 Densities for Several Reactions with that of the Oxygen-dissolution Reaction at 25 0C Table 4. Catalyst slurry compositions 39 Table 5. Maximum power densities at 60 0C, 46 8.0 ml/min H2, 4.0 ml/min O2 Table 6. Maximum power densities at 60 0C, 59-60 12.0 ml/min H2, 6.0 ml/min O2 Table 7. Maximum power densities at 90 0C, 69 12.0 ml/min H2, 6.0 ml/min O2 Table 8. Maximum power densities at 90 0C, 71 8.0 ml/min H2, 4.0 ml/min O2 Table 9. Maximum Current Densities (A/cm2) 75
xii

List of Figures Figure 1. PEMFC Schematic 15 Figure 2. Reaction mechanism for 26 oxidation of hydrogen Figure 3. Airbrush used for spraying 40 technique Figure 4. Carbon cloth electrode material 40 after being sprayed Figure 5. Finished MEA 41 Figure 6. Laboratory setup for testing of 42 MEAs Figure 7. Platinum-Platinum MEA #2, 44 60 0C, 8.0 H2, 4.0 O2 Figure 8. Platinum-50 MEA #2 at 60 0C, 48 8.0 ml/min H2, 4.0 ml/min O2 Figure 9. Platinum-25 MEA #1 at 60 0C, 49 8.0 ml/min H2, 4.0 ml/min O2 Figure 10. Platinum-25 MEA #2 at 60 0C, 50 8.0 ml/min H2, 4.0 ml/min O2 Figure 11. Platinum-40 MEA #2 at 60 0C, 51 8.0 ml/min H2, 4.0 ml/min O2 Figure 12. Platinum-50 MEA #1 at 60 0C, 51 8.0 ml/min H2, 4.0 ml/min O2 Figure 13. Platinum-60 MEA #2 at 60 0C, 52 8.0 ml/min H2, 4.0 ml/min O2
xiii
Figure 14. Platinum-75 MEA #2 at 60 0C, 52 8.0 ml/min H2, 4.0 ml/min O2 Figure 15. Current and Voltage vs. Time for 53 Platinum-40 MEA #2 at 600 C, 8.0 ml/min H2, 4.0 ml/min O2 Figure 16. Platinum-Platinum MEA #2 at 54 60 0C, 8.0 ml/min H2, 4.0 ml/min O2 Figure 17. Platinum-40 MEA #1 at 60 0C, 54 8.0 ml/min H2, 4.0 ml/min O2 Figure 18. Platinum-40 MEA #2 at 60 0C, 55 8.0 ml/min H2, 4.0 ml/min O2 Figure 19. Platinum-50 MEA #1 at 60 0C, 55 8.0 ml/min H2, 4.0 ml/min O2 Figure 20. Platinum-50 MEA #3 at 60 0C, 56 8.0 ml/min H2, 4.0 ml/min O2 Figure 21. Platinum-60 MEA #1 at 60 0C, 56 8.0 ml/min H2, 4.0 ml/min O2 Figure 22. Platinum-75 MEA #1 at 60 0C, 57 8.0 ml/min H2, 4.0 ml/min O2 Figure 23. Platinum-75 MEA #1 at 60 0C, 58 8.0 ml/min H2, 6.0 ml/min O2 Figure 24. Platinum-75 MEA #1 at 60 0C, 58 10.0 ml/min H2, 4.0 ml/min O2 Figure 25. Platinum-40 MEA #2 at 60 0C, 61 12.0 ml/min H2, 6.0 ml/min O2 Figure 26. Platinum-50 MEA #1 at 60 0C, 61 12.0 ml/min H2, 6.0 ml/min O2
xiv

Figure 27. Platinum-Platinum MEA #2 at 60 0C, 62 12.0 ml/min H2, 6.0 ml/min O2 Figure 28. Platinum-25 MEA #1 at 60 0C, 63 12.0 ml/min H2, 6.0 ml/min O2 Figure 29. Platinum-40 MEA #1 at 60 0C, 64 12.0 ml/min H2, 6.0 ml/min O2 Figure 30. Platinum-40 MEA #2 at 60 0C, 64 12.0 ml/min H2, 6.0 ml/min O2 Figure 31. Platinum-50 MEA #1 at 60 0C, 65 12.0 ml/min H2, 6.0 ml/min O2 Figure 32. Platinum-50 MEA #2 at 60 0C, 65 12.0 ml/min H2, 6.0 ml/min O2 Figure 33. Platinum-50 MEA #3 at 60 0C, 66 12.0 ml/min H2, 6.0 ml/min O2 Figure 34. Platinum-60 MEA #1 at 60 0C, 66 12.0 ml/min H2, 6.0 ml/min O2 Figure 35. Platinum-60 MEA #2 at 60 0C, 67 12.0 ml/min H2, 6.0 ml/min O2 Figure 36. Platinum-75 MEA #1 at 60 0C, 67 12.0 ml/min H2, 6.0 ml/min O2 Figure 37. Platinum-75 MEA #2 at 60 0C, 68 12.0 ml/min H2, 6.0 ml/min O2 Figure 38. Platinum-40 MEA #2 at 90 0C, 70 12.0 ml/min H2, 6.0 ml/min O2 Figure 39. Platinum-40 MEA #2 at 90 0C, 72 8.0 ml/min H2, 4.0 ml/min O2
xv

xvi
Figure 40. Platinum-60 MEA #1 at 90 0C, 73 8.0 ml/min H2, 4.0 ml/min O2 Figure 41. Platinum-60 MEA #2 at 90 0C, 73 8.0 ml/min H2, 4.0 ml/min O2 Figure 42. Platinum-Platinum MEA #1 at 74 90 0C, 8.0 ml/min H2, 4.0 ml/min O2

I. INTRODUCTION
A. What Is A Fuel Cell?
A fuel cell acts as a highly efficient and intrinsically nonpolluting electrochemical
energy converter that converts the chemical energy of a fuel, usually hydrogen, directly
into DC electricity. The many advantages of fuel cells mandate their eventual mass
production and cost reduction. The design of fuel cell technology involves components
such as available fuels and their processing, the electrochemical processes, especially
electrocatalysis, and systems technology for complete fuel cell aggregates including the
control of gas, water and heat management. An English physicist, William R. Grove, first
invented fuel cell technology in 1839 and found that the electrochemical processes
involved take place on the electrode surface at the line where the liquid phase, the gas
phase, and the solid platinum catalyst met and, in so doing, opened the inquiry into
increasing the efficiency of fuel cells via improvements of the catalyst layer. Although
there are currently several types of fuel cells, the polymer electrolyte membrane fuel cell
(PEMFC) is most likely to be incorporated in automobiles and offer significant emissions
advantages. The primary areas of PEMFC development fall under two categories: the
development of a hydrogen infrastructure and the mass production of efficient membrane
electrode assemblies. The work presented in this paper focuses on membrane electrode
assembly fabrication and the electrocatalysis of the chemical reactions at the electrodes.
Every fuel cell has two electrodes, one positive and one negative, called, respectively,
the cathode and the anode and this is where the electricity-producing reactions occur
H2 2H+ + 2e- Eq. 1 Reaction at the anode
½ O2 + 2H+ + 2e- H2O Eq. 2 hode Reaction at the cat
H2 2H+ + 2e- ½ O2 + 2H+ + 2e- H2O Eq. 1 Reaction at the anode Eq. 2 hode Reaction at the cat

simultaneously at the three-phase interface discovered by Grove. These electrochemical
reactions are:
The overall reaction is the oxidation of hydrogen to produce water:
Hydrogen atoms enter a fuel cell at the anode and are adsorbed on the anode where a
chemical reaction strips them of their electrons resulting in protons. The protons move
through an electrolyte, which acts as an ionic conductor, under a chemical potential
gradient from the anode to the cathode. The negatively charged electrons move through
an external circuit, providing the current through the wires to do work. Oxygen enters the
fuel cell at the cathode and, in some cell types, it combines with the electrons returning
from the electrical circuit and the hydrogen ions that have traveled through the electrolyte
from the anode. Every fuel cell also has an electrolyte, which carries electrically charged
particles from one electrode to the other, and a catalyst, which speeds up the reactions at
the electrodes. Hydrogen is typically the fuel but fuel cells also require oxygen. One
important advantage of fuel cells is their ability to generate electricity with very little
pollution – most of the hydrogen and oxygen used in generating electricity combine to
form a harmless byproduct, water. Although a single fuel cell generates a small amount
of direct current (DC) electricity, more than one fuel cell may be assembled into a stack
to create more current.
Eq. 3 Overall fuel cell reaction
H2 + ½ O2 H2O
Because the overall reaction in a hydrogen fuel cell is the same as the reaction of
hydrogen combustion, the heat of the reaction is the same as the enthalpy (or heating
value) of hydrogen and the thermodynamics of fuel cells can be derived from this value.
The combustion of hydrogen is an exothermic reaction, releasing 286 kJ/mol at 25 0C,
2
which is equivalent to saying that the enthalpy of hydrogen is –286 kJ/mol at 25 0C. This
heating value is a measure of the energy input in a fuel cell. It is the maximum amount of
thermal energy that may be extracted from hydrogen. However, not all of this energy can
be converted into electricity because a portion of the energy is converted into entropy.
The portion that can be converted into electricity is known as the Gibbs free energy and is
equivalent to 237.34 kJ/mol at 25 0C. The remaining 48.68 kJ/mol is converted into heat.
Using the mathematical expression for work, an expression can be derived that relates the
theoretical potential for fuel cells to the Gibbs free energy. The theoretical potential of a
fuel cell is 1.23 Volts at 25 0C.i An increase in cell temperature results in a lower
theoretical cell potential. However, at higher currents in operating fuel cells, a higher cell
temperature results in a higher cell potential because the voltage losses in operating fuel
cells decrease with temperature and this more than compensates for the loss of theoretical
cell potential. As the current approaches zero, the voltage is larger at lower temperatures
and does not increase with an increase in temperature. If a fuel cell is supplied with
reactant gases but the electrical circuit is open, it will not generate any current and the
cell potential is expected to be at, or at least close to, the theoretical cell potential for the
given conditions (temperature, pressure, and concentration of reactants). This is known as
the open circuit potential and is significantly lower than the theoretical potential –
usually less than 1 volt. Voltage losses can be attributed to the following factors: kinetics
of electrochemical reactions, internal electrical and ionic resistance, difficulties in getting
the reactants to reaction sites, internal (stray) currents, and crossover of reactants.ii iiiThe
purpose of fuel cell technology development is to mitigate these voltage losses and
increase the practical, or operating, efficiency of the fuel cell.
3

B. Advantages Fuel cells have many important advantages that necessitate their mass production and
cost reduction. These advantages fall under two broad categories: the high theoretical
energy conversion efficiency and a potential for sharp reduction of power source
emissions. The theoretical Carnot efficiency can be calculated using Equation 4.iv
Eq. 4
1
2
1
21 1TT
TTT
HW
Carnot −=−
=Δ
=η
However, fuel cells do not underlie the limitations of the thermodynamic Carnot cycle.
The theoretical conversion efficiency for a fuel cell directly converting hydrogen to
electric power at operation temperatures typical for a polymer electrolyte fuel cell (30 0C
– 100 0C) is therefore far greater than that of a heat engine such as an internal combustion
engine. The theoretical conversion efficiency for direct fuel conversion is equivalent to
the ratio between the useful energy output (the electrical energy produced) and the energy
input (the enthalpy of hydrogen). The enthalpy of hydrogen is equal to –286 kJ/mol (at 25
0C). The portion that can be converted into electricity is the Gibbs free energy (ΔG = ΔH
- TΔS). The ratio between the Gibbs free energy and the enthalpy of hydrogen gives a
theoretical efficiency of 83%. Whereas the ideal or maximum efficiency of an
electrochemical energy converter depends upon electrochemical thermodynamics, the
real efficiency depends on electrode kinetics.v The practical energy conversion efficiency
of a fuel cell system, which usually consists of the cell stack, fuel and air supply system,
4

water and heat extraction system, cooling system, and the control unit, ranges between 35
and 70% even at temperatures under 100 0C. The practical energy conversion efficiency
of heat engines is well below 30% and approaches 50% only for large turbines operating
at much higher temperatures. Fuel cells operating at or near ambient temperatures at
higher efficiencies (or power per weight) are important for mobile applications and since
power is the rate of producing energy, the kinetics of the electricity-producing interfacial
charge-transfer reactions (electrode kinetics) are important as well.vi
The simplicity of fuel cells is also an important advantage over heat engines. The
layers of repetitive components that comprise fuel cells and the lack of any moving parts
indicate the potential for mass production of fuel cells at a cost comparable to that of
existing energy conversion technologies or even lower.vii The lack of moving parts also
promises a long operational lifespan for fuel cell units. Furthermore, the fact that fuel
cells are modular – more power may be generated simply by adding more cells –
indicates that mass produced fuel cells may be significantly less expensive than
traditional power plants. As opposed to some heat engines, fuel cells are quiet. Their size
and weight also make them particularly convenient for a wide variety of applications.
In addition to the energy efficiency and simplicity of fuel cell technology, there also
exists a potential for lowering or eliminating altogether hazardous emissions and
reducing greenhouse gas emissions. CO2 emissions could be lowered according to the
ratio of efficiencies of combustion and electrochemical conversions of fuel energy, which
could mean a potential drop in CO2 emissions by as much as 50% per mile driven.viii
There is no nitrogen oxide (a major pollutant emitted by internal combustion engines)
generated by a fuel cell because of the much lower temperature than that of an internal
5

combustion engine. Other hazardous emissions (e.g. carbon monoxide) are also
drastically lower in a fuel cell powered vehicle and are brought to zero when hydrogen is
used as the fuel for a polymer electrolyte membrane fuel cell (PEMFC). In this case,
water vapor becomes the only exhaust and hydrogen fuel cell vehicles are therefore
known as true “zero emission vehicles”. For fuel cell vehicles that do not use pure
hydrogen as a fuel but instead have an onboard reformer, tailpipe emissions are projected
to be a small fraction of emissions from internal combustion engine technologies.
Although it is important to consider the full fuel cycle in evaluating fuel cell vehicles
with onboard reformers, it is still possible to reduce full fuel greenhouse gas emissions by
as much as 50% and lower emissions of other criteria air pollutants such as CO, VOCs,
NOx, SOx, and particulates with gasoline or diesel internal combustion engine hybrids
compared to today’s gasoline cars.ix Fuel cell vehicles can have even lower full fuel cycle
emissions than internal combustion engine hybrids, depending on the fuel and primary
energy source.
C. Hydrogen as a Fuel
Fuel cell vehicles using hydrogen potentially offer the lowest full fuel cycle emissions
of any alternative and also the widest range of primary supply options.x Hydrogen is the
best long-term option for fuel cell vehicles not only because of its environmental and
energy supply benefits but also in terms of vehicle first cost and lifecycle costs. However,
the necessary refueling infrastructure is extremely daunting and costly for hydrogen as
opposed to liquid fuels. The availability of onboard hydrogen storage systems that are
compact and available at low cost is also an issue. The onboard storage problem stems
from several chemical properties of hydrogen. Hydrogen has a high heat of combustion
6
(120 MJ/kg), which is nearly three times higher than the comparable values for gasoline
and diesel, and also has a very low density. The energy content of hydrogen is only
9MJ/l. The necessary onboard storage volume for hydrogen therefore has to be larger
than for conventional fuels. However, the wealth of options for sources of hydrogen
mandate the development of onboard storage, despite the difficulties involved with such
storage systems.
There are two different possibilities for providing hydrogen to a fuel cell within a
vehicle: onboard reformers and hydrogen production outside the vehicle. Small-scale
onboard reformers could be integrated as components of the fuel cell system. In
particular, natural gas reformers could be coupled with phosphoric acid or proton
exchange membrane fuel cell cogeneration systems. Onboard fuel processors could be
used to process methanol or gasoline, producing hydrogen for the fuel cell. Although
these reformers are typically designed to produce a reformate gas containing 40-70%
hydrogen, they could be adapted to include purification stages to produce pure hydrogen.
Reforming can also take place outside the vehicle. In this case, a variety of hydrogen
sources could be utilized but the hydrogen would have to be transported to a refueling
station and an infrastructure would have to be developed to accommodate for such
refueling stations. Onboard fuel processors offer a possible transition to a more
complicated, national hydrogen infrastructure.
Methanol reforming seems to be one of the more promising alternatives in terms of
building a hydrogen infrastructure. With the correct catalyst, methanol can be converted
into a hydrogen-rich stream via steam reforming with water (see Eq. 5) at temperatures as
Eq. 5 CH3OH + H2O CO2 + 3H2
7

low as 200 0C, which is much lower than the temperatures required for liquid or gaseous
hydrocarbons such as gasoline.
At modest pressures the equilibrium conversion is high (above 99%) and the tendency to
form unwanted byproducts is low. The methanol reforming reaction is endothermic and
no other liquid fuel, not even ethanol, can be catalytically converted to yield hydrogen at
as low a temperature as methanol. The main problems with methanol involve availability
and special handling requirements. Although methanol might provide an easy transition
from gasoline-powered vehicles to fuel cell powered vehicles, it would necessarily imply
an extra fuel in the transition process. Other options for building a hydrogen
infrastructure involve transitioning directly from gasoline fuel processors to fuel cell cars
or using hydrogen refueling stations first in centrally refueled fleets and then moving to
general automotive markets.
If onboard reformers are not utilized in fuel cell vehicles then the hydrogen must be
produced elsewhere and piped or carried via truck to refueling stations. Fossil feed stocks
such as natural gas or coal may offer the lowest hydrogen costs in many locations, with
local contributions from electrolysis powered by low cost hydropower, while at the same
time reducing dependence on foreign petroleum supplies. If fuel decarbonization and/or
carbon sequestration is pursued it is possible that fossil fuels could be used for
transportation with near zero emissions of carbon to the atmosphere.xi Currently, over
90% of hydrogen is made thermochemically by processing hydrocarbons in high
temperature chemical reactors to make a synthetic gas (“syngas”), which is comprised of
hydrogen, CO, CO2, H2O, and CH4.xii Syngas is further processed to increase the
hydrogen content and pure hydrogen is separated out of the mixture.
8

Another option for hydrogen production is the use of renewable resources such as
wastes, biomass, solar power, or wind power. Solar and wind power in particular could
be used for electrolytic hydrogen production, which could meet the projected global
demand for fuel. However, the delivered cost for such methods is projected to be about
two to three times that for hydrogen from natural gas reformation.xiii Where low cost,
renewable source electricity is available; water electrolysis is used to produce hydrogen.
In this process, electricity is passed through a conducting aqueous electrolyte, breaking
water down into hydrogen and oxygen. The hydrogen can then be compressed and stored
for later use. If solar or wind power is incorporated and a dense electricity grid with
sufficient capacity exists, the most efficient way to supply the energy to the user is
electricity. However, if the grid does not possess any spare capacities, the energy can be
converted into hydrogen via electrolysis– a storable form of energy – offering up a
viable, fuel cell-based solution for the problem of incorporating renewable power sources
into the current grid system.
Once produced, hydrogen can be stored as a compressed gas, cryogenic liquid, or in a
compound such as a metal hydride or ammonia. The use of hydrogen as an automotive
fuel requires storage systems that have inherent safety as well as volumetric and
gravimetric efficiency. Traditional storage of hydrogen in metallic pressure vessels leads
to low gravimetric efficiency but composite pressure vessels in combination with
increased working pressure up to 700 bar achieve high volumetric and gravimetric
efficiency. This technology is well known in automotive applications because it is
already used in compressed natural gas vessels. Cryogenic storage involves liquefying
hydrogen at low temperatures (-253 0C) and leads to high volumetric and gravimetric
9

efficiency. However, it is extremely difficult to handle hydrogen as a cryogenic liquid at
this low of a temperature and there is a high amount of energy needed to liquefy
hydrogen compared to the storage of compressed hydrogen. Cryogenic storage requires
suitable, safe, and reliable storage and filling facilities and especially safe and easy
handling of filling equipment comparable to conventional gas stations.
The technical feasibility of hydrogen storage in metal hydrides is controlled by the
kinetics of hydriding and dehydriding. There are two possible types of metal hydride
storage: storing hydrogen atoms in certain metals (“metallic sponges”) that will
reversibly hydride and dehydride by the simple gas-solid chemical reaction or the use of
certain previously synthesized hydrides (“chemical hydrides”) that can be destructively
reacted with water to liberate the hydrogen gas. The other option for hydrogen storage is
anhydrous ammonia, which has low toxicity, low flammability, and assured purity that
results from the method of manufacturing. This option offers significant advantages in
cost and convenience due to ammonia’s higher density and easier storage and
distribution. The heating value of ammonia is similar to that of methanol and ammonia
contains 1.7 times as much hydrogen per volume as liquid hydrogen. Furthermore, the
cracking process is thermally efficient and simple. Nitrogen generated can be released to
the atmosphere without significant local environmental impact.xiv However, the
development of hydrogen sources and storage technologies is only one vital component
of advancing fuel cell technology to the point of mass production, cost reduction, and
wide scale implementation.
10

D. Types of Fuel Cells
Not only are there various types of hydrogen sources and storage technologies but
there are also several different types of fuel cells that have been developed since the basic
technology was invented by William Grove in 1839. Not all of these fuel cells offer the
same advantages mentioned earlier. The fundamental difference between the different
types of fuel cells is the electrolyte material, which affects the operating temperature of
the fuel cell and hence, the relevant advantages. At the high range of operating
temperatures are molten carbonate fuel cells and solid oxide fuel cells. Molten carbonate
fuel cells contain an electrolyte composed of a combination of alkali carbonates, retained
in a ceramic matrix of LiAlO2. These carbonates form a highly conductive molten salt
and the carbonate ions provide ionic conduction. These fuel cells are inconvenient
because of their high operating temperatures (600-700 0C) and are thought to be limited
to stationary power generation. However, one benefit is that at this high of an operating
temperature, noble metal catalysts are typically not required. Solid oxide fuel cells use a
solid, nonporous metal oxide as the electrolyte and operate at even higher temperatures
than the molten carbonate fuel cell (800-1000 0C). At high temperatures such as these
ionic conduction by oxygen ions takes place.
Alkaline fuel cells, phosphoric acid fuel cells (PAFCs), and polymer exchange
membrane fuel cells (PEMFCs) operate at the low end of the operational fuel cell
temperature range. Alkaline fuel cells use a concentrated, 85 weight percent, potassium
hydroxide (KOH) as the electrolyte for high temperature operation (250 0C) and less
concentrated, 35-50 wt %, for lower temperature operation (<120 0C). This potassium
hydroxide electrolyte is retained in a matrix (usually asbestos). A wide range of
11
electrocatalysts can be used. An important drawback of the alkaline fuel cell is that this
type of fuel cell is intolerant of CO2 in either the fuel or the oxidant. Phosphoric acid fuel
cells (PAFCs) employ concentrated (~100 weight percent) phosphoric acid as the
electrolyte, which is contained in an SiC matrix under operational temperatures of 150-
220 0C. The electrocatalyst used in PAFCs is platinum. PAFCs are currently semi-
commercially available in container packages (200 kW) for stationary electricity
generation. PEMFCs utilize a thin (<50 μm) proton conductive polymer membrane as the
electrolyte. The catalyst is typically platinum supported on carbon with loadings of about
0.3 mg/cm2, or, if the hydrogen feed contains minute amounts of CO, the catalyst is a
platinum-ruthenium alloy.xv The optimal operating temperature of PEMFCs is between
60 and 100 0C. Because of this low operating temperature, PEMFCs are a serious
candidate for automotive applications and also for small-scale distributed stationary
power generation and portable power applications. Due to PEMFCs potential to be used
in automobiles and therefore provide the emissions advantages described above, they are
the focus of the work presented in this paper.
E. PEMFCs
Although transportation and off-grid power generation have been emphasized in
recent years as the main applications of PEMFCs and solid oxide fuel cells, it is
important to note the potential for other applications of PEMFCs. There is currently a
considerable need for power sources with energy densities exceeding that of secondary
lithium batteries. This need is driven by the consumer electronics industry, which has
flourished in the last decade alone. In addition to the emissions advantages that PEMFCs
offer to the transportation industry, PEMFCs may be required to power both present and
12

next generation hand held devices – particularly those that require longer use times per
recharge. This opportunity may provide the first market entry for low temperature fuel
cells like the PEMFCs discussed in this paper. From an environmental standpoint,
PEMFCs offer emissions advantages that compare favorably with current internal
combustion engines and also have the flexibility and convenience of being incorporated
in automobile designs. With significant increases in efficiency and subsequently lower
production prices, portable power systems of superior energy density and immediate
refuelability such as the PEMFC could compete with the costs of present battery
technology. Current costs of PEM fuel cells range between $1500 and $10,000 per kW,
which is two orders of magnitude higher than today’s engine technologies.xvi If PEMFCs
can be mass-produced, their cost could be lowered enough to compete with internal
combustion engines as well as present battery technology.
PEMFC technology, invented at General Electric in the early 1960s by Thomas
Grubb and Leonard Niedrach, was first introduced as part of the Gemini space program
in the 1960s but was considered fundamentally impractical for any terrestrial application
as late as the mid-1980s. In the Gemini space program, early PEMFCs used highly pure,
cryogenic hydrogen and oxygen and very high precious metal loadings. These high-
priced materials were fully acceptable for use in power sources installed in a space
vehicle but prohibited the wide-scale implementation of PEMFC technology in other
applications. Terrestrial applications demanded lower precious metal loadings, diluted or
impure hydrogen as fuel, and air rather than oxygen. Water redistribution in the
ionomeric, polymer membranes was also a consideration for terrestrial applications.
Technical breakthroughs during the years 1985 through 1995 included the development
13

of membrane electrode assemblies (MEAs) using precious metal loadings lower by more
than an order of magnitude, effective approaches to operation with air and impure
hydrogen fuel, and resolution of the water management issues by using a thinner
polyperfluorocarbon sulfonic acid membrane. During this time period, power densities
approaching 1 kW/liter in prototype stacks were demonstrated. Contemporaneously,
public and industrial interest in environmentally sound power sources resulted in an
increase in the investment in PEMFC technology by three orders of magnitude.xvii
As mentioned before, PEMFCs utilize a polymer membrane electrolyte, which is
impermeable to gases but conducts protons, squeezed between two porous, electrically
conductive electrodes. The electrodes are typically made out of carbon cloth or carbon
fiber paper. The electrodes must be porous because the reactant gases are fed from the
back of the electrodes and must reach the interface between the electrodes and the
membrane. At the interface between the porous electrode and the polymer membrane
electrolyte there is a layer with catalyst particles, which are typically platinum supported
on carbon. The electrochemical reactions take place in these catalyst layers, on the
catalyst surface. The polymer membrane electrolyte, porous electrodes, and precious
metal catalyst comprise the membrane electrode assembly (MEA), which is sandwiched
between collector/separator plates. These plates collect and conduct electrical current,
provide pathways for the flow of reactant gases (flow fields), and provide structural
rigidity. In multicell configurations, the collector/separator plates separate gases in
adjacent cells and physically and electrically connect the cathode of one cell to the anode
of the adjacent cell.
14

Within the PEMFC hardware described above, several processes take place, which
must be optimized in order for the fuel cell to operate efficiently. The reactant gases must
flow through the flow channels – convective
flows may be induced in the porous layers.
These gases must then diffuse through the
porous media and participate in
electrochemical reactions, including
intermediary steps, at the surface of the
catalyst at the interface between the gas
diffusion layer and the membrane.
Hydrogen, fed on one side of the membrane,
splits into its primary constituents – protons
and electrons. The resulting protons are then
transported through the proton-conductive
polymer membrane and the resulting
electrical current is conducted through the
electrically conductive electrodes, through
current collectors, and through the outside
circuit where they perform useful work and come back to the other side of the membrane.
(See Figure 1 for a schematic of the PEMFC hardwarexviii). At the catalyst sites between
the membrane and the other electrode, electrons meet with the protons that went through
the membrane along with the oxygen that is fed on that side of the membrane, resulting in
15

the creation of water in an electrochemical reaction. This product water is transported
through the polymer membrane, involving both electrochemical drag and back diffusion.
Product water (vapor and liquid) is also transported through the porous catalyst layer and
the gas diffusion layers and ultimately pushed out of the cell with excess flow of oxygen.
Heat is transferred via conduction through the solid components of the cell and
convection to the reactant gases and cooling medium. The net result is a current of
electrons through an external circuit.
The potential advantages of fuel cell technology are numerous and hard to ignore in
light of shifting energy policies. On a larger scale, demand for hydrogen infrastructure
has captured the interest of policy-makers and scientists alike and led to many important
developments in this area. Various types of fuel cells can be utilized for a wide range of
applications – from stationary power sources to portable handheld devices to vehicles. In
particular, the flexibility and low emissions of PEMFCs have begun to spark further
interest in the development of fuel cell technology. Due to their low operational
temperature and flexibility with regard to fuel and oxidant, PEMFCs are a likely choice
for all types of applications. Used with pure hydrogen as a fuel, PEMFCs could power
zero-emission vehicles. However, the wide scale utilization of PEMFC technology
demands cost reduction, which will only
become a possibility if the technology is mass-
produced. Likewise, mass production will only become a possibility with significant cost
reduction. It is therefore crucial for PEMFC technology, and in particular the MEA
technology, to be perfected to the point of increasing the practical efficiency as well as
for the fabrication process itself to be made more efficient.
Figure 1. PEMFC Schematic
16

17

II. BACKGROUND
“Although PEMFCs have high power density, their open circuit voltage is about 1 V. The theoretical thermodynamic voltage is about 1.2 V. The slow kinetics of the oxygen reduction reaction as well as the hydrogen crossover through membrane are responsible for this difference.”
– K. Ota and S. Mitsushima, O2 reduction on the Pt/polymerelectrolyte interface
A. Membrane Electrode Assemblies The membrane electrode assembly of a polymer electrolyte membrane fuel cell is the
fundamental component of the fuel cell technology and it is through design
improvements of the membrane electrode assembly (“MEA”) that overall efficiency can
be brought closer to the theoretical energy conversion efficiency of hydrogen
combustion. The MEA is composed of the polymer exchange membrane, sandwiched
between two electrodes (typically of carbon cloth or carbon paper), which each have a
gas diffusion layer and a catalyst layer that face the membrane. This membrane-electrode
sandwich is typically contained within two layers of gasket material that allow the
membrane and electrodes to be held in place between the bipolar plates. Although the
polymer membrane component has only been recently developed, the gas diffusion layer
and catalyst layer concepts were first conceived of by William Grove and his
contemporaries in the nineteenth century. The membrane can be any single-ion
conducting polymer but perfluorinated ionomer membranes have been found to yield the
best operational efficiencies. The membrane known by the trade name Nafion, which is
used in the work presented in this paper, was first successfully implemented in the mid-
1960s. The fuel cell electrodes are essentially thin catalyst layers pressed between the
ionomer membrane and a porous, electrically conductive substrate such as carbon cloth
or paper. Typically, carbon supported platinum catalysts and platinum-alloy catalysts are
used for proton exchange membrane fuel cells. By increasing the efficiency of the MEA
18

components it is possible to decrease the platinum loadings and decrease the overall cost
of production. With simplification of the MEA production process, mass production of
PEMFCs becomes a more realistic goal.
B. Polymer Electrolyte Membranes
The polymer electrolyte membrane (“PEM”) constitutes the basis of the MEA, the
performance of which determines crucially the overall power density of a fuel cell
system. The PEM’s primary function is as the electrolyte through which protons move to
conduct ionic current. However, the PEM also acts as a separator between the two gas
compartments: the anode and cathode gas compartments, and as the support of the anode
and cathode catalyst layers. Single-ion conducting polymer electrolytes give
electrochemists the ability to choose from a variety of polymers with both high
conductivity for a given ion of interest as well as stability and ability to be processed so
as to allow for the ideal design of various electrochemical devices. “Electrochemical
separator membranes with fixed ion groups” date back to before the 1950s with the use of
polystyrene sulfonic acid and related acid-containing polymers as separators for
electrochemical processes. Formerly, sulfuric acid and potassium hydroxide were used as
electrolytes because of their low cost and high ionic conductivity but they were found to
be extremely corrosive and a challenge to confine. The advantages of these early acid-
containing polymers included the lack of corrosive mobile acids and bases, a high
conductivity and selectivity, and a thin film form leading to compact systems with low
ohmic drop. However, there was excessive chemical and electrochemical degradation that
occurred with the instability of the carbon-hydrogen bonds in these early membranes.
19

The concept of ion exchange membranes as the sole electrolyte in fuel cells with
gaseous feed streams was not invented until 1955. In 1962, it was discovered that
humidified feed gases improved the performance of membrane fuel cells. In 1966, the
first Nafion membrane was used in a fuel cell successfully by GE for NASA. Three years
later, DuPont announced the availability of a new XR perfluorosulfonic acid copolymer
composition suitable for use in PEMFCs.xix The perfluorinated ionomer membranes,
which came to be known under the trade names of Nafion membranes and Nafion
solutions, are a subclass of the early polymer electrolytes. The term ionomer refers to
single-ion conducting polymers with a fixed ion group covalently attached to a side chain
of the polymers. A perfluorocarbon-sulfonic acid ionomer is a copolymer of
tetrafluorethylene (TFE) and various perfluorosulfonate monomers. Nafion is comprised
of perfluoro-sulfonylfluoride ethyl-propyl-vinyl ether (PSEPVE). Nafion membranes are
available from DuPont and assigned numbers such as NE112, NE-1135, N115, and N117.
The first two digits represent the equivalent weight divided by 100 whereas the last digits
refer to how many mils (1/1000 of an inch) thick the membrane is. In Nafion, the SO3H
group is ionically bonded and the end of the side chain is an SO3- ion with an H+ ion. The
ends of the side chains cluster within the overall structure of the membrane. The Teflon-
like backbone is hydrophobic and the sulphonic acid at the end of the side chain is highly
hydrophyllic. The PTFE backbones provide structural and thermal stability of the
membrane and immobilize the dissociated sulfonic acid groups. The hydrophyllic regions
are therefore created around clusters of sulphonated side chains. The relative
hydrophobicity and hydrophyllicity of the membrane contribute to the advantages,
disadvantages, and design considerations.
20

Despite the high cost of Nafion membranes and concerns about long-term stability of
polymers in electrochemical cells due to fears of oxidation damage, Nafion has been
found to have favorable chemical, mechanical, and thermal properties along with high
proton conductivity when sufficiently hydrated.xx In fact, Nafion requires water for
proton conductivity and the operating temperature is therefore limited to below the
boiling point of water.xxi Both the fuel and the oxidant for a PEMFC must be saturated
with water vapor. If they are not saturated with water vapor, the water content of the
Nafion electrolyte alone is not enough to sustain desirable fuel cell performance. Lack of
water decreases the ionic conductivity of the membrane, which causes an increase in the
cell’s internal resistance. The electroosmotic drag of water from the cell anode to the cell
cathode, which accompanies proton transport during fuel cell transport at high current
densities, leads to dehydration near the anode and flooding of the cathode with liquid
water.xxii This lower water content on the anode side of the cell results in an even further
reduction in the electrolyte’s ionic conductivity. There is a definite correlation between
the transport of protons and water to the hydrated morphology of the sulfonic acid-based
ionomers. The extremely high hydrophillicity of the sulfonic acid functional groups when
combined with the equally high hydrophobicity of the polytetrafluoroethylene (PTFE)
backbone results in a two-phase system consisting of a network of water containing
domains separated from the PTFE medium.xxiii Within the electrodes, loss of water
decreases both the electrolyte conductivity and the gaseous reactant permeability.
Furthermore, the kinetics of the oxygen reduction reaction are slowed by the loss of
water, which results in an increase in the electrode polarizations.xxiv By carefully
21

managing the hydration and water removal of the fuel cell system it is possible to
maximize the efficiency with which the fuel cell operates.
Although reaction kinetics of the oxygen reduction reaction at the cathode of a
polymer exchange membrane fuel cell are extremely slow, it has been shown that the
solid state perfluorinated acid electrolyte environment offers significant advantages over
phosphoric acid for oxygen reduction. This is because the perfluorinated acid
environment yields higher oxygen solubility and diffusion coefficient. There is also
significantly less anion adsorption from the electrolyte. The low temperature operation
and relatively hydrated environment of the perfluorinated acid electrolyte leads to a
higher degree of water activation and formation of Pt-OH species on the Pt surface. This
low temperature operation also leads to different oxygen-reduction reaction kinetics.
Furthermore, the hydrated nature of the electrolyte leads to higher proton conduction.xxv
Each one of these advantages highlights the solid state perfluorinated acid electrolyte’s
ability to facilitate the relatively slow oxygen reduction reaction kinetics, which is key in
the pursuit to increase the overall efficiency of the cell.
In addition to the inherent benefits to the oxygen reduction reaction, an effective
polymer exchange membrane should have high proton conductivity and immobilized
anions. It should be insoluble in water but water should be soluble in the membrane. The
membrane should be impermeable to hydrogen and oxygen (low crossover). There should
exist dimensional stability as well as chemical and electrochemical stability during
operation, thermal stability, and tolerance to impurities. In terms of the water
management issues mentioned earlier, the membrane should exhibit swift water transport
and reversible hydration. As with other components of the MEA, there is some conflict in
22
the membrane design requirements: low protonic resistance requires high ion exchange
capacity and low thickness, which has to be balanced with the requirements of high
physical stability and low crossover. Although adjustments can be made to the polymer
exchange membrane in order to increase the overall efficiency of the fuel cell, the
electrodes themselves and the catalyst layer also have room for improvement –
particularly in the case of the oxygen reduction reaction at the cathode.
C. Electrode Structure
In addition to maximizing the performance of the polymer electrolyte membrane, it is
also important to take into consideration the various components of the electrode
structure, mainly the gas diffusion layer and the catalyst layer. William Grove discovered
in the mid-19th century that the chemical reactions in a fuel cell take place at the line
where the liquid phase, gas phase, and solid platinum catalyst meet and that the core
problem is to obtain “anything like a notable surface of action”.xxvi The number of
reaction sites at this three-phase boundary is much smaller than at a two-phase boundary.
Grove therefore platinized the platinum to create a porous electrode structure of high
surface area to increase the “surface of action”, or the region in which the chemical
reactions take place on the electrode surface. Grove also found that it was necessary to
cover the catalyst agglomerates with a thin film of electrolyte. Mond and Langer
improved upon these advancements in fuel cell design by using a non-conducting porous
diaphragm or matrix to hold the liquid electrolyte and a powdered electrocatalyst in the
form of platinum black. These early developments demonstrated the necessity of having a
thin film of electrolyte over the electrode with access to the reactant gases while avoiding
drying or drowning, having a high surface area for reaction, having an invariant
23

electrolyte, and analyzing the performance of fuel cells using current-voltage curves.
Each of these concepts is incorporated in current fuel cell designs and has been
implemented in the work presented in this paper.
Electrode material should facilitate the reduction of the activation overpotential at the
desired output currents and also facilitate mass transfer to the reactant sites. An electrode
material with a rough surface increases the current under the activation control at any
overpotential per apparent square centimeter by a factor equal to the ratio of the real area
of the roughened surface to its apparent area. The maximum increase in apparent current
density obtainable with roughened surfaces is by a factor of about 100. However, the
rates of diffusional processes are not greatly enhanced, unless the depths of roughness are
at least of the order of magnitude of diffusion-layer thickness.xxvii The use of porous
media does however increase the rates of diffusional processes, thereby facilitating mass
transfer to the reactant sites and increasing the overall efficiency of the fuel cell. Porous
media generally consists of a catalyst such as platinum distributed in the form of small
particles in a porous substrate (commonly porous carbon). This porous material possesses
a greater surface area and a smaller diffusion-layer thickness than planar electrode
material, which results in an increase in current density.xxviii Within many pores, there is a
thin film or meniscus of the electrolyte and the reactant gases can reach the electrode by
diffusion of the dissolved gas through this film or meniscus. In these cases, diffusion-
layer thickness is of the order of the thickness of the film, enabling high limiting currents
to be obtained as compared to those obtained with planar electrodes. The gas diffusion
layer, which is typically comprised of a thin layer of carbon particles on the surface of the
porous carbon substrate, must be optimized so that reactant gases may easily diffuse, yet,
24

at the same time water, which travels in the opposite direction, must not accumulate in
the pores. This diffusion layer must be both electrically and thermally conductive. The
gas diffusion layer also should provide mechanical support, electrical contact, optimal
distribution of reactant gases, and a pore structure suitable for the removal of liquid or
vapor phase water. In the work discussed in this paper, catalyst in the form of small
particles is dispersed uniformly within the pores of the inert conducting substrate. By
supporting the catalyst on a porous material, the quantity of catalyst is considerably
reduced as compared with sheet electrodes made entirely of catalyst or with
electrodeposited materials.
It has now been established that high performance electrodes should maximize the
active surface per unit mass of the electrocatalyst and per unit electrode area. Barriers to
reactant transport to the catalyst should be minimized. Overall, the electrode should give
invariant performance with time under actual operating conditions. It is necessary that the
catalyst in the electrode structure not be buried under the support and that catalyst
particles have an ionic pathway for protons that presents a low barrier to oxygen
permeability, a low resistance for proton transport (high conductivity), and a low barrier
to water diffusion (hydrophilic pathways for removal of product water). Additionally, the
electrode structure should have hydrophobic gas passages to deliver and distribute
reactants to the catalyst particles. Finally, the catalyst particles must be electronically
connected to the external circuit. In order to satisfy these various requirements, inks or
slurries are typically formulated and applied either to the gas diffusion layer, which acts
as a substrate, or directly to the membrane itself. Applying the catalyst ink to the gas
diffusion layer leads to a basic two-layer structure called the catalyst coated substrate,
25

whereas applying the catalyst to both sides of the membrane leads to a three-layer
structure called the catalyst coated membrane. Two catalyst-coated substrates are then
combined with a membrane or one catalyst coated membrane with two gas diffusion
layers to form a five-layer complete MEA. It is still necessary however to further
examine the catalyst layer.
D. The Catalyst Layer
1. The Role of Catalysts in a PEMFC Catalysts like platinum accelerate the electrodic reactions without being consumed in
the overall reaction themselves. Since one step of the electrochemical reaction in a fuel
cell occurs at the electrode-solution interface and at a given electrode-solution potential
difference, the catalysis in a fuel cell (electrocatalysis) is similar to heterogeneous
chemical catalysis except that one or more of the intermediate steps in the overall
reaction is a charge-transfer step.xxix The catalyst plays a role in three main processes in
electrochemical reactions: adsorption, charge transfer, and surface reactions. Adsorption
and surface reactions are also common in chemical catalysis and therefore, by analogy,
geometric and electronic factors are expected to be important in electrochemical
catalysis. A catalyst should display weak but rapid adsorption of reactant gases.xxx As an
example of the importance of adsorption, molecular hydrogen adsorbed at a metal surface
can be split into reactive hydrogen atoms. The necessary energy for breaking the bond is
given by the heat of adsorption. This is the first step in the catalysis of the hydrogen
reaction in a fuel cell. The entire reaction mechanism for the oxidation of hydrogen is
outlined in Figure 2xxxi.
26

The additional process in electrocatalysis – the charge transfer – makes the potential at
the metal-solution interface an additional factor for electrochemical reactions.xxxii
Global reaction: H2 2H+ + 2e Possible sequence of steps: H2 (aq) H2 (ads) (diffusion and adsorption) H2 (ads) 2H (ads) (dissociation) H (ads) + H2O H3O+ (ads)
+ e (electrooxidation of atoms) H3O+ (ads) H3O+ (aq) (transport of H+)
Figure 2. Reaction mechanism for oxidation of hydrogen
In heterogeneous catalysis, the reaction rate is measured by the number of moles of
reactant consumed in unit time per unit area of the catalyst. In electrocatalysis, the current
density at the electrode is a measure of the reaction rate. Especially in the polymer
electrolyte membrane systems, the platinum catalyst loading must still be significantly
reduced before market introduction can be effected on a broad basis and by increasing the
efficiency of the catalyst layer, which increases the reaction rate and the current density
of the fuel cell, the necessary platinum loading can be reduced. In order to increase the
efficiency it is necessary to examine the geometry of the catalyst layer. Three kinds of
species participate in the fuel cell reaction at the catalyst layer: gases, electrons, and
protons and the reaction takes place only on the portion of the catalyst surface where all
three of these species have access. Furthermore, as Grove discovered, reactions can only
take place at the three-phase boundary between the electrolyte (in the case of the polymer
electrolyte membrane fuel cell, the ionomer), the solid and the void phases. The reaction
rate can be increased by maximizing the surface area at the three-phase boundary as well
27

as by optimizing the geometric, electronic, and potentiostatic characteristics of the
catalyst layer.
Because the three-phase boundary between the electrolyte, the solid, and the void
phases is an infinitesimally small area there exist infinitely large current densities and the
reaction zone must be enlarged in order to increase the overall reaction rate or current
density. Enlarging the reaction zone can be accomplished either by “roughening” the
surface of the membrane or by incorporating some ionomer in the catalyst layer. It is also
possible to lower platinum loadings by supporting and dispersing platinum on carbon
blacks so as to obtain a higher platinum surface area. Carbon supported platinum and
platinum-alloy catalysts are also used because it is relatively easy to uniformly and highly
disperse the catalyst even when the loading is more than 30%. This is extremely
beneficial because higher loadings are expected in order to catalyze the PEMFC
reactions. Additionally, the carbon black has sufficient electronic conductivity and
chemical stability under fuel cell operating conditions and carbon-supported catalysts are
more stable than non-supported catalysts concerning catalyst agglomeration under fuel
cell operating conditions. If the ratio of carbon support to catalyst metal is optimized, this
method results in higher catalyst utilizations, lower sintering rates, and lower costs.
Noble metals have the highest catalytic activity for the electrolytic hydrogen-
evolution reaction and other transition metals have intermediate catalytic power. Tables 1
and 2 show the catalytic activity of different metals for hydrogen-evolution and oxygen-
dissolution reactions at 250 C.xxxiii
28

Metal
Normality of H2SO4
electrolyte i0 amp/cm2 Pt 0.50 1.00E-03Rh 0.50 6.00E-04Ir 1.00 2.00E-04Pd 1.00 1.00E-03Au 2.00 4.00E-06Ni 0.50 6.00E-06Nb 1.00 4.00E-07W 0.50 3.00E-07Cd 0.50 2.00E-11Mn 0.10 1.00E-11Pb 0.50 5.00E-12Hg 0.25 8.00E-13Ti 2.00 6.00E-09
Metal
i0 in 0.1 N HClO4 (pH ~ 1),
amp/cm2
i0 in 0.1 N NaOH (pH ~ 12),
amp/cm2 Pt 1.00E-10 1.00E-10 Pd 4.00E-11 1.00E-11 Rh 2.00E-12 3.00E-13 Ir 4.00E-13 3.00E-14 Au 2.00E-12 4.00E-15 Ag 4.00E-10 Ru 1.00E-08 Ni 5.00E-10 Fe 6.00E-11 Cu 1.00E-08 Re 4.00E-10
Table 2. Exchange Current Densities for the Oxygen-electrode Reaction on Some
Metals at 250 C.
Table 1. Exchange Current Densities for the Hydrogen-electrode Reaction on
Some Metals in H2SO4 at 250 C.
Metals are characterized by the presence of free electrons and each ion in the bulk of a
metallic lattice is equally attracted to all of its nearest neighbors. The important physical
properties of metals that are relevant to catalysis are: normal lattice structure, the melting
and boiling points, the work function, the standard electrode potential, the metallic radius,
the latent heat of sublimation, the density and specific resistance, and the magnetic
susceptibility. The surface of a metal is not homogeneous, close-packed with all its
surface atoms at the same distance from a plane parallel to it, at temperatures above
absolute zero. At higher temperatures, a non close-packed or stepped surface is formed.
Atoms at “kink sites” are in a state of higher energy than those in the straight portion of a
step, which is in turn at a greater energy than those on sites in a homogeneous
surface.xxxiv Because atoms in the region of the dislocation have a higher energy than the
atoms on a plane surface, the energies of adsorption of reactants at geometrical defects
are higher, which in turn accelerate reaction rates.xxxv
29
Alloys, as opposed to metals, are homogeneous substances consisting of two or more
elements, generally metals. Substitutional alloys involve atoms of one element replacing
those of another in a regular lattice. In an interstitial alloy, the atoms of the one of the
components are so small that they occupy interstitial positions in a regular network of the
other component without disturbing the order in the latter.xxxvi Not surprisingly, the
surface and bulk compositions are not the same in alloys as they are for metals. New
phases are formed on the surface of alloys, which are not the same in composition as that
of the bulk. Compositions at grain boundaries and in crystallites are also not identical.
These differences cause a difference in the number of active sites on the surface of an
alloy compared with that which would exist were the surface and bulk concentrations the
same.xxxvii The geometric characteristics of both metals and alloys are important because
they determine how strongly a reactant may be adsorbed. Reactants must be sufficiently
strongly adsorbed to reach a finite concentration on the surface but must not be too
strongly adsorbed to permit a high enough rate constant for the subsequent desorption
reaction. In other words, the catalytic activity of the surface depends on its lattice
structure and spacing.
In addition to the geometric characteristics of catalysts, electronic factors come into
play to affect the reaction rate or current density of the fuel cell. Transition metals are the
more active known catalysts. These metals are known to strongly adsorb atomic
hydrogen and oxygen as well as molecules and fragments of hydrocarbons and there are
several theories for how this adsorption occurs. One theory is that the transition metals
have partly filled d shells and, in the gas phase, the numbers of electrons in these shells
increase from one to nine in each of the long periods of the periodic table. There is
30

electron overlap of the d levels with the immediately higher s level and when hydrogen
enters the metal it is iononized and the free electrons enter the vacant d orbital. However,
this theory is only valid for the group VIII metals and not for the transition metals
preceding it.xxxviii The more generally applicable theory is the Valence-Bond Theory,
which states that metals having more unpaired electrons in the d band have a lower
percentage d-band character and would pair with unpaired electrons from donating atoms
or molecules.xxxix
The work function (Φ), the energy required to remove an electron from the bulk of
the metal to a point well outside it, increases with the increase in percentage of d-band
character (more electrons are paired and a higher energy is required to extract an electron
from a metal). Since the work function increases with the d character and the heat of
adsorption of a species on the metal (ΔH) decreases with an increase in percentage of d
character, then it follows that ΔH decreases with an increase of Φ. If adsorption is the
slow step of the reaction, it can be presumed that the catalyst should have a lower
percentage d-band character. The converse holds true if the rate-determining step is
desorption.xl xli The driving force of an electrode reaction is controlled by electrical
forces, which affect the charge transfer through the interface. A change in the electrode
potential, which can be altered in an electrochemical cell by an external voltage, leads to
a change in electronic structure (e.g. a change in electronic work function). This
phenomenon, known as non-faradaic electrochemical modification of chemical activity
(NEMCA), can also influence the rate of a heterogeneous chemical reaction.xlii
Therefore, geometric and electronic factors as well as external voltages must be
considered when attempting to ascertain the best catalyst for a specific reaction.
31

The overpotential losses in most electrochemical converters arise predominantly due
to the slowness of the oxygen-reduction reaction and this is the principal problem in
hydrogen-oxygen fuel cells.xliii If it were possible to make the reaction increasingly
reversible, fuel cells could approach the ideal efficiency predicted by the Gibbs free
energy and enthalpy values of the oxidation of hydrogen.xliv The oxygen-reduction or
oxygen-dissolution reaction (hereinafter, “ODR” or “ORR”) is relatively slow compared
with other electrodic reactions (see Table 3).xlv
Reaction Electrode Material
Exchange current density:
- log i0 (i0, amp/cm2) 2H+ + 2e0
- H2 Pt 3.0
Cl2 + 2e0- 2Cl- Pt 3.0
Ag+ + e0- Ag Ag 1.0
Fe3+ + e0- Fe2+ Pt 2.1
Hg2Cl2 + 2e0- 2Hg + 2Cl- Hg 0
O2 + 4H+ + 4e0- 2H2O Ba0-5TaO3 6.0
Table 3. A Comparison of Exchange Current Densities for Several Reactions with That of the Oxygen-dissolution Reaction at 250C
Therefore, when the ORR carries a practical density of current, a large overpotential is
typically observed along with a corresponding decrease in the energy-conversion
efficiency. Even at the lowest current density, there is a loss in potential of the oxygen
electrode from the reversible electrode potential by 0.2 or 0.3 volt. The maximum energy-
conversion efficiency of a converter is hence decreased by some 25%.xlvi Depending on
the catalyst, the ORR goes over a four-electron (direct) pathway or a peroxide pathway,
involving H2O2 as intermediate product. In acid solutions the reactions are:
32

Eq. 6. O2 + 4H+ + 4e- 2H2O (direct pathway) Eq. 7. O2 + 2H+ + 2e- H2O2 (peroxide pathway)
In the case of platinum and platinum-family metals, where direct four-electron reduction
is found, two main proposals exist for the first reaction step: Proton transfer simultaneous
with charge transfer, in which case the rate determining step should be O(ads) + H+ + e-
products, and dissociative chemisorption of O2, probably simultaneous with charge
transfer. In this second case, proton transfer should play no role in the reaction rate.xlvii
2. Platinum and Platinum Alloy Catalysts
Platinum, which is the most common catalyst for a PEMFC, has high catalytic
activity towards hydrogen oxidation with exchange current densities on the order of 10-3
A/cm2Pt. The anode platinum loadings in the case of pure hydrogen operation can be
reduced to 0.05-0.10 mgPt/cm2 without any cell voltage losses.xlviii Oxygen reduction at
platinum is characterized under most conditions by a 4-electron reaction (O2 + 4H+ + 4e-
2H2O). Under typical conditions, the oxygen reduction intermediate species share the
electrode surface with platinum oxide and/or hydroxide compounds as well as other
adsorbed species. The formation of platinum oxide and/or hydroxide compounds shows
an irreversible behavior and so the performance of a platinum electrode may also depend
on its history. The sensitivity of the reaction to other adsorbed species means that great
care must be taken to avoid some types of trace impurities.xlix It is important to note that
impurities at either the anode or the cathode have a marked effect on the relations
between over-potential and current density for reactions. They may be strongly adsorbed
at the active sites and thus reduce the exchange current density of the desired reaction.
Impurities may also influence the free energy of adsorption of reactants or intermediates
and thereby alter the exchange current density.l For example, if there is any carbon
33

monoxide in the fuel gas it will be adsorbed on the platinum anode and inhibit the
dissociation of hydrogen into protons and electrons.
Further reductions in the cathode platinum loadings are still required for large-scale
fuel cell applications. Unfortunately, the oxygen reduction reaction kinetics on platinum
are approximately five orders of magnitude slower than the hydrogen oxidation kinetics
so that reduction in cathode platinum loadings to commercial targets without
compromising performance is a significant technical challenge. As with the hydrogen-
reduction reaction, platinum appears as a top catalyst for the ORR, together with some of
its alloys involving some first-row transition metals. The oxygen reduction reaction has a
thermodynamic redox potential (E0) of 1.229 V at 250 C. However, the reaction is
irreversible. The exchange current density on platinum electrocatalysts is the 10-11 – 10-9
A/cm2 in both acidic and alkaline solutions and platinum has been known to be the best
electrocatalyst.
In order to compensate for the slower oxygen reduction reaction kinetics, carbon-
supported platinum alloys have been used with some success as oxygen reduction
catalysts in phosphoric acid fuel cells. In the 1980s, it was discovered that platinum
alloys were more active and stable in corrosive environments than unsupported or
supported platinum-only catalysts. While the use of carbon black support materials allow
platinum to be finely dispersed, maximizing active surface area, these pure platinum
catalysts were shown to deactivate with time due to a loss of active area due to platinum
particle agglomeration (sintering). The carbon supported platinum alloys with a high
surface area however have been shown to be more active and stable as oxygen reduction
catalysts. Platinum alloys have been found to be 1.5-2 times as active as platinum in
34

terms of mass activity and 2-4 times as active in terms of specific activity, which is the
best representation of intrinsic kinetic activity of the catalyst.li The predominant
hypothesis for the improved catalysis involves the shortening of the Pt/Pt distance.
Mukerjee et al conducted a systematic study of five binary alloys of Pt with the first row
transition elements ranging from Cr to Ni for the catalysis of the ORR and found that all
alloy electrocatalysts enhanced ORR activity. The highest active binary alloy was found
to be Pt/Cr, where a three-fold enhancement was reported. The activation energy for
ORR was reported to be approximately half that of Pt, but the reaction order with respect
to molecular oxygen was reported to be one. The conclusion therefore was that the
surface nature of these alloys was more kinetically facile towards higher ORR kinetics.lii
A subsequent study by Watanabe et al examined the effect of Pt alloys with Fe, Ni
and Co, where maximum activity was reported with 30% Fe, 40% Ni, and 50% Co. The
kinetic current was enhanced by an order of 10, 15, and 20 times respectively. A study by
Lima et al examined the kinetics of the ORR in KOH electrolyte on ultra thin layer
electrodes formed by Pt-V, Pt-Cr, and Pt-Co electrocatalysts dispersed on a carbon
powder. There was shown to be an increase of the occupancy of the Pt 5d band and some
reduction of the Pt-Pt interatomic distance in the different metal alloys compared to Pt/C.
Furthermore, alloys with ordered structures exhibit improved catalytic activity compared
to Pt and disordered Pt alloys and the catalytic activity increases with the extend of
ordering.liii The highest electrocatalytic activity was shown by the Pt-V/C alloy.liv Yet,
the reaction rate for the ORR is still too slow with these catalysts, inspiring studies to
assess the role that adsorbed non-intermediate species play in inhibiting the ORR. It has
been shown that strong adsorption of anions, such as phosphoric acid, halide, or hydrogen
35

anions, changes the role of surface structure on the ORR.lv Thus, efforts to improve upon
the platinum cathode catalyst in PEMFCs have focused on alloys that prevent an
insulating anodic film, probably consisting of adsorbed OH, from inhibiting oxygen
reduction.lvi It appears that platinum alloy catalysts, as compared to platinum, cause both
a deceleration of oxide formation and a resistance to restructuring, both of which
contribute to the enhanced oxygen activity in PEMFCs.
Toda et al explained the increase in catalytic activity of Pt alloys based on increases
in Pt 5d band vacancy, leading to a stronger Pt-O2- interaction, which causes a weakening
and lengthening of the O-O bond and its easier scission. This in turn results in an increase
of the reaction rate of the oxygen-reduction reaction. Arico et al and Shukla et al have
attributed the increase of the catalytic activity to a decrease of the coverage of surface
oxides and an enrichment of active Pt sites. Mukerjee et al have explained the increase in
catalytic activity due to the decrease of the Pt-Pt distance and the Pt-Pt coordination
numbers. Unlike Toda et al, Min. et al have suggested that oxygen reduction activity
increases with the occupancy of the Pt 5d band because there is a decrease in the
adsorption strength of oxygenated species resulting in a raise of the kinetics of the
reduction of reaction intermediates. It has also been observed that for Pt-based catalysts
in acid media, the specific activity for the ORR generally increases with decreasing
surface area, which indicates that oxygen reduction on platinum is structure-sensitive.lvii
It has been found that the incorporation of a polyvalent transition-metal atom such as
molybdenum or vanadium into a noble metal such as platinum causes a decrease in the
rate of hydrogen evolution at low overpotentials but an increase in the rate at high
overpotentials, as compared with the rates in the corresponding overpotential regions on
36

the pure metal. Alloying with polyvalent metal atoms reduces the work function, the
energy required to remove an electron from the bulk of the metal to a point well outside
it, and the observed behavior may be explained on the basis of a slow-recombination
mechanism in the low-overpotential region and a slow-discharge step in the high-
overpotential region.lviii
Although carbon-supported platinum and platinum alloys have been shown to be
effective catalysts in a PEMFC, platinum easily adsorbs the oxygen at the cathode,
making it difficult for the protons to adsorb. It has been hypothesized that using a gold
catalyst at the cathode could mitigate this problem and thereby facilitate the chemical
reaction involving the recombination of oxygen with protons and electrons in order to
form water. However, gold is known to be a poor catalyst. The work presented in this
paper therefore focuses on the implementation of various combinations of gold and
platinum catalyst materials at the cathode in order to facilitate the oxygen reduction
reaction kinetics, improve the performance of the MEA, and mitigate production costs.
3. Gold and Gold Alloy Catalysts
Gold and palladium alloys have been investigated as alternatives to a solid platinum
catalyst with dissatisfying results. When log i0 (where i0 is the exchange-current density)
was plotted against percent gold composition in the alloy, there was found to be a rapid
decrease of i0 with increase of gold composition until a composition of 60% gold was
reached. Thereafter, the decrease in i0 with increase in percent of gold composition was
much slower. This has been explained by the gradual filling up of the d band of the alloy
and consequent decrease in the rate of hydrogen evolution with increase in gold
composition from 0 to 60% gold. At 60% gold composition, the d band is completed in
37
the alloy and thus between 60 and 100% gold in the alloy, there is hardly any change in
the rate of hydrogen evolution in it.lix The uptake of oxygen by an oxide-free metal
follows dissociative adsorption – as the number of unpaired d electrons increases, the
oxygen coverage increases. Gold, with no unpaired d electrons, shows the lowest
coverage, whereas ruthenium and platinum, with the highest number of unpaired
electrons have the highest coverage. In the case of catalysis of the hydrogen oxide
reduction on Au(100) and Au(111) by lead adatoms, the presence of lead adatoms
introduce important changes in the catalytic activity. The most important catalytic effect
arose from unit cells where the reactant came into close contact with both gold and lead
atoms, which is consistent with a dissociative adsorption mechanism due to a bimetal
bridge adsorption model.lx
In studies of the oxygen-dissolution reaction on gold and palladium or platinum as
well as their alloys, it was found that their Tafel slopes changed sharply at a composition
greater than 50% gold. It is probable that this change actually occurs at 60% gold, 40%
palladium or platinum, at which composition the d band is completed when adding
increased amounts of gold to palladium or platinum.lxi Enhanced activity was observed
with the use of gold single crystal surfaces when covered by thin palladium layers. Gold,
having no unpaired d-electrons, is unique among the metals studied for oxygen reduction
because of its lack of ability to adsorb oxygen and its high potential for oxide formation.
Reactions are complex and include oxygen reduction, peroxide reduction, peroxide
oxidation, and peroxide decomposition with intermediates diffusing between sites of
different activities. In contrast to platinum, gold’s activity can be greatly enhanced by
some impurities (most notably in the case of metal underpotential deposition).lxii lxiii This
38

has been most notably reported for platinum ions corroded from other electrodes in the
electrochemical cell, which is pertinent to the work described in this paper because of the
suggestion of synergies between platinum and gold as an effective combinatorial catalyst.
Oxygen reduction on gold is first order in O2, pH independent, and has a Tafel slope of
approximately –120 mV decade-1. In alkaline electrolyte the oxygen reduction reaction
occurs via direct 4e- oxidation at potentials near 0.9 V. In acid electrolyte, the ORR
polarization curves on Au surfaces are shifted negatively by hundreds of mV and the
reaction becomes structure insensitive.lxiv Therefore the rate determining step is thought
to be: S + O2 + e- S – O2-. However, in some cases, the initial adsorption has been
thought to be the rate-determining step. If platinum and gold were used as a
combinatorial catalyst on the cathode, it could be possible to reap the benefits of
platinum’s high adsorption activity and catalytic activity as well as gold’s lack of
adsorption activity.
39

III. LABORATORY PROCEDURE
The MEAs for this experimental work were assembled in the Bocarsly Fuel Cell
Laboratory at Princeton University. Carbon cloth (no catalyst, carbon only) was used as
the electrode material and gas diffusion layer. The carbon cloth has been purchased with
the gas diffusion layer already in place. This gas diffusion layer, which is comprised of
carbon particles, is designed so as allow for the diffusion of reactant gases and the
transport of product water and is both electrically and thermally conductive. The
electrode material and gas diffusion layer provide mechanical support, electrical contact,
optimal distribution of reactant gases, and a pore structure suitable for the removal of
liquid or vapor phase water. Catalyst slurries were created by sonicating a total of 0.050 g
ETEK 20% platinum on Vulcan carbon (by weight) and ETEK 20% gold on Vulcan
carbon (by weight) with approximately 10 g isopropanol for more than thirty minutes for
a metal concentration of approximately 4 mg/ml. Each slurry was created with a specific
weight ratio of platinum to gold in order to determine the appropriate ratio for optimizing
overall MEA performance. Each slurry was named according to the percent of the
catalyst material comprised of 20% gold on carbon. For example, the slurry containing
75% gold and 25% platinum was named “75”. For slurries that contained only gold or
only platinum catalyst the names were “Au” and “Pt” respectively. The approximate
catalyst weights used in each slurry are presented in Table 4 below.
Slurry Pt 25 40 50 60 75 Au
Weight of Pt (g) 0.050 0.0375 0.030 0.025 0.020 0.0125 0.000
Weight of Au (g) 0.000 0.0125 0.020 0.025 0.030 0.0375 0.050
Table 4. Catalyst slurry compositions
40

Each of these slurries were sonicated and airbrushed on a piece of carbon cloth measuring
approximately 1 inch by 2 inches (12.9 cm2), using compressed nitrogen as the
airbrushing gas, giving a catalyst loading of approximately 12.7 ml/12.9 cm2 or 3.9 mg of
catalyst per square centimeter.
Figure 3. Airbrush used for spraying technique
Figure 4. Carbon cloth electrode material after
being sprayed
Once the carbon-supported catalyst and isopropanol solution on the carbon cloth
electrode has dried in an 80º C oven, a solution of 5% Nafion (approximately 0.25 g) and
isopropanol (approximately 5 g) that has been lightly swirled is sprayed over top of the
platinum catalyst. The Nafion concentration is 5% of 250mg/3.9 ml, or 3.2 mg/ml. This
gives a Nafion loading of approximately 0.09 mg/cm2. Carbon-supported catalyst is used
for several reasons. Mainly, the carbon black support makes it possible to easily disperse
the catalyst uniformly, increasing the platinum surface area, even at loadings higher than
30%. Furthermore, the carbon black is electronically conductive and chemically stable
under fuel cell operating conditions causing carbon supported catalysts to be more stable
than non-supported catalysts concerning catalyst agglomeration under fuel cell operating
conditions. The Nafion layer serves several purposes: it facilitates adhesion between the
different components of the MEA and also encourages water removal at the membrane-
electrode interface. Furthermore, as discovered by Grove, incorporating some electrolyte
41
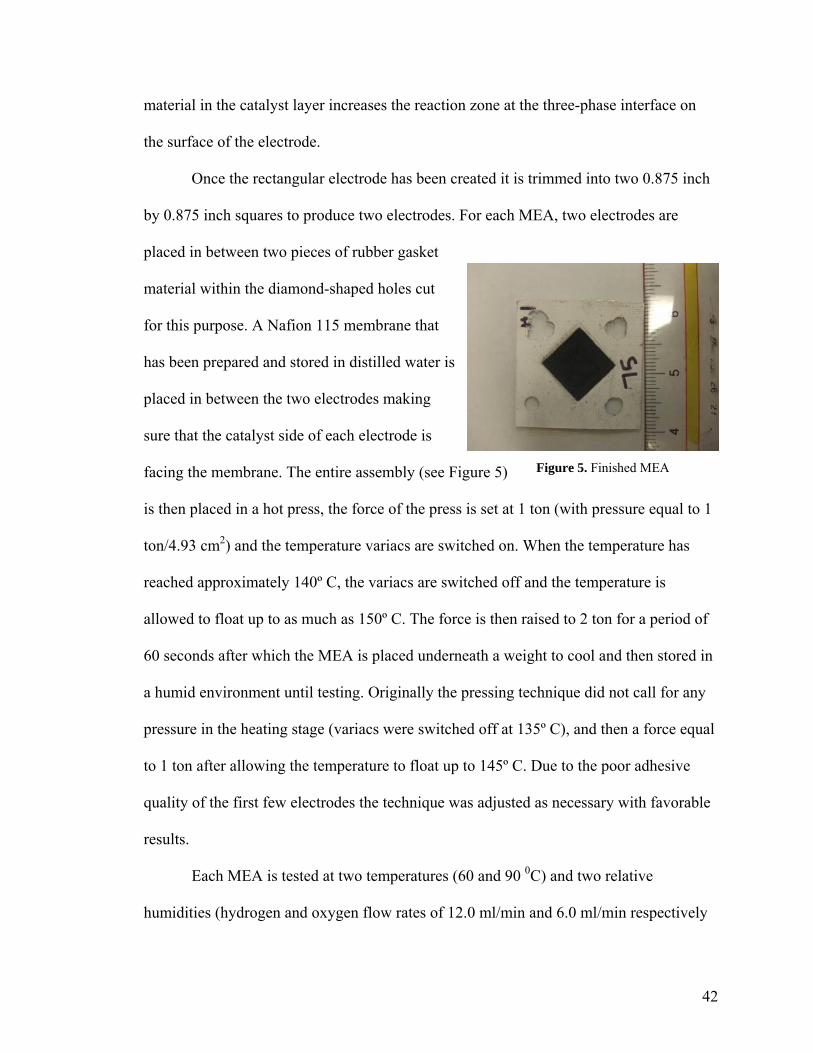
material in the catalyst layer increases the reaction zone at the three-phase interface on
the surface of the electrode.
Once the rectangular electrode has been created it is trimmed into two 0.875 inch
by 0.875 inch squares to produce two electrodes. For each MEA, two electrodes are
placed in between two pieces of rubber gasket
material within the diamond-shaped holes cut
for this purpose. A Nafion 115 membrane that
has been prepared and stored in distilled water is
placed in between the two electrodes making
sure that the catalyst side of each electrode is
facing the membrane. The entire assembly (see Figure 5)
is then placed in a hot press, the force of the press is set at 1 ton (with pressure equal to 1
ton/4.93 cm2) and the temperature variacs are switched on. When the temperature has
reached approximately 140º C, the variacs are switched off and the temperature is
allowed to float up to as much as 150º C. The force is then raised to 2 ton for a period of
60 seconds after which the MEA is placed underneath a weight to cool and then stored in
a humid environment until testing. Originally the pressing technique did not call for any
pressure in the heating stage (variacs were switched off at 135º C), and then a force equal
to 1 ton after allowing the temperature to float up to 145º C. Due to the poor adhesive
quality of the first few electrodes the technique was adjusted as necessary with favorable
results.
Figure 5. Finished MEA
Each MEA is tested at two temperatures (60 and 90 0C) and two relative
humidities (hydrogen and oxygen flow rates of 12.0 ml/min and 6.0 ml/min respectively
42

and 8.0 ml/min and 4.0 ml/min respectively) for a total of four, two-hour tests per MEA.
The laboratory setup with flow and temperature controllers, fuel cell hardware, and
connections to computer is shown in Figure 6.
Figure 6. Laboratory setup for testing of MEAs
The data is collected using the Arbin testing software and hardware in Jay Benziger’s
laboratory. The fuel cell was started for each test by using a rest step, then resetting all
variables. The current was then allowed to equilibrate at 0.5 amps for one hour. Each test
consisted of three CV sweeps, with sweep rate equal to 1 second, resetting the current to
0.5 amps before and after each sweep and allowing the current to re-equilibrate for 30
minutes prior to a CV sweep. CV refers to a method of electrochemical analysis called
cyclic voltammetry. “Conventionally, CV involves a bi-directional linear voltage ramp
applied between the electrodes of a sample in order to identify and characterize certain
electrochemical processes.”lxv MITS Pro is able to perform this test through the use of
Voltage Ramp steps (one forward step, one reverse). For each test, a graph was outputted
in Excel displaying the three current-voltage sweeps or polarization curves. The fuel cell
43

performance is characterized by its polarization curve. Three distinct regions of a fuel cell
polarization curve are noticeablelxvi: an initial voltage drop across the membrane-
electrode interface representing the activation barrier, a relatively linear middle section
that represents the ohmic resistance for protons to cross the membrane, and a voltage
drop in the high current regime due to mass transfer limitations.
By fitting the experimental results to one of the equations describing the
polarization curve, information may be gained about the parameters of the polarization
curve such as reversible cell potential, Vr; apparent exchange current density, io; Tafel
slope, b; cell resistance, Ri; or limiting current iL. The utility of a fuel cell is determined
by its efficiency at reasonable power outputs and by its maximum power, both of which
depend on the cell potential-current relation for the fuel cell. Therefore, exchange current
densities of the partial reactions play a leading role in determining the performance of a
fuel cell. The initial drop in the cell potential-current relation is determined mainly by the
exchange current density – the lower the exchange current density, the greater is this
drop, and hence the greater the loss of efficiency and power.lxvii In order to perform quick
calculations regarding fuel cell efficiency, a linear approximation of the ohmic resistance
portion of the fuel cell polarization curve can be easily manipulated (avoiding the use of
data in the activation and mass transfer regions). Figure 7 demonstrates this method.
44

Vcell = -0.9259i + 0.8085R2 = 0.9956
0.000
0.100
0.200
0.300
0.400
0.500
0.600
0.700
0.800
0.900
1.000
-0.050 0.000 0.050 0.100 0.150 0.200 0.250 0.300 0.350 0.400
Current Density (A/cm2)
Volta
ge (V
)
Figure 7. Platinum-Platinum MEA #2, 600 C, 8.0 H2, 4.0 O2
The linear polarization curve has the following form (Eq. 8):
Vcell = V0 – k * i Eq. 8. Linear polarization curve
where V0 is the intercept (the actual open circuit voltage is always higher), k is the slope
of the curve, and i is the current density.lxviii
The power density as a function of cell potential can be calculated using Eq. 9.lxix
kVVVw cellcell )( 0 −=
Eq. 9 Power density
It can be shown that the maximum power density is equivalent to the intercept squared
divided by four times the slope (see Eq. 10).lxx
kVw o
4
2
max =
Eq. 10 Maximum power density
45

This maximum power density is reached at a cell potential equivalent to half the intercept
(see. Eq. 11).lxxi
2| max
owcell
VV =
Eq. 11 Cell potential at which maximum power density is achieved
46

IV. RESULTS AND DISCUSSION
Using the equations explained above, the maximum power densities were calculated
for each of the MEAs at each of the testing conditions. The power density represents how
much power can be obtained per square centimeter of electrode material and is thus a fair
representation of the amount of power generated per catalyst loading. The names of the
MEAs in the table below refer to the composition of the catalyst layer at the cathode.
Please see the bibliography for the location of all data files. Maximum power densities
for the low temperature, high relative humidity testing condition are shown in Table 5.
MEA k V0 wmax (W/cm2) Pt #1 1.71 0.806 0.0953 Pt #2 0.995 0.784 0.155
AVG 0.125
25 #1 0.926 0.809 0.176 25 #2 1.03 0.777 0.146
AVG 0.161
40 #1 0.964 0.775 0.156 40 #2 0.715 0.779 0.212
AVG 0.184
50 #1 0.818 0.763 0.178 50 #2 1.10 0.810 0.149 50 #3 0.987 0.743 0.140
AVG 0.159
60 #1 0.766 0.743 0.180 60 #2 0.779 0.755 0.183
AVG 0.182
75 #1 1.078 0.691 0.111 75 #2 1.108 0.694 0.109
AVG 0.110
Au #1 2.61 0.373 0.0133 Au #2 2.05 0.350 0.0149
AVG 0.0141
Table 5. Maximum power densities at 600 C, 8.0 ml/min H2, 4.0 ml/min O2
47
From these preliminary calculations, it seems that a platinum-gold combination of
between 40 wt. % and 60 wt. % gold on the cathode results in the highest power density.
The power density seems to decrease at the 50 wt. % gold composition, peak again at the
60 wt. % gold composition, and then decrease at compositions greater than 60 wt. %
gold, however, this slight decrease at the 50 wt. % gold composition is most likely not
evident of a trend.
It is interesting to note the peak in power density at the 60 wt. % gold catalyst
composition since studies have shown that it is also at a 60 wt. % gold, 40 wt. %
palladium alloy composition that a change in current density trend occurs. As noted in the
background section, there was found to be a rapid decrease of i0 with increase of gold
composition until a composition of 60% gold was reached. Thereafter, the decrease in i0
with increase in percent of gold composition was much slower. This has been explained
by the gradual filling up of the d band of the alloy and consequent decrease in the rate of
hydrogen evolution with increase in gold composition from 0 to 60% gold. At 60% gold
composition, the d band is completed in the alloy and thus between 60 and 100% gold in
the alloy, there is hardly any change in the rate of hydrogen evolution in it. Yet, in the
work presented in this paper, the gold-platinum composition is being tested on the
cathode for the oxygen reduction reaction, not for the hydrogen-evolution reaction. Also,
alloys are not being utilized but instead slurries of the two metals deposited on carbon
particles and sonicated in ethyl alcohol. The alloy has different surface characteristics
than the slurry and therefore the power density peaks at 40% and 60% wt. gold slurries
cannot necessarily be explained by the completion of the d-band or the surface
characteristics of the catalyst.
48

The results from the platinum-50 MEA #2 were particularly poor at each of the
four testing conditions, with high levels of crossover occurring, as can be seen by the
negative currents obtained on the IV curves (see Figure 8).
y = -1.1029x + 0.8104R2 = 0.995
0.000
0.100
0.200
0.300
0.400
0.500
0.600
0.700
0.800
0.900
1.000
-0.050 0.000 0.050 0.100 0.150 0.200 0.250 0.300 0.350Current Density (A/cm2)
Volta
ge (V
)
Figure 8. Platinum-50 MEA #2 at 600 C, 8.0 ml/min H2, 4.0 ml/min O2
However, if the power density value for this MEA were discarded, the average power
density obtained with the 50 wt. % slurries would still be 0.159 W/cm2. Crossover occurs
when unreacted hydrogen travels over to the cathode and results in a lower potential. This
phenomenon is better explained by a deficiency in the membrane that caused hydrogen to
pass through the MEA rather than a deficiency in the catalyst material itself. Regardless,
the overall trend remains the same despite the poor performance of Platinum-50 MEA #2.
In Figure 8, the sharp dip in the bottom portion of the curve at approximately
0.200 A can be explained by the adsorption of the reactant gases and the consumption of
those gases. A mass balance on hydrogen shows that moles of H2 subtracted from moles
of H2 in gives the steady state current. For 100% hydrogen utilization, the steady state
current is equivalent to the limiting current. The limiting current is therefore equal to:
49

A
KKmolbarcmsmolcoulombscmbar 05.1
)298(*)/82(*min)/160()/500,96(*min)/8(*)1(
3
3
=−
The fact that currents exceeding 1.05 A are achieved is due to the inventory of hydrogen
in the flow channels and adsorbed on the electrodes that can be used up in the reaction.
At 0.200 A, stored hydrogen formerly adsorbed at the anode or in the flow channels is
fully consumed, causing a sharp drop in potential at 0.200 A. As more reactant gases are
fed into the fuel cell and consumed by the reaction, the potential slowly increases again
with decreasing current. This phenomenon occurs with several of the other MEAs at the
low temperature, high relative humidity testing condition as well, most notably:
Platinum-25 MEA #1 and #2, Platinum-40 MEA #2, Platinum-50 MEA #1 and #2,
Platinum-60 MEA #2, and Platinum-75 MEA #2. See Figures 9 –14.
y = -0.9259x + 0.8085R2 = 0.9956
0.0000.1000.2000.3000.4000.5000.6000.7000.8000.9001.000
-0.050 0.000 0.050 0.100 0.150 0.200 0.250 0.300 0.350 0.400 0.450Current Density (A/cm2)
Volta
ge (V
)
Figure 9. Platinum-25 MEA 1 at 600 C, 8.0 ml/min H2, 4.0 ml/min O2
50

y = -1.0348x + 0.7766R2 = 0.9977
0.0000.100
0.2000.300
0.4000.5000.600
0.7000.800
0.9001.000
-0.100 0.000 0.100 0.200 0.300 0.400 0.500
Current Density (A/cm2)
Volta
ge (V
)
Figure 10. Platinum-25 MEA 2 at 600 C, 8.0 ml/min H2, 4.0 ml/min O2
51

y = -0.7154x + 0.7785R2 = 0.9969
0.0000.1000.2000.3000.4000.5000.6000.7000.8000.9001.000
-0.050 0.000 0.050 0.100 0.150 0.200 0.250 0.300 0.350 0.400 0.450 0.500
Current Density (A/cm2)
Volta
ge (V
)
Figure 11. Platinum-40 MEA 2 at 600 C, 8.0 ml/min H2, 4.0 ml/min O2
y = -0.8183x + 0.7626R2 = 0.9943
0.0000.1000.2000.3000.4000.5000.6000.7000.8000.9001.000
-0.050 0.000 0.050 0.100 0.150 0.200 0.250 0.300 0.350 0.400 0.450 0.500
Current Density (A/cm2)
Volta
ge (V
)
Figure 12. Platinum-50 MEA 1 at 600 C, 8.0 ml/min H2, 4.0 ml/min O2
52

y = -0.7786x + 0.7552R2 = 0.9969
0.0000.1000.2000.300
0.4000.5000.600
0.7000.800
0.9001.000
-0.100 0.000 0.100 0.200 0.300 0.400 0.500
Current Density (A/cm2)
Volta
ge (V
)
Figure 13. Platinum-60 MEA 2 at 600 C, 8.0 ml/min H2, 4.0 ml/min O2
y = -1.1075x + 0.694R2 = 0.9978
0.000
0.100
0.200
0.300
0.400
0.500
0.600
0.700
0.800
0.900
1.000
-0.050 0.000 0.050 0.100 0.150 0.200 0.250 0.300 0.350 0.400 0.450Current Density (A/cm2)
Volta
ge (V
)
Figure 14. Platinum-75 MEA 2 at 600 C, 8.0 ml/min H2, 4.0 ml/min O2
Each of these MEAs seems to have reached maximum reactant gas consumption at the
electrodes at different current densities, which makes sense in light of their overall
differences in performance. Because each MEA has a different combination of catalyst
they have varying abilities to adsorb the reactants. As the amount of gold in the catalyst
layer increases, the current density at which the adsorbed reactant gases are full
consumed decreases until the 60 wt. % gold, 40 wt. % platinum catalyst combination is
reached. At the 60 wt. % gold, 40 wt. % platinum catalyst combination, the current
53

density at which the gases are full consumed increases again. Current and voltage are
both displayed verses time for the current-voltage sweep for platinum-40 MEA #2 at the
first testing condition in Figure 15 so as to emphasize the linear progression of
fluctuations in voltage and current as well as to explicate the mechanisms of adsorption
and consumption of reactant gases.
-0.200
0.000
0.200
0.400
0.600
0.800
1.000
0.0 20.0 40.0 60.0 80.0 100.0 120.0 140.0
Time (s)
Voltage (V)Current (A)
Figure 15. Current and Voltage vs. Time for Platinum-40 MEA #2 at 600 C, 8.0 ml/min H2, 4.0 ml/min O2
It can be seen in Figure 15 that at a current of over 0.400 at time 58 seconds, where the
voltage should bottom out, it actually is sustained until about 70 seconds. This is due to
the fact that the reaction is being powered by adsorbed hydrogen and hydrogen in the
flow channels for several seconds. This confirms the hypothesis that the level of surface
adsorption of reactant gases and their subsequent consumption play a role in the overall
performance of the catalyst layer.
At the low temperature, high relative humidity testing condition, the mass transfer
limitation region of the graph was restricted due to the limitations of the Arbin
instrument. The maximum current the Arbin unit will allow is 2.2 A. This is discernible
54

on the IV curve by a sharp drop off at 0.437 A/cm2 instead of an obvious mass transfer
region. See Figures 16 – 22.
y = -0.9946x + 0.784R2 = 0.996
0.1000.2000.3000.4000.5000.6000.7000.8000.9001.000
Volta
ge (V
)
0.000-0.050 0.000 0.050 0.100 0.150 0.200 0.250 0.300 0.350 0.400 0.450 0.500
Current Density (A/cm2)
Figure 16. Platinum-Platinum MEA 2 at 600 C, 8.0 ml/min H2, 4.0 ml/min O2
y = -0.7154x + 0.7785R2 = 0.9969
0.0000.1000.2000.3000.4000.5000.6000.7000.8000.9001.000
-0.050 0.000 0.050 0.100 0.150 0.200 0.250 0.300 0.350 0.400 0.450 0.500
Current Density (A/cm2)
Volta
ge (V
)
Figure 17. Platinum-40 MEA 1 at 600 C, 8.0 ml/min H2, 4.0 ml/min O2
55

y = -0.9635x + 0.7754R2 = 0.9991
0.0000.1000.2000.3000.4000.5000.6000.7000.8000.9001.000
-0.050 0.000 0.050 0.100 0.150 0.200 0.250 0.300 0.350 0.400 0.450 0.500
Current Density (A/cm2)
Volta
ge (V
)
Figure 18. Platinum-40 MEA 2 at 600 C, 8.0 ml/min H2, 4.0 ml/min O2
y = -0.8183x + 0.7626R2 = 0.9943
0.0000.1000.2000.3000.4000.5000.6000.7000.8000.9001.000
-0.050 0.000 0.050 0.100 0.150 0.200 0.250 0.300 0.350 0.400 0.450 0.500
Current Density (A/cm2)
Volta
ge (V
)
Figure 19. Platinum-50 MEA 1 at 600 C, 8.0 ml/min H2, 4.0 ml/min O2
56

y = -0.9865x + 0.7433R2 = 0.9963
0.0000.1000.2000.3000.4000.5000.6000.7000.8000.9001.000
-0.050 0.000 0.050 0.100 0.150 0.200 0.250 0.300 0.350 0.400 0.450 0.500
Current Density (A/cm2)
Volta
ge (V
)
Figure 20. Platinum-50 MEA 3 at 600 C, 8.0 ml/min H2, 4.0 ml/min O2
y = -0.7655x + 0.743R2 = 0.995
0.0000.1000.2000.3000.4000.5000.6000.7000.8000.9001.000
-0.050 0.000 0.050 0.100 0.150 0.200 0.250 0.300 0.350 0.400 0.450 0.500
Current Density (A/cm2)
Volta
ge (V
)
Figure 21. Platinum-60 MEA 1 at 600 C, 8.0 ml/min H2, 4.0 ml/min O2
57

y = -1.0784x + 0.6912R2 = 0.9976
0.0000.1000.2000.3000.4000.5000.6000.7000.8000.9001.000
-0.050 0.000 0.050 0.100 0.150 0.200 0.250 0.300 0.350 0.400 0.450 0.500
Current Density (A/cm2)
Volta
ge (V
)
Figure 22. Platinum-75 MEA 1 at 600 C, 8.0 ml/min H2, 4.0 ml/min O2
A different theory stating that this sharp drop off in potential at 0.437 A/cm2 was caused
by limitations induced by a lack of reactant gases was tested for Platinum-75 MEA #1 by
increasing the amounts of both oxygen and hydrogen while leaving the other reactant gas
at the same value as in the low temperature, high relative humidity testing conditions.
The results are shown in Figures 23 – 24.
58

y = -1.5972x + 0.7163R2 = 0.9989
0.0000.100
0.200
0.300
0.400
0.5000.600
0.7000.800
0.9001.000
-0.050 0.000 0.050 0.100 0.150 0.200 0.250 0.300 0.350
Current Density (A/cm2)
Volta
ge (V
)
Figure 23. Platinum-75 MEA 1 at 600 C, 8.0 ml/min H2, 6.0 ml/min O2
y = -1.5141x + 0.7618R2 = 0.9991
0.0000.100
0.2000.300
0.4000.5000.6000.7000.8000.9001.000
-0.050 0.000 0.050 0.100 0.150 0.200 0.250 0.300 0.350
Current Density (A/cm2)
Volta
ge (V
)
Figure 24. Platinum-75 MEA 1 at 600 C, 10.0 ml/min H2, 4.0 ml/min O2
From these tests it is not clear if hydrogen or oxygen was the limiting reactant gas. In
fact, they both seem to have been limiting in the case of the 600 C, 8.0 ml/min H2, and 4.0
ml/min O2 testing condition. However, much lower current densities were achieved with
the increase in hydrogen than with the increase in oxygen and both increases resulted in
lower current densities than the initial condition. The lower current densities obtained
59

with these increases in reactant gases as compared to the initial testing condition can be
explained by deterioration in the MEA in between the tests or drying out of the MEA due
to higher flow rates of reactant gases. The increase in hydrogen and oxygen was tested
approximately two weeks after the original testing condition. The fact that lower current
densities were achieved with the increase in hydrogen than with the increase in oxygen
suggests that the oxygen becomes adsorbed more easily at the surface of the catalyst,
resulting in an oxygen deficiency that can be slightly remedied by an increase in oxygen
flow rate. However, the reason for restriction in the mass flow limitation regime is due to
instrument limitations, and not to actual mass flow limitations.
At the low temperature, low relative humidity testing condition the highest power
density was achieved at the 60 wt. % gold, 40 wt. % platinum composite catalyst
although there is also an extended peak in power density between the 40 wt. % gold and
60 wt. % gold compositions. The power density slowly increases with the percentage of
gold until the 50% composition, at which point there is a decrease in performance, even
when the power density value for Platinum-50 MEA #2 is discarded. However, it is
believed that the slight decrease at 50% composition is not indicative of an actual
decreasing trend at this composition. After the second peak in performance at the 60 wt.
% gold composition, there is a definite decrease in performance with increasing amounts
of gold. See Table 6 below.
MEA k V0 wmax (W/cm2) Pt #1 1.88 0.776 0.0803Pt #2 0.992 0.806 0.164
AVG 0.122
25 #1 0.980 0.820 0.17225 #2 1.42 0.801 0.113
AVG 0.142
60

40 #1 0.997 0.806 0.16340 #2 0.792 0.823 0.214
AVG 0.188
50 #1 0.757 0.777 0.19950 #2 1.07 0.806 0.15350 #3 0.955 0.762 0.152
AVG 0.168
60 #1 0.748 0.791 0.20960 #2 0.804 0.790 0.194
AVG 0.202
75 #1 0.924 0.722 0.14175 #2 0.987 0.712 0.128
AVG 0.135
Au #1 12.5 0.324 0.00209Au #2 2.13 0.421 0.0208
AVG 0.0115 Table 6. Maximum power densities at 600 C, 12.0 ml/min H2, 6.0 ml/min O2
Compared to the power densities of each MEA at the low temperature, high relative
humidity testing, the power densities of the MEAs at the low temperature, low relative
humidity testing were lower for the platinum-platinum, platinum-25, and platinum-gold
MEAs but higher for the platinum-40, platinum-50, platinum-60, and platinum-75 MEAs.
The poorer performance for the platinum-platinum, platinum-25, and platinum-gold
MEAs can be accounted for by drying out of the polymer membrane at the higher flow
rates of reactant gases. The higher performance for the platinum-40, platinum-50,
platinum-60, and platinum-75 MEAs despite possible drying out of the membrane could
be accounted for by the enhanced catalytic activity of the combinatorial catalysts at
higher temperatures.
Several of the MEAs also showed strong adsorption at the catalyst layer at the low
temperature, low relative humidity testing condition. This is discernible by the sharp dip
61

in potential in the bottom portion of the IV curve, caused by the complete consumption of
adsorbed reactant gases. These IV curves are shown below (Figures 25 – 26).
y = -0.7921x + 0.8232R2 = 0.9917
0.0000.100
0.2000.300
0.4000.500
0.600
0.7000.800
0.9001.000
-0.100 0.000 0.100 0.200 0.300 0.400 0.500
Current Density (A/cm2)
Volta
ge (V
)
Figure 25. Platinum-40 MEA #2 at 600 C, 12.0 ml/min H2, 6.0 ml/min O2
y = -0.7573x + 0.7768R2 = 0.9943
0.0000.1000.2000.300
0.4000.5000.6000.7000.800
0.9001.000
-0.100 0.000 0.100 0.200 0.300 0.400 0.500
Current Density (A/cm2)
Volta
ge (V
)
There are far fewer MEAs that displayed this phenomenon at this condition than at the
low temperature, high relative humidity testing condition. Therefore, the increased flow
rates of both reactant gases must play a role in the phenomenon. The sharp dip in the
potential is caused by the consumption of the adsorbed reactant gases and the temporary
lack of adsorbed reactant gases to fuel the reaction. Therefore, it makes sense that this
Figure 26. Platinum-50 MEA #1 at 600 C, 12.0 ml/min H2, 6.0 ml/min O2
62
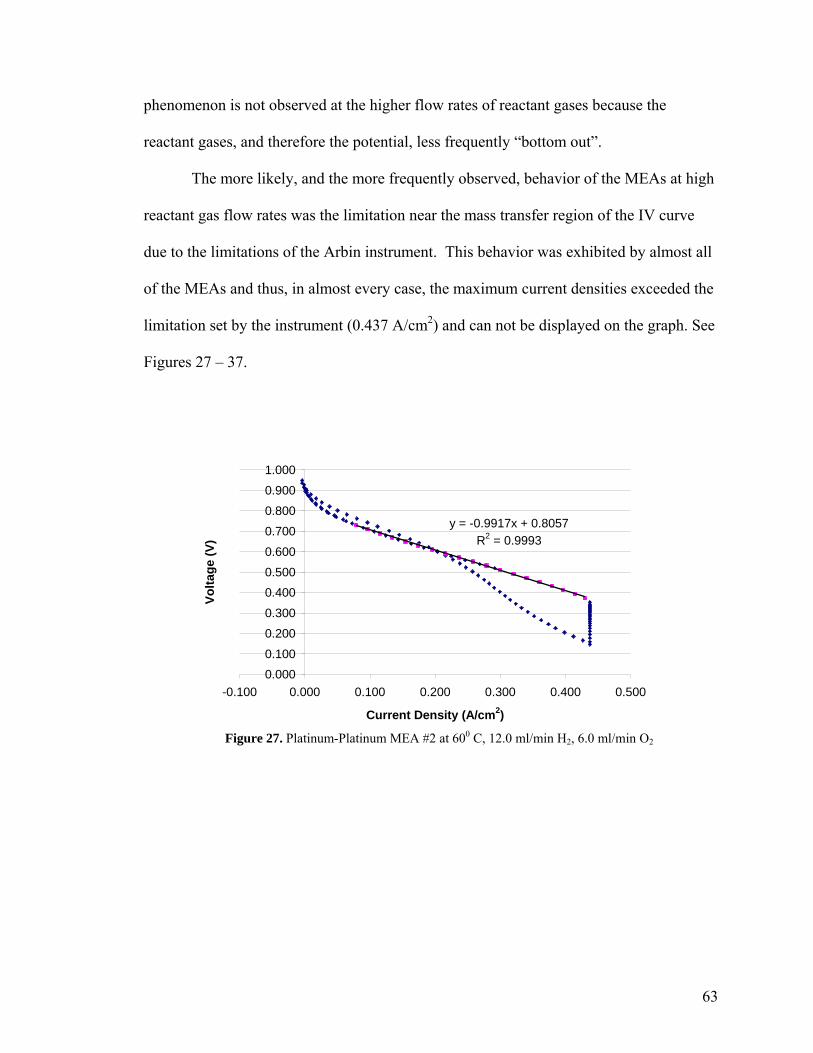
phenomenon is not observed at the higher flow rates of reactant gases because the
reactant gases, and therefore the potential, less frequently “bottom out”.
The more likely, and the more frequently observed, behavior of the MEAs at high
reactant gas flow rates was the limitation near the mass transfer region of the IV curve
due to the limitations of the Arbin instrument. This behavior was exhibited by almost all
of the MEAs and thus, in almost every case, the maximum current densities exceeded the
limitation set by the instrument (0.437 A/cm2) and can not be displayed on the graph. See
Figures 27 – 37.
y = -0.9917x + 0.8057R2 = 0.9993
0.0000.100
0.2000.300
0.4000.5000.600
0.7000.8000.9001.000
-0.100 0.000 0.100 0.200 0.300 0.400 0.500
Current Density (A/cm2)
Volta
ge (V
)
Figure 27. Platinum-Platinum MEA #2 at 600 C, 12.0 ml/min H2, 6.0 ml/min O2
63

y = -0.9797x + 0.8197R2 = 0.9983
0.000
0.100
0.200
0.300
0.400
0.500
0.600
0.700
0.800
0.900
1.000
-0.100 0.000 0.100 0.200 0.300 0.400 0.500Current Density (A/cm2)
Volta
ge (V
)
Figure 28. Platinum-25 MEA #1 at 600 C, 12.0 ml/min H2, 6.0 ml/min O2
64

y = -0.9971x + 0.8055R2 = 0.9986
0.000
0.100
0.200
0.300
0.400
0.500
0.600
0.700
0.800
0.900
1.000
-0.100 0.000 0.100 0.200 0.300 0.400 0.500Current Density (A/cm2)
Volta
ge (V
)
Figure 29. Platinum-40 MEA #1 at 600 C, 12.0 ml/min H2, 6.0 O2
y = -0.7921x + 0.8232R2 = 0.9917
0.000
0.1000.200
0.3000.400
0.500
0.6000.7000.8000.900
1.000
-0.100 0.000 0.100 0.200 0.300 0.400 0.500
Current Density (A/cm2)
Volta
ge (V
)
Figure 30. Platinum-40 MEA #2 at 600 C, 12.0 ml/min H2, 6.0 O2
65

y = -0.7573x + 0.7768R2 = 0.9943
0.000
0.100
0.200
0.3000.400
0.500
0.600
0.700
0.8000.900
1.000
-0.100 0.000 0.100 0.200 0.300 0.400 0.500
Current Density (A/cm2)
Volta
ge (V
)
Figure 31. Platinum-50 MEA #1 at 600 C, 12.0 ml/min H2, 6.0 O2
y = -1.0661x + 0.8064R2 = 0.9968
0.000
0.1000.200
0.3000.400
0.500
0.6000.700
0.8000.900
1.000
-0.100 0.000 0.100 0.200 0.300 0.400 0.500
Current Density (A/cm2)
Volta
ge (V
)
Figure 32. Platinum-50 MEA #2 at 600 C, 12.0 ml/min H2, 6.0 O2
66

y = -0.9551x + 0.7624R2 = 0.995
0.0000.100
0.2000.300
0.4000.5000.600
0.7000.8000.9001.000
-0.100 0.000 0.100 0.200 0.300 0.400 0.500
Current Density (A/cm2)
Volta
ge (V
)
Figure 33. Platinum-50 MEA #3 at 600 C, 12.0 ml/min H2, 6.0 O2
y = -0.7476x + 0.7907R2 = 0.9933
0.0000.100
0.2000.300
0.4000.5000.600
0.7000.800
0.9001.000
-0.100 0.000 0.100 0.200 0.300 0.400 0.500
Current Density (A/cm2)
Volta
ge (V
)
Figure 34. Platinum-60 MEA #1 at 600 C, 12.0 ml/min H2, 6.0 O2
67

y = -0.8037x + 0.79R2 = 0.9962
0.000
0.100
0.200
0.300
0.4000.500
0.600
0.700
0.800
0.9001.000
-0.100 0.000 0.100 0.200 0.300 0.400 0.500
Current Density (A/cm2)
Volta
ge (V
)
Figure 35. Platinum-60 MEA #2 at 600 C, 12.0 ml/min H2, 6.0 O2
y = -0.9243x + 0.7216R2 = 0.9883
0.000
0.100
0.200
0.300
0.400
0.500
0.600
0.700
0.800
0.900
1.000
-0.100 0.000 0.100 0.200 0.300 0.400 0.500Current Density (A/cm2)
Volta
ge (V
)
Figure 36 Platinum-75 MEA #1 at 600 C, 12.0 ml/min H2, 6.0 O2
68

y = -0.9865x + 0.7117R2 = 0.9951
0.0000.100
0.2000.300
0.4000.5000.600
0.7000.800
0.9001.000
-0.100 0.000 0.100 0.200 0.300 0.400 0.500
Current Density (A/cm2)
Volta
ge (V
)
Figure 37 Platinum-75 MEA #2 at 600 C, 12.0 ml/min H2, 6.0 O2
Not all of the power densities of the MEAs at the low temperature, low relative humidity
exceeded the power densities at the low temperature, high relative humidity condition.
However, it is clear from the above graphs that the maximum current density was met far
more frequently at the low relative humidity than at the high relative humidity condition.
This can be explained by the increase in flow rates of the reactant gases and the
subsequent affect on the catalytic activity of the combinatorial catalyst layer.
The power densities at the high temperature testing conditions were significantly
poorer due to the performance requirements of the polymer membrane electrolyte.
Because the polymer membrane electrolyte must remain sufficiently hydrated in order to
act as an ion conductor, the operating temperature is limited by the boiling point of water.
The optimal operating temperature of PEMFCs is therefore between 60 and 100 0C. At
the higher end of this temperature range performance is negatively affected by the
dehydration of the membrane, especially at high flow rates of reactant gases as is the case
69

at the high temperature, low relative humidity testing condition. See Table 7 (asterisks
indicate particularly poor MEA performance in terms of crossover and, in the absence of
any data, indicate the failure to create enough potential to complete a test).
MEA k V0 wmax (W/cm2)Pt #1 2.82 0.820 0.0597Pt #2 0.871 0.686 0.135
AVG 0.0974
25 #1 1.42 0.771 0.10525 #2 1.34 0.762 0.109
AVG 0.107
40 #1 2.10 0.779 0.072240 #2 0.886 0.781 0.172
AVG 0.122
50 #1 1.45 0.753 0.0979*50 #2* 3.69 0.400 0.0108
50 #3 1.41 0.745 0.0986 AVG 0.0983
60 #1 1.31 0.733 0.10360 #2 1.14 0.756 0.126
AVG 0.114
75 #1 2.05 0.712 0.061775 #2 2.26 0.702 0.0547
AVG 0.0582
Au #1 211 0.405 0.000190Au #2 3.44 0.123 0.00110
AVG 0.000650
Once again the power density peaks between combinatorial catalyst compositions of 40
wt. % gold and 60 wt. % gold, with the 40 wt. % gold composition yielding the highest
power density. The power density increases with percent weight gold until 40 wt. %,
slightly decreases at 50 wt. % gold, and peaks again at 60 wt. % gold, and then decreases
Table 7. Maximum power densities at 900 C, 12.0 ml/min H2, 6.0 ml/min O2
70

with increasing percent weight gold. Once again, the slight decrease at 50 wt. % gold is
not thought to be indicative of a decreasing trend at this composition.
The phenomenon of adsorbed reactant gases being thoroughly consumed resulting
in the potential “bottoming-out” only occurred with one MEA at the high temperature,
low relative humidity condition – Platinum-40 MEA #2. See Figure 38
y = -0.8864x + 0.7813R2 = 0.9962
0.0000.100
0.2000.300
0.4000.5000.600
0.7000.800
0.9001.000
-0.100 0.000 0.100 0.200 0.300 0.400 0.500
Current Density (A/cm2)
Volta
ge (V
)
Figure 38 Platinum-40 MEA #2 at 900 C, 12.0 ml/min H2, 6.0 ml/min O2
The rarity of this phenomenon at this testing condition can be explained by the high flow
rate of reactant gases, which prevents the reaction from running out of reactant gases.
Furthermore, the high temperature at this testing condition prevents the MEAs from
achieving maximum current densities greater than 0.437 A/cm2. Hence, the second
phenomenon described above, which involves the sudden drop in potential at 0.437
A/cm2 due to instrument limitations, is not observed at this testing condition for any of
the MEAs.
In the case of the high temperature, high relative humidity testing condition, the
40 wt. % gold, 60 wt. % platinum combinatorial catalyst resulted in the highest maximum
71
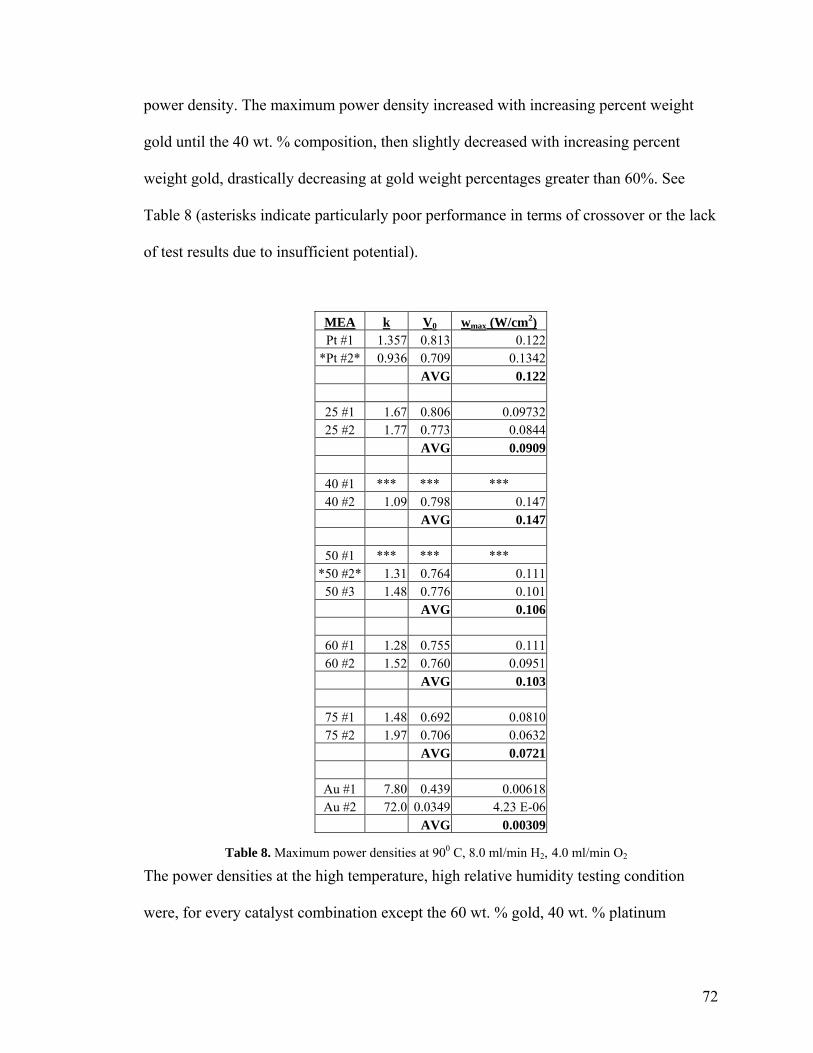
power density. The maximum power density increased with increasing percent weight
gold until the 40 wt. % composition, then slightly decreased with increasing percent
weight gold, drastically decreasing at gold weight percentages greater than 60%. See
Table 8 (asterisks indicate particularly poor performance in terms of crossover or the lack
of test results due to insufficient potential).
MEA k V0 wmax (W/cm2) Pt #1 1.357 0.813 0.122
*Pt #2* 0.936 0.709 0.1342 AVG 0.122
25 #1 1.67 0.806 0.0973225 #2 1.77 0.773 0.0844
AVG 0.0909
40 #1 *** *** *** 40 #2 1.09 0.798 0.147
AVG 0.147
50 #1 *** *** *** *50 #2* 1.31 0.764 0.111
50 #3 1.48 0.776 0.101 AVG 0.106
60 #1 1.28 0.755 0.11160 #2 1.52 0.760 0.0951
AVG 0.103
75 #1 1.48 0.692 0.081075 #2 1.97 0.706 0.0632
AVG 0.0721
Au #1 7.80 0.439 0.00618Au #2 72.0 0.0349 4.23 E-06
AVG 0.00309
Table 8. Maximum power densities at 900 C, 8.0 ml/min H2, 4.0 ml/min O2
The power densities at the high temperature, high relative humidity testing condition
were, for every catalyst combination except the 60 wt. % gold, 40 wt. % platinum
72

combination, higher than those at the high temperature, low relative humidity testing
condition. This difference can be attributed to further dehydration of the polymer
membrane at the low relative humidity (high reactant gas flow rate) condition. The higher
power density for the 60 wt. % gold, 40 wt. % platinum combination at the low relative
humidity (high reactant gas flow rate) condition, as compared to the power density for
this combinatorial catalyst at the high relative humidity condition, suggests that the
catalytic activity of the high performance catalyst combination had more of an affect on
the power density than did the dehydration of the membrane.
The “bottoming-out” of the potential due to a lack of adsorbed reactant gases to
feed the reaction occurred for only three of the MEAs at the high temperature, high
relative humidity testing condition. See Figures 39– 41
y = -1.0872x + 0.7983R2 = 0.9962
0.0000.1000.2000.300
0.4000.5000.6000.7000.800
0.9001.000
-0.050 0.000 0.050 0.100 0.150 0.200 0.250 0.300 0.350
Current Density (A/cm2)
Volta
ge (V
)
Figure 39. Platinum-40 MEA #2 at 900 C, 8.0 ml/min H2, 4.0 ml/min O2
73

y = -1.2785x + 0.7545R2 = 0.9971
0.0000.1000.2000.300
0.4000.5000.6000.7000.800
0.9001.000
-0.050 0.000 0.050 0.100 0.150 0.200 0.250 0.300 0.350 0.400
Current Density (A/cm2)
Volta
ge (V
)
Figure 40. Platinum-60 MEA #1 at 900 C, 8.0 ml/min H2, 4.0 ml/min O2
y = -1.5172x + 0.7596R2 = 0.9987
0.000
0.1000.200
0.3000.400
0.5000.6000.700
0.8000.900
1.000
-0.050 0.000 0.050 0.100 0.150 0.200 0.250 0.300 0.350
Current Density (A/cm2)
Volta
ge (V
)
74Figure 41. Platinum-60 MEA #2 at 900 C, 8.0 ml/min H2, 4.0 ml/min O2

This phenomenon occurred only slightly more frequently at the high temperature, high
relative humidity testing condition than at the high temperature, low relative humidity
testing condition, which can be explained by the fact that there is less mass flow of
reactant gases at the high temperature, high relative humidity testing condition and
therefore “bottoming-out” occurs more often. However, because maximum current
densities (a measure of reaction rate) are smaller at the higher temperature, less reactant
gas mass flow is needed to fuel the reaction. Therefore, the “bottoming-out” phenomenon
occurs much less frequently at the high temperature testing conditions than at the low
temperature testing conditions. Interestingly enough, although the 100 wt. % platinum
cathode catalyst resulted in a lower power density than the optimum combinatorial
catalyst at the high temperature, high relative humidity testing condition, it still resulted
in the largest maximum current density (0.437 A/cm2, the maximum current density
instrument limit). See Figure 42.
y = -1.3571x + 0.8126R2 = 0.9979
0.0000.100
0.2000.300
0.4000.500
0.600
0.7000.800
0.9001.000
-0.100 0.000 0.100 0.200 0.300 0.400 0.500
Current Density (A/cm2)
Volta
ge (V
)
Figure 42. Platinum-Platinum MEA #1 at 900 C, 8.0 ml/min H2, 4.0 ml/min O2
75

This suggests that different trends may be observed in the maximum current density that
for the maximum power density.
The maximum current densities, as shown in Table 9, vary not only with cathode
catalyst combination but also with testing condition.
600 C, 8.0 ml/min H2,
4.0 ml/min O2 600 C, 12.0 ml/min H2,
6.0 ml/min O2 900 C, 12.0 ml/min H2,
6.0 ml/min O2 900 C, 8.0 ml/min H2,
4.0 ml/min O2 AVGPt #1 0.437 0.291 0.146 0.437 0.328Pt #2 0.437 0.437 0.354 0.082 25 #1 0.399 0.437 0.334 0.243 0.33925 #2 0.415 0.33 0.336 0.221 40 #1 0.437 0.437 0.224 *** 0.38040 #2 0.437 0.437 0.402 0.303 50 #1 0.437 0.437 0.374 *** 0.40950 #2 0.317 0.437 0.114 0.266 50 #3 0.437 0.437 0.381 0.349 60 #1 0.437 0.437 0.408 0.338 0.40560 #2 0.436 0.437 0.415 0.329 75 #1 0.437 0.437 0.284 0.326 0.35575 #2 0.416 0.437 0.249 0.252 Au #1 0.14 0.025 0.002 0.066 0.155Au #2 0.164 0.193 0.03 0.001 AVG 0.386 0.402 0.289 0.247
As discussed previously, the maximum current density instrument limit, 0.437 A/cm2, is
met more frequently at the low temperature than at the high temperature testing
conditions and met most frequently at the low temperature, high flow rate (low humidity
testing condition). The increase in performance of the MEAs at the low temperature, high
flow rate as compared to the performance at the low temperature, low flow rate condition
defies the theory that dehydration of the polymer membrane leads to poorer performance.
This is due to stoichiometry and also suggests that an increase in flow rate affects the
adsorption of the reactant gases on the electrodes and alters the catalytic activity. The
Table 9. Maximum Current Densities (A/cm2)
76
average maximum current density at both low temperature testing conditions is
significantly higher than the averages at the high temperature testing conditions due to
dehydration of the polymer membrane and possible affects of temperature on the catalytic
activity of the combinatorial catalysts. The maximum current densities at the higher
temperature testing conditions do not reach the maximum current density limit because of
their relatively poor performance. However, once again, the high temperature, high flow
rate condition leads to a higher average maximum current density than the high
temperature, low flow rate condition, suggesting that dehydration of the membrane is not
the only factor affecting maximum current density.
Preliminary results indicate that the hypothesis concerning possible synergies
between gold and platinum, the benefits of gold on the cathode catalyst layer, and the
respective increase in efficiency of the catalyst layer is correct. However simple
measurements of rates (for example, exchange-current densities) and, therefore, also
measurements of power densities, are evidently fraught with secondary factors, which are
not those connected with electronic bonding and the geometric effects of catalysts.lxxii It
is necessary to positively determine if temperature or relative humidity has any effect on
catalyst behavior. It is also necessary to determine if certain phenomena such as
“bottoming-out” are due to catalytic affects or testing conditions or both. If changes in
the shape of IV curves can be directly linked to catalytic affects it could be possible to
determine the mechanisms involved in the catalytic activity and examine the validity of
the observed patterns. Assuming that the observed patterns are valid reflections of the
efficiency of the catalyst layer, the 40 wt. % gold/60 wt. % platinum combinatorial
catalyst at the cathode offers a 47%, 54%, 25%, and 20% improvement over the platinum
77

catalyst at the cathode at the low temperature/high humidity, low temperature/low
humidity, high temperature/low humidity, high temperature/high humidity testing
conditions respectively. The 60 wt. % gold/40 wt. % platinum combinatorial catalyst at
the cathode offers a 46%, 66%, and 17% improvement over the platinum catalyst at the
cathode at the low temperature/high humidity, low temperature/low humidity, high
temperature/low humidity testing conditions respectively. The largest improvement over
platinum catalyst was seen with the 60 wt. % gold/40 wt. % platinum combinatorial
catalyst at the low temperature/low relative humidity testing condition.
78

V. CONCLUSION
Fuel cells are extremely efficient and nonpolluting electrochemical energy
converters that convert fuel (usually hydrogen) directly into electricity via the oxidation
of hydrogen and reduction of oxygen. Hydrogen enters the fuel cell at the anode and is
adsorbed and stripped of its electrons. The protons move through the electrolyte and the
electrons move through an external circuit to create electricity. Oxygen enters the fuel
cell at the cathode where it combines with protons and electrons to form either water or
hydrogen peroxide. Because fuel cells directly convert the fuel into energy they do not
underlie the limitations of the Carnot cycle. Theoretical fuel cell efficiency is instead
equal to the ratio between the useful energy output (the Gibbs free energy) and the total
energy input contained in the fuel (the enthalpy). The theoretical fuel cell efficiency is
equal to 83%. However, the practical energy efficiency ranges between 35 and 70% as
compared to the practical energy efficiency of heat engines, which is well below 30%.
Fuel cell technology also offers the potential for lowering or eliminating emissions,
particularly when hydrogen is used as the fuel. Currently the cost of fuel cells fails to
compare to other energy technologies and it is therefore necessary to increase the
efficiency of fuel cells while decreasing the cost. The current primary areas of fuel cell
development fall under two categories: the development of a hydrogen infrastructure and
the mass production of efficient MEAs. Because the reactions involved in producing
electricity in a fuel cell occur at the catalyst layer of the electrode at the three phase
boundary it is this catalyst layer that offers the largest potential for efficiency
improvement.
79

PEMFCs operate at a lower temperature (60 –1000 C) due to the use of a thin
proton conductive polymer membrane electrolyte and have a higher power density as
well as more design flexibility and convenience than other types of fuel cells. They are
therefore the most likely to be used in automobiles and offer significant emissions
advantages. The polymer membrane electrolyte in a PEMFC is sandwiched between two
porous, electrically conductive electrodes, which are made out of carbon cloth or carbon
fiber paper. At the interface between the electrodes and the polymer membrane there
exists a catalyst layer, which is typically platinum supported on carbon. The
electrochemical reactions take place at this interface. The membrane electrode assembly
is placed between the collector/separator plates, which collect and conduct electrical
current. When PEMFC technology was first invented in the 1960s it required pure
hydrogen and oxygen and very high precious metal loadings, which made it impractical
for terrestrial applications. However, technical breakthroughs between 1985 and 1995 led
to the lowering of precious metal loadings, effective approaches to operation with air and
impure hydrogen fuel, and resolution of water management issues.
Polymer membrane electrolytes are comprised of a hydrophobic Teflon-like
backbone and a hydrophyllic sulphonic acid side chain. The relative hydrophobicity and
hydrophyllicity contribute to the water management issues in a PEMFC. The
perfluorinated ionomer membranes known under the trade name of Nafion have been
found to have favorable chemical, mechanical, and thermal properties along with high
proton conductivity when sufficiently hydrated. Furthermore, the solid state
perfluorinated acid electrolyte environment offers significant advantages over phosphoric
acid for oxygen reduction. The polymer exchange membrane should have high proton
80

conductivity and immobilized anions. It should be insoluble in water but water should be
soluble in the membrane. The membrane should be impermeable to hydrogena nd oxygen
(low crossover). There should exist structural, chemical, thermal and electrochemical
stability as well as tolerance to impurities. The membrane should exhibit swift water
transport and reversible hydration. In addition to managing the hydration of the cell to
maximize the efficiency of the polymer membrane, it is also necessary to maximize the
efficiency of the electrode structure – specifically the catalyst layer.
The electrode structure and catalyst layer can be improved in several ways. As
early as the mid-1800s, it was discovered that a porous electrode structure with high
surface area could increase the area of the region in which the chemical reactions take
place on the electrode surface. It was also determined that coating the catalyst layer with
a thin film of electrolyte led to better performance. The next early developments included
developing a non-conducting porous matrix to hold the liquid electrolyte and using a
powdered electrocatalyst in the form of platinum black. A rough electrode surface can
increase the current under the activation control at any overpotential, however, diffusion
rates are not greatly enhanced unless the depths of roughness are at least of the order of
magnitude of diffusion-layer thickness. The use of porous electrode material does
increase the rate of diffusional processes, thereby facilitating mass transfer to reactant
sites and increasing the overall efficiency of the fuel cell. The gas diffusion layer, which
typically consists of a thin layer of carbon particles on the surface of the porous carbon
substrate, must be optimized so that reactant gases can diffuse but also so that water does
not accumulate within the pores. The diffusion layer must be electrically and thermally
conductive and provide mechanical support, electrical contact, optimal distribution of
81

reactant gases, and a pore structure suitable for the removal of water. In order to satisfy
these requirements, a catalyst slurry ink is applied to the gas diffusion layer or the
membrane itself.
The catalyst plays a role in three main processes in electrochemical reactions:
adsorption, charge transfer, and surface reactions. The catalyst’s role in adsorption and
surface reactions makes geometric and electronic factors important in the catalysis of the
reaction but the charge transfer step also makes the potential at the metal-solution
interface an additional factor for electrochemical reactions. Especially in PEMFCs, the
platinum catalyst loading must be significantly reduced before the technology can be cost
competitive and market introduction can be effected on a broad basis. In order to increase
the efficiency of the catalyst layer and thereby decrease platinum loadings the surface
area of the catalyst layer must be increased. This can be accomplished either by
roughening the surface of the membrane or incorporating some ionomer in the catalyst
layer. Dispersing platinum on carbon black also leads to a higher platinum surface area
and lower platinum loadings. Noble metals have the highest catalytic activity for the
hydrogen-evolution reaction and other transition metals have intermediate catalytic
power. Alloys of noble metals with other metals can also be used as catalysts but the
surface structure is altered by alloying and may lead to poorer performance. Although
platinum is the most commonly used catalyst in PEMFCs, its strong adsorptive
characteristics lead to poor performance at the cathode for the oxygen-reduction reaction.
The slowness of the oxygen-reduction reaction is the principal problem in
hydrogen-oxygen fuel cells. Even at the lowest current density, there is a loss in potential
of the oxygen electrode from the reversible electrode potential by 0.2 to 0.3 volt which
82

results in a 25% decrease in conversion efficiency. If it were possible to make the ORR
increasingly reversible, fuel cells could approach theoretical efficiencies. Under typical
conditions at the platinum catalyst surface, the oxygen reduction intermediate species
share the electrode surface with platinum oxide and or hydroxide compounds as well as
other adsorbed species. Carbon supported platinum alloys have been shown to be more
active and stable as oxygen reduction catalyst but still lead to a high adsorptive character
that hinders the oxygen reduction reaction.
It has been hypothesized that using a combinatorial catalyst of gold, which does
not have the adsorptive character that hydrogen does, and platinum could mitigate the
problem of adsorption of oxygen, intermediates, and impurities at the cathode and
thereby facilitate the chemical reaction involving the recombination of oxygen with
protons and electrons in order to form water. Gold is also slightly less expensive than
platinum. E-TEK gives a price quote for 20% gold on Vulcan XC-72 (carbon support)
equal to $26.61/g compared to $31.62/g for 20% platinum on Vulcan XC-72. Gold and
palladium alloys have been investigated as alternatives to a solid platinum catalyst with
disappointing results. There was found to be a decrease in current density with increase
of gold composition. However, enhanced activity was observed with the use of gold
single crystal surfaces when covered by thin palladium layers. Gold, having no unpaired
d-electrons, does not adsorb oxygen and has a high potential for oxide formation. It is
probable that by alloying gold with other metals, the surface characteristics are changed
and the ability to adsorb various intermediates, reactants, and impurities increases,
thereby negating the benefits of gold as a catalyst.
83
By using a slurry combination of platinum and gold, instead of an alloy, it is
possible to take advantage of the benefits of platinum’s high adsorption activity and
catalytic activity as well as gold’s lack of adsorption activity. Combinatorial catalyst
slurries were created by sonicating a total of 0.050 g 20% platinum on carbon (by weight)
and 20% gold on carbon (by weight) with approximately 10 g isopropanol for more than
thirty minutes. Each slurry was created with a specific weight ratio of platinum to gold in
order to determine the appropriate ratio for optimizing overall MEA performance. The
percent weights of gold/platinum tested were: 0/100, 25/75, 40/60, 50/50, 60/40, 75/25,
and 100/0. Each of these slurries was applied to the cathode while the anode was coated
with a 100% platinum slurry. Two MEAs were produced for each combinatorial cathode
catalyst in order to confirm that results were reproducible. Each MEA was then tested at
both a low temperature and a high temperature and a low relative humidity (high reactant
gas flow rate) and high relative humidity (low reactant gas flow rate). Three CV curves
were obtained for each MEA at each testing condition. Maximum power densities were
calculated for one CV curve for each MEA at each testing condition and compared with
one another to determine the best possible combinatorial catalyst and testing condition.
At both low temperature testing conditions and the high temperature, low relative
humidity testing condition, the power density increased with gold composition and
peaked at the 40 wt. % gold/60 wt. % platinum combination, decreased at the 50/50 wt.
% combination, peaked again at the 60 wt. % gold/40 wt. % platinum combination, then
decreased with increasing gold composition. At the high temperature, high relative
humidity testing condition, the power density increased with gold composition, peaking
at a 40 wt. % gold combination, then decreased with increasing gold composition. The
84
power densities were generally lower at the high temperature testing conditions than at
the low temperature testing conditions due to dehydration of the membrane. The low
relative humidity testing conditions, however, because they involved a larger reactant gas
flow rate, resulted in high power densities and higher maximum current densities than the
high relative humidity testing conditions. A drastic dip in the voltage occurred on many
of the graphs and is thought to be a representation of the complete coating of the
electrode with adsorbed anions. These adsorbed anions are then gradually consumed by
the reaction and the potential gradually increases. Many of the graphs do not show a mass
transfer regime due to the maximum current limitations of the testing software. The best
results were obtained with the 60 wt. % gold/40 wt. % platinum combinatorial cathode
catalyst at the low temperature/low relative humidity testing condition, which showed a
66% improvement over the platinum cathode catalyst at the same testing condition.
PEMFCs, with their high power density and low operating temperature, offer a viable
solution for reducing emissions and shifting reliance on fossil fuels over to a hydrogen-
based economy but only if their cost can be reduced and a hydrogen infrastructure can be
built. Both of these tasks are difficult at best. However, by tackling the problem of slow
oxygen-reduction kinetics at the cathode and increasing the efficiency of the catalyst
layer, it is possible to decrease platinum loadings and bring down the cost of fuel cell
manufacturing. Although platinum has been shown to be an effective catalyst for
PEMFCs, its highly adsorptive character makes it an inefficient catalyst for the oxygen
reduction reaction and contributes to the slow reaction kinetics at the cathode. By
incorporating some gold in the catalyst layer at the cathode this adsorptive character can
be weakened, thereby promoting the oxygen reduction reaction and increasing the
85

efficiency of the fuel cell. Although significant cost reduction and hydrogen
infrastructure development lie between current technologies and a fuel cell powered
future, the increase in efficiency of the catalyst layer at the cathode through the addition
of gold proves to be a step in the right direction.
86

87
i Barbir, Frano. PEM Fuel Cells: Theory and Practice. Elsevier Academic Press (2005): Burlington, MA. pgs. 20-21. iiBarbir, Frano. pg. 39. iiiHamnett, A. “The components of an electrochemical cell.” Handbook of Fuel Cells: Fundamentals, Technology, and Applications, Edited by Wolf Vielstich, Arnold Lamm, and Hubert A. Gasteiger. Volume 1: Fundamentals and survey of systems. © 2003 John Wiley & Sons Ltd. pg. 6. iv Oniciu, Liviu. Fuel Cells. Abacus Press (1976): Tunbridge Wells, Kent. Pg. 31. v Bockris & Srinivasan. Fuel Cells: Their Electrochemistry. McGraw-Hill Book Company
(1969): New York, New York. pg. 35. vi Bockris & Srinivasan. Pg. 35 viiBarbir, Frano. Pg. 12. viii Handbook of Fuel Cells: Fuel Cell Technology and Applications. Edited by Wolf Vielstich, Arnold Lamm, and Hubert A. Gasteiger. Volume 3: Fuel Cell Technology and Applications, Part 1. © 2003 John Wiley & Sons Ltd. pg. xvi. ix Ogden, J. M. “Alternative fuels and prospects – Overview.” Handbook of Fuel Cells: Fuel Cell Technology and Applications. Edited by Wolf Vielstich, Arnold Lamm, and Hubert A. Gasteiger. Volume 3: Fuel Cell Technology and Applications, Part 1. © 2003 John Wiley & Sons Ltd. pg. 9. x Ogden, J. M. pg. 5. xi Ogden, J. M. pgs. 10 xii Ogden, J. M. pg. 13. xiii Ogden, J. M. pgs. 10 xiv Handbook of Fuel Cells: Fuel Cell Technology and Applications. Edited by Wolf Vielstich, Arnold Lamm, and Hubert A. Gasteiger. Volume 3: Fuel Cell Technology and Applications, Part 1. © 2003 John Wiley & Sons Ltd. pg. 121. xv Barbir, Frano. pgs. 6-9. xvi Ogden, J. M. pgs. 6-7. xvii Handbook of Fuel Cells: Fuel Cell Technology and Applications. pg. xvii. xviii “SERC: The PEM Fuel Cell Schematic.” The Schatz Energy Research Center. <http://www.humboldt.edu/~serc/schematic.html> xix Doyle, M. and Rajendran, G. “Perfluorinated Membranes.” Handbook of Fuel Cells: Fuel Cell Technology and Applications. Edited by Wolf Vielstich, Arnold Lamm, and Hubert A. Gasteiger. Volume 3: Fuel Cell Technology and Applications, Part 1. © 2003 John Wiley & Sons Ltd. pg. 352. xx Paddison, S. J. “First Principles modeling of sulfonic acid based ionomer membranes.” Handbook of Fuel Cells: Fuel Cell Technology and Applications. Edited by Wolf Vielstich, Arnold Lamm, and Hubert A. Gasteiger. Volume 3: Fuel Cell Technology and Applications, Part 1. © 2003 John Wiley & Sons Ltd. pg. 398. xxi Wainright, J. S., Litt, M. H., and Savinell, R. F. “High-Temperature Membranes”. Handbook of Fuel Cells: Fuel Cell Technology and Applications. Edited by Wolf Vielstich, Arnold Lamm, and Hubert A. Gasteiger. Volume 3: Fuel Cell Technology and Applications, Part 1. © 2003 John Wiley & Sons Ltd. pg. 436. xxii Wainright, J. S., Litt, M. H., and Savinell, R. F. pg. 436. xxiii Paddison, S. J. pg. 398-399. xxiv Lin, J. –C., Kunz, H. R., and Fenton, J. M. “Membrane/electrode additives for low-humidification operation.” Handbook of Fuel Cells: Fuel Cell Technology and Applications. Edited by Wolf Vielstich, Arnold Lamm, and Hubert A. Gasteiger. Volume 3: Fuel Cell Technology and Applications, Part 1. © 2003 John Wiley & Sons Ltd. pg. 456. xxv S. Mukerjee and S. Srinivasan. “O2 reduction and structure-related parameters for supported catalysts.” Handbook of Fuel Cells – Fundamentals, Technology and Applications, Edited by Wolf Vielstich, Hubert
88
A. Gasteiger, Arnold Lamm. Volume 2: Electrocatalysis. © 2003 John Wiley & Sons, Ltd. ISBN: 0-471-49926-9. pg. 504. xxvi Kocha, S. S. “Principles of MEA preparation.” Handbook of Fuel Cells: Fuel Cell Technology and Applications. Edited by Wolf Vielstich, Arnold Lamm, and Hubert A. Gasteiger. Volume 3: Fuel Cell Technology and Applications, Part 1. © 2003 John Wiley & Sons Ltd. pg. 538. xxvii Bockris & Srinivasan. Pg. 230-232. xxviii Bockris & Srinivasan. Pg. 230-232. xxix Bockris & Srinivasan. Pg. 289. xxx Fuel Cells. A Symposium held by the Gas and Fuel Division of the American Chemical Society at the 136th National Meeting in Atlantic City, Vol 1. Edited by G. J. Young. Reinhold Publishing Corporation (1960): New York, New York. pg 24. xxxi Vielstich, W. “What is electrocatalysis?” Handbook of Fuel Cells – Fundamentals, Technology and Applications, Edited by Wolf Vielstich, Hubert A. Gasteiger, Arnold Lamm. Volume 2: Electrocatalysis. © 2003 John Wiley & Sons, Ltd. ISBN: 0-471-49926-9. pg. 10. xxxii Bockris & Srinivasan. Pg. 300. xxxiii Bockris & Srinivasan. Pg. 289. xxxiv Bockris & Srinivasan. Pg. 301-304. xxxv Bockris & Srinivasan. Pg. 315-316. xxxvi Bockris & Srinivasan. Pg. 309. xxxvii Bockris & Srinivasan. Pg. 312-314. xxxviii Bockris & Srinivasan. Pg. 317-321. xxxix Bockris & Srinivasan. Pg. 317-321. xl Bockris & Srinivasan. Pg. 317-321. xli C. Sanchez and E. Leiva. “Understanding electrocatalysis: From reaction steps to first-principles calculations.” Handbook of Fuel Cells – Fundamentals, Technology and Applications, Edited by Wolf Vielstich, Hubert A. Gasteiger, Arnold Lamm. Volume 2: Electrocatalysis. © 2003 John Wiley & Sons, Ltd. ISBN: 0-471-49926-9. pg. 30. xlii Vielstich, W. pg. 3. xliii Bockris & Srinivasan. Pg. 292. xliv Bockris & Srinivasan. pg. 412. xlv Bockris & Srinivasan. pg. 415. xlvi Bockris & Srinivasan. pg. 417. xlvii C. Sanchez and E. Leiva. “Catalysis by UPD metals.” Handbook of Fuel Cells – Fundamentals, Technology and Applications, Edited by Wolf Vielstich, Hubert A. Gasteiger, Arnold Lamm. Volume 2: Electrocatalysis. © 2003 John Wiley & Sons, Ltd. ISBN: 0-471-49926-9. pg. 59. xlviiiGasteiger, H. A., Gu, W., Makharia, R., Mathias, M. F., and Sompalli, B. “Beginning-of-life MEA performance – Efficiency loss contributions.” Handbook of Fuel Cells: Fuel Cell Technology and Applications. Edited by Wolf Vielstich, Arnold Lamm, and Hubert A. Gasteiger. Volume 3: Fuel Cell Technology and Applications, Part 1. © 2003 John Wiley & Sons Ltd. pg. 596-608. xlix Gattrell, M. and MacDougall, B. “Reaction mechanisms of the O2 reduction/evolution reaction.” Handbook of Fuel Cells – Fundamentals, Technology and Applications, Edited by Wolf Vielstich, Hubert A. Gasteiger, Arnold Lamm. Volume 2: Electrocatalysis. © 2003 John Wiley & Sons, Ltd. ISBN: 0-471-49926-9. pg. 444-445. l Bockris & Srinivasan. Pg. 137-139. liThompsett, D. “Pt alloys as oxygen reduction catalysts.” Handbook of Fuel Cells: Fuel Cell Technology and Applications. Edited by Wolf Vielstich, Arnold Lamm, and Hubert A. Gasteiger. Volume 3: Fuel Cell Technology and Applications, Part 1. © 2003 John Wiley & Sons Ltd. pg. 468. lii Mukerjee and S. Srinivasan. “O2 reduction and structure-related parameters for supported catalysts.” Pg. 506. liii Xiong, L. and Manthiram, A. “Effect of Atomic Ordering on the Catalytic Activity of Carbon Supported PtM (M = Fe, Co, Ni, and Cu) Alloys fro Oxygen Reduction in PEMFCs.” J. Electrochemical Society, 2005, vol. 152, no. 4, p. A697-A703. liv Lima, Fabio H. B., Giz, M. Janete and Ticianelli, Edson A.. J. Braz. Chem. Soc., May/June 2005, vol. 16, no. 3a, p. 328-336. ISSN 0103-5053. lv C. Sanchez and E. Leiva. “Catalysis by UPD metals.” Pg. 59.

89
lvi T. E. Mallouk and E. S. Smotkin. “Combinatorial catalyst development methods.” Handbook of Fuel Cells – Fundamentals, Technology and Applications, Edited by Wolf Vielstich, Hubert A. Gasteiger, Arnold Lamm. Volume 2: Electrocatalysis. © 2003 John Wiley & Sons, Ltd. ISBN: 0-471-49926-9. pg. Pg. 341. lvii Lima, Fabio H. B., Giz, M. Janete and Ticianelli, Edson A. lviii Bockris & Srinivasan. pg. 330-332. lix Bockris & Srinivasan. pg. 330. lx E. Leiva and C. Sanchez. “Theoretical aspects of some prototypical fuel cell reactions.” Handbook of Fuel Cells – Fundamentals, Technology and Applications, Edited by Wolf Vielstich, Hubert A. Gasteiger, Arnold Lamm. Volume 2: Electrocatalysis. © 2003 John Wiley & Sons, Ltd. ISBN: 0-471-49926-9. pg. 128. lxi Bockris & Srinivasan. pg. 332. lxii M. Gattrell and B. MacDougall. “Reaction mechanisms of the O2 reduction/evolution reaction.” pg. 456. lxiii U. A. Paulus, T. J. Schmidt and H. A. Gasteiger. “Poisons for the O2 reduction reaction”. Handbook of Fuel Cells – Fundamentals, Technology and Applications, Edited by Wolf Vielstich, Hubert A. Gasteiger, Arnold Lamm. Volume 2: Electrocatalysis. © 2003 John Wiley & Sons, Ltd. ISBN: 0-471-49926-9. pg. 555. lxiv M. Gattrell and B. MacDougall. “Reaction mechanisms of the O2 reduction/evolution reaction.” pg. 479. lxv MITS Pro Help. lxvi Hamnett, A. “The components of an electrochemical cell.” pg. 6. lxvii Bockris & Srinivasan. Pg. 197. lxviiiBarbir, Frano. lxix Barbir, Frano. lxx Barbir, Frano. lxxi Barbir, Frano. lxxii Bockris & Srinivasan. Pg. 325.