Embed Size (px)
Citation preview

Journal of Corporate Finance, Vol.14, No.1, February 2008, Pp.51-72
The determinants of board size and composition: Evidence from
the UK
Abstract
This paper examines the trends and determinants of board structure for a large sample of UK
firms from 1981 to 2002. We extend the predominantly US based literature in a number of
important ways. Firstly, a comparative analysis of the UK and US legal and institutional settings
leads us to hypothesize that UK boards will play a weaker monitoring role and hence board
structures will not be determined by monitoring related factors. Our evidence supports this
conjecture, showing that board structure determinants differ in predictable ways across different
institutional settings. Secondly, in contrast to recent US mandatory reforms, UK reforms have
been voluntary. As such they provide an interesting comparison, being arguably more effective
than a mandatory approach by allowing firms to choose board structures most appropriate for
their own needs. Our results support this point of view. Although the UK reforms do have a
significant impact on board structures, a large number of firms choose not to comply, and those
that do appear to do so for strong economic reasons. The reforms also appear to reduce the
ability of well performing CEOs to influence board structures.
JEL classification: G32, G34
Keywords: Board size; Board composition; UK; US; Corporate governance; Cadbury; Hampel

1
1. Introduction
Boards of directors play a central and fundamentally important role in the corporate
governance of publicly listed companies, and therefore understanding the determinants of board
structure is an important research question. Recently, our understanding has increased following
theoretical (e.g., Raheja, 2005; Adams and Ferreira, 2007; Harris and Raviv, 2006) and
empirical work (e.g., Coles et al., 2006; Boone et al., 2007; Lehn et al., 2003; Linck et al.,
2007a; Linck et al., 2007b). The latter (reviewed in Section 2 below) has examined board
structure in terms of long term trends, firm specific determinants, and regulatory impacts.
Despite these recent advances, theoretical papers have mostly been grounded in a US setting
(for an exception, see Adams and Ferreira (2007)) and empirical studies have focused mainly on
US firms. The few non-US empirical studies employ either relatively small or cross-sectional
samples. We consequently have little knowledge of how trends and determinants of board
structure differ in countries with different legal, institutional and regulatory systems. However,
board functions and their effectiveness may differ according to these characteristics, and so
consequently may the trends and determinants of board structure. Examination of other countries
is therefore useful in developing a broader view of what determines board structure. This paper
contributes to the US based literature by examining the trends and determinants of board
structure for a large sample of UK firms over a long time period (1981-2002).
The UK provides a particularly interesting setting for this purpose. The US and UK
governance systems share many similarities, such as a common law system and high protection
of minority rights (La Porta et al., 1998), and the international comparative governance literature
has tended to combine their features into a single ‘Anglo-American’ market-based system.
However, there are also important differences, including the enforcement of directors’ legal
duties, board structure, the role of institutional investors, and the nature of corporate governance
reforms, which lead us to hypothesize that UK boards will play a much weaker monitoring role.
Hence board structure will not be determined by the costs or benefits of monitoring, and
therefore board structure determinants will differ in a predictable way from US firms. Our
2
evidence supports this prediction. Although we find, consistent with US studies, that board size
and the proportion of outsiders is positively impacted by greater advising needs, and negatively
impacted by CEO influence, we find no evidence that the proportion of outsiders is negatively
related to monitoring costs or positively related to monitoring benefits.
The UK trends in board structure over the sample period provide an interesting comparison
with US trends, allowing us to distinguish between country specific and more general trends,
and thus contribute to the convergence debate regarding whether corporate governance models
(even within the Anglo-American model) are converging (e.g., Gilson, 2001). We find a steady
increase in the number and proportion of outsiders over the sample period, and evidence of a
decline in the number of insiders and overall board size since the late 1980s. Overall, this is
broadly consistent with US trends, and suggests that similar forces are at work in both countries.
Although carried out for similar reasons, UK and US corporate governance regulations differ
markedly. In contrast to the 2002 Sarbanes-Oxley Act (SOA) which is mandatory, UK reforms
have been voluntary and operate on a comply-or-explain basis. Such ‘soft’ regulation is arguably
more effective than a mandated ‘one size fits all’ approach, allowing firms to choose the board
structure most appropriate for their own needs without weakening underlying economic
determinants. Recent calls in the US have argued for a scaling back of SOA towards a less
mandated approach (Romano, 2005). Hence, examination of UK reform permits an interesting
comparison with the impact of SOA. We examine the impact of the key board structure reforms
over the sample period, the Cadbury Report (1992) (which recommended that boards include at
least three outside directors) and the Hampel Report (1998) (which recommended that boards
include at least one third outside directors).1 The Cadbury Report is associated with an increase
in the number and proportion of outsiders, whilst the Hampel Report has no significant impact
on either. The flexibility offered by such regulation appears to be valued by companies, since a
large number of firms do not comply, and many more comply irregularly. Furthermore,
compliance is associated with the normal determinants of board structure. The reforms do not

3
fundamentally change the underlying determinants of board structure, except for the negative
relation between firm performance and outsider proportion which subsequently no longer holds,
possibly reflecting a reduced ability of well performing CEOs to influence board structures.
The paper proceeds as follows: Section 2 reviews the US empirical literature on determinants
and trends in board structure. Section 3 compares the functions of boards of directors in the UK
and US. Section 4 describes the data. Section 5 presents long run board structure trends.
Sections 6 and 7 present the empirical results on the determinants of board structure and the
impact of the corporate governance reforms, respectively. Section 8 concludes.
2. The determinants of board structure: The US evidence
The main findings of the extant US empirical literature on board structure determinants are
reported in Table 1 below. The explanatory variables are related to explanations based on either
efficiency or power. To consider efficiency explanations, studies consider the two main
functions of the board, advising and monitoring (Raheja, 2005; Adams and Ferreira, 2007), and
which firm specific characteristics will result in these functions creating value.
INSERT TABLE 1 HERE
The board’s advisory role is to provide the CEO with advice and access to information and
resources, and is more efficiently carried out by outside directors who can provide important
connections and expertise (Fama and Jensen, 1983). A larger board and proportion of outsiders
can provide greater information and hence both should increase as the requirement for advice
increases. This should occur as firm scale and complexity increases (Lehn et al., 2003). Most
empirical studies find that board size and outsider proportion are positively related to firm size
and complexity, the latter measured by age, leverage, or industrial diversification.
The monitoring role involves ensuring that senior management pursues shareholder interests.
Outsider directors are more likely to be independent and objective in this task than insider
directors, since they wish to signal their competence to other potential employers and frequently
already have monitoring experience (Fama and Jensen, 1983). In contrast, insiders’ are less
1 The Higgs Report (2003), which lies beyond our sample period, subsequently recommended that boards should
4
independent because their careers within the firm are dependent on the CEO (Zajac and
Westphal, 1994). Monitoring is more efficient with a larger board and proportion of outsiders
because of greater shared information (Lehn et al., 2003), although there are eventually
coordination and free rider problems with larger boards (Jensen, 1993; Yermack, 1996). It is
argued that as the benefits (costs) of monitoring increase, boards will do more (less) monitoring
leading to more (less) outsiders and larger (smaller) boards (Raheja, 2005). Monitoring benefits
are high when management can benefit at shareholders expense and monitoring costs are high
when outside directors face high information asymmetry. Table 1 shows that evidence is mixed
on whether board size and outsider proportion are positively related to proxies (cash flow and
industry concentration) for monitoring benefits. Proxies employed for monitoring costs (stock
volatility and firm growth (proxied by high Tobin's Q and R&D)) all have a negative impact on
board size, although only Tobin's Q has a consistently negative impact on outsider proportion.
An alternative theory of board structure is that it is determined by CEO power, whereby more
powerful CEOs bargain with outside directors for a smaller board with fewer outsiders
(Hermalin and Weisbach, 1998). The evidence in Table 1 supports this theory, since the proxies
for CEO influence, past profitability and CEO ownership, both have a negative impact on board
size and the proportion of outsiders.
Recent US empirical studies document notable long term trends in board structure. 1985-
2000 witnessed a decline in board size for large firms and an increase in outsider proportion for
large and median firms (Lehn et al., 2003; Linck et al., 2007a). However, from 2000 onwards,
the period preceding and following SOA, board size and outsider proportion increase for all firm
sizes (Linck et al., 2007a; Linck et al., 2007b). Linck et al., (2007a) find that the link between
CEO ownership and both board size and outsider proportion is no longer negative following
SOA, implying that CEO influence on board structure is diminished by SOA.2
comprise at least one half outside directors.2 It is not clear however that this represents more efficient boards since CEO influence could be a reward forsuperior ability and lead to a value maximising outcome (Hermalin and Weisbach, 1988).

5
3. Will the same factors determine US and UK board structures? A comparison of board
functions and their effectiveness in the US and UK
The prescribed function of boards and outside directors in the UK is very similar to that in the
US. UK boards are of a unitary structure, and, “the responsibilities of the board include setting
the company’s strategic aims, providing the leadership to put them into effect, supervising the
management of the business and reporting to shareholders on their stewardship.” (Cadbury,
1992, p. 14). The role of outside directors is to “support executives in their leadership of the
business and to monitor and supervise their conduct” (Higgs, 2003, p. 28). Specific areas for
monitoring include integrity of financial information, risk management, executive remuneration,
and the appointment and removal of executive directors (Financial Reporting Council, 2006).
However, despite these similarities, there are several reasons why the monitoring function
will be carried out less effectively in the UK. Firstly, whilst under UK company law, directors
have a duty of care and of loyalty (Financial Reporting Council, 2006) as they do in the US,
legal procedural differences mean that whilst law suits against outside directors are frequent in
the US, they are very rare in the UK (Franks et al., 2001; Black et al., 2005).3 Since UK outside
directors are rarely held legally accountable for failing to fulfill their duties, they regard their
role as being primarily that of advising rather than monitoring (e.g., Franks et al., 2001; Ozkan,
2007). Secondly, UK boards have historically consisted of a lower proportion of outside
directors who are less independent from management (e.g., Cosh and Hughes, 1987). Although
the Cadbury (1992) and Hampel (1998) Reports encouraged an increase in the number of
outside independent directors, it is still relatively low and outside director independence is still
weak due to an overly informal appointment process (Higgs, 2003). Further, the UK corporate
governance culture could arguably be perceived as having a lower predisposition to monitoring,
illustrated by substantial resistance to the reforms and the Hampel Committee’s claim that past
governance debates had ‘overemphasized’ monitoring (Davies, 2001). Thirdly, the financial
incentives for outside directors to fulfill their functions effectively are relatively lower in the

6
UK. Outside directors own a relatively low number of shares (Cosh and Hughes, 1987) and
outside director pay is also relatively low with insufficient pay being cited as a barrier to non-
executive effectiveness (Higgs, 2003).4 One board characteristic which may offset to some
extent the weaker monitoring of UK boards is the division of the CEO and Chairman roles.
Although the roles were historically combined (as in the US) (Cosh and Hughes, 1997), the
Cadbury Report (1992) recommended their division and this now occurs in 90% of UK firms in
contrast to only 19% of US firms (Higgs, 2003). Other board characteristics such as board size
and outsider director personal characteristics (age, years with company, number of other
directorships) are similar between the US and UK (Cosh and Hughes, 1987).
The monitoring role played by outside directors will depend on the relative strength of other
substitute governance mechanisms (Agrawal and Knoeber, 1996). Firstly, although both
countries have active markets for corporate control with a relatively high proportion of hostile
takeovers, UK companies have many less takeover defences available to them and consequently
this mechanism should perform a relatively stronger function in the UK (Short and Keasey,
1999). Secondly, whilst dispersed share ownership is the norm in both countries, ownership
concentration is higher in the UK (Short and Keasey, 1999) and is predominated by pension
funds and insurance companies, who arguably exhibit a longer time-frame in their investment
strategies than mutual funds which predominate in the US. British institutional investors have
been encouraged to monitor by both the Cadbury (1992) and Myners (2001) Reports, and appear
to do so by acting collectively (Crespi-Cladera and Renneboog, 2003) and exerting a ‘quiet
diplomacy’ on issues such as strategy, succession, and executive remuneration (Black and
Coffee, 1994; Holland, 1998). In contrast, such behaviour is discouraged by US securities laws,
3 Although the out-of-pocket liability of US outside directors is low, law suits still impose considerable costs(Black et al., 2005).4 Regarding insiders, US CEOs are paid more and have a slightly higher proportion of shares than UK CEOs(Conyon and Murphy, 2000). For the board as a whole, Short and Keasey (1999) report a UK mean boardownership of 12% which is lower than the 21% owned by officers and outside directors reported for the US byLinck et al. (2007a).

7
and US investors do not tend to communicate directly with the CEO. The stronger monitoring
by these other mechanisms in the UK will likely result in lower monitoring by outside directors.5
In summary, UK boards are expected to play a weaker monitoring role than US boards. This
view is supported by UK evidence on the impact of outside directors, with no positive impact on
either general firm performance (see e.g., Vafeas and Theodorou, 1998) or specific monitoring
tasks (Cosh and Hughes, 1997; Franks et al., 2001).6 In contrast, the US empirical literature
(reviewed by Hermalin and Weisbach, 2003) shows outsider proportion to have a positive
impact on specific tasks (although no effect on overall performance). Consequently, in contrast
to US findings, we do not expect board structure to be linked to the costs and benefits of
monitoring. However, we do expect variables associated with advisory needs and CEO influence
to have similar impacts to those for US studies. The small number of existing UK studies, the
key findings of which are reported in Table 1, provide support for this argument.
4. Data
4.1. Sample
The data source for our sample of UK publicly quoted firms is Datastream, from which all
variables are derived. Datastream reports the total number of directors and the number of non-
executive directors. In the UK, non-executive directors are part-time directors, whilst executive
directors are employed full time and are involved in the day to day running of the company in
addition to their director’s duties. Henceforth, we refer to non-executive directors as outside
directors, and to executive directors as inside directors. We focus on two board measures; the
total number of directors (Board size), and the proportion of outsiders (%Outsiders). The latter is
estimated by the number of outside directors divided by the total number of directors. There is
no electronic data source to classify UK directors more finely in terms of independence, or other
board structure variables such as whether the CEO is also chairman.
5 This is illustrated by the events following the Carlton–Granada merger, where institutions removed CEO MichaelGreen and criticized the inaction of outside directors, threatening them with removal (Kirkbride and Letza, 2005).6 However, increasing outside directors post-Cadbury did result in more effective CEO turnover (Dahya et al.,2002), CEO appointments (Dahya and McConnell, 2005), and firm performance (Dahya and McConnell, 2007).

8
Firm reporting on board size and composition is very low until the late 1970s. Coverage then
increases over time, but significantly more slowly for the number of outside directors (and hence
%Outsiders) than board size. Board size observations are available for less than 10% of
Datastream firms in 1978 and 1979, roughly 50% in 1980, and 84% in 1981. In contrast,
observations on the number of outside directors (and hence %Outsiders) increases only
gradually from 7% in 1980 to 86% in 1992.7 We base our empirical analysis on 1981 onwards
since this year marks the start of high Datastream coverage on board size. Table 2 below reports
the number of Datastream firms along with the availability of board size and the number of
outside directors, from 1981 onwards. Over the first ten years of our sample period, there is
consequently incomplete coverage on board composition and a larger sample available to
examine board size. The incomplete coverage on board composition causes potential problems
for the analysis of both trends and determinants, and we address these in subsequent tests below.
INSERT TABLE 2 HERE
For the analysis of board structure trends (Section 5), the samples employed include all the
firm year observations available on each board structure measure, as reported in Columns (2)
and (5) of Table 2. For the analysis of board structure determinants (Section 6), the samples
employed also depend on the availability of other explanatory variables, which we now describe.
4.2. Variable specification
The explanatory variables we use to test the hypotheses about firm size, firm complexity,
private benefits, monitoring costs, and CEO influence described in Section 2 are as follows. Our
measure of firm size, Size, is the logarithm of the market value of equity adjusted for inflation
(deflated using the UK Retail Price Index and expressed in 2002 sterling). To proxy for firm
complexity, we include firm age and financial leverage. Age is the logarithm of the number of
years since the firm is first listed on Datastream. Debt is the sum of long term debt, short term
debt and preference capital, divided by the sum of shareholder funds, long term debt, short term
debt and preference capital. To proxy for monitoring costs we use three variables. Our two
7 Using a logit analysis we find that, prior to 1988, firms which report the number of outsiders are larger, younger,

9
growth measures are Tobin’s Q, which is book value of total assets plus market value of equity
minus book value of equity divided by book value of total assets, and R&D, which is research
and development expenditure (if missing set to zero) divided by sales. Our information
asymmetry measure is STDDEV, which is the standard deviation of monthly stock returns over
the 12 months preceding the financial year end. To proxy for managers’ potential private
benefits we include measures for free cash flow and industry concentration. Free cash flow,
FCF, is cash holdings divided by total assets. Industry concentration, Concentration, is
calculated as the sum of all the squared market shares, where market share for each firm is firm
sales divided by total sales for the industry, and industry is defined using Datastream Level 4
industry groupings. We proxy for CEO influence (based on perceived ability) using operating
performance, ROA, measured as the ratio of operating profit before depreciation and provisions
divided by total assets.8 All variables are winsorized at the 1st and 99th percentiles to remove
influential outliers.
For our main analysis we require the availability of all the above variables. We exclude
financial and real estate firms (Datastream Level 4 Industries 80-89), due to the specific
characteristics of financial ratios in these industries. Firm year observations for which these
variables are available along with board size or board composition are reported in Columns (5)
and (8) of Table 2, respectively. Our final samples consist of unbalanced panel datasets of 2,746
unique firms with 25,668 firm year observations for board size tests and 2,515 unique firms with
19,307 firm year observations for board composition tests.
Table 3 below presents summary statistics for the variables employed. The average (median)
board size is 7.18 (7), whilst the average (median) proportion of outside directors is 0.41 (0.40).
Board size is thus similar to that reported for US studies, whilst the proportion of outsiders is
much smaller. For example, Linck et al. (2007a) report an average of 7.5 for board size and an
average of 0.66 for the proportion of outsiders.
have lower Tobin's Q and cash holdings, and higher return variance and profitability, than non-reporting firms.8 Industrial diversification and board ownership are also potentially important board structure determinants.Because they are only partly available for our sample period, we test for their impacts in additional tests below.

10
INSERT TABLE 3 HERE
5. Long term trends in board structure
In this section we examine long run trends in UK board structure from 1981-2002. For both
board size and composition trends, we use all available firm year observations from Columns (3)
and (6) of Table 2, respectively. Figures 1A, 1B, 1C, and 1D below exhibit the trends in board
size, outsider proportion, number of outsiders, and number of insiders, respectively. Since
Datastream reporting on the number of outsiders (and hence outsider proportion and number of
insiders) expands considerably up to 1988, aggregating all observations into a time series prior
to then is problematic. The sample composition changes are large and firms for which this
measure is reported for the first time have a lower proportion of outsiders, number of outsiders,
and number of insiders than firms for which it is already reported. Therefore to examine trends
prior to 1988, in each year prior to 1988 we sample the firms with the number of outsiders
available, and report their subsequent trend without including any new firms. The faint lines in
Figures 1B, 1C and 1D exhibit trends for such firms sampled in 1981 and 1985.9 In contrast, the
bold lines exhibit trends from 1988 onwards, using all observations.
INSERT FIGURE 1 HERE
Figure 1A shows that average board size increases in the 1980s and then declines in the
1990s, especially after 2000. The negative change in board size over the entire period is
statistically significant, and consistent with the decline in the US, suggesting common factors
may be at work. However, there are differences. Firstly, US board sizes decreased from 1980
onwards. Secondly, the decline in the US is only applicable to large firms (Linck et al., 2007a),
whilst we find a decline for small, medium and large firms.10 Finally, whilst US boards increase
in size immediately preceding and following SOA, there is no evidence of an increase
surrounding either the Cadbury (1992) or Hampel (1998) Reports.
Figure 1B shows that the proportion of outside directors increases steadily over the entire
sample period. The increase is statistically significant, and consistent with US trends (Lehn et
9 Identical results are found when we repeat the analysis using 1982, 1983, 1984, 1986, 1987 and 1988 instead.

11
al., 2003; Linck et al., 2007a). We find a similar increase in outsider proportion for small,
medium and large firms. Outside director representation is clearly increasing many years prior to
the Cadbury (1992) and Hampel (1998) Reports.
Figures 1C and 1D show the average number of outsiders and insiders on the board,
respectively. The number of outsiders increases significantly from 1981 onwards. For firms with
1981 data, there is an increase from 3.10 in 1981 to 4.69 in 2002. Consequently, the proportion
of firms that meet the Cadbury requirement of having at least three outside directors
significantly increases over the period, both prior to 1988 for the smaller samples and from 1988
onwards for all firms (from 44% in 1988 to 70% in 2002). The average number of inside
directors is constant until 1988, then falls from 5 to 3.5 in 2002. These trends help us to
understand board size trends. From 1981-88, the number of outsiders increases whilst insiders
are constant, hence board size increases. From 1988 onwards, the increase in the number of
outsiders is offset by a larger decline in the number of insiders, hence board size declines.
The trends we have documented are based on much longer term and broader sample evidence
than previous UK studies, which have not examined trends prior to the 1990s. Our evidence is
however consistent with the questionnaire evidence of the Bank of England (1983; 1985; 1988),
which shows that outsiders grew in importance in the 1970s and 1980s. These earlier trends can
be traced to pressure from various institutions which emphasized the monitoring role of outside
directors (Bullock, 1977; Department of Trade and Industry, 1977; Institute of Directors, 1982;
Association of British Insurers, 1990). Their recommendations can be seen as forerunners to the
Cadbury and Hampel Reports (Kirkbride and Letza, 2005) and in considering the impact of
these reforms it is clearly important to examine the extent to which any changes are simply
continuations of these previous trends. We return to this issue in Section 7 below.
6. The determinants of board structure: Econometric analysis
In this section we report the results of multivariate regressions which test the determinants of
board structure. Such tests present several econometric problems such as independence of
10 Small, medium, and large firms are those in the lowest, middle three, and highest quintiles of Datastream firms

12
observations, measurement error in the proxy variables and endogeneity (Boone et al., 2007;
Linck et al., 2007a) which our econometric approach and robustness tests attempt to address.
6.1. Econometric approach
Our primary approach is to employ the entire panel dataset described in Table 2, which
allows us to exploit both the cross-section and time series nature of the data. Although panel
data analysis has several significant advantages over cross-sectional analysis, the independence
of the year-to-year firm-level observations is a concern because board structure is relatively
persistent (Hermalin and Weisbach, 1988). To illustrate this, the sample correlation between
board size (%Outsiders) and its one year lag is 0.8839 (0.7696). To control for this serial
correlation, we estimate robust Huber-White standard errors in which observations are clustered
at the firm level. Potential measurement error in the proxy variables can lead to attenuation bias
where reported results are understated, and we therefore follow Boone et al. (2007) and Linck et
al. (2007a) and use multiple proxies for single hypotheses (complexity, monitoring costs and
monitoring benefits), as described in Section 4.2. Endogeneity problems can occur if board
structure and firm specific measures are jointly determined by unobservable factors (unobserved
heterogeneity), or if board structure impacts firm specific measures rather than vice versa. In
order to reduce endogeneity problems we use industry dummy variables (defined with
Datastream Level 4 industry groupings) to control for industry effects (Mulherin, 2005), and
year dummy variables to control for board structure trends. We return to these issues in more
detail below. Our initial regression specifications for board size and composition are as follows:
Boardsize = α + β1 Size + β2 Debt + β3 Age + β4 Tobin’s Q + β5 R&D + β6 STDDEV + β7 FCF
+ β8 Concentration + β9 ROA + IndustryDummies + YearDummies + ε (1)
%Outsiders = α + β1 Size + β2 Debt + β3 Age + β4 Tobin’s Q + β5 R&D + β6 STDDEV + β7
FCF + β8 Concentration + β9 ROA + IndustryDummies + YearDummies + ε (2)
6.2. Key results
ranked annually on market values.

13
The results for Equations (1)-(2) are reported in Columns (1) and (3) of Table 4 below. Firm
size is significantly positive in both regressions, providing strong support for the hypothesis that
larger firms have larger boards and a higher proportion of outside directors. In the board size
regression, firm age is insignificant and debt is significantly positive, whilst in the %Outsiders
regression, both variables are significantly positive. Thus there is strong evidence that more
complex firms have a higher outsider proportion but only mixed evidence that they have larger
boards. Evidence on whether board size is determined by the costs and benefits of monitoring is
mixed. Although Tobin’s Q and STDDEV are significantly negative, R&D is significantly
positive. Similarly, whilst concentration is significantly positive, FCF has a negative impact. As
for outsider proportion, there is no evidence it is related to monitoring costs and benefits.
Tobin’s Q and R&D are insignificant, whilst STDDEV is significantly positive. Similarly, FCF
and concentration are insignificant. Finally, ROA is significantly negative in both regressions,
consistent with the hypothesis that well performing CEOs are able to negotiate a small board
with a low outsider proportion. Overall these results support the hypothesis developed in Section
3 that UK board structures will be determined by advisory needs and CEO influence, but not by
the costs and benefits of monitoring. We now check the robustness of this conclusion.
INSERT TABLE 4 HERE
6.3. Robustness tests
In Equations (1)-(2) we include all proxy variables simultaneously. This is potentially
problematic if the variables are correlated with one another, biasing the estimated coefficients
towards zero. To control for this, we firstly enter the variables for each hypothesis individually
(Boone et al., 2007). This changes the sign and significance of some of the coefficients but our
conclusions remain the same.11 Secondly, we use principal components to transform the proxy
variables for each hypothesis into a single linear combination that accounts for the highest
proportion of their variance, hence capturing their commonality and being better proxies for the
11 In the board size regression; the R&D coefficient is insignificantly negative when included without Tobin’s Qand STDDEV. In the %Outsiders regression; the Age coefficient is insignificant when included without Debt; the

14
underlying information (see e.g., Boone et al., 2007; Linck et al., 2007a). We create three new
proxy variables; Complex is the principal factor for the information contained in Age and Debt,
Monitoring costs for Tobin’s Q, R&D, and STDDEV, and Private benefits for FCF and
Concentration.12 Columns (2) and (4) of Table 4 report the results using these principal
components. Size and complexity are consistently significantly positive. Monitoring costs are
significantly negative for board size but insignificant for outsider proportion. Private benefits are
insignificantly negatively related to board size and outsider proportion. These results are
consistent with and reinforce those in Columns (1) and (3).
To check the robustness of our findings to extreme observations, we employ robust
regression, median regression, and iteratively reweighted least squares regression techniques. In
order to further address concerns about independence of observations we follow Linck et al.,
(2007a) and analyze three sub samples of observations based on every three years (1981,
1984,…2002; 1982,1985,..2000; 1983,1986,..2001). Our results may be biased towards zero
because of a lack of cross-sectional variation prior to 1988 due to low board composition
reporting prior to then, and we therefore recalculate results from 1988 onwards only. The results
using these alternative methods are similar to those in Table 4, and our conclusions unchanged.
Despite controlling for industry and time fixed effects, endogeneity caused by unobserved
heterogeneity at the firm specific level could still be a problem, and we therefore employ a firm
fixed effects model. The results are reported in Table 5 below. The results for board size
(Columns (1)-(2)) are very similar to those in Table 4. The results for %Outsiders (Columns (3)-
(4)), show that the results for monitoring costs, benefits, and ROA are very similar. However,
the results for firm size, age and debt are now of a negative sign and statistically insignificant,
indicating that outsider proportion is not determined by advising requirements. However, it has
been argued (Coles et al., 2006) that a fixed-effects approach will reduce statistical power
because most of the variation in board size and composition arises in the cross section rather
Tobin’s Q coefficient is significantly negative when included without R&D and STDDEV; and the Concentrationcoefficient is insignificantly positive when included without FCF.
15
than the time series. Hence, it is not possible to categorically conclude that the strong cross
sectional relation between outsider proportion and advising requirements is a spurious one.
INSERT TABLE 5 HERE
Another endogeneity problem is that of reverse causality, whereby firm specific explanatory
variables are determined by board structure rather than vice versa. In particular, Yermack (1996)
finds that board size and %Outsiders have negative impacts on Tobin’s Q and ROA, whilst
Cheng (2007) finds that board size has a negative impact on STDDEV. In order to address this,
we follow Yermack (1996) and firstly re-estimate Equations (1)-(2) in an instrumental variables
framework, using lagged values of Tobin’s Q, STDDEV and ROA as instruments for current
values. Secondly, we use up to three year lagged values of Tobin’s Q, STDDEV and ROA
instead of current values. For Equation (1) we employ instruments and lags for Tobin’s Q,
STDDEV and ROA, whilst for Equation (2) we only do so for ROA. The new estimates (not
tabulated) are very similar to the original estimates in Table 4. We conclude that the evidence
supports the argument that past firm specific measures do influence board structure.
A further potential source of bias is that of omitted variables. In particular, previous studies
show that CEO/board ownership and industrial diversification are important board structure
determinants. We test the impact of these variables on sub-samples for which such data is
available. Aggregate board ownership is available on Datastream for the two most recent years.
For the board size (%Outsiders) sample, board ownership is available for 5,034 (4,412) firm
year observations with an average of 15.37% (14.45%) and median of 6.2% (5.2%). From 1988
onwards, Datastream reports the breakdown of firm sales by 3-digit SIC codes. Consistent with
prior studies (e.g., Linck et al., 2007a), we employ the number of reported segments as a proxy
for diversification. For the board size (%Outsiders) sample, the number of segments is available
for 14,894 (13,580) firm year observations, whilst for both samples, the average (median)
number of segments is 1.73 (1). In Table 6 below we report the results of running Models (1)
and (3) from Table 4, including separately board ownership and the number of segments.
12 The Eigen values for each principal component exceed one and therefore have more power than any one of the
16
INSERT TABLE 6 HERE
The coefficient for board ownership is positive and marginally significant in the board size
regression (Column (1)) and significantly negative in the %Outsiders regression (Column (2)).
The former finding is inconsistent with previous findings which find a negative impact, whilst
the latter finding is consistent with previous studies. The impact of the other explanatory
variables on board size are similar to those in Table 4 and hence not affected by the inclusion of
board ownership. However, for the %Outsiders regression, the coefficients for age and debt are
no longer significant. In the case of age, this difference is not driven by the smaller sample
employed because when board ownership is excluded, the coefficient for age is still significantly
positive (although this is not the case for debt). There is therefore evidence that complexity does
not have a positive impact on outsider proportion when board ownership is included.13
Columns (3)-(4) of Table 6 show that the number of segments coefficient is insignificantly
positive in the board size regression, and significantly positive in the %Outsiders regression. The
inclusion of this variable does not change the impact of other explanatory variables, which are
consistent with the regression run on the same sub-sample of firms with number of segments
excluded. We saw above that proxies for complexity are not significant in explaining
%Outsiders with a fixed effects framework or when board ownership is controlled for, and the
inclusion of the number of business segments does not change this conclusion.14
6.4. Summary
In summary, the results in this section strongly support the hypothesis that board size is
determined by advisory needs and CEO influence whilst outsider proportion is determined by
CEO influence. This conclusion is robust to a range of econometric methods. There is also a
strong cross-sectional positive relation between outsider proportion and advisory needs.
However, this is not robust to controlling for unobserved firm specific effects and board
original proxies by itself. The second components have Eigen values of less than one and are therefore excluded.13 A principal components analysis results in the same conclusion. For the %Outsiders regression, the complexfactor is insignificant when board ownership is included, yet significantly positive when ownership is excluded.14 The number of segments is not significant in the %Outsiders regression when firm fixed effects are included.Similarly, it is not significant using OLS when both number of segments and board ownership are included.

17
ownership. Our findings support the hypothesis that UK boards, in contrast to US boards, will
not be determined by monitoring costs and benefits. Our evidence however shows that UK
boards are not randomly structured since the regression models explain up to 45% of their
variation. As such, our results undermine the view that UK boards can be improved by
governance reforms based on uniform rules. We now turn to study the impact of such reforms.
7. The impact of soft regulation on board structure
In the UK since the early 1990s a number of reports (Cadbury, 1992; Greenbury, 1995;
Hampel, 1998; Turnbull, 1999; Myners, 2001; Higgs, 2003) have made recommendations for
best practice in different aspects of corporate governance, which now form part of the Combined
Code on Corporate Governance (Financial Reporting Council, 2006). Listed firms must explain
any non-compliance in their annual reports. The Cadbury (1992) and Hampel (1998) reports are
those over our sample period most relevant for board structure.15 A key recommendation of
Cadbury (published in December 2002, implemented on 30/06/1993) was that boards should
include at least three outsiders. A key recommendation of Hampel (published in January 1998,
implemented on 31/12/1998) was that boards should comprise at least one third outsiders.
The UK voluntary approach allows boards to be structured according to their own specific
requirements, an approach supported by the evidence presented thus far. However, comply-or-
explain will only achieve greater flexibility when investors are capable of evaluating non-
compliance explanations (Filatochev et al., 2007). For example, Tafara (2007) argues that the
mandatory approach is more appropriate for the US because of its relatively less sophisticated
shareholder base consisting of a high proportion of retail investors. Given the prescriptive nature
of the Combined Code, and the fact that it provides very limited guidelines for investors to
interpret non-compliance, it remains to be seen whether companies will diverge from its
recommendations and whether underlying board structure determinants will change.
7.1. Compliance levels before and after the reforms
15 Greenbury (1995) focused on executive pay, Turnbull (1999) on internal control, and Myners (2001) oninstitutional investors.
18
Table 7 below reports compliance levels before and after the Cadbury and Hampel reforms.
Panel A categorizes firms according to whether in the financial year prior to Cadbury
implementation (30/06/1993), they have three outsiders, and by whether, following this date for
all remaining firm observations, the firm always has, never has, or irregularly has, three
outsiders. In Panel B, firms are categorized according to whether in the financial year prior to
Hampel implementation (31/12/1998), they have at least one third outsiders, and by whether,
following this date for all remaining firm observations, the firm always has, never has, or
irregularly has, at least one third outsiders. In both panels and subsequent analysis, only firms
with observations available both before and after the implementation dates are included to
maintain sample composition pre- and post-reform (1,063 for Cadbury, 1,155 for Hampel).
INSERT TABLE 7 HERE
A number of important points can be discerned from Table 7. Firstly, 46% of firms are not in
compliance with Cadbury beforehand, whilst only 18% of firms are not in compliance with
Hampel beforehand. Therefore the Cadbury recommendation has more potential to impact board
structures.16 Although a number of these non-complying firms have complied at some point
previously (132 prior to Cadbury, 88 prior to Hampel) the majority has not (359 prior to
Cadbury, 118 prior to Hampel). Secondly, following the reforms, a large proportion of firms
either never comply (15% following Cadbury, 6% following Hampel) or comply irregularly
(44% following Cadbury, 16% following Hampel).17 Therefore many firms do not appear overly
concerned about compliance, and make use of the flexibility that the regulation offers.
Although there is significant non-compliance, the proportion of firms in compliance, either
on a continual or irregular basis, is higher following both reforms. For example, of the 359 (118)
firms never in compliance prior to Cadbury (Hampel), only 140 (58) are never in compliance
afterwards. The increase in the proportion of firms complying is statistically significant. Sign
tests for differences in the proportion of firms in compliance in the year before and after the
16 This clearly follows from the average sample board size of seven, since one third of seven is less than three, andtherefore compliance with Cadbury implies automatic compliance with Hampel for an average firm.

19
reforms (54% to 59% for Cadbury; 82% to 85% for Hampel) are significant at the one percent
level. However these tests do not take account of the long term trends (reported in Figure 1
above) or other determinants of board structure that may be changing over time.
7.2. The impact of the reforms on board structure
To examine the impact of the reforms more rigorously, we employ a change model where the
annual change in board structure (board size, percentage of outsiders, number of outsiders, and
number of insiders) is the dependent variable. By modelling changes in board structure rather
than levels, we control for the long term trends shown in Figure 1. Our explanatory variables
include dummy variables for the year prior to and the five years following the Cadbury and
Hampel implementation dates. Firms are included if data is available both before and after the
specific reform, and a maximum of five years data either side of the reforms is employed.18
Years -5 to -2 prior to the reforms act as the base years against which to compare the dummy
variables. Control variables are industry dummy variables and changes in all the firm specific
variables employed above (coefficients not reported). The results are shown in Table 8 below.19
INSERT TABLE 8 HERE
Panel A reveals a significantly large increase in board size, and the number and proportion of
outside directors in the year prior to Cadbury. Although the impact occurs before Cadbury we
are confident in attributing it to Cadbury because the recommendations were made public and
received widespread support one year prior to implementation (Cadbury, 1992). We find no
significant impact of Cadbury on the number of insiders, and hence no evidence that Cadbury
resulted in firms removing executives to make way for non-executives. Panel B shows that
Hampel has only an insignificantly positive impact on the number of outsiders (year +1). There
is also evidence of a marginally significant (10 percent level) increase in the number of insiders,
17 Those complying irregularly do not appear to be simply complying with a lag. For example, for 368 of the 644firms that comply irregularly following both reforms, we observe compliance followed by non-compliance.18 The first year included is hence 1988, for which board composition data is widely available (see discussion inSection 4.1), ensuring that changing sample composition does not bias the results.19 R-square is low for all regressions in Table 8. Hence our explanatory variables explain much less of the variationin board structure changes than they do the variation in board structure levels. Previous studies examining boardstructure changes also report comparable low r-squares (see e.g., Yermack, 1996, Table 3, Column 4).

20
for which there does not appear any obvious explanation.20 The increase in the number of both
outsiders and insiders results in a significant increase in board size in the year following
Hampel. The impact on outsider proportion is insignificantly positive.21, 22
7.3. The determinants of compliance
The evidence presented so far suggests that different board structures are optimal for different
firms, and that the reforms had a significant impact on board structure. If firms treat the
compliance decision as a ‘box ticking’ exercise to avoid the costs of non-compliance (i.e., the
time spent justifying non-compliance), then comply or explain may cause inefficient boards and
worsen corporate performance. We therefore examine whether the compliance decision is due to
the normal economic determinants, or whether it is arbitrary. We compare those firms that go
from not being in compliance to always being in compliance (Column (4) in Table 7), with those
firms that are not in compliance beforehand and are never in compliance afterwards (Column (5)
in Table 7). The former appear the most likely to have complied because of non-economic
determinants, and hence provide the cleanest test. We employ a logit model, in which the
dependent variable is set equal to one for the former group and equal to zero for the latter group.
We restrict the analysis to post-reform years. The results are shown in Table 9 below.
INSERT TABLE 9 HERE
Compared to non-adopting firms, complying firms are significantly larger, more leveraged,
and have lower profitability (although the latter is not significant for Hampel). The impact of
monitoring costs is not consistent, having a significantly negative impact on Cadbury
compliance but a significantly positive impact on Hampel compliance. This is consistent with
our general finding that total number of directors (outsiders or insiders) is negatively related to
20 The positive impact of Hampel on the number of insiders is not inconsistent with the negative trend in Figure 1.The dependent variable is the change in the number of insiders, and hence estimates whether the change (whichcould be positive or negative) is greater or less than the change prior to the reforms. For example, in the case of thenumber of insiders, this could decline significantly in each year, but the change could be significantly less negativein the year following Hampel and in which case the explanatory variable for year+1 would be significantly positive.21 Although Hampel has a greater impact on the number of insiders compared to outsiders, it does not follow thatboard independence will be reduced. This is because the number of outsiders is lower than the number of insiders.For example, if both outsiders and insiders increase by an equal number, there will be a positive (not neutral) impacton the proportion of outsiders.

21
monitoring costs whilst outsider proportion is not. Monitoring benefits are not significantly
related to compliance with either reform. Overall, this evidence suggests that compliance is not
arbitrary but instead related to the same economic determinants that determine outside director
representation in general.23 Our findings are consistent with previous findings (Young, 2000;
Peasnell et al., 2003; Hillier and McColgan, 2006; Lasfer, 2006; Dahya and McConnell, 2007)
that Cadbury complying firms are larger, have lower board ownership, and lower profitability.
7.4. The impact of the reforms on board structure determinants
We now examine whether the reforms alter the fundamental economic determinants of board
structures, by interacting each explanatory variable with a dummy variable set equal to one for
all years post-Cadbury, zero for all years prior. The results are displayed in Table 10 below.24
INSERT TABLE 10 HERE
In the board size regressions (Columns (1)-(2)), the coefficient for the interactive Size*post-
Cadbury variable is significantly negative, indicating that the relationship between firm size and
board size is significantly weaker following Cadbury. An F-test shows that the underlying
positive relation is weakened but not fundamentally changed (by rejecting the hypothesis that
the sum of the coefficients on firm size and its interaction term with the post-Cadbury dummy
equal zero). Similarly, the significantly negative relation between Tobin’s Q and board size is
weakened after Cadbury, but an F-test shows that the negative relation still holds post-Cadbury.
Furthermore, the principal component analysis in Column (2) shows no evidence that the
relation between monitoring costs and board size significantly changes following Cadbury.
In the %Outsiders regressions (Columns (3)-(4)), there is some evidence that the positive
relation between outsider proportion and firm size is strengthened post Cadbury (Column (3)),
but this does not hold in the principal components regression (Column (4)). The positive relation
22 We run the same models using changes in whether the firm is in compliance or not with the particular reform.We find a significant increase in the number of firms in compliance with Cadbury (in the year prior), but nosignificant increase in the number of firms in compliance with Hampel.23 We investigate the difference between firms always complying (Column (4), Table 7) with those complyingirregularly (Column (6), Table 7). They are generally of the same sign as in Table 9, but of lower magnitude andsignificance, suggesting that the extent of within-firm compliance is also determined by efficiency considerations.24 As in Section 7.2, only data from 1988 onwards is included here to ensure that changing sample composition(due to increasing board composition coverage prior to this date) does not bias the results.

22
between outsider proportion and complexity is also strengthened, suggesting that complex firms
are more likely to use outside directors than was the case prior to Cadbury. Despite the emphasis
placed on monitoring by the reforms, the relation between outsider proportion and monitoring
costs (or benefits) does not change. However, the relation between %Outsiders and profitability
is significantly less negative following Cadbury, and an F-test does not reject the hypothesis that
the sum of the coefficients on profitability and its interaction term with the post-Cadbury
dummy equal zero. Therefore in the post-Cadbury period there is no longer a significant relation
between profitability and board composition, suggesting that well performing CEOs have less
influence to structure boards. This is consistent with a key objective of Cadbury to reduce the
control of powerful CEOs and with US findings which show that following SOA, CEO
ownership no longer has a negative impact on outsider proportion (Linck et al., 2007a).
8. Summary and conclusions
Using a large sample of UK firms from 1981 to 2002, we examine the trends and
determinants of board size and composition. The sample employed is the largest and most
comprehensive employed for the UK, giving us confidence in the generalization of our findings,
whilst the long time series allows us to document for the first time the long term trends in UK
board structures.
We argue that the determinants of board structure will depend on the specific function of
boards within a particular country, and analyze UK board structures in the context of the legal
and institutional background. Due to factors such as the weak enforcement of directors’ legal
duties and the strong role of institutional investors, we hypothesize that UK boards will play a
weak monitoring role and hence will not be structured according to the costs or benefits of
monitoring. Our evidence supports this. Although we find, consistent with US studies, that board
size and outsider proportion are positively impacted by greater advising needs and negatively
impacted by CEO influence, outsider proportion is not related to monitoring costs or benefits.
Therefore board structure determinants for UK firms differ in a predictable way from US firms.
23
Consistent with US studies however, we conclude that UK boards are not randomly structured
since the regression models explain a significant amount of their variation.
Over the sample period we document a steady increase in the number and proportion of
outside directors, and a decline in the number of inside directors and board size. These trends are
broadly similar to those in the US and can be traced to pressure from various UK institutions and
governance reforms. Recommendations for greater outside director representation have been
driven by the view that such directors can play an important monitoring role, although the lack
of relation between UK board structures and monitoring costs and benefits provides no support
for this view. The key governance reforms over the period recommended, but did not mandate,
that firms should have at least three outside directors (Cadbury), and one third of outside
directors (Hampel). Both reforms increased board size, whilst Cadbury also increased the
number and proportion of non-executive directors. A significant number of firms either do not
comply or comply irregularly, suggesting that firms value the flexibility offered by soft
regulation. Compliance is not arbitrary, but instead driven by the same economic considerations
that determine board structure in general. The negative relation between performance and
outsider proportion is no longer evident following the reforms, possibly reflecting less
opportunity for well performing CEOs to influence board structures.
In the context of the UK, soft regulation does not therefore appear to interfere with the
efficient structuring of boards, and hence appears strongly preferred to a mandated approach. It
is important to note though that the success of a comply or explain approach depends on investor
sophistication. In its absence, the pressure to comply can be substantial, and force firms with
idiosyncratic board structures into adopting suboptimal ones. Codes of best practice should,
therefore, pay very careful and explicit attention to mitigating factors, many of which have been
clearly documented by the recent research in this area.

24
References
Association of British Insurers (ABI), 1990. The Roles and Duties of Directors. ABI, London.
Adams, R. B., Ferreira, D., 2007. A theory of friendly boards. Journal of Finance 62, 217–250.
Agrawal, A., Knoeber, C.R., 1996. Firm performance and mechanisms to control agency
problems between managers and shareholders. The Journal of Financial and Quantitative
Analysis 31, 377–397.
Arthur, N., 2001. Board composition as the outcome of an internal bargaining process:
Empirical evidence. Journal of Corporate Finance 7, 307–340.
Baker, M., Gompers, P., 2003. The determinants of board structure at the initial public offering.
Journal of Law and Economics 46, 569–598.
Bank of England, 1983. The composition of company boards in 1982. Bank of England
Quarterly Bulletin, March, 66–68.
Bank of England, 1985. The boards of quoted companies. Bank of England Quarterly Bulletin,
June, 233-236.
Bank of England, 1988. Composition of company boards. Bank of England Quarterly Bulletin,
May, 242–245.
Bathala, C., Rao, R.P., 1995. The determinants of board composition: An agency theory
perspective. Managerial and Decision Economics 16, 59–69.
Berry, T.K., Fields, L.P., Wilkins, M.S., 2006. The interaction among multiple governance
mechanisms in young newly public firms. Journal of Corporate Finance 12, 449–466.
Black, B., Cheffins, B., Klausner, M., 2005. Liability risk for outside directors: A cross–border
analysis. European Financial Management 11, 153–171.
Black, B., Coffee, J., 1994. Hail Britannia: Institutional investor behavior under limited
regulation. Michigan Law Review 92, 1997–2087.
Boone, A.L., Field, L.C., Karpoff, J.M., Raheja, C.G., 2007. The determinants of corporate
board size and composition: An empirical analysis. Journal of Financial Economics 85, 66-
101.
Bullock, A., 1977. Report of the Committee of Inquiry on Industrial Democracy. HMSO,
London.
Cadbury, A., 1992. Report of the Committee on the Financial Aspects of Corporate Governance.
Gee Publishing, London.
Cheng, S., 2007. Board size and the variability of corporate performance. Journal of Financial
Economics forthcoming.
Coles, J.L., Daniel, N.D., Naveen, L., 2006. Boards: Does one size fit all? Journal of Financial
Economics forthcoming.

25
Financial Reporting Council (FRC), 2006. Combined Code on Corporate Governance. FRC,
London.
Conyon, M., Murphy, K., 2000. The prince and the pauper? CEO pay in the United States and
United Kingdom. Economic Journal 110, 640–671.
Cosh, A., Hughes, A., 1987. The anatomy of corporate control: Directors, shareholders and
executive remuneration in giant US and UK companies. Cambridge Journal of Economics 11,
285–313.
Cosh, A., Hughes, A., 1997. Executive remuneration, executive dismissal and institutional
shareholdings. International Journal of Industrial Organisation 15, 469–492.
Crespi-Cladera, R., Renneboog, L., 2003. Corporate Monitoring by Shareholder Coalitions in
the UK. ECGI Working Paper no. 12/2003.
Dahya, J., McConnell, J.J., Travlos, N.G., 2002. The Cadbury Committee, corporate
performance, and top management turnover. Journal of Finance 57, 461–483.
Dahya, J., McConnell, J.J., 2005. Outside directors and corporate board decisions. Journal of
Corporate Finance 11, 37–60.
Dahya, J., McConnell, J.J., 2007. Board composition, corporate performance, and the Cadbury
Committee recommendations. Journal of Financial and Quantitative Analysis 42, 535-564.
Davies, P.L., 2001. Board structure in the UK and Germany: Convergence or continuing
divergence? Working Paper London School of Economics and Political Science.
Denis, D.J., Sarin, A., 1999. Ownership and board structures in publicly traded corporations.
Journal of Financial Economics 52, 187–223.
Department of Trade and Industry (DTI), 1977. The Conduct of Company Directors. DTI,
London.
Fama, E., Jensen, M.C., 1983. Separation of ownership and control. Journal of Law and
Economics 26, 301– 326.
Filatotchev, I., Jackson G., Gospel, H., Allcock, D., 2007. Key Drivers of ‘Good’ Corporate
Governance and the appropriateness of UK Policy Responses. DTI, London.
Franks, J., Mayer, C., Renneboog, L., 2001. Who disciplines management in poorly performing
companies? Journal of Financial Intermediation 10, 209–248.
Gilson, R.J., 2001. Globalization of corporate governance: Convergence of form or function.
American Journal of Comparative Corporate Law 49, 329–357.
Greenbury, Sir R., 1995. Directors' Remuneration: Report of a Study Group Chaired by Sir
Richard Greenbury. GEE, London.
Hampel, Sir R., 1998. Committee on Corporate Governance: Final Report. GEE, London.
Harris, M., Raviv, A., 2006. A theory of board control and size. Review of Financial Studies.
Advance Access published on July 20, 2006. doi:10.1093/rfs/hhl030.
26
Hermalin, B.E., Weisbach, M.S., 1988. The determinants of board composition. Rand Journal of
Economics 19, 589–606.
Hermalin, B.E., Weisbach, M.S., 2003. Boards of directors as an endogenously determined
institution: A survey of the economic evidence. Economic Policy Review 9, 7–26.
Hillier, D., McColgan, P., 2006. An analysis of changes in board structure during corporate
governance reforms. European Financial Management 12, 575-607.
Higgs, D., 2003. Review of the Role and Effectiveness of Non–Executive Directors. Department
of Trade and Industry/HMSO, London.
Holland, J., 1998. Influence and intervention by financial institutions in their investee
companies. Corporate Governance 6, 249–264.
Institute of Directors (IOD), 1982. A Code of Practice for the Non-executive Director. IOD,
London.
Jensen, M.C., 1993. The modern industrial revolution, exit, and the failure of internal control
systems. Journal of Finance 48, 831–880.
Kirkbride, J., Letza, S., 2005. Can the non-executive director be an effective gatekeeper? The
possible development of a legal framework of accountability. Corporate Governance 13, 542–
550.
La Porta, R., Lopez–De–Silanes, F., Shleifer, A., Vishny, R.W., 1998. Law and Finance. Journal
of Political Economy 106, 1113–1155.
Lasfer, M.A., 2006. The interrelationship between managerial ownership and board structure.
Journal of Business Finance & Accounting 33, 1006–1033.
Lehn, K., Sukesh, P., Zhao, M., 2003. Determinants of the size and structure of corporate
boards: 1935–2000. Katz Graduate School of Business Working Paper.
Linck, J., Netter, J., Yang, T., 2007a. The determinants of board structure. Journal of Financial
Economics forthcoming.
Linck, J., Netter, J., Yang, T., 2007b. The effects and unintended consequences of the Sarbanes-
Oxley Act, and its era, on the supply and demand for directors. University of Georgia
Working Paper.
Mak, Y.T., Li, Y., 2001. Determinants of corporate ownership and board structure: Evidence
from Singapore. Journal of Corporate Finance 7, 235–256.
Mulherin, H., 2005. Corporations, collective action and corporate governance: One size does not
fit all. Public Choice 124, 179-204.
Myners, P., 2001. Institutional Investment in the United Kingdom: A Review. Report to HM
Treasury.

27
Ozkan, N., 2007. Do corporate governance mechanisms influence CEO compensation? An
empirical investigation of UK Companies. Journal of Multinational Financial Management
forthcoming.
Peasnell, K.V., Pope, P.F., Young, S., 2003. Managerial equity ownership and the demand for
outside directors. European Financial Management 9, 231–250.
Prevost, A.K., Rao, R.P., Hossain, M., 2002. Determinants of board composition in New
Zealand: A simultaneous equations approach. Journal of Empirical Finance 9, 373–397.
Raheja, C.G., 2005. Determinants of board size and composition: A theory of corporate boards.
Journal of Financial and Quantitative Analysis 40, 283–306.
Romano, R., 2005. The Sarbanes–Oxley Act and the making of quack corporate governance.
Yale Law Journal 114, 1521–1612.
Short, H., Keasey, K., 1999. Managerial ownership and the performance of firms: Evidence
from the UK. Journal of Corporate Finance 5, 79–101.
Tafara, E., 2007. Remarks on UK and US approaches to corporate governance. Speech delivered
at the Institute of Chartered Accountants in England and Wales (London, UK) on 09/01/2007
(http://www.sec.gov/news/speech/2007/spch020807et.htm accessed 19/09/2007).
Turnbull, N., 1999. Internal Control: Guidance for Directors on the Combined Code. The
Institute of Chartered Accountants in England and Wales.
Vafeas, N., Theodorou, E., 1998. The relationship between board structure and firm
performance in the UK. British Accounting Review 30, 383-407.
Yermack, D., 1996. Higher market valuation of companies with a small board of directors.
Journal of Financial Economics 40, 185-221.
Young, S., 2000. The increasing use of non–executive directors: Its impact on UK board
structure and governance arrangements. Journal of Business Finance & Accounting 27, 1311–
1142.
Zajac, E.J., Westphal, J.D., 1994. The costs and benefits of managerial incentives and
monitoring in large US corporations: When is more not better? Strategic Management Journal
15, 121-142.

Figure 1A: Board Size
6.00
6.50
7.00
7.50
8.00
1981 1982 1983 1984 1985 1986 1987 1988 1989 1990 1991 1992 1993 1994 1995 1996 1997 1998 1999 2000 2001 2002
Figure 1B: % Outsiders
0.30
0.35
0.40
0.45
0.50
0.55
0.60
1981 1982 1983 1984 1985 1986 1987 1988 1989 1990 1991 1992 1993 1994 1995 1996 1997 1998 1999 2000 2001 2002
Data available in 1981
Data available in 1985
All observations
Fig. 1C: # Outsiders
2.00
3.00
4.00
5.00
6.00
1981 1982 1983 1984 1985 1986 1987 1988 1989 1990 1991 1992 1993 1994 1995 1996 1997 1998 1999 2000 2001 2002
Data available in 1981
Data available in 1985
All observations
Fig. 1D: # Insiders
2.00
3.00
4.00
5.00
6.00
1981 1982 1983 1984 1985 1986 1987 1988 1989 1990 1991 1992 1993 1994 1995 1996 1997 1998 1999 2000 2001 2002
Data available in 1981
Data available in 1985
All observat ions
Fig. 1. Trends in board structure: 1981-2002. Figs. 1A, 1B, 1C, and 1D report the trends in average board size, proportion of outsiders, number of outsiders, and number of insiders,respectively for UK firms during 1981-2002. The bold line in each figure incorporates all firm year observations. For Figs. 1B, 1C, and 1D, this is estimated from 1988 onwards onlybecause of changing sample composition prior to this date. For these figures, earlier trends are exhibited by the fainter lines which represent samples available in earlier years (1981 and1985) for which new firms are not added in subsequent years. For Fig. 1A, the bold line represents 3,227 unique firms. For Figs. 1B, 1C, and 1D the bold line represents 1,739 uniquefirms, the faint line described as “Data available in 1981” represents 182 unique firms, and the faint line described as “Data available in 1985” represents 536 unique firms.

29
Table 1Summary of studies on the determinants of board size and composition
Study Year Timeperiod
Country # uniquefirms
Explanatory variables, theory, and expected impact
Size Age Debt Diversifi-cation
Tobin’s Q R&D Sharereturn
volatility
Freecashflow
Industryconcentr-
ation
ROA CEOholding
Scale Complex Complex Complex Monitorcosts
Monitorcosts
Monitorcosts
Privatebenefits
Privatebenefits
CEOinfluence
CEOinfluence
+ + + + - - - + + - -
Panel A: Determinants of board size
Mak & Li 2001 95 Singapore 147 + + + - (3)
Hillier & McColgan 2006 92 UK 682 + * + + + + - * + (3)
Lasfer 2006 96-97 UK 1,583 + * + * - * - - * (3)
Denis & Sarin 1999 83-92 US 583 + * + * + * + - * (1) - - (3)
Baker & Gompers 2003 78-87 US 1,116 + * + - - -
Lehn et al. 2003 35-00 US 85 + * - *
Boone et al. 2007 88-02 US 1,019 + * - * + * - * - * - - * + - * - *
Coles et al. 2007 92-01 US Notgiven
+ * + * + * + * - - * - * - * - *
Linck et al. 2007a 90-04 US 6,931 + * + * + * + * - * - - * + * - *
Panel B: Determinants of % outsiders
Arthur 2001 1989 Australia 135 + - - * + - * - *
Prevost et al. 2002 91-97 N. Zeald. 105 + - + * - (3)
Mak & Li 2001 95 Singapore 147 - * (3)
Young 2000 91 UK 470 - * - + + - - * (3)
Peasnell et al. 2003 91/95 UK 428 - + + + - - *(3)
Hillier & McColgan 2006 92 UK 682 - + - + * - + - *(3)
Lasfer 2006 96-97 UK 1,583 + * + - - * - *(3)
Bathala & Rao 1995 84-86 US 261 - - * - * (2) - * (3)
Denis & Sarin 1999 83-92 US 583 + * - + * + - * (1) + - * (3)
Baker & Gompers 2003 78-87 US 1,116 + * + + + -
Lehn et al. 2003 35-00 US 85 + * - *
Berry et al. 2006 79-86 US 109 - * - - * + + * - *
Boone et al. 2007 88-02 US 1,019 + + * + * - + - * - - - * - *
Coles et al. 2007 92-01 US Notgiven
+ * + * + * + * - * - * + - - *
Linck et al. 2007a 90-04 US 6,931 + * + * + * + * - * + * - - - *
This table reports the main findings of previous studies that examine the determinants of board size and composition. * denotes statistical significance at the 10% level or better. (1)Industry Tobin's Q not firm Tobin's Q. (2) Variance in earnings not variance in share returns. (3) Board not CEO ownership.

Table 2
Sample description
Year Datastreamtotal firms
Board size sample %Outsiders sample
Board sizeavailable
Board sizecoverage(3)/(2)
Board size andother variables
available
%Outsidersavailable
%Outsiderscoverage(6)/(2)
%Outsiders andother variables
available
(1) (2) (3) (4) (5) (6) (7) (8)
1981 1,383 1,163 0.84 1,021 182 0.13 169
1982 1,396 1,233 0.88 1,052 247 0.18 223
1983 1,416 1,312 0.93 1,107 388 0.27 355
1984 1,440 1,429 0.99 1,200 478 0.33 422
1985 1,438 1,424 0.99 1,189 536 0.37 470
1986 1,440 1,427 0.99 1,176 670 0.47 564
1987 1,464 1,457 1.00 1,175 965 0.66 788
1988 1,496 1,484 0.99 1,204 1,113 0.74 927
1989 1,473 1,468 1.00 1,206 1,068 0.73 891
1990 1,438 1,432 1.00 1,194 1,112 0.77 938
1991 1,388 1,383 1.00 1,187 1,156 0.83 1,006
1992 1,369 1,367 1.00 1,161 1,171 0.86 1,007
1993 1,378 1,374 1.00 1,160 1,247 0.90 1,066
1994 1,453 1,446 1.00 1,173 1,384 0.95 1,128
1995 1,501 1,500 1.00 1,210 1,467 0.98 1,189
1996 1,602 1,594 1.00 1,235 1,564 0.98 1,222
1997 1,661 1,650 0.99 1,265 1,624 0.98 1,256
1998 1,588 1,583 1.00 1,279 1,556 0.98 1,263
1999 1,473 1,469 1.00 1,185 1,446 0.98 1,174
2000 1,449 1,433 0.99 1,099 1,401 0.97 1,083
2001 1,479 1,446 0.98 1,123 1,412 0.95 1,109
2002 1,321 1,301 0.98 1,067 1,275 0.97 1,057
# firm years 32,046 31,375 0.98 25,668 23,462 0.91 19,307
# unique firms 3,227 3,227 1.00 2,746 2,960 0.92 2,515
This table reports the firm year observations for the samples used in the analysis on a year by year basis. Column(2) reports the number of firm year observations for all UK firms in the Datastream database with any financialinformation available. Column (3) reports the number of firm year observations for these firms with board size dataavailable. Board size is the total number of directors on the board. Column (4) is Column (3) divided by Column(2). Column (5) reports the firm year observations for firms with both board size data available and all the financialvariables described in Table 3 below. Firms classified as financial or real estate (Datastream Level 4 Industrygroupings 80-89 inclusive) are excluded from this column. Columns (6)-(8) are identical to Columns (3)-(5) exceptthey report data availability on %Outsiders rather than board size. %Outsiders is the number of outside directorsdivided by Board size.

2
Table 3
Descriptive statistics
Variable # observations Mean Median Standarddeviation
25th percentile 75th percentile
Panel A: Board size sample
Board size 25,668 7.18 7.00 2.62 5.00 8.00
Size 25,668 3.84 3.61 1.99 2.38 5.11
Age 25,668 2.24 2.48 0.98 1.61 3.00
Debt 25,668 0.30 0.27 0.23 0.11 0.42
Tobin’s Q 25,668 1.53 1.22 1.07 0.94 1.70
R&D 25,668 0.01 0.00 0.06 0.00 0.00
STDDEV 25,668 0.11 0.10 0.07 0.07 0.14
FCF 25,668 0.10 0.05 0.14 0.01 0.14
Concentration 25,668 0.13 0.08 0.12 0.07 0.13
ROA 25,668 0.11 0.12 0.12 0.07 0.17
Panel B: %Outsiders sample
%Outsiders 19,307 0.41 0.40 0.16 0.29 0.50
Size 19,307 4.14 3.96 1.97 2.69 5.41
Age 19,307 2.25 2.48 1.03 1.61 3.14
Debt 19,307 0.31 0.28 0.24 0.12 0.43
Tobin’s Q 19,307 1.61 1.29 1.11 1.00 1.78
R&D 19,307 0.02 0.00 0.07 0.00 0.00
STDDEV 19,307 0.12 0.10 0.07 0.07 0.14
FCF 19,307 0.11 0.06 0.14 0.01 0.14
Concentration 19,307 0.13 0.08 0.12 0.07 0.14
ROA 19,307 0.11 0.12 0.12 0.08 0.17
This table reports summary statistics on the variables employed in the analysis. Panel A reports statistics for the25,668 firm year observations (2,746 firms) with board size and all other variables available (Column (5) of Table2). Panel B reports statistics for the 19,307 firm year observations (2,515 firms) with %Outsiders and all othervariables available (Column (8) of Table 2). Board size is the total number of directors on the board. %Outsiders isthe number of outside directors divided by Board size. Size is the logarithm of the market value of equity adjustedfor inflation. Age is the logarithm of the number of years since the firm was first listed on Datastream. Debt is thesum of long term debt, short term debt and preference capital, divided by the sum of shareholder funds, long termdebt, short term debt and preference capital. Tobin’s Q is book value of total assets plus market value of equityminus book value of equity divided by book value of total assets. R&D is research and development expendituredivided by sales. STDDEV is the standard deviation of monthly stock returns over the 12 months preceding thefinancial year end. FCF is cash holdings divided by total assets. Concentration is the sum of all the squared marketshares, where market share for each firm is firm sales divided by total sales for the industry. ROA is the ratio ofoperating profit before depreciation and provisions divided by total assets.

3
Table 4
The determinants of board size and composition
Board size %Outsiders
(1) (2) (3) (4)
Size 0.909 *** 0.880 *** 0.013 *** 0.013 ***
(38.50) (38.49) (8.26) (8.35)
Age -0.002 0.007 ***
(0.06) (2.87)
Debt 0.305 *** 0.031 ***
(2.60) (3.36)
Complex 0.074 *** 0.010 ***
(2.88) (5.04)
Tobin’s Q -0.422 *** -0.003
(14.98) (1.58)
R&D 1.148 *** -0.026
(2.90) (0.69)
STDDEV -0.681 ** 0.077 ***
(2.30) (2.87)
Monitoring costs -0.277 *** -0.001
(10.97) (0.25)
FCF -0.353 0.012
(1.58) (0.65)
Concentration 0.714 * -0.048
(1.86) (1.63)
Private benefits -0.053 -0.001
(1.42) (0.24)
ROA -1.554 *** -2.315 *** -0.069 *** -0.079 ***
(6.68) (9.44) (3.49) (4.13)
Intercept, industry & year dummies Yes Yes Yes Yes
Adjusted R2 0.4593 0.4472 0.1660 0.1647
# observations 25,688 25,688 19,307 19,307
This table reports OLS regressions of Board size and %Outsiders on firm characteristics. Board size is the totalnumber of directors on the board. %Outsiders is the number of outside directors divided by Board size. Size is thelogarithm of the market value of equity adjusted for inflation. Age is the logarithm of the number of years since thefirm was first listed on Datastream. Debt is the sum of long term debt, short term debt and preference capital,divided by the sum of shareholder funds, long term debt, short term debt and preference capital. Tobin’s Q is bookvalue of total assets plus market value of equity minus book value of equity divided by book value of total assets.R&D is research and development expenditure divided by sales. STDDEV is the standard deviation of monthlystock returns over the 12 months preceding the financial year end. FCF is cash holdings divided by total assets.Concentration is the sum of all the squared market shares, where market share for each firm is firm sales divided bytotal sales for the industry. ROA is the ratio of operating profit before depreciation and provisions divided by totalassets. Using principal components analysis, Complex is the principal factor for the information in Age and Debt,Monitoring costs is the principal factor for the information in Tobin’s Q, R&D, and STDDEV, while Privatebenefits is the principal factor for the information in FCF and Concentration. Absolute t-statistics are in parenthesesand are based on robust standard errors in which observations are clustered at the firm level. ***, ** and * denotesignificance at the 1%, 5%, and 10% level, respectively.

4
Table 5
The determinants of board size and composition: Fixed effects analysis
Board size %Outsiders
(1) (2) (3) (4)
Size 0.616 *** 0.545 *** -0.001 -0.002
(20.00) (19.26) (0.31) (0.77)
Age 0.147 *** -0.004
(2.95) (0.90)
Debt 0.305 *** -0.003
(3.01) (0.31)
Complex 0.129 *** -0.002
(4.45) (0.82)
Tobin’s Q -0.319 *** -0.003
(13.98) (1.31)
R&D -0.289 -0.084 **
(0.59) (1.98)
STDDEV -0.252 0.025
(1.32) (1.24)
Monitoring costs -0.238 *** -0.002
(10.86) (1.14)
FCF -0.669 *** 0.026 *
(4.03) (1.68)
Concentration 0.318 -0.061 *
(0.92) (1.94)
Private benefits -0.092 *** 0.000
(3.17) (0.10)
ROA -0.783 *** -1.002 *** -0.041 ** -0.041 **
(4.12) (5.15) (2.06) (2.07)
Intercept & year dummies Yes Yes Yes Yes
Adjusted R2 0.4112 0.3999 0.0883 0.0915
# observations 25,688 25,688 19,307 19,307
This table reports firm fixed effect regressions of Board size and %Outsiders on firm characteristics. Board size isthe total number of directors on the board. %Outsiders is the number of outside directors divided by Board size.Size is the logarithm of the market value of equity adjusted for inflation. Age is the logarithm of the number ofyears since the firm was first listed on Datastream. Debt is the sum of long term debt, short term debt andpreference capital, divided by the sum of shareholder funds, long term debt, short term debt and preference capital.Tobin’s Q is book value of total assets plus market value of equity minus book value of equity divided by bookvalue of total assets. R&D is research and development expenditure divided by sales. STDDEV is the standarddeviation of monthly stock returns over the 12 months preceding the financial year end. FCF is cash holdingsdivided by total assets. Concentration is the sum of all the squared market shares, where market share for each firmis firm sales divided by total sales for the industry. ROA is the ratio of operating profit before depreciation andprovisions divided by total assets. Using principal components analysis, Complex is the principal factor for theinformation in Age and Debt, Monitoring costs is the principal factor for the information in Tobin’s Q, R&D, andSTDDEV, while Private benefits is the principal factor for the information in FCF and Concentration. Absolute t-statistics are in parentheses and are based on robust standard errors. ***, ** and * denote significance at the 1%,5%, and 10% level, respectively.

5
Table 6
The determinants of board size and composition: Impact of board ownership and the number of business segments
Board size %Outsiders Board size %Outsiders
(1) (2) (3) (4)
Size 0.808 *** 0.011 *** 0.754 *** 0.015 ***
(33.20) (5.45) (27.32) (6.60)
Age 0.004 0.003 -0.002 0.005 **
(0.10) (0.87) (0.07) (1.99)
Debt 0.285 ** 0.005 0.114 0.026 **
(2.01) (0.41) (0.87) (2.43)
Tobin’s Q -0.262 *** -0.001 -0.294 *** -0.002
(7.99) (0.30) (9.95) (0.67)
R&D 1.507 *** -0.042 1.421 *** -0.049
(3.41) (0.96) (3.19) (1.11)
STDDEV -0.553 0.116 *** -0.973 *** 0.056 *
(1.33) (2.82) (2.98) (1.88)
FCF -0.744 *** 0.022 -0.442 * 0.005
(3.20) (0.93) (1.77) (0.22)
Concentration 0.074 -0.037 0.217 -0.066 *
(0.14) (0.72) (0.50) (1.74)
ROA -0.891 *** -0.044 * -0.850 *** -0.095 ***
(3.30) (1.73) (3.38) (4.31)
Board ownership 0.003 * -0.001 ***
(1.73) (7.96)
# segments 0.017 0.007 ***
(0.46) (2.61)
Intercept, industry & year dummies Yes Yes Yes Yes
Adjusted R2 0.4278 0.2087 0.3470 0.1478
# observations 5,034 4,412 14,894 13,580
This table reports OLS regressions of Board size and %Outsiders on firm characteristics. Board size is the totalnumber of directors on the board. %Outsiders is the number of outside directors divided by Board size. Size is thelogarithm of the market value of equity adjusted for inflation. Age is the logarithm of the number of years since thefirm was first listed on Datastream. Debt is the sum of long term debt, short term debt and preference capital,divided by the sum of shareholder funds, long term debt, short term debt and preference capital. Tobin’s Q is bookvalue of total assets plus market value of equity minus book value of equity divided by book value of total assets.R&D is research and development expenditure divided by sales. STDDEV is the standard deviation of monthlystock returns over the 12 months preceding the financial year end. FCF is cash holdings divided by total assets.Concentration is the sum of all the squared market shares, where market share for each firm is firm sales divided bytotal sales for the industry. ROA is the ratio of operating profit before depreciation and provisions divided by totalassets. Board ownership is aggregate percentage share ownership of the board. # segments is the number ofcompany 3 digit SIC codes. Absolute t-statistics are in parentheses and are based on robust standard errors in whichobservations are clustered at the firm level. ***, ** and * denote significance at the 1%, 5%, and 10% level,respectively.
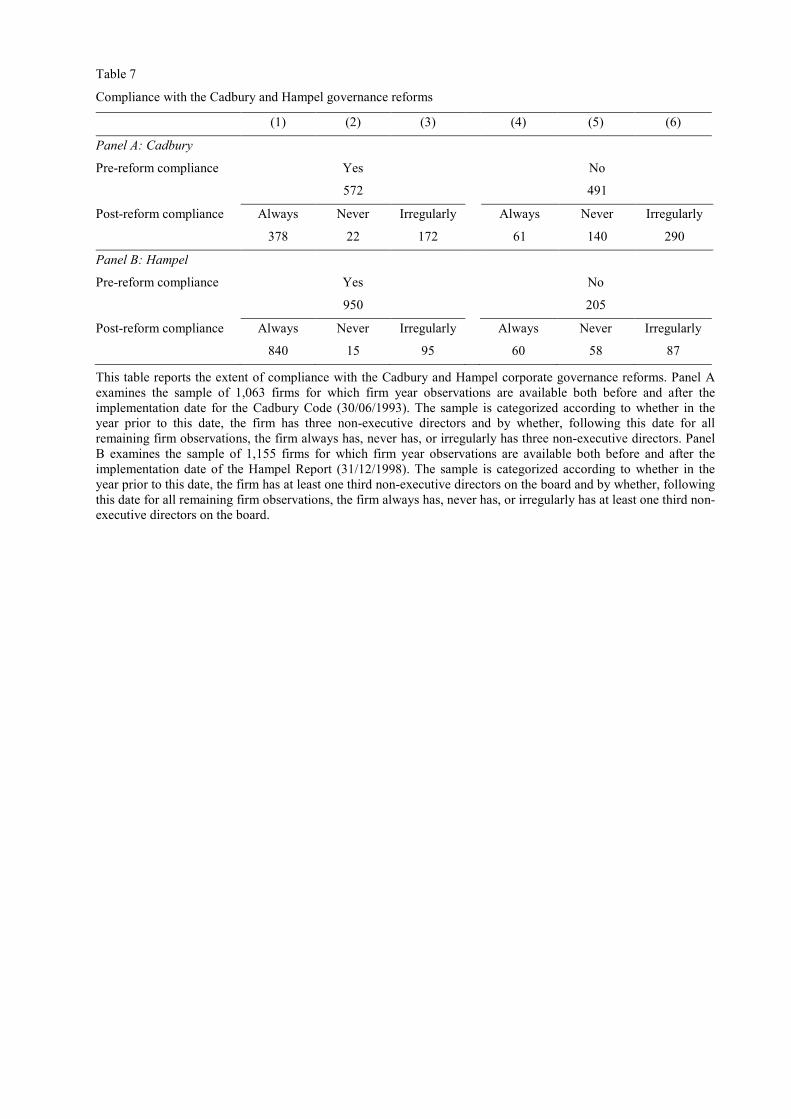
Table 7
Compliance with the Cadbury and Hampel governance reforms
(1) (2) (3) (4) (5) (6)
Panel A: Cadbury
Pre-reform compliance Yes No
572 491
Post-reform compliance Always Never Irregularly Always Never Irregularly
378 22 172 61 140 290
Panel B: Hampel
Pre-reform compliance Yes No
950 205
Post-reform compliance Always Never Irregularly Always Never Irregularly
840 15 95 60 58 87
This table reports the extent of compliance with the Cadbury and Hampel corporate governance reforms. Panel Aexamines the sample of 1,063 firms for which firm year observations are available both before and after theimplementation date for the Cadbury Code (30/06/1993). The sample is categorized according to whether in theyear prior to this date, the firm has three non-executive directors and by whether, following this date for allremaining firm observations, the firm always has, never has, or irregularly has three non-executive directors. PanelB examines the sample of 1,155 firms for which firm year observations are available both before and after theimplementation date of the Hampel Report (31/12/1998). The sample is categorized according to whether in theyear prior to this date, the firm has at least one third non-executive directors on the board and by whether, followingthis date for all remaining firm observations, the firm always has, never has, or irregularly has at least one third non-executive directors on the board.

Table 8
The determinants of board structure: Impact of the Cadbury and Hampel governance reforms
∆Board size ∆%Outsiders ∆#Outsiders ∆#Insiders
(1) (2) (3) (4)
Panel A: Cadbury
Year -1 0.082 * 0.089 ** 0.011 ** -0.004
(1.65) (2.21) (2.22) (0.08)
Year +1 -0.016 -0.019 0.005 0.008
(0.38) (0.51) (1.14) (0.19)
Year +2 -0.026 -0.050 -0.004 0.023
(0.58) (1.35) (0.97) (0.55)
Year +3 0.025 0.034 0.003 0.006
(0.60) (0.93) (0.74) (0.14)
Year +4 0.007 0.023 0.003 -0.007
(0.17) (0.68) (0.69) (0.17)
Year +5 0.010 -0.007 0.001 0.031
(0.22) (0.21) (0.18) (0.76)
Intercept, changes in firmcharacteristics & industry dummies
Yes Yes Yes Yes
Adjusted R2 0.0233 0.0091 0.0037 0.0127
# observations 9,353 8,136 8,136 8,136
Panel B: Hampel
Year -1 0.061 -0.002 0.009 0.058
(1.36) (0.59) (0.29) (1.56)
Year +1 0.086 ** 0.002 0.036 0.057 *
(2.24) (0.61) (1.31) (1.71)
Year +2 -0.068 0.001 -0.019 -0.039
(1.59) (0.20) (0.60) (1.14)
Year +3 -0.060 -0.005 -0.063 ** 0.009
(1.33) (1.33) (1.96) (0.24)
Year +4 -0.029 0.003 0.013 -0.033
(0.66) (0.83) (0.39) (0.90)
Year +5 -0.066 -0.010 * -0.082 * 0.025
(0.97) (1.76) (1.68) (0.45)
Intercept, changes in firmcharacteristics & industry dummies
Yes Yes Yes Yes
Adjusted R2 0.0390 0.0066 0.0166 0.0214
# observations 8,539 8,349 8,349 8,349
This table reports OLS regressions of annual changes in Board size, %Outsiders, #Outsiders, and #Insiders on eventyears surrounding the Cadbury and Hampel Reforms, and changes in firm characteristics and industry dummyvariables. For both panels, firms are included if data is available both before and after the specific reform, and amaximum of five years data either side of the reforms is employed. Board size is the total number of directors onthe board. %Outsiders is the number of outside directors divided by Board size. #Outsiders is the number of outsidedirectors on the board. #Insiders is the number of insiders on the board. Firm characteristics include the following.Size is the logarithm of the market value of equity adjusted for inflation. Age is the logarithm of the number ofyears since the firm was first listed on Datastream. Debt is the sum of long term debt, short term debt andpreference capital, divided by the sum of shareholder funds, long term debt, short term debt and preference capital.Tobin’s Q is book value of total assets plus market value of equity minus book value of equity divided by bookvalue of total assets. R&D is research and development expenditure divided by sales. STDDEV is the standarddeviation of monthly stock returns over the 12 months preceding the financial year end. FCF is cash holdingsdivided by total assets. Concentration is the sum of all the squared market shares, where market share for each firmis firm sales divided by total sales for the industry. ROA is the ratio of operating profit before depreciation andprovisions divided by total assets. Absolute t-statistics are in parentheses and are based on robust standard errors inwhich observations are clustered at the firm level. ***, ** and * denote significance at the 1%, 5%, and 10% level,respectively.

8
Table 9
The determinants of compliance with the Cadbury and Hampel governance reforms
Cadbury compliance Hampel compliance
(1) (2) (3) (4)
Size 1.087 *** 0.993 *** 0.453 ** 0.287 *
(5.68) (5.61) (2.46) (1.90)
Age 0.175 -0.315
(0.42) (0.96)
Debt 1.928 ** 3.678 ***
(2.38) (3.43)
Complex 0.684 *** 0.693 ***
(2.91) (2.95)
Tobin’s Q -0.591 ** 0.109
(2.16) (0.53)
R&D -16.640 -1.206
(1.16) (0.41)
STDDEV -2.387 7.415 ***
(1.17) (2.59)
Monitoring costs -0.803 *** 0.308 **
(3.37) (2.16)
FCF -1.251 1.362
(0.74) (0.83)
Concentration 3.687 4.373
(1.41) (0.67)
Private benefits -0.131 0.018
(0.48) (0.06)
ROA -6.068 ** -5.684 ** -1.910 -2.133
(2.32) (2.22) (0.98) (1.31)
Intercept, industry & year dummies Yes Yes Yes Yes
Pseudo R2 0.4026 0.3924 0.2735 0.1957
# observations 1,143 1,143 363 363
This table reports logit regressions of compliance with corporate governance reforms on firm characteristics. InColumns (1)-(2) the sample employed is the 201 firms (Columns (4)-(5), Table 7 Panel A) which prior to Cadburydo not have at least three outside directors, but following Cadbury either always (61) or never have (140) at leastthis number. The dependent variable is equal to one for firms that always comply and zero for firms that nevercomply. Firm year observations after the Cadbury implementation date (30/06/1993) are employed. In Columns (3)-(4) the sample employed is the 118 firms (Columns (4)-(5), Table 7 Panel B) which prior to Hampel do not have atleast one third outside directors, but following Hampel, either always (60) or never have (58) at least thisproportion. The dependent variable is equal to one for firms that always comply and zero for firms that nevercomply. Firm year observations after the Hampel implementation date (31/12/1998) are employed. Size is thelogarithm of the market value of equity adjusted for inflation. Age is the logarithm of the number of years since thefirm was first listed on Datastream. Debt is the sum of long term debt, short term debt and preference capital,divided by the sum of shareholder funds, long term debt, short term debt and preference capital. Tobin’s Q is bookvalue of total assets plus market value of equity minus book value of equity divided by book value of total assets.R&D is research and development expenditure divided by sales. STDDEV is the standard deviation of monthlystock returns over the 12 months preceding the financial year end. FCF is cash holdings divided by total assets.Concentration is the sum of all the squared market shares, where market share for each firm is firm sales divided bytotal sales for the industry. ROA is the ratio of operating profit before depreciation and provisions divided by totalassets. Using principal components analysis, Complex is the principal factor for the information in Age and Debt,Monitoring costs is the principal factor for the information in Tobin’s Q, R&D, and STDDEV, while Privatebenefits is the principal factor for the information in FCF and Concentration. Absolute z-statistics are in parenthesesand are based on robust standard errors in which observations are clustered at the firm level. ***, ** and * denotesignificance at the 1%, 5%, and 10% level, respectively.

9
Table 10
The determinants of board size and composition: Pre- and post-Cadbury
Board size %Outsiders(1) (2) (3) (4)
Size 0.948 *** 0.922 *** 0.008 *** 0.009 ***(25.98) (26.06) (3.53) (4.08)
Age -0.013 0.009 **(0.25) (2.49)
Debt 0.195 0.010(0.87) (0.59)
Complex 0.055 0.008 **(1.12) (2.22)
Tobin’s Q -0.506 *** -0.002(6.84) (0.45)
R&D 1.785 0.072(1.02) (0.65)
STDDEV -0.836 -0.020(1.51) (0.41)
Monitoring costs -0.370 *** -0.003(6.32) (0.55)
FCF -0.446 -0.055 *(0.96) (1.66)
Concentration 0.063 0.032(0.12) (0.71)
Private benefits -0.110 -0.005(1.59) (0.95)
ROA -1.622 *** -2.322 *** -0.155 *** -0.159 ***(3.42) (4.81) (3.50) (3.66)
Post-Cadbury 0.111 0.105 -0.062 *** 0.045 ***(0.45) (0.95) (3.20) (4.65)
Size * post-Cadbury -0.099 *** -0.097 *** 0.004 ** 0.003(3.50) (3.47) (2.09) (1.35)
Age * post-Cadbury -0.065 0.023 ***(0.99) (4.56)
Debt * post-Cadbury 0.259 0.027(1.17) (1.52)
Complex * post-Cadbury 0.024 0.016 ***(0.46) (3.97)
Tobin’s Q * post-Cadbury 0.169 *** 0.002(2.45) (0.29)
R&D * post-Cadbury -1.490 -0.220(0.88) (1.51)
STDDEV * post-Cadbury -0.562 0.225 ***(0.87) (4.02)
Monitoring costs * post-Cadbury 0.073 0.004(1.30) (0.68)
FCF * post-Cadbury 0.025 0.040(0.06) (1.07)
Concentration * post-Cadbury -0.197 0.011(0.48) (0.41)
Private benefits * post-Cadbury 0.004 0.004(0.07) (1.11)
ROA * post-Cadbury 0.055 0.192 0.105 ** 0.093 **(0.10) (0.36) (2.17) (2.01)
Intercept & industry dummies Yes Yes Yes YesAdjusted R2 0.4861 0.4799 0.1540 0.1468# observations 12,861 12,861 12,007 12,007
This table reports OLS regressions of Board size and %Outsiders on firm characteristics, interacted with a Post-Cadbury dummy variable which is set equal to one for financial years after the Cadbury implementation date(30/06/1993), zero otherwise. The sample of firms employed is those for which data is available both before andafter 30/06/1993, and only firm year observations from 1988 onwards are included. Board size is the total numberof directors on the board. %Outsiders is the number of outside directors divided by Board size. Size is the logarithmof the market value of equity adjusted for inflation. Age is the logarithm of the number of years since the firm was

10
first listed on Datastream. Debt is the sum of long term debt, short term debt and preference capital, divided by thesum of shareholder funds, long term debt, short term debt and preference capital. Tobin’s Q is book value of totalassets plus market value of equity minus book value of equity divided by book value of total assets. R&D isresearch and development expenditure divided by sales. STDDEV is the standard deviation of monthly stockreturns over the 12 months preceding the financial year end. FCF is cash holdings divided by total assets.Concentration is the sum of all the squared market shares, where market share for each firm is firm sales divided bytotal sales for the industry. ROA is the ratio of operating profit before depreciation and provisions divided by totalassets. Using principal components analysis, Complex is the principal factor for the information in Age and Debt,Monitoring costs is the principal factor for the information in Tobin’s Q, R&D, and STDDEV, while Privatebenefits is the principal factor for the information in FCF and Concentration. Absolute t-statistics are in parenthesesand are based on robust standard errors in which observations are clustered at the firm level. ***, ** and * denotesignificance at the 1%, 5%, and 10% level, respectively.