Embed Size (px)
Citation preview
DI
SC
US
SI
ON
P
AP
ER
S
ER
IE
S
Forschungsinstitut zur Zukunft der ArbeitInstitute for the Study of Labor
The Determinants of Education-Job Matchamong Canadian University Graduates
IZA DP No. 4513
October 2009
Brahim BoudarbatVictor Chernoff
The Determinants of Education-Job Match
among Canadian University Graduates
Brahim Boudarbat Université de Montréal
and IZA
Victor Chernoff Université de Montréal
Discussion Paper No. 4513 October 2009
IZA
P.O. Box 7240 53072 Bonn
Germany
Phone: +49-228-3894-0 Fax: +49-228-3894-180
E-mail: [email protected]
Any opinions expressed here are those of the author(s) and not those of IZA. Research published in this series may include views on policy, but the institute itself takes no institutional policy positions. The Institute for the Study of Labor (IZA) in Bonn is a local and virtual international research center and a place of communication between science, politics and business. IZA is an independent nonprofit organization supported by Deutsche Post Foundation. The center is associated with the University of Bonn and offers a stimulating research environment through its international network, workshops and conferences, data service, project support, research visits and doctoral program. IZA engages in (i) original and internationally competitive research in all fields of labor economics, (ii) development of policy concepts, and (iii) dissemination of research results and concepts to the interested public. IZA Discussion Papers often represent preliminary work and are circulated to encourage discussion. Citation of such a paper should account for its provisional character. A revised version may be available directly from the author.
IZA Discussion Paper No. 4513 October 2009
ABSTRACT
The Determinants of Education-Job Match among Canadian University Graduates*
This study uses data from the Follow-up of Graduates Survey – Class of 2000, to look at the determinants of education-job match among Canadian university graduates. From a public policy perspective, the question of education-job match is relevant given the substantial investment society puts into its postsecondary institutions, and the role devoted to human capital in economic development. Our results indicate that one graduate out of three (35.1%) is in a job that is not closely related to his or her education. The most important result is that demographic and socioeconomic characteristics (gender and family background) do not significantly affect the match. On the other hand, education characteristics strongly influence match, with field specific programs (such as “Health sciences” and “Education”) having the highest likelihood of obtaining an education-job match. In addition, the level of education (i.e. graduates with a postgraduate degree vs. a bachelor degree), as well as good grades, strongly affect the match. Employment characteristics also affect the match, but to a mixed extent, with certain characteristics, such as industry, as well as working full-time (vs. part time) affecting the match to a strong extent, while others, such as the permanence of employment, as well as the method used to obtain employment, not having a significant effect on match. JEL Classification: J24 Keywords: education-job match, university graduates, Canada,
Follow-up of Graduates Survey Corresponding author: Brahim Boudarbat School of Industrial Relations University of Montreal C.P. 6128, Succursale Centre-ville Montréal (Québec) H3C 3J7 Canada E-mail: [email protected]
* The authors would like to thank Jean-Michel Cousineau and Vincent Rousseau for valuable comments and suggestions. Many thanks go also to Statistics Canada and the Quebec Inter-University Centre for Social Statistics for providing data used in this study, and for technical support.
1
Introduction
Canada has kept up with and even surpassed the already tremendous international growth in
postsecondary education that western countries have experienced since World War II. In 2006,
27.9% of Canada’s working age population (25 to 64) had a university degree, certificate, or
diploma, up from 22.6% in 2001, and 12.9% in 1981. The proportion of Canada’s working age
population with college credentials has also increased substantially, going from 17.9% in 2001 to
20.3% in 2006 (Canadian census data). Emery (2004) cites Owram (1996) who attributes Canada’s
expansion in postsecondary education to its increase in white-collar positions between 1950 and
1980, requiring it to have more teachers, civil servants, bankers, and doctors. Roterman (1999)
describes how in the 1950s and 1960s, a strong postwar economy and the relatively scarce number
of university graduates meant that all fields had labour market success. However, as time passed and
economic conditions declined, universities became more heavily scrutinized in terms of how they
were funded, and as a response to this, money was reinvested into more job-specific programs.
From society’s point of view, the initial costs of education are expensive. In 2006, expenditure on
education from public and private sources represented 6.5% of GDP in Canada (OECD, 2009).
Private costs become very high in postsecondary education as they include not only the direct costs
of enrolment and class material, but also indirect costs (foregone earnings). On average, a Canadian
individual spends more than USD 50,000 to acquire a tertiary qualification, that is to say, 46.6% of
total costs (OECD, 2009). Such investment is, however, important to sustain the country’s
development and international competitiveness. Because of globalization and technological
advancements, the nature of work has changed in society. Workers now require a variety of skills to
adapt to the constantly evolving requirements in the new knowledge-based and competitive
economy (Walters, 2004). It is therefore important from a public policy perspective that graduates
use their postsecondary education in their subsequent employment.
Most studies to do with the phenomenon of education-job mismatch look at level of education
(Robst 2007a). When working in a position below one’s level of study, skills learnt in formal
education may not be fully used. In the existing literature, over-education is often synonymous with
being over-skilled (Buchel 2001), however some authors argue that measuring education-match in
terms of years of schooling is a poor measure of skills and abilities. For example, Di Pietro and
Urwin (2003) find that in general, level of education was correlated with skill use on the job, but
2
people could be adequately educated in terms of their educational level and still be under-skilled in
their job requirements, and vice-versa.
Vertical mismatch of education (mismatch of level of education and job) is not the only form of
educational mismatch. Another important form of mismatch is horizontal mismatch (i.e. mismatch
of field of study and job). Paying attention to field of study is important because it allows for
analysing different types of skills; education provides not only general human capital, but particular
fields of study provide occupationally specific skills for the job market (Robst 2007a; Van de
Werfhorst 2002). In his study, Walters (2004) cross-tabulates a question about whether employers
requested a specific postsecondary credential for the job, and compares this to whether graduates
used the skills and knowledge they acquired in their postsecondary education on the job. The author
finds that there is a strong connection for occupationally specific disciplines, but not for general
ones.
Education mismatch can have important labour market consequences for the mismatched individual,
employers, and society. For example, Roterman (1999) and Garcia-Espejo and Ibanez (2006) find
that job mismatches are an important cause of job dissatisfaction. Wolbers (2003) finds that
education-job mismatches lead to employee turnover. Wolbers (2003), Robst (2007a), Roterman
(1999), Boudarbat and Montmarquette (2009), as well as Heijke, Meng, and Ris (2003) show a clear
negative effect that education-job mismatch has on wages / job status. Van Smoorenburg and Van
der Velden (2000) show that a proper match between education and employment reduces the need
for further training within the firm.
In addition, because postsecondary institutions are being increasingly evaluated in terms of how
they transfer practical labour market skills to their students (Krahn and Bowlby 1999), they can
benefit from obtaining a more in-depth understanding of how and why individuals are obtaining
employment related to their education. For instance, individual courses or even entire programs may
be modified based on the extent of, and reasons for educational mismatch. A better understanding of
the match graduates of postsecondary institutions have with their subsequent employment can help
society maximize returns on its postsecondary education investments. Redpath (1994) notes that a
society’s economic development depends upon a proper match with its educational system. Garcia-
Espejo and Ibanez (2006) argue that for society at large, a proper job-education match “leads to
3
social benefits, such as productivity increase and welfare, which derive from an efficient use of the
active population’s human capital” (p. 141).
Despite its importance, a preliminary review of the research indicates that a relatively high
percentage of Canadian graduates do not have a job that matches what they studied in school. Barely
over half the graduates of 1995 had jobs closely related to their field of study, two years after
graduation (Boudarbat and Montmarquette 2009). This paper examines the determinants for
obtaining employment that is related to one’s university degree in Canada. This measure of
mismatch encompasses not only the level of study, but also the field of study as well (a relatively
neglected area of research), and will help explain this phenomenon. Data is from the Follow-up of
Graduates survey, class 2000, the most comprehensive and up to date labour market study of
postsecondary graduates in Canada, and represents a selected sample of 9335 Canadian university
graduates.
Brief review of the of education-job match literature
Theory
Witte and Kalleberg (1995) note that there is theoretical importance to the issue of education-job
match, as it brings attention to the understanding of how and why individuals are matched to their
employment, which is a concern of many labour market specialists. Even though in our study we do
not aim to test theoretical aspects of education-job match, we think it is relevant to examine how
some labour market theories would interpret job-education match/mismatch.
In Human capital theory, there are numerous aspects to human capital besides education, such as
experience, training, etc. This theory paints a positive picture of higher education, portraying it as
providing the skills needed to perform complex jobs, making people more productive, thus
sustaining economic growth. People with the most human capital are said to be the most productive,
and thus secure the best jobs and the highest salaries (Allen and De Wert 2007). Educational
mismatch can be viewed as part of an efficient labour market, i.e. a temporary phenomenon to
replace one form of human capital to gain another. Upon acquiring the lacking human capital, a
promotion to a higher position will follow, to more adequately match the level of human capital that
an individual possesses (Chiswick and Miller 2007).
4
On the other hand, Credentialism theory questions whether postsecondary education provides
necessary skills used in employment. In the credentialist viewpoint, skills are by and large acquired
on the job, and employers see education as a predictor of the future productivity and trainability of
employees. Collins (1979) argues that education is more to socialize people in appropriate cultures,
business, sociology, or otherwise. He feels that employers use credentials obtained by graduates as a
form of currency, hiring only those who have the highest degree papers, but these papers have very
little actual worth. Education mismatch by level or field of employment is problematic but might be
expected. If a graduate spends an extra few years earning a particular degree, it might demonstrate
to the employer that the graduate’s intelligence and their abilities to be disciplined and to learn have
presumably already been demonstrated in school. The employer might therefore hire this graduate
ahead of someone without this degree, or with a lower degree, even if it is not necessary to perform
the job itself. However, as the credentialist critique goes, the three years and many tens of thousands
of dollars this investment takes is not worth its subsequent screening advantage to employers.
The Job-matching theory is based on the idea that the labour market is composed of jobs of many
different skill and experience levels, as well as workers of many different skill and experience
levels. The most skilled workers (i.e. the most educated) should occupy the most skilled positions,
and there is a mismatch if either the supply of educated workers or skilled positions surpasses the
other (Sorenson and Kalleberg 1981; Jovanovic 1979). Van de Werfhorst (2002) describes how in
Job-matching theories, education-job match is beneficial for all parties involved. Workers prefer
such a match because they have the opportunity to utilize all of their skills, increasing their feelings
of usefulness, and have more “control over their job” (Sorenson and Kalleberg 1981) which allows
them to command higher salaries. Employers prefer such a match because individuals who are
optimally utilizing their skill sets will maximize productivity for their firm, and will stay longer at
the firm (Jovanovic 1979).
Finally, the Technological change theory is based on the idea that in the modern and advanced
economy, the rate of technology progresses quite rapidly. Workers with seniority within the firm are
therefore likely to have less of an education-job match compared to newer workers, who received a
more recent education, i.e. more relevant to the technology of the day (Chiswick and Miller 2007).
In the same vein, because of differences in the levels of (technological) development of the
countries of origin and destination, immigrants from less-developed countries are less likely to have
5
a technology component to their schooling that is relevant to the labour market in the advanced host
countries. Thusly, immigrants from less-developed countries are more likely to be overeducated
than immigrants from developed countries (Chiswick and Miller 2007).
Applied studies
Most studies on education-job mismatch focus on how level of education affects match. However, a
careful examination of the literature reveals there have been a growing number of articles pertaining
to job mismatch by education degree field, as well as job mismatch by degree generally.
Wolbers 2003; Grayson 2004; Garcia-Espejo and Ibanez 2006; Robst 2007a; Krahn and Bowlby
1999; Storen and Arnesen 2006; and Heijke, Meng and Ris 2003, find that graduates from
occupation-specific programs have a much higher degree of match than those in the more general
programs. This is attributable to the fact that these such programs provide specific skills meant for
the job market (Robst 2007a).
Storen and Arnesen (2006), and Heijke, Meng and Ris (2003) look at how the possession of general
skills affect the match. General skills can either increase or decrease the likelihood of a match,
depending on the field. For example, Storen and Arnesen (2006) find that in general, low levels of
leadership slightly decreases match, which would be consistent, as it lowered job outcomes in
general. Those that see themselves as having strong innovative, professional ability decreases match,
(to the authors’ surprise) while having good language skills decreased the match, which was
attributed to the fact that many “Humanities” graduates had strong language abilities. Heijke, Meng
and Ris (2003) find that having a high level of adaptability decreases match, which is likely
attributable to the fact that those who can adapt might be less inclined to obtain employment in a
field that they studied in school.
Also as far as academic achievements go, the higher the postsecondary educational level, the more
likely the match (Wolbers 2003; Robst 2007a; Krahn and Bowlby 1999). Robst (2007a) also finds
that the more recent the degree, the more likely the match, which might be attributable to the fact
that people most likely took their most recent degree to specifically to find work in the labour
market. Good grades during school also affect the education-job match (Grayson 2004; Garcia-
Espejo and Ibanez 2006; and Storen and Arnesen 2006). This might be attributable to the fact that
6
employers view this as an indicator of ability to excel at the subject-related skills (Grayson 2004).
The education-job match is also found to be associated with some characteristics of the job. For
instance, having a full-time job is associated with an increased match (Wolbers 2003). Having a
permanent job generally is as well (Wolbers 2003; Witte and Kalleberg 1995; Krahn and Bowlby
1999), though this is not always the case, as in some situations having a temporary contract
increases the match (Garcia-Espejo and Ibanez 2006).
There appears to be some discrepancy with firm size, as Witte and Kalleberg (1995) show that for
males, working in a larger firm is negatively associated with education-job match (with no
significant connection for females) whereas Wolbers (2003) finds that in larger firms the match is
generally better. Witte and Kalleberg (1995) as well as Wolbers (2003) hypothesize that a larger
firm might increase the match, because there are more positions available for one to find a position
that matches their skills. Witte and Kalleberg (1995) also alternatively-hypothesize however, that a
large firm might have more room for advancement within the company, so an initial match might be
taken away after promotion opportunities.
Those who found work in Blue-collar positions or lower tier services had less of a match than white-
collar or professional professions (Witte and Kalleberg 1995; Garcia-Espejo 2006; Krahn and
Bowlby 1999). This is likely attributable to the fact that the higher the position, the more likely it
would be to require specific credentials, and thus a postsecondary education.
Obtaining a job through a connection negatively affects the education-job match (Grayson 2004).
This might explain why proper match doesn’t always lead to salary benefits (Allen and De Wert
2007; Allen and Van der Velden 2001). Robst (2007b) shows that the effect of mismatch on wage
depends upon the different reasons for accepting mismatched positions. For example, for men, the
salary penalty ranges from 18% to 29%, when giving reasons such as job location, family
constraints, working conditions, or that no matching jobs were available. A wage premium was
found for men accepting mismatched positions for pay and advancement reasons.
As for demographic factors, there appears to be some contradictions concerning the effects of age,
as Krahn and Bowlby (1999) found that older workers had a slightly higher match over younger
workers, while Robst (2007a), Wolbers (2003), and Witte and Kalleberg (1995) find the opposite.
7
Other demographic results show that people who were never married, as well as handicapped
individuals have less of a match. Whites and Asians have less of a match than Blacks and Hispanics
(Robst 2007a). Galarneau and Morissette (2008) document that a large proportion of immigrants to
Canada with university degrees are in jobs with low educational requirements. The highest rates of
mismatch are observed among immigrants from Southern and Southeast Asia. Jones and Sloane
(2009) also provide evidence that the disabled are significantly more likely to be mismatched in the
labour market. Being female slightly increases the likelihood of match in some studies (Wolbers
2003; Witte and Kalleberg 1995; Robst 2007a), slightly decreases its likelihood in others (Krahn and
Bowlby 1999), and makes no difference in others (Garcia-Espejo and Ibanez 2006; Storen and
Arnesen 2006). This discrepancy is difficult to explain.
People have many reasons for accepting a position outside one’s own degree field, and such
reasoning depends on the individual. Of course, there will always be facilitating and restricting
factors for someone to choose a job that is related to their field of study, but ultimately in a free
society, it is individuals themselves who will choose what job they take. Along these lines, Heijke,
Meng, and Ris (2003) specifically examine the characteristic of motivation, and its effect on match.
They show that the people, who felt it important to use their knowledge and skills on the job, have
the higher match.
Data and analysis
Data
In this paper, we use data from the Follow-up of Graduates Survey – Class of 2000 (2000 FOG).
The National Graduates Survey 2000, conducted in 2002, and its follow-up study, the 2000 FOG,
conducted in 2005, are studies designed to gauge the link between postsecondary education and
career outcomes of graduates two and five years after graduation. These labour market results
include such indicators as salary, satisfaction with employment, and education-job match. It is a vast
reservoir of information on the subject, and was carried out by Statistics Canada, in collaboration
with Human Resources and Skills Development Canada (HRSDC) and thus is reliable and
comprehensive.
The target population of the FOG consists of individuals who obtained or satisfied the requirements
8
for a degree, a diploma or a certificate of postsecondary studies from a public Canadian
postsecondary institution (university, college, trade school) in the reference calendar year. The
survey excludes graduates from private postsecondary educational institutions and those having
completed a continuing education program, unless they received a diploma or a certificate. The
study was collected via computer-assisted telephone, using a set questionnaire, from the period April
27th, 2005 to July 24th, 2005. The overall response rate for the FOG is 68.5%, and has a final
sample size of 34,304. (Follow-up of Graduates Survey - Class of 2000 – User Guide).
For the purpose of our study, we focus only on graduates with a university degree (Bachelor,
Masters, or Doctorate), who were 25-60 at the time of the interview (5 years after graduation), who
held a job during the week preceding the interview, and who did not take any further education since
graduating in 2000. In total, 9335 graduates meet these four criteria.
Methodology
In the FOG study, the information on education-job match is based on response to the following
question: “How closely is the (main) job you held last week related to your certificate, diploma or
degree?” Three choices are given to graduates: 1) Closely related; 2) Somewhat related; 3) Not
related. To focus on the determinants of obtaining a close match, we will use a binary measure, of
whether graduates have a job that is closely related to their degree (value 1), or otherwise (value 0).
Then, we consider a logit model1 to determine the variables that are associated with the close match.
For the potential determinants of (closely) match, we break them down into three general categories:
1) Education characteristics; 2) Employment characteristics; and 3) Demographic characteristics.
We also control for a variety of other characteristics.
1 A probit is also suitable when the dependent variable is dichotomous. However, both models (logit and probit) give
similar results in practice (Greene, 2003).
9
Education characteristics
Education characteristics are among the main determinants of the education-job match. We will
examine four concepts: 1) Field of study; 2) Level of study; 3) Grades; and 4) Recent work/school
experience.
Field of study is interesting to investigate, as there are numerous types of programs that
postsecondary institutions offer. Some forms of education are more vocationally oriented, in the
sense that they provide specific content that graduates would expect to use in the job market. The
2000 FOG break down field of study into ten categories, and are slightly reorganized in our study
(see Table 1). The level of education completed by graduates was seen to be another important
determinant of education-job match in the literature. As mentioned earlier, we focus exclusively on
university-level graduates (Bachelor’s, Master’s, and Doctorate).
Grades are also expected to have a strong positive correlation with education job match and thus are
also looked at in this section. One possible weakness with the way this is collected in the 2000 FOG
data is that it is a self-assessment of grades, i.e. grades compared to others, which can display an
upwards bias. We will keep the responses as they are seen in the FOG survey because this format is
suitable for our purposes; with individuals appearing 1) Top 10% of class grades; 2) Top 10-25% of
class grades; 3) Top 25-50% of class grades; and 4) Below 50% of class grades.
The final variable in this group is major activities before enrolling in the completed program. We
will check whether prior work experience (and thus, information on the labour market) provides an
advantage regarding education-job match.
Employment characteristics
Employment characteristics allow us to see whether some job characteristics are associated with an
education-job match. This variable includes: 1) Method used to obtain employment; 2) Full-time vs.
part-time employment; 3) Permanence of employment; and 4) Industry.
For how job was obtained, we have broken this category down from ten into seven (see Table 1).
Full-time employment is defined as working 30 hours or more per week. For industry, we consider
19 categories, as shown in Table 1.
10
Demographic characteristics
The “Demographics” variable will also provide some relevant insight, as nearly all of the concepts
we chose were explored in the literature. The demographic questions we will be exploring as
independent variables are: 1) Sex; and 2) Family background.
In our study, the family background is based on the level of education obtained by the parents, as
well as the use of a government student loan. We grouped together the highest level achieved
between the parents, as it was assumed that there would be relatively few instances with one parent
with a much a higher level of education than their spouse.
The use of a government student loan in the family background is interesting to consider, because it
is an indicator of family wealth. Indeed, eligibility for a government student loan is only granted if
the parents make less than a certain income; it is thus likely that people would have different job
market considerations if this is required, and therefore it would likely affect the match.
Controls
Several control variables are included in the logistic regression: 1) Province of employment; 2)
Studied full-time vs. part-time; 3) Marital status; 4) Handicap; 5) Member of a visible minority
group; 6) Age; and 7) Immigration status when entering program.
Province of employment was chosen to account for differences between provincial labour markets.
We group together the provinces of Atlantic Canada, and chose to omit the territories. The territories
were excluded from the scope of the survey.
Studied full-time vs. studied part-time would be interesting to control for, because whether a student
devotes their entire effort into education might be different from those who did not, or those who did
a mix of activities. To our knowledge, no study has looked before at this variable in connection with
education-job match.
Handicap was included as a control variable because it allows us to see how being disabled affects
job-education match. Age is listed as age in years at the time of the interview (i.e., in 2005).
Similar to Robst (2007a), we control for racial background because discrimination possibly will play
11
a role in education-job mismatch, and use the concept Member of a visible minority group.
Immigration status when entering program is also interesting to control for, because immigrants
have different labour market outcomes than Canadian citizens, and it will be interesting to see how
being educated in Canada will affect the match. It has been documented that immigrants to Canada
have less favourable labour market results than Canadians, although these results appear to be
present but less severe when their university degree is obtained in Canada (Ferrer, Green, and
Riddell 2004; Alboim, Finnie, and Meng 2005; Gilmore and Le Petit 2008). It would be interesting
to see how this translates to an education-job match when the degree is obtained in Canada when
entering program.
Empirical results
Descriptive statistics
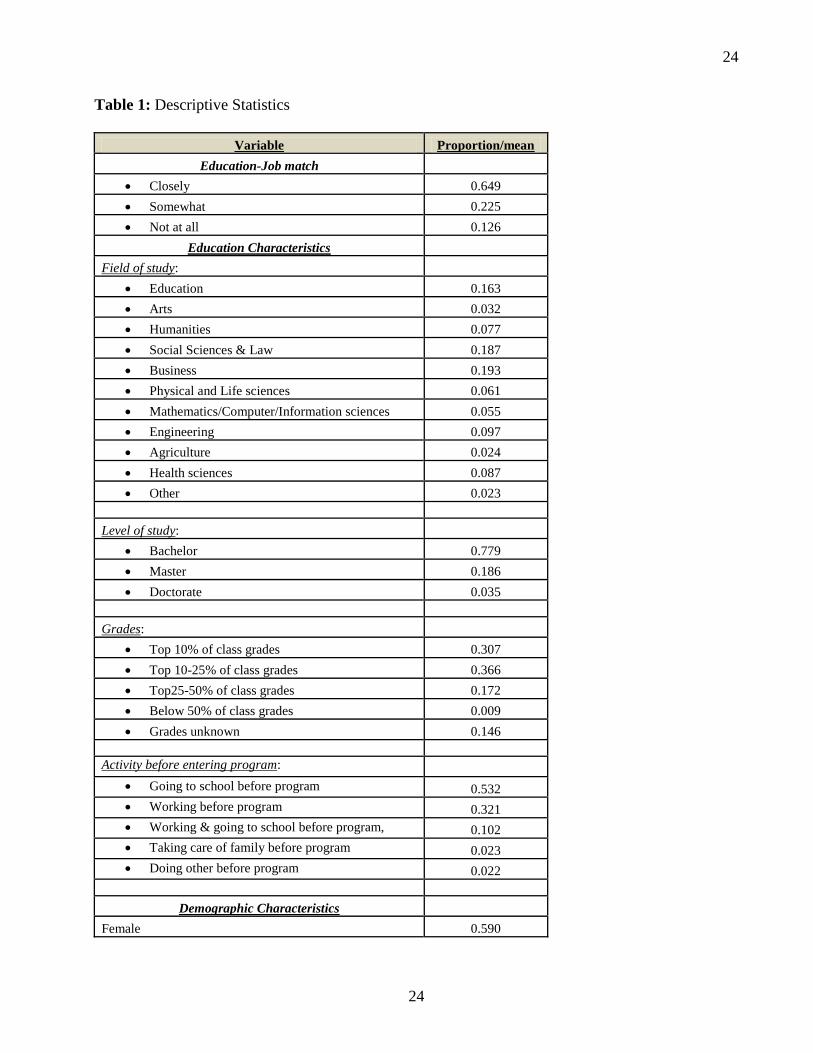
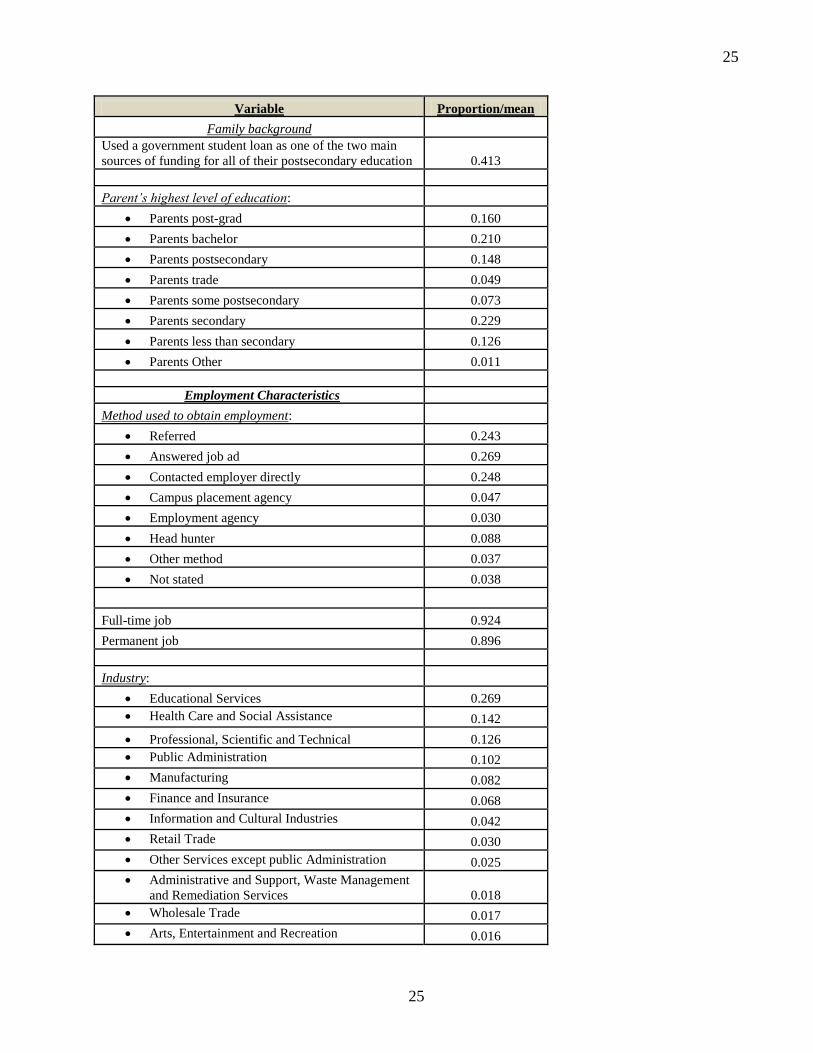
All statistics are presented in Table 1. Overall, 64.9% of graduates said their job closely matched
their education, 22.5% said it was somewhat related, and 12.6% said it was not related at all.
In field of study, as was the case with the previous NGS/FOG studies, it would appear that the so
called “soft science” credentials such as “Business”, “Education”, and “Social Sciences & Law”
were awarded more than “hard science” credentials such as “Engineering”, “Mathematics/
Computer/ Information sciences”, and “Health sciences” (Krahn and Bowlby 1999). “Business”
made up the largest category of graduates in 2000, at 19.3% of the sample, followed by “Education”
(16.3%), and “Social Sciences & Law” (18.7%).
In level of study, almost four out of five graduates in our sample (77.9%) had Bachelor degrees,
18.6% had a Masters degree, and 3.5% had a Doctorate. As for grades, it is quite obvious from the
self-ranking system used in the National survey of graduates that graduates rank themselves
upwards as far as their own grades are concerned. For example, 30.7% of those surveyed felt their
grades were in the top 10% of the class, and more than two thirds of those surveyed, (67.3%) felt
they were somewhere in the top 25% in their class for grades. Only 9% felt they were in the bottom
50% of their class.
As far as the major activity before graduation, more than half the sample (53.2%) listed their major
12
activity before entering their program as going to school, while nearly a third (32.1%) were
working; 10.2% listed a combination of the two. A small percentage (2.3%) listed taking care of
family as their number one activity, and 2.2% said they were doing something else (other) before
entering their university program.
Demographic characteristics allow for seeing what kind of people make up our sample of 2000
university graduates. Females make up 59% of our population. It would appear that Canadian
graduates rely heavily on government support, as 41.3% reported using a government student loan
as one of the two main sources of funding for all of their postsecondary education.
Approximately 37% of graduates had at least one parent holding a university degree, and 64% had a
parent with at least some postsecondary education. Approximately 23% had parents whose highest
level of education was a high school degree, and 12.6% had parents who had not obtained a high
school diploma. Overall, it seems that Canadian graduates have parents who are well-educated. This
is in line with the Drolet (2005) study, which finds that parents’ education stand out as being an
important determinant in the decision to attend university.
As for employment characteristics, in terms of method used to obtain employment, it would appear
that Canadian graduates obtain their jobs through a variety of sources. Approximately one quarter
(24.3%), were referred by a friend or family member, 26.9% answered a job ad, and 24.8%
contacted the employer directly. 8.8% got their job through a head hunter, 4.7% got their job
through their campus, and 3.0% through an employment agency. 3.7% listed another method.
Some additional employment characteristics found in Table 1 are that the vast majority of those in
our sample, 92.4% listed they were working full-time, and 89.6% said they had a permanent job.
Clearly, most graduates were full-time and permanent employees, which would appear to bode well
for the educational system, although it should be noted that unemployed graduates were excluded
from the sample.
By industry, “Educational Services” makes up the largest proportion with 26.9% of graduates
working in this industry, followed by “Health Care and Social Assistance” (14.2%), “Professional,
Scientific and Technical” (12.6%), and “Public Administration” (10.2%). It is apparent that most
2000 graduates do not work in primary sector industries.
13
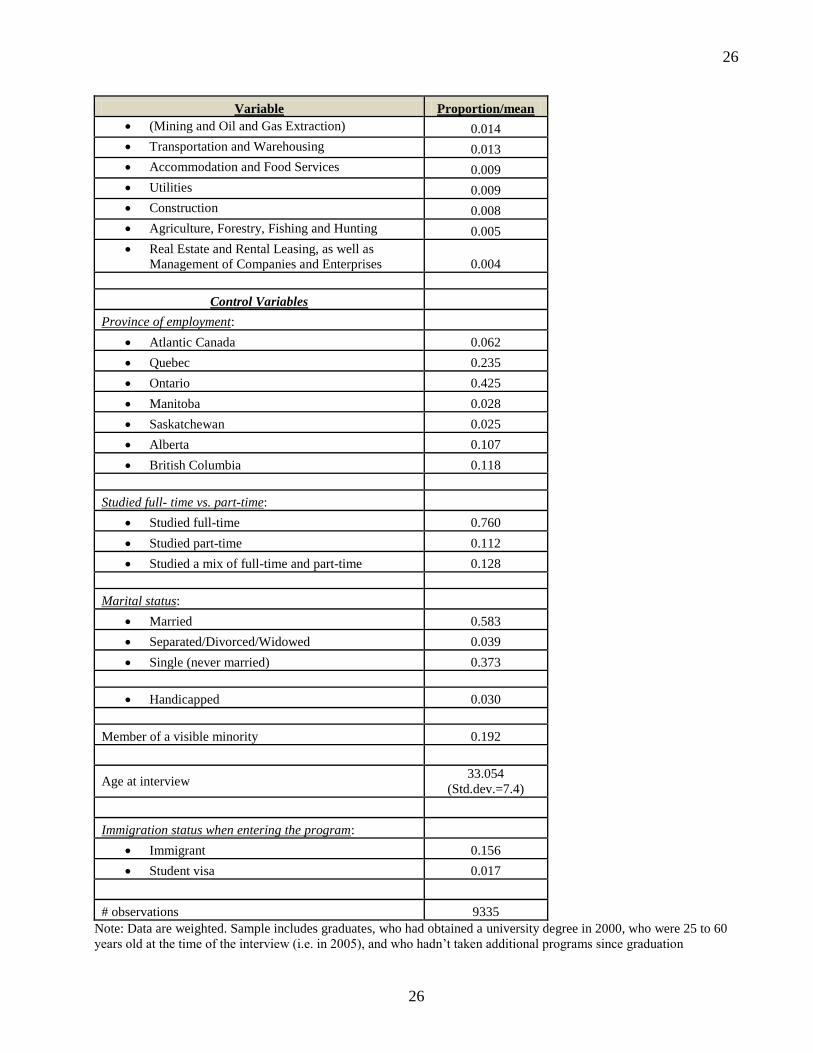
As for the control variables, briefly, many of the figures represent the relatively young age of the
graduates (33 years in 2005; 28 at the time of graduation). In terms of marital status, most were
married (58.3% of our population). 19.2% of graduates considered themselves members of visible
minorities, and as for the immigration status when entering program, 15.6% were immigrants, and
only 1.70% were on a student visa, while the rest are Canadian-born.
As for province of employment, expectedly, Ontario, as the country’s biggest province, made up the
largest percentage where graduates were working (42.5%), followed by Quebec, (23.5%), British
Columbia (11.8%), Alberta (10.7%), and then Atlantic Canada (6.2%). The other prairies provinces
each made up less than 3% if the graduates, with Saskatchewan at 2.5%, and Manitoba, 2.8%.
In terms of studied full-time vs. part-time, most graduates in our sample considered themselves to be
students first. Indeed, more than three quarters (76%) of the 2000 graduates in our sample studied
full-time, compared to 11.2% who studied part-time, and 12.8% who said they did a mix.
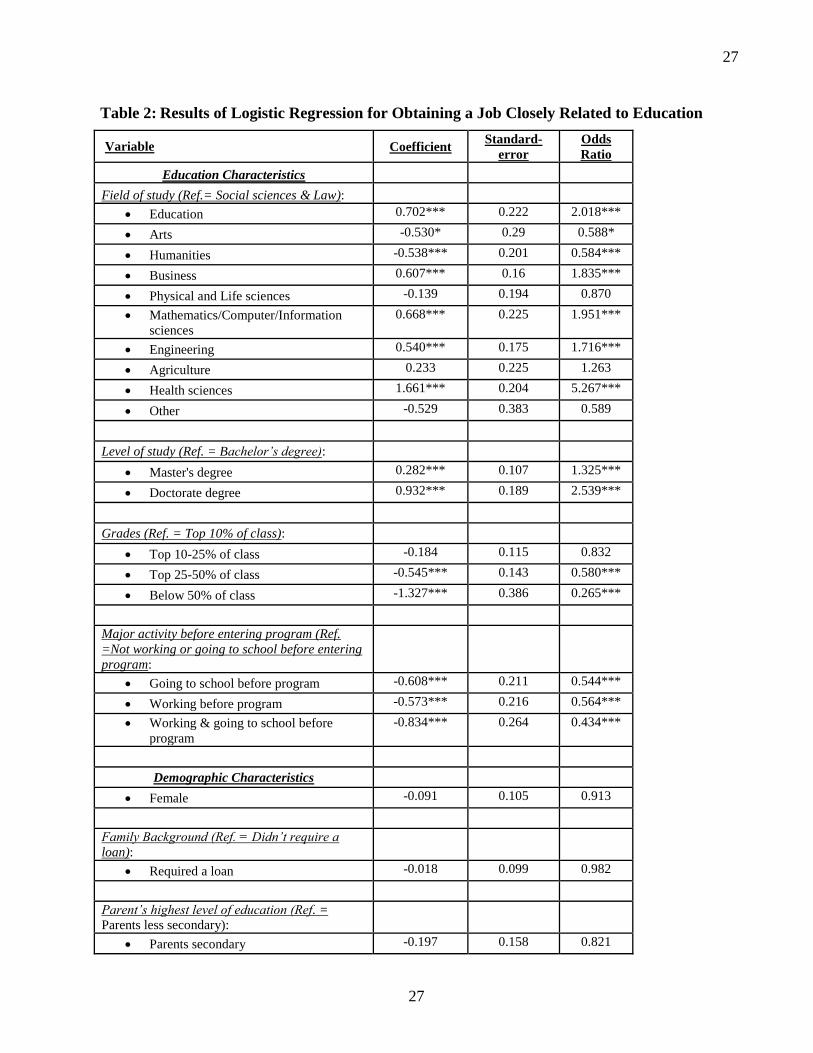
Logistic regression analysis
In our logistic regression, the dependant variable takes value 1 if the (main) job is closely related to
the graduate’s degree, and 0 otherwise. Regression estimates are presented in Table 2. Variables will
be compared through the means of an odds-ratio, which reveals how much more or less likely the
variable is to produce a match compared to the base category. For example, a variable with an odds
ratio of 0.5 means that that variable has half the likelihood of closely related match as the base
category. Any odds ratio above 1 would mean it is more likely than the base category of producing a
closely related match.
Field of study definitely influences the match, as most fields affect match strongly and their
coefficients are highly significant. Not surprisingly, as documented in numerous studies, graduates
in field specific programs had the best chance of finding employment related to their studies.
Compared to the base category of “Social sciences & Law”, the highest education-job match was
clearly “Health sciences”, with an odds ratio 5.267, followed by “Education (2.018)”, then
“Mathematics/Computer/Information sciences” (1.951). Perhaps surprisingly, “Business” (1.835)
was next ahead of “Engineering” (1.716), though “Business” is a broad program encompassing
some field specific programs such as accounting, and some perhaps less so, like marketing.
14
“Agriculture” was positive when compared to “Social sciences & Law”, but not significant, while
“Physical and Life sciences” and “Other” were negative but not significant. The fields with the least
incidence of match were “Arts” with an odds ratio of 0.588 (significant at 10%), and “Humanities”,
at 0.584.
For level of study, results suggest that the higher the degree, the better the match, with a Masters
degree obtaining an odds ratio of 1.325, and a Doctorate degree (odds ratio = 2.539) having the
strongest probability of a match of all degree levels. Regarding grades, each lower grade category
had progressively less of an education-job match, though not all categories were statistically
significant. Compared to the top 10% of class grades, the category of top 10-25% has a negative but
not statistically significant coefficient. Those who were considered to be in the top 25 to 50% of
their class had a likelihood of match 0.580 times that of the top 10%. Finally, the bottom 50% had a
likelihood of match 0.265 times that of the top 10%.
Those who worked before entering their program had the least poor incidence of mismatch
compared to the base category, with an odds ratio of 0.564. This was followed by those whose major
activity was going to school (0.544). For reasons that cannot be explained at the moment, those who
both went to school and worked before entering their program had the highest incidence of
mismatch, at 0.434 the odds. Yet, we find that the coefficients on the three categories “Going to
school before program”, “Working before program” and “Working & going to school before
program” are not statistically different. These three categories cover 96% of graduates.
By gender, females were very slightly negative when compared to males, and this was not
significant. It would appear here that gender is not a determinant of education-job match.
The level of education achieved by the parents of the graduates does not seem to matter for the most
part. Compared to the base category of graduates whose parents’ highest level of education was less
than a secondary degree, there was only a single category of the eight categories of parental
education that has a significant coefficient. Interestingly, when the highest level of education
completed by the graduates’ parent was a trade’s degree, this noticeably reduced the education-job
match with an odds ratio of 0.598 (significant at the 5% level). Having a post-graduate degree, some
postsecondary education, and a secondary education produced slightly negative coefficients, while
having unidentified postsecondary education, and a bachelor degree produced slightly positive
15
coefficients, but none of these results are significant.
In the same vein, the requirement of a student loan did not significantly affect the education-job
match. Those who required a loan had a slightly negative coefficient, but the latter is not significant.
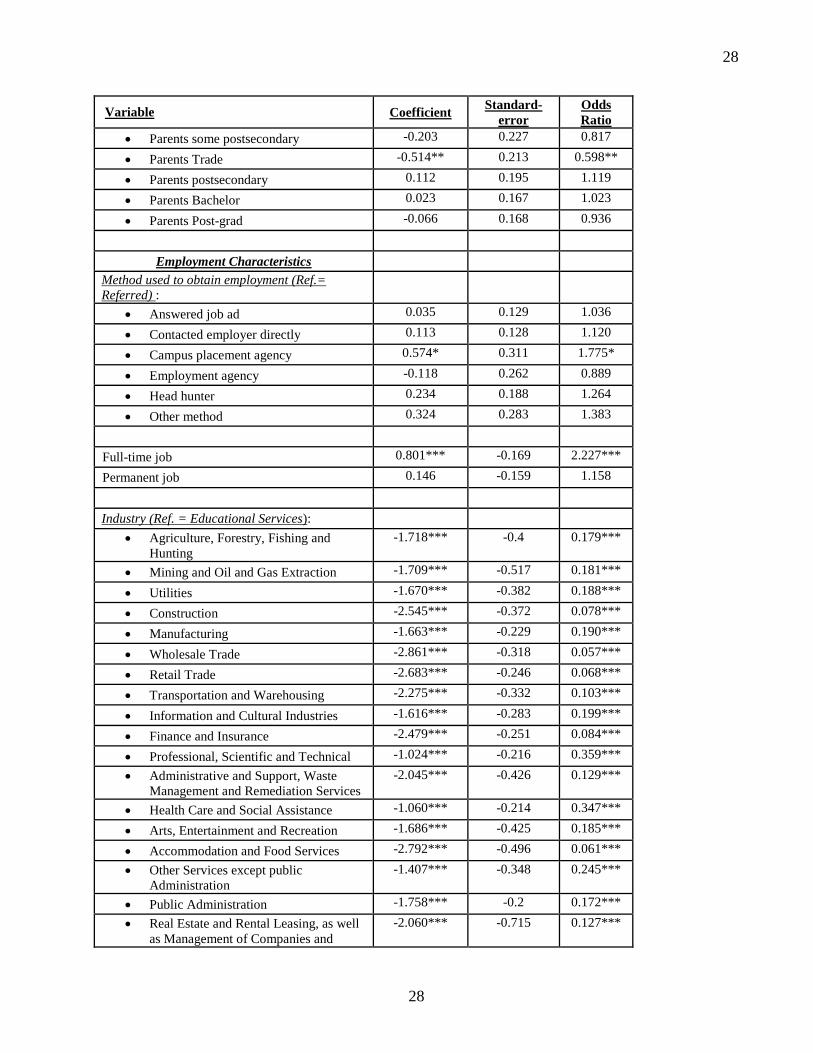
With regard to the method used to obtain employment, next to the base category of graduates who
had found employment through a referral, only those who found their job through their campus
produced significant results, at 1.775 the odds ratio (significant at the 10% level). All other methods
produced positive but insignificant coefficients, except finding employment through an employment
agency, which produced a negative but insignificant coefficient. It would appear that the method
used to obtain employment does not seem to matter for the most part for education-job match.
Having a full-time job strongly increase the likelihood of education-job match, with an odds ratio of
2.227, whereas having a permanent job only very slightly increases match, but the difference is not
statistically significant.
Regarding industry, this turns out to be the single most significant determinant of all the variables,
as all the categories of industries have large and statistically significant coefficients. What is
immediately evident is how negative each of the other industries are compared to the base category
of “Educational Services”. The industry with the least incidence of education-job mismatch in
comparison was “Professional, Scientific and Technical” with an odds ratio of 0.359, followed by
“Health Care and Social Assistance” (0.347), “Other Services except public Administration” (0.245)
and then “Information and Cultural Industries” (0.199). At the bottom end was “Construction”
(0.078), “Retail Trade” (0.068), “Accommodation and Food Services” (0.061), and lastly,
“Wholesale Trade” (0.057). It would appear that the strongest match being in the upper tier sectors,
and the worst match being in the lower tier ones.
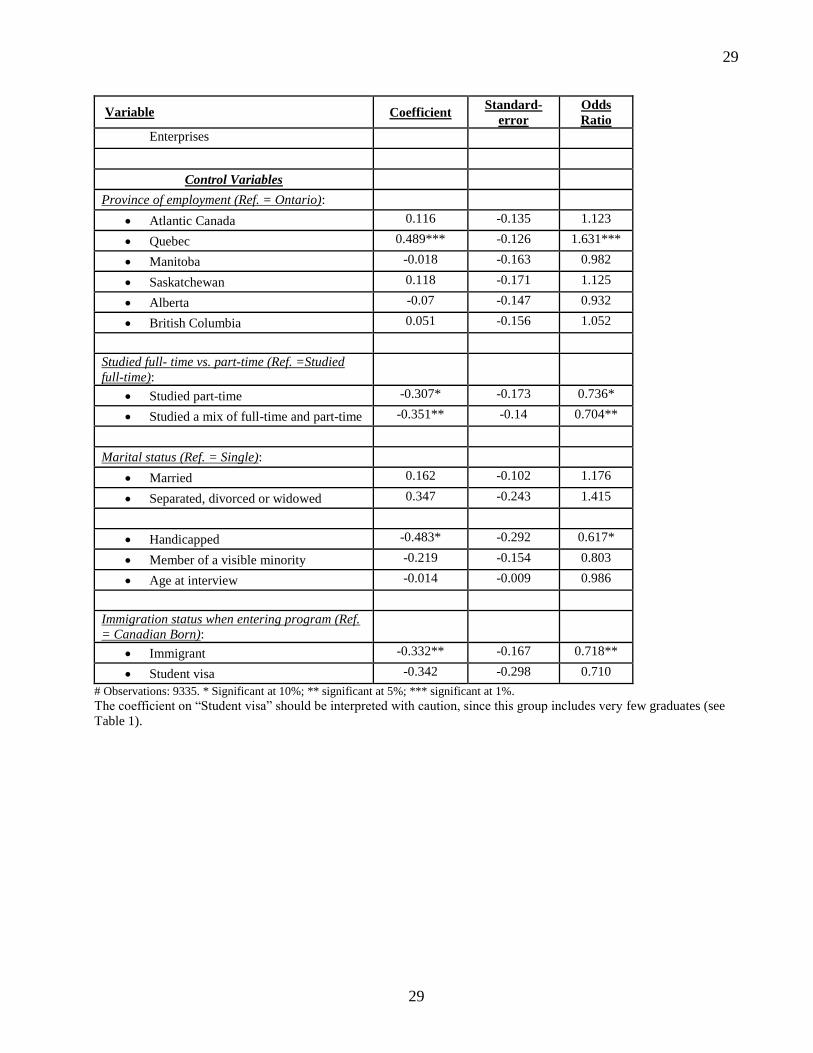
Control variables
Briefly, we will examine the results of some of the control variables. By province, compared to the
base category of working in the province of Ontario, the only province with a significant result was
Quebec, which displays an odds ratio of 1.631. Saskatchewan, Atlantic Canada, and British
Columbia, are all slightly positive, while Alberta and Manitoba are slightly negative, but none of the
odds ratios are statistically significant. As for age, the coefficient for this variable produced a
16
slightly negative but insignificant coefficient. Increased age reduced the likelihood of match, but to
a limited extent. The fact that age did not seem to matter is somewhat surprising, as it might be
expected that people would have different motivations for working at different ages.
Marital status makes no significant difference with regard to match. As for studied full-time vs. part-
time, it appears that studying full-time significantly increases the probability of education-job
match. Compared to the based category of studying full-time, those who studied part-time had an
odds ratio of 0.736 (significant at the 10% level), while those who studied a mix of full and part-
time had an odds ratio of 0.704 (significant at the 5% level).
Being handicapped decreased match slightly, with an odds ratio 0.617 (significant at the 10% level).
Likewise, being a member of a visible minority group has a negative coefficient, but the difference
is not significant. Finally, the fact of being an immigrant decreases the probability of education-job
match by 28%, and this impact is significant at the 5% level). Moreover, possessing a student visa
produces a negative but non-significant coefficient.
Discussion
In our study, education characteristics significantly affect the education-job match among university
graduates. For example, almost all the categories in the field of study variable proved noticeable and
significant. This is not surprising as these fields provide specific skills for specific occupations in
the labour market, while the more general programs are not geared for specific careers, and thus
would presumably have less of a match. Most of the articles in our study make the distinction
between these types of skills, and some (Robst 2007a; Garcia-Espejo and Ibanez 2006; and Wolbers
2003) specifically note the importance of having education-job match in these types of programs,
where the labour market penalties for mismatch is more severe. In addition, both the level of study
and grades influence the education-job match as well. Again, these results are consistent with the
findings of studies on education-job match that we have looked at.
By field of study, Wolbers (2003); Grayson (2004); Garcia-Espejo and Ibanez (2006); Robst
(2007a); Krahn and Bowlby (1999); Storen and Arneson (2006); Heijke, Meng and Ris (2003) show
the more field specific programs obtain a higher match, while Wolbers (2003); Robst (2007a);
Krahn and Bowlby (1999) all clearly show that the higher the level of education, the better the
17
match. Grayson (2004), Garcia-Espejo and Ibanez (2006), and Storen and Arnesen (2006), all show
the better grades obtained during education increases the match.
These results would appear to give some tentative support to the Human Capital theory, at least
according to the logic used by Grayson (2004), who in his articles views knowledge and skills
developed in school as pure human capital in the pursuance of career outcomes, one of which being
the education-job match. The fact that the large majority of university graduates, 64.90% said they
felt their job was closely related to their education seems to show that most graduates are indeed
using what they learnt in school in their employment. Furthermore, this relation is affected by how
and what they studied in school, as well as how they did in school. If the credential was all that
mattered, it would seem that such details would matter less than they did.
As for Demographic characteristics, these did not appear to matter very much. The sex of the
graduate, as well as nearly all of the various characteristics of family background that we looked at,
i.e. the highest level of education obtained by parents, as well as the requirement of a loan, produced
for the most part produced insignificant coefficients in our logistic regression analysis.
The evidence behind demographic characteristics increasing or decreasing match is mixed. The sex
of the graduate for example, had some studies with females having a higher match (Wolbers 2003;
Witte and Kalleberg 1995; Robst 2007a), other studies showing males with the higher match (Krahn
and Bowlby 1999), and this making no difference in others (Garcia-Espejo and Ibanez 2006; Storen
and Arnesen 2006).
As for level of education achieved by parents as well as the requirement of a loan, as noted, these
variables have not been investigated before in any study we have found. This in and of itself is a
little surprising, as people come from many walks of life and of many backgrounds, and it would
seem almost inevitable that this would affect education-job outcomes.
As for Employment characteristics, the results were mixed in our study, with some strongly
affecting the match, while others being insignificant in our regression analysis. The single
determinant with the strongest influence on match in our entire study is the industry the graduate
works in. Certain industries, such as “Educational services”, had match rates many times that of
other industries, such as “Accommodation and Food Services” and “Wholesale Trade”. Other
18
characteristics of the job itself, such as working full-time also strongly positively affected the match.
Wolbers (2003) finds that full-time employment is associated with education-job match. As found
by Krahn and Bowlby (1999), the industry a graduate worked in heavily affected match. This makes
sense as some industries like teaching or professional services would seem far more likely to require
specific education credentials to be allowed in it, whereas industries like trades and accommodation
would seem far less inclined to require such education.
The variables in employment characteristics which unexpectedly do not seem to matter are how the
job was obtained, as well as the permanence of employment. These results were perhaps surprising
as the studies which included these characteristics clearly demonstrate that they affect the match.
For example, for the method used to obtain employment, our regression analysis gave mostly
insignificant results for the most part. This is in clear contrast to the Grayson (2004) study.
The fact that using a head hunter has no significant impact on match is a bit surprising, as these are
people who are paid to find specific careers for people with specific credentials. It is also interesting
that those who found their job through a campus placement agency is the only category that
produced statistically significant and positive results. Perhaps this is because campus placement
agencies would have connections to certain industries, and be specifically geared to set up graduates
from its universities with jobs in their fields.
All in all, our results are mostly line with previous studies. Clearly, some variables are strongly
associated with an education-job match, while other variables don’t seem to matter very much.
Interestingly, for several of the categories which indicated a mix of activities (i.e. those who did a
mix of working and studying as their major activity before graduation, those who studied a mix of
both full-time and part-time for studied full-time or part-time...), this lead to a noticeable and
significant decrease in match. It would appear that being focused on one’s activity is associated with
a higher match.
It would also appear that the variables associated with the choices made by graduates (i.e. the field
and level of study, grades, studying full-time vs. part-time, the types of employment chosen
afterwards, etc.) matter far more than the variables than variables that are pre-determined
(demographic characteristics, being handicapped, etc.). Perhaps these results are therefore also as a
19
positive observation. It would seem to bode well that any graduate in Canada, regardless of their
sex, parental background or social status can obtain employment that matches what they learnt in
school.
Conclusion
Canada has put a tremendous investment into its postsecondary education system. If one of the main
functions of education is to provide skills that will be used in subsequent employment, then it would
be considered an inefficient use of resources for both individuals and society as a whole for
graduates not to use their education in their jobs. This notion has spawned a great deal of research
comparing education and its relation to subsequent employment. In most studies, the concept of
education-job match is looked at in terms of years of schooling required to get the job and years of
schooling obtained, however the level of education is not the only choice students make when taking
education. We chose to look at this education-job match through work and its relation to the degree
obtained, which encompasses both the level and field of study obtained in a graduate’s education.
Our research explores the determinants of education-job match using data for a sample of Canadian
university graduates from the 2000 FOG. Our results are generally in line with similar studies. A
large percentage of graduates (64.90%) found their education to be “closely related” with their job.
By and large, education characteristics affect match, employment characteristics affect match to a
fair extent, while demographic characteristics are far less important.
For our education characteristics, in particular, the field and level of school, as well as grades
obtained, highly increase the education-job match, in accordance with previous studies. We also
attempt to look at the activity before entering program to see if a better understanding of the labour
market would increase match, though our results here are inconclusive. The activity before entering
one’s program affects match, but in ways in which we did not foresee; working before entering
one’s program produced a better match when compared to those who just studied, but those who did
both had the weakest connection to match, while those who neither studied nor worked had the
highest match. The latter result should be considered with caution, since less than 5% of graduates
were neither studying nor working before starting their university program.
For our employment characteristics, in accordance with previous studies, working full-time (vs.
20
working part-time), and the industry of employment in particular, strongly affect the education-job
match. Conversely, the permanence of employment has little effect on match in our study, as did
method used to obtain employment, in contrast to what our review of the literature had lead us to
expect.
Demographic characteristics, such as sex, highest level of education achieved by parents, and the
requirement of a loan did not produce significant results for the most part. By and large, we felt it
positive that demographic characteristics did not affect match, as it shows that employment
outcomes, at least in the form of match, are not particularly influenced by discriminatory factors.
Our study contributes to the research in this area by accounting for several variables which have not
been looked at before to our knowledge; the requirement of a loan and parents education, both of
which allow us to explore how family background affect match. We also use the variable “activity
before entering one’s program” which allows us to see whether knowledge of the labour market
benefits match.
For future research, it would be interesting to study the requirement of a degree to work on the job,
to skills learnt from education used on the job, as in Walters (2004). It also would be interesting to
question graduates about their understanding of the labour market to investigate how this affects
choices. Other future areas of interest to study include looking at labour market consequences of
match, as well as how match changes over time. These latter two variables are found in the 2000
FOG, and would allow for a more practical understanding of educational-job mismatch.
Furthermore, it would allow for the exploration of such labour market theories as Job matching and
Technological change theories, providing for a better theoretical understanding.
Although not the key part of our study, we have mentioned that labour market results of education-
job match results are mixed. Witte and Kalleberg (1995) note that a close fit between training and
employment is not necessarily a good thing. In many cases, maintaining a very close fit between
training and employment would represent a career constraint, as higher positions might require new
skills sets, not learnt in postsecondary education.
21
BIBLIOGRAPHY
Alboim, Naomi, Ross Finnie, and Ronald Meng (2005). “The Discounting of Immigrants' Skills in
Canada: Evidence and Policy Recommendations.” IRPP Choices 11, no. 2.
Allen, Jim and Egbert De Weert (2007) “What do Educational Mismatches Tell us about Skills
Mismatches? A Cross-country Analysis”, European Journal of Education, Vol. 42, No. 1, (p59-73).
Allen, Jim and Rolf Van der Velden (2001) “Educational Mismatches vs Skill Mismatches: Effects
on Wage, Job Satisfaction, and on the Job Search”, Oxford Economic Papers, 3, (p434-452).
Borghans, L. and A. de Grip (2000) (eds) “The Overeducated Worker? The Economics of
Underutilization of Skills”, Edward Elgar, Chltenham, (260 pages).
Boudarbat, Brahim; and Claude Montmarquette (2009) “Choice of Fields of Study of University
Canadian Graduates: the Role of Gender and their Parents’ Education”, Forthcoming, Education
Economics, Vol. 17, Issue 2, pages 185 - 213.
Buchel, Felix (2001) “Overqualification: Reasons, Measurement Issues and Typological Affinity to
Unemployment”, Extract from: Descy, Pascaline; Tessaring, Manfred (2001) (eds.) “Training in
Europe Second Report on Vocational Training Research in Europe 2000: Background Report.
(Cedefop Reference series)”, Luxembourg: Office for Official Publications of the European
Communities, (3 volumes); ISBN 92-896-0034-0. (p453-560).
Chiswick, Barry R., and Paul W. Miller (2007) “The International Transferability of Immigrants’
Human Capital Skills”, Discussion Paper Series, IZA DP No. 2670 (27 pages).
Collins, Randal (1979) “The Credential Society An Historical Sociology of Education and
Stratification”, Academic Press, New York.
Di Pietro, Giorgio and Peter Urwin (2003) “Education and Skills Mismatch in the Italian Graduate
Labour Market”, Royal Economic Society Annual Conference 2003, (26 pages).
Drolet, Marie (2005), "Participation in Post-secondary Education in Canada: Has the Role of
Parental Income and Education Changed over the 1990s?," Statistics Canada - Analytical Studies
Branch Research Paper Series, 11F0019MIE No. 243.
Emery, Herb (2004 draft) “Total and Private Returns to University Education in Canada: 1960-2030
and in Comparison to other Post-Secondary Training”, Prepared for: Higher Education in Canada,
John Deutsch Institute for the Study of Economic Policy, February 13-14, 2004 (37 pages).
Galarneau, Diane and René Morissette (2008) “Immigrants’ education and required job skills”,
Perspectives (December), Statistics Canada - Catalogue no. 75-001-X (p. 5-18).
22
Garcia-Espejo, Isabel, and Marta Ibanez (2006) “Education-Skill Matches and Labour
Achievements among Graduates in Spain”, European Sociological Review, Vol. 22 Number 2
(p141-155).
Gilmore , Jason, and , Christel Le Petit (2008) “The Immigrant Labour Force Analysis Series The
Canadian Immigrant Labour Market in 2007: Analysis by Region of Postsecondary Education” The
Immigrant Labour Force Analysis Series, Catalogue no. 71-606-X2008004, ISSN 1914-6299 ISBN,
978-1-100-10273-3 (32 pages).
Grayson, Paul J. (2004) “Social Dynamics, University Experiences, and Graduates’ Job Outcome”,
British Journal of Sociology of Education, Vol. 25, No. 5, (p609-627).
Greene, W. H. (2003). Econometrics Analysis. 5e edition. Prentice Hall.
Halaby, Charles N. (1994) “Overeducation and Skills Mismatch”, Sociology of Education, Vol. 67,
No. 1. (p47-59).
Heijke, H., C. Meng, and C. Ris (2003) "Fitting to the job: the role of generic and vocational
competencies in adjustment and performance”, Labour Economics, Vol. 10 (p215-229).
Jones, M. K.; P.J. Sloane (2009) “Disability and Skill Mismatch”, IZA discussion paper no. 4430.
Jovanovic, B. (1979) “Job Matching and the Theory of Turnover”, Journal of Political Economy,
Vol. 87, (p972–990).
Krahn, Harvey and Jeffrey Bowlby (1999) “Education job-skills match; An Analysis of the 1990
and 1995 National Graduates Surveys”, A Human Resources Development Canada Research paper,
in collaboration with the Centre for Education Statistics. R-00-101E (85 pages)
Owram, Doug (1996) “Born at the Right Time: A History of the Baby Boom Generation”, Toronto:
University of Toronto Press.
Redpath, Lindsay (1994) “Education-job Mismatch Among Canadian University Graduates:
Implications for Employers and Educators”, The Canadian Journal of Higher Education, Vol.
XXIV-2 (p89-113).
Robst, John (2007a). "Education and Job Match: The Relatedness of College Major and Work",
Economics of Education Review, 26, (p397–407).
Robst, John (2007b) “Education, College Major, and Job Match: Gender Differences in Reasons for
Mismatch”, Education Economics, 15:2, (p159-175).
Roterman, Michelle L. (1999) “Is there a Value in an Arts Education? An Analysis Using the 1997
National Graduates Survey” Masters of Arts Thesis, University of Guelph (172 pages)
23
Sorenson, Aage B., and Kalleberg, Arne L. (1981) “An Outline of a Theory of the Matching of
Persons to Jobs”, Chapter 3: Sociological Perspectives on Labour Markets, edited by Ivar Berg,
Academic Press.
Storen, Liv Anne and Clara Ase Arnesen (2006) “What Promotes a Successful Utilization of
Competence in the Labour Market Five Years after Graduation? Does Vocational Higher Education
Result in a Better Match than Academic Generalist Education?”, Paper presented at the European
Research Network on Transition in Youth – 2006 Workshop, Marseilles, 7–9 September 2006 (27
pages).
Van Smoorenburg, M.S.M. and R.K.W. Van der Velden (2000) “The Training of School-Leavers:
Complementarity or Substitution?”, Economics of Education Review, Vol. 19, (p207-217).
Van de Werfhorst, Herman G. (2002) “Fields of Study, Acquired Skills and the Wage Benefit from
a Matching Job”, Acta Sociologica, Vol. 45:4, (p287 – 303).
Walters, David (2004) “The Relationship Between Postsecondary Education and Skill: Comparing
Credentialism with Human Capital Theory”, The Canadian Journal of Higher Education, Vol. 34,
No. 2 (p97-124).
Witte, James C. and Arne L Kalleberg (1995) “Matching Training and Jobs: The Fit between
Vocational Education and Employment in the German Labour Market”, European Sociological
Review, Vol. 11 No. 3. (p293-317).
Wolbers, Maareten H.J. (2003) “Job Mismatches and their Labour-Market Effects among School-
Leavers in Europe”, European Sociological Review, Vol. 19 No. 3, (p249-266).
OECD (2009) “Education at a Glance 2009” published on the responsibility of the Secretary-
General of the OECD, 96 pages.
Statistics Canada (2007) “National Graduates Survey (NGS)” *Presently unavailable online.
Statistics Canada Centre for Education Statistics “Microdata User Guide Follow-up of Graduates
Survey Class of 2000 Public Use Microdata File”.
24
24
Table 1: Descriptive Statistics
Variable Proportion/mean
Education-Job match
Closely 0.649
Somewhat 0.225
Not at all 0.126
Education Characteristics
Field of study:
Education 0.163
Arts 0.032
Humanities 0.077
Social Sciences & Law 0.187
Business 0.193
Physical and Life sciences 0.061
Mathematics/Computer/Information sciences 0.055
Engineering 0.097
Agriculture 0.024
Health sciences 0.087
Other 0.023
Level of study:
Bachelor 0.779
Master 0.186
Doctorate 0.035
Grades:
Top 10% of class grades 0.307
Top 10-25% of class grades 0.366
Top25-50% of class grades 0.172
Below 50% of class grades 0.009
Grades unknown 0.146
Activity before entering program:
Going to school before program 0.532
Working before program 0.321
Working & going to school before program, 0.102
Taking care of family before program 0.023
Doing other before program 0.022
Demographic Characteristics
Female 0.590
25
25
Variable Proportion/mean
Family background
Used a government student loan as one of the two main
sources of funding for all of their postsecondary education 0.413
Parent’s highest level of education:
Parents post-grad 0.160
Parents bachelor 0.210
Parents postsecondary 0.148
Parents trade 0.049
Parents some postsecondary 0.073
Parents secondary 0.229
Parents less than secondary 0.126
Parents Other 0.011
Employment Characteristics
Method used to obtain employment:
Referred 0.243
Answered job ad 0.269
Contacted employer directly 0.248
Campus placement agency 0.047
Employment agency 0.030
Head hunter 0.088
Other method 0.037
Not stated 0.038
Full-time job 0.924
Permanent job 0.896
Industry:
Educational Services 0.269
Health Care and Social Assistance 0.142
Professional, Scientific and Technical 0.126
Public Administration 0.102
Manufacturing 0.082
Finance and Insurance 0.068
Information and Cultural Industries 0.042
Retail Trade 0.030
Other Services except public Administration 0.025
Administrative and Support, Waste Management
and Remediation Services 0.018
Wholesale Trade 0.017
Arts, Entertainment and Recreation 0.016
26
26
Variable Proportion/mean
(Mining and Oil and Gas Extraction) 0.014
Transportation and Warehousing 0.013
Accommodation and Food Services 0.009
Utilities 0.009
Construction 0.008
Agriculture, Forestry, Fishing and Hunting 0.005
Real Estate and Rental Leasing, as well as
Management of Companies and Enterprises 0.004
Control Variables
Province of employment:
Atlantic Canada 0.062
Quebec 0.235
Ontario 0.425
Manitoba 0.028
Saskatchewan 0.025
Alberta 0.107
British Columbia 0.118
Studied full- time vs. part-time:
Studied full-time 0.760
Studied part-time 0.112
Studied a mix of full-time and part-time 0.128
Marital status:
Married 0.583
Separated/Divorced/Widowed 0.039
Single (never married) 0.373
Handicapped 0.030
Member of a visible minority 0.192
Age at interview 33.054
(Std.dev.=7.4)
Immigration status when entering the program:
Immigrant 0.156
Student visa 0.017
# observations 9335
Note: Data are weighted. Sample includes graduates, who had obtained a university degree in 2000, who were 25 to 60
years old at the time of the interview (i.e. in 2005), and who hadn’t taken additional programs since graduation
27
27
Table 2: Results of Logistic Regression for Obtaining a Job Closely Related to Education
Variable Coefficient Standard-
error
Odds
Ratio
Education Characteristics
Field of study (Ref.= Social sciences & Law):
Education 0.702*** 0.222 2.018***
Arts -0.530* 0.29 0.588*
Humanities -0.538*** 0.201 0.584***
Business 0.607*** 0.16 1.835***
Physical and Life sciences -0.139 0.194 0.870
Mathematics/Computer/Information
sciences
0.668*** 0.225 1.951***
Engineering 0.540*** 0.175 1.716***
Agriculture 0.233 0.225 1.263
Health sciences 1.661*** 0.204 5.267***
Other -0.529 0.383 0.589
Level of study (Ref. = Bachelor’s degree):
Master's degree 0.282*** 0.107 1.325***
Doctorate degree 0.932*** 0.189 2.539***
Grades (Ref. = Top 10% of class):
Top 10-25% of class -0.184 0.115 0.832
Top 25-50% of class -0.545*** 0.143 0.580***
Below 50% of class -1.327*** 0.386 0.265***
Major activity before entering program (Ref.
=Not working or going to school before entering
program:
Going to school before program -0.608*** 0.211 0.544***
Working before program -0.573*** 0.216 0.564***
Working & going to school before
program
-0.834*** 0.264 0.434***
Demographic Characteristics
Female -0.091 0.105 0.913
Family Background (Ref. = Didn’t require a
loan):
Required a loan -0.018 0.099 0.982
Parent’s highest level of education (Ref. =
Parents less secondary):
Parents secondary -0.197 0.158 0.821
28
28
Variable Coefficient Standard-
error
Odds
Ratio
Parents some postsecondary -0.203 0.227 0.817
Parents Trade -0.514** 0.213 0.598**
Parents postsecondary 0.112 0.195 1.119
Parents Bachelor 0.023 0.167 1.023
Parents Post-grad -0.066 0.168 0.936
Employment Characteristics
Method used to obtain employment (Ref.=
Referred) :
Answered job ad 0.035 0.129 1.036
Contacted employer directly 0.113 0.128 1.120
Campus placement agency 0.574* 0.311 1.775*
Employment agency -0.118 0.262 0.889
Head hunter 0.234 0.188 1.264
Other method 0.324 0.283 1.383
Full-time job 0.801*** -0.169 2.227***
Permanent job 0.146 -0.159 1.158
Industry (Ref. = Educational Services):
Agriculture, Forestry, Fishing and
Hunting
-1.718*** -0.4 0.179***
Mining and Oil and Gas Extraction -1.709*** -0.517 0.181***
Utilities -1.670*** -0.382 0.188***
Construction -2.545*** -0.372 0.078***
Manufacturing -1.663*** -0.229 0.190***
Wholesale Trade -2.861*** -0.318 0.057***
Retail Trade -2.683*** -0.246 0.068***
Transportation and Warehousing -2.275*** -0.332 0.103***
Information and Cultural Industries -1.616*** -0.283 0.199***
Finance and Insurance -2.479*** -0.251 0.084***
Professional, Scientific and Technical -1.024*** -0.216 0.359***
Administrative and Support, Waste
Management and Remediation Services
-2.045*** -0.426 0.129***
Health Care and Social Assistance -1.060*** -0.214 0.347***
Arts, Entertainment and Recreation -1.686*** -0.425 0.185***
Accommodation and Food Services -2.792*** -0.496 0.061***
Other Services except public
Administration
-1.407*** -0.348 0.245***
Public Administration -1.758*** -0.2 0.172***
Real Estate and Rental Leasing, as well
as Management of Companies and
-2.060*** -0.715 0.127***
29
29
Variable Coefficient Standard-
error
Odds
Ratio
Enterprises
Control Variables
Province of employment (Ref. = Ontario):
Atlantic Canada 0.116 -0.135 1.123
Quebec 0.489*** -0.126 1.631***
Manitoba -0.018 -0.163 0.982
Saskatchewan 0.118 -0.171 1.125
Alberta -0.07 -0.147 0.932
British Columbia 0.051 -0.156 1.052
Studied full- time vs. part-time (Ref. =Studied
full-time):
Studied part-time -0.307* -0.173 0.736*
Studied a mix of full-time and part-time -0.351** -0.14 0.704**
Marital status (Ref. = Single):
Married 0.162 -0.102 1.176
Separated, divorced or widowed 0.347 -0.243 1.415
Handicapped -0.483* -0.292 0.617*
Member of a visible minority -0.219 -0.154 0.803
Age at interview -0.014 -0.009 0.986
Immigration status when entering program (Ref.
= Canadian Born):
Immigrant -0.332** -0.167 0.718**
Student visa -0.342 -0.298 0.710
# Observations: 9335. * Significant at 10%; ** significant at 5%; *** significant at 1%.
The coefficient on “Student visa” should be interpreted with caution, since this group includes very few graduates (see
Table 1).