Embed Size (px)
Citation preview

http://econ.geog.uu.nl/peeg/peeg.html
Papers in Evolutionary Economic Geography
# 17.20
The Determinants of Foreign Direct Investment in sub-Saharan Africa: What Role for Governance?
Andrés Rodríguez-Pose and Gilles Cols

The Determinants of Foreign Direct Investment in sub-Saharan Africa: What Role for Governance?
by
Andrés Rodríguez-Posea and Gilles Colsb
a Department of Geography and Environment, London School of Economics, Houghton St, London WC2A 2AE, UK. E-mail: [email protected] b Trade and Competitiveness Department, World Bank, Washington, US. E-mail: [email protected]

The Determinants of Foreign Direct Investment in sub-
Saharan Africa: What Role for Governance?
Abstract
For the past quarter of a century, foreign direct investment (FDI) flows have
grown exponentially across the world. Sub-Saharan Africa has, however, lagged
behind and only lured on average a mere 2% of global FDI. The investment that
the region attracts tends, moreover, to be concentrated in a number of commodity-
rich countries. Natural resources and the size of national markets have generally
been considered as the main drivers of FDI. The quality of local institutions has,
by contrast, attracted less attention. This paper uses institutional data for 22
countries in order to demonstrate that the quality of governance plays a far from
negligible and enduring role in the distribution of FDI in sub-Saharan Africa. It is
shown that factors such as political stability, government effectiveness, lower
corruption, voice and accountability, and the rule of law not only are more
important determinants of FDI than the size of local markets, but also that their
influence on the capacity of African countries to attract FDI is long-lasting.
Keywords: Foreign direct investment (FDI), good governance, institutions,
markets, natural resources, sub-Saharan Africa
JEL Codes: F21, N57, O43

3
1. Introduction
For the past quarter of a century, globalisation has unleashed an impressive
growth in global Foreign Direct Investment (FDI). Designing, producing,
managing, and selling in the four corners of the world has become the norm for an
ever-growing number of companies. This phenomenon has certainly not remained
without consequences. A company that relocates or invests in a foreign country
brings with it physical capital, know-how, jobs, and other positive externalities,
such as the promotion of exports and of domestic investment, making FDI very
attractive for host countries. At the same time, it is often the case that competition
ensues among countries and regions in order to ensure the attraction of FDI. And
some countries and regions are simply more competitive than others.
Sub-Saharan Africa as a whole has, however, been somewhat cut off from global
FDI flows. Even though the flows towards the region have significantly increased
over the past twenty years, its share in global FDI remains very small. There are
numerous reasons for this situation. The lack of adequate infrastructure in many
parts of the Continent, the relative absence of macroeconomic and political
stability, the weak level of human capital, and the frequent uncertainties affecting
national legal frameworks represent only a part of the explanation. Some
countries—Nigeria or Angola, to name two—are not doing too badly, essentially
due to the presence of vast quantities of oil and/or mineral resources. Given the
relatively large size of its market, Nigeria and South Africa also feature among the
4
principal destinations for FDI in the region. For the great majority of countries,
however, FDI stocks and flows remain tiny.
The purpose of this paper is to analyse to what extent other factors beyond the
presence of natural resources and country size determine the amount of FDI there
is channelled to a particular sub-Saharan African country. In particular, we are
interested in what measure the quality of local institutions1 affects the attraction of
FDI. We thus examine the evolution and distribution of FDI flows, on a global
level, on the one hand, and within sub-Saharan Africa itself, on the other, before
looking at the specific factors which may affect the attraction of FDI in the
Continent. Section 4 proposes an empirical econometric model of the factors
which influence the allocation of FDI in sub-Saharan Africa and explains the data
used and their sources. Section 5 introduces the results of the analysis, putting
special emphasis on the connection between governance variables and FDI – the
main interest of the paper – and on whether this relationship determines long-term
decisions on FDI.
2. The distribution of foreign direct investment
2.1. Global distribution2
Global FDI has taken off since the mid-1980s. World annual FDI flows
grew from a little over US$50 billion in 1983 to a peak of US$1,400 billion in
1 In this article, institutions refer to any public organization and entity, law and norm that influence the political, legal and economic environment in a particular country. Institutions are proxied by the quality of governance and are measured by means of six indicators developed by Kaufmann, Kraay and Mastruzzi (2008). 2 If not otherwise indicated, all data in this section are taken from UNCTAD.

5
2000. Global flows then decreased by 60% in three years, as the world economy
at large experienced a slowdown. From 2004 to 2007, global FDI flows recovered
and reached US$1,900 billion, before decreasing again due to the financial crisis
in 2008. Global FDI flows went down to US$1,200 billion in 2009 before
climbing back to US$1,760 billion in 2015.
Developed countries were first to benefit from this surge in FDI. Emerging
countries soon followed suit to the extent that, as in the case of trade (Ezcurra and
Rodríguez-Pose, 2014a), today around 50% of FDI is channelled to developing
countries. During the 1990s FDI in emerging countries multiplied by a factor of
seven, in line with the global trend. The sudden decline in FDI at the beginning of
the 21st century was also felt by developing countries, though in much smaller
measure. Between 2000 and 2003, the FDI going towards developing countries
decreased by 30%, i.e. only half of the global average. Over the following four
years, it resumed its previous rate of growth, almost reaching US$500 billion in
2007 (27% of the global total). The 2008 financial crisis represented only a small
hiccup for FDI flows towards developing countries. FDI in this part of the world
recovered much quicker than in developed countries. After a decline of 20% from
2008 to 2009, investment kept on increasing, reaching US$760 billion in 2015
(43% of the global total).
As illustrated by Figure 1, the developing world’s share of total global FDI is
highly volatile, often contracting by half, sometimes even more, in the space of a
couple of years (e.g. 1983-84 and 1997-2000). However, despite these sudden
changes, the general trend in emerging countries has been towards a steady long-
term increase, from about 25% of the global total during the 1970s to around 40%

6
in recent years. This trend has been fundamentally shaped by the trajectories of a
handful of countries, including, above all, China and India, but also other Asian
countries, such as Singapore, or Mexico and Brazil in Latin America. In 2015,
these five countries together attracted 44% of the FDI directed towards emerging
countries, with China alone accounting for 18%. The remaining 56% are
essentially divided between the Middle East, East and South-East Asia, and the
rest of Latin America.
Figure 1: Emerging countries’ share of global FDI inflows, 1980 – 2015.
Source: Own elaboration using UNCTAD data.
2.2. The share of sub-Saharan Africa
Africa, by contrast, has been somewhat isolated from these trends. Overall, the
whole of Africa has done rather poorly. In North Africa FDI was mainly
concentrated in Egypt, which in 2007 accounted for half of the FDI in the region.
In sub-Saharan Africa the situation was even worse. Despite the fact that countries
south of the Sahara have witnessed a net growth of FDI inflows since the early
1990s, reaching US$42 billion in 2015 – an increase by a factor of 25 between
1990 and 2015 – the starting point was very low. As can be seen in Figure 2, the

7
Continent’s share of global FDI remains marginal and has not surpassed the 4%
mark in 35 years. Since 2003, it has hovered between 2 and 3% of global FDI and
we have to go back to before the 1970s in order to find a time when the region
accounted for more than 6% of global FDI flows. Sub-Saharan Africa has not only
lost ground with respect to the developed world, but also compared to many other
emerging economies. Even as the region saw a 218% increase in FDI during the
1980s and 1990s, Latin America registered a growth of 560%, South Asia of
789%, East Asia of 990%, and the developing countries as a whole of 760% over
the same period (Asiedu, 2004). During the past 25 years, the region not once
managed to attract more than 10% of the FDI directed to developing countries.
Among the principal factors responsible for this gap are the low level of human
capital, the economic instability and the lack of infrastructure, not to forget high
tariff barriers (internal and external), the difficult and slow implementation of
macroeconomic reforms, burdensome tax regimes, and the overregulation of
markets feature prominently (Cotton and Ramachandran, 2001). The recent efforts
by some countries in sub-Saharan Africa to put in place new policies to attract
FDI have not always been successful and often the impact of these policies
remains minimal when compared to other developing countries (Asiedu, 2004).
The countries which have been more successful in turning around their FDI
fortunes have been those, such as Mozambique, Tanzania, or Zambia, where
modest privatisation policies and significant advantages in the rule of law and the
protection of private property have been achieved (Jenkins and Thomas, 2002).
As is the case with the developing world at large, the FDI directed towards sub-
Saharan Africa is concentrated in only a few countries. In 2015, the four principal

8
recipients of FDI – Angola (US$8,681 million), Mozambique (US$3,711 million),
Ghana (US$3,192 million) and Nigeria (US$3,064 million) – alone attracted 43%
of all FDI channelled to sub-Saharan Africa. In the same year, four countries
together held 52% of the region’s total FDI stocks: South Africa (US$124,940
million), Nigeria (US$89,735 million), Mozambique (US$28,768 million), and
Ghana (US$26,397 million).
Figure 2: FDI flows towards sub-Saharan Africa: total volume and share of global inflows, 1970 – 2015.
Source: Own elaboration using UNCTAD data.
3. What determines the attraction of FDI in sub-Saharan
Africa?
What factors explain the geographical concentration of FDI in certain countries of
sub-Saharan Africa and not in others? The drivers of FDI, in general, and in
emerging countries, in particular, have attracted considerable interest. Two have
been the factors which have drawn the greatest attention as the determinants of
FDI in sub-Saharan Africa: the presence of natural resources, on the one hand,
9
and the role of market size, on the other (Jenkins and Thomas, 2002; Asiedu,
2006).
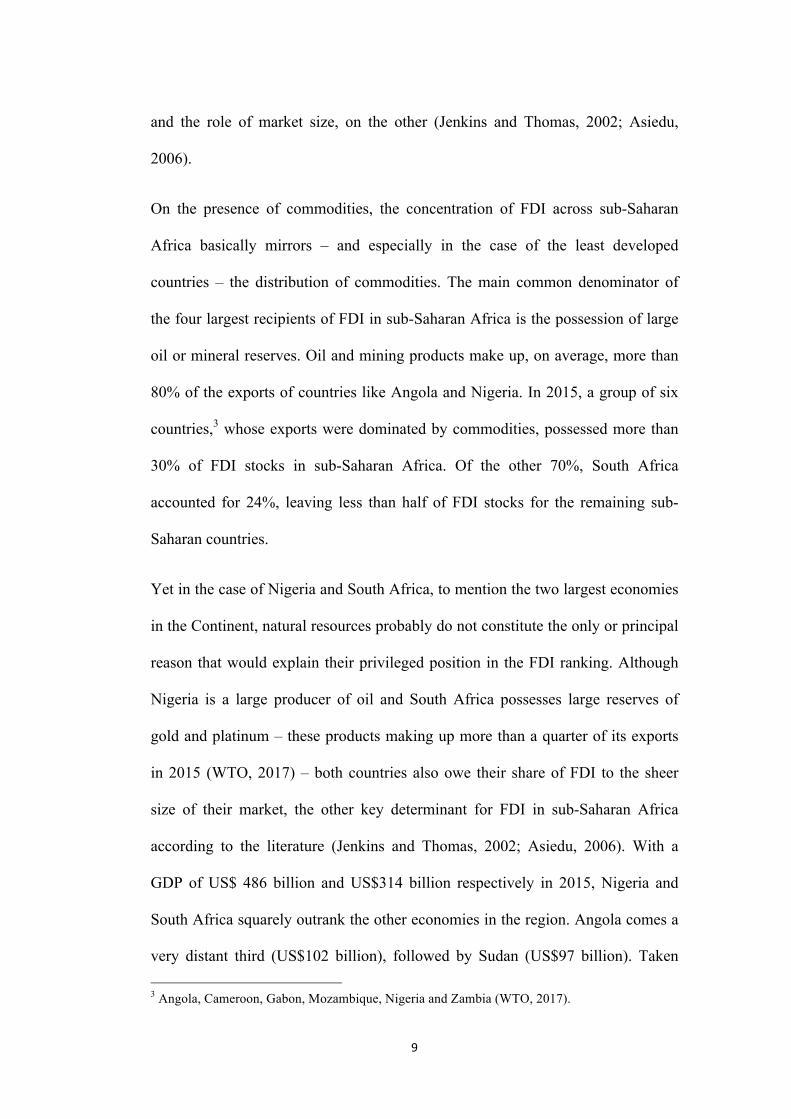
On the presence of commodities, the concentration of FDI across sub-Saharan
Africa basically mirrors – and especially in the case of the least developed
countries – the distribution of commodities. The main common denominator of
the four largest recipients of FDI in sub-Saharan Africa is the possession of large
oil or mineral reserves. Oil and mining products make up, on average, more than
80% of the exports of countries like Angola and Nigeria. In 2015, a group of six
countries,3 whose exports were dominated by commodities, possessed more than
30% of FDI stocks in sub-Saharan Africa. Of the other 70%, South Africa
accounted for 24%, leaving less than half of FDI stocks for the remaining sub-
Saharan countries.
Yet in the case of Nigeria and South Africa, to mention the two largest economies
in the Continent, natural resources probably do not constitute the only or principal
reason that would explain their privileged position in the FDI ranking. Although
Nigeria is a large producer of oil and South Africa possesses large reserves of
gold and platinum – these products making up more than a quarter of its exports
in 2015 (WTO, 2017) – both countries also owe their share of FDI to the sheer
size of their market, the other key determinant for FDI in sub-Saharan Africa
according to the literature (Jenkins and Thomas, 2002; Asiedu, 2006). With a
GDP of US$ 486 billion and US$314 billion respectively in 2015, Nigeria and
South Africa squarely outrank the other economies in the region. Angola comes a
very distant third (US$102 billion), followed by Sudan (US$97 billion). Taken 3 Angola, Cameroon, Gabon, Mozambique, Nigeria and Zambia (WTO, 2017).

10
together, these four countries represented 63% of sub-Saharan Africa’s 2015
GDP, with Nigeria alone accounting for 30%. In that year, 44 countries shared the
remaining 37%, of which only twenty had a GDP greater than US$10 billion
(World Bank, 2017).
The pre-eminence of natural resources and market size as the key drivers of FDI
generates a number of problems. Firstly, the determination to a large extent of
FDI flows by the quantity of natural resources a country possesses implies a much
greater volatility in these flows (Ndikumana and Verick, 2008). Price fluctuations
for these products mean that the interest of foreign investors in these countries
will vary. The commodities boom from the early 2000s to 2014 led to a much
greater interest among foreign firms, but the recent oil and gas price drop has
generated uncertainty and volatility in FDI flows. Secondly, some of the positive
externalities associated with FDI seem to be moderated when FDI is primarily
devoted to natural resources. In terms of employment, for example, the impact of
FDI is limited, given the predominance of physical capital in this sector. In a 2007
report on FDI in natural resources, UNCTAD noted the lack of benefits from FDI
for the economies of recipient countries, and stressed the necessity to establish
clearly defined development strategies, so that these countries can turn their
abundance of natural resources into sustainable development and profit
(UNCTAD, 2007). UNCTAD further recommended the encouragement of
industrialisation and diversification, using resource extraction as a catalyst for the
creation of new sectors adding value to resources before they are exported, as well
as for the promotion of industries capable of responding to the demand for goods
and/or services on the part of foreign firms active in the region. Thirdly, if natural

11
resources and market size are really crucial for the attraction of FDI, many
countries in sub-Saharan Africa possess neither large reserves of oil and minerals,
nor a large market.
Natural resources and local markets are, however, not the only factors which
attract FDI. A number of studies have examined the role of other factors on flows
of FDI in sub-Saharan Africa (Jenkins and Thomas, 2002; Basu and Srinivasan,
2002; Asiedu, 2006). Colonial links, different privatisation policies undertaken by
African states, and macroeconomic and political stability are considered to play a
non-negligible role. Basu and Srinivasan (2002) identify the capacity of
governments to implement structural reforms as a fundamental element for the
attraction of FDI. The presence of sound monetary and fiscal policies, adequate
exchange rate policies, and support for the development of the private sector send
strong positive signals to investors. In addition, openness to international trade,
the level of human capital, macroeconomic and political stability, corruption (or
lack of it), and the quality of infrastructure have, among others, been mentioned as
other potential factors driving FDI (Bende-Nabende, 2002; Asiedu, 2002 and
2006). Yet few countries in sub-Saharan Africa can claim to be competitive in any
of these areas in comparison to most emerging states in Asia or Latin America.
The majority of countries in the region are laden with debt and frequent efforts to
contain inflation have left, at best, mixed results. Participation rates in education
have risen considerably in recent years (particularly at primary level) (World
Bank, 2017), but the quality of teaching as well the rate of students holding
higher education degrees still remains low: participation in higher education in
2005 hovered around 4% of the population in the relevant age group (Muco,

12
2008). Moreover, many investors point to the problem of sub-Saharan Africa’s
‘bad reputation’ (Jenkins and Thomas, 2002). “Countries with better governments
and governance attract greater FDI” (Ezcurra and Rodríguez-Pose, 2014b),
whereas poor governance as well as a certain incapacity or low speed and
effectiveness to implement new reforms have become important barriers for trade
and FDI. What may amount to a lack of objectivity on the part of foreign firms
perhaps offers a plausible explanation for the weak correlation between the
adoption of new policies designed to attract FDI and the actual flows entering
sub-Saharan Africa (UNCTAD, 2000).
3.1. The role of institutions
In contrast to the importance attached to the above-mentioned factors, institutional
factors have tended to be, if not completely ignored, somewhat overlooked by the
scholarly literature on the topic. Factors such as political and economic stability
have often been deemed to have a limited effect on FDI in sub-Saharan Africa,
especially as many of the reforms are either too recent or have been regarded as
not particularly credible by investors (Jenkins and Thomas, 2002). Some research
claims that good institutions in Africa may have a negative influence on FDI
inflows, arguing that more democratic environments hinder monopolistic or
oligopolistic behaviour from large foreign investors, allow businesses to organize
and protect themselves from foreign capital, and make it complicated for host
governments to offer generous fiscal conditions (Li and Resnick, 2003).
However, according to Asiedu (2006), the evidence is far too thin and institutions
represent an important omission in our knowledge about what determines FDI in
some of the poorest countries of the world. As she underlines, FDI in Africa is not

13
only determined by exogenous factors. The quality of institutions – proxied by the
level of corruption and the rule of law – is a sufficiently important factor
explaining why FDI prefers some countries in the region to others (Asiedu, 2006).
Good institutions can trump the presence of relatively large markets or natural
resources. A country with a low level of corruption and where the rule of law
applies is more likely to see its FDI stock increase (Asiedu, 2006). But more than
whether the quality of institutions makes a difference, the question is to what
extent is the role of institutions important in comparison to that accorded to other
factors such as natural resources or markets. Asiedu and Lien (2011) indicate that
democracy and FDI are positively correlated in countries where natural resources
account for a low share of total exports, while the correlation becomes negative
for countries where exports are largely dominated by primary commodities.
However, many questions remain. Does an improvement in institutions suffice to
counterbalance the lack of natural resources and the small size of some African
markets? Can small countries that only possess few natural resources hope to see
their FDI stock grow in the same measure as natural resource rich countries, such
as Nigeria or Equatorial Guinea? While the answers to these questions are
certainly debatable — and this will form the subject of the econometric analysis
of this paper — it is logical to assume that better institutions will positively affect
the amount of FDI a country succeeds in attracting and that the effect of
institutional quality on FDI flows will be long-lasting as institutional change
generally happens at a slow pace (Putnam, 1994; Rodríguez-Pose, 2013) and
certainly slower than changes in the price of natural resources or in the size of
African economies. As has been underlined, an increase in FDI inflows would

14
ensure a greater diversification of investors who will be attracted by factors other
than commodities, thereby partly solving the problem of the lack of benefits from
FDI for the local economy.
Overall, the existing literature on the determinants of FDI in sub-Saharan Africa
has failed to reach a strong consensus about which are the essential determinants
for inward investment – or, at least, on the dimension of the impact of individual
variables. While some regard political and economic stability and trade openness
as strong promoters of FDI – the key issue seems to be related not to these factors,
but to their credibility – other authors, for example, see market size as being the
most significant factor for FDI (Jenkins and Thomas, 2002; Asiedu, 2006).
Others, in contrast, do not even mention it (Basu and Srinivasan, 2002). The same
holds for human capital, to which Asiedu (2006) alone seems to attach any
importance. Anyanwu and Yameogo (2015) demonstrated that domestic
investments and the urbanization rate – the latter associated with the creation of
urban clusters, transport corridors and the necessary infrastructure – tend to attract
FDI in sub-Saharan Africa.
In any case, the most astonishing gap in the literature relates to institutions and
good governance. Only Asiedu places institutional variables at the centre of her
analysis, without sufficiently scrutinising them, as she contents herself with
observing the influence of corruption levels and of the rule of law (Asiedu, 2006).
This paper will aim to fill this gap by dividing the notion of good governance into
six distinct variables, while controlling for a host of other factors identified in the
literature as key promoters of FDI in sub-Saharan Africa. It will also explore the
time influence of country-level institutional quality. The slow pace of institutional

15
change may imply that institutional conditions can determine FDI inflows into
specific countries and other economic outcomes for years and, in some cases,
decades to come.
4. Model and data
4.1 Econometric analysis
This section aims to provide an answer to the three main questions emerging from
the discussion above. The first is what is the role of institutions – and in particular
good governance – on the attraction of FDI towards countries in sub-Saharan
Africa. Second, whether this role by institutions is more or less significant than
that awarded to other key factors behind FDI, such as a country's endowment of
natural resources and its market size. And, third, whether the effect of institutions
on FDI flows persists in time. The model used in order to address these questions
adopts the following form:
ittititititi XMSizeNatresGovFDI eµfqlba ++++++= ,,,,, 0 (1)
where FDI depicts the foreign direct investment as a percentage of GDP received
by country i in any given year t; Gov represents a matrix of variables depicting the
quality of governance; Natres is an indicator of natural resources, proxied by the
percentage of oil and mining and exports; MSize represents an indicator of the
potential market in any given country; and X is a vector of other variables which
are assumed to influence the location of FDI. Finally, µ are unobservable time-
specific effects and ε depicts the residual factor.

16
4.2. Data
Dependent variable
The dependent variable is represented by the FDI inflows as the percentage for
GDP in every sub-Saharan African country for which complete sets of data are
available. FDI inflows are preferred to stocks as they present a snapshot of the
current situation without (or only marginally) taking into account the historical
events that have influenced a country’s FDI stock. The GDP data are taken from
the Economic Outlook Database of the International Monetary Fund. The data
concerning FDI inflows are available from the United Nations Conference on
Trade and Development.
Explanatory variables
• Good governance
The explanatory variables of interest are linked to the notion of good governance.
Good governance is measured by means of six indicators developed by
Kaufmann, Kraay and Mastruzzi (2008) at the World Bank, which are based on
hundreds of individual variables contained in 35 databases that were compiled by
32 different organisations (Kaufmann, Kraay, and Mastruzzi, 2008). The six
‘good governance’ variables include: voice and accountability; political stability
and absence of violence; government effectiveness; regulatory quality; the rule of
law; and control of corruption. These indicators aim to represent the perceptions
of governance held by the public and private sectors, NGOs, businesses, and
individual citizens. Information for the variables is gathered from organisations
located in different regions of the world in order to minimise potential biases. The

17
authors attribute each variable a value ranging from -2,5 (poor performance) to
2,5 (excellent performance). Given that political instability, lack of government
credibility and poor quality of institutions are often cited as factors that limit the
amount of FDI directed towards sub-Saharan Africa, the expectation is, a priori,
that a good performance in any of these domains would be related to higher levels
of FDI.
In particular, each of the six good governance indicators represents the following.
Voice and accountability measures the perception of the capacity of the citizens of
a given country to participate in the selection of its government, alongside the
freedoms of expression, assembly, and the press. Political stability aims to assess
the probability that a government would be destabilised or overthrown by violent
or unconstitutional means, and also includes politically motivated violence and
terrorism. Government effectiveness assesses the perception of the quality of
public services and of the civil servants who deliver them, as well as their degree
of independence from political pressure. It also takes into account the quality of
policy formulation and implementation, along with the credibility of a
government’s policy commitments. Regulatory quality measures the perception of
a government’s capacity to formulate and implement sound regulatory policies
that facilitate and promote the development of the private sector. Rule of law
gauges the confidence actors have in societal rules, as well as the respect accorded
to them, with particular reference to the reliability of contracts, property rights,
the police, and the courts. It equally considers the levels of crime and violence.
Finally, control of corruption assesses the extent to which the public sector is used

18
for private ends, including both minor and major forms of corruption, and any
‘appropriation’ of the state by elites and private interests in general.
Because of the high correlation among some of the ‘good governance’ variables,
we resort to principal component analysis (PCA) in order to create a number of
composite variables capable of capturing different institutional and governance
dimensions in sub-Saharan Africa. Three composite governance variables are
created. These are government quality, citizens’ rights and political stability, and
overall governance.
Government quality combines the three variables, which according to their
respective definitions best reflect the quality of government in a general sense.
These are government effectiveness, regulatory quality, and control of corruption.
The outcomes of the PCA have the expected signs and are listed in Annex 1a. The
first principal component, which we use as our government quality variable,
accounts for 79% of the total variance.
Citizens’ rights and political stability combines the remaining governance
variables. The first principal component, used as the composite variable, explains
almost 82% of the total variance (Annex 1b).
Overall governance combines all six variables as a means to evaluate the
importance of the quality of governance at large in the attraction of FDI. All the
variables included in the composite governance index have the expected signs and
the first principal component accounts for almost 75% of the total variance
(Annex 1c).
• Natural resources and market size

19
The relevance of the good governance variables for FDI is weighed against that of
the two other fundamental factors for the attraction of FDI in sub-Saharan Africa,
according to the scholarly literature: natural resources and market size.
Regarding natural resources, the African Continent probably possesses more
natural wealth than any other region in the world and for many sub-Saharan
African countries proceeds from natural resources are a substantial source of
revenue. It is therefore essential to include a variable that permits the assessment
of the actual influence of these resources on the distribution of FDI in sub-
Saharan Africa. We therefore look at oil and mining products as a share of any
given country’s total exports. The relevant figures are taken from the statistical
database the World Trade Organisation (WTO, 2017). A positive correlation
between a country’s quantity of natural resources and the flows of FDI it attracts
is to be expected.
Market size has also been generally perceived as a key driver of FDI across the
world, although, because of the presence of relatively small markets, its influence
may not be quite as felt in many sub-Saharan African countries. We proxy the size
of the market of a country by its overall GDP, measured at constant prices. The
GDP data are the same as those used for the denominator of the dependent
variable. We expect, as per the relevant literature, the relationship between market
size and FDI to be positive. However, we use the natural logarithm of GDP as the
positive effect of the market is likely to fizzle out beyond a certain threshold.
• Other control variables

20
We also control for an additional number of factors which, according to the
literature, may have some influence on the attraction of FDI. These include the
wealth of the population proxied by GDP per capita at constant prices. As Asiedu
(2002) points out, the views on the association between this variable and FDI are
ambiguous. A higher level of wealth generally bodes well for investment, since a
company would want to place its products on the local market upon establishing
itself in a country. A lower level of wealth, on the other hand, could spark the
interest of investors, as poorer countries may offer a greater potential return on
capital. It is therefore difficult to anticipate ex ante what the sign of the coefficient
will be. The figures for GDP per capita are extracted from the International
Monetary Fund’s online database. Following the same logic as in the case of
market size, GDP per capita is expressed as a logarithm.
Macroeconomic stability is also used as another potential driver of FDI. We use
the inflation rate as our proxy for macroeconomic stability. The source of data is,
once more, the International Monetary Fund. High levels of inflation are a clear
symptom of macroeconomic instability, leading to the expectation of a negative
relationship between this variable and the dependent variable.
The two final variables represent human capital and market openness. The
endowment of human capital in any given country is likely to have a positive
association with FDI; the better the endowment of human capital, the higher the
level of FDI. However, this potential association is likely to be mediated by the
type of investment coming into the country and it is therefore not always clear-cut
that the association would always be positive. As educational data are frequently
elusive, we resort to the enrolment rate in primary education as our measure of

21
human capital. The data are taken from the World Bank (WB, 2008). The final
variable is market openness. It is expected that open markets would facilitate trade
with the rest of the world and particularly favour investors seeking to export their
products. Market openness is measured by the total of a country’s imports and
exports as a share of GDP. The relevant figures come from the online database of
the World Trade Organisation (WTO, 2009). The sign of the coefficient is
expected to be positive.
The key variables and their sources are presented in Table 1.

22
Table 1. Summary of the variables used in the econometric analysis
Variable Measure Source Expected sign
Dependent variable
FDI flows FDI inflows in % of GDP UNCTAD and IMF /
Good governance variables
Voice and accountability
Value between -2,5 and 2,5
World Governance Indicators
(World Bank) +
Political stability Government effectiveness Regulatory quality Rule of law Control of corruption
Natural resources and market size
Natural resources % of oil and
mining products in exports
WTO +
Market size Log GDP
IMF
+ Other control variables
Wealth of the population
Log GDP per capita ?
Macroeconomic stability Inflation rate -
Human capital Enrolment rate in primary education
World Development Indicators
(World Bank) +
Market openness Imports + exports in % of GDP WTO and IMF +
5. Results of the analysis
Model (1) is estimated by means of a balanced panel data analysis for the 22 sub-
Saharan African countries4 for which complete sets of data are available. Two
4 The countries considered in the analysis include Burkina Faso, Cameroon, Ivory Coast, Ethiopia, Gabon, Gambia, Ghana, Mauritius, Kenya, Madagascar, Malawi, Mozambique, Niger, Nigeria, Senegal, South Africa, Sudan, Tanzania, Togo, Uganda, Zambia, and Zimbabwe.

23
periods considered. First, the analysis is conducted between 1996 and 2005,
covering the period before the commodity-driven hike in FDI towards sub-
Saharan Africa. Second and in order to evaluate the medium- to long-term
influence of country level conditions on FDI, the connection between specific
country conditions during the period between 1996 and 2005 and FDI 10 years
later – that is between 2006 and 2015 – is estimated. Following the results of the
Hausman test, panel data estimations with random effects are preferred to the use
of fixed effects. Four main tables are extracted from the analysis. In Table 2 the
results of estimating model (1) are presented for every single individual ‘good
governance’ variable. Table 3 introduces the three composite governance
variables (government quality; citizens’ rights and political stability; and overall
governance), while Table 4 inserts a dynamic element to the analysis, by looking
at the evolution of the coefficients of the six governance variables over time. The
same analysis is conducted for up to 3 annual lags. For each regression a number
of normality, specification error, heteroscedasticity, and autocorrelation tests are
conducted. Finally, Table 5 looks at the medium- to long-term impact of FDI, by
connecting country specific conditions between 1996 and 2005 with FDI flows
between 2006 and 2015.
Regressions (1) through (6) in Table 2 assess the connection between each of the
individual ‘good governance’ variables (voice and accountability; political
stability; government effectiveness; regulatory quality; the rule of law; and control
of corruption) and foreign investment in sub-Saharan Africa, while controlling for
natural resources, market size, and the other independent variables. In regression

24
(7) all the governance variables are included together simultaneously, although
the significance of this latter regression is seriously undermined by problems of
multicollinearity, derived from the high level of correlation between the
individual governance variables.
The results of the analysis highlight that the quality of governance of different
sub-Saharan nations makes an important difference for FDI (Table 2). Five out of
the six good governance variables considered display significant coefficients.
Countries that are politically more stable, which have more effective
governments, where the rule of law prevails, and which tend to control corruption,
once other factors are controlled for, attract FDI to a much greater extent than
countries that do not. The only exceptions are regulatory quality, which seems to
be completely dissociated from FDI in sub-Saharan Africa, and voice and
accountability, which has a negative association with FDI.
On top of quality of governance a number of other control variables display a
strong connection with FDI in sub-Saharan Africa. This is particularly the case, as
was expected by theory, of the presence of natural resources. The coefficient for
our natural resources proxy is always a positive and significant, indicating that
African nations with a good endowment of oil and minerals are magnets for FDI.
The other factor highlighted by the literature as a key determinant of FDI, market
size, displays by contrast a non-significant coefficient in all regressions. Once
other factors are controlled for, it does not seem that foreign investors are
attracted by the dimension of the market of African countries. Similarly, market
openness is also totally dissociated from FDI. A further sign that markets may not
seem to matter for FDI in sub-Saharan Africa is the negative and insignificant

25
coefficient of the wealth of the population in all regressions. Richer countries not
only do not attract greater FDI, but, once other factors are controlled for, seem to
be pushing FDI away. Finally, human capital is positively connected to FDI,
while macroeconomic instability, proxied in our analysis by the inflation rate of
every country, displays the expected negative and significant sign.

26
Table 2. Estimation of the model (1) with individual good governance variables.
Variables (1) (2) (3) (4) (5) (6) (7) Dependent variable: FDI inflows as a % of GDP Natural resources
0.026*** (0.0079)
0.027*** (0.0078)
0.031*** (0.0078)
0.026*** (0.008)
0.031*** (0.0079)
0.033*** (0.008)
0.029*** (0.0075)
Market size
-0.0003 (0.893)
0.472 (0.908)
-0.431 (0.868)
-0.045 (0.89)
0.127 (0.876)
-0.232 (0.868)
0.065 (0.753)
Wealth level of the population
-3.083*** (1.036)
-3.386*** (1.029)
-3.425*** (1.005)
-3.38*** (1.041)
-3.238*** (1.008)
-3.392*** (1.01)
-3.095*** (0.791)
Inflation rate
-0.011*** (0.003)
-0.007** (0.003)
-0.007** (0.003)
-0.008** (0.003)
-0.006* (0.004)
-0.007** (0.003)
-0.006 (0.004)
Human capital
0.038** (0.018)
0.03* (0.018)
0.029* (0.017)
0.034* (0.018)
0.023 (0.018)
0.033* (0.017)
0.02 (0.015)
Market openness
-0.374 (1.33)
-0.67 (1.313)
-0.767 (1.307)
-0.303 (1.342)
-1.302 (1.358)
-1.132 (1.333)
-1.044 (1.278)
Voice and accountability
-0.663* (0.369)
-1.811*** (0.401)
Political stability
0.879*** (0.313)
0.66* (0.356)
Government effectiveness
1.459*** (0.467)
1.768*** (0.607)
Regulatory quality
0.447 (0.347)
0.171 (0.376)
Rule of law 1.304** (0.526)
0.071 (0.66)
Control of corruption
1.161*** (0.419)
0.659 (0.526)
Constant
7.780** (3.725)
8.181** (3.643)
12.066*** (3.664)
9.482*** (3.646)
10.001*** (3.576)
10.965*** (3.619)
9.96*** (3.078)
Time controls YES YES YES YES YES YES YES R² within 0.2050 0.2334 0.2230 0.1969 0.2058 0.2088 0.3089 R² between 0.1062 0.0727 0.1269 0.0821 0.1305 0.1295 0.2578 R² overall 0.1122 0.0903 0.1404 0.0929 0.1379 0.1419 0.2716 Normality of Residuals (prob>chi2)
0.0001 0.0000 0.0000 0.0000 0.0000 0.0000 0.0003
Ramsey – Reset (prob>chi2) 0.0459 0.3885 0.3978 0.2454 0.0205 0.0451 0.0000
Heteroscedasticity (prob>chi2) 0.0000 0.0000 0.0000 0.0000 0.0000 0.0000 0.0000
Autocorrelation (prob>F) 0.0000 0.0000 0.0000 0.0000 0.0000 0.0000 0.0000
Number of observations
176 176 176 176 176 176 176
Standard error is in parentheses. *, ** and *** denote significance at 0.10, 0.05 and 0.01 respectively.
In Table 3 we introduce the three composite governance variables
calculated by means of principal component analysis (PCA) in replacement of the

27
individual variables. The introduction of the composite governance variables does
not affect the sign and significance of the coefficients of the control variables.
The combination of individual governance variables into composite variables does
not alter the perception that governance matters for FDI in sub-Saharan Africa.
Government quality displays a clearly positive and significant coefficient, while
the association between citizens’ rights and political stability and FDI is positive,
but not significant. Finally, the combination of all six individual governance
variables, overall governance, is strongly and positively connected with FDI. This
indicates that countries with the best levels of governance in sub-Saharan Africa
are also those more likely to attract FDI, once other factors such as the presence of
natural resources, macroeconomic stability and human capital – which appear to
be the other main drivers of FDI – are taken into account.

28
Table 3: Estimation of the model (1) with the composite good governance variables.
Variables (1) (2) (3) Dependent variable: FDI inflows as a % of GDP Natural resources 0.0299***
(0.0078) 0.0287***
(0.008) 0.0296*** (0.0079)
Market size
-0.147 (0.88)
0.033 (0.897)
0.008 (0.888)
Wealth level of the population
-3.686*** (1.033)
-3.294*** (1.035)
-3.492*** (1.037)
Inflation rate
-0.0053 (0.0035)
-0.0078** (0.0036)
-0.0061* (0.0036)
Human capital
0.0303* (0.017)
0.031* (0.018)
0.029* (0.018)
Market openness -0.695 (1.305)
-0.737 (1.345)
-0.813 (1.327)
Government quality
1.007*** (0.317)
Citizens’rights and political stability
0.431 (0.299)
Overall Governance
0.574** (0.24)
Constant
11.684*** (3.704)
9.509*** (3.657)
10.578*** (3.689)
Time controls YES YES YES R² within 0.2336 0.1954 0.2153 R² between 0.0903 0.0903 0.0850 R² overall 0.1102 0.1005 0.1002 Normality of Residuals (prob>chi2) 0.0000 0.0000 0.0000
Ramsey – Reset (prob>chi2) 0.2260 0.1764 0.2285 Heteroscedasticity (prob>chi2) 0.0000 0.0000 0.0000
Autocorrelation (prob>F) 0.0000 0.0000 0.0000 Number of observations 176 176 176
Standard error is in parentheses. *, ** and *** denote significance at 0.10, 0.05 and 0.01 respectively.
In order to test whether the connection between good governance and FDI in sub-
Saharan Africa expands beyond the short-term, we introduce two different types
of analyses: a) we consider a series of annual lags in model (1) (Table 4); and b)
we analyse the connection between country-level conditions during the period
1995-2006 and FDI 10 years later (2006-2015) (Table 5).
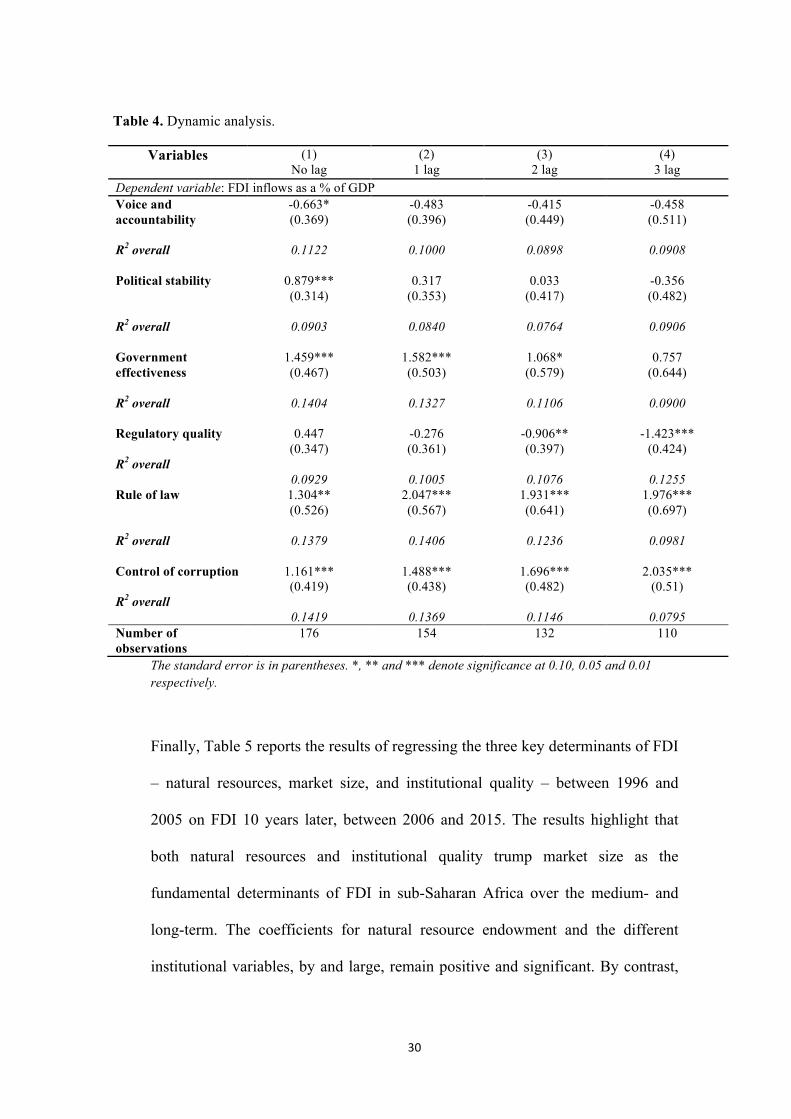
Table 4 reports only the coefficients for the six governance variables without the
controls. The introduction of time lags does not fundamentally alter the

29
coefficients of the control variables. Market size and market openness remain
insignificant in all specifications of the model, whereas the positive and
significant association between natural resources and FDI persists in time. The
same could be said for the negative connection between wealth and inflation, on
the one hand, and FDI, on the other. If anything, and as could be expected, the
coefficients tend to become somewhat weaker over time. The only control
variable which experiences a change in coefficient is human capital, which
becomes insignificant once in the first time lag is introduced in the analysis.
Regarding the governance variables, only rule of law and control of corruption
show a consistent and enduring association with FDI in sub-Saharan Africa.
Countries that effectively apply the rule of law and have better systems for the
control of corruption are capable of attracting a greater share of FDI relative to
their GDP. Investors deem it to be unlikely that the legal framework of a country
and its level of corruption can change radically in the relative short-term and
hence, once a certain level has been reached in these two areas, investors may
consider the risk that the country will regress to be generally relatively small.
Government effectiveness displays a similar behaviour, although its significance
tends to wane with time, as shown by the coefficient in the regression including
three annual lags (Regression 4). Making a government more effective is a task
that requires patience, which, in turn, renders it difficult for the newly acquired
effectiveness to collapse in the short-term.
30
Table 4. Dynamic analysis.
Variables
(1) No lag
(2) 1 lag
(3) 2 lag
(4) 3 lag
Dependent variable: FDI inflows as a % of GDP Voice and accountability R2 overall
-0.663* (0.369)
0.1122
-0.483 (0.396)
0.1000
-0.415 (0.449)
0.0898
-0.458 (0.511)
0.0908
Political stability R2 overall
0.879*** (0.314)
0.0903
0.317 (0.353)
0.0840
0.033 (0.417)
0.0764
-0.356 (0.482)
0.0906
Government effectiveness R2 overall
1.459*** (0.467)
0.1404
1.582*** (0.503)
0.1327
1.068* (0.579)
0.1106
0.757 (0.644)
0.0900
Regulatory quality R2 overall
0.447 (0.347)
0.0929
-0.276 (0.361)
0.1005
-0.906** (0.397)
0.1076
-1.423*** (0.424)
0.1255
Rule of law R2 overall
1.304** (0.526)
0.1379
2.047*** (0.567)
0.1406
1.931*** (0.641)
0.1236
1.976*** (0.697)
0.0981
Control of corruption R2 overall
1.161*** (0.419)
0.1419
1.488*** (0.438)
0.1369
1.696*** (0.482)
0.1146
2.035*** (0.51)
0.0795
Number of observations
176 154 132 110
The standard error is in parentheses. *, ** and *** denote significance at 0.10, 0.05 and 0.01 respectively.
Finally, Table 5 reports the results of regressing the three key determinants of FDI
– natural resources, market size, and institutional quality – between 1996 and
2005 on FDI 10 years later, between 2006 and 2015. The results highlight that
both natural resources and institutional quality trump market size as the
fundamental determinants of FDI in sub-Saharan Africa over the medium- and
long-term. The coefficients for natural resource endowment and the different
institutional variables, by and large, remain positive and significant. By contrast,

31
that for market size, which was insignificant in Tables 2 and 3, becomes negative
and significant at the 1% level. This implies that, once institutions and natural
resources are accounted for, large countries in Africa attract less and not more
FDI over the medium-term. Moreover, four of the six institutional quality
variables – voice and accountability, political stability, government effectiveness,
and control of corruption – seem to exert a long-lasting influence on the amount
of FDI that is directed to any particular sub-Saharan African country ten years
later (Table 5). Hence, countries with poor governance quality can endure the
consequences of their weak institutions over a considerable amount of time.
Table 5. Institutional conditions (1996-2005) and FDI 10 years later (2006-2015).
Variables (1) (2) (3) (4) (5) (6) Dependent variable: FDI inflows as a % of GDP Natural resources
0.0779*** 0.0644*** 0.0783*** 0.0644*** 0.0696*** 0.0737*** (1.499) (1.458) (1.601) (1.514) (1.592) (1.654)
Market size
-0.4599*** -0.2745*** -0.4710*** -0.3974*** -0.3788*** -0.4126*** (0.837) (0.909) (0.891) (0.848) (0.839) (0.853)
Voice and accountability
2.418*** (0.628)
Political stability
1.715*** (0.593)
Government effectiveness
2.333*** (0.884)
Regulatory quality
0.826 (0.760)
Rule of law 1.164 (0.798)
Control of corruption
1.544* (0.906)
Constant 19.34*** 12.30*** 19.80*** 16.31*** 15.90*** 17.11*** (3.380) (3.460) (3.670) (3.417) (3.338) (3.451) Time Controls
YES YES YES YES YES YES
Number of observations
220 220 220 220 220 220
Number of years
10 10 10 10 10 10
R2 overall 0.217 0.193 0.188 0.165 0.169 0.172 Standard error is in parentheses. *, ** and *** denote significance at 0.10, 0.05 and 0.01 respectively.

32
Overall, the results of the empirical analysis indicate that FDI in sub-Saharan
Africa is mainly driven by two out of the three key factors identified by the
literature. FDI flows towards countries with a good endowment of natural
resources. Hence, countries with a good endowment of natural resources but
relatively weak institutions, such as Nigeria, can still attract a considerable
amount of FDI.
But right next to natural resources is the prominent role played by governance and
institutional aspects on the attraction of FDI. Our analysis underlines that the
quality of governance of any given sub-Saharan African nation is definitely
connected to the flows of FDI entering that country. In a general manner, this is
demonstrated by the coefficient obtained for the overall governance variable,
which, in addition to being positive, is significant at 5% level. These results
regarding the importance of the quality of governance for FDI are reinforced by
the strongly significant and positive coefficients for the composite variable
government quality, as well as by those for the majority of the individual
governance variables. More stable, effective, and less corrupt governments that
uphold the rule of law act as magnets for FDI in sub-Saharan Africa. Investors
have a tendency to shy away from unstable governments, as well as from those
regarded as ineffective or where corruption is rife. A functioning legal system and
a comparatively low level of crime drive inward investment. Property rights and
the reliability of contracts are also crucial for any investor, making the rule of law
key amongst the factors driving FDI. More importantly, good institutions have a
long-lasting influence on the perception of investors, as the quality of governance
in Africa at a given point still determines FDI ten years down the line.

33
By contrast, the third key determinant of FDI in sub-Saharan Africa – market size
– does not make a difference for FDI and, if anything, it may be detrimental for
foreign investment. This may be related to the fact that even the largest markets in
the region are too small to influence investment decisions, and because many
foreign firms export their products outside the countries where they invest in and
out of sub-Saharan Africa as a whole. If certain commodity-rich countries have a
relatively large market compared to the rest of the region, such as Nigeria or
South Africa, this is not necessarily the case for most other countries well-
endowed with natural resources. Hence a country like Gabon, where oil and
mining products made up more than 80% of exports between 1996 and 2005
(WTO, 2017), remains a tiny market5 and one with low prospects for significant
expansion. Investors in sub-Saharan Africa are first and foremost concerned with
the presence of natural resources and the institutional conditions which would
guarantee their investment. Whether these countries have a relatively large
internal market is of secondary interest and thus irrelevant in the context of our
analysis.
The coefficients for the remaining control variables suggest that investors are
attracted to poor countries, reinforcing the idea that getting returns from relatively
well-off local markets is not one of the main objectives. FDI also takes the level
of human capital into consideration. Everything else being equal, foreign investors
prefer countries with a relatively good level of education of the labour force to
those where the levels of skills are lower. Macroeconomic stability is also a key
determinant of FDI, confirming the results of the literature. Multinational
5GDP of US$8,7 billion in current prices in 2008 (IMF, 2009).

34
companies and foreign investors will have an interest in avoiding unstable
markets. Last but not least, the openness of a local market does not seem to
influence the amount of FDI being channelled to specific sub-Saharan African
countries. This may also be the result that in sub-Saharan Africa even the most
open countries on paper do not necessarily have policies in place conducive to
greater trade. Countries such as the Ivory Coast, Gabon, Ghana, Mauritius, Togo,
and Zimbabwe rank amongst the most open in the Continent, but still make a
motley crew in terms of the levels of trade and political stability.
6. Conclusion
The aim of this article has been to look at the determinants of FDI in sub-Saharan
Africa, paying special attention to the role played by institutional factors and the
quality of governance in this respect. The econometric analysis, applied to a total
of 22 sub-Saharan African countries for the period between 1996 and 2015,
identifies the presence of natural resources, of a degree of macroeconomic
stability and of a good level of human capital as important assets for sub-Saharan
African countries in their efforts to attract FDI. The size, internal wealth, and
openness of a market, however, play an insignificant or, in some cases, negative
role for FDI.
The most important finding of the paper relates, however, to the key variable of
interest; quality of governance. Despite being somewhat neglected by the
literature on FDI in sub-Saharan Africa in the past, we have been able to prove
that the quality of local governance plays a non-negligible role in the distribution

35
of FDI in sub-Saharan Africa. Stable, more credible and effective, and less corrupt
regimes greatly encourage and facilitate FDI, as does having a sound and effective
legal system in which investors can place their trust. And the positive effects of
good institutions on FDI endure over a considerable amount of time.
African leaders are becoming increasingly aware of the importance of local
institutions for FDI and are adopting measures aimed at not only improving their
countries FDI intake, but also securing a more steady and sustainable inflow of
investment. This evolution towards better governance and a greater respect for
citizens’ and investors’ rights is a means to arrive to a more just and sustainable
society and also gives reason for hope that investors will eventually change their
perception of sub-Saharan Africa and allocate a greater share of global FDI to the
region. In that case, a snowball effect could even ensue, with more inward
investment signalling both the conduciveness of an environment to FDI and good
perspectives for economic and employment growth in the future. Even so, it
should be kept in mind that such a phenomenon, which would enable the countries
of the region to make their economies more diverse and more dynamic, will only
materialise if Africa’s leaders and its population as a whole display a clear
willingness to address the institutional shortcomings that have plagued the
development of the Continent and to make sure that any institutional
improvements remain over time.

36
Acknowledgements
We are grateful to Tomaz Ponce Dentinho, the editor in charge of the manuscript,
and to the anonymous reviewers for their incisive and challenging suggestions to a
previous version of the manuscript.

37
Reference list
Anyanwu, J. C., and Yameogo, N.D. (2015): ‘What Drives Foreign Direct Investments into West Africa? An Empirical Investigation’. African Development Bank. JEL Classification: F21, F23, O19
Asiedu, E. (2002): ‘On the Determinants of Foreign Direct Investment to Developing Countries: Is Africa Different?’ World Development, 30, 1: 107-119.
Asiedu, E. (2004): ‘Policy Reform and Foreign Direct Investment in Africa: Absolute Progress but Relative Decline’. Development Policy Review, 22, 1: 41-48.
Asiedu, E. (2006): ‘Foreign Direct Investment in Africa: The Role of Natural Resources, Market Size, Government Policy, Institutions and Political Instability’. The World Economy, 29,1: 63-77.
Asiedu, E. and Lien, D. (2011). ‘Democracy, foreign direct investment and natural resources’. Journal of International Economics, 84: 99-111.
Basu, A., and Srinivasan, K. (2002): ‘Foreign Direct Investment in Africa - Some Case Studies’. IMF Working Paper WP/02/61. IMF: Washington, D.C.
Bende-Nabende, A. (2002): ‘Foreign Direct Investment Determinants in Sub-Saharan Africa: A Co-integration Analysis’. Economics Bulletin, 6, 4: 1-19.
Cotton, L., and Ramachandran, V. (2001): ‘Foreign Direct Investment in Emerging Economies: Lessons from sub-Saharan Africa’. UNU/WIDER Discussion Paper N° 2001/82.
Ezcurra, R. and Rodríguez-Pose, A. (2014a) Trade openness and spatial inequality in emerging countries. Spatial Economic Analysis, 9, 2: 162-182.
Ezcurra, R. and Rodríguez-Pose, A. (2014b) Government quality and spatial inequality: A cross-country analysis. Environment and Planning A 46, 7: 1732-1753.
Jenkins, C., and Thomas, L. (2002). ‘Foreign Direct Investment in Southern Africa: Determinants, Characteristics and Implications for Economic Growth and Poverty Alleviation’. http://www.csae.ox.ac.uk/reports/pdfs/rep2002-02.pdf.
Kaufmann, D., Kraay, A., and Mastruzzi, M. (2008): ‘Governance Matters VII: Aggregate and Individual Governance Indicators 1996-2007’. World Bank Policy Research Working Paper 4654. World Bank : Washington : D.C.
Li, Q., & Resnick, A. (2003). ‘Reversal of Fortunes: Democratic Institutions and Foreign Direct Investment Inflows to Developing Countries’. International Organization, 57(1), 175-211. doi:10.1017/S0020818303571077
Muco, S. (2008): ‘Tertiary Education Indicators’. Ibrahim Index of African Governance. http://www.moibrahimfoundation.org/en/section/the-ibrahim-index.
Ndikumana, L. and Verick, S. (2008): ‘The Linkages between FDI and Domestic Investment: Unravelling the Developmental Impact of Foreign Investment in Sub-Saharan Africa’. IZA Discussion Paper N°3296. IZA: Bonn.

38
Putnam, R. D. (1994). Making democracy work: Civic traditions in modern Italy. Princeton: Princeton University Press.
Rodríguez-Pose, A. (2013) Do institutions matter for regional development? Regional Studies, 47, 7: 1034-1047.
United Nations Conference for Trade and Development. (2000): Action taken by the Trade and Development Board 2000. UNCTAD: Geneva.http://www.unctad.org/Templates/webflyer.asp?docid=2495&intItemID=1956&lang=1
United Nations Conference for Trade and Development. (2007): ‘Report of the expert
meeting on foreign direct investment in natural resources’. Report of the meeting held from November 20-22, 2006 in Geneva, published on January 24, 2007 by UNCTAD.
World Bank. (2017): The World Bank database. World Bank: Washington, D.C. http://data.worldbank.org
World Trade Organisation (2017): Interactive Database of the World Trade Organisation. WTO: Geneva. http://stat.wto.org/StatisticalProgram/WSDBStatProgramHome.aspx?Language=E.

39
Annex 1. Principal component analysis. Governance variables
Annex 1a: Quality of government
Eigenanalysis of the Correlation Matrix – Quality of government
PC1 PC2 PC3
Eigenvalue 2.3659 0.4642 0.1698
Proportion 0.7887 0.1547 0.0566
Cumulative 0.7887 0.9434 1.000
Coefficients of the PCA
Variable PC1 PC2
Government effectiveness 0.6139 -0.0902
Regulatory quality 0.5475 0.7643
Control of corruption 0.5687 -0.6385
Annex 1b: Citizens’ rights and political stability
Eigenanalysis of the Correlation Matrix – Citizens’ rights and political stability PC1 PC2 PC3
Eigenvalue 2.4500 0.3692 0.1807
Proportion 0.8167 0.1231 0.0602
Cumulative 0.8167 0.9398 1.0000
Coefficients of the PCA
Variable PC1 PC2
Voice and accountability 0.5691 -0.6688
Political stability 0.5616 0.7411
Rule of law 0.6006 -0.0593

40
Annex 1c: Overall governance
Eigenanalysis of the Correlation Matrix – Overall governance PC1 PC2 PC3 PC4 PC5 PC6
Eigenvalue 4.4919 0.5553 0.4779 0.2242 0.1544 0.0961
Proportion 0.7487 0.0926 0.0797 0.0374 0.0257 0.0160
Cumulative 0.7487 0.8412 0.9209 0.9582 0.9840 1.000
Coefficients des composants principaux
Variable PC1 PC2
Voice and accountability 0.4298 -0.1676
Political stability 0.3622 0.8410
Government effectiveness 0.4282 -0.4293
Regulatory quality 0.3806 -0.1282
Rule of law 0.4394 0.1710
Control of corruption 0.4034 -0.1862