Embed Size (px)
Citation preview

48
ORIGINAL ARTICLE JUMMEC 2021:24(2)
THE DETERMINANTS OF HEALTH SERVICES DEMAND IN INDONESIA: AN ANALYSIS OF INDONESIA FAMILY
LIFE SURVEY 5 (IFLS)
Idris H1, Misnaniarti1, Budi IS1, Ainy A1, and Safriantini D1.1Department of Health Policy and Administration, Faculty of Public Health, Sriwijaya University, Indralaya, Ogan Ilir, South Sumatera 30662, Indonesia
Correspondence:Haerawati Idris,Department of Health Policy and Administration,Faculty of Public Health,Sriwijaya University, Indralaya, Ogan Ilir,South Sumatera 30662, IndonesiaEmail: [email protected]
AbstractMany countries are trying to achieve Universal Health Coverage. Indonesia wanted to do this by implementing National Health Insurance in 2014. The purpose of this study is to explore the demand for health services based on visits to service providers, for both outpatient and inpatient care. This study used secondary data from wave five of the Indonesia Family Life Survey (IFLS). The sample used in this study comprised 34,177 individuals who were aged >15 years old. In this study, the demand for health services was measured based on whether respondents had visited a healthcare facility and their number of visits to healthcare facilities. Data was analysed using bivariate analysis with chi-square and multivariate analysis using the negative binomial regression model and probit model. The proportion of respondents visiting healthcare facilities for outpatient care was 16%, while for inpatient visits it was 5%. Both models produced almost the same effect in indicating the probability of individuals visiting a healthcare facility and their number of visits. Age, gender, marital status, education level, economic level, having health insurance, region, health status, chronic disease, and the number of diseases were statistically significant (P < 0.001) in influencing outpatient service demand. Age, gender, marital status, education level, economic level, having health insurance, regional status, health status, and the number of diseases were statistically significant (P < 0.001) in influencing inpatient service demand. Individual characteristics, demographics, and health status were independent factors associated with demand for healthcare services. The government should consider these factors in expanding health service demand in Indonesia.
Keywords: Demand, Health Services, Outpatient, Inpatient, Negative Binomial, Probit
IntroductionEvery citizen has a human right to obtain social protection, including access to health services. However, about 75% of the world’s population is unprotected in social security, and around 40% lack the necessary protection. The international labour organization (ILO) for countries to define minimum social security benefits including those for health. Meanwhile, the momentum for achieving Universal Health Coverage (UHC) is increasing. UHC is a system whereby each person obtains health services without financial constraints (1). Many countries are trying to achieve UHC, including Indonesia.
The utilization of health facilities and allocation of family expenses for health in Indonesia is still relatively low compared to other Southeast Asian countries. The low levels of these indicators has arisen because of the
variations between populations. Households in Indonesia only allocate 2% of their monthly expenditure to health services. The small health expenditure makes some people in low income groups very vulnerable to the occurrence of health shock, which then triggers a decline in health and a depreciation of human resources (2).
From the economic viewpoint, health is considered as capital to work. Health is essential for everyone, regardless of their position and profession. Everyone has the right and obligation to obtain health services to an optimal degree. In terms of meeting health service needs, the state has a responsibility to guarantee this right. It is stated in article 28 H (1) of the 1945 Constitution that “everyone has the right to live in physical and spiritual prosperity, to live, and to get a good and healthy environment and the right to receive health services.”(3).

49
JUMMEC 2021:24(2)ORIGINAL ARTICLE
Several studies related to the use of health services have explored this issue starting in the 1980s. Gani’s survey found that per capita expenditure affects the tendency to use traditional or modern health care facilities (4). The higher the per capita expenditure, the more likely the individual is to choose and pay for modern health services compared to traditional health services. The price factor or cost of healthcare also affects the number of visits to service facilities (5). Another study used data derived from an analysis of the utilization of physician services in Italy by looking at providers of two different classes of health service: public and private. This study controlled for individual health and needs and found that variables such as economic level, education, private insurance, and supply characteristics determined these services (6). A study conducted by Anyanwu related to health service demand in Nigeria reported that prices were negative in relation to demand, increased income decreased the demand for private health services; travel time did not have a significant effect. In general, the length of service reduced demand, and waiting time influenced visits to health services (7). Most of the literature about the demand for health services has just focused on modern health care. There are a limited number of studies focusing on the demand for healthcare services based on type of health service. We want to add to the value of this study by exploring the demand for health services with regards to two outcomes: whether respondents had visited a healthcare facility and their number of visits based on outpatient and inpatient healthcare consumption.
The demand for healthcare services is demonstrated by the degree of genuine utilization of these services by individuals when confronting sickness/injury. This utilization could vary according to demand factors, such as pay, cost of care, training, regular practices and customs, and the quality and suitability of the administration (8, 9). It is from a multidimensional viewpoint that an individual makes a choice in the event of ailment/injury (10). Exploring the determinants of demand for health care services would enable the introduction and implementation of an appropriate health policy to improve better utilization of health care services in Indonesia. This study will enable the Indonesian government and other governments to better understand health service demand in order to expand health service demand in Indonesia. This study aims to explore the determinants of health service demand in Indonesia based on outpatient and inpatient healthcare consumption.
Materials and MethodsThis study used quantitative data-based analytics. The data for the study was secondary data sourced from the Indonesian Family Life Survey (IFLS) 2014 wave five. The IFLS is an Indonesian household socio-economic survey. This survey was initially carried out in 13 of the 27 provinces in Indonesia at that time. The 13 areas were divided into three geographical regions of Indonesia, namely the Java-Bali region consisting of DKI-Jakarta, West Java, Central
Java, DI Yogyakarta, East Java, and Bali, the Sumatra region consisting of North Sumatra, West Sumatra, South Sumatra, and the Lampung provinces, and the Eastern Indonesia Region (KTI) consisting of West Nusa Tenggara, South Kalimantan, and South Sulawesi Provinces (11).
The sample used in this study comprised 34,177 individuals who were aged > 15 years old. We measured the demand for health services in relation to two outcomes: visit to a health care service and number of visits to a health care service. Health care services were divided into outpatient and inpatient services. Statistical analysis of the data used a bivariate test with chi-square, and a multivariate test using the negative binomial regression model and probit model.
For outcome 1, we used the dependent variable, visit to a health care service (binary). We used dependent variable dummy 1 if the respondent visited a healthcare service and 0 if they did not visit one, hence we used the probit analysis model. This is a type of regression used to analyze a binary response variable. For outcome 2, we measured the demand for health services using the dependent variable, number of visits (0,1,2,3,...). We applied the negative binomial regression model to the health care utilization variable with the dependent variable using count data for the number of visits. We applied two models for health services, for both outpatient and inpatient healthcare consumption. The analysis in this study used statistical software STATA 12.
VariableWe divided the dependent variable in this study according to two outcomes. First, we used the number of visits (outpatient and inpatient), and second the type of healthcare visit (outpatient or inpatient). The number of visits to health services was recorded as count data, starting from 0,1,2,3,... The number of outpatient visits was constructed from the question: How many times did you visit a public hospital, public health center (Puskesmas), private hospital, clinic, health worker, or doctor’s practice during the last four weeks? The number of inpatient visits was constructed from the question: How many times have you received inpatient care at a public hospital, public health center, private hospital, and private clinic during the past 12 months?
Then, we used the dependent variable, visit to a health care service. The outpatient visit was scored ‘yes’ if the individual reported having visited a public hospital, public health center (Puskesmas), private hospital, clinic, health worker, or doctor’s practice in the past four weeks. The variable was scored ‘no’ if this was not the case. For inpatient visits, the variable was scored ‘yes’ if the individual reported having received inpatient care at a public hospital, public health center (Puskesmas), private hospital, or clinic in the past 12 months. The variable was scored ‘no’ if this was not the case. The outpatient visit was 1 if the individual visited a health facility in the last month. The inpatient visit was 1 if the individual visited a health facility within the last year.

50
ORIGINAL ARTICLE JUMMEC 2021:24(2)
The independent variables consisted of sex, age, marital status, economic status, education level, regional status, region, health insurance, and health status. Sex was divided into 1 if a respondent was male, and 0 if female. Age was divided into 1 if a respondent was 15-24 years old, 2 if the respondent was 25-34 years old, 3 if the respondent was 35-44 years old, 4 if the respondent was 45-54 years old, 5 if the respondent was> 54 years old. Marital status was divided into 1 if the respondent was married, 0 if not married/widow/widower. Economic status was dichotomized according to per capita expenditure (PCE), which was constructed from the monthly total household expenditures divided by number of household members (12). A respondent was categorized 1 if poor, had a PCE below the poverty line, and 0 if the respondent had a PCE above the poverty line. Education level was divided into three groups, namely 1 (low education) if the respondent had a primary education/attended elementary school. 2 (middle education) if the respondent had a junior or senior high school education, 3 (high education) if the respondent had a college education (13). Regional status was divided into 1 if the respondent was living in an urban area, 0 if living in a rural area. Region was divided into three main areas in Indonesia: 1 if the respondent lived in Java/Bali, 2 if Sumatra, and 3 if the Eastern region. Health insurance was 1 if the respondent had health insurance, 0 if they did not have health insurance. Health status was divided into three variables: health perception, having a chronic disease, and number of diseases. Health status was determined according to the perceptions of the patients when they were surveyed. Information about health status was obtained from self-reported information about current health status based on responses to the five-point Likert scale question ‘In general, how is your health?’ (answers ranged from very healthy (1), somewhat healthy (2), somewhat unhealthy (3), very unhealthy (4). We categorized individuals into 1 healthy if the response was very healthy or somewhat healthy, 0 sick if the response was somewhat unhealthy or very unhealthy. Number of diseases was constructed from the information on chronic disease. We determined the number of chronic diseases based on the question: Has a doctor/paramedic/nurse/midwife ever told you that you have a type of chronic disease (hypertension, diabetes or high blood sugar, tuberculosis (TBC), asthma, other lung conditions, heart attack, coronary heart disease, angina, or other heart problems, liver, stroke, cancer or malignant tumor, arthritis/rheumatism, uric acid/gout, depression? Answer: yes or no. Reponses were then divided into 0 if the respondent did not have a chronic disease. 1 if the respondent had 1-2 chronic diseases, 2 if the respondent had 3-4 chronic diseases, 3 if the respondent had > 4 chronic diseases. We categorized individuals having a chronic disease with 1 if the respondent having a or more chronic disease dan 0 if the respondent did not have a chronic disease.
Research model
Demand model for health servicesTwo approaches are commonly used in analysing the demand for health services (5). The first is the agency relationship approach, also known as the supplier-induced demand model, while the second approach is the investment model proposed by Grossman. The first approach says that the patient’s role is minimal compared to the health expert’s or doctor’s role in shaping the demand for health services. In contrast, Grossman notes that the patient has enough information and freedom to determine his or her demand.
Demand according to the Grossman ModelAccording to Grossman (14), demand for health services is a derivation of demand for health itself, which, according to Becker’s terminology, is a necessary commodity. Using this basic understanding, Grossman constructed his consumer behavior theory using the human capital approach where the electoral area is expanded to include health status selection.
The Grossman model assumes that each individual evaluates the benefits of health expenditure compared with other commodity expenditure to determine their optimal health status. In this case, the consumer is assumed to know their health status and production function, which links health improvement to health service expenditure. In addition, Grossman conducted tests considering education variables and also the benefits of healthy consumption.
Based on Grossman, a person’s utility function is assumed to depend on commodity consumption and time of illness. The time of illness, in turn, depends on the level of health capital. Net investment in the stock of health capital depends on gross investment, depreciation, and environmental factors. Individuals are assumed to generate total investment in health by combining their own time with medical services and payment for food. This formula raises structural demands for lowered health demand for medical services. The equation for the reduced demand for medical services can be derived from the structural demands. It can be described as:
Mr = m r (Pm, Pf, P time, t, X, E), (1) ……………………… (1)
Where Mr stands for the demand for medical services. Pm is the price of medical services. Pf stands for food prices. P time is the opportunity cost of time. t stands for age. X is a vector of environmental factors. E is a variable that affects health investment productivity, such as the stock of human capital (15).

51
JUMMEC 2021:24(2)ORIGINAL ARTICLE
Demand according to the Agency Relationship ModelThe Agency relationship approach is one where the doctor acts as agent. The patient lacks information about everything that concerns health services. This is caused by the commodity nature of uncertain health services and lack of knowledge on the part of the patient and other traits, ultimately demanding doctors. This approach then acts as a process for combining aspects of the cost burden, impact benefits, and decision making from cost-benefit calculations.
The demand for medical services can be measured in different ways. This study adopted the estimation model constructed by Fabbri et al., which explains the two models above (6). The first model uses the negative binomial regression model measured by the number of visits, both positive and non-positive (number 0). The estimation test uses the MLE (maximum likelihood estimation). The econometric equation is as follows:
Nv = α + B 1 gender + B 2 age_1 + B 3 age_2 + B 4 age_3 + B 5 age_4 + B 6
age_5 + B 7 marital status + B 8poor + B 9 edu_1 + B 10edu_2 + B 11 edu_3 + B 12area_status + B 12region1+ B 13region2 + B 14region3 + B 15 health insurance + B 16 health_status + B 17 chronic disease + B 18 symptom_1 + B 19 symptom_2 + B 20
symptom_3 + B 21symptom_4 ………………………………………… (2)
Nv = Number of visits (0 , 1, 2, 3 ……… n)
This study looked at the demand model of health services using the count data regression model. The estimation test used a negative binomial regression model based on the number of visits to health facilities, both outpatient and inpatient. This model is useful for estimating the demand for health services where the dependent variable is the number of events or rate (incidence) of the independent variables that exist. This estimation test uses the maximization of maximum likelihood. Because the mean number of outpatient visits and inpatient visits was greater than the variance value, overdispersion or heteroscedasticity arose. Hence, the Poisson model was not suitable for use. Therefore, the authors used the binomial negative regression model.
The second model used the Hurdle model (contact decisions & visit frequency decisions). The Hurdle model is also called the “two-part model” (2 PM). This model was introduced by Mullahy (15) and popularized by the Rand Health Insurance Experiment. It is an alternative method related to the number of events that have “zero excess.” This study used the Hurdle model. The use of the model is based on a person’s two-part decision to visit a health care facility, namely the individual’s decision to contact (visit or not) a health care facility and the individual’s choices based on frequency of visits to the facility. The decision to visit / contact reflects the patient’s ‘individual decision only’ while frequency of visits reflects the doctor’s results and joint decisions with the patient.
This model is used when the highest incidence is 0. In this study, it was found that the number of visits had a high number of 0 for both outpatient and inpatient care. The step used in this model is the probit logit model.
The econometric equation is as follows:
Nd = α + B 1 gender + B 2 age_1 + B 3 age_2 + B 4 age_3 + B 5 age_4 + B 6
age_5 + B 7 marital status + B 8poor + B 9 edu_1 + B 10edu_2 + B 11 edu_3 + B 12area_status + B 12region1+ B 13region2 + B 14region3 + B 15 health insurance + B 16 health_status + B 17 chronic disease + B 18 symptom_1 + B 19 symptom_2 + B 20 symptom_3 + B 21symptom_4 ………………………………………… ………………………………………. (2)
Nd = dummy visit: 1 when making visits to health care facilities, 0 = did not visit.
Results
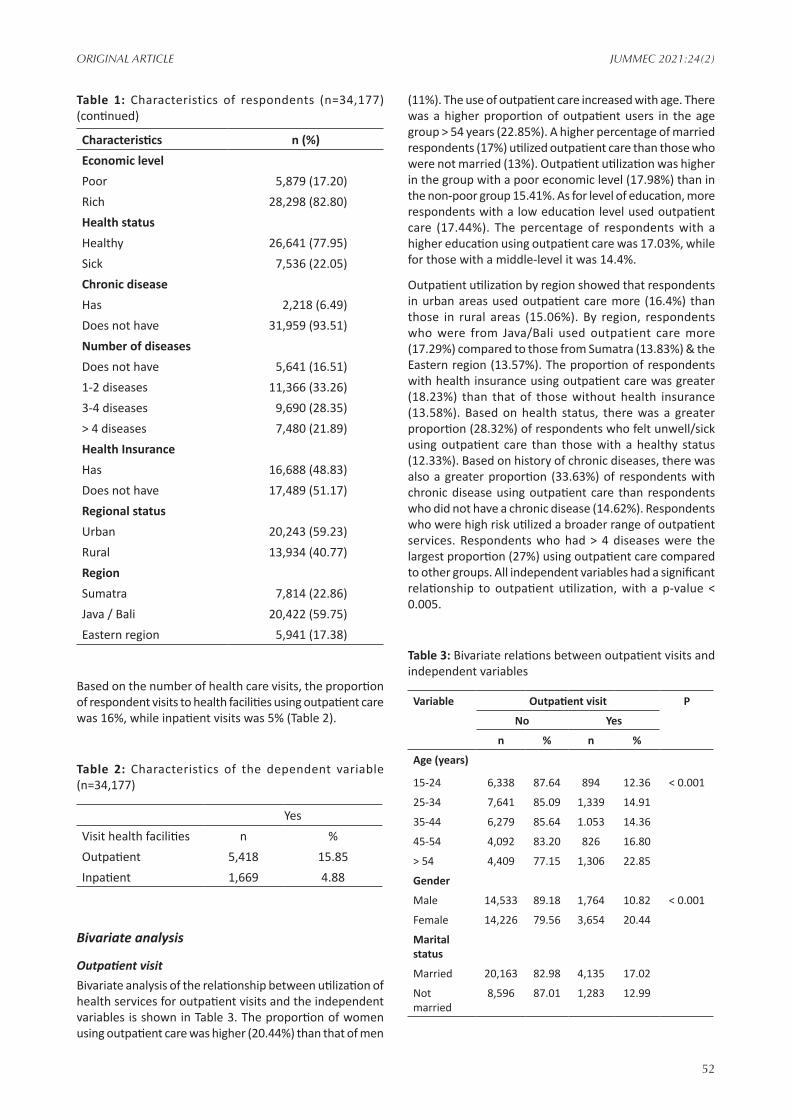
Univariate analysisThe characteristics of the respondents in this study can be seen in Table 1. The number of respondents was 34,177. The majority of respondents were female (52.32%). Most of the respondents were aged 25-34 years old (26.27%), and 71.09% were married. A majority of the respondents had a middle-level education (50.43%). A higher proportion of individuals lived in urban areas (59.23%). By region, the majority of respondents lived in the Java Bali region (59.75%). Wealthy groups were dominant (82.80%). Based on health status, the percentage of respondents who felt sick/unwell was 22.05%, 6.49 % had a chronic disease, and 48.83% had health insurance. The majority of respondents had 1-2 diseases (33.26%).
Table 1: Characteristics of respondents (n=34,177)
Characteristics n (%)Gender Male 16,297 (47.68) Female 17,880 (52.32)Marital status Married 24,298 (71.09) Not married 9,879 (28.91)Education Level Low 12,479 (36.51) Middle 17,235 (50.43) High 4,463 (13.06)Age Group 15-24 years old 7,232 (21.16)25-34 years old 8,980 (26.27)35-44 years old 7,332 (21.45)45-54 years old 4,918 (14.39)> 54 years old 5,715 (16.72)
52
ORIGINAL ARTICLE JUMMEC 2021:24(2)
Characteristics n (%)Economic level Poor 5,879 (17.20)Rich 28,298 (82.80)Health status Healthy 26,641 (77.95)Sick 7,536 (22.05)Chronic disease Has 2,218 (6.49)Does not have 31,959 (93.51)Number of diseases Does not have 5,641 (16.51)1-2 diseases 11,366 (33.26)3-4 diseases 9,690 (28.35)> 4 diseases 7,480 (21.89)Health Insurance Has 16,688 (48.83)Does not have 17,489 (51.17)Regional status Urban 20,243 (59.23)Rural 13,934 (40.77)Region Sumatra 7,814 (22.86)Java / Bali 20,422 (59.75)Eastern region 5,941 (17.38)
Based on the number of health care visits, the proportion of respondent visits to health facilities using outpatient care was 16%, while inpatient visits was 5% (Table 2).
Table 2: Characteristics of the dependent variable (n=34,177)
YesVisit health facilities n %Outpatient 5,418 15.85Inpatient 1,669 4.88
Bivariate analysis
Outpatient visitBivariate analysis of the relationship between utilization of health services for outpatient visits and the independent variables is shown in Table 3. The proportion of women using outpatient care was higher (20.44%) than that of men
(11%). The use of outpatient care increased with age. There was a higher proportion of outpatient users in the age group > 54 years (22.85%). A higher percentage of married respondents (17%) utilized outpatient care than those who were not married (13%). Outpatient utilization was higher in the group with a poor economic level (17.98%) than in the non-poor group 15.41%. As for level of education, more respondents with a low education level used outpatient care (17.44%). The percentage of respondents with a higher education using outpatient care was 17.03%, while for those with a middle-level it was 14.4%.
Outpatient utilization by region showed that respondents in urban areas used outpatient care more (16.4%) than those in rural areas (15.06%). By region, respondents who were from Java/Bali used outpatient care more (17.29%) compared to those from Sumatra (13.83%) & the Eastern region (13.57%). The proportion of respondents with health insurance using outpatient care was greater (18.23%) than that of those without health insurance (13.58%). Based on health status, there was a greater proportion (28.32%) of respondents who felt unwell/sick using outpatient care than those with a healthy status (12.33%). Based on history of chronic diseases, there was also a greater proportion (33.63%) of respondents with chronic disease using outpatient care than respondents who did not have a chronic disease (14.62%). Respondents who were high risk utilized a broader range of outpatient services. Respondents who had > 4 diseases were the largest proportion (27%) using outpatient care compared to other groups. All independent variables had a significant relationship to outpatient utilization, with a p-value < 0.005.
Table 3: Bivariate relations between outpatient visits and independent variables
Variable Outpatient visit P
No Yes
n % n %
Age (years)
15-24 6,338 87.64 894 12.36 < 0.001
25-34 7,641 85.09 1,339 14.91
35-44 6,279 85.64 1.053 14.36
45-54 4,092 83.20 826 16.80
> 54 4,409 77.15 1,306 22.85
Gender
Male 14,533 89.18 1,764 10.82 < 0.001
Female 14,226 79.56 3,654 20.44
Marital status
Married 20,163 82.98 4,135 17.02
Not married
8,596 87.01 1,283 12.99
Table 1: Characteristics of respondents (n=34,177) (continued)

53
JUMMEC 2021:24(2)ORIGINAL ARTICLE
Variable Outpatient visit P
No Yes
n % n %
Education Level
Low 10.303 82.56 2,176 17.44 < 0.001
Middle 14,753 85.60 2,482 14.40
High 3,703 82.97 760 17.03
Regional status
Urban 16,924 83.60 3,319 16.40 < 0.05
Rural 11,835 84.94 2,099 15.06
Region
Sumatra 6,733 86.17 1,081 13.83 < 0.001
Java-Bali 16,891 82.71 3,531 17.29
Eastern region
5,135 86.43 806 13.57
Economic level
Poor 4,822 82.02 1,057 17.98 < 0.001
Rich 23,937 84.59 4,361 15.41
Health insurance
Has 13,645 81.77 3.043 18.33 < 0.001
Does not have
15,114 86.42 2,375 13.58
Health status
Healthy 23,357 87.67 3,284 12.33 < 0.001
Sick 5,402 71.68 2,134 28.32
Chronic disease
Has 1,472 66.37 746 33.63 < 0.001
Does not have
27,287 85.38 4,672 14.62
Number of diseases
Does not have
5,293 93.83 348 6.17 < 0.001
1-2 10.006 88.03 1,360 11.97
3-4 7,968 82.23 1,722 17.77
> 4 5,492 73.42 1,988 26.58
Inpatient visitBivariate analysis showing the relationship between utilization of health services for inpatient visits and the independent variables is shown in Table 4. A greater proportion (6.66%) of women used inpatient facilities
compared to men (2.93%). The use of inpatient facilities increased with age. The largest proportion of inpatient users were in the age group > 54 years (6.28%). A higher proportion of married respondents (5.28%) utilized inpatient care compared to unmarried repondents (3.92%). The utilization of inpatient services was higher in groups with an economic status in the poor category (6.94%), compared with the non-poor group 4.46%. As for education level, those with a higher education were more likely to use inpatient care (6.59%), followed by respondents with a low education (4.29%) and those with middle-level education (4.87%).
Table 4: Bivariate relations between inpatient visits and independent variables
Variable Inpatient visit P
No Yes
n % n %
Age (years) < 0.001
15-24 6.884 95.19 348 4.81
25-34 8,458 94.19 522 5.81
35-44 7,065 96.36 267 3.64
45-54 4,745 96.48 173 3.52
> 54 5,356 93.72 359 6.28
Gender
Male 15,819 97.07 478 2.93 < 0.001
Female 16,689 93.34 1,191 6.66
Marital status
Married 23,016 94.72 1,282 5.28
Not married
9,492 96.08 387 3.92
Education level
Low 11,944 95.71 535 4.29 < 0.001
Middle 16,395 95.13 840 4.87
High 4,169 93.41 294 6.59
Regional status
Urban 19,156 94.63 1,087 5.37 < 0.001
Rural 13,352 95.82 582 4.18
Region
Sumatra 7,449 95.33 365 4.67 0.600
Java-Bali 19,409 95.04 1,013 4.96
Eastern region
5,650 95.10 291 4.90
Economic status
Poor 5,471 93.06 408 6.94 < 0.001
Rich 27,037 95.54 1,261 4.46
Table 3: Bivariate relations between outpatient visits and independent variables (continued)

54
ORIGINAL ARTICLE JUMMEC 2021:24(2)
Variable Inpatient visit P
No Yes
n % n %
Health insurance
Has 15,542 93.13 1,146 6.87 < 0.001
Does not have
16,966 97.01 523 2.99
Health status
Healthy 25,573 95.99 1,068 4.01 < 0.001
Sick 6,935 92.02 601 7.98
Chronic disease
Has 1,938 87.38 280 12.62 < 0.001
Does not have
30,570 95.65 1,389 4.35
Number of disease
Does not have
5,463 96.84 178 3.16 < 0.001
1-2 10,849 95.45 517 4.55
3-4 9,200 94.94 490 5.06
> 4 6.996 93.53 484 6.47
According to region, inpatient utilization was higher for respondents in urban areas (5.37%) compared to rural areas (4.18%). By region, respondents in Java/Bali used inpatient care the most (4.96%) compared to Sumatra (4.67%) & the Eastern region (4.9%). There was a greater proportion of respondents with health insurance (7%) using inpatient care than those without health insurance (3%). Based on health status, there was a greater proportion of respondents who felt unwell/sick (8%) using inpatient care than those who were healthy (4%). Based on history of chronic diseases, there was also a greater proportion of respondents with chronic disease (12.62%) using inpatient care than respondents who did not have a chronic disease (4.35%). Respondents who were high risk used more inpatient services. Respondents who had > 4 diseases comprised the largest proportion (6.47%) of those using inpatient care compared to other groups. Age, sex, marital status, education level, regional status, economic status, having health insurance, health status, chronic disease, and number of diseases had a significant relationship with inpatient utilization with a p-value < 0.001. However, region variables did not have a significant relationship because the p-value was > 0.05.
Multivariate analysisWe used two different outcome variables. First, we measured the demand for healthcare services from the number of visits. Second, we measured healthcare service demand from whether the respondent had visited a healthcare facility (binary) for both outpatient and inpatient services. The coefficients for each variable reflect the effect of a change in each variable on the probability that the individual would demand healthcare services.
Health service demand model with dependent variable number of visitsWith reference to Table 5, we used the binomial negative regression model with the outcome variable: number of outpatient visits. The dependent variable was the number of outpatient visits. We found that the age variable had a significantly greater effect on the number of outpatient visits. The sign of the coefficient indicated that older respondents were more likely to increase their number of outpatient visits. Individuals aged ≥ 45-54 years and > 54 years old had a significantly higher number of outpatient visits (p-value < 001). The older the respondent, the higher the probability of an increased number of outpatient visits. Gender had a significant influence on the number of outpatient visits. The negative sign of the coefficient indicated that men made fewer outpatient visits than women (p-value < 0.001). Being married had a significantly greater effect on the number of outpatient visits, as compared to not being married (p-value < 0.001). Likewise, a high education level had a significantly greater effect on the number of outpatient visits (p-value < 0.05) compared to a low education level. Respondents from Sumatera and the Eastern region had fewer outpatient visits than those from Java/Bali (p-value < 0.001). Poor economic status, having health insurance, having a chronic disease, and having a number of diseases had a significantly greater effect on the number of outpatient visits (p-value < 0.001). Respondents who were healthy had a lower number of outpatient visits than those who were sick (p-value < 0.001).
Table 5: Estimates using the Binomial Negative Regression Model for number of outpatient visits
Variable Coefficient Std err ZAge (years)
15-24 (ref) 25-34 0.012 0.051 0.2435-44 -0.001 0.054 -0.0345-54 0.259 0.058 4.41 ***> 54 0.614 0.055 11.06 ***
Table 4: Bivariate relations between inpatient visits and independent variables (continued)

55
JUMMEC 2021:24(2)ORIGINAL ARTICLE
Variable Coefficient Std err ZGenderFemale(ref) Male -0,584 0.031 -18.67 ***Marital statusNot Married (ref) Married 0.358 0.039 9.12 ***Education levelLow (ref) Middle 0.058 0.037 1.54High 0.133 0.053 2.50 **Regional statusRural (ref) Urban 0.039 0.032 1.20RegionJava-Bali (ref) Sumatra -0.264 0.038 -6.80 ***Eastern region -0.291 0.042 -6.80 ***Economic levelRich (ref) Poor 0.186 0.040 4.65 ***Health insuranceDoes not have (ref)
Has 0.317 0.031 10.23 ***Health statusSick (ref) Healthy -0.877 0.033 -25.94 ***Chronic diseaseDoes not have (ref)
Has 0.654 0.050 12.92 ***Number of diseasesDoes not have (ref)
1-2 0.709 0.059 11.85 ***3-4 0.983 0.059 16.40 ***> 4 1.438 0.060 23.81 ***Number of obs 34,177 LR chi2 (17) 2843.57 Prob> chi2 0.000 Pseudo R2 0.0679 Log-likelihood -19419
*Statistical significance:* significant at level 10%; * * significant at level 5%; *** significant at level 1%, ,std err: Standar Error, Z:z-score
With reference to Table 6, we used the binomial negative regression model with the outcome variable: number
of inpatient visits. The age variable had a significant association with the number of inpatient visits. Individuals who were 35-44 and 45-54 years old had fewer inpatient visits than individuals who were 15-24 years old (p-value < 0.001). Individuals who were > 54 years old had a significantly higher number of inpatient visits than individuals who were 15-24 years old (p-value < 0.001). Gender had a significant effect on number of inpatient visits. The coefficient’s negative sign indicated that men had a lower number of inpatient visits than women (p-value < 0.001). Married people had a significantly higher number of inpatient visits than those who were unmarried (p-value < 0.001). Likewise, a middle and high education level had a significantly greater effect on the number of inpatient visits than a low education level (p-value < 0.05). Residing in an urban area had a significantly greater effect on the number of inpatient visits (p-value < 0.05). Respondents who were healthy had a lower number of inpatient visits than those who were sick (p-value < 0.001). Poor economic status, having health insurance, and the number of diseases were associated with a significantly higher number of inpatient visits (p-value < 0.001).
Table 6: Estimates using the Binomial Negative Regression Model for number of inpatient visits
Variable Coefficient Std err Z
Age (years)
15-24 (ref)
25-34 -0,032 0.090 -0.36
35-44 -0,377 0.100 -3.76 ***
45-54 -0,434 0.113 -3.83 ***
> 54 0.372 0.100 3.71 ***
Gender
Female (ref)
Male -0,783 0.059 -13.20 ***
Marital status
Not Married (ref)
Married 0.385 0.072 5.31 ***
Education level
Low (ref)
Middle 0.207 0.072 2.87 **
High 0.278 0.097 2.85 **
Regional status
Rural (ref)
Urban 0.140 0.061 2.28 **
Region
Java-Bali (ref)
Sumatra 0.028 0.069 0.40
Eastern region 0.129 0.075 1.71 *
Table 5: Estimates using the Binomial Negative Regression Model for number of outpatient visits (continued)

56
ORIGINAL ARTICLE JUMMEC 2021:24(2)
Variable Coefficient Std err Z
Economic level
Rich (ref)
Poor 0.359 0.071 5.05 ***
Health insurance
Does not have (ref)
Has 0.753 0.058 12.86 ***
Health status
Sick (ref)
Healthy -0.746 0.065 -11.45 ***
Chronic disease
Does not have (ref)
Has 0.916 0.088 10.34
Number of diseases
Does not have (ref)
1-2 0.305 0.096 3.16 **
3-4 0.307 0.098 3.12 **
> 4 0.487 0.101 4.80 ***
Number of obs 34,177
LR chi2 (17) 748.60
Prob> chi2 0.000
Pseudo R2 0.049
Log-likelihood -7245
*Statistical significance:* significant at level 10%; * * significant at level 5%; *** significant at level 1%,std err: Standar Error, Z:z-score
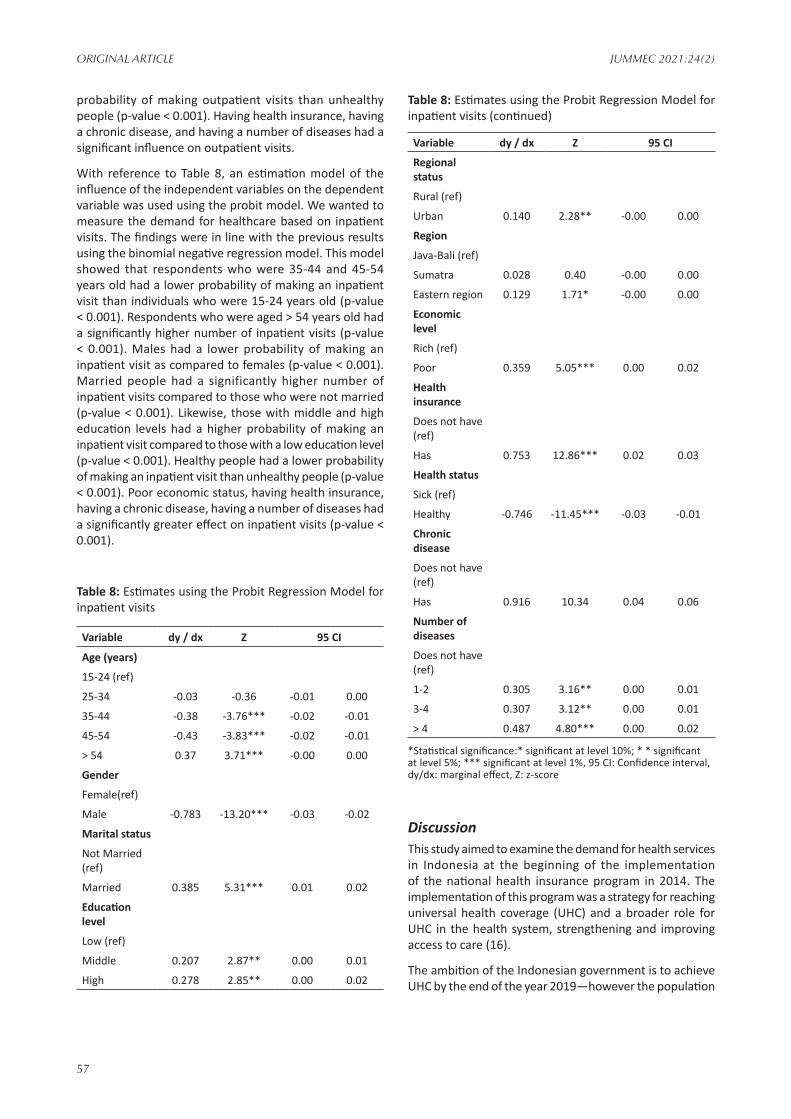
Health service demand model with dependent variable binary outpatient visitWith reference to Table 7, an estimation model of the independent variables’ influence on the dependent variable was used using the probit model. We wanted to measure the demand for healthcare based on outpatient visits. The findings were in line with previous results using the binomial negative regression model. Respondents being > 54 years old had a significant influence on outpatient visits (p-value < 0.001). There was a lower probability of males making outpatient visits as compared to females. Married people had a higher probability of making an outpatient visit than those who were not married (p-value < 0.001). Likewise, those with a high education level had a greater probability of making an outpatient visit (p-value < 0.001). Those from Sumatra and the Eastern region had a lower probability of using outpatient services than those from Java/Bali (p-value < 0.001). Healthy people had a lower
Table 6: Estimates using the Binomial Negative Regression Model for number of inpatient visits (continued)
Table 7: Estimates using the Probit Regression Model for outpatient visits
Variable dy / dx
Z 95 CI
Age (years) 15-24 (ref) 25-34 -0.00 -0.32 -0.01 0.0135-44 -0.01 -1.79 * -0.02 0.0045-54 0.00 0.50 -0.01 0.01> 54 0.05 7.22 *** 0.04 0.07GenderFemale (ref) Male -0.08 -22.63 *** -0.09 -0.07Marital statusNot Married (ref) Married 0.04 11.03 *** 0.03 0.05Education levelLow (ref) Middle 0.00 1.38 -0.00 0.01High 0.02 3.45 *** 0.01 0.03Regional statusRural (ref) Urban -0.00 -1.57 -0.01 0.00RegionJava-Bali (ref) Sumatra -0.03 -8.49 *** -0.04 -0.02Eastern region -0.04 -8.85 *** -0.04 -0.03
Economic levelRich (ref) Poor 0.01 3.43 *** 0.00 0.02Health insuranceDoes not have (ref) Has 0.03 8.97 *** 0.02 0.04Health statusSick (ref) Healthy -0.09 -17.39 *** -0.10 -0.08
Chronic diseaseDoes not have (ref) Has 0.09 10.71 *** 0.07 0.11Number of diseasesDoes not have (ref) 1-2 0.07 9.75 *** 0.05 0.083-4 0.13 15.55 *** 0.11 0.14
> 4 0.20 20.78 *** 0.18 0.22
*Statistical significance:* significant at level 10%; * * significant at level 5%;*** significant at level 1%, 95 CI: Confidence interval, dy/dx: marginal effect, Z: z-score
57
JUMMEC 2021:24(2)ORIGINAL ARTICLE
probability of making outpatient visits than unhealthy people (p-value < 0.001). Having health insurance, having a chronic disease, and having a number of diseases had a significant influence on outpatient visits.
With reference to Table 8, an estimation model of the influence of the independent variables on the dependent variable was used using the probit model. We wanted to measure the demand for healthcare based on inpatient visits. The findings were in line with the previous results using the binomial negative regression model. This model showed that respondents who were 35-44 and 45-54 years old had a lower probability of making an inpatient visit than individuals who were 15-24 years old (p-value < 0.001). Respondents who were aged > 54 years old had a significantly higher number of inpatient visits (p-value < 0.001). Males had a lower probability of making an inpatient visit as compared to females (p-value < 0.001). Married people had a significantly higher number of inpatient visits compared to those who were not married (p-value < 0.001). Likewise, those with middle and high education levels had a higher probability of making an inpatient visit compared to those with a low education level (p-value < 0.001). Healthy people had a lower probability of making an inpatient visit than unhealthy people (p-value < 0.001). Poor economic status, having health insurance, having a chronic disease, having a number of diseases had a significantly greater effect on inpatient visits (p-value < 0.001).
Table 8: Estimates using the Probit Regression Model for inpatient visits
Variable dy / dx Z 95 CI
Age (years)
15-24 (ref)
25-34 -0.03 -0.36 -0.01 0.00
35-44 -0.38 -3.76*** -0.02 -0.01
45-54 -0.43 -3.83*** -0.02 -0.01
> 54 0.37 3.71*** -0.00 0.00
Gender
Female(ref)
Male -0.783 -13.20*** -0.03 -0.02
Marital status
Not Married (ref)
Married 0.385 5.31*** 0.01 0.02
Education level
Low (ref)
Middle 0.207 2.87** 0.00 0.01
High 0.278 2.85** 0.00 0.02
Variable dy / dx Z 95 CI
Regional status
Rural (ref)
Urban 0.140 2.28** -0.00 0.00
Region
Java-Bali (ref)
Sumatra 0.028 0.40 -0.00 0.00
Eastern region 0.129 1.71* -0.00 0.00
Economic level
Rich (ref)
Poor 0.359 5.05*** 0.00 0.02
Health insurance
Does not have (ref)
Has 0.753 12.86*** 0.02 0.03
Health status
Sick (ref)
Healthy -0.746 -11.45*** -0.03 -0.01
Chronic disease
Does not have (ref)
Has 0.916 10.34 0.04 0.06
Number of diseases
Does not have (ref)
1-2 0.305 3.16** 0.00 0.01
3-4 0.307 3.12** 0.00 0.01
> 4 0.487 4.80*** 0.00 0.02
*Statistical significance:* significant at level 10%; * * significant at level 5%; *** significant at level 1%, 95 CI: Confidence interval, dy/dx: marginal effect, Z: z-score
DiscussionThis study aimed to examine the demand for health services in Indonesia at the beginning of the implementation of the national health insurance program in 2014. The implementation of this program was a strategy for reaching universal health coverage (UHC) and a broader role for UHC in the health system, strengthening and improving access to care (16).
The ambition of the Indonesian government is to achieve UHC by the end of the year 2019—however the population
Table 8: Estimates using the Probit Regression Model for inpatient visits (continued)

58
ORIGINAL ARTICLE JUMMEC 2021:24(2)
of Indonesia, around 262 million inhabitants, presents unique challenges for universal health coverage. In 2014, the UHC system was introduced, and it then grew rapidly to cover 203 million people. When it has been successfully implemented, JKN (Jaminan Kesehatan Nasional; the universal health coverage system) will be the world’s largest single-payer system. The road towards implementing JKN has presented the country with unique challenges; Indonesia is a rapidly developing middle-income country with 262 million residents from 300 ethnic groups who speak 730 languages spread across 17,774 islands (16).
This study showed that the proportion of respondent visits to health facilities using outpatient care was 16%, while inpatient visits was 5%. One survey reported that eighty-one percent of hospitals had reported increased inpatient and outpatient service utilization since JKN started (17). This survey’s results are in line with a study that showed that the JKN program had increased the probability of individuals seeking outpatient and inpatient care (18). In line with information collected during the first and second quarters of 2014, the study showed increases in the utilization of primary health centers and declines in referral upward through the system in many areas (19).
The regression test results on both models showed that the probability of individuals deciding to visit/contact health care facilities for outpatient or inpatient care was almost the same as that found using the negative binomial regression model and the probit model. The results showed that individual characteristics, demographics, and health status variables influenced visits to health service facilities, both outpatient and inpatient. These variables were age > 54 years, gender, marital status, poor economic status, living in urban areas, having a higher education, having health insurance, individual health status, chronic disease, and number of diseases.
The results showed that respondents who were aged >54 years old had a higher probability of using a health service - both outpatient and inpatient. An older person would have higher health service utilization (20). The prevalence of multimorbidity increases with age and is substantial among older adults (21-24). This might be because chronic disease incidence increases with aging and impacts on an increased demand for healthcare services. Based on gender, males had a lower number of inpatient visits than females. This is consistent with a previous study (25). The influence of gender on visits to health services follows other empirical studies. In this study, women were more likely to visit outpatient and inpatient health services. This finding is consistent with a previous study (26-29). This might be because women need more healthcare services due to pregnancy and childbirth.
Having a higher education level increased the probability of using healthcare services, both outpatient and inpatient, in comparison to a low education level. This finding is consistent with other studies (24, 30, 31). This might be because educated people have a better awareness of
the importance of healthcare services (28, 32). Higher education levels will influence decision-making in relation to utilizing health care when it is needed (31, 33).
Economic level was found to be significant for poor people. This might be because of the availability of health insurance for the poor. The Indonesian government has provided subsidized health insurance for low income and vulnerable income groups (16). This is consistent with a previous study (34). Other results showed that having health insurance influenced visits to health care facilities, both outpatient and inpatient. Enrolling in a health insurance program increases the probability of seeking health care. The results of this study are in line with other studies (35-38). Not being covered by health insurance and a high economic burden will mostly delay outpatient care utilization when it is needed (31).
Respondents who stayed in urban areas had a higher probability of making an inpatient visit than those living in rural areas. This may be because people in urban areas have easy access to health care facilities. In general, individual health status - feeling sick/unwell, having a chronic disease, and number of diseases - influenced visits health care facilities, for both outpatient and inpatient care. This might be because chronic diseases tend to require sophisticated medical technology and specialist doctors. The findings above are in line with Anderson’s (39) theory, which needs factors like having a disease associated with use of healthcare. This study is in line with the findings of other studies that poor health perception has a significant relationship with health care utilization (33, 40). The results of these studies suggest that policymakers should consider these factors in increasing access to health care. We recommend an expansion of health insurance, and efforts to increase each individual’s knowledge and awareness of his/her health status, for example, through promotion and health education.
LimitationsAs this study is based on secondary data getting all the relevant information was difficult. The weakness in this study’s analysis is the unavailability of data on the price of health services, which is the primary variable that influences the demand for health services, and the service quality variables of the service providers were not yet available. The perception of quality healthcare can attract patients and be associated with the demand for healthcare services (18). The other limitation was mainly due to recall bias. The respondents were expected to recall visits to healthcare facilities during the past four weeks or an individual visit to a health facility within the last month—or within the last year for an inpatient visit.
ConclusionThis study showed that the proportion of respondents’ visits to health facilities for outpatient care was 16%, while inpatient visits was 5%. Based on the analysis, by

59
JUMMEC 2021:24(2)ORIGINAL ARTICLE
considering two outcomes, visit and number of visits, it could be seen that both outpatient and inpatient care were driven by different models. The study’s findings indicate that economic level, sex, marital status, age, education level, having health insurance, health status, chronic disease, and number of diseases are predictors of demand for healthcare services. The government should consider these factors in expanding health service demand in Indonesia.
Consent This article used secondary data, hence informed consent to participate in the study was obtained from the Indonesian Family Life Survey (IFLS).
AcknowledgmentThe authors are thankful to RAND for providing access to survey data in the IFLS-5.
Financial support We are grateful to the Faculty of Public Health, Sriwijaya University for financially supporting this study.
Competing interestsThe authors declare that they have no competing interests.
References1. Kimball M, Phily C, Folsom A, Lagomarsino G, Holtz
J. Leveraging health microinsurance to promote universal health coverage. Microinsurance Paper. International Labour Organization. 2013.
2. Sparrow R, Suryahadi A, Widayanti W. Public health insurance for the poor: targeting and impact of Indonesia’s Asheskin Programme. The Hague, Netherlands: Institute of Social Studies. 2008.
3. Musriyati N. Hak asasi manusia dalam Hukum Kesehatan di Indonesia. Gaster: Jurnal Kesehatan. 2008;4(2):304-11.
4. Gani A. Demand for health service in rural area of Karanganyar Regency, Central Java, Indonesia. Dissertation PhD. Baltimor Maryland. 1981:216-22.
5. Tjiptoherijanto P, Soesetyo B. Ekonomi kesehatan. Cet 1 Ed. Jakarta: Rineka Cipta. 1994.
6. Fabbri D, Monfardini C. Public vs. private health care demand in Italy. Giornale degli Economisti e Annli di Economia. 2002;62(1):93-123.
7. Anyanwu JC. Demand for health care institutions’ services: evidence from malaria fever treatment in Nigeria. Afr Dev Rev. 2007;19(2):304-34.
8. Nahu A. Determinants of demand for health care services and their implication on Health care financing: the case of Bure town. Ethiop J Econ. 2006;11(1):122.
9. Bello R. Determinants of demand for traditional method of health care services in Osun state: Nigeria. Ind J Soc Dev. 2005;5:203-17.
10. Andersen R, Newman JF. Societal and individual determinants of medical care utilization in the United States. Milbank Mem Fund Q Health Soc. 1973;51(1):95-124.
11. Strauss J, Witoelar F, Sikoki B. The fifth wave of the Indonesia family life survey: overview and field report. RAND Corporation. 2016. Available at: https://www.rand.org/content/dam/rand/pubs/working_papers/WR1100/WR1143z1/RAND_WR1143z1.pdf. Accessed at 19 Jan 2021.
12. Witoelar F. Note on the construction of the IFLS consumption expenditure aggregates. The World Bank Research. 2009. Available at: https://dokumen.tips/reader/f/ifls-consumption-expenditure-aggregatespdf. Accessed at 19 Jan 2021.
13. Maika A, Mittinty MN, Brinkman S, Harper S, Satriawan E, Lynch JW. Changes in socioeconomic inequality in Indonesian children’s cognitive function from 2000 to 2007: a decomposition analysis. PLoS One. 2013;8(10):e78809.
14. Grossman M. On the concept of health capital and the demand for health. J Polit Econ. 1972;80(2):223-55.
15. Mullahy J. Specification and testing of some modified count data models. J Econom. 1986;33(3):341-65.
16. Agustina R, Dartanto T, Sitompul R, Susiloretni KA, Suparmi MKM, Achadi EL, et al. Universal health coverage in Indonesia: concept, progress, and challenges. Lancet. 2018;393(10166):75-102.
17. Ross R, Koseki S, Dutta A, Nugrahani Y. Results of a survey of private hospitals in the era of Indonesia’s Jaminan Kesehatan Nasional: impact of contracting with national health insurance on services, capacity, revenues, and expenditure. Washington, DC: Palladium, Health Policy Plus; and Jakarta, Indonesia: National Team for Accelerating Poverty Reduction (TNP2K). 2018.
18. Erlangga D, Ali S, Bloor K. The impact of public health insurance on healthcare utilisation in Indonesia: evidence from panel data. Int J Public Health. 2019;64(4):603-13.
19. Mboi N. Indonesia: on the way to universal health care. Health Syst Reform. 2015;1(2):91-7.
20. Babitsch B, Gohl D, von Lengerke T. Re-revisiting Andersen’s Behavioral Model of health services use: a systematic review of studies from 1998–2011. Psychosoc Med. 2012;9:Doc11.
21. Boyd CM, Fortin M. Future of multimorbidity research: how should understanding of multimorbidity inform health system design? Public Health Rev. 2010;32(2):451.
22. Barnett K, Mercer SW, Norbury M, Watt G, Wyke S, Guthrie B. Epidemiology of multimorbidity and implications for health care, research, and medical education: a cross-sectional study. Lancet. 2012;380(9836):37-43.
23. Institute of Medicine (US) Committee on the Future Health Care Workforce for Older Americans. Retooling for an aging America: building the health care workforce. National Academies Press. 2008.

60
ORIGINAL ARTICLE JUMMEC 2021:24(2)
Available at: https://www.ncbi.nlm.nih.gov/books/NBK215401/. Accessed at 19 Jan 2021.
24. Sahn DE, Younger SD, Genicot G. The demand for health care services in rural Tanzania. Oxf Bull Econ Stat. 2003;65(2):241-60.
25. Idris H, Safitri T, Safriantini D, Trisnaini I. Determinant of health services utilization by persons with disabilities in Palembang City. EDP Sciences. 2018; 68:01010.
26. Arega T, Ababa A. The demand for curative health care in Jimma Town: choosing between healthcare providers. Thesis. Ethiopia: Addis Ababa University. 2003.
27. Muriithi MK. The determinants of health-seeking behavior in a Nairobi slum, Kenya. Eur Sci J. 2013;9(8):151-64.
28. Nugraheni WP, Hartono RK. Analisis pola layanan kesehatan rawat jalan pada tahun pertama implementasi Program Jaminan Kesehatan Nasional (JKN). Media Penelitian dan Pengembangan Kesehatan. 2017;27(1):9-16.
29. Owens G. Gender differences in health care expenditures, resource utilization, and quality of care. J Manag Care Spec Pharm. 2008;14(3):2-6.
30. Mwabu G, Wang’ombe J, Nganda B. The demand for medical care in Kenya. Afr Dev Rev. 2003;15(2-3):439-53.
31. Insaf TZ, Jurkowski JM, Alomar L. Sociocultural factors influencing delay in seeking routine health care among Latinas: a community-based participatory research study. Ethn Dis. 2010;20(2):148-54.
32. Wellay T, Gebreslassie M, Mesele M, Gebretinsae H, Ayele B, Tewelde A, et al. Demand for health care service and associated factors among patients in the community of Tsegedie District, Northern Ethiopia. BMC Health Serv Res. 2018;18(1):697.
33. Blackwell DL, Martinez ME, Gentleman JF, Sanmartin C, Berthelot JM. Socioeconomic status and utilization of health care services in Canada and the United States: findings from a binational health survey. Med Care. 2009;47(11):1136-46.
34. Cameron AC, Trivedi PK, Milne F, Piggott J. A microeconometric model of the demand for health care and health insurance in Australia. Rev Econ Stud. 1988;55(1):85-106.
35. Gaddah M, Munro A, Quartey P. The demand for public health care and the progressivity of health care services in Ghana. Afr Dev Rev. 2015;27(2):79-91.
36. Kim HK, Lee M. Factors associated with health services utilization between the years 2010 and 2012 in Korea: using Andersen’s behavioral model. Osong Public Health Res Perspect. 2016;7(1):18-25.
37. Liu M, Zhang Q, Lu M, Kwon CS, Quan H. Rural and urban disparity in health services utilization in China. Med Care. 2007;45(8):767-74.
38. Hidayat B, Pokhrel S. The selection of an appropriate count data model for modelling health insurance and health care demand: case of Indonesia. Int J Environ Res Public Health. 2010;7(1):9-27.
39. Anderson M, Dobkin C, Gross T. The effect of health insurance coverage on the use of medical services. Am Econ J Econ Policy. 2012;4(1):1-27.
40. Broyles RW, McAuley WJ, Baird-Holmes D. The medically vulnerable: their health risks, health status, and use of physician care. J Health Care Poor Underserved. 1999;10(2):186-200.