Embed Size (px)
Citation preview
Stockholm School of Economics Department of Economics Course 659: B.Sc. Thesis in Economics Spring 2010
The Determinants of Private Donations
to Humanitarian Disasters
Sana Alajmovic* and Philip Wehtje**
Abstract The aim of this study is to investigate the determinants of private donations to humanitarian disasters. We design a model on donor behaviour consisting of the determinants social distance, need for relief and awareness. To test for the impact of social distance, we use the proxy variables geographic distance, share of Christians and a culture index which is based on Geert Hofstede’s cultural dimensions. For the determinant need for relief we use the variables killed in the disaster and GDP per capita of the disaster stricken country. In order to test for awareness we chose the variable media coverage. Data on private donations to humanitarian disasters was collected from the Swedish fundraising organisation Radiohjälpen. Based on the results from our regression analyses, we conclude that awareness of a disaster through media coverage has a significant impact on private donations to humanitarian disaster whereas social distance and need for relief receive mixed support. Key words: Humanitarian disaster, donor behaviour, social distance, media coverage
Tutor: Magnus Johannesson Examiner: Örjan Sjöberg We would like to express our sincere gratitude towards our tutor Magnus Johannesson at the Stockholm School of Economics for his invaluable help and support.
Table of content
1. Introduction ............................................................................................................................ 1
1.1 Statement of purpose and delimitation ......................................................................... 2
1.2 Radiohjälpen – context and background ...................................................................... 3
2. Theory .................................................................................................................................... 4
2.1 Altruism ........................................................................................................................ 4
2.2 Social distance .............................................................................................................. 5
2.3 Need for relief .............................................................................................................. 7
2.4 Awareness .................................................................................................................... 8
2.5 Hypotheses ................................................................................................................... 9
3. Empirical method ................................................................................................................. 10
3.1 Donations – dependent variable ................................................................................. 10
3.2 Social distance – independent variable ...................................................................... 11
3.2.1 Geographic distance ............................................................................................. 11
3.2.2 Share of Christians ............................................................................................... 11
3.2.3 Culture index ........................................................................................................ 11
3.3 Need for relief - independent variable ........................................................................ 12
3.3.1 Killed .................................................................................................................... 12
3.3.2 GDP per capita ..................................................................................................... 13
3.4 Awareness – independent variable ............................................................................. 13
3.5 Disaster type – control variable .................................................................................. 13
3.6 Time –control variable ............................................................................................... 14
3.7 Method of analysis ..................................................................................................... 14
3.7.1 The Big model ...................................................................................................... 15
3.7.2 The Media Model ................................................................................................. 15
4. Results .................................................................................................................................. 16
4.1 Descriptive data .......................................................................................................... 17
4.2 Regressions on the Big sample ................................................................................... 19
4.2.1 The Big model ...................................................................................................... 19
4.2.2 Social distance ...................................................................................................... 20
4.2.3 Need for relief ...................................................................................................... 20
4.2.4 Disaster type and time .......................................................................................... 20
4.2.5 Other issues .......................................................................................................... 21
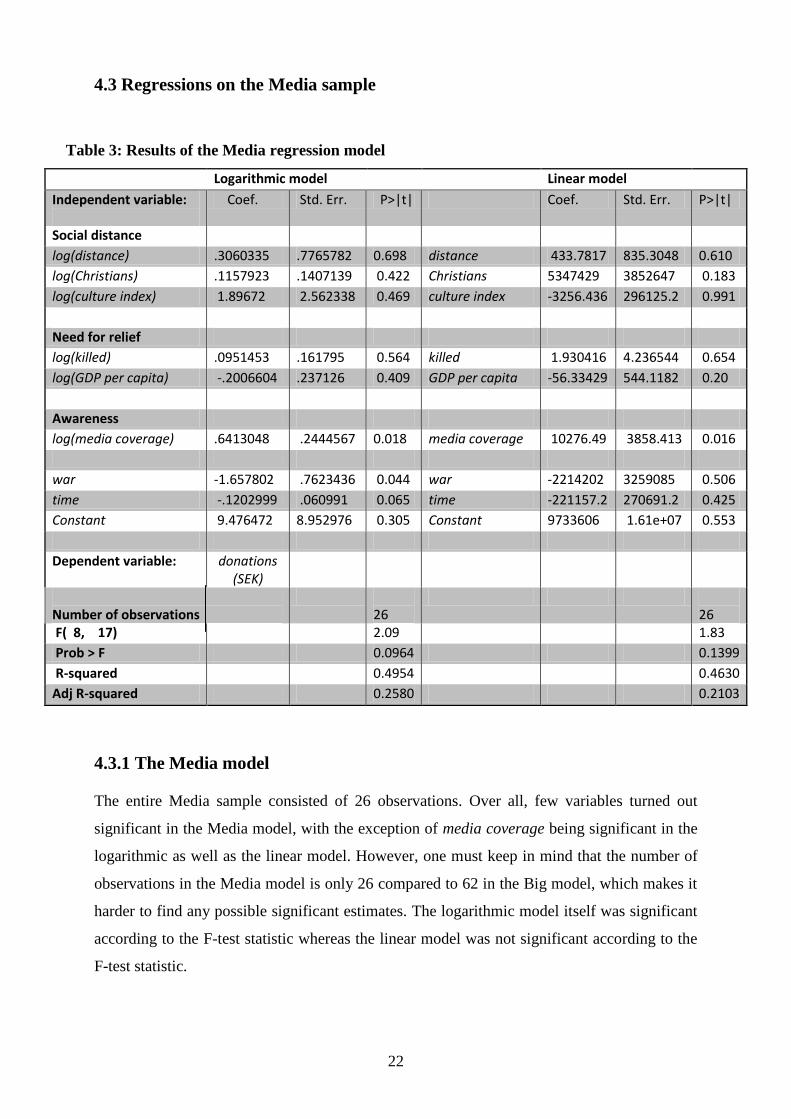
4.3 Regressions on the Media sample .............................................................................. 22
4.3.1 The Media model ................................................................................................. 22
4.3.2 Social distance ...................................................................................................... 23
4.3.3 Need for relief ...................................................................................................... 23
4.3.4 Awareness ............................................................................................................. 23
4.3.5 Disaster type and time ........................................................................................... 23
5. Discussion ............................................................................................................................ 24
5.1 Social distance ............................................................................................................ 24
5.2 Need for relief ............................................................................................................ 25
5.3 Awareness .................................................................................................................. 26
5.4 Disaster type and time ................................................................................................ 28
5.5 General discussion ...................................................................................................... 29
6. Concluding remarks ............................................................................................................. 30
6.1 Further research .......................................................................................................... 31
References ................................................................................................................................ 32
Appendix 1 ............................................................................................................................... 36
Appendix 2 ............................................................................................................................... 37
Appendix 3 ............................................................................................................................... 38
1
“If he was to lose his little finger tomorrow, he would not sleep tonight; but, provided he
never saw them, he will snore with the most profound security over the ruin of a hundred
millions of his brethren.”
Adam Smith (1723-1770)
1. Introduction
In The Theory of Moral Sentiments, Adam Smith asks his readers to imagine an earthquake
swallowing up the whole of China. While "a man of humanity in Europe" would be moved to
express his melancholy, he would, Smith argued, ultimately return untroubled to his ordinary
life (Smith 1970, p. 215). Whilst Smith did not question the existence of altruism, he was
sceptical about its scope or reach. Our sense of solidarity with those who suffer is strongest
when we consider someone else as "one of us" where "us" means something smaller and more
local than the human race. Smith’s observations can however be regarded as less relevant
today than in the 18th
century. Modern technology has enabled the images and sounds of an
earthquake's devastation to be broadcasted into the living rooms of those on the other side of
the world.
But perhaps Smith’s claim is less out of date than what might appear, considering the current
debate about how people feel and reason about humanitarian disasters in distant places. The
humanitarian catastrophes of the 21st century, such as the 2004 Indian Ocean Tsunami and
the tropical cyclone in Burma 2008, have sparked a debate concerning which humanitarian
disasters we humans care about and donate money to. Despite the fact that the scale of the two
mentioned catastrophes was similar in terms of the number of people affected, many aid
organisations in Sweden reported that their relief efforts in Burma received only a fraction of
the money donated to the Tsunami stricken countries. Speculation of why this was the case
pointed to the fact that 543 Swedes died in the tsunami and that many Swedes had a personal
relationship with Thailand, which was the most popular Swedish tourist destination in recent
years (Bodin 2008). This explanation compels us to ask whether there are certain boundaries
to human generosity.
2
Although there is an extensive research into the motivations underlying private giving to
charitable organisations, few studies have systematically assessed the determining factors
behind private donations to humanitarian disasters1, based on data from fundraising
organisations. The importance of the subject cannot however be mistaken. According to a
report from the Centre for Research on the Epidemiology of Disasters (2003), the total
number of natural disasters reported each year has been steadily increasing in recent decades,
from 78 in 1970 to 348 in 2003. Another report from the World Bank (2005) shows that
people are flocking to disaster-prone regions, resulting in an increasing number of people
being left injured, displaced or homeless.
In the light of this development it becomes even more important to mobilize resources from
all parts of the society to provide humanitarian relief, including private donations to
fundraising organisations. Studying private giving is therefore not only an important
theoretical contribution to our understanding of donor behaviour. Knowledge about predictors
of donations can help charities to target their relief appeals more effectively, and for that
reason has strong applied value.
1.1 Statement of purpose and delimitation
The purpose with this study is to empirically examine the determinants behind private
donations to humanitarian disasters. While there is a substantial literature on charitable giving
we still have an imperfect understanding about which factors affect different forms of giving.
Moreover, much of the literature stems from the United States and is based on data from
American private giving- not taking into consideration cross-cultural differences. To the best
of our knowledge there are no previously published studies that examine private giving to
humanitarian disasters by using Swedish data from a fundraising organisation.
Previous research within the field of behavioural economics on private donations as well as
literature on foreign and humanitarian aid will be used to form a model of donor behaviour.
Unfortunately we cannot hope to create a complete model for all conceivable determinants
and so the formulated hypotheses constitute a delimitation of the essay. To test our hypotheses
we have collected data that stretches back to the 1950s from the Swedish fundraising
organisation Radiohjälpen.
1 A humanitarian disaster is an event or series of events which represents a critical threat to the health, safety,
security or wellbeing of a community or other large group of people, usually over a wide area (Oxford Reference
Online 2010).
3
1.2 Radiohjälpen – context and background
The term “non-profit organization” includes all kinds of organisations from sport associations
to unions. Among the non-profit organisations one finds fund-raising organisations such as
Radiohjälpen, Röda Korset and Rädda Barnen. The fund-raising organisations in Sweden
generally hold a bank account starting with the number 90, which shows that the organisation
fulfils a number of criteria; for example, the administrative costs may not exceed more than
ten percent of the money raised. According to Stiftelsen för Insamlingskontroll (2010), the
Swedish fund-raising organisations collected a total of SEK twelve billion in 2008, out of
which approximately five billion were private gifts from the public. The government,
companies and foundations funded the remaining seven billions. On average, this means that
every Swede donates about 500 SEK per year to fundraising organisations, which by
international standards is a fairly average amount (Breman 2008).
Radiohjälpen was founded in 1939 and is today one of the oldest and most well-known of the
Swedish fundraising organisations. It is co-owned as a foundation by the Swedish public
service television company, the Swedish public service radio and the Swedish broadcasting
educational company. Since 1939 it has conducted around 70 appeals to the Swedish public
for domestic as well as international causes. These appeals have been carried out by the help
from the Swedish public television and radio. Typically, small announcements are made about
an on-going humanitarian disaster followed by an appeal to the public to donate money.
The choice of Radiohjälpen as a study object was made based on its long-history as a non-
member fundraising organisation without relief operations of its own. Radiohjälpen does not
perform any practical charity work, but specifically focuses on raising money for different
humanitarian causes. The collected money is then allocated to different aid organisations that
carry out the actual emergency relief work. In this way, Radiohjälpen is a suitable object of
study as it enables us to control to some extent for the possibility that the organisation would
want to increase its fund-raising activities during a disaster that renders more publicity than
usual as it refers to its work in the on-going disaster. This is clearly not an option for
Radiohjälpen. Likewise, Radiohjälpen’s method of appeals presents, at least in theory, the
closest one can get to a non biased fund-raising organisation regarding how much publicity
they give to each disaster fundraise.
4
2. Theory
Before describing the specific theory of our hypotheses, we will briefly describe altruism, the
underlying theoretical framework in this thesis.
2.1 Altruism
“Altruism is the disinterested or benevolent act for other people, that is, a regard to promote
the welfare of others for their own sake rather than to promote one’s own interest or a
placing of interests of others ahead of those of oneself.”
(Bunnin & Yu 2004, pp 22-23)
The theory of altruism holds that the primary motivation for giving is that people value when
their fellow human beings increase their utility, wealth or consumption (Andreoni 2006).
There is ample consistent evidence of altruism in experiments such as dictator games (see eg.
Forsythe et al 1994) as well as in field experiments on fundraising (see eg. List &Lucking-
Reiley 2002). Since altruism is “consistent with observed patterns of giving” it will be applied
in this study (Andreoni 1990, p.465).
According to the theory of altruism, one would predict that people would give more money
the closer our relation to the person in pain, the more pain there is, and the more we know
about it (Kolm & Ythier 2006). In accordance with these general predictions we have
constructed a model on private giving composed of the determinants social distance, need for
relief and awareness. We will proceed by accounting for the theory underlying each one of the
chosen determinants.
5
2.2 Social distance
“Social distance is the degree to which people are willing to accept and associate with those
having different characteristics” (Johnson 2000, p. 289).
The theory of social distance was originally launched and developed by a number of
sociologists. The notion was first used in Georg Simmel's discussion of the stranger in his
Soziologie. According to Simmel, the stranger represents the union of newness and
remoteness as he moves out of one social circle and strives for acceptance in another (Wolff
1950). The concept was further developed by Robert Park as the “grades and degrees of
understanding and intimacy that characterize personal and social relations” (Park 1924,
p.340).
Emory Bogardus operationalized the concept in 1925 by developing the Bogardus Social
Distance Scale - a scaling technique for measuring social distance. The Bogardus Social
Distance scale measures people’s willingness to participate in social contacts of varying
degrees of closeness with members of diverse social groups- on the basis of race/ethnicity,
age, sex, social class, religion, and nationality. An unwillingness to live next door to a family
of a different race, for example, would indicate a high degree of social distance while a
willingness to marry someone of a different race would indicate extremely low level of social
distance (Wark & Galliher 2007).
The concept of social distance has been further tested in a number of studies on prosocial
behaviour within the field of social psychology. Extensive research on helping suggests that
people are more likely to offer help to in-group members, people whom they identify with,
than to out-group members with whom they do not identify (eg. Dovidio et al. 1997: Stürmer,
Snyder & Omot 2005: van Leeuven 2007).
Behavioural economists, building on the research in sociology and social psychology, have
studied the implications of social distance for economic decisions. A particularly large body
of experimental and statistical evidence shows that altruism travels less across racial and
ethnic lines. Individuals are more generous toward others who are similar to them, among
others, racially, ethnically and linguistically (Alesina & Giuliano 2009). Evidence includes
experimental research by Christina M. Fong and Erzo F.P Luttmer (2009) on the effect of
racial group loyalty on generosity to Hurricane Katrina victims. They find that respondents
6
who report feeling close to their racial or ethnic group give substantially more when victims
are of the same race.
However, the same authors Christina M. Fong and Erzo F.P Luttmer (2009) come to reach
another result in a dictator game experiment where the recipients are local charities that serve
the poor. They find that giving does not respond significantly to recipient race despite the fact
that there is a significant racial bias in perceptions of worthiness as respondents rate recipients
of their own racial group as more worthy. The authors conclude that “while our respondents
do seem to rate ingroup members as more worthy, they appear to overcome this bias when it
comes to giving” (Fong & Luttmer 2009, p. 5).
While race and ethnicity have received a lot of attention in studies on private donations, the
impact of national culture2 on generosity has been less examined. Despite findings within
social psychology which show that culture has an influence on helping behaviour (Triandis
1991).
In conclusion, there is ample evidence that social distance has an impact on giving, despite
some findings which suggest otherwise. Moreover, we want to remedy the lack of systematic
studies on the effect of culture on private donations, by focusing on social distance as
exemplified by cultural differences across countries. Thus we form the following hypothesis:
Hypothesis 1: Social distance. The greater the social distance, as exemplified by cultural
differences across countries, between the donor and the recipient, the less money the donor
will donate to the humanitarian disaster.
2 Culture can be defined as the system of shared beliefs, values, customs, behaviours, and artifacts that the
members of society use to cope with their world and with one another, and that are transmitted from generation
to generation through learning (Oxford Reference Online 2010).
7
2.3 Need for relief
Private donations are primarily considered to be based on humanitarian motivations. The
humanitarian motive is to provide relief where it would do most good, in terms of saving lives
and reducing human suffering (Strömberg 2007). When it comes to humanitarian disasters
worldwide, this would arguably drive relief to larger disasters in low-income countries, which
lack the necessary resources to limit and deal with the effects of a disaster. As we have been
unable to find studies which specifically examine the determinants of private donations to
disasters worldwide, literature on humanitarian and foreign aid will be analogously applied.
Even if there are differences between private giving and aid, where geopolitical strategy is for
example of greater importance for the allocation of aid, both are assumed to be allocated in
response to the need of the recipient (Nielsen 2009).
Empirical research on humanitarian aid suggests that international relief for natural disasters
does increase with the severity of the disaster, as measured by the number of killed and
affected, and also rises when the income of the affected country is lower (Strömberg 2007).
These results have been given support in another study by Alesina and Dollar who studied
foreign aid from various donors to receiving countries and found that “most donors give more
to poorer countries, ceteris paribus” (Alesina & Dollar 2000, p.47). However, the authors
also noted that there is quite a large variation among donors in the relationship of aid to
poverty as measured by income per capita, with the highest elasticity for the Nordic countries.
This means that Swedish humanitarian aid responds significantly to the income of the
recipient- the poorer the recipient the more aid will be granted.
Given that the findings on humanitarian and foreign aid have found a positive correlation
between the need for relief and the amount of aid, we form the following hypothesis:
Hypothesis 2: Need for relief. The greater the need for relief in a humanitarian disaster, the
more money the donor will donate to the humanitarian disaster.
8
2.4 Awareness
Awareness of a humanitarian disaster is more or less a prerequisite for giving as people will
have to know about a disaster before they can think about donating money to disaster relief.
This notion has been given support by Cheung and Chan (2000) who found that awareness of
a disaster influences the intention to donate to charity. As disasters are happening worldwide
the media is very likely to play a role in influencing human awareness and perception of
disasters. Support for this was given by Rattien (1990) who found that electronic and print
media significantly affect how and what the public learns about natural disasters. Payne
(1994) went further in his argument, suggesting that media services are the essential means
whereby the public becomes aware of catastrophes, sometimes arriving at the scene of a
disaster well before local emergency services.
The mechanism through which media affects donor behaviour can be explained by the
exposure theory. According to the exposure theory, a person that is repeatedly exposed to a
stimulus will adopt a positive attitude toward the stimulus (Zajonc 1968). In the case of a
disaster, this implies that the amount of exposure to news reports about a disaster and the help
needed in the disaster area, can lead to a positive attitude towards donating to a disaster relief
campaign. A study by Massey (1994) confirmed this expectation, showing that extensive
news coverage of a disaster increases the response to an emergency fund-raising appeal.
Another study by Simon (1997), using a quasi-experimental design, showed that more
network news coverage of earthquakes increased aggregate donations by private citizens.
Leading on from the idea that media has a crucial influence in making people aware of
humanitarian disasters, we arrive at out final hypothesis:
Hypothesis 3: Awareness. The more aware the donor is of a humanitarian disaster through
media coverage, the more money she will donate to the humanitarian disaster.
9
2.5 Hypotheses
To summarize, we formulate the following hypotheses:
1. Social distance. The greater the social distance, as exemplified by cultural differences
across countries, between the donor and the recipient, the less money the donor will
donate to the humanitarian disaster.
2. Need for relief. The greater the need for relief in a humanitarian disaster, the more
money the donor will donate to the humanitarian disaster.
3. Awareness. The more aware the donor is of a humanitarian disaster through media
coverage, the more money she will donate to the humanitarian disaster.
10
3. Empirical method
We will begin by presenting the dependent and the independent variables and how data on
each was collected as well as their interpretation for our hypotheses. We then proceed to
present the regression models used to test our hypotheses.
3.1 Donations – dependent variable
Donations (SEK) is the dependent variable in the regression models. It measures the amount
of money collected for each fundraise. In the Swedish public service broadcasters’ archive,
the annual reports of Radiohjälpen were kept. Each of the observations of disaster fundraisers
that make up our sample was found in these annual reports published over the past 60 years
by Radiohjälpen. For example, in the annual report of 2005 one can read that Radiohjälpen
collected SEK seven million for the earthquake in Pakistan that took place on the 8th
of
October the same year. Each disaster fundraise and the amount collected make up an
observation in our sample. The earliest observation dating back to the annual report of 1951
and the latest comes from the 2008 report. For fundraisers that stretched over several years,
which was the case for a few observations, the sums collected each year were added together
forming a sum for that specific observation. For example Radiohjälpen conducted one
fundraise in 1982 and another in 1984 for the war in Lebanon during the 1980s; hence the two
sums were added together.
Furthermore, the amounts in SEK collected were adjusted for inflation into the price level of
March 2010 using Statistics Sweden’s price converter. The price converter used an average of
prices for the year when the observation was dated, meaning that a fundraise conducted in
May 1985 was converted from the average price level of 1985 into the price level of March
2010.
We would like to point out that the Indian Ocean Tsunami in 2004 originally was part of our
sample. The Tsunami raised more than SEK 300 millions and was, and still is until this day,
by far the largest of all fundraisers that Radiohjälpen has ever conducted. When we included
the Tsunami in our regressions it changed the output completely. For this reason we
considered it to be an outlier and excluded it from the sample.
11
3.2 Social distance – independent variable
Since culture is an elusive concept which is hard to measure we will make use of proxy
variables. We limit ourselves to three proxy variables of culture that differ in character:
1. Geographic distance
2. Share of Christians
3. Culture index
3.2.1 Geographic distance
Geographic distance has often been considered a proxy for cultural distance (Johanson &
Wiedersheim-Paul 1975). It has been used as a proxy for culture in several studies on the
allocation of foreign and humanitarian aid, where it has been found significant (see eg.
Alesina & Dollar 2007). In this case, the variable (geographic) distance measures the distance
between the capital of the donor, Stockholm, and the capital of the recipient country. This
data was calculated using a calculator for distances between geographical locations provided
by the U.S Board on Geographic Names (2010).
3.2.2 Share of Christians
Religion is another common proxy for culture and has been found significant in numerous
studies on aid (see eg. Neumayer 2005). The variable (share of) Christians, with regard to the
fact that Sweden counts as a Christian nation, includes the share of the population in the
recipient country that follows Christianity. This data was collected from the CIA World
Factbook (2010).
3.2.3 Culture index
The variable culture index is based on Geert Hofstede's cultural dimensions. These are power
distance, uncertainty avoidance, individualism versus collectivism and masculinity versus
femininity (for a more detailed description of the four dimensions see Appendix 1).
Hofstede’s culture indexes have been found to be very stable over time and have been replicated
in numerous studies (Hofstede 1984). In contrast to the two previous variables this measure has,
to the best of our knowledge, never previously been applied as a proxy for culture in a study
on donor behaviour. However, there are studies in behavioural finance which have utilized
culture, as operationalized by Hofstede, to measure cultural differences across countries (see eg.
Chui, Titman, & Wei 2010: Tadesse & Kwok 2005). These studies support this paper’s assertion
12
that culture, as operationalized by Hofstede, can be used as a measure of cultural differences
across countries.
To be able to calculate the difference in culture between Sweden and the recipient country we
calculated an average of the difference in Hofstede’s four categories. First, the recipient
country’s value in each category was subtracted from Sweden’s value in each category, then,
the absolute sum of the differences for all four categories were added together and divided by
four. For example, the difference between Sweden and an Arab country is calculated as
follows: (31-80+71-38+5-52+5-68)/4 = 48. In those cases where values on the four
dimensions were missing for a certain country we approximated with neighbouring countries.
The approximations were done after consulting Fredrik Wicklund (2010) who is a certified
consultant at the international consulting organisation Itim International which utilizes
Hofstede's concepts.
3.3 Need for relief - independent variable
The severity of a disaster is often measured in terms of the number of killed, which, hence,
make up one of the proxies for need for relief. Likewise, GDP per capita can be used as a
proxy for a country’s ability to handle a disaster. The poorer a country is the less it can be
expected to employ disaster preparedness and prevention programs and therefore has a greater
need for relief. Both of the variables have been applied, and found significant, in previous
studies on relief to humanitarian disaster (see eg. Strömberg 2007).
3.3.1 Killed
Information about the number of killed in specific natural disasters was gathered through the
Emergency Events Database (EM-DAT 2010), which is run by the Centre for Research on the
Epidemiology of Disasters (CRED), a WHO collaborating centre. Information about the
number of casualties in wars and war-related conflicts was gathered from the book World
Military and Social Expenditures for disasters prior to 1996 (Sivard 1996). For disasters from
1996 and onwards we used the database of Centre for Systemic Peace (2010).
13
3.3.2 GDP per capita
To gather information on GDP per capita for every country we mainly used data from the
World Bank (2010). A few countries missed data, in which case we used United Nation’s
(2010) database as a substitute. Specifically, we gathered information on the current GDP per
capita in USD at the time of the disaster and then turned the GDP per capita into constant
prices of 2010 in USD by accounting for inflation. This was done with the help of a US
Inflation Calculator (2010).
3.4 Awareness – independent variable
The variable media coverage was used as a proxy for awareness and to find a measure for it
of the disasters was a difficult task. The task was finding a source that reached far back in
time but still was representative for the general media coverage of the disaster. The source
that reached longest back in time was the archives of Sweden’s biggest daily newspaper
Dagens Nyheter and Sweden’s second biggest evening paper Expressen. These two papers
had a daily number of copies printed of around 700 000 distributed nationwide in 2010 (TS
Tidningen 2010). Moreover, through Mediearkivet (2010) we could access a database with all
editions of Dagens Nyheter and Expressen back to 1991 and 1990 respectively. All in all, the
two papers were considered being the best proxy at hand for measuring media coverage over a
longer period.
By using the Mediearkivet’s archive our aim was to get an approximate measure of the media
coverage that each disaster was granted. The search method is described below. All words
marked with quotation marks are search words. For example, “Country” could be “Pakistan”
and “Disaster type*3” “Earthquake*” for one of our observations. The different search fields
were filled in as follows: (1) “Country”; (2) [words also included in the search] “Disaster
type*” OR “Disaster*”; (3) [the search period stretched from the month before the disaster
took place to the end of the year when the fundraise ended].
3.5 Disaster type – control variable
The first variable which we control for is disaster type. In the annual reports from the 1970s
and onwards Radiohjälpen describes what kind of disaster that was the cause for the
fundraise. For the years prior to 1970 we had to find out ourselves which type of disaster the
3 The star sign (*) indicates that the ending of the word can take any form.
14
fundraises concerned. The different kinds of disasters were divided into two different main
groups that each was assigned a number; natural disasters (=0) or war (=1). The
categorization was made since there were too few observations to have any more than two
separate sub-groups. Furthermore, the choice of putting all the natural disasters in one group,
on one hand, and the wars and war-related conflicts in another group seemed like the most
reasonable choice and was in accordance with the categorization of humanitarian disasters in
previous studies (see e.g., Drury, Olson & Belle 2005).
In detail the disasters were divided as follows with the number within the parenthesis being
our categorization: (0) tropical cyclone, storm or hurricane, (0) volcanic eruption, (0)
earthquake, (0) land slide, (1) war, genocide or political unrest, (1 or 0) famine. As can be
seen famines were categorized as either natural disaster or war. For the famines, they were
classified as natural disasters (=0) if the major cause behind the famine was a natural disaster,
such as drought. If the major cause behind the famine was war-related it was placed in the
group war (=1).
3.6 Time –control variable
The second variable that we control for is time. Time can be interpreted as how many years
from the base year 1950 that a disaster fundraise took place. This means that the fundraise
conducted for Pakistan in 2005 was assigned t=55. The time variable is important as it
controls for any possible time trend in Radiohjälpen’s appeals for money from the Swedish
public.
3.7 Method of analysis
To test our hypotheses we ran two different regression models. The first one is for the sample
as a whole and excluded the variable media coverage. We will refer to this sample as the “Big
model/sample”. The Big sample included a total of 62 observations. The second regression
model had a smaller sample of 26 observations in total and included the variable media
coverage. From now on we will refer to it as the “Media model/sample”.
The regression method used was Ordinary Least Square (OLS) and we used the statistical
software Intercooled Stata 9.2. Also, each of the two regression models were run in both
linear form as well as logarithmic form. In addition, Breusch-Pagan tests for the presence of
heteroskedasticity were run. The test was significant in the linear model in the Big sample
15
which made us implement robust standard errors. In the Media sample the test was
insignificant and we choose not to implement robust standard errors.
3.7.1 The Big model
For the Big sample a linear and a logarithmic model were tested. In the logarithmic model we
left the time variable in its levelled form, since it was easier to interpret that way. The dummy
variable war was also left in its levelled form. The models look as follows:
The linear Big model
Donations(SEK) = 0 + 1*distance + 2*culture index + 3*Christians + 4*killed +
5*GDP per capita + 6*war + 7*time + u
The logarithmic Big model
Log(Donations(SEK)) = 0 + 1*log(distance) + 2*log(culture index) + 3*log(Christians)+
4*log(killed) + 5*log(GDP per capita) + 6*war + 7*time + u
3.7.2 The Media Model
For the Media sample, we also ran a linear as well as a logarithmic model. The model was
identical to the Big model with the exception of the included media coverage variable.
The linear Media model
Donations (SEK) = 0 + 1*distance + … + 7*time + 8*media coverage + u
The logarithmic Media model
Log(Donations(SEK)) = 0 + 1*log(distance) + … + 7*time + 8*log(media coverage) + u
16
4. Results
In the following section the descriptive data for the total sample will be presented. We then
proceed to report the results of the separate regressions. We will present one Big model for
the entire sample and a Media model for the sample where the media coverage variable is
included. We will make comments on the outcome of each variable and more specifically how
the results compare to what the hypotheses had predicted. For statistic significance, we will
accept p-values of at most ten percent.
17
4.1 Descriptive data
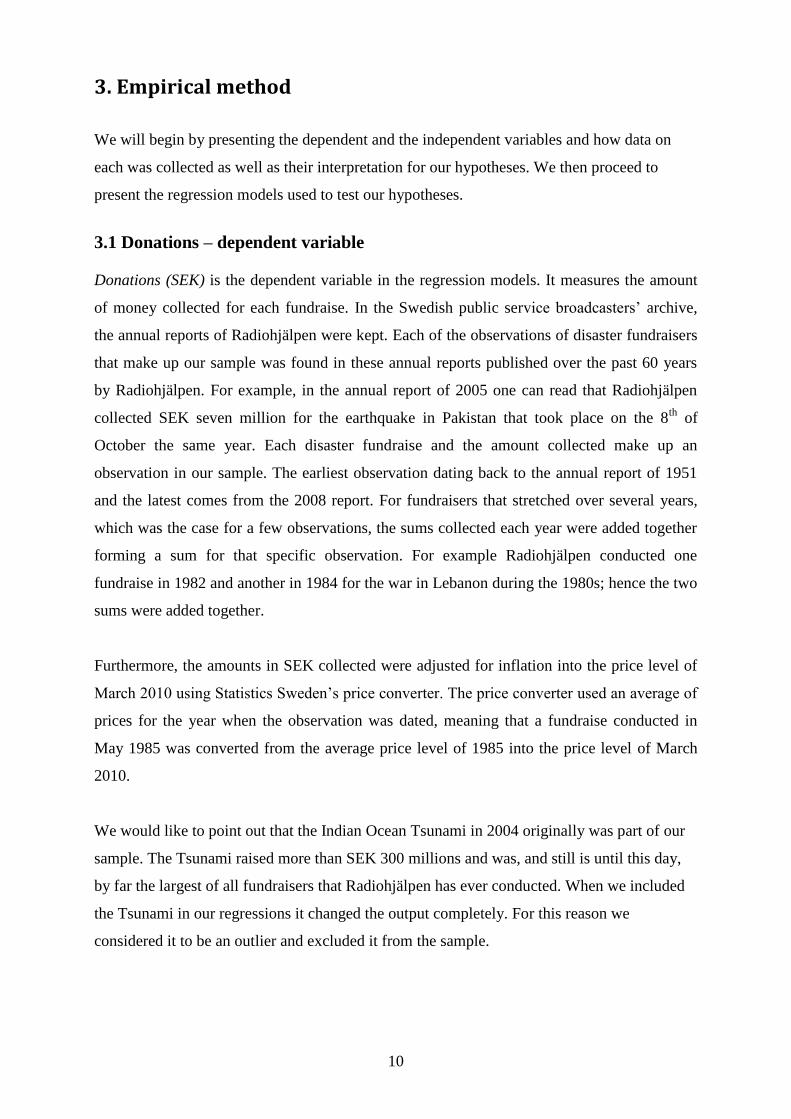
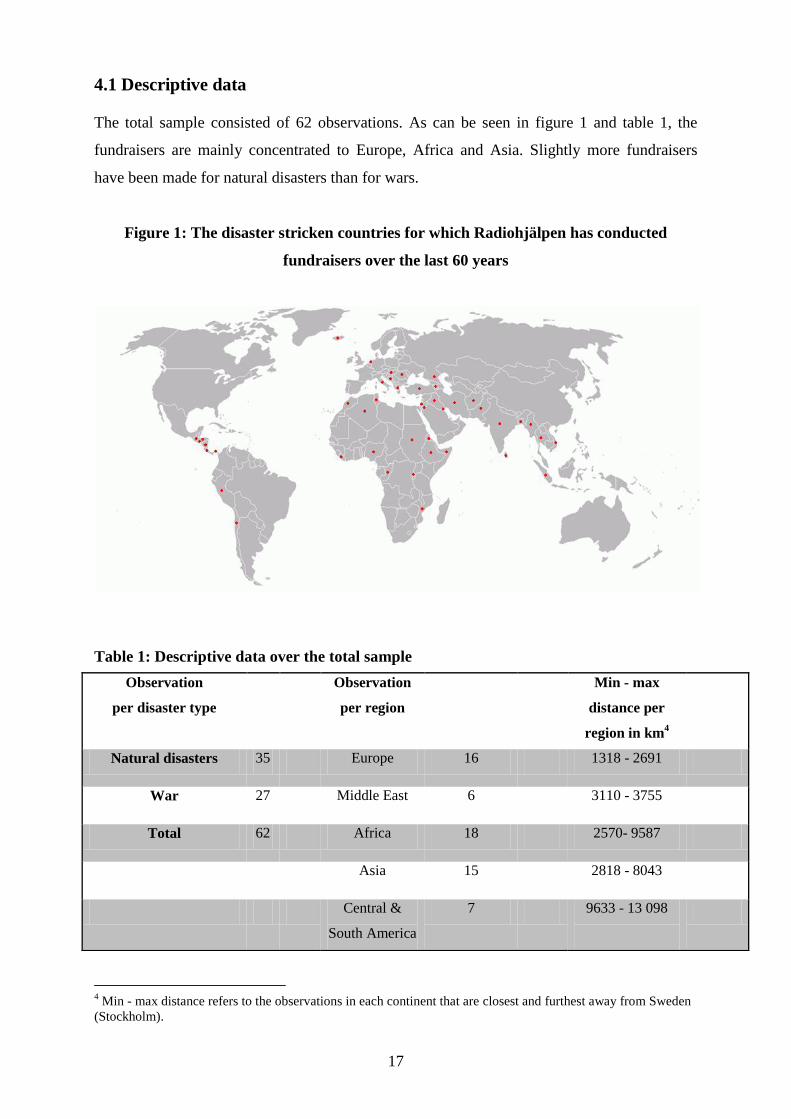
The total sample consisted of 62 observations. As can be seen in figure 1 and table 1, the
fundraisers are mainly concentrated to Europe, Africa and Asia. Slightly more fundraisers
have been made for natural disasters than for wars.
Figure 1: The disaster stricken countries for which Radiohjälpen has conducted
fundraisers over the last 60 years
Table 1: Descriptive data over the total sample
4 Min - max distance refers to the observations in each continent that are closest and furthest away from Sweden
(Stockholm).
Observation
per disaster type
Observation
per region
Min - max
distance per
region in km4
Natural disasters 35 Europe 16 1318 - 2691
War 27 Middle East 6 3110 - 3755
Total 62 Africa 18 2570- 9587
Asia 15 2818 - 8043
Central &
South America
7 9633 - 13 098
18
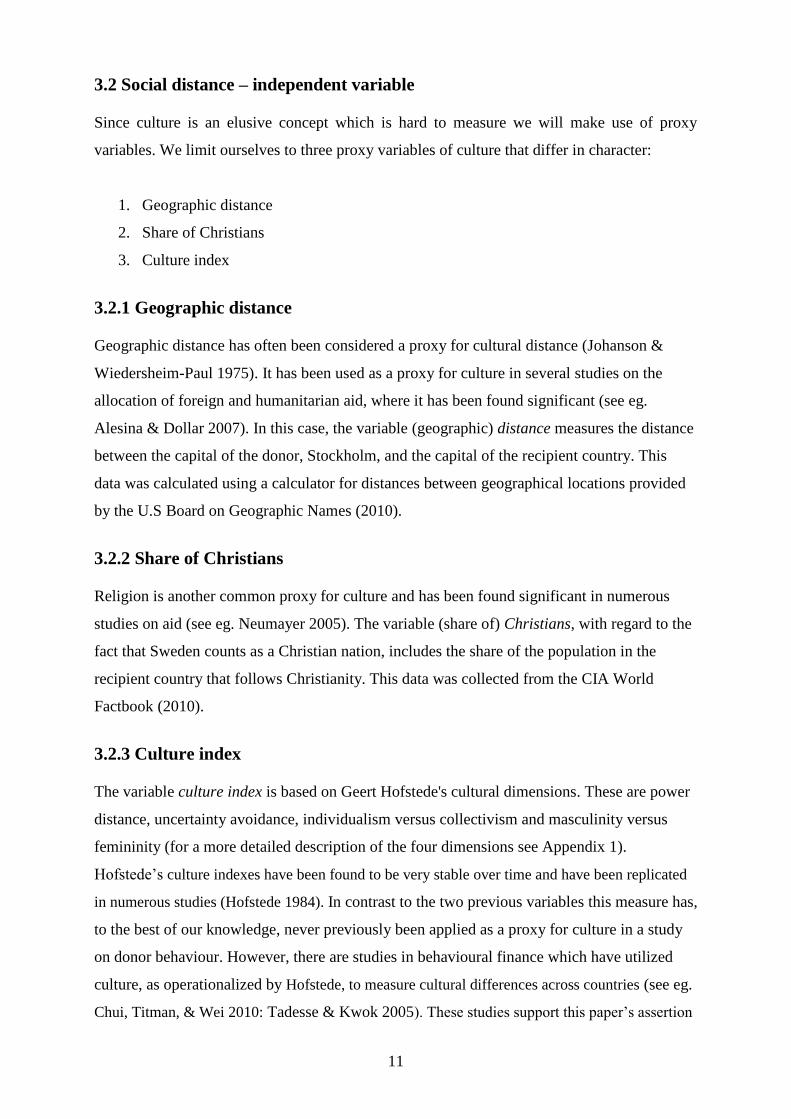
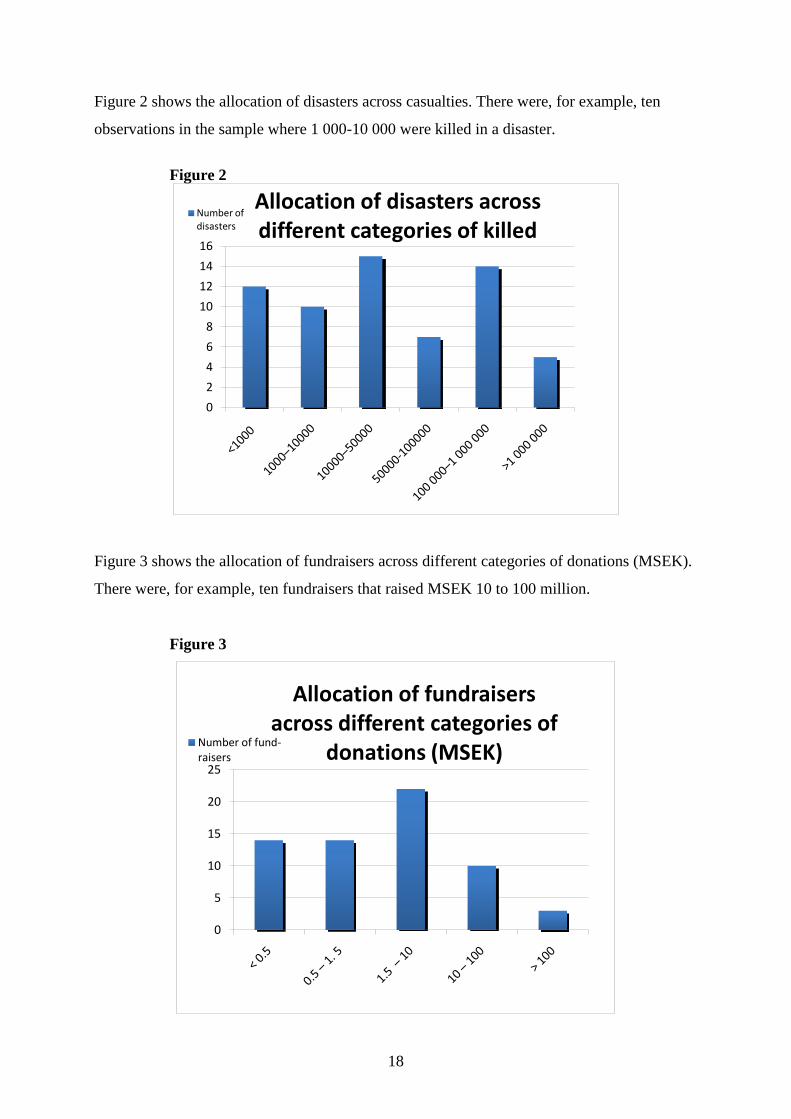
Figure 2 shows the allocation of disasters across casualties. There were, for example, ten
observations in the sample where 1 000-10 000 were killed in a disaster.
Figure 2
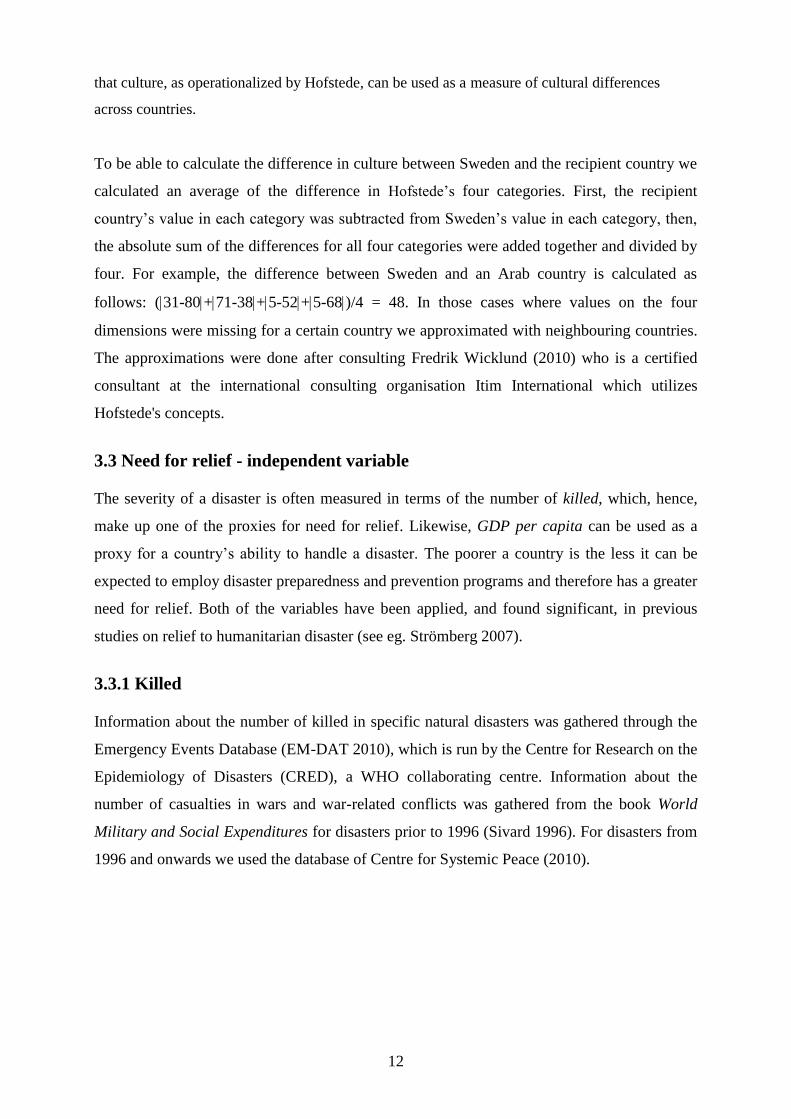
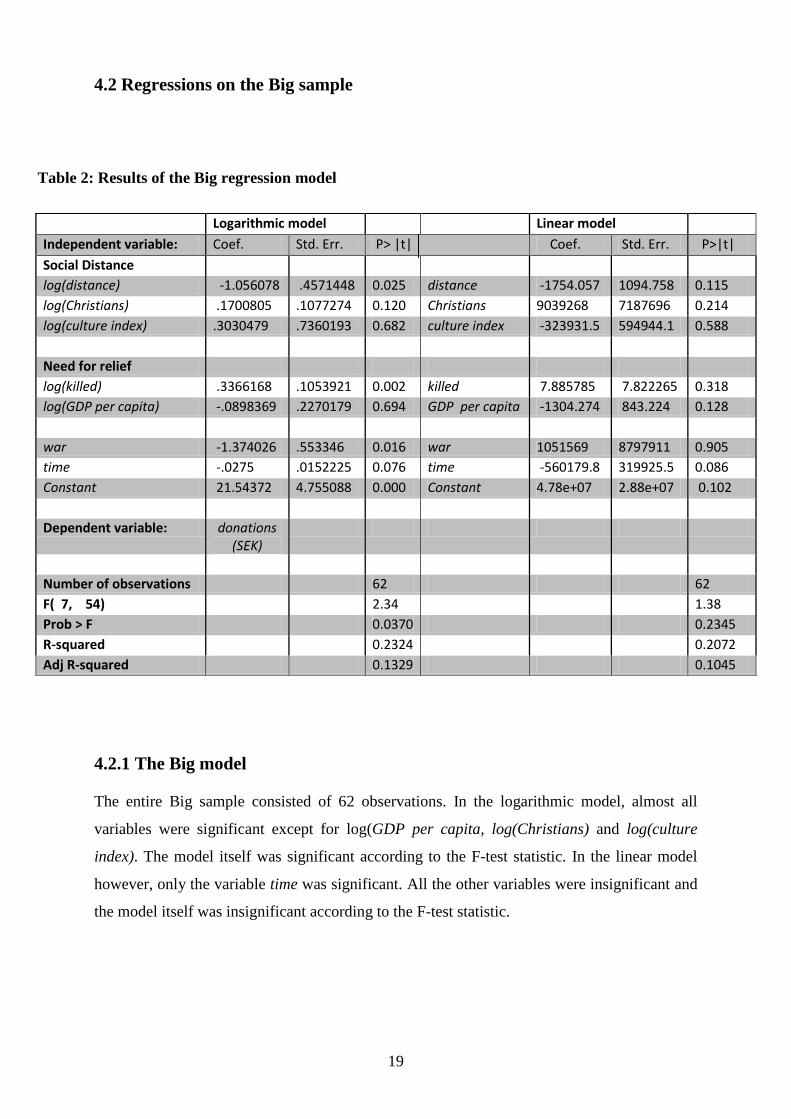
Figure 3 shows the allocation of fundraisers across different categories of donations (MSEK).
There were, for example, ten fundraisers that raised MSEK 10 to 100 million.
Figure 3
0
2
4
6
8
10
12
14
16
Allocation of disasters across different categories of killed
Number of disasters
0
5
10
15
20
25
Allocation of fundraisersacross different categories of
donations (MSEK)Number of fund-raisers
19
4.2 Regressions on the Big sample
Table 2: Results of the Big regression model
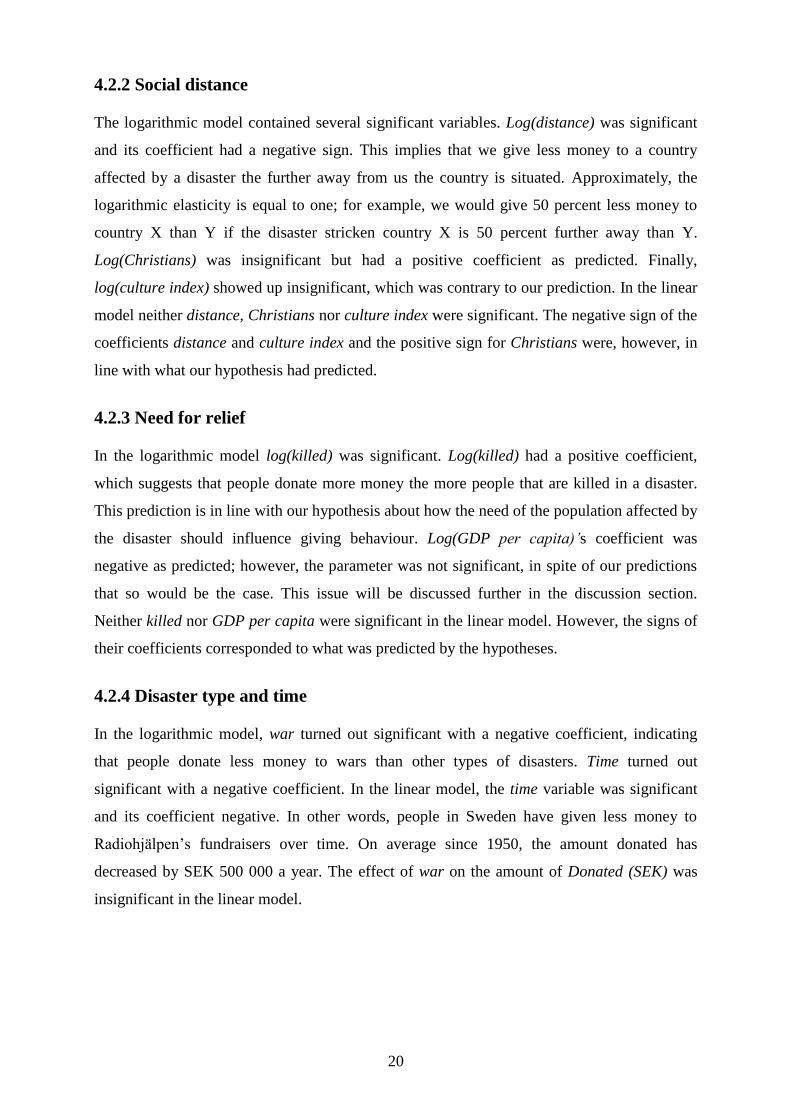
4.2.1 The Big model
The entire Big sample consisted of 62 observations. In the logarithmic model, almost all
variables were significant except for log(GDP per capita, log(Christians) and log(culture
index). The model itself was significant according to the F-test statistic. In the linear model
however, only the variable time was significant. All the other variables were insignificant and
the model itself was insignificant according to the F-test statistic.
Logarithmic model Linear model
Independent variable: Coef. Std. Err. P> |t| Coef. Std. Err. P>|t|
Social Distance
log(distance) -1.056078 .4571448 0.025 distance -1754.057 1094.758 0.115
log(Christians) .1700805 .1077274 0.120 Christians 9039268 7187696 0.214
log(culture index) .3030479 .7360193 0.682 culture index -323931.5 594944.1 0.588
Need for relief
log(killed) .3366168 .1053921 0.002 killed 7.885785 7.822265 0.318
log(GDP per capita) -.0898369 .2270179 0.694 GDP per capita -1304.274 843.224 0.128
war -1.374026 .553346 0.016 war 1051569 8797911 0.905
time -.0275 .0152225 0.076 time -560179.8 319925.5 0.086
Constant 21.54372 4.755088 0.000 Constant 4.78e+07 2.88e+07 0.102
Dependent variable: donations (SEK)
Number of observations 62 62
F( 7, 54) 2.34 1.38
Prob > F 0.0370 0.2345
R-squared 0.2324 0.2072
Adj R-squared 0.1329 0.1045
20
4.2.2 Social distance
The logarithmic model contained several significant variables. Log(distance) was significant
and its coefficient had a negative sign. This implies that we give less money to a country
affected by a disaster the further away from us the country is situated. Approximately, the
logarithmic elasticity is equal to one; for example, we would give 50 percent less money to
country X than Y if the disaster stricken country X is 50 percent further away than Y.
Log(Christians) was insignificant but had a positive coefficient as predicted. Finally,
log(culture index) showed up insignificant, which was contrary to our prediction. In the linear
model neither distance, Christians nor culture index were significant. The negative sign of the
coefficients distance and culture index and the positive sign for Christians were, however, in
line with what our hypothesis had predicted.
4.2.3 Need for relief
In the logarithmic model log(killed) was significant. Log(killed) had a positive coefficient,
which suggests that people donate more money the more people that are killed in a disaster.
This prediction is in line with our hypothesis about how the need of the population affected by
the disaster should influence giving behaviour. Log(GDP per capita)’s coefficient was
negative as predicted; however, the parameter was not significant, in spite of our predictions
that so would be the case. This issue will be discussed further in the discussion section.
Neither killed nor GDP per capita were significant in the linear model. However, the signs of
their coefficients corresponded to what was predicted by the hypotheses.
4.2.4 Disaster type and time
In the logarithmic model, war turned out significant with a negative coefficient, indicating
that people donate less money to wars than other types of disasters. Time turned out
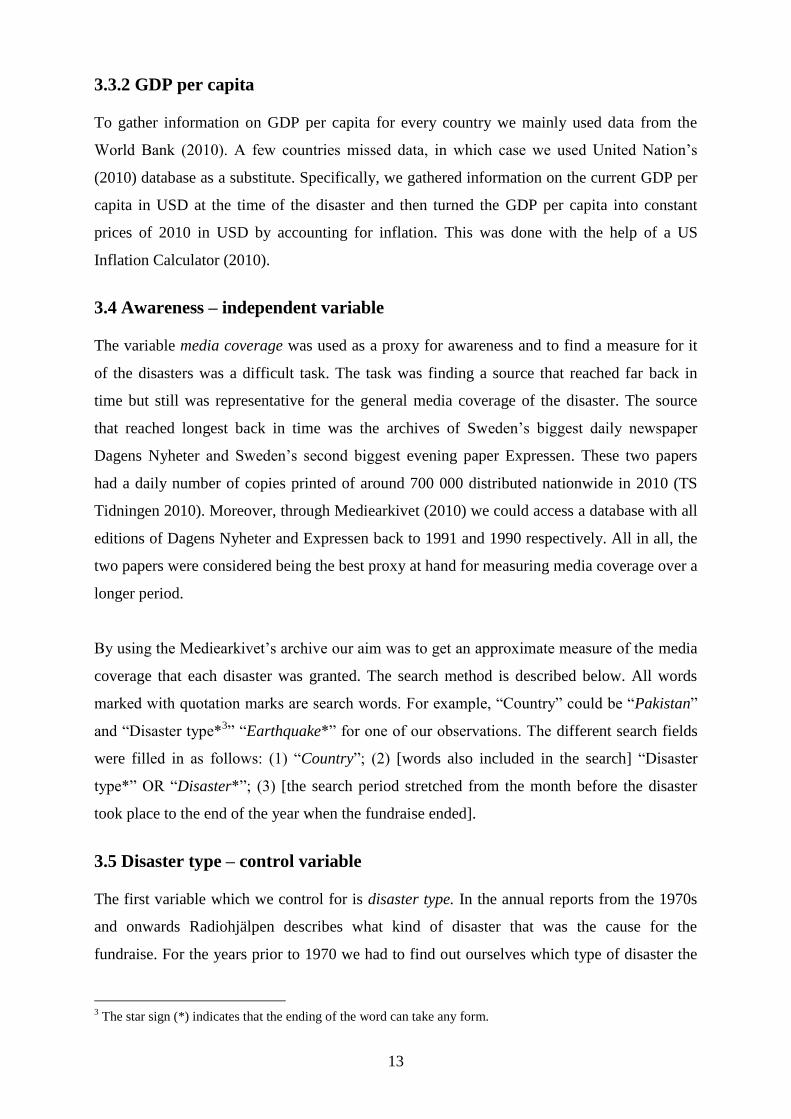
significant with a negative coefficient. In the linear model, the time variable was significant
and its coefficient negative. In other words, people in Sweden have given less money to
Radiohjälpen’s fundraisers over time. On average since 1950, the amount donated has
decreased by SEK 500 000 a year. The effect of war on the amount of Donated (SEK) was
insignificant in the linear model.
21
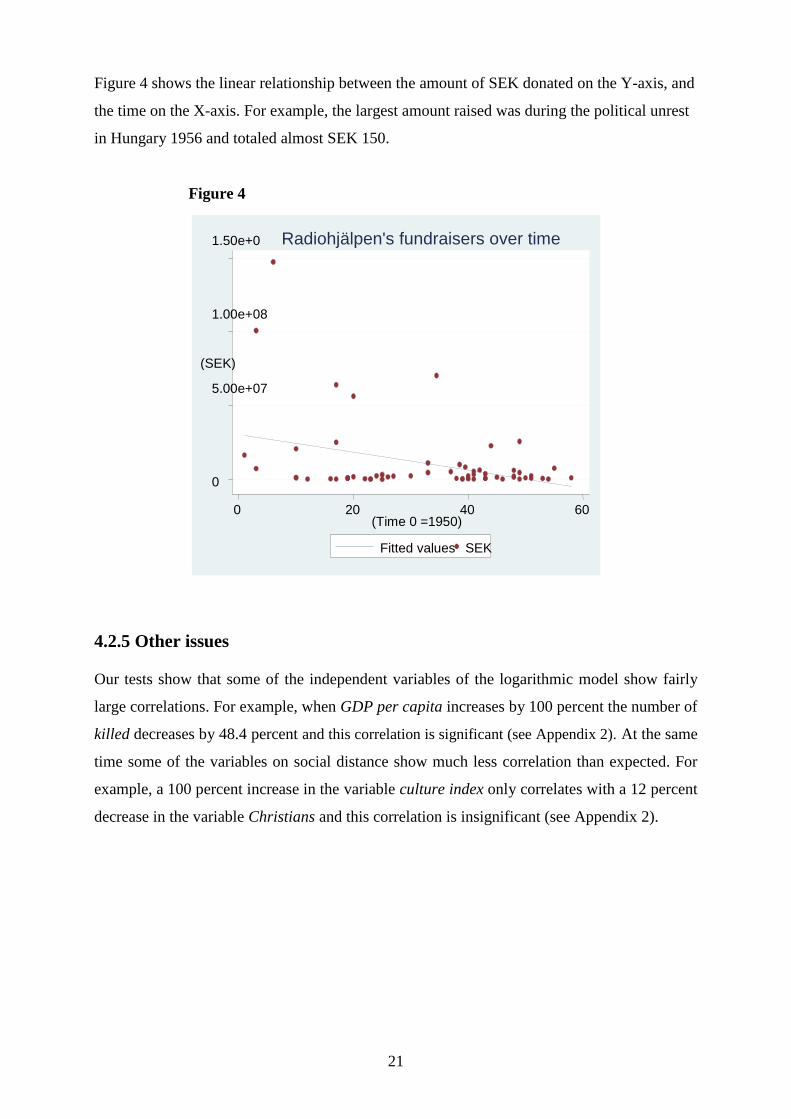
Figure 4 shows the linear relationship between the amount of SEK donated on the Y-axis, and
the time on the X-axis. For example, the largest amount raised was during the political unrest
in Hungary 1956 and totaled almost SEK 150.
Figure 4
4.2.5 Other issues
Our tests show that some of the independent variables of the logarithmic model show fairly
large correlations. For example, when GDP per capita increases by 100 percent the number of
killed decreases by 48.4 percent and this correlation is significant (see Appendix 2). At the same
time some of the variables on social distance show much less correlation than expected. For
example, a 100 percent increase in the variable culture index only correlates with a 12 percent
decrease in the variable Christians and this correlation is insignificant (see Appendix 2).
0
5.00e+07
1.00e+08
1.50e+08
(SEK)
0 20 40 60 (Time 0 =1950)
Fitted values SEK
Radiohjälpen's fundraisers over time
22
4.3 Regressions on the Media sample
Table 3: Results of the Media regression model
Logarithmic model Linear model
Independent variable:
Coef. Std. Err. P>|t| Coef. Std. Err. P>|t|
Social distance
log(distance) .3060335 .7765782 0.698 distance 433.7817 835.3048 0.610
log(Christians) .1157923 .1407139 0.422 Christians 5347429 3852647 0.183
log(culture index) 1.89672 2.562338 0.469 culture index -3256.436 296125.2 0.991
Need for relief
log(killed) .0951453 .161795 0.564 killed 1.930416 4.236544 0.654
log(GDP per capita) -.2006604 .237126 0.409 GDP per capita -56.33429 544.1182 0.20
Awareness
log(media coverage) .6413048 .2444567 0.018 media coverage 10276.49 3858.413 0.016
war -1.657802 .7623436 0.044 war -2214202 3259085 0.506
time -.1202999 .060991 0.065 time -221157.2 270691.2 0.425
Constant 9.476472 8.952976 0.305 Constant 9733606 1.61e+07 0.553
Dependent variable:
donations (SEK)
Number of observations
26
26
F( 8, 17) 2.09 1.83
Prob > F 0.0964 0.1399
R-squared 0.4954 0.4630
Adj R-squared 0.2580 0.2103
4.3.1 The Media model
The entire Media sample consisted of 26 observations. Over all, few variables turned out
significant in the Media model, with the exception of media coverage being significant in the
logarithmic as well as the linear model. However, one must keep in mind that the number of
observations in the Media model is only 26 compared to 62 in the Big model, which makes it
harder to find any possible significant estimates. The logarithmic model itself was significant
according to the F-test statistic whereas the linear model was not significant according to the
F-test statistic.
23
4.3.2 Social distance
All of the variables distance, Christians and culture index were insignificant in both the
logarithmic and the linear model. Distance and Christians have positive signs on their
coefficients in both models, implying that donations increase the larger the social distance
between donors and recipients. This runs opposite to our hypothesis. The culture index
receives different signs on its coefficient depending on model.
4.3.3 Need for relief
Neither killed nor GDP per capita were significant in either the logarithmic model nor in the
linear model. Killed and GDP per capita have positive and negative signs respectively on
their coefficients, implying that donations increase as the number of killed increases and the
poorer a country is. This is in accordance with our hypothesis.
4.3.4 Awareness
The regressions showed that media coverage was significant in the logarithmic model as well
as in the linear model. The coefficients were positive in both models, which suggests that we
give more money to the disasters that media cover more intensely. The relationship in the
logarithmic model was that a 100 percent increase in the variable media coverage was equal
to a 64 percent increase in the variable donations (SEK)5. In the linear model neither time nor
war were significant.
4.3.5 Disaster type and time
In the logarithmic model war as well as time turned out significant. The negative coefficient
on war suggests that people donate less money to wars than to the base group natural
disasters. Time’s coefficient was negative which means that Radiohjälpen has raised less
money for disasters on average for every year since 1990.
5 We also ran the Media model in logged form but without log(media coverage). By doing so the R
2-value fell to
0.29 compared to 0.50 when the variable on media was included. For the linear Media model the corresponding
change resulted in R2-value from 0.46 to 0.24
24
5. Discussion
We begin by discussing the results obtained with respect to the hypotheses before proceeding
into a more general discussion of the study’s limitations and its over all implications.
5.1 Social distance
The impact of social distance, as measured by cultural differences across countries, on
donations has received mixed support. None of the three measures of culture are significant in
the linear model while log(distance) shows up as significant in the logarithmic model.
The results of the linear model leave us with little to conclude but that cultural differences do
not appear to have any effect on donor behaviour. Either this can be due to that the effects are
too weak to be found in our relative small sample, or there simply does not exist a linear
relationship between cultural differences on one hand and money donated on the other.
If we instead turn to the results of the logarithmic model, it shows that the only variable for
cultural differences that seems to have an effect on donor behaviour is distance between
Sweden and the disaster stricken country. This result is in-line with previous research on state
funded relief support in other countries. Moreover, our results on the effect of the share of
Christians on donor behaviour do not correspond to what the hypothesis predicted. Our study
finds no significant support for that the share of Christians in the disaster stricken country
would have any effect on the amount donated. Perhaps the high rate of secularity among the
Swedish population makes Christianity of little or no importance for donor behaviour.
Sweden is according to Therborn “the most secular and agnostic of the world's modern
societies”6, where somewhat less than four percent of the Church of Sweden’s nearly seven
million members attended public worship during an average week and only about two percent
are regular attendees (Therborn 1989, p.275). In light of the seemingly low degree of
religiosity among the Swedish population it does not seem unreasonable that we are unable to
detect any significant effect of the share of Christians on donor behaviour. If such an effect
exists, it is likely to be relatively small.
Furthermore, we note that the variable culture index is never significant at any conventional
level; in fact, it never comes close to being so. The index, thus, do not seem to make up a
6 Free translation from Swedish
25
suitable proxy for a possible existing cultural bias. One possible explanation for this is that the
index in itself is imperfect and not suitable for quantitative empirical studies, but rather as an
indicator of relative differences in value systems across countries. Criticism has also been
directed towards Hofstede’s research which according McSweeney (2002, p. 112) relies on
“fundamentally flawed assumptions”. One point of criticism that McSweeney makes is that
the index is based on generalizations about an entire national population solely on the basis of
analysis of a few questionnaire responses in each country. Hofstede’s national cultural
descriptions are therefore, argues McSweeney (2002, p.112), “invalid and misleading”. We
are inclined to believe that some of this criticism has its merits as we find it intuitively hard to
understand how Sweden, according to Hofstede’s index, can be culturally closer to Ethiopia
and Nigeria than Greece for example.
On the whole, we find weak support for our hypothesis on the effect of national culture on
giving behaviour. A final explanation for this could be that culture does not matter much for
the Swedish population. Some research has shown that members of individualistic cultures are
more likely to help out-group members than members of interdependent or collectivistic
cultures (Triandis 1994). Given that Sweden is often regarded as an individualistic society
(Halman & Ester 1996) this might help to explain why Swedish donors overcome any cultural
differences when it comes to giving. Or perhaps the effect is too small to be measured with
our sample size? Whatever the reason behind our result is, it cannot be rejected that culture,
with the exception of geographical distance, does in fact have little or no impact on donor
behaviour.
5.2 Need for relief
The results points to that the need for relief affects how much money the Swedish population
donates to humanitarian disasters. The results, however, were not unambiguous, as the GDP
per capita variable did not turn out significant at any conventional level.
First of all, the number of casualties affects how much money people are willing to donate.
The results point to a relationship where donators give more money the more people that are
killed in a disaster. This result is not surprising and goes well in line with our hypothesis of
how the need for relief should affect the willingness to donate. The variable log(killed), turned
out significant in the Big logarithmic model whereas it turned out insignificant in the linear
model. The linear model, however, contained fewer significant variables than the logarithmic
26
model in general, which is one possible explanation for why the variable killed proved to be
significant in the logarithmic but not in the linear model.
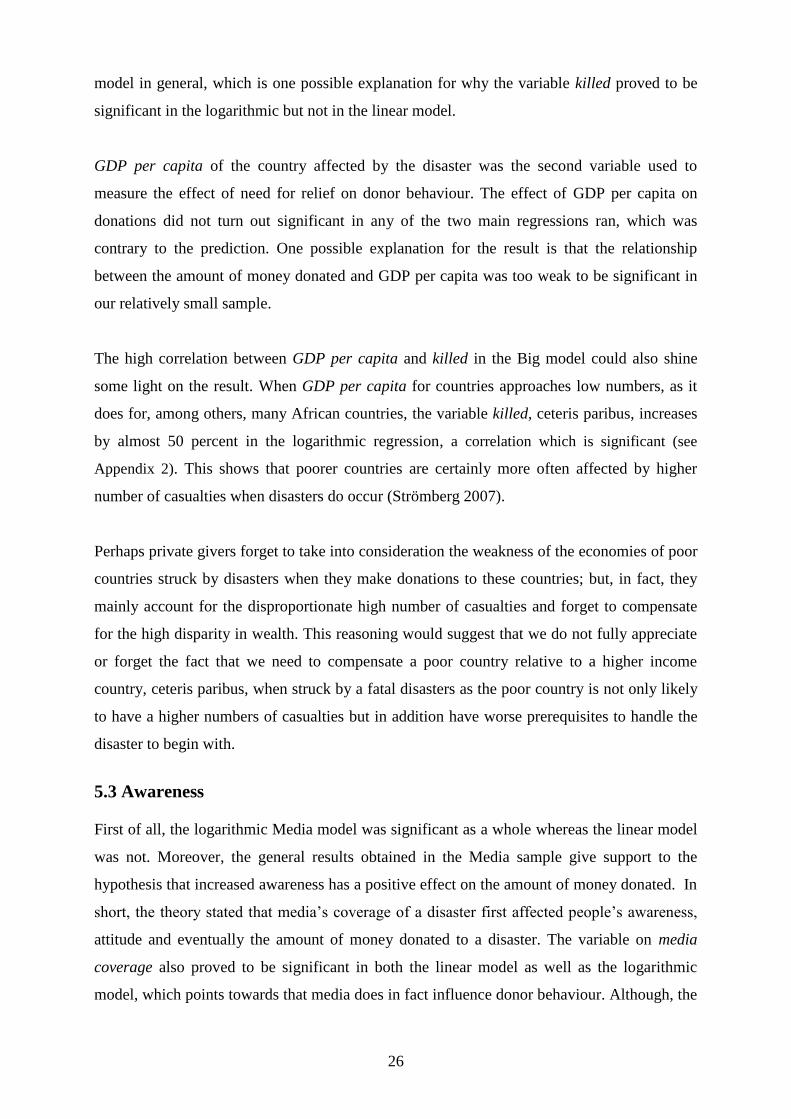
GDP per capita of the country affected by the disaster was the second variable used to
measure the effect of need for relief on donor behaviour. The effect of GDP per capita on
donations did not turn out significant in any of the two main regressions ran, which was
contrary to the prediction. One possible explanation for the result is that the relationship
between the amount of money donated and GDP per capita was too weak to be significant in
our relatively small sample.
The high correlation between GDP per capita and killed in the Big model could also shine
some light on the result. When GDP per capita for countries approaches low numbers, as it
does for, among others, many African countries, the variable killed, ceteris paribus, increases
by almost 50 percent in the logarithmic regression, a correlation which is significant (see
Appendix 2). This shows that poorer countries are certainly more often affected by higher
number of casualties when disasters do occur (Strömberg 2007).
Perhaps private givers forget to take into consideration the weakness of the economies of poor
countries struck by disasters when they make donations to these countries; but, in fact, they
mainly account for the disproportionate high number of casualties and forget to compensate
for the high disparity in wealth. This reasoning would suggest that we do not fully appreciate
or forget the fact that we need to compensate a poor country relative to a higher income
country, ceteris paribus, when struck by a fatal disasters as the poor country is not only likely
to have a higher numbers of casualties but in addition have worse prerequisites to handle the
disaster to begin with.
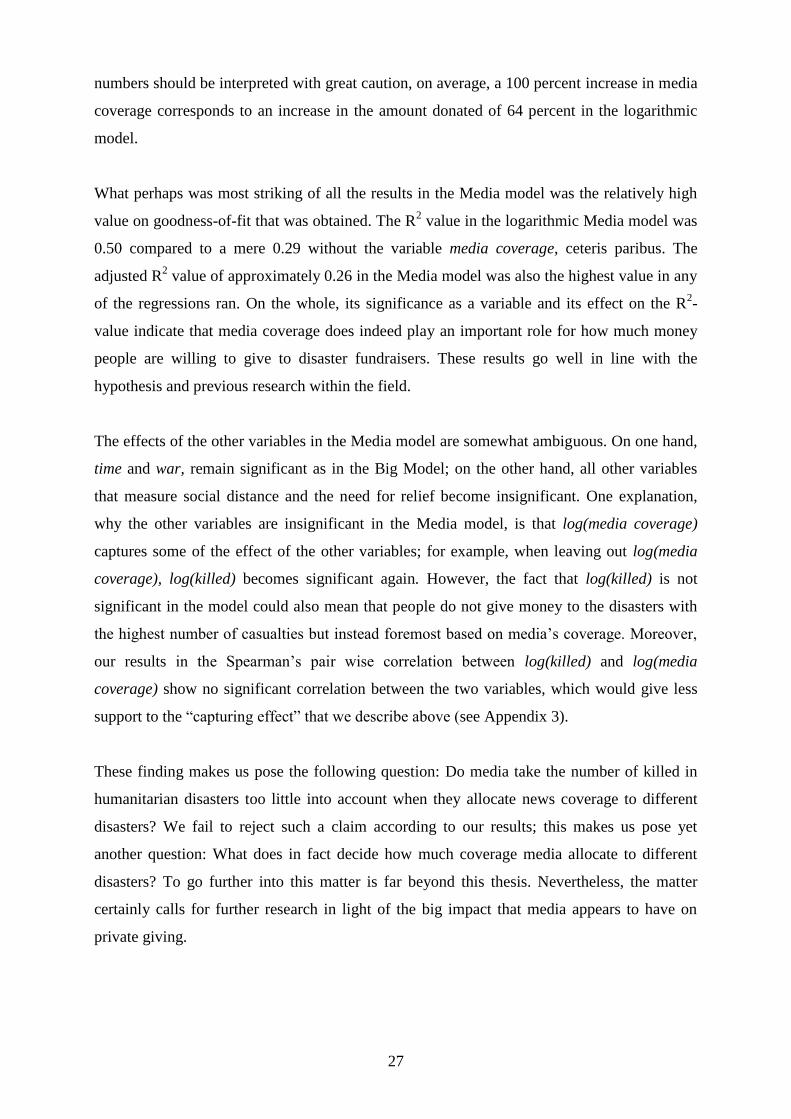
5.3 Awareness
First of all, the logarithmic Media model was significant as a whole whereas the linear model
was not. Moreover, the general results obtained in the Media sample give support to the
hypothesis that increased awareness has a positive effect on the amount of money donated. In
short, the theory stated that media’s coverage of a disaster first affected people’s awareness,
attitude and eventually the amount of money donated to a disaster. The variable on media
coverage also proved to be significant in both the linear model as well as the logarithmic
model, which points towards that media does in fact influence donor behaviour. Although, the
27
numbers should be interpreted with great caution, on average, a 100 percent increase in media
coverage corresponds to an increase in the amount donated of 64 percent in the logarithmic
model.
What perhaps was most striking of all the results in the Media model was the relatively high
value on goodness-of-fit that was obtained. The R2 value in the logarithmic Media model was
0.50 compared to a mere 0.29 without the variable media coverage, ceteris paribus. The
adjusted R2 value of approximately 0.26 in the Media model was also the highest value in any
of the regressions ran. On the whole, its significance as a variable and its effect on the R2-
value indicate that media coverage does indeed play an important role for how much money
people are willing to give to disaster fundraisers. These results go well in line with the
hypothesis and previous research within the field.
The effects of the other variables in the Media model are somewhat ambiguous. On one hand,
time and war, remain significant as in the Big Model; on the other hand, all other variables
that measure social distance and the need for relief become insignificant. One explanation,
why the other variables are insignificant in the Media model, is that log(media coverage)
captures some of the effect of the other variables; for example, when leaving out log(media
coverage), log(killed) becomes significant again. However, the fact that log(killed) is not
significant in the model could also mean that people do not give money to the disasters with
the highest number of casualties but instead foremost based on media’s coverage. Moreover,
our results in the Spearman’s pair wise correlation between log(killed) and log(media
coverage) show no significant correlation between the two variables, which would give less
support to the “capturing effect” that we describe above (see Appendix 3).
These finding makes us pose the following question: Do media take the number of killed in
humanitarian disasters too little into account when they allocate news coverage to different
disasters? We fail to reject such a claim according to our results; this makes us pose yet
another question: What does in fact decide how much coverage media allocate to different
disasters? To go further into this matter is far beyond this thesis. Nevertheless, the matter
certainly calls for further research in light of the big impact that media appears to have on
private giving.
28
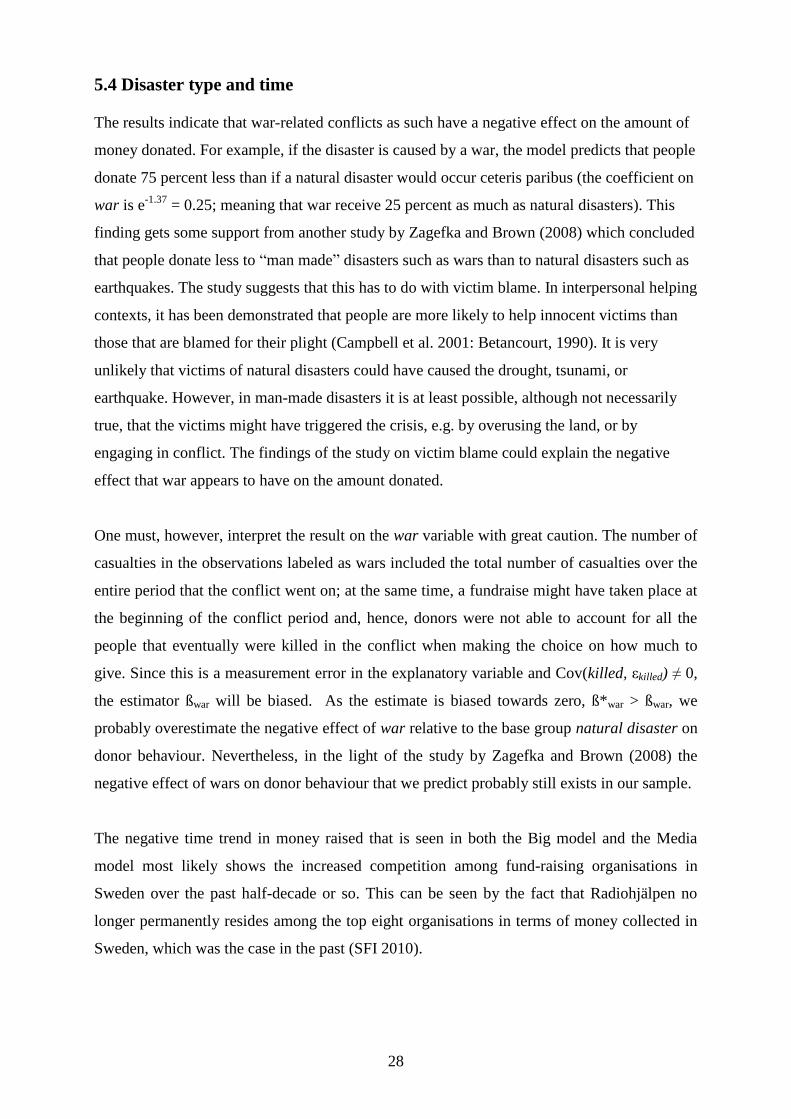
5.4 Disaster type and time
The results indicate that war-related conflicts as such have a negative effect on the amount of
money donated. For example, if the disaster is caused by a war, the model predicts that people
donate 75 percent less than if a natural disaster would occur ceteris paribus (the coefficient on
war is e-1.37
= 0.25; meaning that war receive 25 percent as much as natural disasters). This
finding gets some support from another study by Zagefka and Brown (2008) which concluded
that people donate less to “man made” disasters such as wars than to natural disasters such as
earthquakes. The study suggests that this has to do with victim blame. In interpersonal helping
contexts, it has been demonstrated that people are more likely to help innocent victims than
those that are blamed for their plight (Campbell et al. 2001: Betancourt, 1990). It is very
unlikely that victims of natural disasters could have caused the drought, tsunami, or
earthquake. However, in man-made disasters it is at least possible, although not necessarily
true, that the victims might have triggered the crisis, e.g. by overusing the land, or by
engaging in conflict. The findings of the study on victim blame could explain the negative
effect that war appears to have on the amount donated.
One must, however, interpret the result on the war variable with great caution. The number of
casualties in the observations labeled as wars included the total number of casualties over the
entire period that the conflict went on; at the same time, a fundraise might have taken place at
the beginning of the conflict period and, hence, donors were not able to account for all the
people that eventually were killed in the conflict when making the choice on how much to
give. Since this is a measurement error in the explanatory variable and Cov(killed, εkilled) ≠ 0,
the estimator ßwar will be biased. As the estimate is biased towards zero, ß*war > ßwar, we
probably overestimate the negative effect of war relative to the base group natural disaster on
donor behaviour. Nevertheless, in the light of the study by Zagefka and Brown (2008) the
negative effect of wars on donor behaviour that we predict probably still exists in our sample.
The negative time trend in money raised that is seen in both the Big model and the Media
model most likely shows the increased competition among fund-raising organisations in
Sweden over the past half-decade or so. This can be seen by the fact that Radiohjälpen no
longer permanently resides among the top eight organisations in terms of money collected in
Sweden, which was the case in the past (SFI 2010).
29
5. 5 General discussion
The primary limitation of this study is the small sample size. With a larger sample size small
anomalies and statistical deviations would be of less influence. Specifically, we believe, that
the sample size is very likely to be a problem when it comes to the Media sample. It is
possible that we would have obtained different results if we had worked with a larger sample
size. Our chosen determinants may also constitute a limitation. We cannot exclude the
possibility that there is some other, largely uncorrelated factor, that influences donor
behaviour; combined with our chosen determinants, such omitted factors may have given a
more complete model explaining private donations to humanitarian disasters. A final
limitation concerns the amount of publicity that Radiohjälpen has given to each fundraise
which we could not control for.
30
6. Concluding remarks
The purpose of this study was to examine the determinants behind private donations to
humanitarian disasters. We formulated three hypotheses based on the determinants social
distance, need for relief and awareness through media coverage. Of the three tested
hypotheses, awareness of a disaster emerged as the most influential determinant of private
donations to humanitarian disasters. There is a significant positive relationship between media
coverage and donations- the more media coverage a humanitarian disaster receives, the more
money people will donate to the disaster. The other two determinants social distance and need
for relief received some but not unambiguous support. Among the social distance variables,
only distance received support whereas Christians and culture index did not gain any support.
The determinant need for relief did also receive somewhat mixed support. Whereas the
variable killed received some support, GDP per capita did not get any significant support. We
also found support for that people donate less money to wars than other types of disasters.
Interesting to note, however, is that when the variable media coverage is added to the model
neither distance nor killed are longer significant. Only media coverage gains significance.
This leaves us with the conclusion that over a 60 years period of time, there is some support
for the prediction that the closer our relation to the person in pain and the more pain there is,
the more we donate to those in need in a humanitarian disaster. On the other hand, however,
when we look at the past two decades and control for the awareness of a disaster, neither our
relationship to the person in pain nor the amount of pain there is, no longer with certainty has
an effect on donations. We find this result difficult to understand and it certainly calls for
further investigation.
31
6.1 Further research
As we got somewhat mixed results on the majority of our determinants, we suggest a
replication of our study with some modifications. We suggest, first and foremost, a larger
sample size that covers all the determinants that we tested. Secondly, regarding the variables,
it would be desirable to have data on media coverage over a longer period of time, with
different types of media such as television and advertising. In addition, we recommend the
application of other measures on culture to complement ours. Perhaps we should not rule out
Gert Hofstede’s cultural index completely since it has been found significant in several
studies within behavioural finance. These studies have however only applied one out of
Hofstede’s four cultural dimensions; the dimension of individuality vs. collectivism. In
another study on donor behaviour, it thus might be suitable to apply the dimension
individuality versus collectivism as research suggests that this dimension has implications for
generosity. Finally, as mentioned in the general discussion there may exist other variables that
we have not accounted for in our model. It is therefore our hope that the search continues
towards finding out more specifically if there are other determinants that affect private donor
behaviour when fatal humanitarian disasters occur around the world; and if this is the case,
which these determinants are.
32
References
Alesina, A. F. & Dollar, D. (2000). Who Gives Foreign Aid to Whom and Why?. Journal of
Economic Growth, vol 5(1), pp. 33-63.
Alesina, A. F. & Giuliano, P. (2009). Preferences for Redistribution. National Bureau of
Economic Research. Working Paper 14825.
Andreoni, J. (1990). Impure Altruism and Donations to Public Goods: A Theory of Warm-
Glow Giving?. The Economic Journal, vol 100(401), pp. 464-77.
Andreoni, J. (2006). Philantrophy. In S. Kolm & J.M. Ythier. eds. Handbook on the
Economcis of Giving, Reciprocity and Altruism Volume 2. Amsterdam: North-Holland. Ch.
18.
Betancourt, H. (1990). An attribution-empathy model of helping behaviour: Behavioural
intentions and judgments of help-giving. Personality and Social Psychology Bulletin, vol
16(3), pp. 573-591.
Bodin, A.(2008). Vilka katastrofer ser vi och vem hjälper vi. Dagens nyheter, 25 maj. p. 21-
24.
Breman, A. (2008). Forskning om filantropi : varför skänker vi bort pengar?. Stockholm:
Ekonomiska Forskningsinstitutet vid Handelshögskolan i Stockholm.
Brickman, L. & Gaertner, S. L. (1971). Effects of race on the elicitation of helping
behaviour: The wrong number technique. Journal of Personality and Social
Psychology, vol 20(2), pp. 218-222.
Bunnin, N. & Yu, J. eds. (2004). The Blackwell Dictionary of Western Philosophy. Oxford:
Blackwell Publishers Ltd.
Campbell, D., Carr, S. C., & MacLachlan, M. (2001). Attributing "third world
poverty" in Australia and Malawi: A case of donor bias?. Journal of Applied
Social Psychology, 31, 409-430.
CARMA International. (2006). The Carma Report on Western Media Coverage on
Humanitarian Disasters 2006. Washington: CARMA International Inc.
Centre for Research on the Epidemiology of Disasters [CRED]. (2003). Thirty years of
natural disasters 1974-2003: The numbers. Belgium: Presses universitaires de Louvain.
Centre for Systemic Peace. (2010). Retrieved 20 March, 2010, from
http://www.systemicpeace.org
Chan, C.M. & Cheung, C.K. (2000). Social-cognitive factors of donating money to charity,
with special attention to an international relief organisation. Evaluation and Program
Planning, vol 23(2), pp. 241–253.
Chui, A. C.W., Wei, J. K.C. & Titman, S. (2010). Individualism and Momentum around the
World. The Journal of Finance, vol 65(1), pp 361-392.
33
CIA World Factbook. (2010), Retrieved 20 April, 2010, from
https://www.cia.gov/library/publications/the-world-factbook/
Drury, C.A., Olson, R. S, Van Belle, D.A. (2005). The Politics of Humanitarian Aid: U.S.
foreign Disaster Assistance, 1964-1995. The Journal of Politics, vol 67(2), pp. 454-473.
Emergency Events Database. (2010). Retrieved 10 May, 2010, from http://www.emdat.be/
Fong, C.M. & Luttmer, E. F.P. (2009). What Determines Giving to Hurricane Katrina
Victims? Experimental Evidence on Racial Group Loyalty." American Economic Journal:
Applied Economics, vol 1(2). pp. 64-87.
Fong, C.M. & Luttmer, E. F.P. (2009). Do Race and Fairness Matter in Generosity?
Evidence from a Nationally Representative Charity Experiment. National Bureau of
Economic Research, Inc. Working paper 15064.
Forsythe, R., Horowitz, J. L., Savin, N. E., and Sefton, M. (1994). Fairness in simple
bargaining experiments. Games and Economic Behaviour 6, pp. 347–69.
Galliher, J. F. & Wark, C. (2007). Emory Bogardus and the Origins of the Social Distance
Scale. The American Sociologist, vol 38(4), pp. 383-395.
Halman, L & Ester, P. (1996). The ethos of individualism in cross-cultural perspective:
Exploring the European values data. The European Legacy, Volume 1(2), pp. 645 – 651.
Hofstede, G. (1984). Culture's Consequences: International Differences in Work-Related
Values. Beverly Hills, California: Sage Publications.
Johanson, J. & Wiedersheim-Paul, F. (1975). The internationalization of the firm: four
Swedish case studies. Journal of Management Studies, vol 12(3), pp.305-22.
Johnson, G. J. ed. (2000). The Blackwell Dictionary of Sociology: A User’s Guide to
Sociological Language. 2nd ed. Oxford: Blackwell Publishers Ltd
Kolm, S.C. (2006). Introduction to the economics of altruism, giving and reciprocity. In S.
Kolm & J.M., Ythier. eds. Handbook on the Economcis of Giving, Reciprocity and Altruism
Volume 1. Amsterdam: North-Holland. Ch. 1.
Kwok, C., Tadesse, S. (2005). National Cultural & Financial Systems. William Davidson
Institute. Working Paper 884.
List, J. A. & Lucking-Reiley, D. (2002). The effects of seed money and refunds on
charitable giving: experimental evidence from a university capital campaign. Journal of
Political Economy 110, pp. 215–33.
McSweeney, B. (2002). Hofstede’s Model of National Cultural Differences and
Consequences: A Triumph of Faith - A Failure of Analysis. Human Relations’, vol 55(1), pp.
89-118.
34
Neumayer, E. (2005). Is the Allocation of Food Aid Free from Donor Interest Bias?. The
Journal of Development Studies, vol 41(3), pp. 394-411.
Nielsen, R. 2009. Does Aid Follow Need? Humanitarian Motives in Aid Allocation. In Project
Level Aid Data Vetting Workshop. Washington D.C, United States, 17-18 September 2009.
PLAID: Washington D.C.
Massey, A. (1994). In a league of their own: Charities are way ahead of the commercial
world when it comes to direct marketing. Marketing, vol 1(1), pp. 18–22.
Mediearkivet. (2010). Retrieved 15 March, 2010, from http://www.retriever-info.com/se/
Omoto, A.M., Snyder, M. & Stürmer, S.(2005). Prosocial emotions and helping:
The moderating role of group membership. Journal of Personality and Social Psychology, vol
88(3), pp. 532-546.
Oxford Reference Online. Retrieved 25 March, 2010, from
<http://www.oxfordreference.com/views/ENTRY.html?subview=Main&entry=t235.e1144>
Park, R.E. (1924). The Concept of Social Distance As Applied to the Study of Racial Attitudes
and Racial Relations. Journal of Applied Sociology, vol 8, pp. 339-344.
Payne, C. (1994). Handling the press. Disaster Prevention and Management, vol 3(1),
pp. 24–32.
Rattien, S. (1990). The role of media in hazard mitigation and disaster management.
Disasters, vol 14(1), pp. 36–45.
Simon, A.F. (1997). Television news and international earthquake relief. Journal of
Communication, vol 47(3), pp. 82–93.
Sivard, R.L. (1996).World Military and Social Expenditures.16th ed. Washington D.C: World
Priorities.
Smith, A. (1970). The Theory of Moral Sentiments. London: A. Millar.
Stiftelsen för Insamlingskontroll [SFI]. (2010). Retrieved February 27, 2010, from
http://www.insamlingskontroll.se
Strömberg, D. (2007). Natural Disasters, Economic Development, and Humanitarian Aid.
Journal of Economic Perspectives, vol 21(3). pp 199-222.
Therborn, G. (1989). Nation och klass, tur och skicklighet: Vägar till ständig (?) makt. In K.
Misgeld, K. Molin & K. Cmark. eds. Socialdemokratins samhälle: SAP och Sverige under
100 år. Stockholm: Tiden.
Triandis, H. C. (1991). Cross-cultural differences in assertiveness/competition vs. group
loyalty/cooperation. In R. A. Hinde & J. Groebel .eds. Cooperation and Prosocial Behaviour.
New York: Cambridge University Press. pp. 78–88.
35
TS Tidningen. (2010). Rettrieved January 9, 2010, from
http://www.ts.se/Mediefakta/Index.aspx
United Nations. (2010). Retrieved 5 Mai, 2010, from http://data.un.org/Explorer.aspx
U.S Board on Geographic Names [BGN]. (2010). Retrieved 14 March, 2010, from
http://www.infoplease.com/atlas/calculate-distance.html
US Inflation Calculator. (2010). Retrieved 27 April, 2010, from
http://www.usinflationcalculator.com/
van Leeuven, E. (2007). Restoring identity through outgroup helping: Beliefs about
international aid in response to the December 2004 tsunami. European
Journal of Social Psychology, vol 37(4), pp. 661-671.
Wicklund, F. 2010. Discussion about approximation of Geert Hofstede's Cultural Dimensions.
Email. (Personal communication, 20 April 2010)
Wolff, K. (1950). The Sociology of Georg Simmel. New York: Free Press.
World Bank. (2005). Natural Disaster Hotspots: A Global Risk Analysis: Washington
D.C.World Bank Publications.
World Bank. (2010). Retrieved 13 Mai, 2010, from http://data.worldbank.org/indicator
Zagefka, H & Brown, R. (2008). Monetary Donations following Humanitarian Disasters. Full
Research Report ESRC End of Award Report. Swindon: ESR
Zajonc, R. (1968). Attitudinal effects of mere exposure. Journal of Personality and Social
Psychology, vol 9(2), pp. 1–32.
36
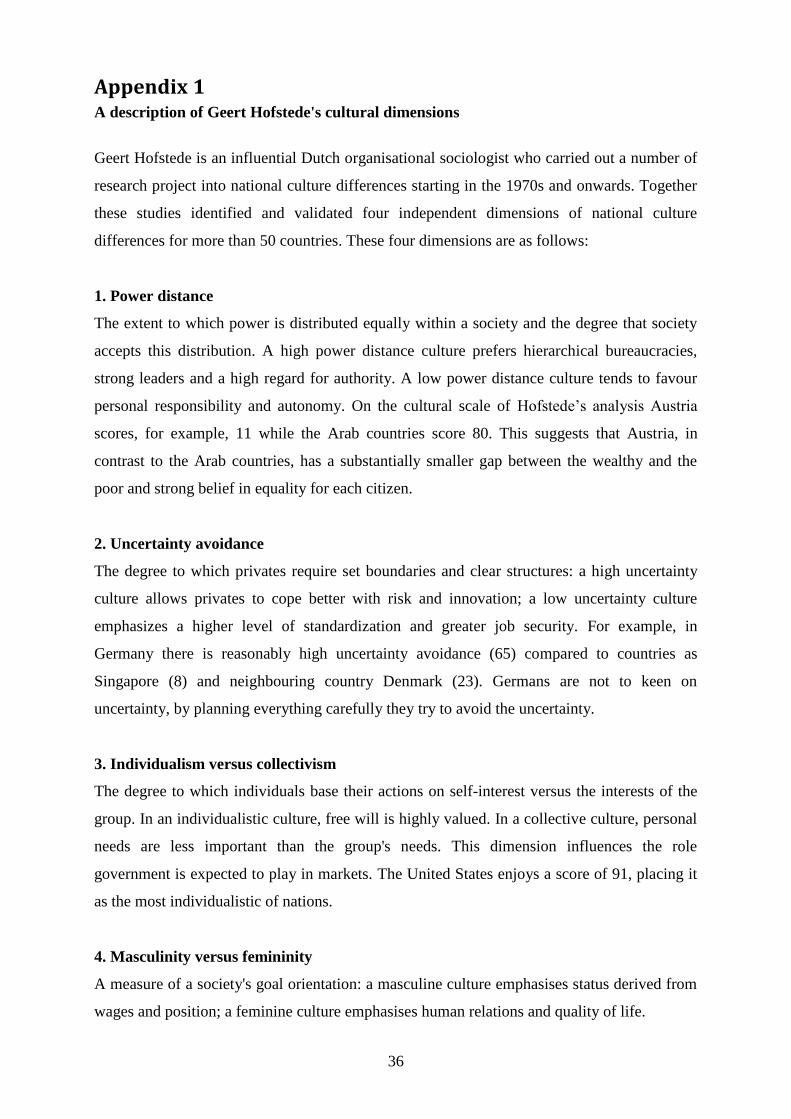
Appendix 1 A description of Geert Hofstede's cultural dimensions
Geert Hofstede is an influential Dutch organisational sociologist who carried out a number of
research project into national culture differences starting in the 1970s and onwards. Together
these studies identified and validated four independent dimensions of national culture
differences for more than 50 countries. These four dimensions are as follows:
1. Power distance
The extent to which power is distributed equally within a society and the degree that society
accepts this distribution. A high power distance culture prefers hierarchical bureaucracies,
strong leaders and a high regard for authority. A low power distance culture tends to favour
personal responsibility and autonomy. On the cultural scale of Hofstede’s analysis Austria
scores, for example, 11 while the Arab countries score 80. This suggests that Austria, in
contrast to the Arab countries, has a substantially smaller gap between the wealthy and the
poor and strong belief in equality for each citizen.
2. Uncertainty avoidance
The degree to which privates require set boundaries and clear structures: a high uncertainty
culture allows privates to cope better with risk and innovation; a low uncertainty culture
emphasizes a higher level of standardization and greater job security. For example, in
Germany there is reasonably high uncertainty avoidance (65) compared to countries as
Singapore (8) and neighbouring country Denmark (23). Germans are not to keen on
uncertainty, by planning everything carefully they try to avoid the uncertainty.
3. Individualism versus collectivism
The degree to which individuals base their actions on self-interest versus the interests of the
group. In an individualistic culture, free will is highly valued. In a collective culture, personal
needs are less important than the group's needs. This dimension influences the role
government is expected to play in markets. The United States enjoys a score of 91, placing it
as the most individualistic of nations.
4. Masculinity versus femininity
A measure of a society's goal orientation: a masculine culture emphasises status derived from
wages and position; a feminine culture emphasises human relations and quality of life.
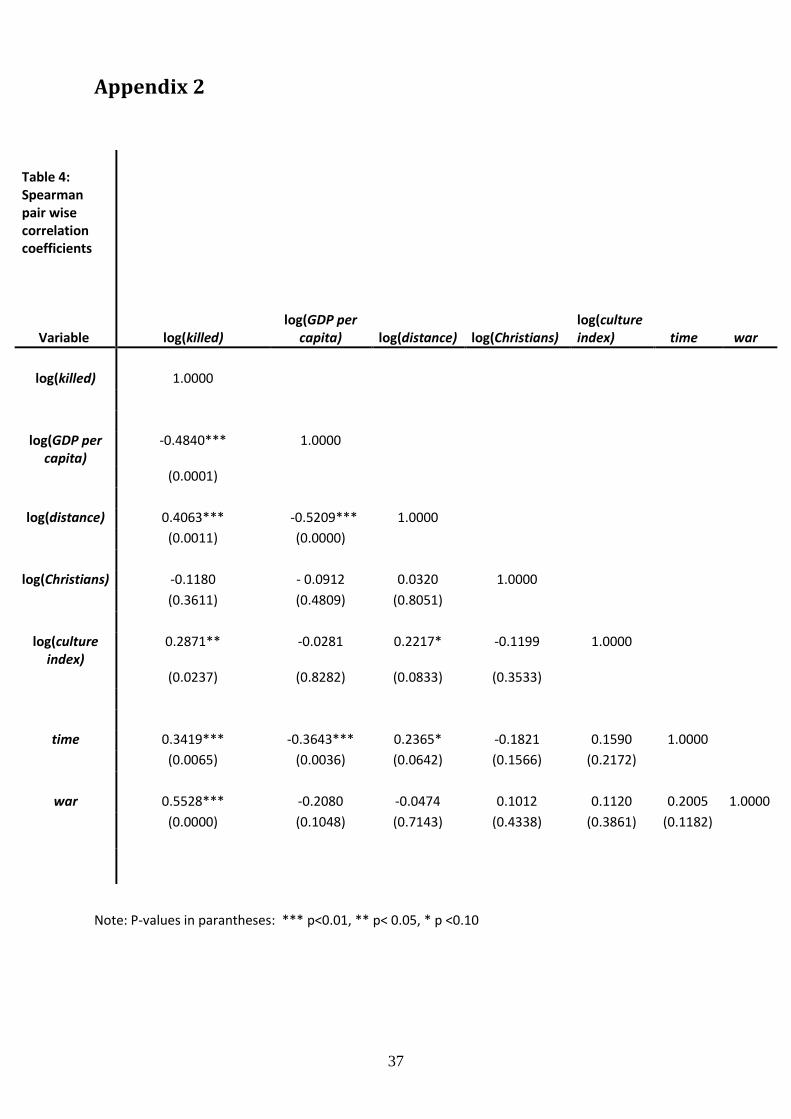
37
Appendix 2
Note: P-values in parantheses: *** p<0.01, ** p< 0.05, * p <0.10
Table 4: Spearman pair wise correlation coefficients Variable
log(killed)
log(GDP per capita)
log(distance)
log(Christians)
log(culture index)
time
war
log(killed) 1.0000
log(GDP per capita)
-0.4840*** 1.0000
(0.0001)
log(distance) 0.4063*** -0.5209*** 1.0000
(0.0011) (0.0000)
log(Christians) -0.1180 - 0.0912 0.0320 1.0000
(0.3611) (0.4809) (0.8051)
log(culture index)
0.2871** -0.0281 0.2217* -0.1199 1.0000
(0.0237) (0.8282) (0.0833) (0.3533)
time 0.3419*** -0.3643*** 0.2365* -0.1821 0.1590 1.0000
(0.0065) (0.0036) (0.0642) (0.1566) (0.2172)
war 0.5528*** -0.2080 -0.0474 0.1012 0.1120 0.2005 1.0000
(0.0000) (0.1048) (0.7143) (0.4338) (0.3861) (0.1182)
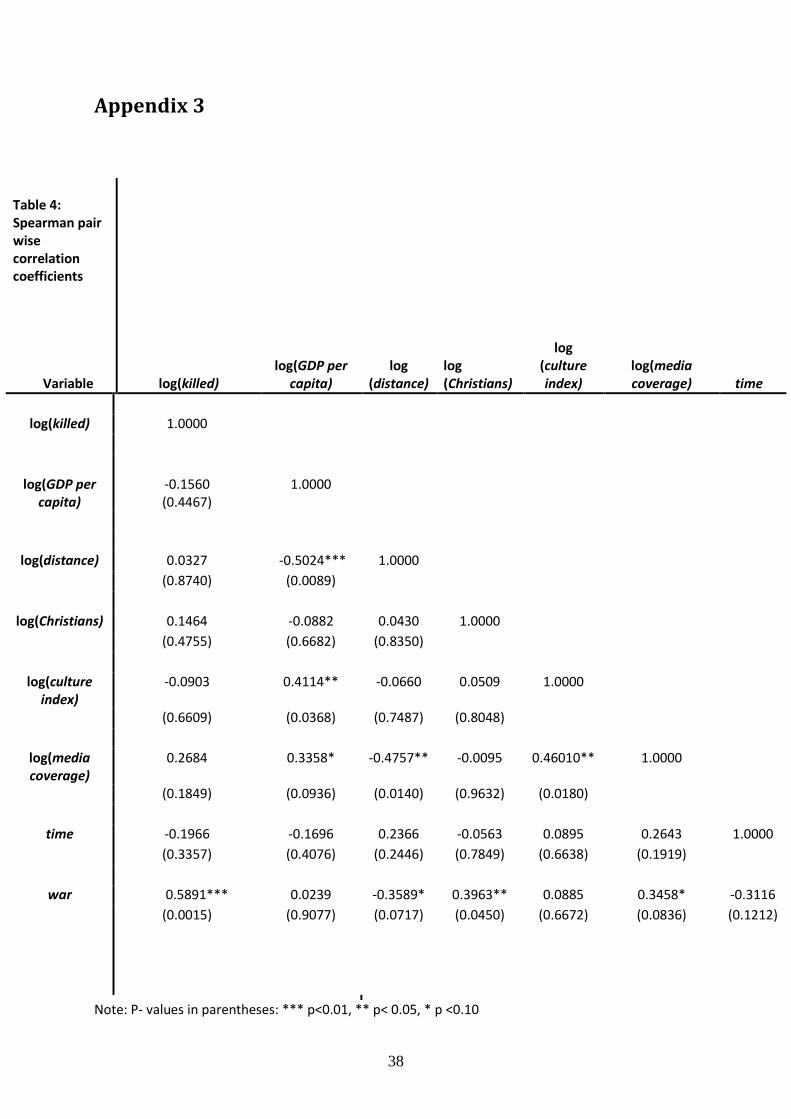
38
Appendix 3
Note: P- values in parentheses: *** p<0.01, ** p< 0.05, * p <0.10
Table 4: Spearman pair wise correlation coefficients
Variable
log(killed)
log(GDP per capita)
log (distance)
log (Christians)
log (culture index)
log(media coverage)
time
log(killed) 1.0000
log(GDP per capita)
-0.1560 (0.4467)
1.0000
log(distance) 0.0327 -0.5024*** 1.0000
(0.8740) (0.0089)
log(Christians) 0.1464 -0.0882 0.0430 1.0000
(0.4755) (0.6682) (0.8350)
log(culture index)
-0.0903 0.4114** -0.0660 0.0509 1.0000
(0.6609) (0.0368) (0.7487) (0.8048)
log(media coverage)
0.2684 0.3358* -0.4757** -0.0095 0.46010** 1.0000
(0.1849) (0.0936) (0.0140) (0.9632) (0.0180)
time -0.1966 -0.1696 0.2366 -0.0563 0.0895 0.2643 1.0000
(0.3357) (0.4076) (0.2446) (0.7849) (0.6638) (0.1919)
war 0.5891*** 0.0239 -0.3589* 0.3963** 0.0885 0.3458* -0.3116
(0.0015)
(0.9077) (0.0717) (0.0450) (0.6672) (0.0836) (0.1212)