Embed Size (px)
Citation preview

The Determination of the Age and Growth of the Perch (Perca fluviatilis) from the OpercularBoneAuthor(s): E. D. Le CrenSource: Journal of Animal Ecology, Vol. 16, No. 2 (Nov., 1947), pp. 188-204Published by: British Ecological SocietyStable URL: http://www.jstor.org/stable/1494 .
Accessed: 01/05/2014 22:36
Your use of the JSTOR archive indicates your acceptance of the Terms & Conditions of Use, available at .http://www.jstor.org/page/info/about/policies/terms.jsp
.JSTOR is a not-for-profit service that helps scholars, researchers, and students discover, use, and build upon a wide range ofcontent in a trusted digital archive. We use information technology and tools to increase productivity and facilitate new formsof scholarship. For more information about JSTOR, please contact [email protected].
.
British Ecological Society is collaborating with JSTOR to digitize, preserve and extend access to Journal ofAnimal Ecology.
http://www.jstor.org
This content downloaded from 62.122.73.193 on Thu, 1 May 2014 22:36:14 PMAll use subject to JSTOR Terms and Conditions
[ i88 ]
THE DETERMINATION OF THE AGE AND GROWTH OF THE PERCH (PERCA FLUVIATILIS) FROM THE OPERCULAR BONE
BY E. D. LE CREN, Freshwater Biological Association, Wray Castle, Ambleside, Westmorland
(With Plate 4, and 6 Figures in the Text)
CONTENTS
PAGE
I. INTRODUCTION i88
2. THE COLLECTION OF DATA I89
3. THE READING OF AGE AND GROWTI . . I89
4. THE ACCURACY OF THE AGE DETERMINATIONS . I91
5. THE BACK-CALCULATION OF GROWTH . . 192
PAGE 6. THE ACCURACY OF THE BACK-CALCULATIONS OF
GROWTH . . . . . . . I98
7. DISCUSSION AND CONCLUSIONS . . . 202
8. SUMMARY . . . . . . . 203
9. ACKNOWLEDGEMENTS . . . . . 203
REFERENCES . . . . . . 204
i. INTRODUCTION The fact that many fish show rings on such skeletal structures as scales, bones, otoliths and fin rays, has, been known for a long time. In many cases these rings have been shown to be annual in formation and to be probably due to seasonal fluctuations in growth. They thus provide a very useful method for assessing the ages of fish, and as such have been extensively used by many workers. In fact, age determination, usually from the rings on the scales, has become one of the standard methods in fishery research. Age deter- minations are very useful in practical fishery manage- ment as they can lead to assessments of mortality rates and by calculations of the mean sizes of the age groups to a knowledge of the growth rates of the fish. Additional information on the growth of fish can also be ascertained from the scales and similar skeletal structures by calculating the length of a fish at each year of its life from the proportional width of the rings laid down each year. These methods have been very widely used and a large proportion of the ex- tensive modern research on fish ecology and fishery management is based on age and growth studies using the 'scale method'.
There is also a large literature on the validity of the use of these methods, which discusses whether the rings are true annual formations and whether they provide accurate estimates of past growth. Although there is relatively little substantial direct evidence of the soundness of age and growth determinations from scales, the sum of indirect evidence leaves no doubt that in general their use is justified. At the same time the practice of many workers, who have published accounts of age and growth based on the scale method without attempting to substantiate the validity of its application to the species or problem studied, is to be
deprecated. The present paper is a preliminary to an account of the study of perch (Perca flutviatilis L.) in Windermere, and its aim is to demonstrate that the methods used to determine age and growth are valid. The literature on the method and the investigations towards proving its correctness has been discussed by several workers, and the papers of Graham (I 929) and Van Oosten (I929, 1941) give detailed reviews. It is not intended here to enter into a general discussion on the scale method and its validity.
In the perch, some age and growth studies have been made by Scandinavian and German workers, and recently the ecology of the closely related yellow perch (P. flavescens Mitchill) has been investigated in many North American waters. In nearly all cases the scales have been used, but Nilsson (I92I) concluded that in practice the opercular bone was more accurate and easier to use than the scales. Roper (1936) used scales and operculars in a study of perch in Germany, and found that infra-red photography helped to reveal the obscure inner annual rings on the oper- culars. The opercular bone has also been used by Nikolsky & Evtiukhov (I940) to determine the age of P. shrenki Kessler. Segerstrale (I933) has studied the use of the scales of the perch in detail, has shown the need for correcting back-calculated readings of growth made by direct proportion, and has con- structed a curve for this purpose.
When data were collected from the perch in Windermere in connexion with the current trap fishery experiment (Worthington, I94), Mr H. J. Buchanan-Wollaston tried using the opercular bones and compared them with scales from various parts of the perch. He discovered that the use of polarized light often clarified the rings on the operculars, and that by projection the width of these rings could easily be measured. He found that in general the
This content downloaded from 62.122.73.193 on Thu, 1 May 2014 22:36:14 PMAll use subject to JSTOR Terms and Conditions
E. D. LE CREN I89
operculars of the Windermere fish were easier to read than the scales, although at times it was useful to examine both.
The purpose of the present paper is (i) to describe the opercular bone of the perch and to give an account of the methods of examining the rings which it shows; (2) to demonstrate that these rings are true annual formations; (3) to show that there is a constant re- lationship between the growth of the opercular and the growth of the fish, and that the length of a fish at each year of its life can thus be calculated from the width of the rings on the opercular; and (4) to put forward evidence that the lengths so estimated are reasonably accurate. It does not attempt an analysis of the structure or growth of the opercular nor of the factors causing the seasonal rings on that bone. Nearly all the data used were collected and analysed primarily for other studies and have only been used for this paper in so far as they provide information on the method of age and growth determination and its accuracy.
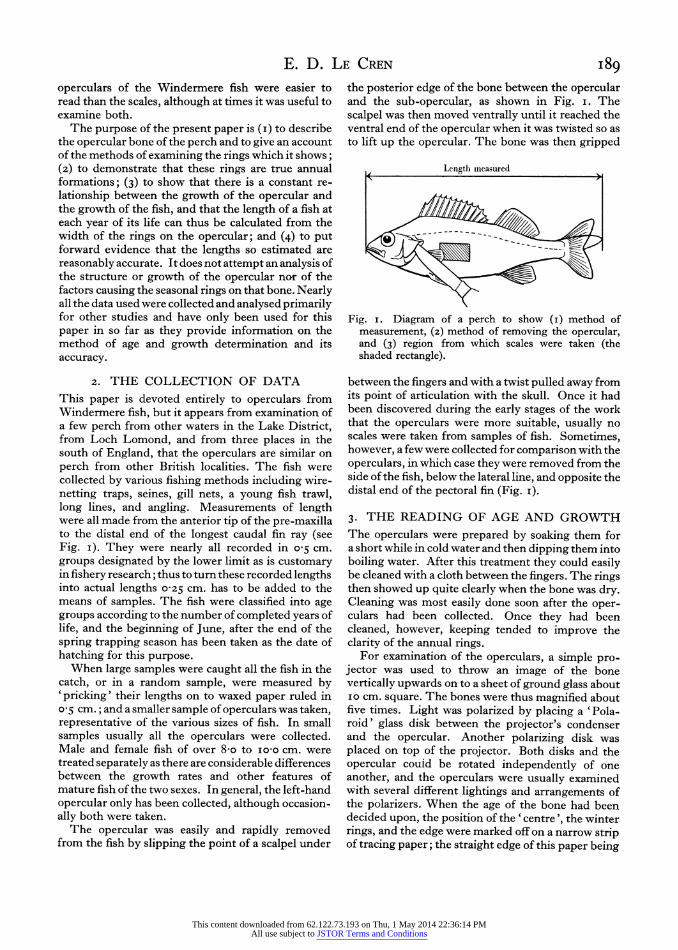
2. THE COLLECTION OF DATA This paper is devoted entirely to operculars from Windermere fish, but it appears from examination of a few perch from other waters in the Lake District, from Loch Lomond, and from three places in the south of England, that the operculars are similar on perch from other British localities. The fish were collected by various fishing methods including wire- netting traps, seines, gill nets, a young fish trawl, long lines, and angling. Measurements of length were all made from the anterior tip of the pre-maxilla to the distal end of the longest caudal fin ray (see Fig. i). They were nearly all recorded in o 5 cm. groups designated by the lower limit as is customary in fishery research; thus to turn these recorded lengths into actual lengths o025 cm. has to be added to the means of samples. The fish were classified into age groups according to the number of completed years of life, and the beginning of June, after the end of the spring trapping season has been taken as the date of hatching for this purpose.
When large samples were caught all the fish in the catch, or in a random sample, were measured by 'pricking' their lengths on to waxed paper ruled in o 5 cm.; and a smaller sample of operculars was taken, representative of the various sizes of fish. In small samples usually all the operculars were collected. Male and female fish of over 8-o to io'o cm. were treated separately as there are considerable differences between the growth rates and other features of mature fish of the two sexes. In general, the left-hand opercular only has been collected, although occasion- ally both were taken.
The opercular was easily and rapidly removed from the fish by slipping the point of a scalpel under
the posterior edge of the bone between the opercular and the sub-opercular, as shown in Fig. i. The scalpel was then moved ventrally until it reached the ventral end of the opercular when it was twisted so as to lift up the opercular. The bone was then gripped
Length measured
Fig. i. Diagram of a perch to show (i) method of measurement, (2) method of removing the opercular, and (3) region from which scales were taken (the shaded rectangle).
between the fingers and with a twist pulled away from its point of articulation with the skull. Once it had been discovered during the early stages of the work that the operculars were more suitable, usually no scales were taken from samples of fish. Sometimes, however, a few were collected for comparison with the operculars, in which case they were removed from the side of the fish, below the lateral line, and opposite the distal end of the pectoral fin (Fig. i).
3. THE READING OF AGE AND GROWTH The operculars were prepared by soaking them for a short while in cold water and then dipping them into boiling water. After this treatment they could easily be cleaned with a cloth between the fingers. The rings then showed up quite clearly when the bone was dry. Cleaning was most easily done soon after the oper- culars had been collected. Once they had been cleaned, however, keeping tended to improve the clarity of the annual rings.
For examination of the operculars, a simple pro- jector was used to throw an image of the bone vertically upwards on to a sheet of ground glass about IO cm. square. The bones were thus magnified about five times. Light was polarized by placing a 'Pola- roid' glass disk between the projector's condenser and the opercular. Another polarizing disk was placed on top of the projector. Both disks and the opercular couid be rotated independently of one another, and the operculars were usually examined with several different lightings and arrangements of the polarizers. When the age of the bone had been decided upon, the position of the 'centre , the winter rings, and the edge were marked off on a narrow strip of tracing paper; the straight edge of this paper being
This content downloaded from 62.122.73.193 on Thu, 1 May 2014 22:36:14 PMAll use subject to JSTOR Terms and Conditions
I90 Determination of the age and growth of the perch placed along a line passing through the 'centre' of the bone and perpendicular to its posterior edge. The paper was then placed on a sheet of accurate squared paper and adjusted so that the centre mark was at the origin, and the edge mark opposite the recorded length of the fish on the ordinate scale. The respective proportionate lengths were then read off on the same scale, opposite the marks representing successive winter bands. These readings, like those of the final lengths of the fish, were made in terms of 0o5 cm. length groups.
On the opercular bone (P1. 4) broad, opaque zones correspond to the rapid growth of the summer, and each of these gradually fades into a narrow trans- parent winter zone, which ends relatively abruptly, with a sharp line of discontinuity between it and the next summer zone. This sharp line marking the end of the winter band was always taken as the end of the year's growth. In well-dried operculars the rings show up most clearly when viewed with reflected light against a dark background. This kind of lighting shows the transparent winter zones dark and the opaque summer zones white, and is also the best light- ing for distinguishing between true and false rings. For measurement of the rings, however, transmitted light was used and in this case the rings showed up clearest with polarized light and when the two 'Polaroid' disks were crossed. Different a1ppearances were given to the rings by different settings of the disks and by the rotation of the opercular between them. In many of the bones the innermost, or first, winter ring was more a change over from one broad zone to another, it was often not clear without the use of the polarizers, and even then it was generally difficult to place in large and thick operculars. Most of the growth of the perch in Windermere is confined to the months between May and October and operculars from fish caught between October and April showed the beginning of a transparent 'winter' band on the edge. The abrupt ending of the winter ring, its really characteristic feature, could -not, however, be seen on the edge of the opercular till the perch had started its next season's growth. Apart from the different character of the first winter ring no obvious differences were found between the rings laid down when the fish were immature and when they had spawned, comparable to the spawning marks on the scales of the Salmonidae.
The gradual change from opacity to transparency ending abruptly at the beginning of another opaque zone is characteristic of the true annual ring, and although false rings were sometimes frequent, on careful examination they could usually be distin- guished by their abrupt change from an opaque zone to a thin transparent band followed again by an opaque zone. In one case the formation of a false ring on the operculars of nearly all the fish from one locality was
traced by a succession of samples throughout the summer. Although, when it first appeared, this ring was sometimes mistaken for a true annual ring, when new summer growth had been added outside it, its false nature was realized and the mistakes corrected. The false rings were usually found in the middle of the summer's growth, and in fast-growing fish there is often a rather sudden reduction in opacity half-way through the summer zone which was sometimes on first examination mistaken for an annual ring. Although with young and fast-growing fish there was rarely any doubt as to the age, in some older fish several different interpretations could be made. After practice it was possible to give nearly all of these an estimated age, though in many cases more by the general appearance of the rings, than by any definable characters.
a
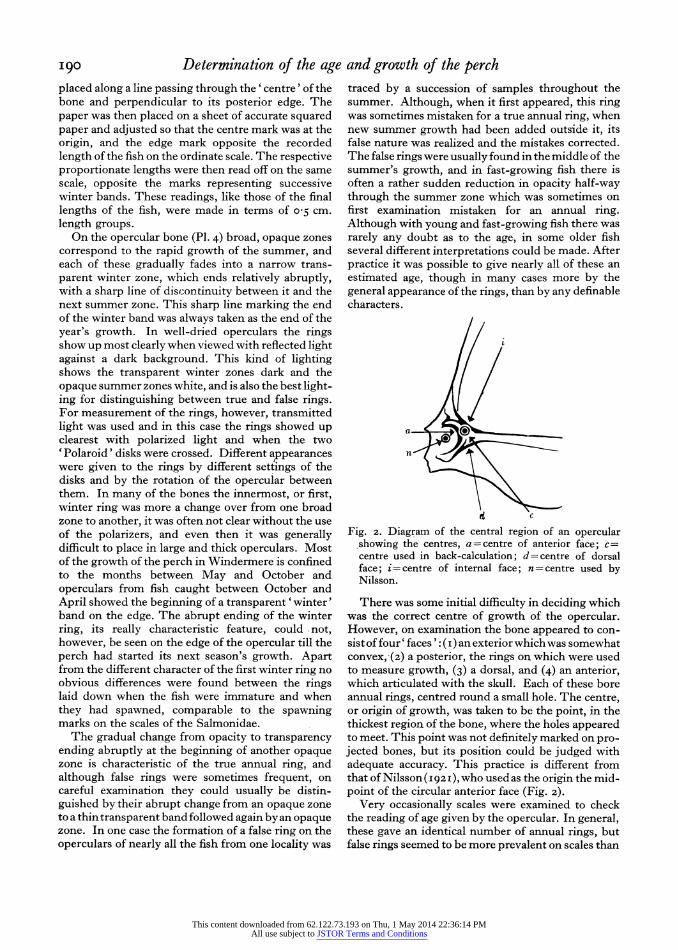
n
Fig. 2. Diagram of the central region of an opercular showing the centres, a = centre of anterior face; c- centre used in back-calculation; d = centre of dorsal face; i=centre of internal face; n=centre used by Nilsson.
There was some initial difficulty in deciding which was the correct centre of growth of the opercular. However, on examination the bone appeared to con- sistof four' faces ': (i) an exteriorwhichwas somewhat convex, (z) a posterior, the rings on which were used to measure growth, (3) a dorsal, and (4) an anterior, which articulated with the skull. Each of these bore annual rings, centred round a small hole. The centre, or origin of growth, was taken to be the point, in the thickest region of the bone, where the holes appeared to meet. This point was not definitely marked on pro- jected bones, but its position could be judged with adequate accuracy. This practice is different from that of Nilsson(I92I),who used as the origin the mid- point of the circular anterior face (Fig. 2).
Very occasionally scales were examined to check the reading of age given by the opercular. In general, these gave an identical number of annual rings, but false rings seemed to be more prevalent on scales than
This content downloaded from 62.122.73.193 on Thu, 1 May 2014 22:36:14 PMAll use subject to JSTOR Terms and Conditions
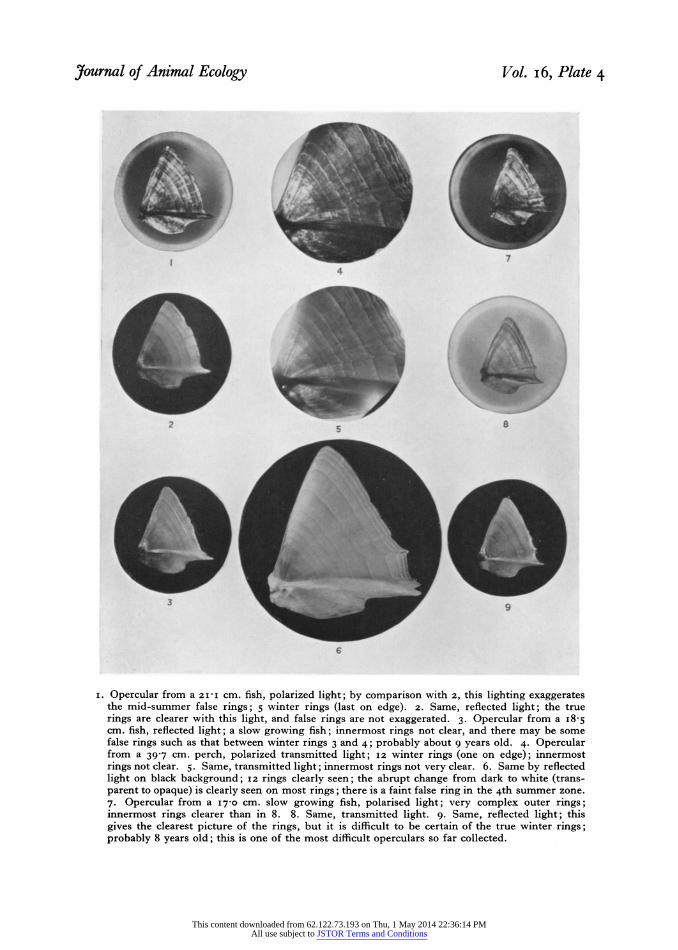
Journal of Animal Ecology Vol. i6, Plate 4
7 4
3 ~~~~~~~~~~~~~~~9
i[. Opercular from a 21 I - cm. fish, polarized light; by comparison with 2, this lighting exaggerates the mid-summner false rings; 5 winter rings (last on edge). 2. Same, reflected light; the true rings are clearer with this light, and false rings are not exaggerated. 3. Opercular froma a8- cm. fish, reflected light; a slow growing fish; innermost rings not clear, and there may be some false rings such as that between winter rings 3 and 4; probably about 9 years old. 4. Opercular from a 39-7 cm. perch, polarized transmitted light; 12 winter rings (one on edge); innermost rings not clear. 5. Same, transmitted light; innermost rings not very clear. 6. Same by reflected light on black background; a2 rings clearly seen; the abrupt change from dark to white (trans- parent to opaque) is clearly seen on most rings; there is a faint false ring in the 4th summer zone. 7. Opercular from a I7O cm. slow growing fish, polarised light; very complex outer rings; innermost rings clearer than in 8. 8. Same, transmit ted light. 9. Same, reflected light; this gives the clearest picture of the rings, but it is difficult to be certain of the true winter rings; probably 8 years old; this is one of the most difficult operculars so far collected.
This content downloaded from 62.122.73.193 on Thu, 1 May 2014 22:36:14 PMAll use subject to JSTOR Terms and Conditions
E. D. LE CREN I9I
on the operculars, though their presence often corre- sponded in the two cases. No detailed study of the scales has been made, and only the opercular of most fish was used. The scales of the perch have been studied in some detail by Segerstrale (I933).
4. THE ACCURACY OF THE AGE DETERMINATIONS
The accuracy of age determinations made from rings on scales or bones can be substantiated by evidence of at least five main kinds (Graham, I929; Van Oosten, 1929, 1941):
(I) In length-frequency curves of young fish, each age group is generally represented by a distinct mode. Agreement between the age as determined from the successive modes and as determined from the number of rings on the skeletal structure is evidence of the accuracy of the latter. Substantial agreement between the modal lengths of frequency curves and the mean lengths as back-calculated by a correct method from the rings on scales or bones is additional evidence of this type.
(2) In a population of fish, variations in the success of the annual hatch may lead to considerable varia- tions in the relative abundance of the year classes. This may make a particular year class recognizable as unusually abundant or scarce, and so through its annual appearance as a successively older age group each year, a check can be made on the annual forma- tion of the rings on skeletal structures.
(3) If the rings on the scales or bones are annual formations, examination of their growing edge throughout the year should reveal an annual cycle in the structure seen at that edge.
(4) Fish can be marked when fry, or at a known age, and then released. When recaptured the number of rings on their skeletal structures should agree with their known age.
(5) Fish reared in ponds or aquaria are often of known age, and the rings on their scales and bones can be checked against this known age.
The main evidence produced in support of the rings on the perch opercular being annual formations falls into the first three of the catagories given above. The length frequencies of younger perch are presented first in some detail, and then an example is given of a dominant year class being traced in two successive seasons. The appearance of the edge of the opercular throughout the year has not been analysed, but mention has already been madt that operculars of fish caught in the summer invariably showed 'plus growth' outside a completed winter ring.
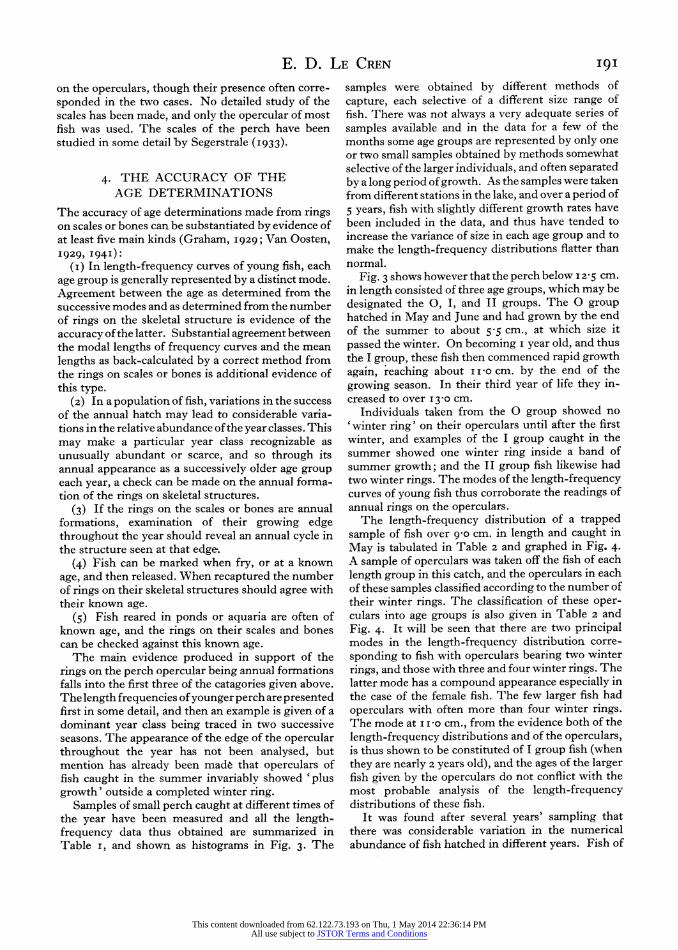
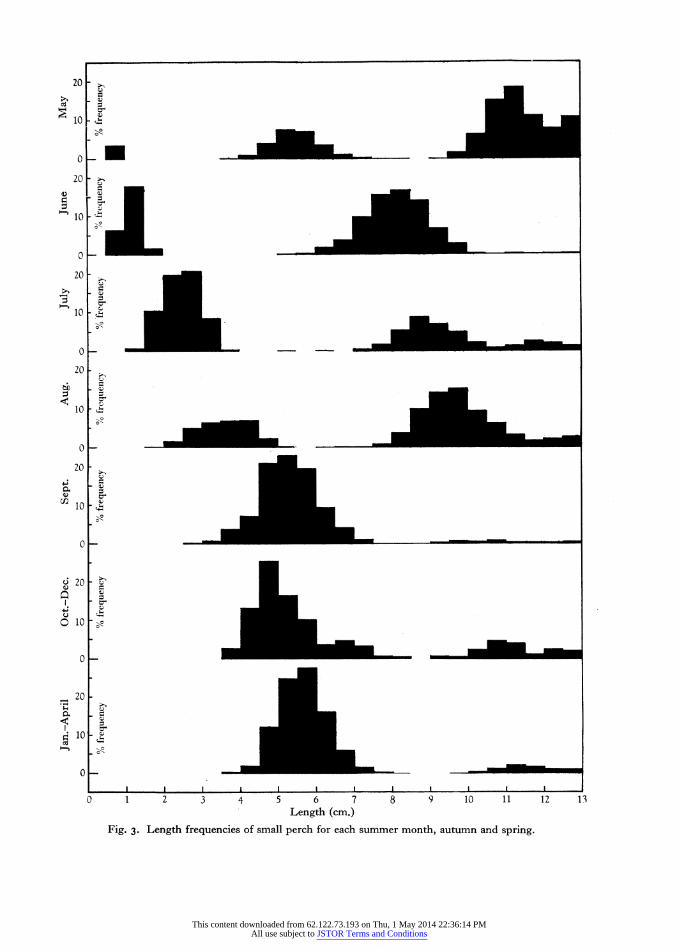
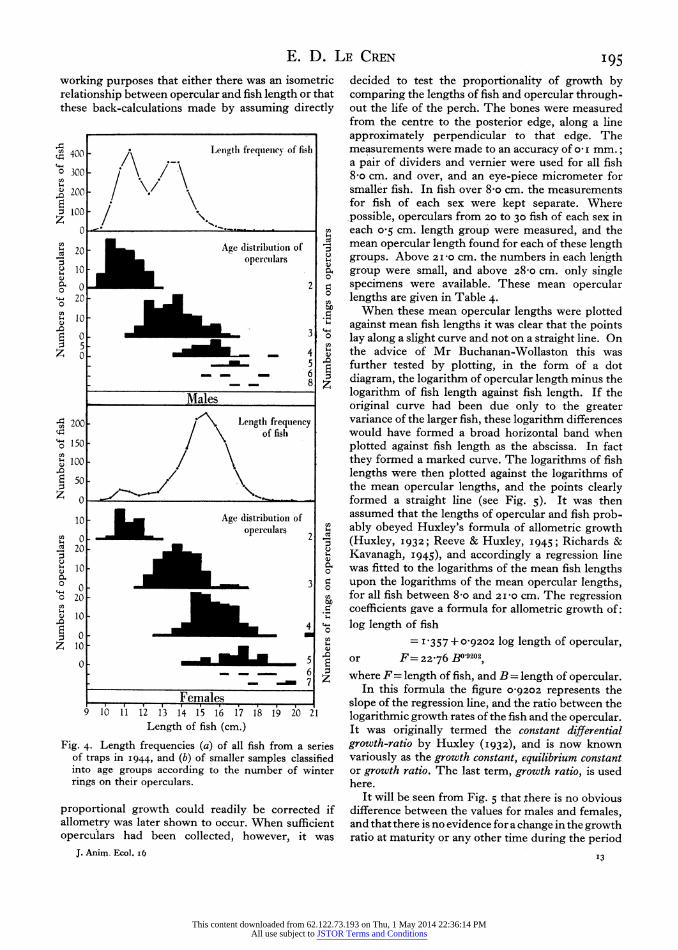
Samples of small perch caught at different times of the year have been measured and all the length- frequency data thus obtained are summarized in Table i, and shown as histograms in Fig. 3. The
samples were obtained by different methods of capture, each selective of a different size range of fish. There was not always a very adequate series of samples available and in the data for a few of the months some age groups are represented by only one or two small samples obtained by methods somewhat selective of the larger individuals, and often separated by a long period of growth. As the samples were taken from different stations in the lake, and over a period of 5 years, fish with slightly different growth rates have been included in the data, and thus have tended to increase the variance of size in each age group and to make the length-frequency distributions flatter than normal.
Fig. 3 shows however that the perch below 12-5 cm. in length consisted of three age groups, which may be designated the 0, I, and II groups. The 0 group hatched in May and June and had grown by the end of the summer to about 5-5 cm., at which size it passed the winter. On becoming i year old, and thus the I group, these fish then commenced rapid growth again, reaching about i i o cm. by the end of the growing season. In their third year of life they in- creased to over I3-0 cm.
Individuals taken from the 0 group showed no 'winter ring' on their operculars until after the first winter, and examples of the I group caught in the summer showed one winter ring inside a band of summer growth; and the II group fish likewise had two winter rings. The modes of the length-frequency curves of young fish thus corroborate the readings of annual rings on the operculars.
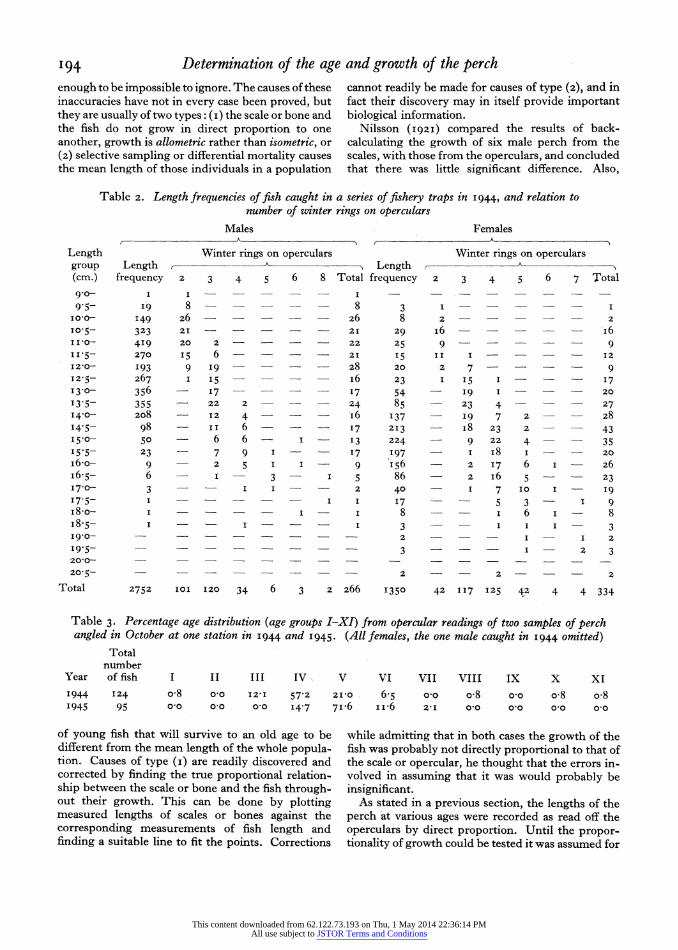
The length-frequency distribution of a trapped sample of fish over 9go cm. in length and caught in May is tabulated in Table 2 and graphed in Fig. 4. A sample of operculars was taken off the fish of each length group in this catch, and the operculars in each of these samples classified according to the number of their winter rings. The classification of these oper- culars into age groups is also given in Table 2 and Fig. 4. It will be seen that there are two principal modes in the length-frequency distribution corre- sponding to fish with operculars bearing two winter rings, and those with three and four winter rings. The latter mode has a compound appearance especially in the case of the female fish. The few larger fish had operculars with often more than four winter rings. The mode at ii -o cm., from the evidence both of the length-frequency distributions and of the operculars, is thus shown to be constituted of I group fish (when they are nearly 2 years old), and the ages of the larger fish given by the operculars do not conflict with the most probable analysis of the length-frequency distributions of these fish.
It was found after several years' sampling that there was considerable variation in the numerical abundance of fish hatched in different years. Fish of
This content downloaded from 62.122.73.193 on Thu, 1 May 2014 22:36:14 PMAll use subject to JSTOR Terms and Conditions
I92 Determination of the age and growth of the perch one year class frequently showed a preponderance over those a year younger and those a year older. One example of this is given in Table 3 which shows the age distribution as deduced from opercular readings, of two comparable samples taken in the same month at the same place, but the second a year after the first. A majority of the fish (57 %) in the I944 sample had four rings on their operculars, indicating that they belonged to the I940-year class and were 4+ years old; while a majority (7I %) of the I945 sample had
Table i. Monthly length frequencies of perch below I3'0 cm. All samples to I944 combined. In the spring and autumn totals data, additional to those given under the separate months, have been added; the exact date of capture of these fish is unknown
Length group Jan.-Apr. Oct.-Dec. (cm.) Jan. Feb. Mar. Apr. May June July Aug. Sept. Oct. Nov. Dec. ( + others) (+ others) 0o0
0-5- - - IOO 67 ? ? ? ? ? ? ?--- i86 I2? ? ? ? ? ?- -
I-5- i8 172 2 - - - -
2-0- -? 323 69 - - -
2-5- 339 22I 6 - -
3-0- -- -14I 28i 26 - - -
3 5 - 7 I 5 302 132 15 - 7 15 4 0 I - 44 26 305 4I6 67 4 45 71 4 5- 8 - 3 275 112 - 104 7I8 130 7 286 I37 5-0 20 - II 553 221 2 I I4 789 74 I5 584 89 5 5 3I I 3I 585 206 4 - 672 35 12 8 648 55 6-o- 33 I I3 333 102 I9 I 2 325 IO 8 2 380 20
6-5- i9 I - 122 36 39 6 I43 6 20 I43 26 7 0- 9 I 29 8 102 9 5 38 - i8 39 i8 7.5 7 - - 3 4 i62 28 37 I - 4 IO 4 8o I - - 2 174 88 I64 I - 3 I 3 8-5- - - 146 144 429 2 --- -
9-0- - 4 71 II4 6i6 15 4 - 4 9 5 I _- - 46 30 82 666 25 3 - 3 3
100- I I 7 I86 4 36 413 22 9 - - I3 105 - - I 20 442 I 15 273 31 20 3 30 26 II*-O I I 3 27 530 3 23 144 I5 I5 I 54 22
II-5- 2 26 326 2 43 73 I4 3 2 43 7 12-0- - 17 227 3 34 IOI 12 5 I 30 14 I2-5 - I I I5 315 4 23 II9 20 6 - 29 12
Total I31 6 67 2063 2894 I037 I633 4346 3423 402 65 43 2344 539
five rings on their operculars, thus indicating that they were the same year class as that dominant in I944, but were a year older, and had added one ring to their operculars during the intervening winter. This can be considered as additional evidence that the rings on the operculars are annual rings and are thus accurate indications of age.
5. THE BACK-CALCULATION OF GROWTH
When growth made in each year of life has been back- calculated from the rings on the scales or bones of fish it has often been assumed that the scale or bone
grew in direct proportion to the fish. The lengths at each year were calculated from the formula:
Fx = FyBx By'
where Bx = length (or diameter, etc.) of the scale or bone at a particular age, Fx = the corresponding length of the fish, By = final length of the scale, and Fy = final length of the fish. Alternatively, the lengths could be read off a projected image of the scale or
bone by a graphical method such as the one described above for the opercular of the perch. This method of back-calculating the growth of a fish is often known as the 'Dahl-Lea' method, after its principal originators.
The method has been used very widely, often without its accuracy being questioned, but in many cases when the method has been tested by comparing the mean lengths of age groups as measured from actual fish and as back-calculated from older fish in- accuracies have been discovered. In some cases they were not large enough to be of practical importance, but in other cases they were large and consistent
This content downloaded from 62.122.73.193 on Thu, 1 May 2014 22:36:14 PMAll use subject to JSTOR Terms and Conditions
201-
10 [
~ 0 10
10 20
10 Z
o
0
20
10 e
0
~20
10
0 10
10
0o _______________
20
10 t?
O
0 1 2 3 4 5 6 7 8 9 10 11 12 13 Length (cm.)
Fig. 3. Length frequencies of small perch for each summer month, autumn and spring.
This content downloaded from 62.122.73.193 on Thu, 1 May 2014 22:36:14 PMAll use subject to JSTOR Terms and Conditions
194 Determination of the age and growth of the perch enough to be impossible to ignore. The causes of these inaccuracies have not in every case been proved, but they are usually of two types: (I) the scale or bone and the fish do not grow in direct proportion to one another, growth is allometric rather than isometric, or (z) selective sampling or differential mortality causes the mean length of those individuals in a population
Table 2. Length frequencies of fish caught in a series of fishery traps in I944, and relation to number of winter rings on operculars
Males Females
Length Winter rings on operculars Winter rings on operculars group Length ,- Length (cm.) frequency 2 3 4 5 6 8 Total frequency 2 3 4 5 6 7 Total 90- I ?? I - -I
95- I9 8 - _ 8 3 1 - - - 100- I49 26 - - 26 8 2 - - - 2 10o5- 323 21 - _ 21 29 I6 - - I6 I110- 4I9 20 2 - - - 22 25 9 ? 9 11-5- 270 I5 6 - - - - 21 I5 II I - - I2
I2,0- I93 9 19 - - - - 28 20 2 7 - -- 9 12-5- 267 I 5 - - - I6 23 I 15 I - - I7 I3-0- 356 - 17- 17 54 I9 I - - 20
13-5- 355 - 22 2 - - - 24 85 23 4 - - 27 I4.0- 2o8 - 12 4 -- I6 137 I9 7 2 - - 28 14.5- 98 - II 6 - - - 17 213 i8 23 2 - - 43 I 5 o- 50 6 6 I - 13 224 9 22 4 - - 35 I 5-5_ 23 7 9 I - 17 197 - i8 I - - 20
I6-o- 9 2 5 I I 9 I56 2 7 6 I - 26 I6.5- 6 - - 3 I 5 86 2 i6 5 - - 23 I7-0- 3 - - I I - - 2 40 - I 7 IO I - I9
'7.5- I - I I I7 - 5 3 I 9 I8-o- I - - - I 8 - I 6 I - 8 I8.5- I I - I 3 - I I I - 3 I9-0- ? ? ? ? ? ? ? ? 2 - - - I I 2
I95 3 - - - I 2 3 20-0- ? _ _
205- - ?2 - 2 - - - 2
Total 2752 IOI 120 34 6 3 2 266 1350 42 117 125 42 4 4 334
Table 3. Percentage age distribution (age groups I-XI) .from opercular readings of two samples of perch angled in October at one station in I944 and I945. (All females, the one male caught in I944 omitted)
Total number
Year of fish I II III IV V VI VII VIII IX X XI 1944 124 o-8 0o0 I2-I 57'2 2I-0o 6-5 0-0 o-8 o-o o-8 o-8 1945 95 0o0 0?0 0? 0 I4.7 7I.6 ii'6 2-I 010 0-0 0-0 0-0
of young fish that will survive to an old age to be different from the mean length of the whole popula- tion. Causes of type (i) are readily discovered and corrected by finding the true proportional relation- ship between the scale or bone and the fish through- out their growth. This can be done by plotting measured lengths of scales or bones against the corresponding measurements of fish length and finding a suitable line to fit the points. Corrections
cannot readily be made for causes of type (2), and in fact their discovery may in itself provide important biological information.
Nilsson (I92I) compared the results of back- calculating the growth of six male perch from the scales, with those from the operculars, and concluded that there was little significant difference. Also,
while admitting that in both cases the growth of the fish was probably not directly proportional to that of the scale or opercular, he thought that the errors in- volved in assuming that it was would probably be insignificant.
As stated in a previous section, the lengths of the perch at various ages were recorded as read off the operculars by direct proportion. Until the propor- tionality of growth could be tested it was assumed for
This content downloaded from 62.122.73.193 on Thu, 1 May 2014 22:36:14 PMAll use subject to JSTOR Terms and Conditions
E. D. LE CREN I95 working purposes that either there was an isometric relationship between opercular and fish length or that these back-calculations made by assuming directly
- 400l r ii Lenigthi frequienicy of fishi
40 0 - Aedsrbtolo
0 300 - \ 200 / \/
0 3 o
2 Age distribution ofre
2 0 -< _
5 opercullars o 0 10 Q) ~~~~~~~~~~~~0 0 0 2 r,m
o 20 -M0 0 4
Z 10 ._-_ a
0 _3 _E 5 - ,
Zo -~~~~~~~~~~~~~
___- 6 z;
Males
W-0 200 / Length frequency Length o f f is(m
0 150 -
5 50
10 a Age distribution of wn operctplars
20 20
v 10 - 0 0 _ _ _ _3__ _
0 t20 - Cdi
10 .0 ~~~~~~~~~~~~~4C Z 10~~~~~~~~~~~~ 0~~~~~~~~~~~~~~~.
0- - -7 Z
Females 9 ib 11 12 13 14 15 16 1'7 18 19 20 2 1
Length of fish (cm.)
Fig. 4. Length frequencies (a) of all fish from a series of traps in I944, and (b) of smaller samples classified into age groups according to the number of winter rings on their operculars.
proportional growth could readily be corrected if allometry was later shown to occur. When sufficient operculars had been collected, however, it was
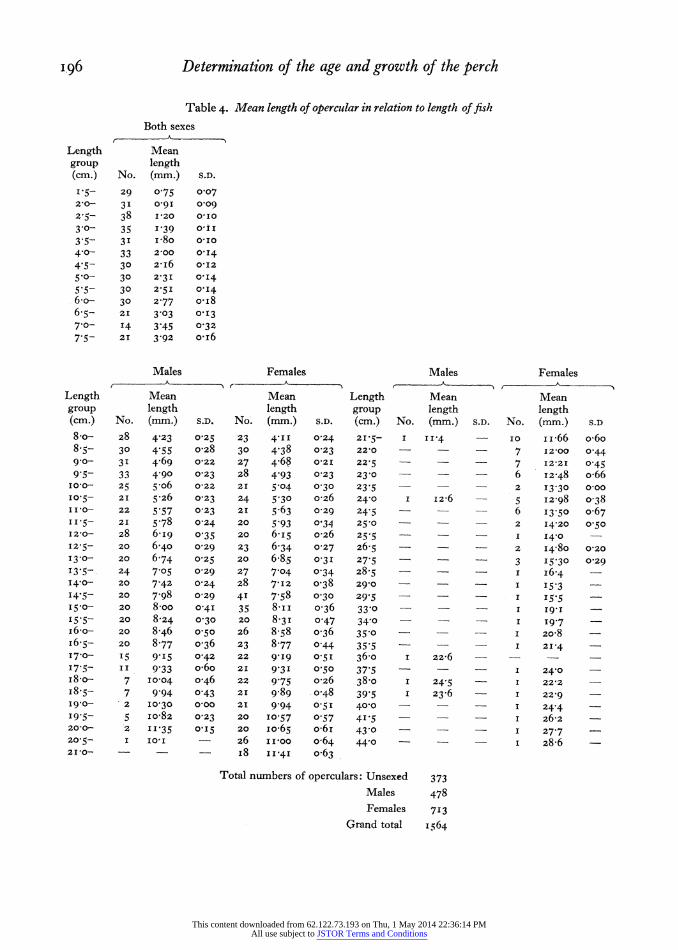
decided to test the proportionality of growth by comparing the lengths of fish and opercular through- out the life of the perch. The bones were measured from the centre to the posterior edge, along a line approximately perpendicular to that edge. The measurements were made to an accuracy of o0 I mm.; a pair of dividers and vernier were used for all fish 8 o cm. and over, and an eye-piece micrometer for smaller fish. In fish over 8-o cm. the measurements for fish of each sex were kept separate. Where possible, operculars from 20 to 30 fish of each sex in each o 5 cm. length group were measured, and the mean opercular length found for each of these length groups. Above 2I-0 cm. the numbers in each length group were small, and above 28-o cm. only single specimens were available. These mean opercular lengths are given in Table 4.
When these mean opercular lengths were plotted against mean fish lengths it was clear that the points lay along a slight curve and not on a straight line. On the advice of Mr Buchanan-Wollaston this was further tested by plotting, in the form of a dot diagram, the logarithm of opercular length minus the logarithm of fish length against fish length. If the original curve had been due only to the greater variance of the larger fish, these logarithm differences would have formed a broad horizontal band when plotted against fish length as the abscissa. In fact they formed a marked curve. The logarithms of fish lengths were then plotted against the logarithms of the mean opercular lengths, and the points clearly formed a straight line (see Fig. 5). It was then assumed that the lengths of opercular and fish prob- ably obeyed Huxley's formula of allometric growth (Huxley, I932; Reeve & Huxley, I945; Richards & Kavanagh, I945), and accordingly a regression line was fitted to the logarithms of the mean fish lengths upon the logarithms of the mean opercular lengths, for all fish between 8-o and 2Izo cm. The regression coefficients gave a formula for allometric growth of: log length of fish
= I-357 + 0-9202 log length of opercular, or F= 22-76 B0 9202,
where F= length of fish, and B = length of opercular. In this formula the figure 0'9202 represents the
slope of the regression line, and the ratio between the logarithmic growth rates of the fish and the opercular. It was originally termed the constant differential growth-ratio by Huxley (1932), and is now known variously as the growth constant, equilibrium constant or growth ratio. The last term, growth ratio, is used here.
It will be seen from Fig. 5 that there is no obvious difference between the values for males and females, and that there is no evidence for a change in the growth ratio at maturity or any other time during the period
J. Anim. Ecol. I6
This content downloaded from 62.122.73.193 on Thu, 1 May 2014 22:36:14 PMAll use subject to JSTOR Terms and Conditions
.96 Determination of the age and growth of the perch
Table 4. Mean length of opercular in relation to length of fish Both sexes
Length Mean group length (cm.) No. (mm.) S.D.
1-5- 29 0-75 0?07 2'0- 31 0-9I 0-09
2.5- 38 120 0'I0 3 0- 35 I 39 O'II
3.5- 3I I-8o Q'i0 4?0- 33 2-00 0'I4 4 5- 30 2-I6 O0I2 5 0- 30 2-31 0-I4
5*5- 30 2'5I O'I4 6o- 30 2 77 oi8 6-5- 221 3.03 0'I3 7 0- I4 3 45 0-32 7-5- 21 3 92 O'i6
Males Females Males Females A-
. , . " A - -- A
-
Length Mean Mean Length Mean Mean group length length group length length (cm.) No. (mm.) S.D. No. (mm.) S.D. (cm.) No. (mm.) S.D. No. (mm.) S.D
8-o- 28 4 23 0-25 -23 4-II 0'24 2 15- I 11P4 - I0 I -66 o-6o 8-5- 30 4 55 o-28 30 4-38 0o23 22-0 - 7 12-00 0 44 90?- 3I 4.69 o022 27 4.68 021 22-5 - 7 12-21 0o45 9 5- 33 4g90 0o23 z8 4 93 0-23 230 - - - 6 I2-48 o-66
I0-0- 25 5.o6 0-22 21 5.04 0?30 23-5 2 13-30 0o00 10-5- 2I 5 26 0-23 24 5'30 0-26 24-0 1 12-6 - I2-98 038 I10- 22 5.57 0-23 21 5.63 0 29 245 - - - 6 I3-50 o067 II.5- 21 5.78 0-24 20 5.93 O 34 250 - _ 2 14-20 0-50 I2-0- 28 6-i9 0-35 20 6.I5 o-26 25'5 - - I 140 -
12-5- 20 6-40 0-29 23 6-34 0-27 26-5 2 I4-80 0-20 I3.0- 20 6 74 0?25 20 6.85 0-31 27 5 3 I5-30 0 29 I3-5- 24 705 0-29 27 7'04 0o34 28-5 - - - I I6.4 14.0- 20 7.42 0-24 28 7'I2 0-38 29-0 - - _ I I5 3 I4.5- 20 7.98 0-29 4I 7-58 0-30 29 5 - - 155 15.0- 20 8-oo 0-4I 35 8-iI o-36 330 ? I I9-I - I5'5 20 8-24 0 30 20 8-3I 0o47 340 - I I9.7 ir6o 20 8-46 0 50 26 8 58 036 350 I 20-8 - I6.5- 20 8.77 0o36 23 8-77 0o44 355 - I 21-4 17.0- 15 9-I5 0-42 22 9'I9 0.51 360o I 22-6 - - -
17'5- II 9 33 o'6o 21 9'3I 0-50 37-5 - - - I 24-0 -
i8-o- 7 10-04 0o46 22 9.75 0-26 38.o I 24 5 I 222 -
I8-5- 7 9 94 0?43 21 9-89 0o48 39 5 I 23-6 I 22-9 -
I9-0- 2 I0-30 0-00 21 9 94 0-51 40-0 - - - I 24 4 I9-5- 5 io-82 0-23 20 10-57 O 57 4'5 - _ I 26-2 -
200- 2 II 35 015 20 io065 o-6I 43 0 - I 27 7 20-5- I IO,I - 26 II-00 o-64 44?0 I 28-6 -
210- - i8 I I.4I o-63
Total numbers of operculars: Unsexed 373 Males 478 Females 713
Grand total i564
This content downloaded from 62.122.73.193 on Thu, 1 May 2014 22:36:14 PMAll use subject to JSTOR Terms and Conditions
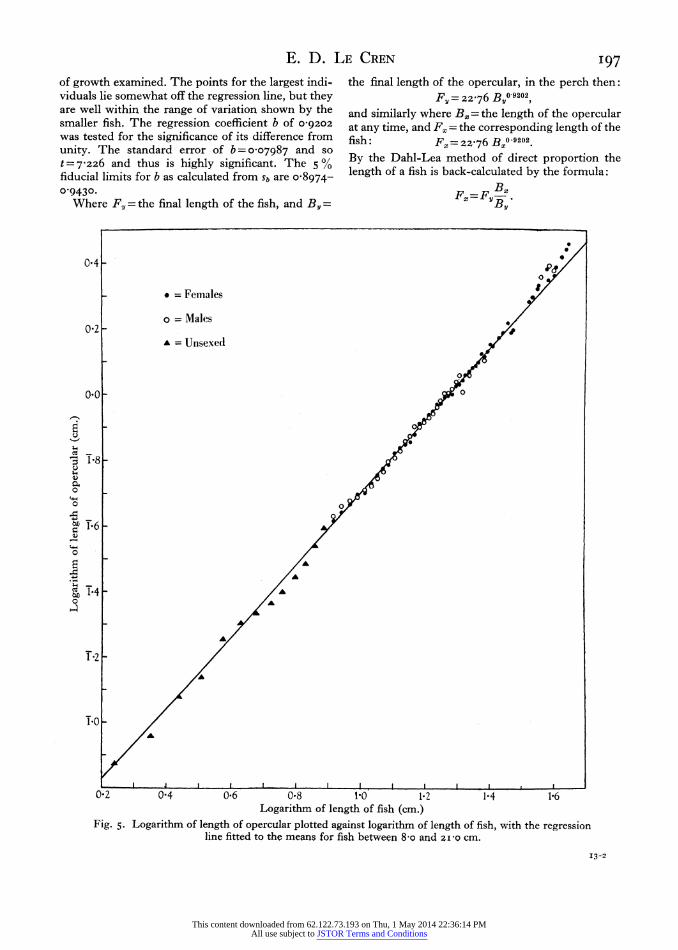
E. D. LE CREN I97 of growth examined. The points for the largest indi- viduals lie somewhat off the regression line, but they are well within the range of variation shown by the smaller fish. The regression coefficient b of 0-9202
was tested for the significance of its difference from unity. The standard error of b = 0-07987 and so t = 7226 and thus is highly significant. The 5 % fiducial limits for b as calculated from Sb are o08974-
0?9430. Where Fv = the final length of the fish, and B, =
the final length of the opercular, in the perch then: Fy= 22'76 ByO'9202
and similarly where B$, =the length of the opercular at any time, and F$ = the corresponding length of the fish: F = 22-76 Bx0 9202.
By the Dahl-Lea method of direct proportion the length of a fish is back-calculated by the formula:
F., = Fy Bx B.y
04 - 0
= Females
o = Males 0-2 -8
A Unsexed
0
0'0 0
0
1--4
'3 1-8 0
'-4
0 0
0
14-4
0T 2 0*4 06 0-8 10 1-2 1-4 166 Logarithm of length of fish (cm.)
Fig. 5. Logarithm of length of opercular plotted against logarithm of length of fish, with the regression line fitted to the means for fish between 8 -o and 21I-O cm.
0~~~~~~~~~~~~~~~~~~~~~~~~~~~~~~~~1-
This content downloaded from 62.122.73.193 on Thu, 1 May 2014 22:36:14 PMAll use subject to JSTOR Terms and Conditions
I98 Determination of the age and growth of the perch But using the opercular of the perch this should become: B00 9202
FF OBy0-9202
This can also be expressed in a logarithmic form which is easier to compute:
log Fx = log F, + o09202 (log Bx - log By). This formula can be applied to actual measure-
ments of the bone, or to proportions of Bx and By, however they may be recorded. Thus if B0 and By
f ---------- a
.E.~~~~.
r - ? -_vY
0
Length of opercular
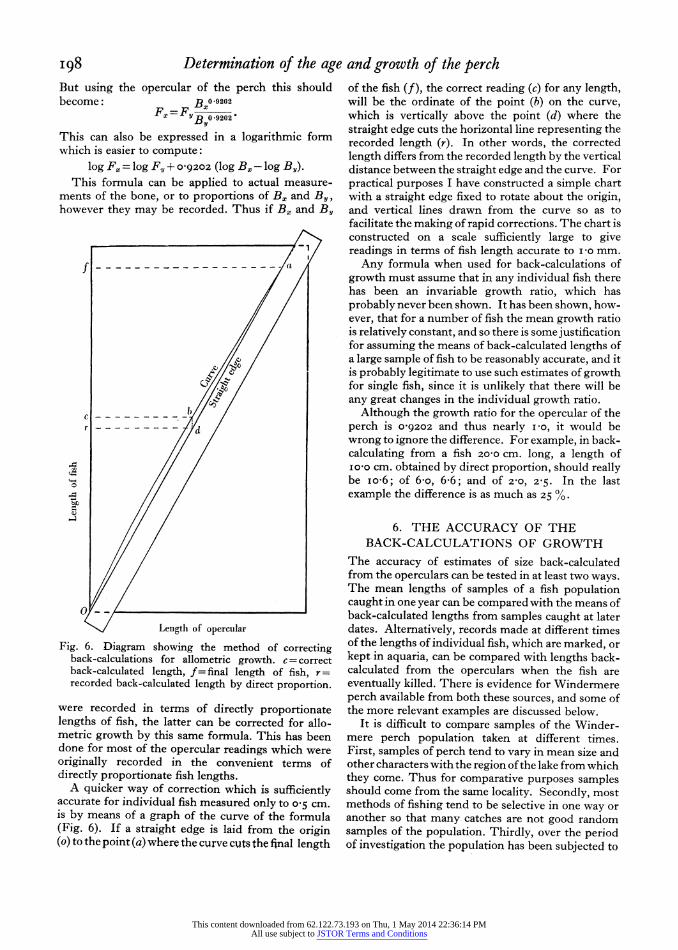
Fig. 6. Diagram showing the method of correcting back-calculations for allometric growth. c = correct back-calculated length, f= final length of fish, r = recorded back-calculated length by direct proportion.
were recorded in terms of directly proportionate lengths of fish, the latter can be corrected for allo- metric growth by this same formula. This has been done for most of the opercular readings which were originally recorded in the convenient terms of directly proportionate fish lengths.
A quicker way of correction which is sufficiently accurate for individual fish measured only to o 5 cm. is by means of a graph of the curve of the formula (Fig. 6). If a straight edge is laid from the origin (o) to the point (a) where the curve cuts the final length
of the fish (f), the correct reading (c) for any length, will be the ordinate of the point (b) on the curve, which is vertically above the point (d) where the straight edge cuts the horizontal line representing the recorded length (r). In other words, the corrected length differs from the recorded length by the vertical distance between the straight edge and the curve. For practical purposes I have constructed a simple chart with a straight edge fixed to rotate about the origin, and vertical lines drawn from the curve so as to facilitate the making of rapid corrections. The chart is constructed on a scale sufficiently large to give readings in terms of fish length accurate to ivo mm.
Any formula when used for back-calculations of growth must assume that in any individual fish there has been an invariable growth ratio, which has probably never been shown. It has been shown, how- ever, that for a number of fish the mean growth ratio is relatively constant, and so there is some justification for assuming the means of back-calculated lengths of a large sample of fish to be reasonably accurate, and it is probably legitimate to use such estimates of growth for single fish, since it is unlikely that there will be any great changes in the individual growth ratio.
Although the growth ratio for the opercular of the perch is 09202 and thus nearly i -o, it would be wrong to ignore the difference. For example, in back- calculating from a fish 20-0 cm. long, a length of io0o cm. obtained by direct proportion, should really be io-6; of 6-o, 6 6; and of 2-0, 2-5. In the last example the difference is as much as 25 0.
6. THE ACCURACY OF THE BACK-CALCULATIONS OF GROWTH
The accuracy of estimates of size back-calculated from the operculars can be tested in at least two ways. The mean lengths of samples of a fish population caught in one year can be compared with the means of back-calculated lengths from samples caught at later dates. Alternatively, records made at different times of the lengths of individual fish, which are marked, or kept in aquaria, can be compared with lengths back- calculated from the operculars when the fish are eventually killed. There is evidence for Windermere perch available from both these sources, and some of the more relevant examples are discussed below.
It is difficult to compare samples of the Winder- mere perch population taken at different times. First, samples of perch tend to vary in mean size and other characters with the region of the lake from which they come. Thus for comparative purposes samples should come from the same locality. Secondly, most methods of fishing tend to be selective in one way or another so that many catches are not good random samples of the population. Thirdly, over the period of investigation the population has been subjected to
This content downloaded from 62.122.73.193 on Thu, 1 May 2014 22:36:14 PMAll use subject to JSTOR Terms and Conditions
E. D. LE CREN 199
a very heavy and selective mortality by the trap fishery, so that in back-calculating one or more years, not the whole original population is being sampled, but only that part of it which has survived selection by the
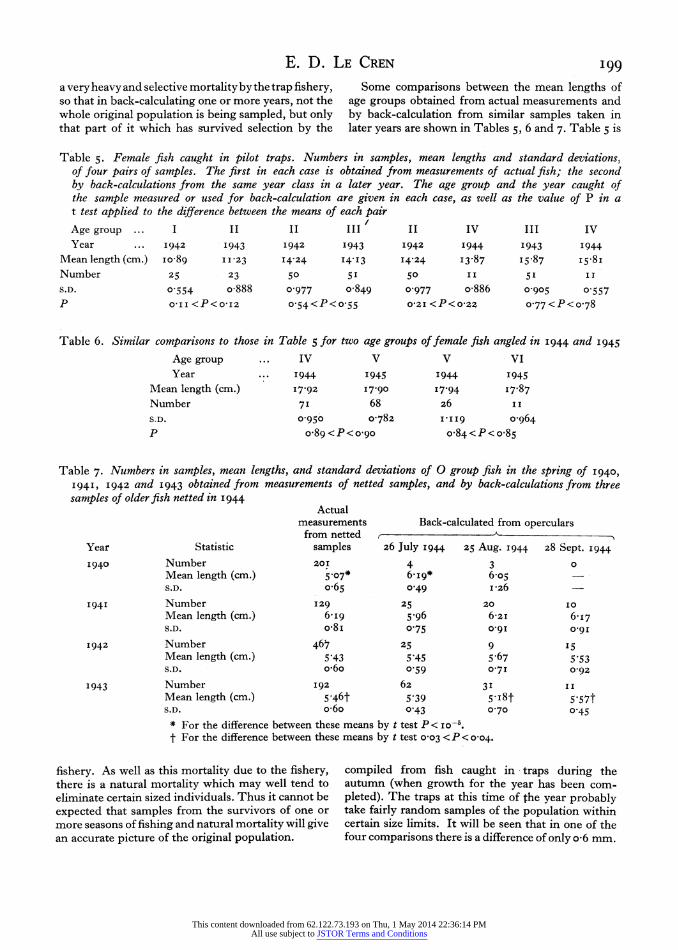
Table 5. Female fish caught in pilot traps. Numbers in samples, mean lengths and standard deviations, of four pairs of samples. The first in each case is obtained from measurements of actual fish; the second by back-calculations from the same year class in a later year. The age group and the year caught of the sample measured or used for bach-calculation are given in each case, as well as the value of P in a t test applied to the difference between the means of each pair
Age group ... I II II III II IV III IV Year ... I 942 I943 1942 1943 I942 1944 1943 1944
Mean length (cm.) I0-89 1123 I4.24 I4.13 14'24 I3.87 I5.87 I5.8I
Number 25 23 50 5 1 50 I I 5 1 II
S.D. 0 554 o-888 o0977 o-849 0977 o-886 0o905 o0557
P O-II <P<O I2 0o54<P<o055 oz2I <P<o022 o077<P<o 78
Table 6. Similar comparisons to those in Table 5 for two age groups of female fish angled in I944 and I945
Age group ... IV V V VI
Year ... 1944 1I945 I 944 1945 Mean length (cm.) I7.92 I7.90 I794 I7.87
Number 7 I 68 26 II
S.D. o0950 0-782 I-II9 o964
P o-89<P<o9go o 84<P<o-85
Table 7. Numbers in samples, mean lengths, and standard deviations of 0 group fish in the spring of I940,
I94I, I942 and I943 obtained from measurements of netted samples, and by back-calculations from three samples of older fish netted in I944
Actual measurements Back-calculated from operculars
from netted A
Year Statistic samples 26 July I944 25 Aug. I944 28 Sept. 1944
1940 Number 201 4 3 ? Mean length (cm.) 5.07* 6.i9* 6-o0
S.D. o-65 0?49 I*26 -
I94I Number I29 25 20 I0
Mean length (cm.) 6-i9 5.96 6z2I 6-17 S.D. o08i 0-75 O'9I O-9I
I942 Number 467 25 9 I5 Mean length (cm.) 5 43 5.45 5 67 5-53 S.D. o-6o 0 59 0711 0'92
1943 Number I92 62 3 I I
Mean length (cm.) 5-46t 5 39 5-i8t 5-57t S.D. o-6o 0o43 0o70 0?45
* For the difference between these means by t test P< io0-.
t For the difference between these means by t test 0o03 < P < 0-04.
fishery. As well as this mortality due to the fishery, there is a natural mortality which may well tend to eliminate certain sized individuals. Thus it cannot be expected that samples from the survivors of one or more seasons of fishing and natural mortality will give an accurate picture of the original population.
Some comparisons between the mean lengths of age groups obtained from actual measurements and by back-calculation from similar samples taken in later years are shown in Tables 5, 6 and 7. Table 5 is
compiled from fish caught in traps during the autumn (when growth for the year has been com- pleted). The traps at this time of the year probably take fairly random samples of the population within certain size limits. It will be seen that in one of the four comparisons there is a difference of only o6 mm.
This content downloaded from 62.122.73.193 on Thu, 1 May 2014 22:36:14 PMAll use subject to JSTOR Terms and Conditions
200 Determination of the age and growth of the perch and that although in the other three there are differ- ences of 3 7, 3 4 and i i mm., in all cases the values of P derived from applying the t test (Simpson & Roe, 1939) show that these differences might well have arisen by chance. Table 6 shows two more com- parisons for older fish taken from two comparable samples caught by angling, which is probably not seiective within the size range of fish of these age groups. In both these cases the difference is very small, and very likely due to chance.
Both the above sets of comparisons deal with back- calculations made from fish i or 2 years older. In Table 7, however, are given some comparisons be- tween means from measured samples of 0 group fish and means of back-calculations to the first winter ring from samples of fish from i 5 to 4-5 years older. Both the successive annual samples of 0 group fish and the samples of older fish taken in I944 were netted with seines of suitable mesh and so are likely to be good un- selected samples. The mean of the 1943 fish back- calculated from the sample of August I944 is signi- ficantly different both from the mean back-calculated from the September 1944 sample and the mean of the sample measured in I943; the mean for the measured sample, however, lies between the two back-calcula- tions. In all the other cases the difference is not more than 3 mm. In one of these cases, there is, however, a significant statistical difference between the back- calculated means derived from two of the samples; but the mean for the measured fish in this case lies between the two back-calculations.
This table suggests that there is a tendency, which is even more apparent from some other samples, for the lengths of fish back-calculated to the end of the first year to be slightly larger than the mean lengths derived from netted samples of fish a year old. This difference is not due to the correction for allometry, however, as when uncorrected these back-calculated lengths, especially from large fish, are generally smaller than the average lengths found by actual measurements. Measurements of the actual width on the opercular of this first ring suggest that there is a slight tendency for the ring to be wider in older fish than in fish i year old. It may be due, therefore, either to growth of the opercular inside the first annual ring after it is laid down, or to a differential mortality among fish of different sizes in their second year of life. The first possibility, of the growth of bone after it has been laid down, seems unlikely; but the second, a differential mortality, is probable. It is known that there is a heavy mortality among the young perch, and the length-frequency curves of fish of one age group very often show a positive skew, which may well be due to a mortality that is heavier among fish smaller than the mean, than among those larger. This difference between 'actual' and back- calculated lengths seems to occur only in I-year old
fish and is rarely large enough or frequent enough to be very important. Its exact significance cannot be determined from the data at present available.
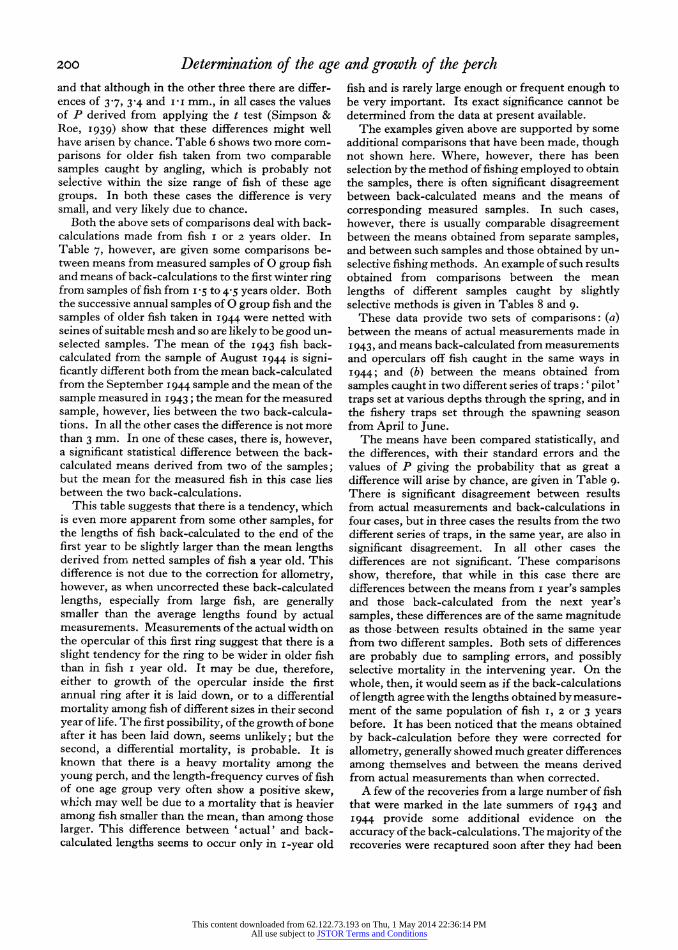
The examples given above are supported by some additional comparisons that have been made, though not shown here. Where, however, there has been selection by the method of fishing employed to obtain the samples, there is often significant disagreement between back-calculated means and the means of corresponding measured samples. In such cases, however, there is usually comparable disagreement between the means obtained from separate samples, and between such samples and those obtained by un- selective fishing methods. An example of such results obtained from comparisons between the mean lengths of different samples caught by slightly selective methods is given in Tables 8 and 9.
These data provide two sets of comparisons: (a) between the means of actual measurements made in I 943, and means back-calculated from measurements and operculars off fish caught in the same ways in 1944; and (b) between the means obtained from samples caught in two different series of traps: 'pilot' traps set at various depths through the spring, and in the fishery traps set through the spawning season from April to June.
The means have been compared statistically, and the differences, with their standard errors and the values of P giving the probability that as great a difference will arise by chance, are given in Table 9. There is significant disagreement between results from actual measurements and back-calculations in four cases, but in three cases the results from the two different series of traps, in the same year, are also in significant disagreement. In all other cases the differences are not significant. These comparisons show, therefore, that while in this case there are differences between the means from i year's samples and those back-calculated from the next year's samples, these differences are of the same magnitude as those -between results obtained in the same year from two different samples. Both sets of differences are probably due to sampling errors, and possibly selective mortality in the intervening year. On the whole, then, it would seem as if the back-calculations of length agree with the lengths obtained by measure- ment of the same population of fish I, 2 or 3 years before. It has been noticed that the means obtained by back-calculation before they were corrected for allometry, generally showed much greater differences among themselves and between the means derived from actual measurements than when corrected.
A few of the recoveries from a large number of fish that were marked in the late summers of 1943 and 1944 provide some additional evidence on the accuracy of the back-calculations. The majority of the recoveries were recaptured soon after they had been
This content downloaded from 62.122.73.193 on Thu, 1 May 2014 22:36:14 PMAll use subject to JSTOR Terms and Conditions
E. D. LE CREN 201
marked and so had made no growth; none so far have been recovered which had completed more than one growing season. Fifteen fish provide information on back-calculated lengths and their details are given in Table io. The initial measurements were made with live fish, and the lengths were recorded to 0o5 cm. in
Table 8. Numbers in samples, mean lengths and standard deviations, for four age groups of female fish in the spring of I 943. The two left-hand columns give the results from actual measurements made in I 943, the two right-hand columns the results of back-calculations made from operculars collected in comparable samples a year later
Actual measurements I943 Back-calculated from I944
Age group Statistic Fishery traps Pilot traps Fishery traps Pilot traps I Number 103 3I 433 48
Mean length (cm.) ii*66 io-8i io-85 II*09 S.D. o-81 o-6o o087 o098
II Number 959 102 673 I55 Mean length (cm.) 14-09 14'33 13-88 I3-96 S.D. 0-74 0 90 0o79 0o78
III Number 687 I [3 147 58 Mean length (cm.) 15.04 15-4I 14'99 Is530 S.D. o-86 PI*2 o096 I*05
IV Number 63 I5 I2 3 Mean length (cm.) i6I12 i6-68 's-63 I5134 S.D. 0@90 i-i6 0I- 050
Table 9. Comparisons between the means of Table 8. The two left-hand columns give the comparisons between the means calculated from actual measurements and back-calculations; the two right-hand columns give the comparisons between the two methods of trap fishing. The difference between the means, its standard error, and the value of P in a t test are given in each case
Comparisons between actual Comparisons between measurements and back-calculations fishery traps and pilot traps
Age group Statistic Fishery traps Pilot traps Actual, 1943 Back-calc. I944
I Difference o-8i o-28 o.85 0o24 S.E. 00903 O-I783 0 I345 0-I478 P < Io-1 o-24<P<0 25 < io 9 O-IO<P<O-II
II Difference 0-21 O037 0o24 o-o8 S.E. o00389 o-io87 0-0923 o-o693 P Io 6 <O-OOI o-ooi <P<o-oi O024<P<o 25
III Difference 0o05 0-II 037 0-3I S.E. o-io66 0I73I 0o1270 0-1587 p o-63 < P < o 64 o-52<P<0?53 o-ooi <P<O-OI 005 < P < o-o6
IV Difference 0o49 I34 o.56 0-29
S.E. 0-342I O-4I65 0-3208 0 4330 P o-i6<P<O-I7 <O-OI o0o8 < P < o-og 0-5<P<o-6
I943 and i mm. in 1944, so no great accuracy was obtained. Often, particularly in 1944, the length on recapture was not recorded very exactly either, some- times due to delay in the return of the recaptured fish to the laboratory. Thus no very accurate comparison of actual and back-calculated lengths is possible. In Table I o the range of length possible from the records made is shown; although, with the initial measure-
ments in particular, it is quite possible that the fish was recorded as belonging to the wrong 0o5 cm. or i mm. length group.
The marking took place near the end of the growing season and most of the fish that were recaptured during the subsequent winter showed no growth since
being marked. Therefore the length recorded when the fish were marked should either lie between the back-calculated lengths for the winters preceding and following marking, or correspond to the length for the following winter. In Table io fish nos. I-5
show a back-calculated length for the winter following marking which is in agreement (within the range of accuracy of the lengths) with the length on marking.
This content downloaded from 62.122.73.193 on Thu, 1 May 2014 22:36:14 PMAll use subject to JSTOR Terms and Conditions
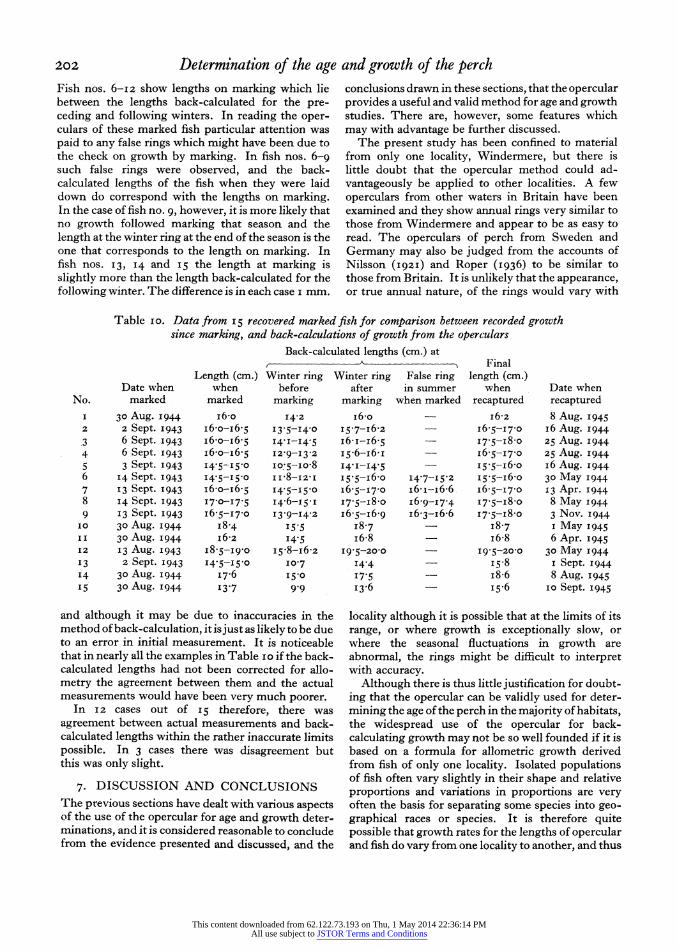
20oz Determi'nati'on of the age and growth of the perch Fish nos. 6-I2 show lengths on marking which lie between the lengths back-calculated for the pre- ceding and following winters. In reading the oper- culars of these marked fish particular attention was paid to any false rings which might have been due to the check on growth by marking. In fish nos. 6-9 such false rings were observed, and the back- calculated lengths of the fish when they were laid down do correspond with the lengths on marking. In the case of fish no. 9, however, it is more likely that no growth followed marking that season and the length at the winter ring at the end of the season is the one that corresponds to the length on marking. In fish nos. I3, x4 and IS the length at marking is slightly more than the length back-calculated for the following winter. The difference is in each case i mm.
Table I0. Data from I 5 recovered marked fish for comparison between recorded growth since marking, and back-calculations of growth from the operculars
Back-calculated lengths (cm.) at I Final
Length (cm.) Winter ring Winter ring False ring length (cm.) Date when when before after in summer when Date when
No. marked marked marking marking when marked recaptured recaptured I 30 Aug. 1944 I6-0o 142 i6-o i6-2 8 Aug. 1945 2 2 Sept. I943 i6-o-i6-5 I3-5-I4'0 I5-7-I62 I6.5-17.0 I6 Aug. 1944 3 6 Sept. I943 i6-o-I6-5 I4-I-I4 5 i6-I-I65 - 17.5-i80 25 Aug. 1944 4 6 Sept. I943 i6-o-i6-5 I2-9-I3'2 I5-6-i6-I I65-I7.0 25 Aug. 1944
5 3 Sept. I943 I4-5--I5-0 I0-5-I0-8 I41I-I4 5 I-5-5I6-o I6 Aug. 1944 6 I4 Sept. 1943 I4-5-I5-0 ii-8-I2-I I5.5-I6.o I4-7-I5,2 I5'5-i6.o 30 May 1944 7 13 Sept. 1943 160-I6-5 14-5-I5-0 I6'5-17?0 I6-i-I6-6 I6-5-17-0 I3 Apr. I944 8 I4 Sept. 1943 I7-0-I7 5 14.6-15.1 17.5-I8.0 I6-9-I7-4 I7.5-I8.0 8 May 1944 9 I3 Sept. I943 I6.5-I7.0 I3-9-I4-2 i6'5-16-9 i6'3-I6-6 I7.5-I8.0 3 Nov. 1944
I0 30 Aug. 1944 I8.4 I5.5 I8.7 - I87 I May 1945 II 30 Aug. 1944 i6-2 I4.5 i6-8 i6'8 6 Apr. 1945 I2 I3 Aug. I943 I8'5-I9'0 I5-8-I6-2 I9'5-20-0 I9-5-20-0 30 May 1944 13 2 Sept. I943 I4-5-I5-0 I0-7 I44 - 158 i Sept. 1944 I4 30 Aug. I944 I7-6 I5.0 17'5 I8'6 8 Aug. 1945 I5 30 Aug. 1944 13.7 9 9 I3.6 - I5.6 I0 Sept. 1945
and although it may be due to inaccuracies in the method of back-calculation, it is just as likely to be due to an error in initial measurement. It is noticeable that in nearly all the examples in Table io if the back- calculated lengths had not been corrected for allo- metry the agreement between them and the actual measurements would have been very much poorer.
In 12 cases out of 15 therefore, there was agreement between actual measurements and back- calculated lengths within the rather inaccurate limits possible. In 3 cases there was disagreement but this was only slight.
7. DISCUSSION AND CONCLUSIONS The previous sections have dealt with various aspects of the use of the opercular for age and growth deter- minations, and it is considered reasonable to conclude from the evidence presented and discussed, and the
conclusions drawn in these sections, that the opercular provides a useful and valid method for age and growth studies. There are, however, some features which may with advantage be further discussed.
The present study has been confined to material from only one locality, Windermere, but there is little doubt that the opercular method could ad- vantageously be applied to other localities. A few operculars from other waters in Britain have been examined and they show annual rings very similar to those from Windermere and appear to be as easy to read. The operculars of perch from Sweden and Germany may also be judged from the accounts of Nilsson (192I) and Roper (I936) to be similar to those from Britain. It is unlikely that the appearance, or true annual nature, of the rings would vary with
locality although it is possible that at the limits of its range, or where growth is exceptionally slow, or where the seasonal fluctuations in growth are abnormal, the rings might be difficult to interpret with accuracy.
Although there is thus little justification for doubt- ing that the opercular can be validly used for deter- mining the age of the perch in the majority of habitats, the widespread use of the opercular for back- calculating growth may not be so well founded if it is based on a formula for allometric growth derived from fish of only one locality. Isolated populations of fish often vary slightly in their shape and relative proportions and variations in proportions are very often the basis for separating some species into geo- graphical races or species. It is therefore quite possible that growth rates for the lengths of opercular and fish do vary from one locality to another, and thus
This content downloaded from 62.122.73.193 on Thu, 1 May 2014 22:36:14 PMAll use subject to JSTOR Terms and Conditions
E. D. LE CREN 203
ideally the growth ratio should be estimated for each locality before back-calculations of growth are made from operculars from that locality. It is unlikely, however, that there is any very great variation, and it is probably safe to assume that approximately accurate results can be obtained from any locality using the growth ratio obtained for Windermere.
The discovery of a definite allometry in the growth of the opercular is of some interest in connexion with the widespread use of morphometric measurements in fish taxonomy. Subspecies or even species are separated largely on the basis of morphometric ratios often measured on one or a very few specimens, and so if allometry is common in the relative growth of different parts of fish, in some cases it may seriously affect the taxonomic criteria that are used.
It is realized that in attempting to show the accuracy of the readings of age and growth from the operculars the evidence presented is mostly of an in- direct kind, and that there has been no direct check applied to the results. Direct checks that are applic- able involve the recorded observation of fish kept in tanks or marked in large numbers in the field, which are laborious and of necessity long-term procedures. A study should also perhaps be made of the agreement between scales and operculars in the readings of age and growth obtained from them, employing Seger- strale's correction for scales and allowing for allo- metric growth in operculars. It is considered, how- ever, that within the limits of accuracy usually re- quired in research on fish ecology the data given in this paper do provide an adequate check on the use of the opercular bone, and that it is therefore legitimate to use the method for age and growth studies on the perch.
Although in certain species of fish the value of the opercular bone for age and growth determinations has been demonstrated, in work on most species, the scales and less frequently the otoliths are used. The otoliths suffer from the disadvantages that they are often difficult to extract and that they do not lend themselves to growth calculations. The use of the scales has one unique advantage in that it is generally possible to remove a few scales from a fish and then return it to the water alive. The opercular bone, however, has several useful characteristics. It is readily removed from the fish; it is easily prepared
and is used dry, without any need for it to be mounted; and it is a useful size to handle and store. In the case of fish of the usual sizes encountered the opercular is large enough for the annual rings to be seen with the naked eye, yet with adequate optical apparatus an image can be projected for detailed examination and growth measurements. It would seem then as if the opercular bone possessed several useful, practical advantages, and that when studying species where the scales are found to be difficult, investigation of the possibility of using the opercular might prove fruitful.
8. SUMMARY
I. The use of the opercular bone in determining the age and growth of the perch in Windermere is described.
2. The readings of age from the operculars of fish up to 4 years old at least, agree with estimates of age made from length-frequency distributions, and are also confirmed by the occurrence of dominant year classes in successive annual samples.
3. The opercular shows allometric growth in relation to the length of the fish. The correction of directly proportionate back-calculations of growth is described.
4. There is little direct evidence to check the accuracy of the back-calculations of growth, but the evidence available in general shows that these calcu- lations are reasonably accurate.
5. It is concluded that the use of the opercular provides a good general method for ascertaining the age and growth of the perch.
9. ACKNOWLEDGEMENTS
I am indebted to Mr H. J. Buchanan-Wollaston for the loan of operculars collected by him and for statistical advice, and I am grateful to Prof. W. H. Pearsall for his valuable advice on allometry and for his criticism of the manuscript. I also wish to thank Dr E. B. Worthington, until lately Director of the Freshwater Biological Association, Dr W. E. Frost, Miss R. H. Lowe, Dr T. T. Macan, Mr P. H. T. Hartley and my other colleagues at Wray Castle for their helpful advice and criticism, and Mr G. J. Thompson and his staff for their work in the collec- tion of material and the preparation of the operculars.
This content downloaded from 62.122.73.193 on Thu, 1 May 2014 22:36:14 PMAll use subject to JSTOR Terms and Conditions
204 Determination of the age and growth of the perch
REFERENCES
Allen, K R. (I935). 'The food and migration of the perch (Perca fluviatilis) in Windermere.' J. Anim. Ecol. 4: 264-73.
Graham, M. (1929). 'Studies of age-determination in fish. Part II. A survey of the literature.' Fish. Invest. Ser. II, ii (2): I-5o. London.
Huxley, J. S. (1932). 'Problems of Relative Growth.' London.
Nikolsky, G. & Evtiukhov, N. A. (I940). ['The fishes of the middle and lower course of the Ili River. Part II'] (In Russian with English summary.) Bull. Soc. Nat. Moscou, Sect. Biol. 49 (5-6): 57-70.
Nilsson, D. (1921). 'Nagra insjofiskars alder och till- vaxt i Bottniska Viken och Malaren.' Medd. Landtbr- Styr. Stockh. no. 231.
Reeve, E. C. R. & Huxley, J. S. (1945). 'Some problems in the study of allometric growth', in Le Gros Clark, W. E. & Medawar, P. B., 'Essays on growth and form presented to D'Arcy Wentworth Thompson.' Oxford: 12I-56.
Richards, 0. W. & Kavanagh, A. J. (I945). 'The analysis of growing form,' in Le Gros Clark, W. E. &
Medawar, P. B., 'Essays on growth and form presented to D'Arcy Wentworth Thompson.' Oxford: i 88- 230.
Roper, K. C. (1936). 'Ernaihrung und Wachstum des Barsches (Perca fluviatilis L.) in Gewaissern Mecklen- burgs und der Mark Brandenburg.' Z. Fisch. 34: 567-638.
Segerstrale, C. (I933). 'Tber scalimetrische Methoden zur Bestimmung des linearen Wachstums bei Fischen, insbesondere bei Leuciscus idus L., Abramis brama L., und Percafluviatilis L.' Acta Zool. Fenn. 15: i-i68.
Simpson, G. G. & Roe, A. (I939). 'Quantitative Zoology.' New York etc.
Van Oosten, J. (I929). 'Life history of the lake herring (Leucichthys artedi Le Sueur) of Lake Huron as revealed by its scales, with a critique of the scale method.' Bull. U.S. Bur. Fish. 44: 265-428.
Van Oosten, J. (194I). 'The age and growth of fresh- water fishes,' in 'A symposium of hydrobiology.' Madison, Wis.: I96-205.
Worthington, E. B. (I94I). 'Perch in British lakes: a new fishing industry.' Nature, Lond. I48: 65I-2.
This content downloaded from 62.122.73.193 on Thu, 1 May 2014 22:36:14 PMAll use subject to JSTOR Terms and Conditions