Embed Size (px)
Citation preview
1
The Development Challenge of the Decade: Natural Resource Governance
Reflections and Peering ahead, Evidence-based
Daniel Kaufmann, Revenue Watch Institute http://www.revenuewatch.org/
Presentation at Extractive Industry Roundtable
sponsored by EITI & Norway,
Oslo, February 25th, 2013 .
Reflecting on 4 ‘Powers’
1. Power of Data, Research & of Evidence-Based Policy-Making
2. Power of Smart Transparency
3. Power of Incentives
4. Implications for Debate, including: Power of Partnerships
1. Power of Data & Research
Power of Data, Research & of Evidence-Based Policy-Making:
• Better outreach of existing data/evidence and analysis on governance in natural resource governance
• Building a major Databank; making sense of the existing & upcoming data; enabling multitude of users around the world (in-country) to use it effectively
• Guarding against: i) ‘Zombie Data’; ii) Confusing the Macro with the Micro in charting data work ahead; iii) viewing Data & technical analysis as substitute to civil society advocacy (not so); iv) misalignment with international statistical norms (thus IMF needs to be further involved, etc)
-1.0
-0.8
-0.6
-0.4
-0.2
0.0
0.2
0.4
0.6
0.8
1.0
2002 2003 2004 2005 2006 2007 2008 2009 2010 2011
WG
I C
on
tro
l o
f C
orr
up
tio
n, 2
011
ExtractiveCountries withsatisfactoryGovernance
Non-ExtractiveIntensive Countries
Extractive-Intensive Countries(All)
Control of
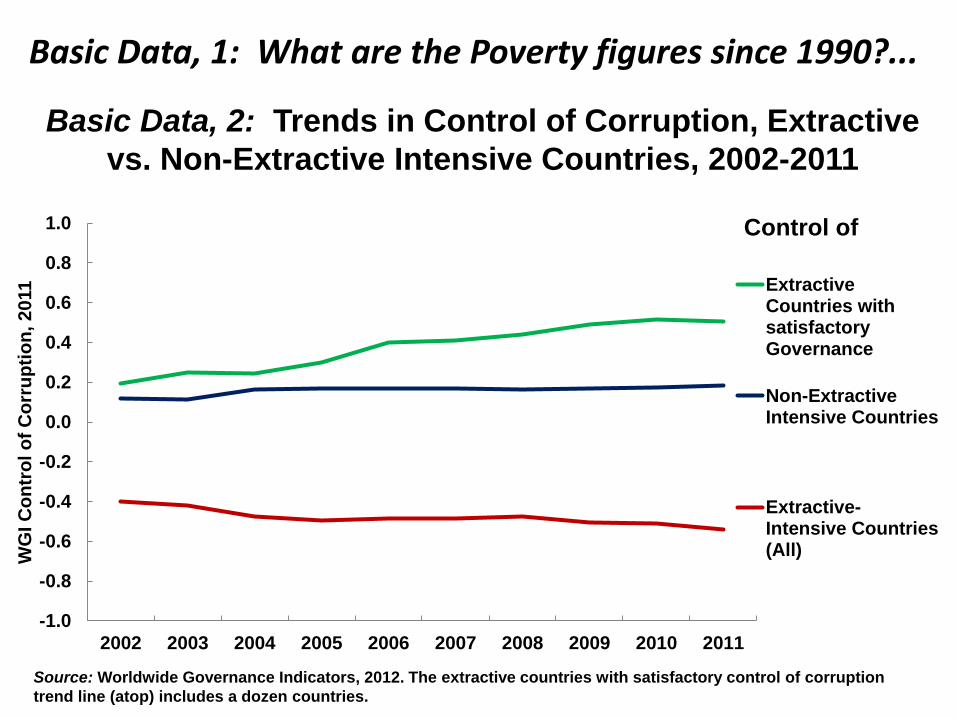
Basic Data, 2: Trends in Control of Corruption, Extractive
vs. Non-Extractive Intensive Countries, 2002-2011
Source: Worldwide Governance Indicators, 2012. The extractive countries with satisfactory control of corruption
trend line (atop) includes a dozen countries.
Basic Data, 1: What are the Poverty figures since 1990?...
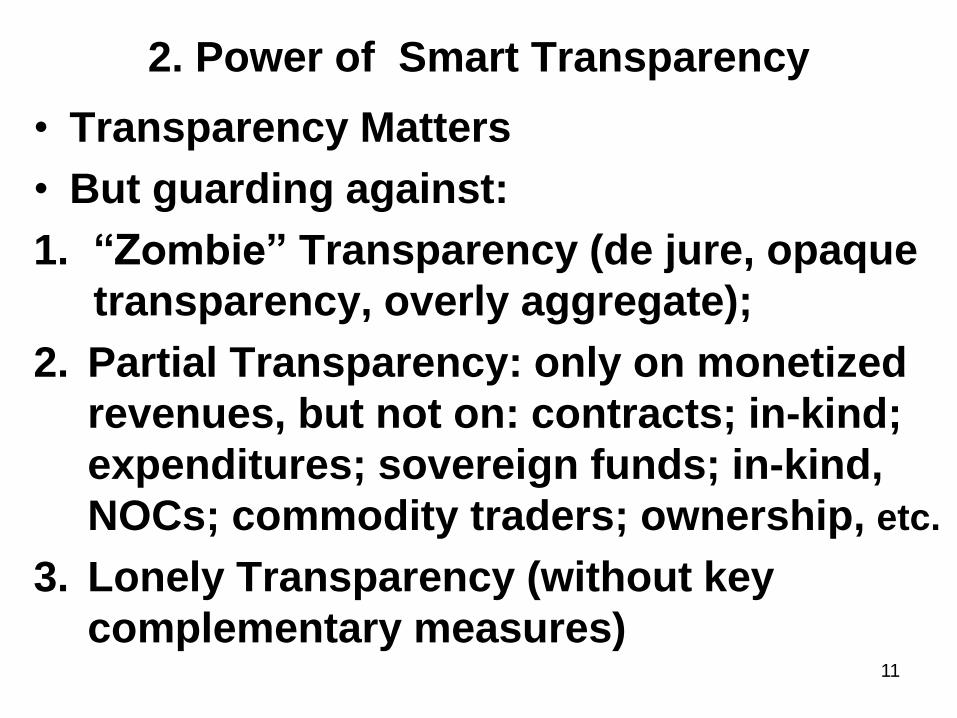
2. Power of Smart Transparency
• Transparency Matters
• But guarding against:
1. “Zombie” Transparency (de jure, opaque
transparency, overly aggregate);
2. Partial Transparency: only on monetized
revenues, but not on: contracts; in-kind;
expenditures; sovereign funds; in-kind,
NOCs; commodity traders; ownership, etc.
3. Lonely Transparency (without key
complementary measures)
11
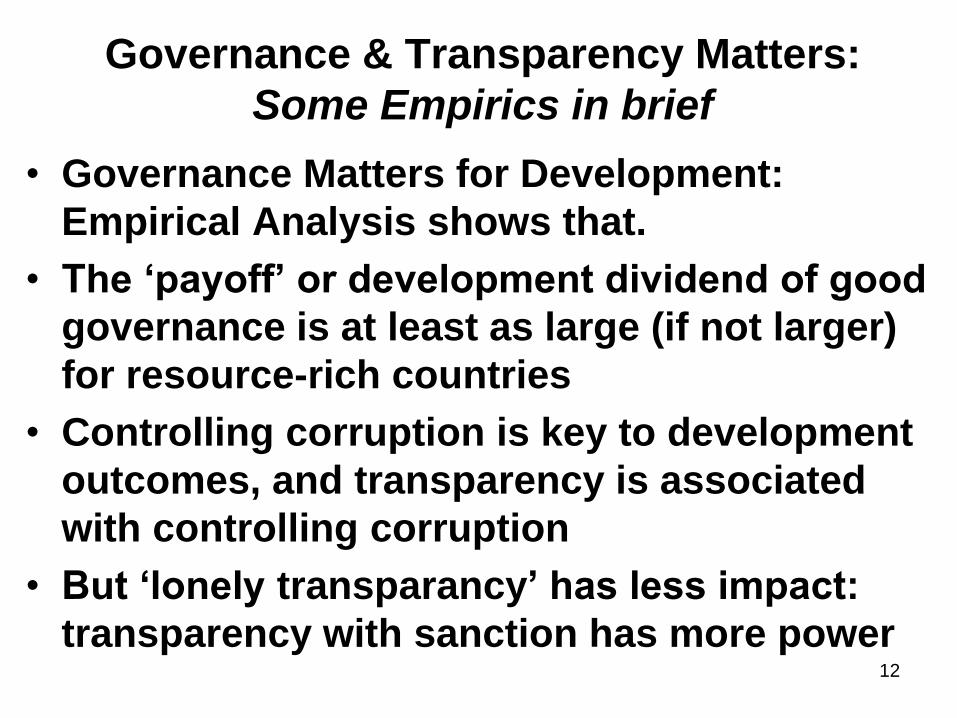
Governance & Transparency Matters:
Some Empirics in brief
• Governance Matters for Development:
Empirical Analysis shows that.
• The ‘payoff’ or development dividend of good
governance is at least as large (if not larger)
for resource-rich countries
• Controlling corruption is key to development
outcomes, and transparency is associated
with controlling corruption
• But ‘lonely transparancy’ has less impact:
transparency with sanction has more power 12
13
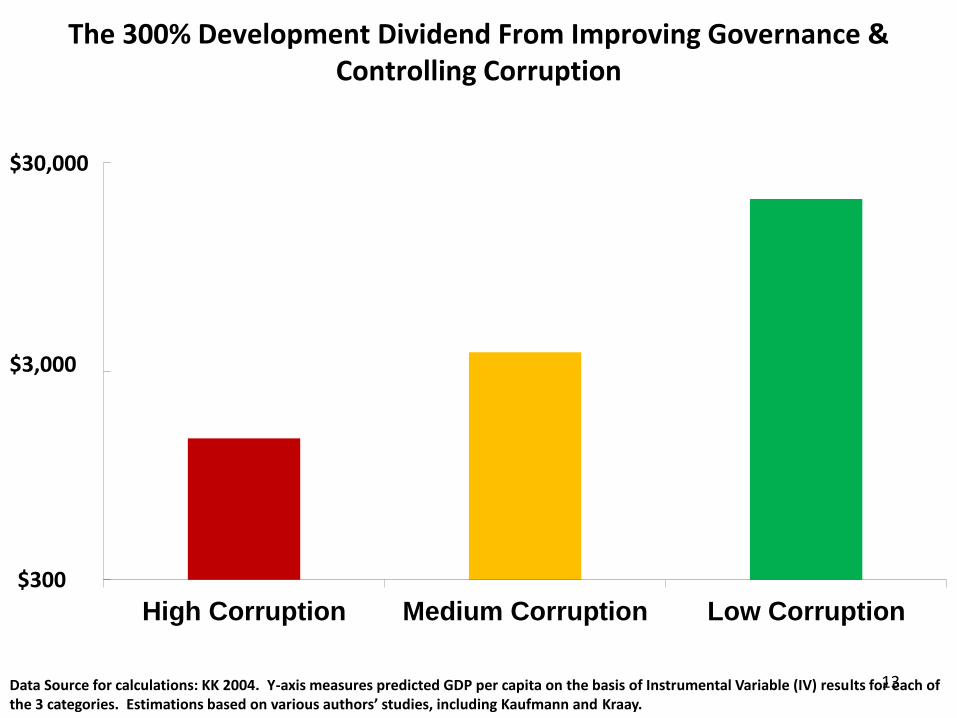
The 300% Development Dividend From Improving Governance & Controlling Corruption
High Corruption Medium Corruption Low Corruption
$300
$3,000
$30,000
Data Source for calculations: KK 2004. Y-axis measures predicted GDP per capita on the basis of Instrumental Variable (IV) results for each of the 3 categories. Estimations based on various authors’ studies, including Kaufmann and Kraay.
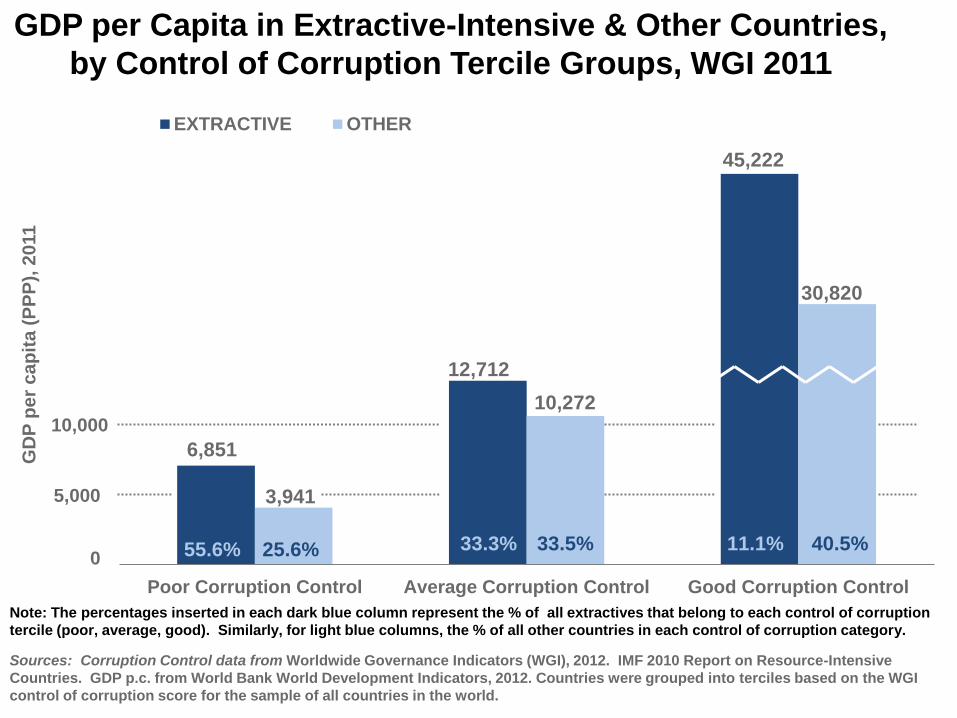
GDP per Capita in Extractive-Intensive & Other Countries,
by Control of Corruption Tercile Groups, WGI 2011
Sources: Corruption Control data from Worldwide Governance Indicators (WGI), 2012. IMF 2010 Report on Resource-Intensive
Countries. GDP p.c. from World Bank World Development Indicators, 2012. Countries were grouped into terciles based on the WGI
control of corruption score for the sample of all countries in the world.
Poor Corruption Control Average Corruption Control Good Corruption Control
GD
P p
er
ca
pit
a (
PP
P),
20
11
EXTRACTIVE OTHER
33.3% 11.1%
5,000
0
10,000
55.6% 25.6% 33.5% 40.5%
6,851
3,941
12,712
10,272
45,222
30,820
Note: The percentages inserted in each dark blue column represent the % of all extractives that belong to each control of corruption
tercile (poor, average, good). Similarly, for light blue columns, the % of all other countries in each control of corruption category.
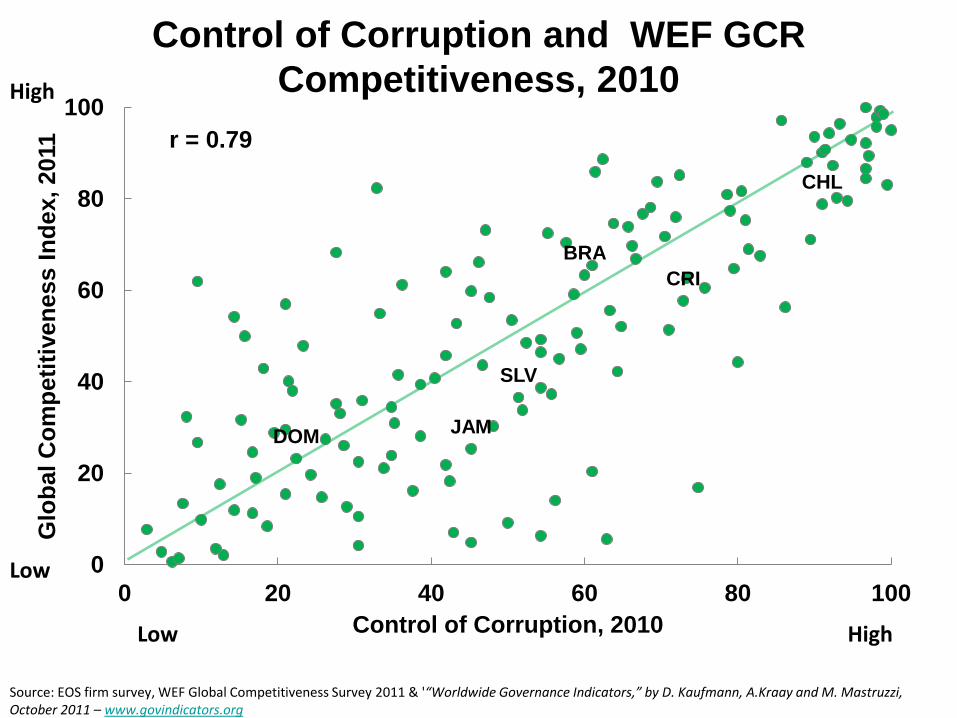
Control of Corruption and WEF GCR
Competitiveness, 2010
Source: EOS firm survey, WEF Global Competitiveness Survey 2011 & '“Worldwide Governance Indicators,” by D. Kaufmann, A.Kraay and M. Mastruzzi, October 2011 – www.govindicators.org
BRA
CHL
CRI
DOM
SLV
JAM
0
20
40
60
80
100
0 20 40 60 80 100
Glo
bal C
om
peti
tiven
ess I
nd
ex, 2011
Control of Corruption, 2010
r = 0.79
High
High Low
Low
16
-1.5
-1
-0.5
0
0.5
1
No Transparency Limited Transparency Satisfactory Transparency
Extent of Transparency
Co
ntr
ol
of
Co
rru
pti
on
Good
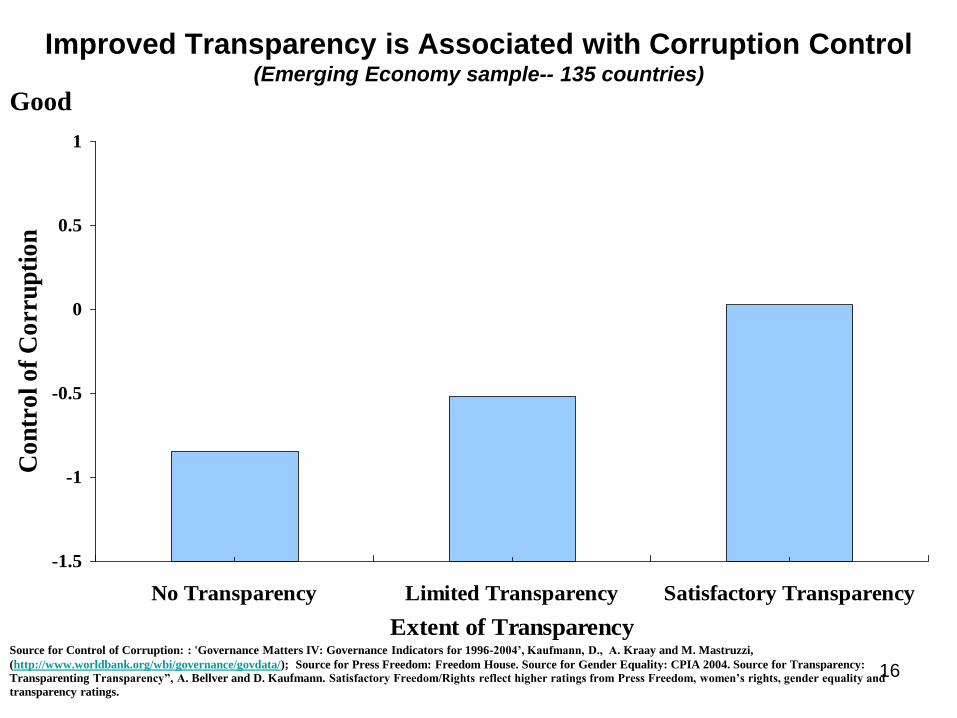
Improved Transparency is Associated with Corruption Control (Emerging Economy sample-- 135 countries)
Source for Control of Corruption: : 'Governance Matters IV: Governance Indicators for 1996-2004’, Kaufmann, D., A. Kraay and M. Mastruzzi,
(http://www.worldbank.org/wbi/governance/govdata/); Source for Press Freedom: Freedom House. Source for Gender Equality: CPIA 2004. Source for Transparency:
Transparenting Transparency”, A. Bellver and D. Kaufmann. Satisfactory Freedom/Rights reflect higher ratings from Press Freedom, women’s rights, gender equality and
transparency ratings.
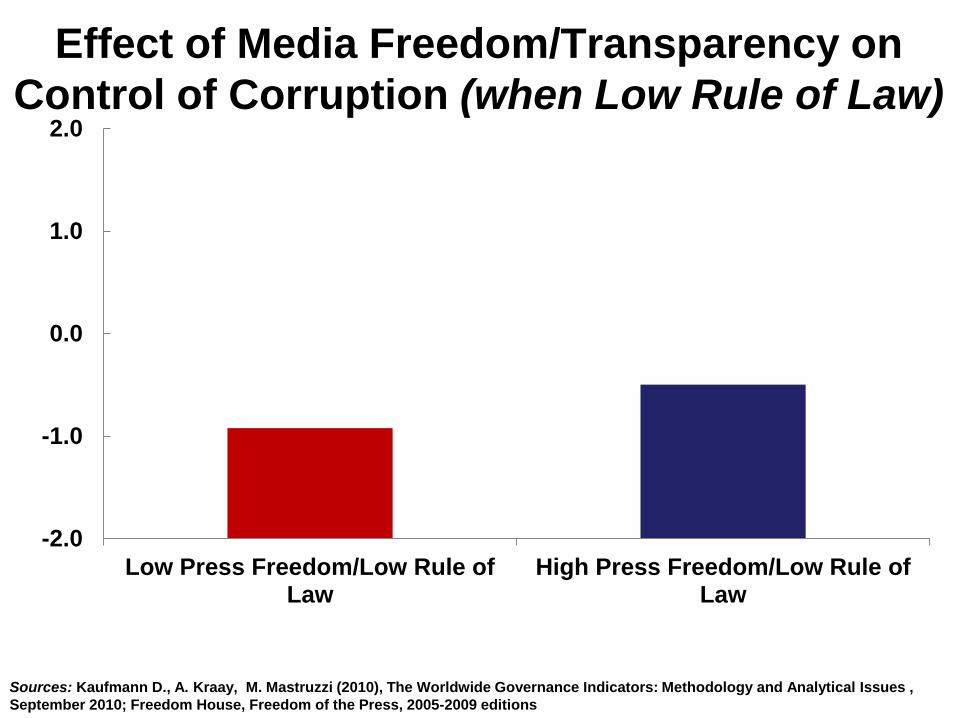
Effect of Media Freedom/Transparency on
Control of Corruption (when Low Rule of Law)
-2.0
-1.0
0.0
1.0
2.0
Low Press Freedom/Low Rule ofLaw
High Press Freedom/Low Rule ofLaw
Sources: Kaufmann D., A. Kraay, M. Mastruzzi (2010), The Worldwide Governance Indicators: Methodology and Analytical Issues ,
September 2010; Freedom House, Freedom of the Press, 2005-2009 editions
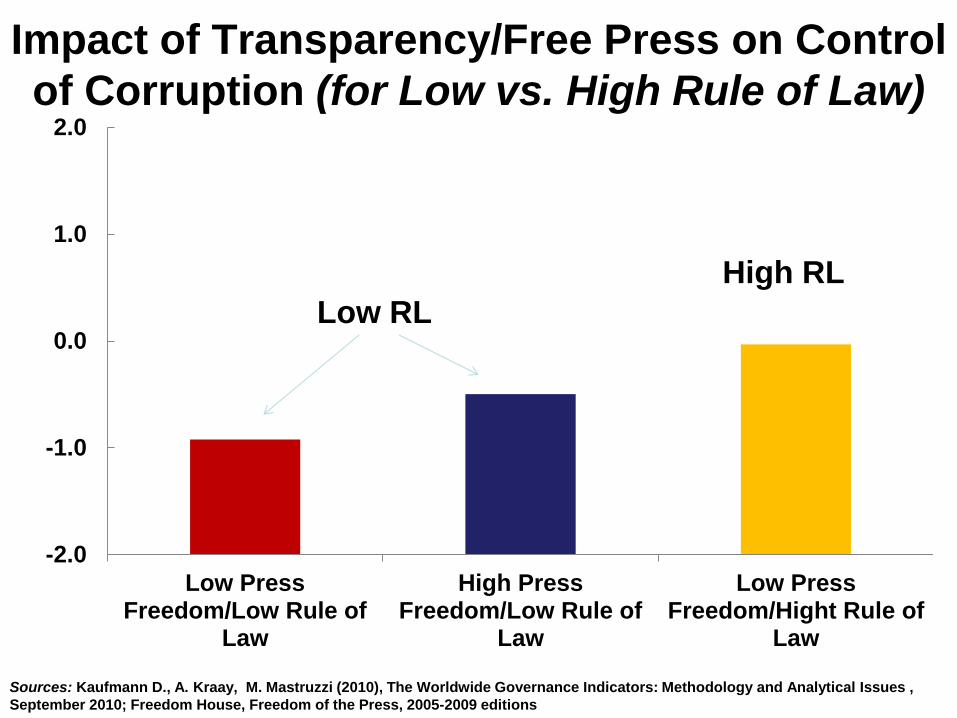
Impact of Transparency/Free Press on Control
of Corruption (for Low vs. High Rule of Law)
-2.0
-1.0
0.0
1.0
2.0
Low PressFreedom/Low Rule of
Law
High PressFreedom/Low Rule of
Law
Low PressFreedom/Hight Rule of
Law
Low RL
High RL
Sources: Kaufmann D., A. Kraay, M. Mastruzzi (2010), The Worldwide Governance Indicators: Methodology and Analytical Issues ,
September 2010; Freedom House, Freedom of the Press, 2005-2009 editions
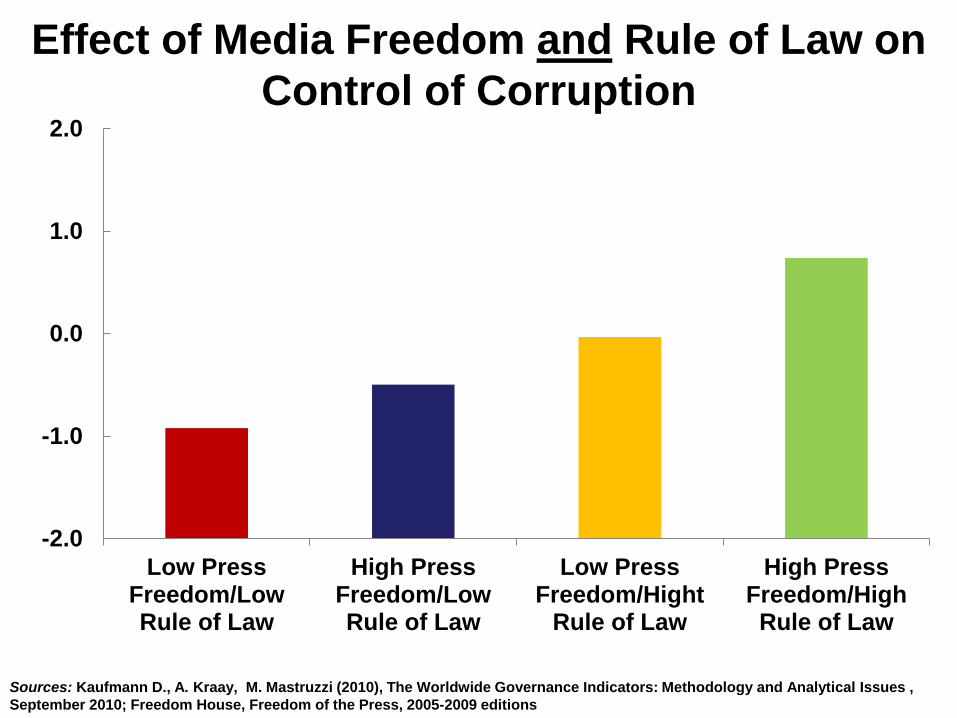
Effect of Media Freedom and Rule of Law on
Control of Corruption
-2.0
-1.0
0.0
1.0
2.0
Low PressFreedom/LowRule of Law
High PressFreedom/LowRule of Law
Low PressFreedom/Hight
Rule of Law
High PressFreedom/HighRule of Law
Sources: Kaufmann D., A. Kraay, M. Mastruzzi (2010), The Worldwide Governance Indicators: Methodology and Analytical Issues ,
September 2010; Freedom House, Freedom of the Press, 2005-2009 editions
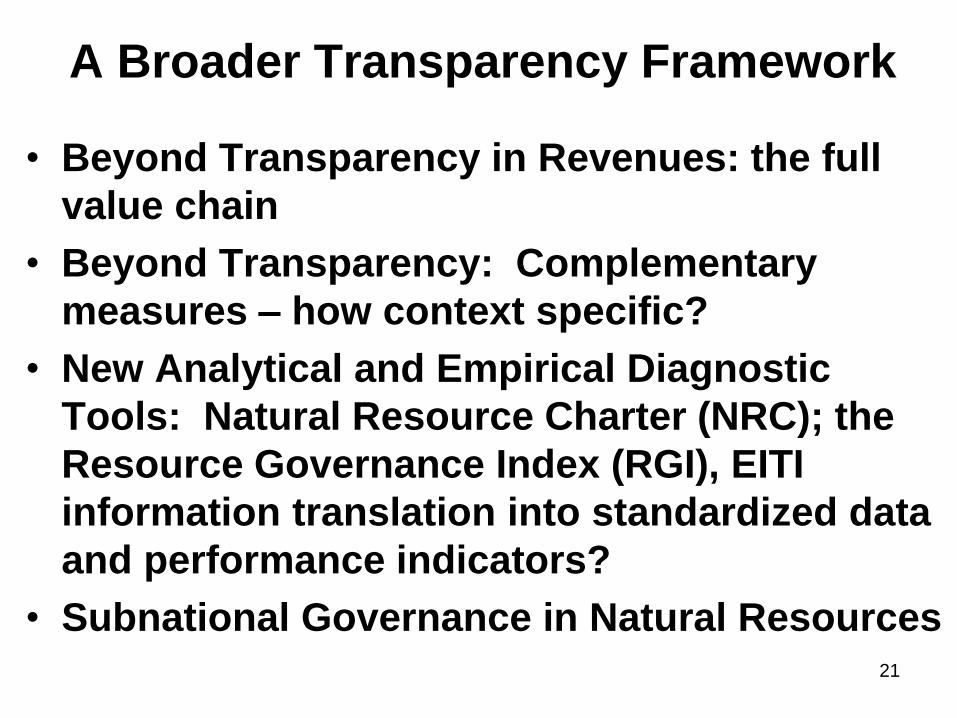
A Broader Transparency Framework
• Beyond Transparency in Revenues: the full
value chain
• Beyond Transparency: Complementary
measures – how context specific?
• New Analytical and Empirical Diagnostic
Tools: Natural Resource Charter (NRC); the
Resource Governance Index (RGI), EITI
information translation into standardized data
and performance indicators?
• Subnational Governance in Natural Resources
21
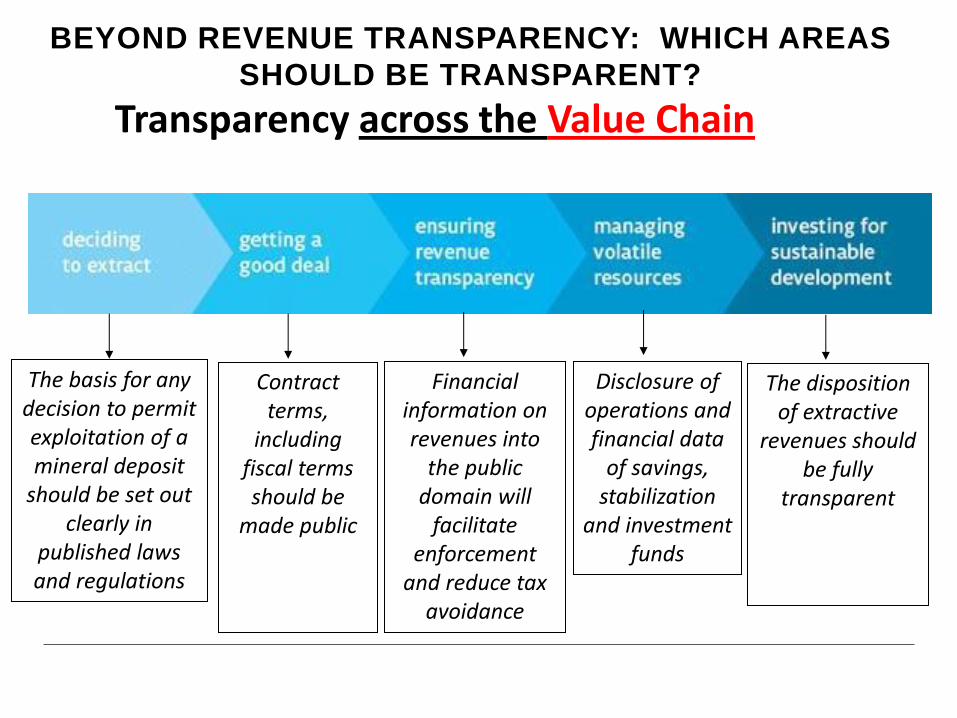
BEYOND REVENUE TRANSPARENCY: WHICH AREAS
SHOULD BE TRANSPARENT?
Transparency across the Value Chain
The basis for any decision to permit exploitation of a mineral deposit
should be set out clearly in
published laws and regulations
Contract terms,
including fiscal terms should be
made public
Financial information on revenues into
the public domain will
facilitate enforcement
and reduce tax avoidance
Disclosure of operations and financial data
of savings, stabilization
and investment funds
The disposition of extractive
revenues should be fully
transparent
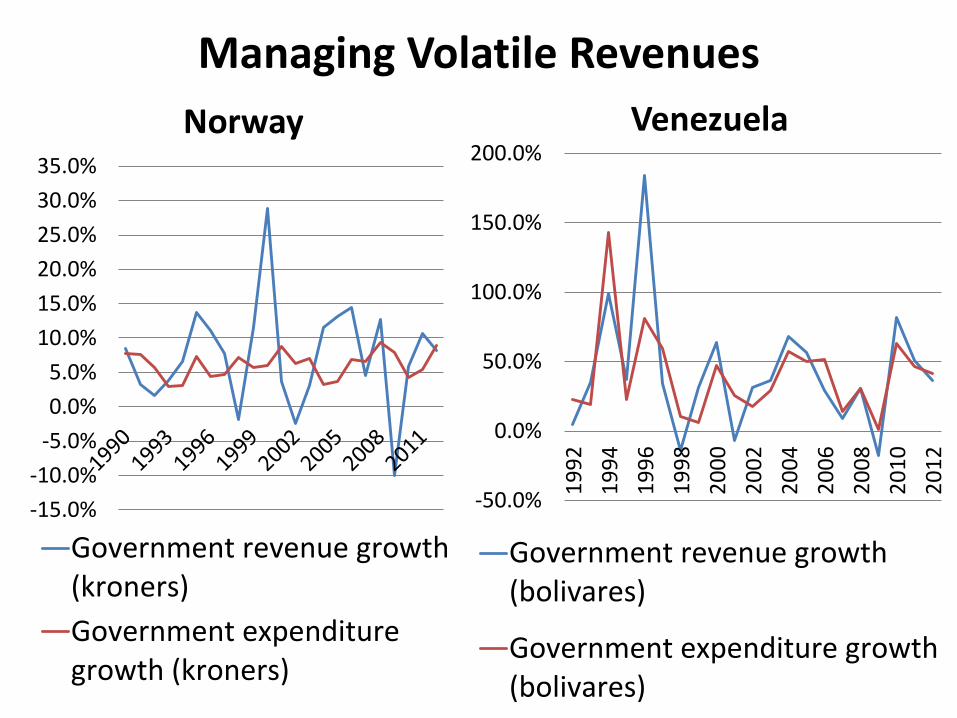
Managing Volatile Revenues
-15.0%
-10.0%
-5.0%
0.0%
5.0%
10.0%
15.0%
20.0%
25.0%
30.0%
35.0%
Norway
Government revenue growth(kroners)
Government expendituregrowth (kroners)
-50.0%
0.0%
50.0%
100.0%
150.0%
200.0%
19
92
19
94
19
96
19
98
20
00
20
02
20
04
20
06
20
08
20
10
20
12
Venezuela
Government revenue growth(bolivares)
Government expenditure growth(bolivares)
-30.0%
-20.0%
-10.0%
0.0%
10.0%
20.0%
30.0%
40.0%
19
97
19
99
20
01
20
03
20
05
20
07
20
09
20
11
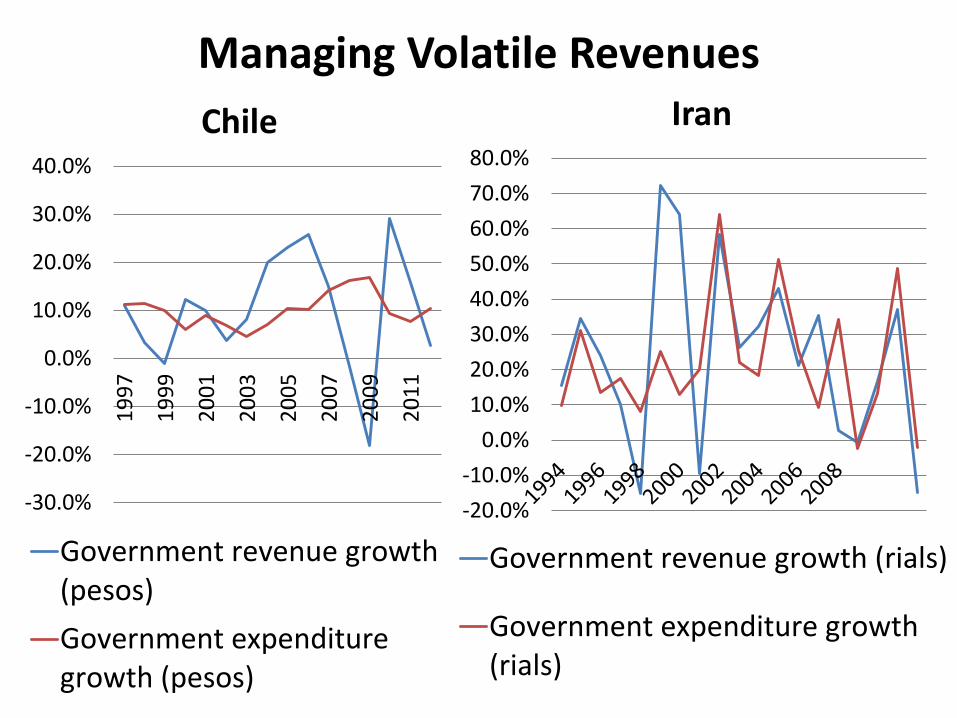
Chile
Government revenue growth(pesos)
Government expendituregrowth (pesos)
Managing Volatile Revenues
-20.0%
-10.0%
0.0%
10.0%
20.0%
30.0%
40.0%
50.0%
60.0%
70.0%
80.0%
Iran
Government revenue growth (rials)
Government expenditure growth(rials)
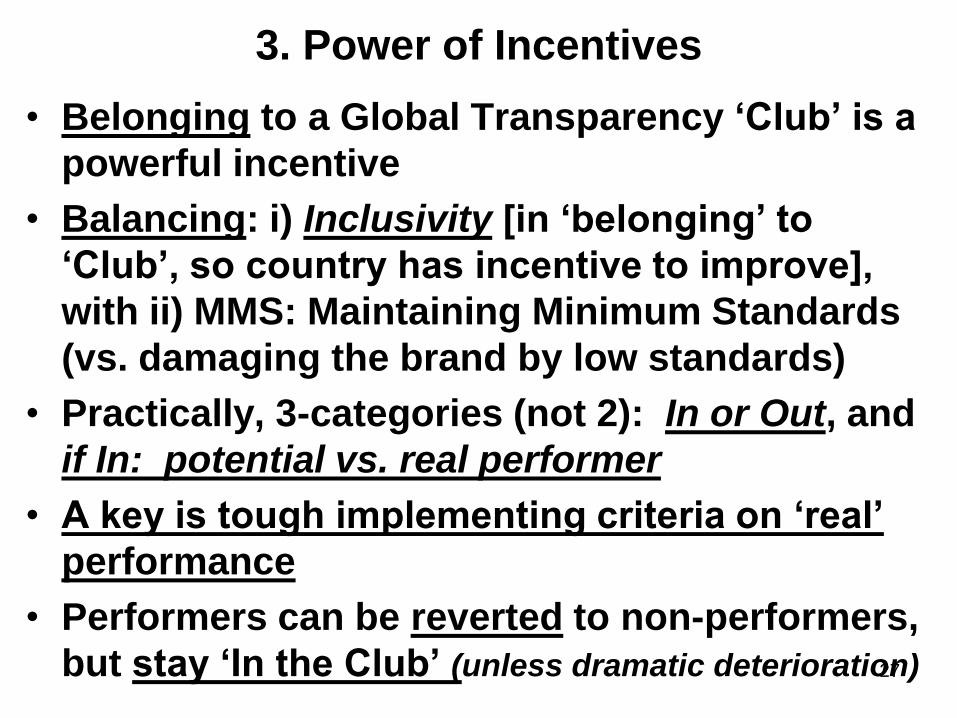
3. Power of Incentives
• Belonging to a Global Transparency ‘Club’ is a
powerful incentive
• Balancing: i) Inclusivity [in ‘belonging’ to
‘Club’, so country has incentive to improve],
with ii) MMS: Maintaining Minimum Standards
(vs. damaging the brand by low standards)
• Practically, 3-categories (not 2): In or Out, and
if In: potential vs. real performer
• A key is tough implementing criteria on ‘real’
performance
• Performers can be reverted to non-performers,
but stay ‘In the Club’ (unless dramatic deterioration)
27
28
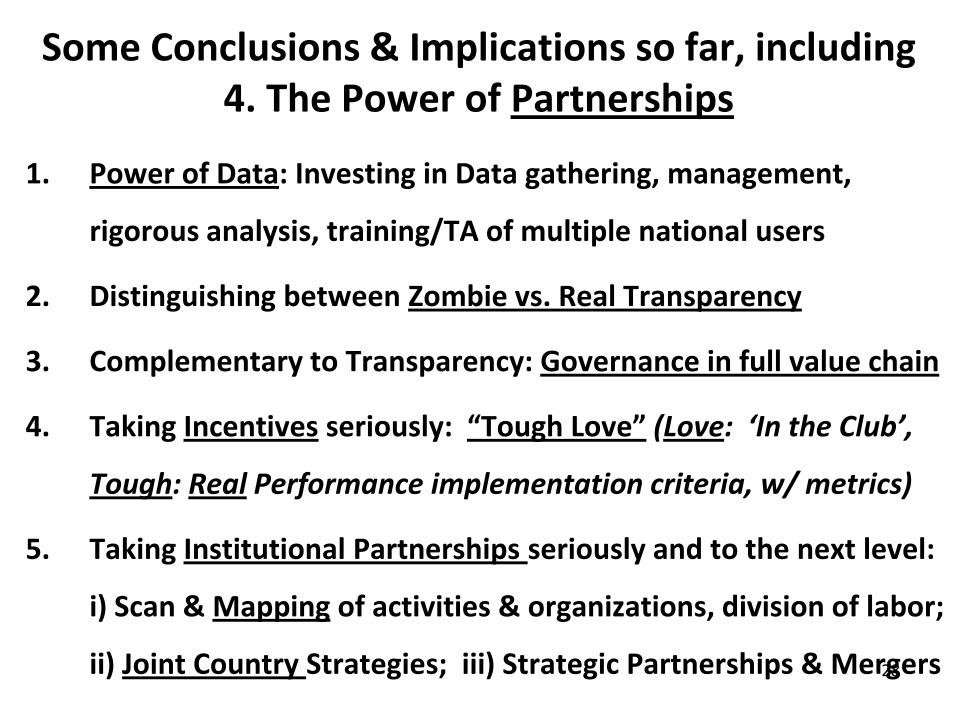
Some Conclusions & Implications so far, including 4. The Power of Partnerships
1. Power of Data: Investing in Data gathering, management,
rigorous analysis, training/TA of multiple national users
2. Distinguishing between Zombie vs. Real Transparency
3. Complementary to Transparency: Governance in full value chain
4. Taking Incentives seriously: “Tough Love” (Love: ‘In the Club’,
Tough: Real Performance implementation criteria, w/ metrics)
5. Taking Institutional Partnerships seriously and to the next level:
i) Scan & Mapping of activities & organizations, division of labor;
ii) Joint Country Strategies; iii) Strategic Partnerships & Mergers
29
Some Perspective on the Power of Transparency & Data…
‘If it cannot be measured, it cannot be controlled’
Lord Kelvin
‘Not everything that counts, can be counted, and,
not everything that can be counted, counts’ Einstein