Embed Size (px)
Citation preview

P/GSI Slides
The Development of a 400 Level 3C Clamped
Downhole Seismic Receiver Arrayfor 3D Imaging of Gas Reservoirs
-The Next Generation of HighResolution 3D/4D Imaging
Paulsson Geophysical Services, Inc. (P/GSI)Brea, CA

P/GSI Slides
The Development of a 400 level 3C borehole arrayProject Summary
The project is co-funded by DOE and P/GSI (50% each)Project started on October 1, 2001Estimated project duration 24 - 30 monthsFirst operational equipment was available Q1, 2002All equipment was completed Q2 2002Project survey planned for Q3 or Q4 2002Processing completed of data from Project survey by Q2 or Q3 2003Software development during the entire course of the project

P/GSI Slides
The Development of a 400 level 3C borehole arrayProject Tasks
Order geophone cables – 320 levels ordered Nov. 20, 2001High pressure, high temperature pods being tested at presentManufacture hardware for 400 levels
Centralizers completedGeophone housing prototype completed 12/4/01Manufacturing of 330 geophone pod housings start 12/05/01Tubing ordered – scheduled to be delivered Feb. 2002Other misc. components completed or orderedWinches have been designed – getting quotesEnclosures and trailers have been designed – getting quotesDesigning the acquisition system to work with our array
Discussing with several operators to host project survey in Q3 or Q4, 2002.

P/GSI Slides
The Development of a 400 level 3C borehole arrayProject Deliverables
A functional 400 level 3C array for boreholes available to the US gas industry for surveys.A public data set recorded in a US gas field
Raw 3D VSP data recorded on the borehole seismic arrayProcessed 3D Image from the 3D VSP dataInterpretation of the 3D VSP imageWell logs from the survey well to allow correlation of the VSP image with current standard well log data.

P/GSI Slides
Why Develop aMassive 3D VSP™
Technique

P/GSI Slides
The Massive 3D VSP™
Technique provides:
High frequency data (150 – 200 Hz) = High resolutionP and S wave data = Mapping of lithology, pore fluids, stress, etc., etc.Excellent Repeatability for time lapse imagingTrue calibrated depth imaging along the array to support important drilling decisions.
P/GSI Slides
The Massive 3D VSP™ Technique provides:An improved lateral and vertical resolution in the 3D image witha factor of two - eight, compared with surface seismic.An ability to Image in areas that previously were “non seismic”.An ability to map small scale faults with displacements less than 10 ft (3 m)A detailed velocity model through 3D tomography.A capability to image to 25,000 ft (7.6 km) and below.The highest resolution 3D imaging technology in the oil and gas industry today.

P/GSI Slides
The Massive 3D VSP™ Technique Development Details:
P/GSI developed and patented the deployment technologyP/GSI designs and manufactures the deployment hardwareP/GSI is developing the processing and imaging software, > 20 man years so far – now have 4 software developersP/GSI is processing the data, 5 processors nowP/GSI incorporates other data for interpretation services using 3D Massive VSP™

P/GSI Slides
P/GSI Receiver Array Specifications
80 - 400, 3C, Clamped Levels (up to 1,200 channels)10 - 50 ft (3 – 15 m) Level Spacing; Tool Length up to 20,000 ft (6.1 km)10,000 - 25,000 ft (3.0 – 7.6 km) Depth CapabilityDeployed on Standard Production TubingDeployable in Vertical or Horizontal wellsSM-45 HS15 Hz Geophones - No Gimbling Needed

P/GSI Slides
The Massive 3D VSP™
3D VSP imaging @ 280 Hz
P/GSI Slides
The History of Massive 3D VSP’s™ From December, 1999 to March, 2002 P/GSI recorded the ten largest 3D VSP’s in the industry. This presentation shows how the scale of projects has changed in terms of data acquisition effort and in terms of the size of volumes that are imaged.
The following three shot maps are all on the same spatial scale

P/GSI Slides
P/GSI Single well 3D VSP Surveys
9,800 ft, 3.1 km
Year 1999 1 Well, 239 shots, 57,360 traces
21,000 ft, 6.4 km
Year 20011 Well, 1,400 shots, 336,000 traces

P/GSI Slides
Example of a Multi Well 3D VSP Survey
Year 20008 Wells, 5,200 shots, 1,040,000 traces
1
8
2
3
4
5 67
14,000 ft, 4.3 km

P/GSI Slides
Multi Well Massive 3D VSP™ Surveys Recently concludedA Multi-well on-shore Massive 3D VSP survey recorded simultaneously in four deviated wells (Alaska)A Multi-well marine survey in five deviated wells (California)
Multi Well Massive 3D VSP Surveys currently under consideration
A 20 Well survey covering about 80 square miles (Wyoming)

P/GSI Slides
Massive 3D VSP™ Survey – Image Volume
D1
D2D12
D22
Receiver Array Source Points
Cylindrical image below array: radius = max source offset/2 = D/2
Maximum source offset = D2

P/GSI Slides
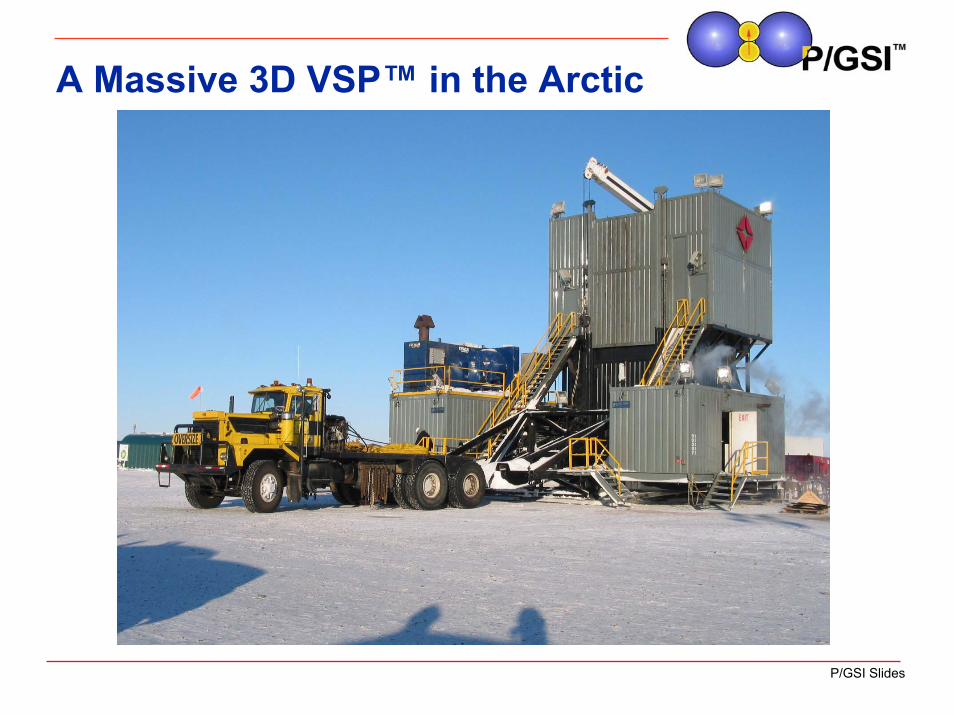
A Massive 3D VSP™recorded in the Arctic
March 2002

P/GSI Slides
A Massive 3D VSP™ in the Arctic:
Four wells and 960 channels recorded simultaneously3,232 source points3.0 million tracesSurface vibrator used as a sourceSweep: 5 – 200 Hz

P/GSI Slides
A Massive 3D VSP™ in the Arctic
P/GSI Slides
A Massive 3D VSP™ in the Arctic

P/GSI Slides
A Massive 3D VSP™ in the Arctic
From Sullivan et al., 2002, Extended Abstract, SEG, 2002, Salt Lake City

P/GSI Slides
A Massive 3D VSP™ in the Arctic
From Sullivan et al., 2002, Extended Abstract, SEG, 2002, Salt Lake City

P/GSI Slides
A Massive 3D VSP™ in the Arctic
From Sullivan et al., 2002, Extended Abstract, SEG, 2002, Salt Lake City

P/GSI Slides
A Massive 3D VSP™ in the Arctic
From Sullivan et al., 2002, Extended Abstract, SEG, 2002, Salt Lake City

P/GSI Slides
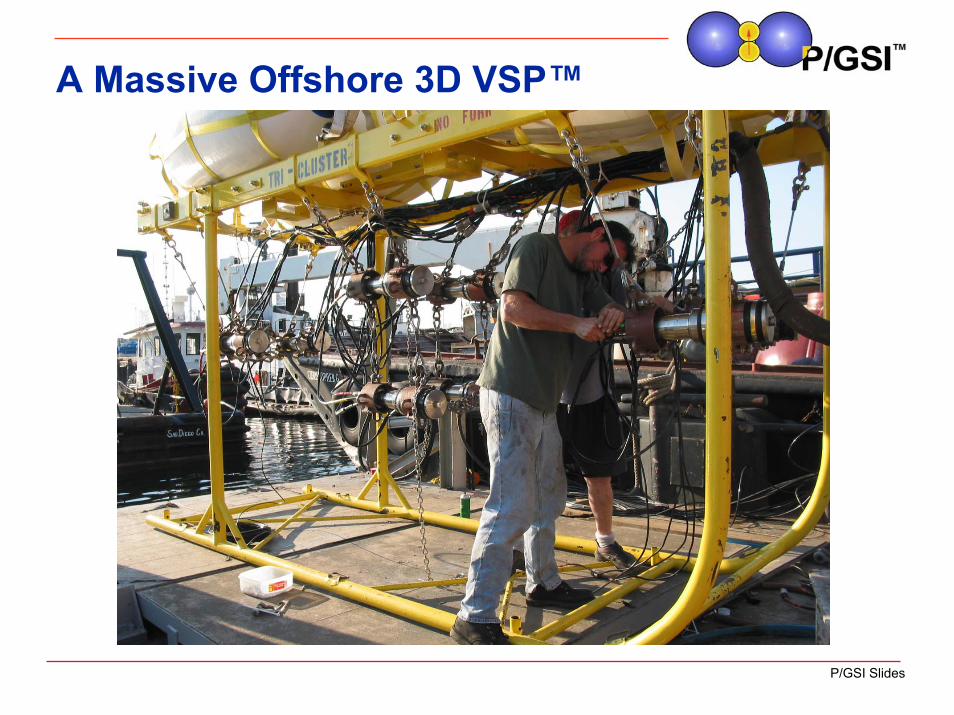
A Massive 3D VSP™recorded Offshore
February 2002

P/GSI Slides
A Massive Offshore 3D VSP™
P/GSI Slides
A Massive Offshore 3D VSP™

P/GSI Slides
Final Shot coverage into WellsA Massive Offshore 3D VSP™
D630Final Coverage
4012000 4012000
4016000 4016000
4020000 4020000
4024000 4024000
4232000
4232000
4236000
4236000
4240000
4240000
4244000
4244000
4248000
4248000

P/GSI Slides
Vertical Well Raw 3C at 2,996 ft OffsetA Massive Offshore 3D VSP™
Axial R2 R1
P/GSI Slides
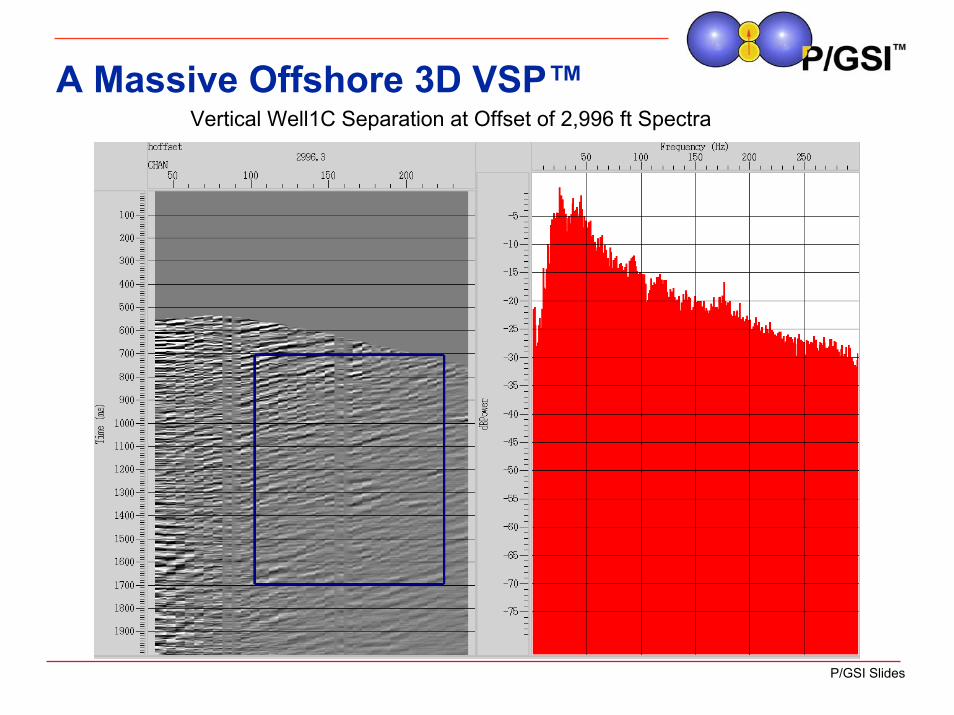
Vertical Well1C Separation at Offset of 2,996 ft Spectra A Massive Offshore 3D VSP™

P/GSI Slides
A 9C 3D Massive VSP™recorded for DOE/LBL
in NMJuly 2002
P/GSI Slides
A 9C 3D VSP™ in NM for DOE/LBL:
Objective: To study the use of back scattered energy to characterize fractured reservoirs160 receiver positions, dz=25 ft50 * 3C source pointsTwo different 3C Surface vibrators used as sourcesSweeps, P: 10–140 Hz, S: 10-70 Hz

P/GSI Slides
Acquisition of a 9C Massive 3D VSP™

P/GSI Slides
Acquisition of a 9C Massive 3D VSP™

P/GSI Slides
Acquisition of a 9C Massive 3D VSP™

P/GSI Slides
LBL – Newburry LS-2C 3D VSPZero Offset VSP from Surface to 5100 ft. depth

P/GSI Slides
LBL – Newburry LS-2C 3D VSPSample P-wave Shot – 1,700 ft Offset from Well
V H1 H2

P/GSI Slides
LBL – Newburry LS-2C 3D VSPSample SL Wave Shot 1180 ft. offset from Well
V H1 H2
P/GSI Slides
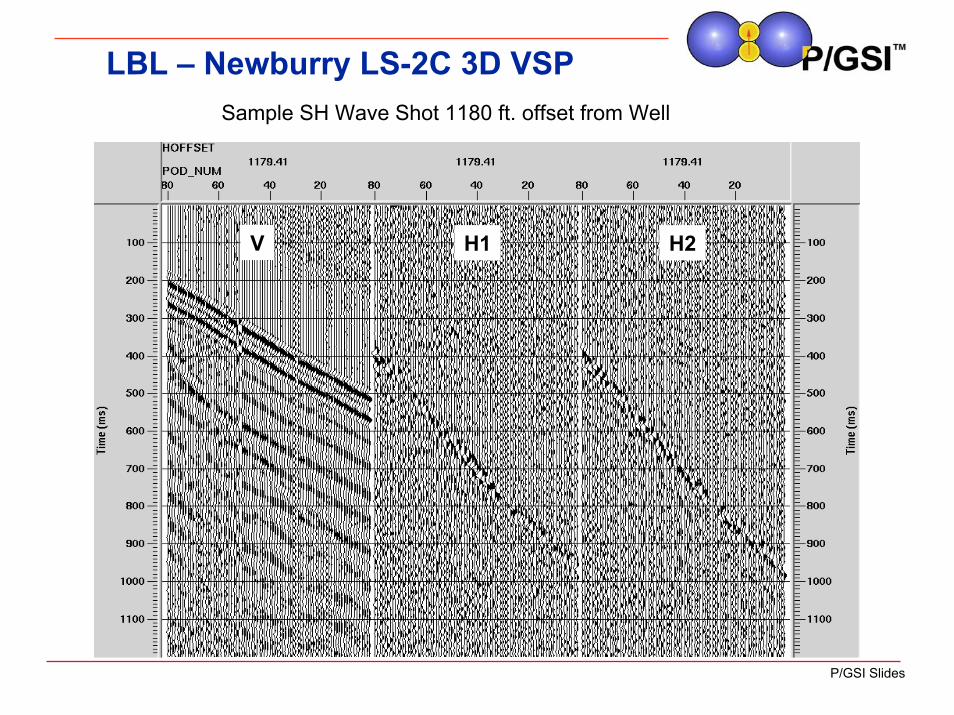
LBL – Newburry LS-2C 3D VSPSample SH Wave Shot 1180 ft. offset from Well
V H1 H2

P/GSI Slides
A Massive 4D VSP™recorded
in Saskatchewan, CanadaDec. 1999 and Dec 2001
P/GSI Slides
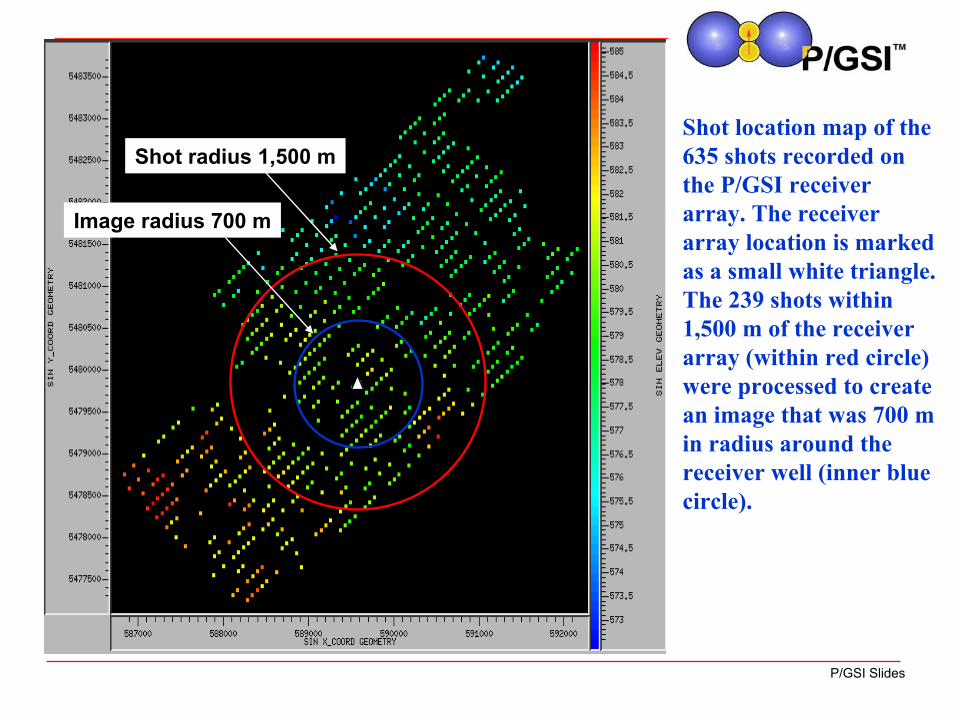
Shot radius 1,500 m
Image radius 700 m
Shot location map of the 635 shots recorded on the P/GSI receiver array. The receiver array location is marked as a small white triangle. The 239 shots within 1,500 m of the receiver array (within red circle) were processed to create an image that was 700 m in radius around the receiver well (inner blue circle).

P/GSI Slides
Weyburn 3D VSPDynamite VSP recorded on the 80 level receiver array
Reflections
First arrivals
This is a gained shot gather from the Weyburn 3D VSP survey. Only time-variant gain has been applied to the dataset. The source was 344 m from the receiver array.
P/GSI Slides
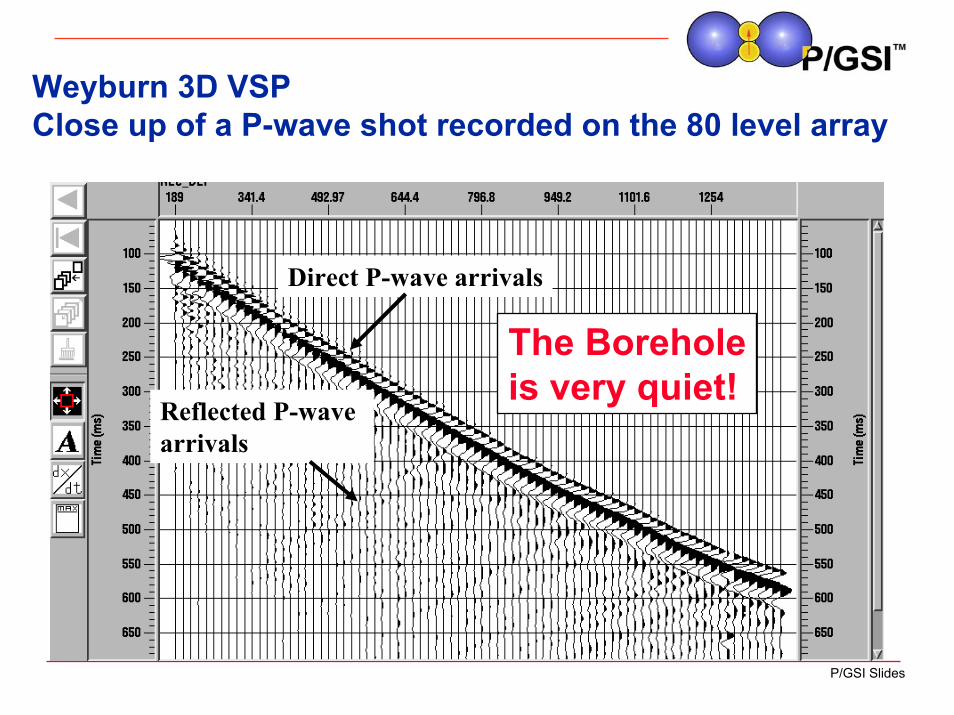
Weyburn 3D VSPClose up of a P-wave shot recorded on the 80 level array
Direct P-wave arrivals
Reflected P-wave arrivals
The Boreholeis very quiet!

P/GSI Slides
Weyburn 3D VSP. Data from 199 m and 684 m offsets before decon and wave field separation

P/GSI Slides
Weyburn 3D VSP. Data from 199 m offset after decon and wave field separation
Amplitude spectrum of a shot record from offset 199 m with time variant gain, spiking decon, and median filter applied.
P/GSI Slides
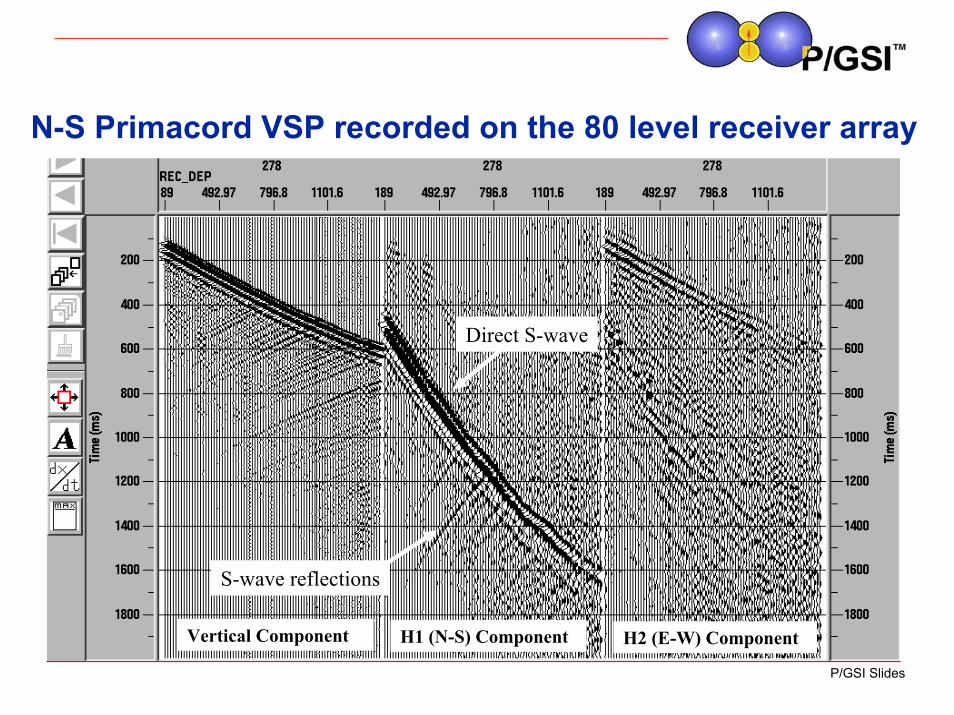
Direct S-wave
S-wave reflections
Vertical Component H1 (N-S) Component H2 (E-W) Component
N-S Primacord VSP recorded on the 80 level receiver array

P/GSI Slides
Direct S-wave
S-wave reflection
Vertical Component H1 (N-S) Component H2 (E-W) Component
E-W Primacord VSP recorded on the 80 level receiver array
P/GSI Slides
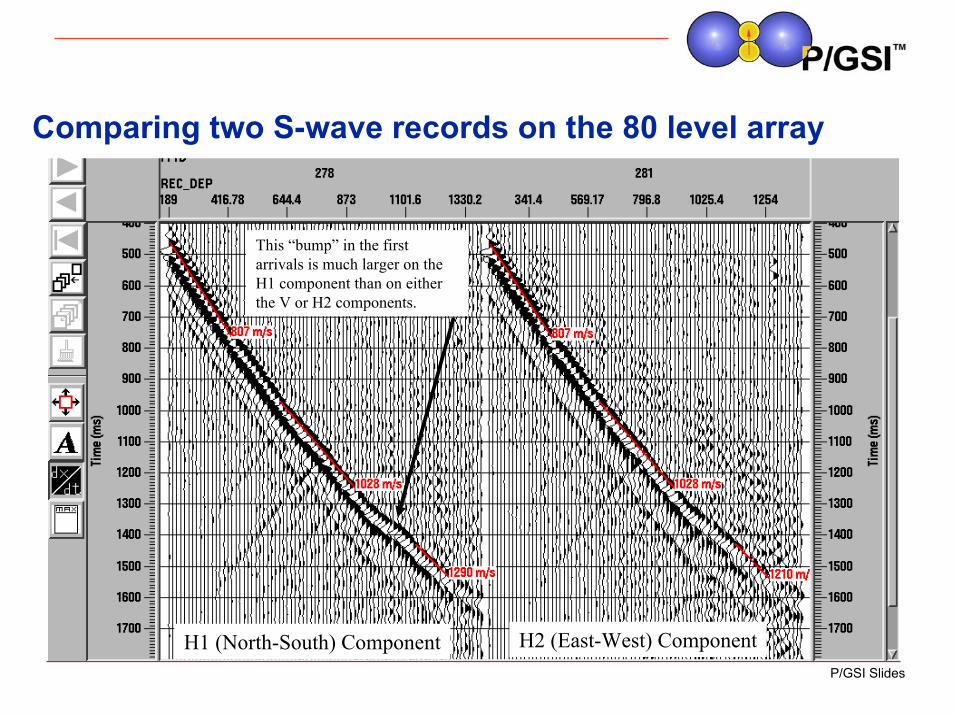
This “bump” in the first arrivals is much larger on the H1 component than on either the V or H2 components.
H1 (North-South) Component H2 (East-West) Component
Comparing two S-wave records on the 80 level array
P/GSI Slides
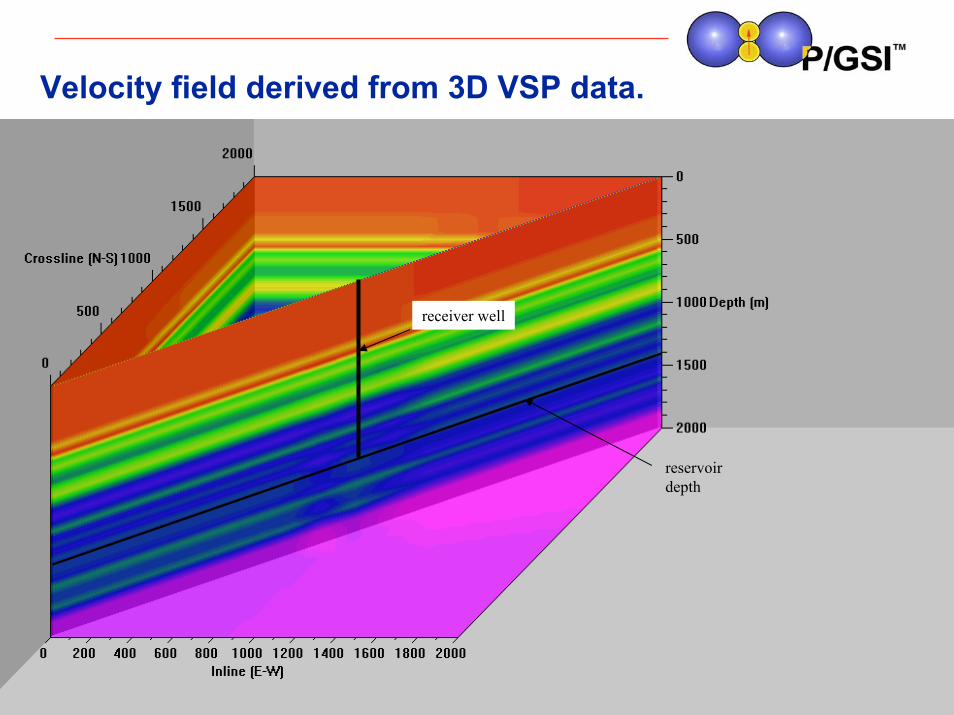
Velocity field derived from 3D VSP data.
receiver well
reservoir depth

P/GSI Slides
3D View of the image volume around the 3D VSP well

P/GSI Slides
Surface Seismic8 - 130 Hz
3D VSP data with8-130 Hz BPF
80 m80 m
Reservoir interval
Sonic log
Receiver well
Comparison of surface seismic and filtered borehole seismic data at Weyburn Field. These two images cover exactly the same ground from the receiver well to 80 m southwest of the receiver well. The VSP data has been bandpass filtered to match the frequency spectrum of the surface data

P/GSI Slides
Sonic log
Reservoir interval
80 m80 m
Surface Seismic8 - 130 Hz
3D VSP data8 - 220 Hz
Receiver well
Comparison of surface seismic and borehole seismic data at Weyburn Field. These two images cover exactly the same ground from the receiver well to 80 m southwest of the receiver well. The receiver well is at the right hand side of both images.

P/GSI Slides
East-West slice through the 3D volume.0 Length (m) 400
Reservoir level
Trace spacing is 20 m. The Maximum frequency is 210 Hz with the wavelength as short as 14 m.

P/GSI Slides
Converted Shear wavesInline horizontal component showing P-S reflections.
FFID 139 is offset 718 m south of the receiver well. The components were rotated so that one of the components was pointed toward the source. This shot record shows the inline horizontal component with strong converted S-wave reflections. The data has had no other processing beyond rotation. The traces are displayed with individual trace scaling.b
P-S Reflections
Direct P-waves

P/GSI Slides
Converted Shear waves
Spectrum of P-S converted reflections. The amplitude spectrum of P-S converted reflections is shown on the right. The reflection amplitudes are -30 dB at 104 Hz. The apparent velocity of the S-wave reflection is 850 m/s. The wavelength of the 100 Hz component is therefore 8.5 m.

P/GSI Slides
Multi-Well 3D VSPSeptember, 2000

P/GSI Slides
A one million trace, 5,000 source point, 8-well 3D VSP data set recorded in 14 days150 Hz 3D VSP vs 25 Hz for
surface seismic

P/GSI Slides
1
Final Edison Field Shot Map with well locations
8
1
2
3
4
5 67
3D VSP Shot MapShot map of 5,200 shots into 8 wells. Then the largest 3D VSP ever recorded – 1,040,000 traces.
14 kft
12 kft

P/GSI Slides
Multi Well 3D VSP1st well spectrum, 50 ft Source Offset from 1st, Raw Spectra
Shot point 200,1001st Well 2nd Well

P/GSI Slides
Depth (ft)
Inte
rval
Vel
ocity
(ft/s
ec)
Multi Well 3D VSP: Interval Velocities from log and VSP
Blue: Well logPurple: VSP

P/GSI Slides
Multi Well 3D VSP Imaging Examples

P/GSI Slides
8
1
2
3
4
5 67
Multi Well 3D VSP: Imaging Examples

P/GSI Slides
Arbitrary Line through wells 1 - 6

P/GSI Slides
8
1
2
3
4
5 67
This map shows the location of the eight receiver wells and over 5,000 source points used in the survey. The color of source point dots is the ground elevation. White lines mark cross sections that are shown in the following slides.
Figure 2
Figure 1
Figure 3
Figure 4
Multi Well 3D VSP: Imaging Examples

P/GSI Slides
Fault < 100 ft throw
X-line 265
W E
500 ft
Multi Well 3D VSP: Imaging Examples, In-Line 227
Figure 1. This line extends from West (left) to East (right) and shows a fault with 75 to 100 ft of throw. The crossing line on the next slide also covers the fault.

P/GSI SlidesFigure 1B. This line extends from West (left) to East (right) and shows a fault with 75 to 100 ft of throw.
500 ft
Fault < 100 ft throw
100 ft
W EMulti Well 3D VSP: Imaging Examples
100 ft

P/GSI Slides
Multi well 3D VSP - Summary
The 3D VSP method has been shown to be able to image complex geology and has identified a number of new drilling targets.Using the 3D VSP technique we recorded 150 Hz high quality data in an area where surface seismic recorded a low S/N ratio 25 Hz.

P/GSI Slides
The Massive 3D VSP™ Technology provides (recap):
An improved lateral and vertical resolution in the 3D image with a factor of two - eight, compared with surface seismic.An ability to Image in areas that previously were “non seismic”.An ability to map small scale faults with displacements less than 10 ft (3 m)A detailed velocity model through 3D tomography.A capability to image to 25,000 ft (7.6 km) and below.The highest resolution 3D imaging technology in the oil and gas industry today.

P/GSI Slides
Observations & ConclusionsBorehole Seismology can now be used for 3D imaging.Borehole Seismology complements surface seismology by providing focused high resolution images.Borehole seismology is still seismology so all the normal interpretation and processing tools apply -special adaptation is needed however.The key to the improved Borehole seismic imaging is the data quality and data volume that now can be achieved with new data acquisition tools.

P/GSI Slides
We acknowledge
PanCanadian Petroleum LTD. and the Weyburn Partners
for the permission to show the data and the images from the Weyburn field displayed in this presentation.
In particular we acknowledgeDave Cooper and Guoping Li, PanCanadian Petroleum
for making the 3D VSP survey possible.
P/GSI Slides
Paulsson Geophysical Services, Inc. (P/GSI) acknowledges
Vaquero Energy, Inc.
for permission to show data and images from the Edison Field displayed in this presentation.

P/GSI Slides
For more information visit us at:
www.paulsson.com

P/GSI Slides
End of Presentation