Embed Size (px)
Citation preview

Unclassified DSTI/ICCP/CISP(2013)8/FINAL Organisation de Coopération et de Développement Économiques Organisation for Economic Co-operation and Development 08-Jan-2015
___________________________________________________________________________________________
_____________ English - Or. English DIRECTORATE FOR SCIENCE, TECHNOLOGY AND INDUSTRY
COMMITTEE ON DIGITAL ECONOMY POLICY
Working Party on Communication Infrastructures and Services Policy
The Development of Fixed Broadband Networks
JT03369079
Complete document available on OLIS in its original format
This document and any map included herein are without prejudice to the status of or sovereignty over any territory, to the delimitation of
international frontiers and boundaries and to the name of any territory, city or area.
DS
TI/IC
CP
/CIS
P(2
01
3)8
/FIN
AL
Un
classified
En
glish
- Or. E
ng
lish

DSTI/ICCP/CISP(2013)8/FINAL
2
FOREWORD
This report was presented to the Working Party on Communication, Infrastructures and Services
Policy (CISP) in December 2013 and agreed to recommend it for declassification to the Committee on
Digital Economy Policy (CDEP). The CDEP Committee approved the report in April 2014.
The document was prepared by Mr. Kevin Werbach, of the Wharton Business School, University of
Pennsylvania.
The statistical data for Israel are supplied by and under the responsibility of the relevant Israeli authorities. The use of such data by the OECD is without prejudice to the status of the Golan Heights, East Jerusalem and Israeli settlements in the West Bank under the terms of international law.
© OECD 2014
Applications for permission to reproduce or translate all or part of this material should be made to: OECD Publications, 2 rue André-Pascal, 75775 Paris, Cedex 16, France; e-mail: [email protected]
Note to Delegations: This document is also available on OECD iLibrary. Please cite as
OECD (2014), "The Development of Fixed Broadband Networks", OECD Digital Economy Papers, No. 239,
OECD Publishing. doi: 10.1787/5jz2m5mlb1q2-en

DSTI/ICCP/CISP(2013)8/FINAL
3
TABLE OF CONTENTS
FOREWORD ................................................................................................................................................... 2
TABLE OF CONTENTS ................................................................................................................................ 3
MAIN POINTS ............................................................................................................................................... 5
THE EVOLUTION OF FIXED BROADBAND INFRASTRUCTURE ........................................................ 7
Types of Networks ....................................................................................................................................... 7 Twisted pair /FTTN .................................................................................................................................. 7 Cable/HFC ................................................................................................................................................ 7 Fibre ......................................................................................................................................................... 8
Megabits and megabucks ............................................................................................................................. 8 The broadband landscape ......................................................................................................................... 8 Interconnection mechanisms .................................................................................................................. 10 Economic dimensions ............................................................................................................................ 11 The role of wireline amid the growth of wireless................................................................................... 11
Key marketplace developments ................................................................................................................. 13 Convergence ........................................................................................................................................... 13 Growth of streaming media .................................................................................................................... 14 Content delivery and cloud services ....................................................................................................... 15 The PSTN transition ............................................................................................................................... 16
FROM HERE TO FIBRE .............................................................................................................................. 18
Significance of ultra-fast networks ............................................................................................................ 18 The economics of abundance ................................................................................................................. 18 Indirect benefits ...................................................................................................................................... 19 Upgrade paths ......................................................................................................................................... 20
Business and regulatory models for fibre deployment ............................................................................... 21 Incumbents vs. entrants .......................................................................................................................... 23 Public funding ........................................................................................................................................ 24 Open access ............................................................................................................................................ 26
Barriers to Investment ................................................................................................................................ 27 Capital expenditures ............................................................................................................................... 27 Transit costs............................................................................................................................................ 28 Municipal obstacles ................................................................................................................................ 28
RELATIONSHIP TO APPLICATIONS, SERVICES, AND CONTENT .................................................... 30
Broadband and Specialised Services ......................................................................................................... 30 OTT offerings ............................................................................................................................................ 30
Real-time communications ..................................................................................................................... 30 Entertainment video services.................................................................................................................. 31 Telework/telepresence ............................................................................................................................ 31 Cloud computing and storage ................................................................................................................. 32 Financial services ................................................................................................................................... 32 Internet of Things ................................................................................................................................... 32 Smart homes ........................................................................................................................................... 33
Business Models for Deployment .............................................................................................................. 33 Cost causation and infrastructure benefits .............................................................................................. 33

DSTI/ICCP/CISP(2013)8/FINAL
4
Content-based interconnection charges .................................................................................................. 33 Potential bargaining asymmetries .......................................................................................................... 35 Relationship to network investment ....................................................................................................... 37
End-user pricing practices .......................................................................................................................... 38
CONCLUSIONS AND SUMMARY ............................................................................................................ 41
REFERENCES .............................................................................................................................................. 43
NOTES .......................................................................................................................................................... 45

DSTI/ICCP/CISP(2013)8/FINAL
5
MAIN POINTS
This report examines the development of fixed networks and their ability to support the Internet
economy. Internet access in the OECD area has been upgraded almost entirely to broadband, with only 3%
of total subscribers still using dial-up links. Several significant developments are creating increasing
demand to upgrade fixed networks. Digital convergence means that the same network platforms can offer
voice, video, and data. Rapid growth in streaming media, especially video, requires major efforts to handle
traffic demands. Content delivery networks and cloud services add intelligence inside the network. And the
replacement of the public switched telephone network (PSTN) with Internet protocol transmission
challenges long-settled aspects of the legal and business environment for communications.
Enhancements to fixed broadband networks remain important despite the growth of wireless data.
Wireless broadband networks still carry far less traffic than fixed networks, and they generally offer lower
speeds and reliability. Moreover, the growth of mobile data actually increases demand for fixed networks.
Mobile connections only travel over the air for a short distance, after which they are carried on high-
capacity wired connections. The growth of Wi-Fi and other mechanisms for offloading cellular traffic will
place greater demands on wired networks.
Upgrading fixed networks to ultra-fast speeds of 100 megabits per second or more has the potential to
generate significant direct and indirect benefits. Both operators and governments are looking in particular
at mechanisms to encourage deployment of fibre connections. In December 2012, 14.9% of total fixed
broadband subscriptions involved fibre to the home (FTTH) in the OECD area, ranging from less than 1%
in some countries to nearly 70% in Japan. This does not tell the full story, because many countries with
limited FTTH penetration have widespread availability of what today is considered fast broadband through
cable or fibre to the node (FTTN) networks. These platforms, which do not extend fibre all the way to the
premises, have limitations compared to FTTH systems, but they may be deployed initially at a lower cost.
The greatest barrier to fibre FTTH deployment involves capital costs, which typically exceed
USD 1 000 per home served. Transit costs and difficulties in gaining municipal approvals and access to
rights of way are also impediments. New technologies such as vectoring and G.fast (for FTTN networks)
and DOCSIS 3.1 (for cable networks) may narrow the performance gap with fully fibre-based systems,
although they come with limitations such as the need for short loops and limitations on unbundling.
The business and regulatory models for deployment of faster networks vary along several dimensions,
including the involvement of incumbents and new entrants, the scope of public funding, and requirements
for open access or wholesale service provision. There are also architectural choices for both the access and
distribution segments of the network (e.g. FTTH vs. vectored VDSL2) that significantly affect
performance. Operators are making different choices depending on local conditions.
For regulators, a central question is how to ensure effective competition under any of these
alternatives. The up-front costs of upgrades and technical limitations on unbundling under certain
configurations may create dilemmas between promoting investment and ensuring competition. This will
put a spotlight on regulatory approaches that are appropriate in the absence of sufficient infrastructure
competition, or that allow for competition in other ways.

DSTI/ICCP/CISP(2013)8/FINAL
6
Applications, services, and content can be delivered to end-users over ultra-fast networks through
specialised services segregated from other Internet traffic (for example, IPTV), or over the top (OTT)
services that use the general-purpose data pipe. The economic and technical arrangements involved are
increasingly complex. Users may pay subscription fees to OTT providers as well as broadband access
providers, and both types of providers may also pay interconnection and transit charges inside the network.
Content delivery networks and other mechanisms are now widely deployed to improve performance,
creating further complications. End-user pricing practices such as data caps and usage charges can also
influence the economics of both broadband access and OTT services.
In this environment, some operators are pushing for a model in which OTT providers pay for access
to broadband customers, based not just on volume but on the type and direction of traffic. Their main
justification for this approach is to provide additional capital for network upgrades, including quality of
service for OTT applications and investment in fibre or other ultra-fast networks. If OTT providers and
operators voluntarily negotiate content-based interconnection arrangements, consistency with network
neutrality policies or principles should be assessed. A greater concern may be that some operators, if given
the opportunity due to regulatory intervention that alters commercial negotiations in their favour, could
effectively require OTT providers to pay additional charges. This could have negative consequences for
competition and innovation; with no guarantee these funds would promote greater network investment.
The evidence so far is mixed as to whether public intervention at the national level is necessary to
spur fibre deployment, and how the evolution of fixed networks will alter the relationships among
established operators, entrants, and OTT providers. Ultimately, competition and transparency are the most
effective means to facilitate investment and innovation in both networks and the services delivered over
them.
DSTI/ICCP/CISP(2013)8/FINAL
7
THE EVOLUTION OF FIXED BROADBAND INFRASTRUCTURE
Types of Networks
Network operators around the world use a myriad of different network configurations to deliver
broadband data connectivity (Table 1). However, there are in essence only two substances used for
transport in fixed communications networks: copper and fibre-optic glass. Copper carrier systems are
further subdivided into thin “twisted pair” cables originally designed for voice telephony and thick
“coaxial” cables with greater capacity, primarily installed for cable television. 1
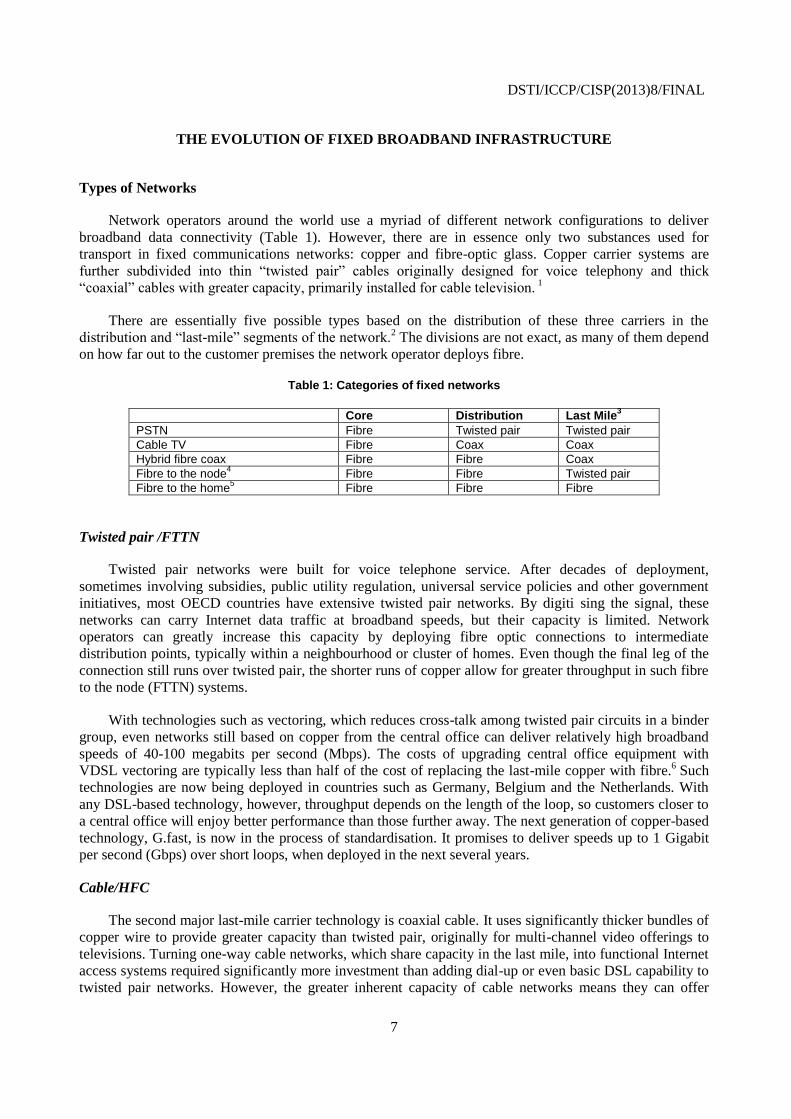
There are essentially five possible types based on the distribution of these three carriers in the
distribution and “last-mile” segments of the network.2 The divisions are not exact, as many of them depend
on how far out to the customer premises the network operator deploys fibre.
Table 1: Categories of fixed networks
Core Distribution Last Mile3
PSTN Fibre Twisted pair Twisted pair
Cable TV Fibre Coax Coax
Hybrid fibre coax Fibre Fibre Coax
Fibre to the node4 Fibre Fibre Twisted pair
Fibre to the home5 Fibre Fibre Fibre
Twisted pair /FTTN
Twisted pair networks were built for voice telephone service. After decades of deployment,
sometimes involving subsidies, public utility regulation, universal service policies and other government
initiatives, most OECD countries have extensive twisted pair networks. By digiti sing the signal, these
networks can carry Internet data traffic at broadband speeds, but their capacity is limited. Network
operators can greatly increase this capacity by deploying fibre optic connections to intermediate
distribution points, typically within a neighbourhood or cluster of homes. Even though the final leg of the
connection still runs over twisted pair, the shorter runs of copper allow for greater throughput in such fibre
to the node (FTTN) systems.
With technologies such as vectoring, which reduces cross-talk among twisted pair circuits in a binder
group, even networks still based on copper from the central office can deliver relatively high broadband
speeds of 40-100 megabits per second (Mbps). The costs of upgrading central office equipment with
VDSL vectoring are typically less than half of the cost of replacing the last-mile copper with fibre.6 Such
technologies are now being deployed in countries such as Germany, Belgium and the Netherlands. With
any DSL-based technology, however, throughput depends on the length of the loop, so customers closer to
a central office will enjoy better performance than those further away. The next generation of copper-based
technology, G.fast, is now in the process of standardisation. It promises to deliver speeds up to 1 Gigabit
per second (Gbps) over short loops, when deployed in the next several years.
Cable/HFC
The second major last-mile carrier technology is coaxial cable. It uses significantly thicker bundles of
copper wire to provide greater capacity than twisted pair, originally for multi-channel video offerings to
televisions. Turning one-way cable networks, which share capacity in the last mile, into functional Internet
access systems required significantly more investment than adding dial-up or even basic DSL capability to
twisted pair networks. However, the greater inherent capacity of cable networks means they can offer

DSTI/ICCP/CISP(2013)8/FINAL
8
higher broadband speeds. These speeds are increased even further when, as with the case of FTTN
networks, operators deploy fibre deeper into the network towards homes.
In the cable case, much of this upgrade was justified by the desire to provide additional television
channels and interactive “on-demand” functions for their existing multi-channel video offering. Most cable
networks today use a hybrid fibre coax (HFC) architecture. With the current DOCSIS 3.0 standard for
cable modems, such networks can deliver broadband access speeds in the hundreds of megabits per second.
There are some limitations of cable broadband networks. They are inherently asymmetric, unlike fibre, and
they share capacity among subscribers in the last mile, which may limit their ability to deliver advertised
speeds at peak loads or require more active traffic management.
Cable-based systems are not the leading providers of broadband access in most OECD countries. The
United States, where cable has the largest share of broadband customers, is the largest exception. Cable
television is also available to 80% or more of the population in Canada, Belgium, Korea, the Netherlands,
and Switzerland (OECD, 2013a).7 In most countries, deployments of cable systems for multi-channel video
programming were limited, especially once direct broadcast satellite (DBS) technology allowed for
satellite-based systems to provide comparable services. Cable TV subscribership is below 20% of homes in
countries such as France, Italy, Mexico, New Zealand, Spain, and Turkey.8
Fibre
The final option considered here for broadband connectivity is fibre. The carrying capacity of fibre-
optic glass strands using laser pulses is virtually unlimited. Researchers have demonstrated speeds
exceeding 100 terabits (the equivalent of 100 000 000 megabits) per second over hundreds of kilometres.9
Production networks cannot approach those rates, but many fibre networks in the field offer customers
speeds of 1 Gbps. That is 10 and 100 times faster than most alternative fixed broadband offerings.
The challenge is the deployment cost involved. Expenses for the equipment and electronics of fibre
networks have come down, but running fibre to each home over either underground or aerial conduit is still
very costly. A 2008 survey in connection with the Australian National Broadband Network (NBN) found a
range of estimates based on international comparisons from under USD 500 to over USD 2 000 per
premises passed.10
More recent data from the NBN suggests an average cost per premises passed in
Australia of AUD 1 100 to AUD 1 400 (roughly USD 1 000 to USD 1 300).11
Exact numbers depend on
the architecture chosen (with FTTN networks roughly one quarter to one-half as costly as FTTH), local
labour costs, and physical factors such as population density and topography. Thus, in Korea, where a very
high percentage of the population lives in urban areas, per-home deployment costs for fibre are estimated
at only USD 110 to USD 170.
Eventually, fibre will almost certainly be the dominant carrier technology in fixed networks. Fibre is
the only technology that is certain to offer greater capacity than wireless networks, which are continually
evolving to offer better performance in addition to the benefits of mobility and flexible deployment. Even
when end-user devices are connected wirelessly, fibre will be the technology of choice for aggregation and
backhaul to Internet core networks, as it is today for cellular towers. Over a reasonable strategic planning
horizon of ten or twenty years, however, fixed networks throughout the OECD seem destined to involve a
mix of fibre along with twisted pair and coax networks in many countries.
Megabits and megabucks
The broadband landscape
The original form of residential Internet access used dial-up connections through the telephone
network. Internet access providers or the telephone companies themselves deployed modems in central

DSTI/ICCP/CISP(2013)8/FINAL
9
offices that converted analogue voice connections to Internet Protocol data packets, and then routed those
packets across the Internet. Dial-up access did not require costly upgrades to the existing wireline last-mile
infrastructure. However, it provided very limited data speeds (typically not more than 56 kilobits per
second), and required the subscriber to initiate a phone call every time they wished to connect.
As Internet usage skyrocketed in the late 1990s operators began to deploy always-on broadband
connections to replace these narrowband access mechanisms. By the first few years of the 21st century,
broadband connections had surpassed dial-up, even in markets such as the United States where the dial-up
market was already quite large. As of 2011, dial-up connections represented only 3% of the total fixed
Internet connections in the OECD, with only Australia and New Zealand reporting rates over 10% (OECD,
2013a).12
Fixed broadband access networks vary greatly in speed and other characteristics. There is no
universally agreed-upon lower or upper bound for broadband. The OECD requires a minimum of 256 kbps
downstream for its collection of data on broadband access, although most broadband systems today operate
at considerably faster speeds. Many ISPs offer a range of speeds at different price points, some of which
are not available to all customers. To address this, OECD data are now collected in tiers (e.g. up to 2 Mbps
ranging to over 1 Gbps). Some countries also define “broadband” in legislation associated with universal
service or national broadband plans (e.g. Australia, Finland and Spain). In the United States, the Federal
Communications Commission (FCC) initially defined broadband as at least 200 kilobits in both directions,
and currently defines it as at least four megabits downstream and one megabit upstream.
Most first-generation broadband access networks used asynchronous digital subscriber line (ADSL)
technology for twisted pair last-mile networks and DOCSIS 1.0/2.0 for coaxial cable networks, typically
delivering downstream speeds in the range of 1-6 megabits per second (Mbps), and considerably lower
upstream speeds. Newer technologies, network upgrades, and competition are pushing these speeds up. By
upgrading central office equipment and selectively deploying in the distribution network to shorten loop
lengths, carriers in many countries are able to offer DSL-based broadband services at rates of
approximately 20-70 Mbps, depending on distance to the central office. In addition to better broadband
performance, these speeds have allowed many operators to deploy bundled services including voice and
multi-channel video alongside broadband data.
Vectoring, which is poised for large-scale deployment in a number of OECD countries, could double
those rates. Vectoring does require relatively substantial central office upgrades. Also, with current
technology, it makes it difficult to offer unbundled access to the local loop, which could reduce the level of
competition.13
However, the ease of upgrading relative to full fibre deployments makes the technology
attractive in many countries. Vectoring may make FTTN architectures more appealing in the short- to
medium-term, potentially as an initial step toward later deployment of FTTH. Or it may enable operators to
expand coverage plans by using a mixture of FTTH and FTTN. However, it raises important considerations
for regulators (Plückebaum, 2013). In Germany, BNetzA has proposed allowing operators to deploy
vectored VDSL2 on a “first come, first served” basis. While this might limit competition, it could also
create a strong incentive to upgrade in order to lock out other entrants.
Over coaxial cable networks, DOCSIS 3.0 allows for downstream speeds comparable to those offered
by many FTTH providers. For example, Comcast in the United States offers a residential broadband tier
with 505 Mbps downstream and 100 Mbps upstream, matching the top downstream offer on Verizon’s
competing FiOS fibre network. This service, however, is priced at USD 299/month, which is not a
mainstream residential price. Comcast’s other speed tiers are roughly competitive in price and capacity
with those for Verizon’s FiOS. Generally speaking, in countries with significant cable penetration, those
networks are competing against either VDSL or fibre-based offerings for the top end of the market.

DSTI/ICCP/CISP(2013)8/FINAL
10
The distinction between published broadband speeds and actual performance should be kept in mind.
End-to-end throughput on the Internet is only as fast as the slowest link, which may be outside the
broadband access network. Depending on the type of network and the operator’s level of investment,
performance may suffer when many users are active at the same time, or when users access popular
content. In addition, the top speeds for technologies based on copper loops depend on the distance to the
central office. At the same time, operators may report theoretical capacity of their networks to obtain
maximum marketing benefits. Some regulators have begun to require transparency and truth in advertising
to give users a more accurate picture. Both regulators and third parties are also gathering real-world
performance data to give a more precise picture.
Interconnection mechanisms
Last-mile access networks are only part of the picture. No provider, no matter how large, can keep all
traffic on its own network. When users seek to access content and services remotely over the network, they
may need to reach servers located in other countries or on other providers’ networks. A subscriber may
have an extremely fast broadband pipe into their home, but the performance they experience in reaching
that remote content or services is a function of the end-to-end communications path. Providers along that
path make a series of technical and investment choices, which affect both their cost structure and
performance.
Generally speaking, there are two kinds of networks making up the Internet: access and transit
networks. Access networks give residential and business users access to the Internet; transit networks move
data between other networks. Most large operators of physical access networks have at least some transit
aspects of their network, to reduce the costs involved in paying other providers for transit. Some transit
networks, generally referred to as core or backbone networks, specialise in high-capacity long-distance
links between different access networks. Others, generally called content delivery or content distribution
networks (CDNs), focus on providing high-performance transit for large content producers or cloud service
providers.14
These networks must interconnect with each other to provide end-to-end service. Those terms of
interconnection further shape the end-to-end experience (OECD, 2013b). In contrast to
telecommunications networks, interconnection between Internet networks is generally not subject to price
regulation. Moreover, each network can interconnect with as many others as it chooses, in whatever
locations it chooses. Neutral Internet exchange points (IXPs), a large number of which have been built in
major markets including the United States, Europe and Brazil in recent years, facilitate interconnection
between networks (OECD, 2014a).
The two canonical arrangements for Internet interconnection are peering and transit. With a peering
arrangement, each network commits only to delivering traffic to its own customers; it does not guarantee
routing anywhere on the Internet. Peering arrangements historically were settlement-free agreements
between the largest transit networks, but today, some providers engage in “paid peering” in which one
network offers certain performance guarantees in return for a payment. The other traditional arrangement is
transit, in which one network charges for delivery of traffic between another network and all points on the
Internet.
As will be described in more detail below, the picture is more complicated today. Content delivery
and cloud computing platforms optimise the delivery of content and services across the network. The
Internet was designed as an end-to-end network that provided two-way transport between devices and their
users at the edges of the network. CDNs are optimised for one-way distribution of video, images, and other
content from large content providers such as Netflix or the BBC’s iPlayer to individual users. Cloud
computing is designed to move the computing and storage functionality of the end-user device into the

DSTI/ICCP/CISP(2013)8/FINAL
11
network. Even when a high-level network diagram looks the same, these applications involve different
business relationships and technical expectations than the baseline client-server or peer-to-peer models the
Internet architecture was designed around.
Economic dimensions
All fixed communications networks share basic economic characteristics. The first is high fixed costs
(capital expenditures), both in absolute terms and relative to variable costs (operational expenditures). The
numbers vary based on technology and the scale of the network. Under any conditions, though, running a
wire into each residence, and linking those last-mile connections through a wired distribution network, is a
costly endeavour. In addition to direct expenses, the necessity of digging up streets, gaining access to
telephone poles or conduit space, and gaining physical access to homes is a significant burden.
For a great many years, some economists treated telephone networks as a canonical example of a
natural monopoly – a business in which competition was infeasible – mainly due to those large up-front
costs and associated economies of scale. While wireless networks are also costly to deploy, the fact that a
single tower can serve an area and the network can scale by subdividing cells when capacity limits are
reached mean they do not have the same cost profile as fixed networks.
Historically, most incumbent fixed networks, in markets with private ownership, were built out under
a regulated monopoly arrangement that guaranteed a fixed rate of return and the absence of competition to
address these considerations. In other countries state owned monopolies, sometimes within a government
department, provided telecommunication services – also under monopoly conditions. The demands on
governments to meet other priorities often meant the funds required for network investment were
constrained. In addition, without rate of return incentives, few matched the level of telephone penetration
experienced in North America, though there were some exceptions such as in Sweden.
Competitors that entered markets following liberalisation, in most OECD countries, used the existing
fixed last-mile network under regulated wholesale and interconnection arrangements to provide telephony
and other services. Few new entrants replicated traditional PSTN access infrastructure. Where competitive
facilities were introduced they generally involved the provision of additional services (such as cable
television), which provided a revenue stream to offset some of the fixed costs. These infrastructures were
also, for the most part, built in areas with higher population densities. In some countries with areas of low
population density there are still significant challenges associated with the inherited universal service
schemes as well as the higher costs that can be involved in expanding traditional and new services.
The role of wireline amid the growth of wireless
There are far more people in the world with wireless communications devices than wireline
connections. And with mass-market deployment of smartphones and tablets, the introduction of 3G/4G
cellular networks, and large-scale rollouts of Wi-Fi access points, wireless data usage has grown
explosively in recent years. Only six years after the introduction of Apple’s game-changing iPhone, the
installed base of smartphones and tablets exceeds that of personal computers.15
The question naturally
arises whether fixed networks still deserve so much attention.
If anything, the growth of wireless data accentuates the need to focus on fixed network deployment
and enhancement. Most Internet traffic still runs over wired connections. Worldwide, according to Cisco,
mobile data traffic was 2% of total IP traffic in 2012, and will be 9% of the total by 2017. Moreover, while
mobile networks are extremely significant and create their own unique issues, there are still situations
where fixed connections are superior. The throughput of wireless networks continues to improve, but the
highest performance over a wireless connection will always lag behind what is possible over the more
DSTI/ICCP/CISP(2013)8/FINAL
12
controlled environment of a wire. Moreover, wireless connections are less reliable and vulnerable to
interference, making them less robust than fixed connections. And finally, certain applications such as
video services delivered to large television sets are inherently non-mobile.
The growth in wireless data traffic has indeed been impressive. Mobile data traffic doubled between
2011 and 2012 alone.16
Going forward, Cisco’s widely-used Visual Networking Index (VNI) predicts data
transmitted on mobile broadband networks in 2017 will be nearly thirteen times the level of 2012 (CISCO,
2013). Wireless networks thus appear to be the fastest-growing segment of data traffic. In actuality, there
are few official data to inform this question and where it does exist it can be initially counter intuitive.
In Australia, for example, the average fixed-line subscription downloads per month increased at 56%
year-on-year to 30.6 GB per month between 2008 and December 2012.17
Meanwhile, during this period,
the average for mobile subscriptions remained relatively constant at 1.5 GB per month. There are several
factors at play here, including: the use of fixed networks to offload smartphone traffic via Wi-Fi access
points; user preference for consumption of some services via fixed rather than mobile networks (for
reasons of price or performance); or simply because large amounts of the day are spent at locations where
fixed networks are the default on devices used for consumption (e.g. Wi-Fi at home or work).
The increase in wireless traffic reported by operators in many markets, therefore, is at least partly a
function of the growth in individual smartphone subscriptions. In many OECD countries, mobile
subscriptions already exceed total population and far exceed the number of households. This trend seems
likely to accelerate as data-centric devices replace feature phones. In other words, while the average
Australian household will likely only have a single fixed broadband connection, it will increasingly have
multiple wireless data subscriptions associated with smart-phones and tablets. The most recent data
collected by the Australian Bureau of Statistics showed that the total volume of data downloaded via
mobile handsets between April and June 2013 was 19 636 terabytes -- a 43 percent increase from the
previous period of October to December 2012.18
Given that the number of subscriptions increased by 13%,
between December 2012 and June 2013, these data suggest usage is starting to increase per individual user.
It is also crucial to keep in mind that “wireless” connections involve a significant amount of fixed
infrastructure. In most cases, the wireless portion of the transmission is only the short hop between the end-
user device and a local network node, whether a Wi-Fi access point or a cellular tower. Those nodes are
typically fed by high-capacity wired backhaul connections, with microwave relay and other wireless
backhaul technologies used only where fixed connections are unavailable or unaffordable. It has been
estimated that 70-80% of the total cost of a 4G LTE network is in fact the expense of fibre backhaul
(Acreo, 2013). And core networks are almost entirely wireline.
With the growth of Wi-Fi, fixed networks provide the facilities over which both users and operators
will off-load traffic whenever that is the most efficient, economic or convenient option. In June 2013,
Mobidia, a private company monitoring the use of smart-phones, suggested that the growth in usage of
data on smart-phones across countries such as Canada, Korea, Japan and the United States, was greater
over Wi-Fi than wireless networks.19
These data are measured using “crowdsourcing” techniques, based on
apps downloaded to users’ smartphones. The company reported that, on aggregate, across these and other
countries, Wi-Fi data consumption represented more than 70 percent of total data used on a smartphone
and was growing faster than cellular mobile usage.
Globally, public Wi-Fi hotspots are predicted to grow from 1.3 million in 2011 to 5.8 million in 2015,
according to Informa.20
Mobile and fixed operators as well as many governments throughout the world are
deploying large-scale municipal Wi-Fi networks in major urban areas. In some cases operators use legacy
infrastructure, such as public telephone booths, to provide places where the hotspot is located, as is
occurring in New Zealand.21
In other cases ISPs are providing Wi-Fi, blanketing central business districts

DSTI/ICCP/CISP(2013)8/FINAL
13
and surrounding parklands, such as Internode is doing in Adelaide, Australia.22
Some fixed line providers
without cellular networks, such as Shaw Cable in Canada and Time Warner Cable in the United States,
have built out extensive Wi-Fi hotspot in their regions as their primary wireless offering.23
As big as the public Wi-Fi cloud is, there are many more Wi-Fi access points deployed privately in
homes or businesses. Some wireless providers, such as Iliad Free in France, use their customers’ residential
Wi-Fi routers coverage to provide service to their mobile users. Several fixed broadband operators
including Belgacom (Belgium), BT (United Kingdom), Deutsche Telekom (Germany), KPN (Netherlands),
SFR (France), and Softbank (Japan) have partnered with Fon, which makes Wi-Fi access points that
automatically share capacity with other subscribers. Fon claims over twelve million hotspots on its
network.24
New technical standards will improve the convenience of handoffs between access points for mobile
devices. Several operators in France, Sweden and Switzerland, for example, make use of the Extensible
Authentication Protocol to provide seamless handovers from cellular to fixed networks via Wi-Fi. The
IEEE 802.11u standard and the Certified Passpoint initiative from the Wi-Fi Alliance allow for cellular-
like roaming and automatic connections when users approach Wi-Fi hotspots.
The more traffic on wireless networks, therefore, the more traffic on fixed networks. If the economics
or performance characteristics of fixed networks cannot support sufficient growth, mobile networks will
suffer as well. Conversely, widespread deployment of fibre networks may help promote high-speed mobile
data rollouts. In Stockholm, Sweden, for example, mobile operators took advantage of municipal dark fibre
to roll out high-speed 4G mobile data services in advance of many other countries.
Key marketplace developments
Convergence
The most significant phenomenon in the evolution of fixed networks is the convergence of all
communications services. Convergence has several aspects:
From analogue to digital transmission
From various transmission protocols to the Internet Protocol (IP)
Integration of fixed, nomadic, and mobile networks
Historically, voice, video, and data were delivered over physically separate networks with completely
different technical characteristics. Today, all three, as well as many other services can be provided over the
same digital broadband IP connection. This is not to say that all networks are identical: IP packets can be
delivered in many different ways. And the fact that networks can be converged is not the same as saying
that all of them are. Moving from an environment in which some telephone traffic uses voice over IP
(VOIP) to one in which all of it does involve very significant shifts in infrastructure, resolution of
regulatory and technical questions, and important business changes. By separating the service layer from
network infrastructure layers, convergence has encouraged cross-platform and cross-service competition,
and has encouraged commercial offers based on bundles across in all OECD countries.
Convergence means that policy considerations for broadband data also become considerations for
telephony and video. For example, as will be discussed below, as video services migrate to broadband
platforms through both integrated IPTV and over the top (OTT) distribution, questions about the

DSTI/ICCP/CISP(2013)8/FINAL
14
mechanics and business arrangements for interconnection between Internet networks will shape those
services in ways they never did for over-the-air broadcasting, cable or satellite television.
One aspect of convergence in the broadband era is that the incumbent providers of communications
services in most OECD countries are either the leading retail or wholesale providers of broadband Internet
access. The difference lies in whether regulators require those operators to offer unbundled access to their
broadband networks at wholesale rates. The primary exceptions are those cities and countries with publicly
funded high-speed broadband networks, such as Amsterdam, Stockholm, and in Australia in respect to its
NBN. In all cases, though, the question arises as to whether a single fixed access infrastructure will serve a
dominant percentage of customers in that market segment.
Growth of streaming media
The second major development for the broadband Internet is the rise of streaming media, particularly
video. Video now constitutes the largest share of traffic on the Internet (OECD, 2012a). According to
Cisco, over the top video represented 57% of all public Internet traffic in 2012. In North America, the
online video distribution service Netflix already represents over 30% of peak Internet traffic by itself. In
total, including IPTV, video on demand, Internet video, and peer-to-peer file sharing, video in all forms is
expected to represent 80-90% of Internet traffic in 2017 (CISCO, 2013). At that point, Cisco projects,
nearly a million minutes of video will cross the Internet every second.
There are several implications of the growing dominance of streaming video over Internet traffic. First,
video streams require significant amounts of bandwidth. Perhaps even more important, they require
sufficiently low latency and jitter to deliver good picture quality across the network. A 100 megabyte video
stream may tax the network more than a one gigabyte file transfer, because it has less tolerance for lost and
resent packets. Second, online video streaming generally follows a power-law distribution: a small number
of extremely popular items at one end, and a huge number of items with little usage by themselves on the
other end. While there has been significant attention paid to this “long tail,” it is the “head” that is most
significant in driving network investment. For such content, typically commercial movies, television
shows, and similar material, sending an identical stream across the network to thousands or millions of
viewers is inefficient; caching that content closer to the edge of the content delivery systems significantly
improves performance.
Online video streaming also raises important legal and business challenges that are not present for
websites and cloud computing services. In particular, online video services are likely to compete with
broadcast or pay television offerings. Furthermore, online video content is subject to copyright. Questions
about licencing and piracy could become potentially significant impediments to growth of the market, even
if the network capacity is available. These challenges are exacerbated in a global environment, where
viewers may watch content across borders even when intellectual property rights or cultural heritage
restrictions are defined in national terms.
Going forward, it is possible the distribution of traffic will shift again, and video will no longer have
the lion’s share. In particular, the Internet of Things promises many billions of connected devices (OECD,
2012b). The sheer number of connections may generate more traffic than online video, even if each uses
less bandwidth. Or some systems such as remote operation of robots may require fantastically large
amounts of bandwidth. Even if video remains dominant, there may be shifts in the composition of that
video traffic, just as streaming dethroned peer-to-peer downloading. Person-to-person video streams or
very high-resolution imaging content may displace one-way entertainment content as the primary form of
online video.

DSTI/ICCP/CISP(2013)8/FINAL
15
More generally, there has been a pendulum over time in traffic patterns, from symmetric to
asymmetric and back. The telephone network is symmetric, built in an environment in which each
subscriber is as likely to make as receive calls. Dial-up Internet access runs over that network, but is
inherently asymmetric: users make calls to ISPs but do not receive them. Even when users are primarily
recipients of traffic on a dial-up connection, the phone call that initiates the connection is outbound.
Broadband connections are always-on, and therefore eliminate this asymmetry. Furthermore, the initial
wave of rich media on the Internet involved peer-to-peer (P2P) file-sharing, a symmetric architecture.
When streaming video overshadowed P2P, the pendulum shifted again to services sending large streams
down to users. First-generation broadband access networks are often highly asymmetric as well, with
downstream throughput many times higher than upstream capacity.
In the future, things could change again. Fibre access networks can offer symmetric capacity, and
users are increasingly originating video streams as well as consuming them, thanks to high-quality video
cameras integrated with smartphones, tablets, and laptops. Already, wireless operators deploying high-
speed 4G networks are finding formerly asymmetric traffic becoming more symmetric.
It is impossible to plan for every eventuality. Policy-makers must address the issues before them
today and in the near future, which are heavily video-driven. They should, however, provide enough
flexibility to allow for changes in usage patterns beyond that time horizon.
Content delivery and cloud services
A further complexity is the growing prevalence of servers and storage devices “inside” the network.
In the classical model of Internet architecture, the Internet is an “end to end” transmission pipe with
intelligence limited to routing; the computers that act on, serve, and store information are at the edges. The
two major evolutions of this model are content distribution and cloud computing. Content delivery
networks use caching servers to locate popular content closer to those requesting it. Serving that content
from local caches reduces demand on the longer network links, reducing costs and increasing performance.
Cloud computing provides remote processing and storage services that take the place of local applications.
A cloud service such as Google Drive needs to distribute processing and storage to reduce latency and
improve performance in the same ways as a popular content site such as DailyMotion.
Both of these developments have significant implications for network topology, interconnection, and
business models. Large online video and cloud services providers increasingly rely on CDNs to deliver
traffic to access networks. According to Cisco’s latest Visual Networking Index report, one third of
Internet traffic globally passes over CDNs, and that total will exceed one half by 2017 (CISCO, 2013).
These CDNs both provide a benefit to those access networks (by reducing transit costs), and impose
costs on them (by requiring construction of additional interconnection ports and generating more
termination traffic). Interconnection negotiations between CDNs and access networks have become
contentious as a result. To achieve their full performance benefits CDNs need to position caching servers
within the access networks, but they can only do so with the permission of those networks. Access
networks increasingly are seeking compensation for doing so.
Major cloud operators such as Google, Apple, Amazon, and Facebook are increasingly self-
provisioning their own network infrastructure, including CDNs, data centres, fibre networks, and
transoceanic cables. These companies generally do not seek to become communications service providers
themselves.25
Instead, they are becoming network operators to internalise costs and improve performance
by more active network optimisation.

DSTI/ICCP/CISP(2013)8/FINAL
16
The PSTN transition
As the converged broadband Internet is growing, the public switched telephone network or PSTN is
shrinking. The PSTN is the network of wireline networks delivering “plain old telephone service” (POTS)
using time-division multiplexing (TDM) technology. Providing real-time communications capabilities to
over one billion people around the world, the PSTN is one of the great achievements in human history.
Already, however, the wireline PSTN has been surpassed in subscribers by wireless networks. As
investment moves toward broadband data technologies and away from special-purpose networks optimised
for voice phone service, the PSTN is gradually becoming a relic. Its switching technology uses purpose-
built mainframe-class computers, many of which are already past their expected end-of-life date. And
subscribers are increasingly choosing to rely on wireless or VoIP connections rather than their landline
phones at home.
The sunset of the PSTN is occurring at various rates in different countries. In the United States, it is
already far along. Residential switched access lines dropped from 194 million in 2000 to 101 million in
2012, a period in which the United States population grew by 30 million.26
According to the trade
association for American local telephone carriers, the percentage of U.S. households with traditional phone
service fell from 93% in 2003 to 25% in 2013.27
By the end of 2013, the trade association United States
Telecom predicts, 43% of households in the United States will be wireless-only and 32% will use VoIP or
other non-PSTN landline technologies.
Although countries are at different stages of the transition, this phenomenon is a global one.
According to the most recent OECD Communications Outlook, more than half of OECD countries
experienced a drop in analogue PSTN access lines between 2009 and 2011, with annualised declines
exceeding 10% in Denmark, Finland, France, Israel, the Netherlands, Poland, Slovenia, and Sweden.28
In
eight OECD countries, there are already fewer than 20 standard analogue PSTN access lines in use per
hundred inhabitants.
Regulators are beginning to contemplate the transition from the PSTN to an all-IP environment. This
involves the deployment of next-generation networks to replace the TDM infrastructure, along with
resolution of technical and regulatory questions around the transition. For example, the management of
e.164 phone numbers is closely tied to the PSTN. Allowing VOIP devices to seamlessly interconnect will
require both technical standards such as ENUM and arrangements to prevent breakdowns. Some regulators
are considering whether to set a “date certain” for the changeover, similar to those used in the transition
from analogue to digital broadcast television.
At a general level, the PSTN represents the promise of a universal network. Part of this promise is tied
to universal service policies that supported deployment, operation, and use of the network particularly in
high-cost areas. Another piece, however, is the ability of any subscriber to reach any other subscriber
through a common calling environment, known as dialtone. While the Internet is in many ways also a
public network and a common platform, it is not obliged by regulation or technology to offer this same
level of ubiquity.
Perhaps the most significant element of the PSTN sunset concerns the fate of interconnection.
Interconnection in the PSTN is generally required by national law and subject to non-discrimination and
pricing regulation. For Internet networks, interconnection is typically a voluntary, private, and confidential
arrangement between operators. Internet providers are free to refuse interconnection with other providers
who wish to exchange traffic. Regulators have generally concluded that the Internet market is sufficiently
competitive to allow market forces to discipline anticompetitive behaviour. And indeed, thousands of
Internet interconnection arrangements have been negotiated smoothly in this manner, as recent OECD
work found (OECD, 2013b). This work advocated a “bright line” between regulated TDM interconnection

DSTI/ICCP/CISP(2013)8/FINAL
17
and unregulated IP interconnection. The document took the position that imposition of telecommunication
regulation on IP interconnection would give dominant telecommunication carriers leverage to impose
unnecessary obligations on Internet providers.
The question now is what happens when the regulated TDM interconnection goes away, and all
telecommunication interconnection is IP interconnection. Under the existing treatment of IP
interconnection, which could mean that network interconnection is no longer subject to sector-specific
regulatory obligations. Unless it ran afoul of competition policy, a network operator would be free to
refuse interconnection on any grounds, or treat other providers in discriminatory ways.
A second option would be for “network neutrality” rules, which restrict blocking or discriminatory
treatment of traffic, to apply as the primary obligations governing interconnection (BEREC, 2012).
Although there are important similarities between network neutrality and interconnection obligations, there
are also differences, most notably the fact that network neutrality (as generally constituted) does not
affirmatively require interconnection (Werbach, 2008).
Finally, the “bright line” between TDM and IP interconnection could be maintained by requiring
TDM operators to maintain the option of TDM interconnection indefinitely. Such a policy would conflict
with the overall desire of regulators to facilitate, or at least to allow, the shift from TDM to IP. Forcing
network operators to maintain out-dated and duplicative networks would be a more intrusive regulatory
obligation than applying interconnection obligations to IP connections.

DSTI/ICCP/CISP(2013)8/FINAL
18
FROM HERE TO FIBRE
Significance of ultra-fast networks
Fixed broadband is already a mature technology in the majority of OECD countries. Growth of fixed
broadband connections in the OECD had already slowed to 1.8% by the second half of 2011.29
The most
significant current and prospective development is not the availability of broadband access, but the
deployment and adoption of newer forms of access, specifically mobile broadband and ultra-fast networks
delivering speeds of 100 Mbps or more. According to the OECD Broadband Portal, the number of fibre to
the home connections increased by 29% between 2010 and 2012, reaching 14.9% of total fixed broadband
subscriptions as of December 2012.30
Deployment of FTTN systems (and in some countries, DOCSIS 3.0
cable networks) has also expanded during that time period.
The economics of abundance
Such next-generation broadband upgrades provide several benefits.31
For example, they support
robust triple-play offerings in which voice, data, and multichannel video are delivered over the same
network, as well as potentially other services such as home security monitoring and smart grid energy
monitoring. This provides additional revenue streams and also holds the potential to reduce operational
expenses significantly, as the operator need not maintain and manage multiple networks. And as usage
evolves, the capacity and functionality of next-generation broadband networks can be expanded further.
Fibre-to-the-premises networks today can deliver one gigabit per second or more to and from end-users.
Inevitably, the question arises whether subscribers will ever need such speeds. Section III, below,
identifies a number of OTT service offerings that could benefit from fibre speeds. More generally, several
points should be highlighted. First, at every stage in the evolution of the Internet, commenters were
sceptical there was demand or need for higher speeds. New capacity creates new opportunities, which
enable new applications and services to develop. Already, delivering multiple streams of high-definition
video to different devices in the home is not a farfetched usage scenario, which exceeds the capacity of
first-generation broadband networks.
The dynamic involved is known as the economics of abundance. When a resource is scarce,
participants in the marketplace expend energy trying to optimise use of that resource, whether through
technical measures or business decisions. For example, given constraints on network throughput today,
OTT video providers such as Netflix and YouTube employ variable bitrate encoding technology that
downgrades the quality of the video stream gracefully when capacity is limited. This ensures that more
users enjoy a reasonable quality experience, but it also involves trade-offs including processing overhead
and lowering user expectations. Similarly, network operators can respond to bandwidth constraints with
data caps or usage-based pricing, which create economic incentives for users to limit their consumption.
While such mechanisms, if designed appropriately, can produce economically efficient results, they
also tend to depress potential demand and innovation. Historically, for example, those operators with
unmetered local telephone calls, such as in Canada and the United States, had much higher usage not only
of those services but also long distance services, which were metered. It also encouraged the first growth of
services such as dial-up Internet access in ways that were constrained in those countries with metered local
calls.
In an environment where a resource is abundant, new services and approaches emerge that “waste”
previously scarce resources. The Internet’s packet-switching architecture, for example, wastes computation
in network routing, because it requires significantly more processing along the way than circuit switching.

DSTI/ICCP/CISP(2013)8/FINAL
19
Thanks to Moore’s Law, however, computers are inexpensive and increasingly less expensive relative to
the past, so this trade-off imposes negligible cost penalties and produces massive benefits. Similarly, the
caching servers in CDNs and the disk arrays in data centres “waste” storage inside the network. Without
doing so, however, there would be no cloud computing or mass-scale entertainment content on the Internet.
Abundance encourages entrepreneurs and innovative companies to try out new ideas, without having to fit
into an optimised rationing environment. The possibilities of a world of unconstrained capacity are simply
impossible to imagine ahead of time.
Second, maximum throughput is not the same as actual performance. An Internet connection is only
as fast as its slowest link, so a user on a 1 Gbps connection accessing a web server on a 10 Mbps
connection with congestion on the intermediate backbone networks may only experience 1 Mbps of
throughput, or less. For video services, the engineering of CDNs and collocation of content close to the end
user may have a greater impact on actual performance than the nominal speed of the network links. 32
Moreover, some broadband networks share capacity in the last mile or distribution segments, so the
available capacity is less when users in a neighbourhood are active simultaneously. These limitations can
be alleviated through investment in caching and other enhancements in the core and distribution networks,
as will be discussed below.
Third, network deployment costs and capacity are not stepwise functions. A network delivering 1
Gbps to the home is not four times as expensive as a network delivering 250 Mbps; in most cases, it is
exactly the same network. The decision for operators is, therefore, whether to continue investing in first-
generation broadband networks, whose limits may be reached in the foreseeable future, or to “future-proof”
their networks so they can easily scale to meet future demand. Of course, the analysis for any real-world
network operator will involve their existing infrastructure, market conditions, regulatory environment, and
characteristics of their service territory.
Indirect benefits
A recent study by Ericsson, Arthur D. Little, and Chalmers University of Technology concluded that
in OECD countries, increasing broadband speeds from 4 Mbps to 8 Mbps produced an increase in
household income of USD 122 per household per month, and increasing from 8 to 24 Mbps produced a
significant further increase beyond that figure (Bohlin et al, 2013). This last number likely understates the
economic benefits of higher speeds, as applications and services taking full advantage of those capacities
are not yet widely deployed. Looking at one network in particular, the municipal fibre infrastructure
deployed by Stokab in Stockholm, Sweden, an analysis by Acreo estimated economic benefits, including
direct revenues as well as municipal cost savings and benefits to users, at EUR 1.9 billion (USD 2.57
billion), or more than triple Stokab’s total investment (Acreo, 2013).
In September 2013, one of the most comprehensive studies of the potential benefits of high-speed
deployment was published by Deloitte Access Economics, evaluating the impacts of the Australian NBN
project. The report estimated that the annual household benefits of the NBN would be worth around AUD
3 800 (USD 3 580) in 2020, in current dollars. Around two-thirds of these benefits (AUD 2 400/ USD 2
261) are financial benefits, the rest are the equivalent monetary value of consumer benefits such as savings
in travel time and convenience of e-commerce.33
Such indirect benefits include:
Cost savings form municipal telecommunication expenses
Increased property values
Economic development, including firms’ decisions about where to locate
Reduced travel expenses through use of telework and online communications tools

DSTI/ICCP/CISP(2013)8/FINAL
20
Improved productivity
Other research conclusions are consistent with these findings. A study conducted in 2013 by Swedish
Royal Institute of Technology Masters student Ziyi Xiong, analysed data from 290 municipalities in
Sweden.34
It found that, with a lag of three years, fibre networks show statistically significant socio-
economic benefits. These include population growth and better job opportunities in areas served by those
networks. A preliminary analysis of three cities in the United States concluded that the presence of fibre-
based broadband was correlated with higher property values in a neighbourhood (Molnar et al, 2013).
Many of the economic benefits of fibre come from use-cases that are not evident until networks are
deployed. For example, SVT, the Swedish public service television operator, arranges with Stokab to
purchase dark fibre strands for a short period of time to cover high-profile events such as the Swedish royal
wedding in 2010. By connecting the video feed from its cameras directly to the editing suite in its central
production studio, SVT was able to eliminate the expense of sending trucks into the field and using
satellite transmission to the studio, saving approximately 40% of production costs (Felten, 2012).
An additional benefit of fibre is a significant reduction in carbon footprint. Electricity usage of fibre
networks is estimated at 20% lower than VDSL2 networks with the same number of customers. Moreover,
the high-quality communications, telework, and other opportunities that fibre networks enable allow
subscribers to drive less, further cutting carbon emissions.
Upgrade paths
Fibre penetration rates vary greatly among OECD countries (Figure 1). In a few countries, most
notably Japan and Korea, fibre infrastructure is already widely available, with availability rates exceeding
65% of the population. In those countries, fibre was a significant element of the first wave of broadband
deployment. In a number of other countries, network operators have launched fibre infrastructure as a
second-generation technology in a limited territory. In the United States, Verizon has deployed its FiOS
fibre network to approximately 18 million homes, representing about 15% of the population in the country,
with no current plans for significant further expansion.35
In the Netherlands, KPN in partnership with
Reggefiber provided FTTH to almost 20% of homes as of September 2012.36
Numerous fibre deployment
projects are now underway throughout the OECD region by incumbent operators, new entrants, and
municipal providers.

DSTI/ICCP/CISP(2013)8/FINAL
21
Business and regulatory models for fibre deployment
Figure 1. Percentage of fibre connections in total broadband subscriptions, December 2012
Source: OECD Broadband Portal
Policy makers have taken different approaches to promoting fibre upgrades. For example, the
European Commission adopted a series of initiatives to promote fibre to the home deployment in 2010-11,
and is currently considering whether more significant regulatory intervention is warranted. The United
States pre-emptively foreclosed open access requirements for fibre in 2005, and in its 2010 National
Broadband Plan declined to propose any major commitments to ensure rapid expansion of fibre access
beyond the current footprint. On the other hand, countries such as Australia, Israel and New Zealand
decided that private operators were moving too slowly, and therefore have initiated government-funded
national broadband network deployments. Meanwhile outside the OECD area smaller countries such as
Singapore and Qatar have national FTTH deployments in progress while China is expected to add
35 million FTTH connections in 2013.37
As noted in an earlier OECD report, the scope of competition in first-generation broadband markets is
an important driver of fibre deployment (OECD, 2011). For example, in Japan, intense competition for
DSL service sparked by low unbundled access rates created incentives for providers to seek competitive
advantage through higher-speed alternatives. Japan now has the most FTTH subscribers of any OECD
country (in absolute numbers).38
0% 10% 20% 30% 40% 50% 60% 70% 80%
Belgium
Greece
Ireland
New Zealand
Chile
Germany
Austria
France
Australia
Canada
Italy
Finland
Spain
Luxembourg
Poland
United Kingdom
Netherlands
Switzerland
United States
Turkey
Hungary
OECD
Portugal
Czech Republic
Denmark
Slovenia
Iceland
Norway
Slovak Republic
Estonia
Sweden
Korea
Japan
Source: OECD Broadband Portal

DSTI/ICCP/CISP(2013)8/FINAL
22
In theory, the capacity of fibre networks is nearly infinite, but in deployment their end-to-end
performance depends on backhaul, CDNs, switching electronics, and other factors. Network operators may
also limit the capacity of their fibre offerings to discourage users from taxing other network resources and
increasing their transit costs, or to maximise revenues. And finally, price must be taken into account when
evaluating broadband offerings. Operators typically offer service at a range of speed tiers, and the highest-
capacity services may be priced at levels that make them un-affordable for mainstream residential
customers.
Moreover, there is not a bright line between “true” fibre networks and other forms of advanced
broadband access. Most fixed broadband networks today use fibre in the core and distribution segments of
the network; the issue is how far the fibre extends into the last mile. HFC cable networks using DOCSIS
3.0 and vectored VDSL2 systems on copper are today capable of delivering performance that, until a few
years ago, was only available with FTTH. In many countries, fast broadband services with downstream
rates of 20-70 Mbps or higher are now available on such networks. The next-generation standards of
DOCSIS 3.1 for cable networks and G.fast for copper FTTN network can theoretically support up to 1
Gbps connections to some subscribers, although their real-world performance and deployment schedule
remain to be seen.
As described in the previous section, FTTH networks still have important advantages. They are
essentially “future-proof,” with the potential for virtually limitless capacity with relatively inexpensive
upgrades. They offer the potential for significantly lower operational expenses and lower carbon footprint.
Cable and FTTN networks may require costly and difficult upgrades to push their performance higher. 39
Moreover, fibre is largely distance-insensitive, while the performance of systems retaining copper loops
depends on the length of the loop. FTTN systems theoretically capable of offering 50-100 Mbps may only
be able to deliver that performance to some customers. The exact percentage will depend on population
density and the location of central offices. Finally, FTTH systems are largely symmetric, while alternative
architectures, especially on cable networks, offer relatively limited upstream capacity. These benefits,
however, must be weighed against higher initial deployment costs for fibre.
In light of these factors, operators in many countries are employing a hybrid model. Swisscom in
Switzerland, for example, plans by 2015 to offer vectored VDSL to 800 000 households and businesses,
FTTN to at speeds of approximately 100 Mbps to 500 000, and FTTH at speeds up to 1 Gbps to 1 million
customers. These numbers represent, in aggregate, roughly two thirds of the households in Switzerland.
Swisscom is partnering with municipal utilities in various cities to deploy fibre networks, often in
competition with cable broadband providers. Deutsche Telekom in Germany has announced similar plans
for a hybrid of FTTH and vectored VDSL2.
In countries where FTTH is widely deployed, there is still the potential to increase performance
further. In Korea, which already claims the world’s fastest average broadband connection speeds and has
one of the highest fibre penetration rates, the government is looking to upgrade the speeds available. Its
plans call for more than 90% of the country to receive speeds of 1 Gbps by 2017, with over 15% enjoying
those speeds by the end of 2013. The costs of upgrading electronics to support these higher speeds are
substantially lower than the initial deployment costs for FTTH. Supporting true gigabit speeds, however,
may require caching or serving content locally on the fibre network, which can involve additional costs and
negotiations between providers.
There are three main differentiators among fibre network deployments: who deploys the networks;
whether public funding is involved; and whether an open access model is used.

DSTI/ICCP/CISP(2013)8/FINAL
23
Incumbents vs. entrants
Among countries with significant deployment of fibre networks, some are primarily provided by
incumbent communications operators, while in other markets new entrants are more active. In Japan and in
the United States, the incumbents NTT and Verizon provide the dominant shares of FTTH infrastructure.
Likewise in China, a country adding the greatest single number of FTTH deployments each year,
incumbent fixed network providers are also undertaking them.
As noted in the prior section, however, Japan mandates fibre unbundling, so other retail broadband
providers may offer service on the NTT network. China also does this for deployments in new housing
developments. In Korea, the incumbent Korea Telecom competes against SK Broadband, LG Uplus and
cable operators for FTTH customers, with each provider building its own infrastructure. In most European
countries, fibre deployments by incumbents have been very limited until recently. The primary providers
of FTTH have been new entrants, although in some cases these actors were later acquired by incumbents.
One category of entrants is those already providing broadband or other communications services.
These include incumbent cable television providers upgrading subscribers from lower-speed cable
broadband options to fibre, and entrants providing first-generation broadband through unbundled access to
carrier DSL networks. A variant model is for incumbents and these entrants to co-invest in fibre
deployment. In France, since 2009, the incumbent Orange has co-investment agreements for fibre with
Iliad, SFR, and Bouygues Telecom under a framework established by the regulator ARCEP. In Spain,
Telefónica has signed a co-investment agreement with Jazztel and Orange has done so with Vodefone. A
third co-investment arrangement among Telefónica, Orange, and Vodafone is currently under review to
resolve disagreements over pricing.
In many countries, fibre networks are also being deployed by non-communications companies. These
include construction companies, electric utilities, and online service providers. Unlike communications
providers, these entrants do not have concerns about legacy infrastructure or “cannibalisation” when they
deploy fibre networks. Especially for the deployment of physical infrastructure, companies without a
background in communications may have all the necessary resources and access to the same equipment
vendors as communication operators. They therefore have the potential to shake up markets when
incumbents are reluctant to deploy.
In the Netherlands, the most aggressive driver of fibre deployment is Reggefiber. Reggefiber was
formed by Reggeborgh, the investment vehicle of the Wessels family, which also owns the large
construction company Volker Wessels. The incumbent, KPN, partnered with Reggefiber and subsequently
acquired majority ownership over the company, although it still operates as an independent entity. The
initial deployment focused on Amsterdam but more recently Reggefiber has been concentrating on smaller
cities and towns. The company has also expanded to similar towns in Germany, mostly close to the Dutch
border.
In Italy, Metroweb, controlled by state-backed financing agency Cassa Depositi e Prestiti (CDP) and
infrastructure fund F2i, with a share owned by Milan’s Fastweb, has announced plans to bring wholesale
dark fibre to 30 Italian cities. The incumbent Telecom Italia decided in May 2013 to spin off its fixed line
copper and fibre network as a wholesale provider, and is in discussions for CDP to take a stake in the new
company.
Another category of fibre entrants is utility companies. In the OECD area, these are a mixture of
national and local providers, some of which are private and some of which are state or municipally-owned.
These companies have many of the same attributes as communication carriers. They have the financial,
technical, and operational wherewithal to deploy and operate large-scale networks providing services

DSTI/ICCP/CISP(2013)8/FINAL
24
directly to residential users. And they control access to rights of way that are among the biggest barriers to
fibre deployment. Although there are some differences, laying fibre is not radically distinct from running
electrical wires to the same homes. In many areas, utilities have actually deployed communications
networks for internal management purposes, and for smart grid functionality to monitor their energy
networks. However, because their primary market is not communications, these companies typically do not
have an existing broadband, voice, or video business.
In the United States, most electric utilities have been reluctant to enter a new and potentially riskier
business. The exception is a small number of municipally owned utilities in small to mediums-sized cities.
In Japan, on the other hand, 16% of fibre deployments, as of 2009, were by utility companies.40
The
percentage is even higher in western regions such as Kyoto and Osaka.
A different kind of non-traditional provider is Google, whose main business is operating the dominant
Internet search engine and associated online services. Google launched a competition to partner with a
municipality to deploy a fibre to the home network in a city in the United States. It received proposals from
over 1 000 communities and chose Kansas City, Kansas as the winner in 2011. Google is currently
deploying in Kansas City, and has announced plans for further deployments in Austin, Texas and Provo,
Utah.
Although it is not an infrastructure provider, Google does have significant expertise operating
networks for internal purposes. It is believed to operate one of the world’s most high-capacity fibre
networks to connect its data centres. All this network capacity also gives Google access to effectively “free”
backhaul for on-network traffic. Google has indicated repeatedly that it does not see itself as a
communications network operator. It describes its rationale for the Kansas City deployment as allowing it
to experiment with fibre networks in real-world conditions, and also pressuring existing network operators
to upgrade. Nonetheless, Google has structured its operations to generate revenues that at least cover its
costs.
Public funding
Public entities can support fibre networks in several ways. They can fund deployment directly from
general revenue, or they can provide various direct and indirect subsidies to encourage private deployment.
Public entities may also contribute capital as investors in fibre operators. Another dimension is the type of
public entity involved. Some public investment is coming at the national level, while in other areas it is at
the regional or municipal level. Public institutions can also provide low-cost loans to provide operators for
fibre deployment, a strategy that has been used in Canada, Portugal and the United States. In the OECD
area the most extensive public investment plans for fibre are in Australia, New Zealand, and Israel, which
have announced plans for government-funded networks providing high-speed connectivity to the home
throughout their countries.
In 2007, the incoming Australian government announced plans for a national wholesale-only, open-
access National Broadband Network (NBN). The network was estimated to cost AUD 37.4 billion (USD
35.3 billion) in capital expenditure to construct over a 10-year period, including an Australian Government
investment of AUD 30.4 billion (USD 28.7 billion) with a peak funding cost of AUD 44 billion (USD 41.5
billion). NBN Co, a government-owned corporation, was established to design, build and operate the NBN,
and construction began with a trial rollout in Tasmania in July 2010.
The FTTH rollout was planned to reach approximately 93% of Australian homes by 2021. As of
September 2012, construction of the network had commenced and 24 000 customer services were active.
As part of an agreement with NBN Co, the telecommunication incumbent Telstra will move its customers

DSTI/ICCP/CISP(2013)8/FINAL
25
to the NBN, and lease access to its exchange space and extensive network ducting to assist in the rollout. A
similar agreement with Optus is in place.
At this time, the future of the NBN is uncertain in terms of several commercial and technological
choices that will be taken in the coming months. Following an election, in September 2013, the incoming
government is reviewing the status of the project before deciding which aspects will be continued and
those that will be revised. One key decision is whether to continue with the previous plan for FTTH to 93%
of households or to substitute an FTTN deployment or other option for some of these households. Some of
the factors that will be taken into account are the costs of FTTH, as opposed to FTTN, as well as the
timelines for both options (e.g. speed of deployment; duration of expected utility and so forth).41
If a
decision is made for FTTN, then policy makers have indicated that business and consumers would have an
option to self-fund the final fibre connection from the node to their premises.
In Israel, the state-owned Israel Electric Corporation (IEC) will deploy a 1 Gbps fibre network in
partnership with a group led by Sweden’s Viaeuropa, with plans to cover two thirds of the country by 2020.
IEC already has close to 3 000 km of fibre deployed, and it will form a new company for the FTTH
network with the partners owning 60%.42
In 2009, the New Zealand government established Crown Fibre Holdings (CFH) to manage public
investment of NZD 1.35 billion (USD 1.24 billion) in “Ultra-Fast Broadband” (UFB) infrastructure, with a
goal of serving 75% of New Zealanders within ten years at speeds of at least 100 Mbps downstream and 50
Mbps upstream. The plan is to involve the private sector to contribute additional investment as well as
directing any public funding to open-access infrastructure. Crown Fibre Holdings manages the contracts
with fibre companies building UFB facilities. The largest such player is Chorus, a wholesale infrastructure
provider company listed on the New Zealand stock exchange, after it was split off from Telecom New
Zealand’s retail operations. Retail service providers, such as Vodafone New Zealand, provide different
bundles of services (e.g. Internet, telephone, video) over FTTH networks in cities such as Auckland,
Wellington and Christchurch.43
Approximately 20% of the UFB buildout has been completed so far.
An alternative means of public funding for fibre is at the municipal level. While not providing
nationwide coverage, and in particular, not seeking to address “digital divide” considerations for rural
citizens, such initiatives have been successful in several countries for stimulating fibre deployment in cities.
In Sweden, over half of the households had access to broadband connections of at least 100 Mbps by 2012,
exceeding the government’s articulated goal three years early, thanks in substantial part to municipal
networks. There are approximately 170 companies or organisations in Sweden involved in the provision of
municipal broadband in different cities, of which approximately 30 are large urban networks comprising
the bulk of the investment.
Most notably, the city of Stockholm created a non-profit entity, Stokab, to build and operate a city-
wide fibre to the home network. Since 1994, Stokab has invested over USD 814 million and deployed a
network of 1.25 million kilometres of fibre that now serves 90% of households and almost 100% of
enterprises in Stockholm. Service providers lease fibre from Stokab, which is limited to providing point-to-
point dark fibre circuits on an open-access wholesale basis. The service providers are able to architect
networks and services on top of Stokab’s fibre to offer differentiated services to customers. This approach
of municipally-owned utilities is also being employed in Norway and Denmark.
There are also hybrid models involving public-private partnerships. In such arrangements, a coalition
of local institutions comes together to bring the benefits of high speed broadband to their residents. These
partnerships may deploy fibre networks themselves, as in the case of OneCommunity, a non-profit that
provides high-speed connectivity to over 2 000 hospitals, schools, libraries and government offices in
Ohio, or they may facilitate deployment by traditional network operators. Gig U, a coalition of 30 research

DSTI/ICCP/CISP(2013)8/FINAL
26
universities in the United States, works to leverage the high-capacity networks these institutions already
operate across their campuses as a foundation for ultra-fast broadband deployments in the surrounding
communities. In the Catalonia region of Spain, the Xarxa Oberta project seeks to connect over 5 000 public
bodies in 946 municipalities, and also offer wholesale open access fibre (Ganuza et al, 2010).44
Open access
In nearly all countries in the OECD area, incumbent telecommunication providers that operate
copper-based broadband networks are required to offer unbundled wholesale access to competitors at
regulated rates (OECD, 2013c). Such open access mandates ensure that even if competition among
physical network infrastructure is infeasible, there is the opportunity for competition at the retail level to
drive consumer benefits and innovation.
Some countries, including Japan and the Netherlands, require unbundling of FTTH networks, and
similar rules are under consideration elsewhere. The European Commission in 2010 recommended
regulated wholesale access to the last mile fibre facilities of operators with significant market power
(European Commission, 2008). Even some countries that do not mandate unbundled access to wholesale
fibre connections require sharing of civil engineering assets, such as ducts and conduits, which make it
easier for competitors to deploy. In countries where unbundling is considered unnecessary due to the level
of competition (such as in Korea and Hong Kong, China) regulators have established guidance or good
practices to ensure competitive facilities providers have ready access to inside wiring (e.g. so they can
connect their networks to facilities in the basements of apartment buildings).
An alternative model is to encourage operators to build fibre and other high-speed broadband
networks as the sole service provider over these networks in competition with other facilities-based
providers. In effect, this limits competition for high-speed broadband to situations where more than one
network deploys in the same area. This is the approach taken by the United States, where the FCC pre-
emptively declined to unbundle fibre networks. There are some areas of the United States served by new
entrants using unbundled facilities, over copper networks, though they tend to be relatively small and
operate in a limited geographical area. One example is Sonic.net which has expanded from using
unbundled DSL lines to offer its own fibre network in Sonoma County, California, in competition with
incumbent telecommunication and cable operators.45
In Korea, unbundling is not required for fibre
deployed after 2004 and unbundling is little used in Canada. In all three countries policy makers have
chosen to largely rely on infrastructure competition rather than a combination of facilities based
competition and unbundled facilities.
Some new entrants have voluntarily chosen an open access wholesale model for FTTN networks,
based on business considerations. Marketing and supporting retail Internet access services is in many ways
a fundamentally different business than digging trenches and deploying networks. A further model has
been for policy makers to insist that the first deployment of fibre be done in a way that enables some
measure of competitive services to be provided over those facilities. One example is in Switzerland where
an operator is required to ensure that each newly connected cable is a bundle of four fibres – one reserved
for the builder and the other three available for competitive service providers.46
In France, policy makers
have introduced safeguards based on “…the principle of having operators shar[ing] the last segment of the
networks, thus reducing the amount of work that needs to be done on the private property while also
limiting the dangers of a local monopoly forming in the buildings.” 47
In Kansas City, Google initially planned an open access network but later adopted an exclusive model.
According to the company, in order to deliver actual performance substantially superior to non-fibre
networks at scale, Google must aggressively utilise its own massive backhaul network and collocate

DSTI/ICCP/CISP(2013)8/FINAL
27
content deliver servers in Kansas City. A competing provider that gained wholesale access to the last-mile
fibre connections, they say, could not affordably acquire similar capacity.
In addition to the competition policy considerations, the open access model creates a different set of
business requirements than the exclusive model. Operators must have the processes and skills to manage a
wholesale business effectively, and there must be enough retail providers for a working marketplace. If
retail providers are not able to deliver differentiated and value-added service offerings, there may not be
sufficient demand to drive adoption. This was apparently one reason that the utility company Dong Energy
was unsuccessful in launching a wholesale fibre network in Denmark. It eventually sold its operations in
2009 to the incumbent operator TDC.48
Local factors and timing may create different outcomes for the same approaches. In the United States,
the city of Provo, Utah built a municipal fibre network beginning in 2001, but it was not financially
successful. In 2013, the city agreed to transfer the network to Google at no cost, as the foundation for
Google’s commercial FTTH deployment in the city. On the other hand, Stokab in Stockholm, Sweden has
created a successful wholesale fibre business with over 100 partners. It is worth noting that business
models can change depending on circumstances. Telecom Italia’s decision to separate infrastructure and
services for its fixed broadband networks represents one example of a company fundamentally changing its
business model.
Barriers to Investment
Policymakers generally agree that further deployment of high-speed broadband networks, especially
fibre to the home, would bring significant economic and social benefits. A key issue is therefore whether
there are optimal incentives for private companies to make the necessary investments. Several barriers
might hamper investment in high-speed broadband.
Capital expenditures
As noted above, the challenge with deployment of fibre networks is the high fixed cost of the upgrade.
In the United States, Verizon’s costs for FiOS were estimated at USD 750 per home passed in a
neighbourhood, plus an additional USD 600 for each home that actually subscribed.49
Verizon’s “take rate”
for FiOS is approximately 30%, meaning the effective up-front expenditure for each subscriber was nearly
USD 3 000. Even without competitive constraints on pricing, the economics of such an offer are difficult to
sustain. And indeed, Verizon announced in 2010 that it would wind down FiOS expansion well before
reaching its entire service territory.50
With newer technologies and higher densities, however, per-home
costs of fibre can come down substantially. Other fibre deployments have seen better take rates; for
example, Reggefiber in the Netherlands reports a 60% take rate for completed projects, partly by requiring
pre-commitments from enough homes before expanding into a neighbourhood.51
The cost characteristics of fixed networks have important business implications. The business case for
a fixed network is heavily dependent on factors such as population density and residential patterns
(freestanding homes compared to apartment buildings). It also depends heavily on the take rate – the
percentage of homes passed by the network that actually subscribe to services. A fixed network must
generally be built out past every home in a neighbourhood, whether that home generates revenue or not. Its
costs therefore are relatively insensitive to the number of subscribers, but its revenues are not.
One way to address the sensitivity to the take rate of fibre networks is to target deployments more
narrowly and use social awareness to encourage adoption. This is the strategy Reggefiber pioneered in the
Netherlands where it distributed pins for customers, that had signed up for the prospective service, to place
in their gardens to encourage their neighbours to also do so. In the United States, Google developed a

DSTI/ICCP/CISP(2013)8/FINAL
28
similarly novel marketing and rollout strategy for its fibre network in Kansas City by dividing the city up
into “fibrehoods” and asking residents to commit ahead of time to subscribe. Only when enough residents
in a fibrehood make the initial payment does Google deploy in that area. Both companies use a similar
approach to reduce take rate risk.
For fixed networks, the physical environment and population patterns have a large effect on costs.
Construction of networks is inherently more expensive in some areas. Even more important is population
density. If the same fibre loop passes more homes, it will be effectively less expensive to serve each one.
And if hundreds of “homes” can be served by bringing one fibre connection into an apartment building, the
costs drop still more. This is one reason why Japan and Korea, which have a high portion of their
population in a few urban areas dominated by apartment buildings, have such high fibre penetration
relative to the rest of the OECD.
Cost is always only one half of the equation. The other half is revenue. For existing operators, fibre
deployments must be considered in comparison to their current first-generation broadband offerings.
Subscribers are not always willing to pay more for additional speed. Moreover, ability to price high-speed
broadband at a premium may be limited by competition or regulation. The equations are somewhat
different for new entrants, especially those focusing purely on the wholesale portion of the market.
Finally, competition affects the business calculus for investment. A telecommunications operator
considering investing in FTTN or FTTH has to evaluate whether enough of DSL subscribers would
upgrade, and be willing to pay a high enough price to recoup the network investment. If a cable-based
broadband provider is in the same territory, however, the operator may be in jeopardy of losing those DSL
subscribers anyway. In such a scenario, fibre may be more appealing as a competitive differentiator.
Transit costs
To realise the potential of high-speed broadband networks requires more than a fast connection in the
last mile. Most commercial services that users access over the Internet are not local. Backhaul and transit
costs can be significant, especially in areas where there is limited competition or price regulation for such
“middle mile” services. In the United States, many of the projects funded through the USD 4 billion
Broadband Technology Opportunity Program launched by the federal government in 2009 were for
middle-mile systems.
While transit costs are an issue for any communications network, they can be particularly problematic
for ultra-fast broadband. Such networks carry huge volumes of traffic, and require high-performance
connections to take advantage of the abundant bandwidth in the last mile. According to a recent report, for
example, users of the Australian NBN download 47 gigabytes per month, which is 50% more than the
national average for fixed broadband in that country.52
Especially for media and cloud services, CDNs and
collocation of data centres locally may be necessary in order to maintain quality of service and reduce costs.
Municipal obstacles
One of the most significant barriers to fibre deployment is the physical access required. Deploying
fibre to the home typically requires operators to dig up city streets and dig trenches outside homes. The
inconvenience involved for residents makes municipalities reluctant to approve such operations, especially
multiple times for different providers. If fibre is run overhead or through existing utility conduits
underground, access to those facilities becomes a bottleneck. Poles and conduits are often owned by
municipalities or electric utilities, which may charge high rates in order to extract as much revenue as
possible. Simply navigating the complexities of deployment across all these different channels can make

DSTI/ICCP/CISP(2013)8/FINAL
29
fibre rollouts complex and add to costs. In France, the regulator has estimated that civil engineering
accounts for between 50% to 80% of the cost of laying local fibre loops.53
In addition to the physical difficulties, local governments themselves may impose obstacles to fibre
deployment. These can include franchising requirements and zoning laws, which may involve lengthy
delays for approvals. Established operators may lobby local or regional governments not to provide
favourable terms to new entrants who will compete with them and the situation can also arise that the local
authority owns a municipal network.
A countervailing force is the desire of municipalities for the economic development benefits they
anticipate ultra-fast broadband will bring. The overwhelming response by cities to Google’s RFP for its
FTTH project, in the United States, suggests that many local governments appreciate these benefits, if
provided with an opportunity to act. A key element in Google’s selection of host cities involves their
commitment to removing legal and operational barriers that would slow or increase the costs of
deployment.
DSTI/ICCP/CISP(2013)8/FINAL
30
RELATIONSHIP TO APPLICATIONS, SERVICES, AND CONTENT
Broadband and Specialised Services
As noted above, all communications services are converging to digital broadband delivery. However,
this does not mean that all traffic will be routed over the same undifferentiated Internet connections.
Network operators may segment traffic on their broadband networks for performance, security,
management, and strategic business reasons. Such offerings are generally referred to as managed or
specialised services.
A telemedicine service connecting a rural clinic to a large urban hospital, for example, may require
extremely high capacity, guaranteed quality of service, and secure protection of sensitive data. That service
could be delivered over a virtual “managed pipe” through a variety of technologies that allow
differentiation of traffic flows. Other examples include VOIP telephony and IPTV offerings delivered by
network operators alongside their broadband access services. To subscribers, these are distinct product
offers, often with separate billing. The traffic is routed separately once it reaches the first connection point
in the operators’ network, usually on dedicated circuits.
The treatment of specialised services has become an important question in the debate over “network
neutrality” rules. Many network neutrality regimes, such as that in the United States and the proposed
legislation in the European Union, expressly exempt specialised services from non-discrimination
provisions. Some services running over broadband networks may need segmentation and differential
treatment for service quality or security reasons. However, there are concerns that the exception allows
operators to undermine network neutrality by treating certain services better than others. This issue is the
subject of significant debate, beyond the scope of this report.
The alternative way to deliver services over broadband networks is over the top (OTT). An OTT
service uses no specialised capabilities of the network that are not available to other service providers.
Typically, OTT services are provided by companies other than the operator. However, operators
themselves can offer OTT services either directly or through subsidiaries, such as the video site Daily
Motion owned by Orange. Operators may also offer specialised services such as CDNs or secure
connections on a wholesale basis to third parties, who use them to create OTT offerings.
OTT offerings
High-speed broadband networks provide access to the Internet, and therefore to an extraordinary
wealth of content, applications, services, and communications links. In a sense, all of the Internet is an
OTT offering. However, the great potential of high-speed networks is to allow for new functionality and
innovation above and beyond those enabled by the existing mainstream broadband ecosystems. Some of
the major categories of new and enhanced OTT services are described below. Many others are likely to
develop primarily on mobile devices, where fixed networks will serve as backhaul.54
Real-time communications
High-speed broadband connections will turn wireline voice telephony, which was historically the
principle function of telecommunication networks, into one of many applications on a data-centric
platform. Already on first-generation broadband platforms, voice over IP is available as both a specialised
service and OTT. Many of these OTT applications such as Skype, Apple’s Facetime, and WhatsApp
include video capability in addition to voice, as well as additional functionality such as messaging, screen
sharing, file transfers, and high-resolution voice encoding.

DSTI/ICCP/CISP(2013)8/FINAL
31
As part of the PSTN transition, next-generation broadband will generally replace legacy voice
services with offerings integrated into the broadband network. With additional capacity, OTT
communications services involving additional features, high-quality video, and integration with computers
and television sets in the home may become significant. Multipoint high-resolution videoconferencing can
be used to provide a range of services including telehealth, remote training, aging in place, and distance
learning.
Entertainment video services
As described earlier, streaming media (particularly video content) is growing extremely rapidly with
the rollout of broadband networks. This includes both distribution of commercial content such as movies,
television shows, and live sports as well as sharing of short video clips and user-generated content on
services such as YouTube. High-speed networks allow such video content to be delivered at higher quality.
With the digital television transition completed in most of the OECD, high-definition (HD) video has
become the norm for commercial broadcasting. Even smartphones are now capable of recording in HD.
And even higher-resolution technologies such as 4K HD and 3D are in early stages of deployment. Netflix
CEO Reed Hastings estimates 4K streams require approximately 15 Mbps of dedicated bandwidth, so
overall connection speeds of 50 Mbps will be needed for good performance.55
A variety of video services provide additional functionality on top of content delivery. These include
DVR functionality for pausing and reviewing live television and events, as well as catch-up TV
functionality for previously broadcast shows. These video services are increasingly being delivered to
television sets, either through set-top boxes or consoles or via connected televisions, the subject of a
previous OECD report (OECD, 2014b). The smart television market in Korea already reaches 2.5 million
people and is expected to grow to 40% of the population in 2018.
Telework/telepresence
Telework, allowing employees and independent professionals to work remotely rather than in
centralised offices, has many potential benefits. It cuts costs and time of commuting. It also gives workers
greater flexibility, which is particularly important for those responsible for caring for others or otherwise
needing to spend time at home. It reduces expenses of providing physical office space, as well as travel
expenses. And it allows for virtual collaboration among distributed teams. One goal originally set as part of
Australia’s NBN project is that at least 12% of Australian employees have a teleworking arrangement by
2020.
In Korea, which has among the world’s highest adoption rate for fibre to the home, these effects are
already being felt. A recent study by VMware found that at least eight out of every 10 employed Koreans
could be dubbed “smart workers,” indicating that they have somehow adopted a flexible working style --
mobile offices, virtual meetings and working in remote areas -- into their workplaces.
Telepresence systems provide very high-quality video and audio connections, creating the sensation
that the remote participants are in the same room. Although currently available primarily for enterprises,
telepresence promises to further expand the scope of telework as it becomes available in the home. The
potential benefits are significant. For example, the networking equipment vendor Cisco cut its internal
travel expenses by USD 400 million annually by replacing travel with telepresence between offices.
Deploying telepresence requires end-to-end quality of service, which today is achieved through specialised
interconnection arrangements between network operators.

DSTI/ICCP/CISP(2013)8/FINAL
32
Cloud computing and storage
Cloud computing services move the functionality of desktop applications into the cloud. In addition to
greater functionality, such services allow users to access their data and applications anywhere, from any
Internet-connected device. Cloud services have rapidly become popular in areas ranging from productivity
applications (Google Docs) to enterprise software (Salesforce.com), and have become the foundation for
new companies (e.g. Dropbox and others built on Amazon’s cloud platform).
Cloud services can benefit from the high speeds of fibre networks. Higher broadband speeds allow
data stored remotely to be accessed as quickly as on a local hard drive, and synchronised transparently
across multiple devices. To encourage cloud usage, for example, Google provides one terabyte of free
remote storage on its Google Drive service for subscribers to its fibre service in Kansas City.
While the issues around trans-border data flows have long raised issues now associated with cloud
computing they have recently received significant attention in the press and at the Internet Governance
Forum related to surveillance practices.56
Some of this commentary in the press has neglected the good
practices, sometimes assisted by government policy, that have developed in certain areas to increase the
efficiency of local Internet traffic exchange (e.g. the establishment of IXPs).57
While the issues go beyond
the scope of this report, it is clear that some approaches may affect the physical location of cloud
computing or other aspects of traffic exchange and therefore have implications for network developments
that were designed to improve the responsiveness and resilience of the Internet (e.g. location of DNS
servers).58
Financial services
Much of the innovation in online financial services in the coming years is likely to involve mobile
access. The combination of powerful smartphones, short-range communications technologies such as NFC
and extended Bluetooth as well as biometric authentication, microtransaction platforms, and affordable
reader and sensor devices promises a massive migration of transactions from traditional mechanisms such
as cash and credit cards to mobile payments. Such innovations generally involve relatively low per-device
data volumes (compared to, say, streaming media), and thus do not require enhanced capacity in fixed
networks. However, payments are just one side of the financial services equation. The other side is the
centralised systems that manage large volumes of data and transactions.
Financial services firms such as banks and investment brokers already provide online access over the
web. With the growth of mobile payments, however, the need will grow for more sophisticated cloud
infrastructure to process banking transactions, payment transactions, and securities trading. This
infrastructure will have to guarantee security and quality of service to handle a financial universe involving
far more real-time transactions to far more devices. Such capabilities dovetail with those necessary to
support cloud computing and application acceleration.
Internet of Things
Virtually all electronic devices, home appliances, sensors, cars, machines, and industrial equipment
could be integrated with Internet connectivity, a development known as the Internet of Things. Ericsson
estimates that by 2020 there will be 50 billion such connected devices.59
As detailed in a recent OECD
report, machine-to-machine (M2M) functionality allows these devices to communicate with each other
directly, without human intervention (OECD, 2012b).
Only some elements of the “Internet of Things” will take advantage of ultra-fast fixed networks. A
high percentage of M2M connections will be wireless, using short-range links to reach a wired network.
Some devices are mobile or move around a defined environment, and for others, connecting wirelessly

DSTI/ICCP/CISP(2013)8/FINAL
33
avoids the need to establish a direct wired connection to every device. Even for such devices, having
significant fixed network capacity will provide benefits. In aggregate, the Internet of Things will generate
significant network traffic, even if many devices individually require far less bandwidth than a human-
connected device such as a smartphone. Some devices such as remote cameras will, however, require
substantial capacity, and others may generate large volumes of telemetry data, which needs to be managed
using big data techniques in the cloud.
Smart homes
Fibre networks have the potential to generate massive cost savings and other benefits by connecting to
energy-consuming equipment inside homes, and the electric distribution network outside of it. So-called
smart grids can measure usage in real time and create mechanisms to shift demand away from peak load
periods. Such real-time feedback networks involve massive data requirements, which the high capacity of
fibre can support. James Salter, a former utility executive, estimated at a conference in early 2013 that the
benefits to utilities of equalising supply and demand through smart grids were approximately USD 1 800
per home, roughly the same costs per home served for FTTH in the United States and similar markets.60
Business Models for Deployment
Cost causation and infrastructure benefits
Deploying and operating Internet infrastructure is relatively expensive. And increasing the capacity of
those networks to handle more traffic or higher quality of service generally requires additional investment.
Discussions about network upgrades often turn to the question of who should pay for those costs, and how.
Money flows into the Internet infrastructure in several ways. End-users pay their Internet access
provider a monthly fee for their broadband connection, and potentially for other services they use. They
may also pay a network-based service provider, such as a cloud service or an online content provider, a
subscription fee or other charge. Alternatively, those providers may monetise their services through
advertising, trading on the value of the end-user “eyeballs” without charging those users directly. If the
interconnection arrangement involves paid peering, content distribution, transit or another value-added
service, network operators may also pay each other for delivery of traffic. Finally, network operators may
receive public support either in the form of subsidies or direct public funding of networks.
Telecommunication operators face significant potential financial challenges particularly in relation to
traditional services. Overall telecommunication investment levels have largely recovered from the 2008
financial crisis, but are still at the pre-crash level in some countries or in others at the peaks reached during
the burst of network deployment around 2000.61
The progression of the PSTN transition means that
analogue fixed lines are declining, falling from 21% of the total fixed, mobile, and broadband access paths
in the OECD in 2009 to 19% in 2011.62
Subscribers are abandoning their traditional fixed connections to
rely entirely on mobile devices, or using some form of VOIP. While the substitution of a household fixed
line is often undertaken by multiple mobile subscriptions, here too traditional pricing models are under
greater competitive discipline. Social media and Internet-based messaging services, for example, are
cutting into carrier revenue from high-margin SMS services. In this environment, operators are evaluating
a variety of potential new revenue sources.
Content-based interconnection charges
Traditionally, Internet access providers have received virtually all of their revenues from their own
subscribers. Their connections to other networks have typically been on a settlement-free peering basis, or
involved payments to transit providers for routing traffic between their customers and other subscribers.
Even when network interconnection involves positive charges, those charges have generally been generic

DSTI/ICCP/CISP(2013)8/FINAL
34
as to the type of traffic. In some cases, access networks charge CDNs to host caches inside their networks,
even though those caches reduce the volume of traffic flowing into the access networks. CDNs are able
and willing to pay these fees because they receive payment from their own content-provider subscribers.
In 2012, the European Telecommunications Network Operators’ Association (ETNO) proposed that
operators be permitted to impose content-based interconnection charges for access to their broadband
subscribers.63
Specifically, ETNO recommended that the International Telecommunication Regulations
(ITRs) include Internet infrastructure and countries establish rules governing IP interconnection. ETNO
argued that as value shifts towards OTT providers, revenue flows should be realigned. Under ETNO’s
concept of “quality based delivery,” operators could establish interconnection terms for specific services
and types of traffic.64
Although ETNO’s proposal was not adopted at the 2012 World Conference on
International Telecommunications (WCIT-12), it has remained a subject of discussion.
ETNO urged that content providers pay network operators to recover the costs they impose on
network infrastructure, and specifically advocated for a “sending party pays” rule for Internet traffic. The
group argued that the evolution of the Internet “has created strong imbalances in the value of peering
relationships.” About 10-15 OTT providers, it said, originate more than 70% of incoming traffic, and many
of those providers receive significant advertising revenue, which do not go to network operators.
Before evaluating the substantive issues, it should be noted that some objections concerned the venue
for ETNO’s proposals: negotiations over an international treaty. Some opponents argued that ITRs should
not be used to determine business relationships between operators and other service providers in a
competitive international telecommunication market. Such an approach might be used to constrain
competition, particularly where governments have the intent of limiting international trans-border
competitive entry. Claims about the economic arrangements between operators and other entities are best
addressed within the scope of existing efforts at the national and regional level to promote competition,
investment, and innovation in the telecoms market.
In considering the substance of the ETNO proposal, it is important to differentiate between allowing
commercial negotiations that result in content-based interconnection charges and allowing practices that
effectively mandate such arrangements. Today, some OTT providers may voluntarily pay operators for
enhanced quality of service delivery, though these arrangements are generally regarded as confidential.65
Others may refuse such offerings and, while these discussions are also confidential, this would seem to be
occurring according to ETNO. It would not appear that any additional authorisation is needed for content-
based rates to be discussed.
Many operators also offer CDN functionality, which results in a similar payment structure. Effectively,
these arrangements would constitute specialised services, which are distinguished in many network
neutrality regimes. The argument for permitting such payment is that, in a market with sufficient
competition, parties should be permitted to enter into mutually beneficial transactions, even if they produce
differential treatment among providers. Opposing arguments are that discriminatory treatment of traffic
inherently weakens the Internet as a platform for innovation, choice, and free expression especially where
there is insufficient competition or high transaction costs associated with shifting providers. A February
2014 agreement in the United States between Netflix and Comcast, under which Netflix was widely
reportedly to agree to pay Comcast for direct interconnection, brought all these issues to the fore, though
the precise arrangements remain a matter for the two parties involved.66
Some operators make the case that guaranteed quality of service is important for the adoption of next-
generation broadband services as opposed to best effort approaches.67
This turns out to be a complex
question. It is certainly true that better performance of web-based services facilitates user adoption in
OECD countries. Leading online services aggressively invest to reduce latency and improve reliability, and

DSTI/ICCP/CISP(2013)8/FINAL
35
studies confirm that even small improvements can make a difference in usage. On the other hand, there are
numerous ways to manage performance of services such as online video. Variable bitrate encoding, for
example, allows performance to degrade gracefully with bandwidth. CDNs can be deployed in numerous
configurations, with caches managed by the content provider, a transit network, a specialised CDN
provider, or the access provider. And even when enhanced quality of service is available on one access
network, it does not guarantee end-to-end performance across interconnection links with other networks.
Such long-promised interdomain QOS has never been widely deployed, for both to technical and business
reasons.
There are many other services that operators may offer to content providers, beyond enhanced quality
of service for traffic delivery. These could include billing, cloud data centre hosting, identity management
and authentication, transaction processing, information security, numbering translation, and customer
service. All of these are functions for which large-scale operators may have expertise or comparative
advantages relative to standalone providers. For many of them, there are important issues to be addressed
regarding the handling of customer data, especially in cross-border contexts. Early efforts by operators to
introduce behavioural tracking for advertising using deep packet inspection technologies produced
significant outcry. If such concerns can be addressed, operators might attempt to move away from pure
content delivery to a two-sided market arrangement in which they generate revenue from both end-users
and OTT providers.
Potential bargaining asymmetries
The situation is quite different if OTT providers have no choice but to pay based on the contents of
their traffic. In that case, operators may be exploiting control over bottlenecks to extract an excessive share
of revenues. Charging OTT providers different rates based on their content raises the possibility that newer
and more innovative companies will be shut out because of their inability to pay, and creates the potential
to dampen usage and availability of high-speed services.
There are several ways that operators may gain leverage in demanding content-based fees. If
performance on transit links is sufficiently poor, OTT providers or their distribution networks may feel
compelled to agree to supplemental payments for routing their traffic on higher-quality connections. Such a
situation could result from operators deliberately blocking or throttling traffic from certain providers, in
violation of either the letter or the spirit of network neutrality principles. However, this may also occur if
circuits become saturated, or if there are insufficient physical interconnection ports between the two
networks. In the United States, Cogent Communications complained in June 2013 that Verizon was
deliberately failing to upgrade ports in order to degrade interconnection.68
Verizon responded by arguing
that Cogent should use Verizon’s paid peering offering for the volume of downstream traffic it was
sending across the links.
Another approach was taken by Iliad Free in France, which set a software default for its customers in
January 2013 that blocked viewing of Google advertisements, evidently to gain leverage in interconnection
negotiations with Google. The practice was stopped after objections from ARCEP.69
ARCEP also
investigated whether Free was deliberately degrading performance of YouTube for its customers but did
not find evidence to support discrimination.70
The regulator did find, however, that “…Free’s
interconnection and IP data traffic routing capacities are congested during peak hours, as use of the most
bandwidth-hungry applications continues to rise.” It added that this was a challenge for many operators.
Separately, ARCEP has ordered operators to provide semi-annual reports on their Internet traffic exchange
practices, in order to identify potential instances of traffic degradation or blocking.71
AT&T and Verizon
unsuccessfully challenged this requirement in court.
DSTI/ICCP/CISP(2013)8/FINAL
36
Pushing the other way, some large OTT providers are using their control of high-demand content to
pressure network operators to accept traffic from their CDN services. Netflix in particular announced that
only networks that peer or use its Open Connect CDN can access its highest-quality super-HD and 3D
content.72
In response, Time Warner Cable charged that Netflix was improperly withholding content to
receive preferential treatment from access providers. Netflix later abandoned its requirement.73
In a similar
arrangement, American sports network ESPN, owned by Disney, provides a service called ESPN3 that is
only available to customers of access providers who pay a special fee.
One reason broadband access providers may have difficulty imposing additional charges is that
content providers can shift traffic from peering to transit links, or at least threaten to do so. In areas such as
Europe, these transit connections could easily involve IXPs in nearby countries. If the content provider
pays a transit network to deliver traffic, it is commingled with any other traffic over the transit links to the
access provider. The access provider must also pay for the transit connection, instead of charging the
content provider or its distribution network for a direct paid peering connection, or exchanging the traffic
on a settlement-free basis. While this arrangement may cost the content provider more and reduce
performance, it puts pressure on the access provider to lower its paid peering rates, at least to the level the
content providers would pay for transit. Indeed, there is some empirical evidence that transit rates serve as
an upper bound on paid peering, consistent with this hypothesis (Clark et al 2011).
This equilibrium will change if paid peering becomes more attractive or transit becomes less attractive.
This may be the case if the performance benefits of a direct peered connection with an access provider are
sufficiently substantial and important, or if the transit connection is either too expensive or insufficient in
terms of quality. New technologies and service innovations may also change the dynamics. For example,
transparent caching, provided by companies such as Qwilt, Concurrent Computing, and PeerApp, provides
several major broadband access providers with technology that automatically identifies and caches popular
video content locally on their networks.74
In effect, it serves as a dynamic CDN, which cuts down the need
for transit. Access providers will evaluate the benefits of such internal caching against the services
provided by third-party CDNs. Their business relationships with content providers will likely play a role in
their decisions.
As previously mentioned, in February 2014, Netflix reportedly agreed to interconnect directly with
Comcast under a paid peering arrangement, replacing its transit connections to Comcast to improve end-
user performance. Netflix had previously sought settlement-free interconnection with Comcast, and had
insisted that Comcast host its Open Connect CDN servers. The deal received significant media coverage,
especially in light of Comcast’s pending acquisition of Time Warner Cable, its largest competitor. Some
commentators expressed concern that Comcast forced Netflix into a paid peering arrangement by
degrading the quality of transit links. However, the FCC has in the past stated that voluntary Internet
interconnection arrangements reflect a competitive Internet traffic exchange market, and are not covered
under network neutrality rules.
The Netflix-Comcast agreement raised a variety of issues related to broadband competition and the
significance of interconnection terms. However, it should be distinguished from the ETNO proposal in two
important ways. First, it was a voluntary agreement between two networks. Second, the charges to Netflix
are apparently based purely on the volume of traffic it delivers, not on the value or type of content involved.
The “tug of war” between OTT providers and operators seems very likely to continue. Ultimately,
regulators will need to determine the appropriate framework governing OTT-operator interconnection. The
key threshold question is whether such transactions should be subject to the regulatory approach that has
traditionally governed interconnection in the PSTN, the Internet backbone, or some other model. PSTN
interconnection has traditionally involved obligations to interconnect upon request on reasonable terms,
non-discrimination rules, and price regulation. Internet backbone interconnection has generally been left to

DSTI/ICCP/CISP(2013)8/FINAL
37
general principles of competition policy, with particular arrangements or acquisitions subject to review
only when raising market power concerns. A recent example is in the Slovak Republic where the courts
were asked to rule on a competition case after one ISP blocked the IPTV service of another using its public
IP address.75
Transparency could also play a significant role here. In October 2013, for example, Iliad Free in
France announced a major upgrade to its network and services, claiming that FTTH customers would
receive 1 Gbps service, while ADSL2 customers would be upgraded to VDSL2 with up to 100 Mbps
depending on their distance to an exchange, all without an increase in prices.76
In commenting on the
announcement, ARCEP said the information provided to consumers was incomplete, because end-user
service quality depends not only on access network capacity, but also on backhaul, interconnection, and
other factors. Based on its prior investigation involving YouTube, ARCEP suggested, subscribers were
unlikely to experience the stated performance.77
Reporting requirements and performance metrics can help
to pinpoint impediments to improved service quality, while also giving end-users the necessary
information to make informed choices in a competitive environment.
Relationship to network investment
One of ETNO’s primary claims is that new economic arrangements between OTT providers and
operators are necessary to provide sufficient incentives for further fibre deployment. It is important to
understand that, in this environment, terms such as “causing costs”, or “paying a fair share” are arbitrary.
When a subscriber goes online and downloads a movie or accesses a cloud-based application, the costs and
benefits involved are inherently shared among all the participating networks. The marginal cost of
delivering bits is effectively zero. Once networks have been built with sufficient capacity and quality of
service, they are typically designed to carry the peak load of traffic they will experience. There are large
costs involved in providing the level of connectivity that Internet users enjoy today. However, this does not
mean one set of parties is solely responsible, and another set is uniquely burdened with those costs.
Saying that the cost allocation decision is arbitrary does not imply it is unimportant or random. The
point is that there is no unambiguous result dictated by economic theory. Different configurations of
charges may make some participants better off and others worse off under some business models. There
could also be effects on downstream/upstream services, the competitive configuration of the market, and
levels of innovation. Regulators may appropriately choose to mandate some outcomes and preclude others
based on these factors but they need to be cautious where there is sufficient competition to address some of
these issues.
It is not possible here to assess in the abstract the relationship between infrastructure investment and
other benefits such as job creation and application/service innovation. The benefits of Internet
infrastructure flow from network operators having the incentives and the wherewithal to make the highly
capital intensive investments in broadband infrastructure. The evolution of fixed networks to high-speed
broadband and fibre will require further large-scale investments. Ideally, policy-makers would be aware of
the optimal level of investment, and whether market conditions are producing that investment. In reality,
those answers are impossible to determine.
Liberalisation of communication markets and widespread privatisation/corporatisation, throughout the
OECD area, means that network operators are no longer public utilities operated on the basis of guaranteed
rates of return or administered as part of a government department (i.e. subject to budgets of public
revenue and expenditure). Although still subject to sector-specific regulation, they are generally private
firms, including those partially owned by a government, deploying their capital in the manner they believe
is in the best interests of shareholders.
DSTI/ICCP/CISP(2013)8/FINAL
38
If an operator is not sufficiently constrained by competition or regulation, therefore, it might
rationally choose not to invest profits or use its access to capital markets for further infrastructure
deployment, even when that would be in the best interests of a particular country as a whole. Stated
another way, if network operators are not investing in certain upgrades, there is no guarantee that either
higher end-user charges or additional cost recovering from interconnection charges to other networks and
content providers would cause them to make those investments. Again, this is not a criticism; it is how
markets operate.
It is particularly difficult to evaluate whether a change in regulation or business arrangements would
foster innovation and investment in downstream content or services. For one thing, users and
application/content creators may be in different countries. Network investment may create greater take-up
locally, but availability and innovation in provision of network-based services may depend on activity in
other markets. Moreover, the same service may be offered over-the-top or by a network operator. Different
economic arrangements that change distribution of rents among various providers in the value chain affect
which of these models is more prevalent. There may be reasons to prefer one market configuration over
another in particular cases. However, there is no abstract basis to choose one ex ante.
End-user pricing practices
Broadband access providers can also exert influence through the structure of their retail prices. There
are several possible pricing models for broadband access. Roughly speaking, they can be grouped into the
following categories:
Unlimited: a monthly fee that does not change based on the amount of data sent or consumed.
Unlimited+: a fixed monthly fee that does not change based on the amount of data sent or
consumed but with additional services offered for additional charges (e.g. access to some types of
content).
Capped: a monthly fee for receiving up to a certain amount of data, typically with overage
charges above that level or reduced service levels once that limit is reached (e.g. throttling speed).
Tiered: buckets of capped data at higher monthly rates or by speed tiers without caps.
Usage-based: price is entirely based on the volume of traffic consumed or less often by time.
Each of these has effects on user behaviour. With limited plans, users have an incentive to govern
their consumption to avoid additional charges. Whether higher usage is seen as a benefit or a cost depends
on perspective. Few fixed broadband subscribers experience truly usage-based charges, in which their bill
goes up or down depending on usage, as is commonly the case for electricity or water utilities. This has
largely been an outcome of a competitive market reflecting a preference from many consumers for
certainty in their monthly expenditure and low/falling marginal costs. To meet this demand operators have
offered unlimited service or, particularly where there are other factors such as spectrum limitations, tiers or
caps that can provide attractive ways to bill for service while also influencing usage patterns. Like any
rational business, operators seek to use price discrimination to reveal customer preferences for different
service elements (e.g. speed, volume).
At a conceptual level, pricing mechanisms involving tiers, caps, and usage-based charges can produce
economically efficient results. Subscribers consume more when they feel the benefits exceed the costs they
impose on the network, and networks have resources to provide additional capacity that subscribers desire.
The reality is considerably more complex, with significant downsides to such mechanisms.

DSTI/ICCP/CISP(2013)8/FINAL
39
First, usage-based charges, tiers, and caps are not necessarily set at economically efficient levels.
Second, because so much of the cost of providing high speed broadband involves the initial deployment
expenses, there is not a linear relationship between data consumption and cost. This divergence is
exacerbated by CDNs and other performance enhancement mechanisms. Third, subscribers are not
necessarily aware of the efficient level of usage, especially when transparency of pricing and usage levels
is not ideal or they are paying for usage by others (e.g. parents/children). Fourth, low caps may encourage
users not to upgrade software such as anti-virus programmes that could have results that impose cost on
other users across the Internet.
Pricing mechanisms that do not excessively depress demand have the advantage of stimulating
adoption. Swisscom’s mobile service, for example, believes its charging model makes the OTTs its allies
in selling faster broadband. It charges via speed tiers with no data caps. If a user wants better video they
pay for the speed. While more speed can also mean more costs for the operator, per-unit transit costs have
consistently fallen as demand has increased, thanks to economies of scale, competition, and technological
evolution.
One of the key benefits of high-speed broadband is to stimulate innovation and the growth of new
services that would not otherwise emerge. This beneficial dynamic depends on users and service providers
being willing to explore new opportunities. Data caps and usage-based pricing may curtail such exploration.
It is important to recognise that, while there are some parallels, broadband is not the same as a linear
resource such as electricity. Usage-based pricing and other mechanisms such as off-peak discounts are
widely used by electric utilities to recover costs appropriately and to train users to reduce unnecessary
consumption. For broadband, however, consumption is also a benefit, and it does not necessarily cause
costs to increase. New applications that generate more usage may also generate more revenues, and lead to
implementation of CDNs and other mechanisms to reduce the traffic load on broadband access networks.
Competitive markets generate the best options for pricing communication services. For example, in
the United States the regulatory authorities prevented the merger of AT&T and T-Mobile. While showing
causation is always a challenge, the market in that country for wireless services now arguably shows as a
result a greater variety of options for consumers in terms of wireless plans (e.g. caps or unlimited,
subsidised or non-subsidised handsets and so forth) as operators explore consumer demand. T-Mobile
recently announced the elimination of international data roaming charges in 100 countries and a flat rate of
20 cents per minute for international voice roaming, a highly disruptive offer.78
“3 UK” has also abolished
roaming charges in countries where it operates while Iliad Free has done the same for its users from France
travelling to Portugal (a country where it does not have a network).79
In all these countries, each with at
least four wireless infrastructure providers, the benefits of sufficient facilities based competition is clearly
evident as there are choices for consumers in respect to pricing. For the future the challenge is to ensure as
much competition in fixed broadband networks.
Usage-based pricing and similar mechanisms can also have important effects on interconnection rates.
As researchers David Clark, Bill Lehr, and Steven Bauer explain in a recent paper, end-user pricing
policies may shift the balance of power toward broadband access providers (Clark et al, 2011). They can
do so by exempting traffic over their favoured peering connections from caps or usage charges. If Internet
video services over the ordinary transit link become too expensive or performance suffers too much, users
may shift to the content delivered over the peering links, and content providers will face growing pressure
to pay the charges sought by access providers. A recent arrangement in the United States between Comcast
and Microsoft for video content delivered through Xbox 360 gaming consoles, which exempt that traffic
from usage caps, raised concerns about this result.80
The FCC, however, declined to act. It saw the Xbox
video offering as a specialised service, and thus not subject to network neutrality rules.

DSTI/ICCP/CISP(2013)8/FINAL
40
Elsewhere, arrangements such as the one considered by the FCC are not uncommon. In Australia, for
example, data caps for fixed broadband are more widespread than in the United States. Many ISPs label
content as metered (“off-net”) or unmetered (“on-net”). Telstra, for example, has an extensive range of on-
net content including games, video, music and live sport.81
In addition, some off-net services are also
labelled as unmetered at the discretion of the ISP. Internode, for example, has sites for customers that
identify unmetered services such as television and radio streams.82
While the arrangements for traffic exchange are commercially confidential, it is unlikely that many
actors are paying transit in one direction or the other for unmetered off-net services. Australian regulators
leave this matter for the market and ISPs compete to make their “freezones” more attractive than rivals –
an important element of which is likely to be peering. Alternatively, they compete for content such as the
“Internet rights” to the most popular sporting events through which they make the content an on-net
product. This is an area that has recently drawn more attention from regulators if they believe a single
player can dominate adjacent markets through exclusive rights. The issue is analogous to exclusive rights
to programming for pay television, which were the subject of recent reports in the United Kingdom, by
Ofcom for sports and the Competition Commission for movies (Ofcom, 2010; Competition Commission
United Kingdom, 2012 ).
In all these cases – in Australia, the United Kingdom and the United States – as well as ARCEP’s
investigation of Iliad Free’s relationship with YouTube in France, regulators have essentially examined the
traffic exchange between networks to see if it inhibits competition dynamics, service performance and
availability. An important element of these investigations has been to decide if there is sufficient
competition in the market or whether action or forbearance would encourage competition.

DSTI/ICCP/CISP(2013)8/FINAL
41
CONCLUSIONS AND SUMMARY
Moving from first-generation to second-generation broadband will require continued investment in
network infrastructure, particularly in fibre connections. While this may take the form of either new fibre
to the home networks or deeper penetration of fibre toward the edges of HFC and vectored VDSL2, the
ultimate goal should be to replace copper with the vastly greater capacity of fibre optics. In addition to
abundant capacity, fibre networks allow for symmetrical connections, which enable new classes of
applications and services.
Recognising that fibre upgrades are costly, policymakers should examine incentives to promote
deployment. As detailed in this document, there are many potential routes to that result. Multiple models
may be useful within the same country, as fibre deployments are often municipal in scale.
The picture so far is mixed. The OECD countries with the highest rates of fibre penetration – Japan
and Korea – have done so using essentially the same approaches as for the original DSL-based broadband
rollout. Australia, New Zealand, and Israel are taking the opposite approach of creating national networks
with substantial public ownership. These countries will need to reintroduce regulation appropriate to
oversee the ‘infrastructure monopolies’ that are created by separating this segment from the competitive
services market. Elsewhere a combination of private proprietary network investment and municipal
ownership is being used with success in some countries, although not yet to the same level of penetration.
Simple comparisons based on advertised speeds are unlikely to reflect real-world performance. This is
an issue with all broadband services, but it is especially acute for ultra-fast networks, where the gap
between capacity in the last mile and the performance of other network components may be particularly
large. Decisions about interconnection, transit, and caching will have great impacts on performance, and
the capacity of servers and end-user equipment may also come into play. Performance metrics and
transparency measures may be helpful for consumers and regulators to make accurate comparisons.
Cross-national comparisons of fibre deployment need to take into account local conditions such as
population density, the inherited infrastructures (e.g. prevalence of competing infrastructures such as HFC)
and so forth. Differences in “urbanicity” and population density, in particular, may create radically
different contexts. The larger the physical territory to be served, the more route miles of fibre will be
deployed, but the harder it will be to reach higher penetration levels. Furthermore, countries with
widespread adoption of relatively high-speed broadband based on DSL, such as France or the United
Kingdom, may feel less pressure to invest in an upgrade to higher speeds than those with a less robust first-
generation broadband market.
A key question in front of all network operators is how far to deploy fibre into the network. Vectored
VDSL2 is emerging as a middle ground between existing low-speed broadband networks and true fibre.
The best approach needs to be determined by each operator based on factors such as the length of existing
loops, cost and expected returns, competition dynamics and so forth. From the perspective of regulators,
key questions are whether VDSL2 is sufficient, how to ensure effective competition in any of the
deployments, and where there is insufficient competition to regulate accordingly. This report has noted that
there may be significant challenges that technological choices may have for the future of some instruments
in the regulator’s tool kit (e.g. unbundling).
While policy makers would prefer to adopt an approach based on the principle of technological
neutrality this may not always be possible in practice. Decisions made by publicly funded networks may by
necessity require choices between architectures. Even where networks are privately operated, deployment
decisions for fixed networks may lock in particular configurations for many years. Governments will need

DSTI/ICCP/CISP(2013)8/FINAL
42
to decide how important it encourage the “future proof” capacity of FTTH networks, and what universal
service entails in an ultra-fast broadband world. Ideally, policy-makers should set out objectives and
performance targets, and then remove impediments to market forces wherever possible.
Meanwhile, regulators in some countries will be tasked with assessing if there is sufficient
infrastructure competition to meet their objectives without tools such as unbundling. Given the high costs
of deploying infrastructure, irrespective of which technological architecture is chosen, there will be a
diminishing business case for each market entrant that follows the first deployment in some locations. This
returns regulators to the familiar questions of natural monopoly. During the past twenty years of
liberalisation, most governments in the OECD have moved away from state ownership and monopoly
regulation of telecommunication networks towards competition and private investment. Will such market
forces be sufficient in an era of ultra-fast broadband, or is greater public intervention essential?
Wireless broadband networks can provide some competition for fixed networks, and certainly supply
a degree of substitution for some services, but they are essentially complementary technologies. Wireless
systems in themselves heavily rely on fixed-broadband networks for backhaul. The growth of Wi-Fi
offloading for burgeoning smartphone and tablet data traffic accentuates this dependency.
Interconnection policies and practices will shape what services are available on high-speed broadband
networks, and from which kinds of providers. Both operators and over-the-top (OTT) providers will need
sufficient revenue sources to invest in growth and innovation. At a high level, their interests are aligned, as
enhanced content and service drive customers to pay for faster broadband connections, which enable them
to take fuller advantage of OTT offerings. In practice, tensions have already emerged relating to peering
and transit arrangements. Competition and transparency are likely to be the most effective means of
policing such disputes. Policy-makers will have to consider how the provision of specialised services and
end-user pricing practices such as metering, freezones, and data caps effect the growing OTT market.
While commercial agreements between broadband operators and OTT service providers can produce
efficient outcomes, imposing fees not tied to traffic volumes based on preconceived views about
responsibility for costs could stifle competition and market growth. OTT providers and operators share a
desire to encourage deployment of higher-performing networks. Regulators should encourage mutually
advantageous solutions.
If the last decade represented the widespread emergence of broadband and the Internet as a truly
global phenomenon, the next decade is likely to involve the integration of fixed networks for voice, video,
data, and machine-to-machine services into converged Internet-based platforms. The economic and social
benefits for countries that successfully transition to ultra-fast networks will be considerable.

DSTI/ICCP/CISP(2013)8/FINAL
43
REFERENCES
Acreo (2013), “Stokab, a Socio-Economic Analysis,” May 30, 2013,
https://www.acreo.se/sites/default/files/pub/acreo.se/EXPERTISE/broadband/socio-
economic_return_of_stokab_investment_twocolumns_notjustify.pdf
BEREC (2012), “An assessment of IP interconnection in the context of Net Neutrality,” BoR (12) 130,
December 6, 2012.
Bohlin, E., Kholilul Rohman, I. (2013), “The Impact of Broadband Speed on the Household Income:
Comparing OECD and BIC,” March 1, 2013,
http://papers.ssrn.com/sol3/papers.cfm?abstract_id=2226899
CISCO (2013), “Cisco Visual Networking Index: Forecast and Methodology, 2012–2017,”
http://www.cisco.com/en/US/solutions/collateral/ns341/ns525/ns537/ns705/ns827/white_paper_c11-
481360_ns827_Networking_Solutions_White_Paper.html
Clark D., Lehr W., and Bauer S. (2011), “Interconnection in the Internet: the Policy Challenge”, Aug. 9,
TPRC 2011. http://ssrn.com/abstract=1992641.
European Commission (2008), “Recommendation on Interconnection in a Liberalized Telecommunications
Market.
Felten B. (2012), “Stockholm’s Stokab: A Blueprint for Ubiquitous Fiber Connectivity?, Diffraction
Analysis,” July 2012. http://www.stokab.se/Documents/Stockholms%20Stokab%20-
%20A%20Blueprint%20for%20Ubiquitous%20Fiber%20Connectivity%20FINAL%20VERSION.p
df
Ganuza J.J., Viecens M.F. (2010), “Deployment of High-speed Broadband Infrastructures during the
Economic Crisis: The Case of Regional Governments in Spain,” September 2010.
http://www.crisis09.es/redes/PDF/15-2010.pdf.
Molnar G., Savage S., and Sicker D. (2013), “The Impact of High-Speed Broadband Availability on Real
Estate Values: Evidence from United States Property Markets,” August 15, 2013.
http://papers.ssrn.com/sol3/papers.cfm?abstract_id=2241926
OECD (2014a), "International Cables, Gateways, Backhaul and International Exchange Points", OECD
Digital Economy Papers, No. 232, OECD Publishing, doi: 10.1787/5jz8m9jf3wkl-en.
OECD (2014b), "Connected Televisions: Convergence and Emerging Business Models", OECD Digital
Economy Papers, No. 231, OECD Publishing, doi: 10.1787/5jzb36wjqkvg-en.
OECD (2013a), OECD Communications Outlook 2013, OECD Publishing.
doi: 10.1787/comms_outlook-2013-en,
OECD (2013b), "Internet Traffic Exchange: Market Developments and Policy Challenges", Weller, D. and
B. Woodcock, OECD Digital Economy Papers, No. 207, OECD Publishing, doi:
10.1787/5k918gpt130q-en.

DSTI/ICCP/CISP(2013)8/FINAL
44
OECD (2013c), "Broadband Networks and Open Access", OECD Digital Economy Papers, No. 218,
OECD Publishing, doi: 10.1787/5k49qgz7crmr-en.
OECD (2012a), "The Development and Diffusion of Digital Content", OECD Digital Economy Papers, No.
213, OECD Publishing, doi: 10.1787/5k8x6kv51z0n-en.
OECD (2012b), "Machine-to-Machine Communications: Connecting Billions of Devices", OECD Digital
Economy Papers, No. 192, OECD Publishing, doi: 10.1787/5k9gsh2gp043-en.\
OECD (2011), "Fibre Access: Network Developments in the OECD Area", OECD Digital Economy
Papers, No. 182, OECD Publishing, doi: 10.1787/5kg9sqzz9mlx-en.
Ofcom (2010), “Delivering Consumer Benefits in Pay TV,” March 31, 2010,
http://media.ofcom.org.uk/2010/03/31/delivering-consumer-benefits-in-pay-tv/
United Kingdom Competition Commission (2012),” Movies on Pay TV Market Investigation,” August 2,
2012, http://www.competition-
commission.org.uk/assets/competitioncommission/docs/2010/movies-on-pay-tv/main_report.pdf
Plückebaum T., “VDSL Vectoring, Bonding und Phantoming: Technisches Konzept, marktliche und
regulatorische Implikationen,” WIK Diskussionsbeitrag Nr. 374 (January 2013).
Werbach K. (2008), “Only Connect,” Volume 22, Berkeley Technology Law Journal 1233 (Fall 2008),
http://scholarship.law.berkeley.edu/cgi/viewcontent.cgi?article=1026&context=btlj

DSTI/ICCP/CISP(2013)8/FINAL
45
NOTES
1 Coaxial cable uses a variety of materials and insulators, but copper is still the primary conductor used for
the core of the bundle.
2 This typology only describes the transport links in the network, not the electronics that route traffic or
reinforce signals. These factors have a significant influence on the capacity and architecture of any real-
world network.
3 The “last mile,” representing the network and customer-premises wiring beyond the nearest operator point
of presence (called a central office in the telephone world), is sometimes referred to as the “first mile”.
4 Sometimes referred to as fibre to the neighbourhood, or fibre to the pedestal.
5 Sometimes referred to as fibre to the building (FTTB), recognising the distinction between individual
homes and apartment or office buildings.
6 Dave Burstein, Vectored DSL: How it Works, Fast Net News, April 4, 2013.
http://fastnetnews.com/dslprime/42-d/4909-vectored-dsl-how-it-works.
7 OECD (2013a), at pg.188
8 Id.
9 Jeff Hecht, “Ultrafast Fibre Optics Set New Speed Record,” New Scientist, April 29, 2011.
www.newscientist.com/article/mg21028095.500-ultrafast-fibre-optics-set-new-speed-record.html.
10 ACCC, “Fibre to the Home (FTTH) Information Paper,”
http://foi.accc.gov.au/sites/foi.accc.gov.au/files/repository/ACCC%20FOI%20Request%2023-2013%20-
%20Document%208.pdf.
11 Lucy Battersby, “Leaked NBN Co Corporate Plan Shows Project on Track,” The Age, September 25, 2013.
www.theage.com.au/it-pro/government-it/leaked-nbn-co-corporate-plan-shows-project-on-track-20130925-
hv1tg.html.
12 OECD (2013a), at pg. 99
13 Steve Wilson, “Should Deutsche Telekom be allowed to deploy vectoring?” Telecoms.com, September 26,
2012. www.telecoms.com/49824/should-deutsche-telekom-be-allowed-to-deploy-vectoring/.
14 Again, these are not strict divisions between companies. Some providers such as Level 3 offer both core
and content distribution services.
15 Mary Meeker, “2012 KPCB Internet Trends Year-end Update,” December 3, 2012.
www.slideshare.net/kleinerperkins/2012-kpcb-internet-trends-yearend-update.
16 Ericsson Mobility Report: “On the Pulse of the Networked Society,” February 2013.
www.ericsson.com/res/docs/2013/ericsson-mobility-report-february-2013.pdf.
17 Australian Bureau of Statistics, Series 8153.0: Internet Activity, Australia, June 2013.
www.abs.gov.au/ausstats/[email protected]/mf/8153.0/.

DSTI/ICCP/CISP(2013)8/FINAL
46
18
Australian Bureau of Statistics, Australian Mobile Handset Downloads Surge, Media Release, October 8,
2013.
www.abs.gov.au/ausstats/[email protected]/Latestproducts/8153.0Media%20Release1June%202013?opendocumen
t&tabname=Summary&prodno=8153.0&issue=June%202013&num=&view=.
19 Mobidia, “New Research Provides Insight into LTE Usage by Smartphone Users; Mobile Operators
Continue to Benefit,” 20 June 2013. www.mobidia.com/admin/news/35.pdf.
20 Informa, Wifi hotspots set to more than triple by 2015. www.informa.com/Media-centre/Press-releases--
news/Latest-News/Wifi-hotspots-set-to-more-than-triple-by-2015/.
21 Rob O’Neill, Phone Boxes Converted into National WiFi Network, ZDNet, September 26, 2013.
www.zdnet.com/phone-boxes-converted-into-national-wifi-network-7000021202/.
22 Internode to double free Adelaide WiFi, August 7, 2013. www.internode.on.net/news/2013/08/318.php.
23 Shaw Go WiFi. www.shaw.ca/wifi/?intcid=ib-2013-09-03-masswifi-h2-all-nonshaw&. In fact, several U.S.
cable operators now offer their customers free roaming across any of their WiFi access points in major
cities.
24 AT&T and Fon Sign Strategic Global Wi-Fi Agreement, Marketwatch.com, September 24, 2013.
www.marketwatch.com/story/att-and-fon-sign-strategic-global-wi-fi-agreement-2013-09-24.
25 Google is arguably an exception, with its Google Voice service and its fibre optic broadband access
network in Kansas City in the United States. However, these are separate ventures from Google’s primary
search and cloud services businesses, with limited scope at present.
26 Federal Communications Commission Releases Latest Data on Local Telephone Competition, May 21,
2001. http://transition.fcc.gov/Bureaus/Common_Carrier/Reports/FCC-State_Link/IAD/lcom0501.pdf.
27 Patrick Brogan, “Evidence of Voice Competition and ILEC Non-Dominance Mounts,” US Telecom
Research Brief, April 3, 2013,
www.ustelecom.org/sites/default/files/documents/130403_Voice_Comp_Update.pdf.
28 See OECD (2013a), at pg. 123
29 See OECD (2013a), at pg. 27
30 See OECD (2013a) at pg. 39
31 Many incumbent telecommunications providers describe these upgrades as “next-generation networks”
(NGNs), focusing not only on the broadband connections, but on the transition of voice service from time-
division multiplexing (TDM) to IP, the convergence of fixed and mobile networks, and the adoption of
standards-based mechanisms for application and service deployment.
32 For example, Netflix in early 2014 reported that Comcast was near the bottom among major American
ISPs in effective performance for its video streaming service, even though Comcast’s broadband access
speeds were among the highest. See Joris Evers, New ISP Performance Data For December, Netflix USA
and Canada Blog, at http://blog.netflix.com/2014/01/new-isp-performance-data-for-december.html. The
performance began to improve after Netflix agreed to a direct paid peering arrangement with Comcast. See
Jon Brodkin, Netflix Got a Bit Faster on Comcast after Opening its Wallet, Ars Technica, March 10, 2014,
at http://arstechnica.com/business/2014/03/netflix-got-a-bit-faster-on-comcast-after-opening-its-wallet/.

DSTI/ICCP/CISP(2013)8/FINAL
47
33
Deloitte Access Economics, Benefits of High-Speed Broadband for Australian Households,
www.deloitte.com/assets/Dcom-
Australia/Local%20Assets/Documents/Services/Corporate%20Finance/Access%20Economics/Deloitte_Ac
cess_Economics_Benefits_HIghspeed_Broadband_v2.pdf.
34 Juha Saarinen, “Socio-economic Benefits of FTTH 'Significant': Study,” IT News, March 28, 2013.
www.itnews.com.au/News/337655,socio-economic-benefits-of-ftth-significant-study.aspx.
35 Jeff Baumgartner, “Verizon FiOS Rolls Out 500-Meg Internet Tier Offers, Multichannel News,” July 22,
2013. www.multichannel.com/distribution/verizon-fios-rolls-out-500-meg-internet-tier/144521. See also:
“AT&T offers its U-Verse FTTN service to approximately 25 million homes, with plans to expand that to
25 million by the end of 2015,” www.multichannel.com/telco-tv/att-expand-u-verse-33-million-
homes/140166.
36 See OECD (2013a), at pg. 101
37 China to Add 35 Mln FTTH Households in 2013, Sina Techm February 26, 2013.
www.marbridgeconsulting.com/marbridgedaily/2013-02-
26/article/63582/china_to_add_35_mln_ftth_households_in_2013.
38 The world leader today in total number of fibre connections is China. Ovum predicts that in 2015, China
will have 76.5 million FTTx subscribers, more than half of the world total. Ovum, FTTx on the Rise in
China, June 26, 2012. http://ovum.com/press_releases/fttx-on-the-rise-in-china/.
39 There are reports in some countries that vectoring systems are proving more difficult to deploy and
offering lower performance than anticipated, although it is possible these limitations will be overcome as
the technology matures.
40 Ministry of Internal Affairs and Communications, Disclosure of Quarterly Data concerning Competition
Review in the Telecommunications Business Field Third quarter of FY2008, Japan (as of the end of
December 2008). www.soumu.go.jp/main_sosiki/joho_tsusin/eng/Statistics/pdf/090325_1.pdf.
41 Annabel Hepworth, “Coalition to Delay NBN Laws Until 2014,” The Australian, September 13, 2013.
www.theaustralian.com.au/national-affairs/election-2013/coalition-to-delay-nbn-laws-until-2014/story-
fn9qr68y-1226718041481.
42 “Viaeuropa to Build Israel Fiber Optic Network,” Reuters, June 18, 2013.
www.ynetnews.com/articles/0,7340,L-4393226,00.html.
43 Harley Ogier, “Vodafone Announces UFB Plans, Television-Over-Fibre Service,” PC World New Zealand,
October 4, 2013. www.pcworld.co.nz/article/528275/vodafone_announces_ufb_plans_television-over-
fibre_service/.
44 See Ganuza et al, 2010. The Xarxa Oberta project was launched as a public-private partnership funded in
part by the regional government of Catalonia. In September 2013, Imagina Media bought out its partner
Axia and assumed full ownership of the network.
45 Rob Pegoraro, Gigabit Internet for $70: the Unlikely Success of California’s Sonic.net, Ars Technica,
February 27, 2012. http://arstechnica.com/tech-policy/2012/02/gigabit-internet-for-80-the-unlikely-
success-of-californias-sonicnet/.
46 Scott Capper, Fibre Optic Standards Simplify Networking, Swissinfo.ch, January 24, 2012.
www.swissinfo.ch/eng/business/Fibre_optic_standards_simplify_networking.html?cid=31974894.

DSTI/ICCP/CISP(2013)8/FINAL
48
47
“ARCEP Defines the Terms of Optical Fibre Rollouts to Stimulate Investment,” June 22, 2009.
www.arcep.fr/index.php?id=8571&L=1&tx_gsactualite_pi1%5Buid%5D=1177&cHash=a72424f18f.
48 “DONG Energy Sells Fibre Optic Network to TDC,” November 17, 2009.
www.dongenergy.com/EN/Investor/releases/Pages/omx%20feed%20list%20details.aspx?omxid=446997.
49 Marguerite Reardon, “Verizon Nears FiOS Network Completion,” News.com, March 29, 2010.
http://news.cnet.com/8301-30686_3-20001377-266.html.
50 Peter Svensson, “Verizon Winds Down Expensive FiOS Expansion,” Associated Press, March 26, 2010.
http://usatoday30.usatoday.com/money/industries/telecom/2010-03-26-verizon-fios_N.htm.
51 Jan Davids, “Reggfiber General Overview,” www.slideshare.net/INCA_NextGen/reggefiber.
52 Lucy Battersby, “Leaked NBN Co Corporate Plan Shows Project on Track,” The Age, September 25, 2013.
www.theage.com.au/it-pro/government-it/leaked-nbn-co-corporate-plan-shows-project-on-track-20130925-
hv1tg.html.
53 See supra note 47.
54 For descriptions of 20 applications that take advantage of ultra-fast networks, see http://us-ignite.org/next-
gen-applications/.
55 Karl Bode, Netflix: “4K Video Will Need At Least 15 Mbps, DSL Reports,” September 23, 2013.
www.dslreports.com/shownews/Netflix-4K-Video-Will-Need-At-Least-15-Mbps-125924.
56 “Surveillance Issues overshadow talks at end of Internet Governance Forum 2013”, Bali, Indonesia, 2013
www.intgovforum.org/cms/2013/IGF2013%20Press%20Release%20END%20FINAL%2020131025.pdf.
57 For a discussion of the value of local IXPs, see OECD (2013b). See also “On Internet, Brazil is Beating US
at its Own Game”, Al Jazeera America, September 20, 2013.
http://america.aljazeera.com/articles/2013/9/20/brazil-internet-dilmarousseffnsa.html
58 Doug Madory, “Google DNS Departs Brazil Ahead of New Law,” 30 October, 2013
www.renesys.com/2013/10/google-dns-departs-brazil-ahead-new-law/.
59 Ericsson, “More Than 50 Billion Connected Devices,” February 2011.
www.ericsson.com/res/docs/whitepapers/wp-50-billions.pdf.
60 F2C 2013 3.1 James Salter: “Building Community Networks,” July 9, 2013.
www.youtube.com/watch?v=04b-IzSRh0M&list=PLuVpWA96MxueWSaBIonLaoJBb6KHM6qGj.
61 See OECD (2013a), at pg. 70. There are, of course, exceptions with investment in France being at record
levels in 2012.
62 See OECD (2013a), at pg. 94.
63 European Telecommunication Network Operators’ Association, “CWG-WCIT12 Contribution 109,
Council Working Group to Prepare for the 2012 World Conference on International Telecommunications,”
June 6, 2012.
64 ETNO paper on Contribution to WCIT: “ITRs Proposal to Address New Internet Ecosystem,” September 7,
2012. www.etno.eu/news/etno/2012/51.

DSTI/ICCP/CISP(2013)8/FINAL
49
65
Jon Brodkin, “Why YouTube Buffers: The Secret Deals the Make – and Break – Online Video,” Ars
Technica, July 28, 2013. http://arstechnica.com/information-technology/2013/07/why-youtube-buffers-the-
secret-deals-that-make-and-break-online-video/.
66 Edward Wyatt and Noam Cohen, “Comcast and Netflix Reach Deal on Service,” New York Times,
February 24, 2014, at B1.
67 A more extensive discussion of such QoS offerings is provided in OECD (2014b).
68 Joan Engebretson, “Verizon, Netflix Dispute Not Just Over Peering; Servers are New Battlefield,”
Telecompetitor, June 24, 2013.
69 David Meyer, “French Government Slaps Down Free’s Anti-Google Ad-Blocking,” GigaOm, January 8,
2013. http://gigaom.com/2013/01/08/french-government-slaps-down-frees-anti-google-ad-blocking/.
70 ARCEP Press Release, “ARCEP Closes the Administrative Inquiry Involving Several Companies,
Including Free and Google, on the Technical and Financial Terms Governing IP Traffic Routing,” July 19,
2013.
www.arcep.fr/index.php?id=8571&L=1&tx_gsactualite_pi1%5Buid%5D=1619&tx_gsactualite_pi1%5Ban
nee%5D=&tx_gsactualite_pi1%5Btheme%5D=&tx_gsactualite_pi1%5Bmotscle%5D=&tx_gsactualite_pi
1%5BbackID%5D=26&cHash=8d42d6993c018a12924d83cf72e3bd36.
71 Lance Whitney, “AT&T, Verizon Face Investigation from French Telecom Regulator,” CNet, July 11,
2013. http://news.cnet.com/8301-1023_3-57593244-93/at-t-verizon-face-investigation-from-french-
telecom-regulator/.
72 Todd Spangler, TWC: “Netflix Is Withholding Content to Gain 'Unprecedented' Access to ISPs,”
Multichannel News, January 16, 2013. www.multichannel.com/cable-operators/twc-netflix-withholding-
content-gain-unprecedented-access-isps/141261.
73 Janko Roettgers, “Netflix Expands Super HD and 3D Streaming to All of its Members,” GigaOm,
September 26, 2013. http://gigaom.com/2013/09/26/netflix-expands-super-hd-and-3-d-streaming-to-all-of-
its-members/.
74 Brian Santo, “Transparent Caching Catching On,” CED Magazine, August 29, 2013.
www.cedmagazine.com/blogs/2013/08/transparent-caching-catching-on.
75 Huťko's Technology Law Blog, “The Slovak Court Orders an ISP to Stop Breaching the Net Neutrality,”
31 October 2013. www.husovec.eu/2013/10/the-slovak-court-orders-isp-to-stop.html.
76 Free, Freebox Revolution: “1 Gbps with FTTH”, October 1, 2013.
http://www.iliad.fr/en/presse/2013/CP_011013_Eng.pdf.
77 “ARCEP Underlines the Partial and Occasionally Inaccurate Nature of Today’s Press Release Made by
Free on its Superfast Broadband Offers,” Press Release, October 1, 2013.
www.arcep.fr/index.php?id=8571&tx_gsactualite_pi1[uid]=1623&tx_gsactualite_pi1[annee]=&tx_gsactua
lite_pi1[theme]=&tx_gsactualite_pi1[motscle]=&tx_gsactualite_pi1[backID]=26&cHash=406889e32a803
ef1190da9e6b0b469f4&L=1.
78 Joshua Brustein, “T-Mobile Gets Rid of International Roaming Fees, Shaming Competitors,” Bloomberg
BusinessWeek, October 10, 2013.
79 Sophie Curtis, “Three Dumps Roaming Charges in Seven Countries,” The Telegraph, August 30, 2013.
www.telegraph.co.uk/technology/news/10276475/Three-dumps-roaming-charges-in-seven-countries.html

DSTI/ICCP/CISP(2013)8/FINAL
50
“Free Mobile Plan” Available in Portugal at No Extra Charge, Press Release, April 25, 2013.
www.iliad.fr/en/presse/2013/CP_250413_Eng.pdf.
80 Stacey Higginbotham, “The Technical and Legal Realities of Comcast’s Xbox Cap Spat,” GigaOm, March
27, 2012. http://gigaom.com/2012/03/27/the-technical-and-legal-realities-of-comcasts-xbox-cap-spat/.
81 BigPond Unmetered. http://go.bigpond.com/unmetered/.
82 “Internode’s ‘Unmetered Content’ Services aren’t Counted Against Your Monthly Download Inclusion -
So Enjoy!” www.internode.on.net/residential/entertainment/unmetered_content/.