Embed Size (px)
Citation preview
The Development Strategy for the Food and Beverage Service
Study Program as One of the Superior Study Programs at the
Politeknik Pariwisata Makassar
Ratnah1, I Putu Suarta
2, Rita
3
1,2,3 Politeknik Pariwisata Makassar
Email: [email protected]
(Received: August 2020; revised: September 2020; published: October 2020)
ABSTRACT
The interest of students to continue studying at the Politeknik Pariwisata Makassar is very large and
increases from year to year.. This study aims to formulate a development strategy for the Food and
Beverage Service Management study program as one of the superior study programs at Makassar
Tourism Polytechnic. This research uses descriptive quantitative method. Respondents in this study
totaled 241 consisting of 140 male respondents and 101 female respondents who were a combination of
students, lecturers/staff of the Food and Beverage Service study program at Makassar Tourism
Polytechnic, hotel/restaurant employees, entrepreneurs, employees of other companies, and that hasn't
worked. The data collection techniques used in this study were: questionnaires, interviews, Focus Group
Discussion (FGD), and literature study. The data analysis technique was carried out in three stages,
namely the input stage, the matching stage and the decision stage. The conclusion of this research is that
the analysis results from the IFAS matrix show that the strength factor of the study program is much
greater than the weakness factor so that the study program has strengths or advantages that can be
developed. Meanwhile, the results of the analysis from the EFAS matrix show that the opportunities the
study program has are greater than the threat factors so that the study program has a greater chance of
being developed. As for the results of the QSPM matrix analysis, the TAS value that has been listed is
that the W-O strategy gets the highest value of 6,354, the W-T strategy is 6,027 then the S-O strategy is
5,976 and finally the S-T strategy is 5,869. That is, the development strategy of the MTH study program
is compiled in 14 priority strategies from 20 formulated strategies consisting of the W - O Strategy (5
strategies), the W - T Strategy (4 strategies), the S - O Strategy (3 strategies), and the S - T (2 strategies).
Keywords: Development Strategy, IFE Matrix, EFE Matrix, QSPM
INTRODUCTION
The interest of students to continue studying at the Makassar Tourism Polytechnic
(Poltekpar Makassar) is very large and increases from year to year. Students who are interested
in studying at the Makassar Poltekpar in 2018 are 4,705 people (1,778 people on the SBMPTNP
pathway and 2927 people on the SMM pathway) and have increased in 2019 to 7,958 (1533 on
the SBMPTNP route and 6425 on the SMM route) or an increase 59%. However, the increase in
the number of enthusiasts and participants was not evenly distributed for each study program
including the Food and Beverage Service study program.
Based on data on new student admissions, the number of students admitted to the MTH
study program, in previous years, always corresponds to the specified capacity. However, at the
2019 new student admission, the target number of students accepted for the MTH study
Jurnal Administrare: Jurnal Pemikiran Ilmiah dan Pendidikan Administrasi Perkantoran Vol. 7, No. 2, July-December 2020, Pages 215-226 p-ISSN: 2407-1765, e-ISSN: 2541-1306 Homepage: http://ojs.unm.ac.id/index.php/administrare/index
Copyright © 2020 Universitas Negeri Makassar. This is an open access article under the CC BY license
(http://creativecommons.org/licenses/by/4.0/)
216 Jurnal Administrare: Jurnal Pemikiran Ilmiah dan Pendidikan Administrasi Perkantoran
Volume 7 Number 2 July- December 2020. Pages 215-226
program is 80 students, but only 72 people are accepted. This shows that the number of students
accepted does not match the predetermined target. Therefore, the importance of a study program
development strategy in order to increase the number of enthusiasts who choose Poltekpar,
especially the course of Food and Beverage Service.
According to (Sofjan, 2013) the function of the strategy is basically to streamline the
implementation in helping achieve organizational goals. There are six strategic functions that
must be carried out simultaneously, namely: (1) communicating a purpose (vision) to be
achieved to others, (2) connecting or linking the strengths or advantages of the organization
with opportunities from its environment, (3) exploiting or exploiting success and the success
that is obtained now is simultaneously investigating the existence of new opportunities, (4)
generating and generating more resources than currently used, (5) coordinating and directing
future activities or organizational activities, and (6) responding and react to new situations all
the time.
The strategy is a fundamental pattern of current and planned goals, mobilization of
resources, and interactions of the organization with markets, competitors, and other
environmental factors (Boyd & Harper, 2000). The strategy is a long-term plan, followed by
actions aimed at achieving a specific goal, which is generally victory. The term strategy is
formulated as a goal to be achieved and the steps to achieve that goal (Astuti, Silalahi, &
Wijaya, 2015; Botituhe, Akib, & Gani, 2017.; Kurniawati, Triyanti, & Daraba, 2019;
Sedarmayanti, 2018)
According to (Setyosari, 2012) that development activities include three stages,
namely planning, implementing, and evaluating followed by improvement activities so
that a form deemed adequate is obtained. Development is a process or effort to make a
change either slowly or gradually by deepening and expanding existing knowledge
through the planning, implementation, and evaluation process. (Ibrahim, Boerhannoeddin,
& Kazeem Kayode, 2017; Prasodjo, 2020; Rasyid, 2020)
The formulation of the development strategy for the Food and Beverage Service study
program, the writer will use the matrix analysis External Factor Evaluation (EFAS), Internal
Factor Evaluation (IFAS), SWOT, and Quantitative Strategic Planning Matrix (QSPM). Matrix
External Factor Evaluation (EFAS) is part of an organization's external audit. The EFE matrix is
used to evaluate the external factors of the organization. Its purpose is to develop a finite list of
opportunities that can benefit an organization and threats to avoid. In addition, the external
evaluation identifies important variables that offer responses in the form of actions. In this case,
an organization must be able to respond in the form of action (Klein, 2009). Meanwhile, the IFE
matrix is used to determine internal organizational factors related to strengths and weaknesses
that are considered important. The internal aspects of the organization can be extracted from
several organizational functions, such as finance, human resources, management, competence,
marketing, production, and so on (Evelyn, 2018).
METHOD
This research uses a quantitative approach, with a descriptive method because this
research will look for facts in the field using proper interpretations of relationships, activities,
attitudes, views, and ongoing processes related to management study program development
Ratnah, Sunarta, Rita; The Development Strategy for the Food and Beverage Service …|217
strategies. food preparation as one of the superior study programs at the Politeknik Pariwisata
Makassar (Herdiansyah, 2010; Sugiyono, 2017). The operational definitions in this research are:
(1) strategy is defined as a goal to be achieved and steps to achieve that goal, (2) development is
defined as a process or effort to make a change either slowly or gradually by deepening and
expand existing knowledge through planning, implementation and evaluation processes.
This research was conducted in several places, namely the Politeknik Pariwisata
Makassar and several starred hotels/restaurants in Makassar, as well as several districts and
cities that are considered representative in South Sulawesi province, namely Makassar City,
Parepare City, Bone Regency, and Bulukumba Regency. Respondents/informants in this study
totaled 241 consisting of 140 male respondents and 101 female respondents who were a
combination of students, lecturers/staff of the Politeknik Pariwisata Makassar Food and Beverage
Service study program, hotel/restaurant employees, entrepreneurs, employees of other
companies, and that hasn't worked. The data collection techniques used in this study were:
questionnaires, interviews, Focus Group Discussion (FGD), and literature study. As part of the
data analysis technique, developing a development strategy is carried out by going through three
stages of analysis, namely the input stage, namely by entering the results of EFAS (External
Factor Analysis) and IFAS (Internal Factor Analysis) into the matrix, the merger stage (
Matching Stage) by combining the results from the EFAS and IFAS matrices into the SWOT
analysis and the decision stage. The final stage of this data analysis is to formulate the decisions
that will be taken in the QSPM (Quantitative Strategic Planning Matrix) process.
RESULT AND DISCUSSION
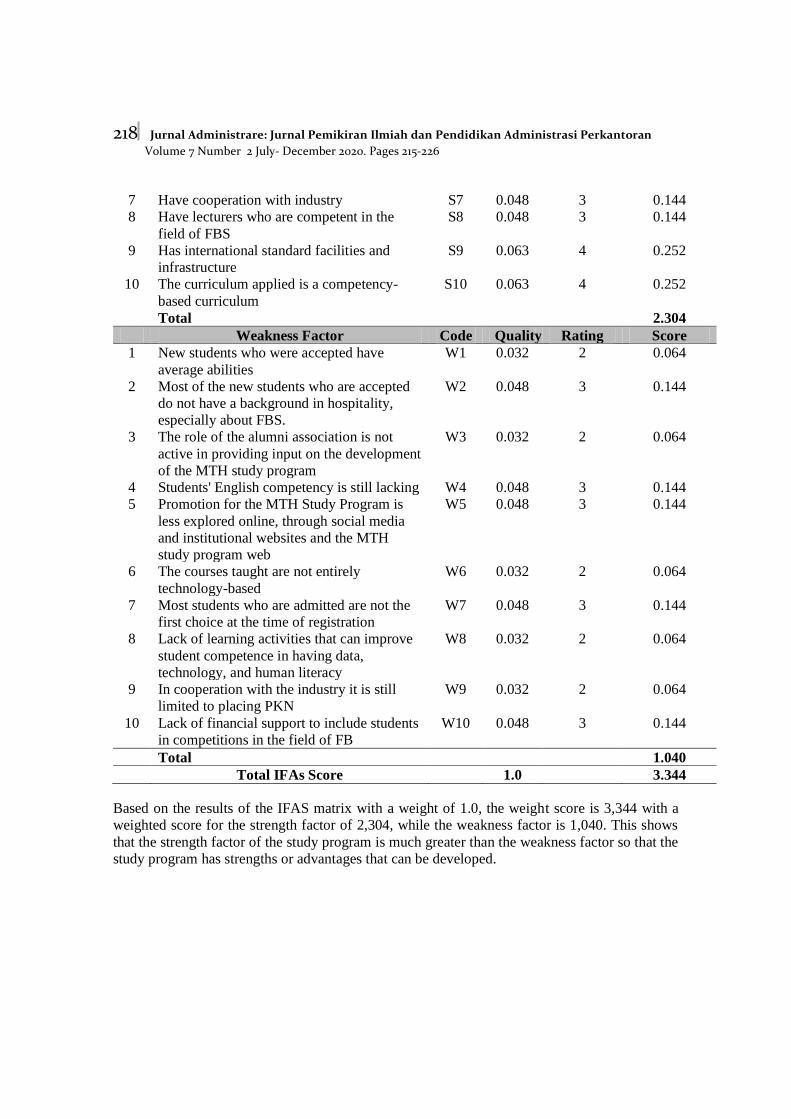
Internal Factors Analysis Summary (IFAS)
IFAS describes the magnitude of the influence between internal factors on the strategy-
making of an organization or business (Rangkuti, 2016).
Tabel 1.
Internal Factors Analysis Summary (IFAS)
No Strength Factors Code Quality Rating Score
1 Has status as a country under the auspices of
the Ministry of Tourism and Creative
Economy
S1 0.063 4 0.252
2 Received Accreditation A from BAN-PT S2 0.063 4 0.252
3 The alumni get a competency certificate
from BNSP in addition to a diploma
S3 0.063 4 0.252
4 Cheap tuition fees because it gets subsidies
from the government
S4 0.063 4 0.252
5 Consists of several outlets (Restaurant, Bar,
Room Service, Banquet)
S5 0.063 4 0.252
6 There is budget support from the ministry
for the development of the MTH study
program
S6 0.063 4 0.252
218 Jurnal Administrare: Jurnal Pemikiran Ilmiah dan Pendidikan Administrasi Perkantoran
Volume 7 Number 2 July- December 2020. Pages 215-226
7 Have cooperation with industry S7 0.048 3 0.144
8 Have lecturers who are competent in the
field of FBS
S8 0.048 3 0.144
9 Has international standard facilities and
infrastructure
S9 0.063 4 0.252
10 The curriculum applied is a competency-
based curriculum
S10 0.063 4 0.252
Total 2.304
Weakness Factor Code Quality Rating Score
1 New students who were accepted have
average abilities
W1 0.032 2 0.064
2 Most of the new students who are accepted
do not have a background in hospitality,
especially about FBS.
W2 0.048 3 0.144
3 The role of the alumni association is not
active in providing input on the development
of the MTH study program
W3 0.032 2 0.064
4 Students' English competency is still lacking W4 0.048 3 0.144
5 Promotion for the MTH Study Program is
less explored online, through social media
and institutional websites and the MTH
study program web
W5 0.048 3 0.144
6 The courses taught are not entirely
technology-based
W6 0.032 2 0.064
7 Most students who are admitted are not the
first choice at the time of registration
W7 0.048 3 0.144
8 Lack of learning activities that can improve
student competence in having data,
technology, and human literacy
W8 0.032 2 0.064
9 In cooperation with the industry it is still
limited to placing PKN
W9 0.032 2 0.064
10 Lack of financial support to include students
in competitions in the field of FB
W10 0.048 3 0.144
Total 1.040
Total IFAs Score 1.0 3.344
Based on the results of the IFAS matrix with a weight of 1.0, the weight score is 3,344 with a
weighted score for the strength factor of 2,304, while the weakness factor is 1,040. This shows
that the strength factor of the study program is much greater than the weakness factor so that the
study program has strengths or advantages that can be developed.
Ratnah, Sunarta, Rita; The Development Strategy for the Food and Beverage Service …|219
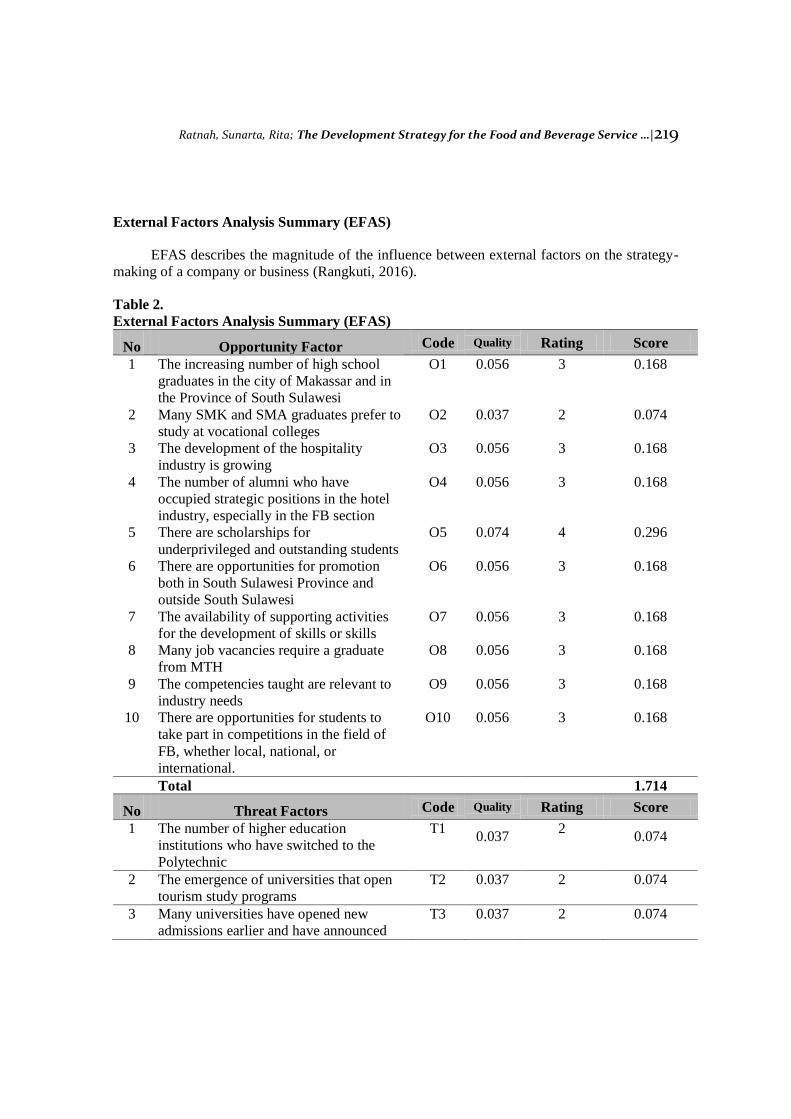
External Factors Analysis Summary (EFAS)
EFAS describes the magnitude of the influence between external factors on the strategy-
making of a company or business (Rangkuti, 2016).
Table 2.
External Factors Analysis Summary (EFAS)
No Opportunity Factor Code Quality Rating Score
1 The increasing number of high school
graduates in the city of Makassar and in
the Province of South Sulawesi
O1 0.056 3 0.168
2 Many SMK and SMA graduates prefer to
study at vocational colleges
O2 0.037 2 0.074
3 The development of the hospitality
industry is growing
O3 0.056 3 0.168
4 The number of alumni who have
occupied strategic positions in the hotel
industry, especially in the FB section
O4 0.056 3 0.168
5 There are scholarships for
underprivileged and outstanding students
O5 0.074 4 0.296
6 There are opportunities for promotion
both in South Sulawesi Province and
outside South Sulawesi
O6 0.056 3 0.168
7 The availability of supporting activities
for the development of skills or skills
O7 0.056 3 0.168
8 Many job vacancies require a graduate
from MTH
O8 0.056 3 0.168
9 The competencies taught are relevant to
industry needs
O9 0.056 3 0.168
10 There are opportunities for students to
take part in competitions in the field of
FB, whether local, national, or
international.
O10 0.056 3 0.168
Total 1.714
No Threat Factors Code Quality Rating Score
1 The number of higher education
institutions who have switched to the
Polytechnic
T1 0.037
2 0.074
2 The emergence of universities that open
tourism study programs
T2 0.037 2 0.074
3 Many universities have opened new
admissions earlier and have announced
T3 0.037 2 0.074
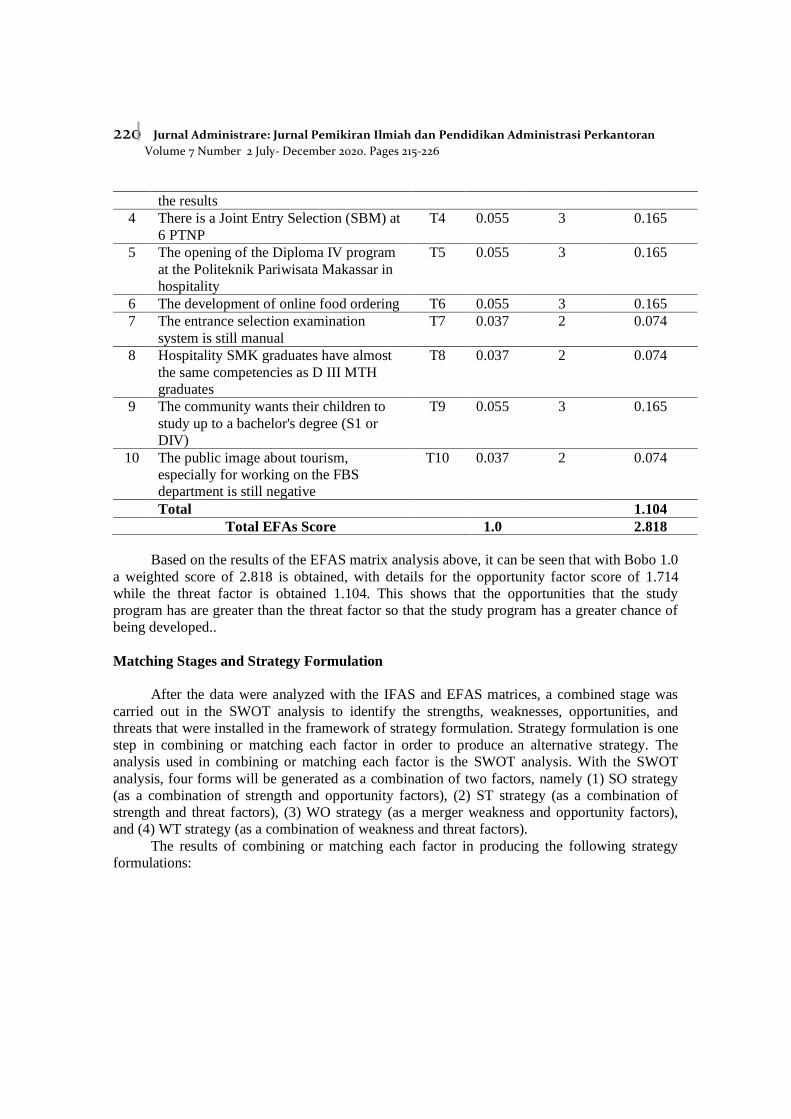
220 Jurnal Administrare: Jurnal Pemikiran Ilmiah dan Pendidikan Administrasi Perkantoran
Volume 7 Number 2 July- December 2020. Pages 215-226
the results
4 There is a Joint Entry Selection (SBM) at
6 PTNP
T4 0.055 3 0.165
5 The opening of the Diploma IV program
at the Politeknik Pariwisata Makassar in
hospitality
T5 0.055 3 0.165
6 The development of online food ordering T6 0.055 3 0.165
7 The entrance selection examination
system is still manual
T7 0.037 2 0.074
8 Hospitality SMK graduates have almost
the same competencies as D III MTH
graduates
T8 0.037 2 0.074
9 The community wants their children to
study up to a bachelor's degree (S1 or
DIV)
T9 0.055 3 0.165
10 The public image about tourism,
especially for working on the FBS
department is still negative
T10 0.037 2 0.074
Total 1.104
Total EFAs Score 1.0 2.818
Based on the results of the EFAS matrix analysis above, it can be seen that with Bobo 1.0
a weighted score of 2.818 is obtained, with details for the opportunity factor score of 1.714
while the threat factor is obtained 1.104. This shows that the opportunities that the study
program has are greater than the threat factor so that the study program has a greater chance of
being developed..
Matching Stages and Strategy Formulation
After the data were analyzed with the IFAS and EFAS matrices, a combined stage was
carried out in the SWOT analysis to identify the strengths, weaknesses, opportunities, and
threats that were installed in the framework of strategy formulation. Strategy formulation is one
step in combining or matching each factor in order to produce an alternative strategy. The
analysis used in combining or matching each factor is the SWOT analysis. With the SWOT
analysis, four forms will be generated as a combination of two factors, namely (1) SO strategy
(as a combination of strength and opportunity factors), (2) ST strategy (as a combination of
strength and threat factors), (3) WO strategy (as a merger weakness and opportunity factors),
and (4) WT strategy (as a combination of weakness and threat factors).
The results of combining or matching each factor in producing the following strategy
formulations:
Ratnah, Sunarta, Rita; The Development Strategy for the Food and Beverage Service …|221
1. S-O Strategy (Strength - opportunities)
a. Promotion activities are further enhanced by involving study programs to highlight all
products, outlets, job opportunities, and graduate profiles (S1, S5, O6, O8)
b. Cooperating with alumni in promoting study programs and providing information on
job opportunities in the industry/company where the alumni work. (S7, O4, O6, O8)
c. Involving students actively in every competition or event that can introduce study
programs to the community (S6, O6, O10)
d. Maximizing the use of facilities and infrastructure, especially technology-based
equipment in increasing the competence of lecturers and students (S8, S9, O9)
e. Curriculum reviews are carried out periodically based on industrial needs (S3, S10, O9)
2. S-T Strategy (Strength - Threats)
a. The study program must create a logo that accentuates products from the restaurant and
not on services (S3, S5, T8, T10)
b. The study program creates profiles that further highlight products and capabilities in
restaurant management, including displaying top-level positions in the restaurant, not
service profiles that carry trays (S3, S5, T8, T10)
c. Collaboration with industry in developing lecturer competence must always be carried
out regularly to improve the quality/competence of graduates (S7, S8, T8)
d. The study program must often carry out community service activities together with
students to improve its image (S6, T10)
e. Upgrading the status from D-III program to D-IV program with the name of "Restaurant
Management" study program (S1, S8, T5, T9)
3. W-O Strategy (Weaknesses - Opportunities)
a. Maximizing the implementation of extra-curricular activities in improving student
competence (W1, O7, O9)
b. Regularly involve alumni as Guest Lecturers to increase knowledge, insight, skills, and
motivation to students so that they are proud of the study program (W1, W2, W7, O4)
c. Provide activities for students to use English optimally, for example when entering a
restaurant, or when serving guests and on extra-curricular activities (W4, O7, O9)
d. Coordination between study programs is further improved so that the implementation of
practice can run optimally (W6, W8, O9)
e. Cooperation with industry in implementing PKN is further enhanced including
providing facilities to students (W9, O8, O9)
4. W - T (Weaknesses - Threats) Strategy
a. Maximizing the lecture process both theory and practice in improving student
competence (W1, W4, T8)
b. Providing orientation or hotel visits to new students (W2, T8)
c. Provide training more often to the community and include students in various
competitions and events to give a good image (W5, W7, T10)
d. Creating a "magic word" that can increase the enthusiasm and pride of students in their
study program (W7, T10)
e. Prepare the study program to switch to the D-IV program using the name of the study
program "Restaurant Management" or Restaurant Management (W2, T9)
222 Jurnal Administrare: Jurnal Pemikiran Ilmiah dan Pendidikan Administrasi Perkantoran
Volume 7 Number 2 July- December 2020. Pages 215-226
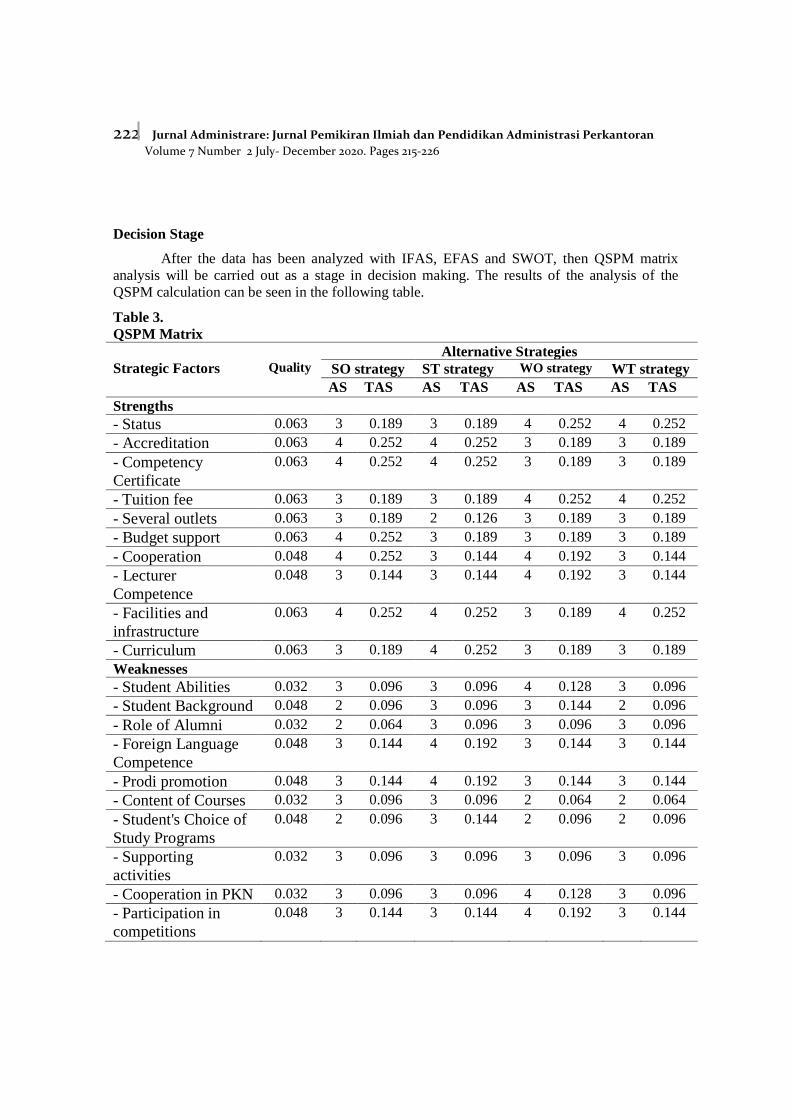
Decision Stage
After the data has been analyzed with IFAS, EFAS and SWOT, then QSPM matrix
analysis will be carried out as a stage in decision making. The results of the analysis of the
QSPM calculation can be seen in the following table.
Table 3.
QSPM Matrix
Strategic Factors
Quality
Alternative Strategies
SO strategy ST strategy WO strategy WT strategy
AS TAS AS TAS AS TAS AS TAS
Strengths
- Status 0.063 3 0.189 3 0.189 4 0.252 4 0.252
- Accreditation 0.063 4 0.252 4 0.252 3 0.189 3 0.189
- Competency
Certificate
0.063 4 0.252 4 0.252 3 0.189 3 0.189
- Tuition fee 0.063 3 0.189 3 0.189 4 0.252 4 0.252
- Several outlets 0.063 3 0.189 2 0.126 3 0.189 3 0.189
- Budget support 0.063 4 0.252 3 0.189 3 0.189 3 0.189
- Cooperation 0.048 4 0.252 3 0.144 4 0.192 3 0.144
- Lecturer
Competence
0.048 3 0.144 3 0.144 4 0.192 3 0.144
- Facilities and
infrastructure
0.063 4 0.252 4 0.252 3 0.189 4 0.252
- Curriculum 0.063 3 0.189 4 0.252 3 0.189 3 0.189
Weaknesses
- Student Abilities 0.032 3 0.096 3 0.096 4 0.128 3 0.096
- Student Background 0.048 2 0.096 3 0.096 3 0.144 2 0.096
- Role of Alumni 0.032 2 0.064 3 0.096 3 0.096 3 0.096
- Foreign Language
Competence
0.048 3 0.144 4 0.192 3 0.144 3 0.144
- Prodi promotion 0.048 3 0.144 4 0.192 3 0.144 3 0.144
- Content of Courses 0.032 3 0.096 3 0.096 2 0.064 2 0.064
- Student's Choice of
Study Programs
0.048 2 0.096 3 0.144 2 0.096 2 0.096
- Supporting
activities
0.032 3 0.096 3 0.096 3 0.096 3 0.096
- Cooperation in PKN 0.032 3 0.096 3 0.096 4 0.128 3 0.096
- Participation in
competitions
0.048 3 0.144 3 0.144 4 0.192 3 0.144
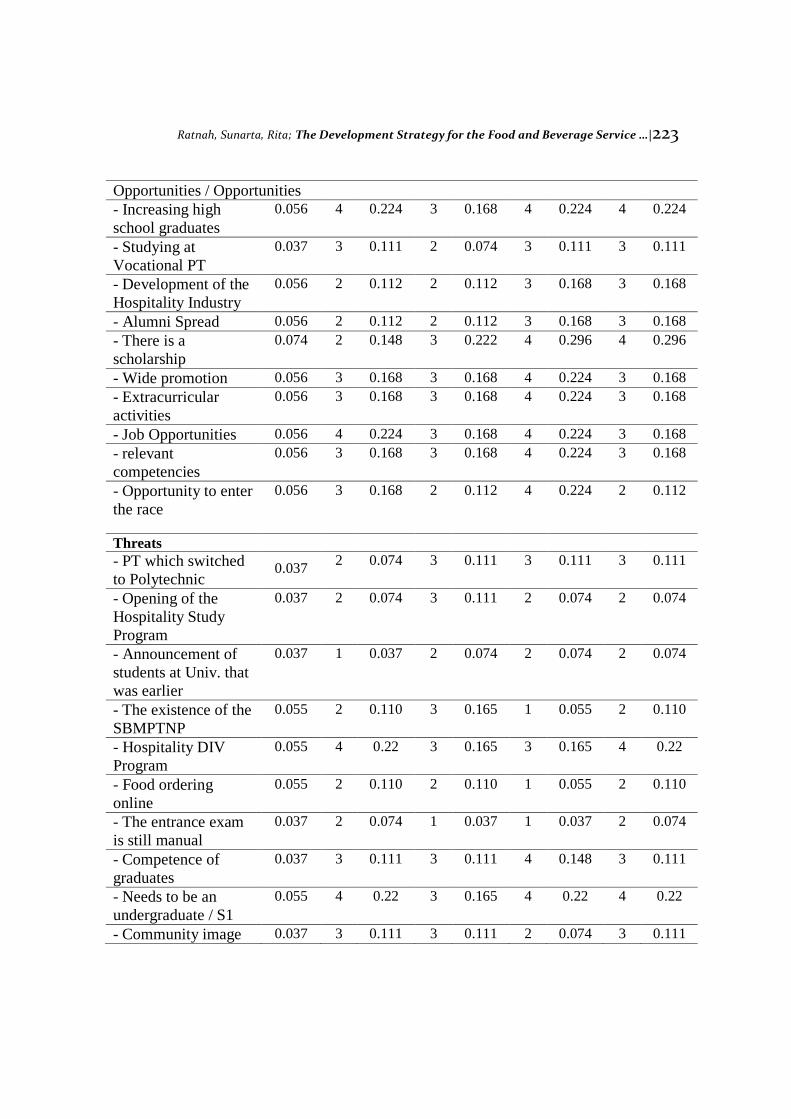
Ratnah, Sunarta, Rita; The Development Strategy for the Food and Beverage Service …|223
Opportunities / Opportunities
- Increasing high
school graduates
0.056 4 0.224 3 0.168 4 0.224 4 0.224
- Studying at
Vocational PT
0.037 3 0.111 2 0.074 3 0.111 3 0.111
- Development of the
Hospitality Industry
0.056 2 0.112 2 0.112 3 0.168 3 0.168
- Alumni Spread 0.056 2 0.112 2 0.112 3 0.168 3 0.168
- There is a
scholarship
0.074 2 0.148 3 0.222 4 0.296 4 0.296
- Wide promotion 0.056 3 0.168 3 0.168 4 0.224 3 0.168
- Extracurricular
activities
0.056 3 0.168 3 0.168 4 0.224 3 0.168
- Job Opportunities 0.056 4 0.224 3 0.168 4 0.224 3 0.168
- relevant
competencies
0.056 3 0.168 3 0.168 4 0.224 3 0.168
- Opportunity to enter
the race
0.056 3 0.168 2 0.112 4 0.224 2 0.112
Threats
- PT which switched
to Polytechnic 0.037
2 0.074 3 0.111 3 0.111 3 0.111
- Opening of the
Hospitality Study
Program
0.037 2 0.074 3 0.111 2 0.074 2 0.074
- Announcement of
students at Univ. that
was earlier
0.037 1 0.037 2 0.074 2 0.074 2 0.074
- The existence of the
SBMPTNP
0.055 2 0.110 3 0.165 1 0.055 2 0.110
- Hospitality DIV
Program
0.055 4 0.22 3 0.165 3 0.165 4 0.22
- Food ordering
online
0.055 2 0.110 2 0.110 1 0.055 2 0.110
- The entrance exam
is still manual
0.037 2 0.074 1 0.037 1 0.037 2 0.074
- Competence of
graduates
0.037 3 0.111 3 0.111 4 0.148 3 0.111
- Needs to be an
undergraduate / S1
0.055 4 0.22 3 0.165 4 0.22 4 0.22
- Community image 0.037 3 0.111 3 0.111 2 0.074 3 0.111
224 Jurnal Administrare: Jurnal Pemikiran Ilmiah dan Pendidikan Administrasi Perkantoran
Volume 7 Number 2 July- December 2020. Pages 215-226
Total 5.976 5.869 6.354 6.027
Based on the results of the strategy formulation and the predetermined priority scale, the
development strategy of the Food and Beverage Service study program is compiled in 14 priority
strategies out of the 20 formulated strategies, namely:
1. Maximizing the implementation of extra-curricular activities in improving student
competence (W1, O7, O9)
2. Involving alumni regularly as Guest Lecturers to increase knowledge, insight, skills,
and motivation to students so that they are proud of their study program (W1, W2, W7,
O4)
3. Provide activities for students to use English optimally, for example when entering a
restaurant, or when serving guests and in extra-curricular activities (W4, O7, O9)
4. Coordination between study programs is further improved so that the implementation of
practice can run optimally (W6, W8, O9)
5. Cooperation with industry in implementing PKN is further enhanced including
providing facilities to students (W9, O8, O9)
6. Providing orientation or hotel visits to new students (W2, T8)
7. More often provide training to the community or other service activities by involving
students to improve the image or image (W5, W7, T10)
8. Prepare the study program to switch to the D-IV program by using the name of the
study program "Restaurant Management" or Restaurant Management (W2, T9)
9. Promotional activities are further enhanced both offline and online by involving study
programs to highlight all products, outlets, job opportunities, and graduate profiles (S1,
S5, O6, O8)
10. Cooperate with alumni in promoting study programs and providing information on job
opportunities in the industries/companies where the alumni work. (S7, O4, O6, O8)
11. Involving students actively in every competition or event that can introduce study
programs to the community (S6, O6, O10)
12. Curriculum reviews are carried out periodically based on industry needs (S3, S10, O9)
13. The study program must create a logo that accentuates products from the restaurant and
not on services (S3, S5, T8, T10)
14. The study program creates profiles that further highlight products and competencies in
restaurant management, including displaying top-level positions in restaurants, not
service profiles that carry trays (S3, S5, T8, T10)
CONCLUSION
Based on the results of the IFAS matrix with a weight of 1.0, the weight score is 3,344
with a weight score for the strength factor of 2.304 while the factor for weakness is 1.040. This
shows that the strength factor of the study program is much greater than the weakness factor so
that the study program has strengths or advantages that can be developed. The results of the
EFAS matrix analysis show that with a weight of 1.0, a weight score of 2.818 is obtained, with
Ratnah, Sunarta, Rita; The Development Strategy for the Food and Beverage Service …|225
details for the opportunity factor score of 1.714 while the threat factor is obtained 1.104. This
shows that the opportunities that the study program has are greater than the threat factor so that
the study program has a greater chance of being developed. Meanwhile, the QSPM matrix
results obtained the TAS value which has been listed, namely the W - O Strategy getting the
highest value, namely 6.354, the W - T Strategy which is 6,027 then the S - O Strategy which is
5,976 and finally the S-T Strategy which is 5,869. So that the development strategy of the MTH
study program is compiled in 14 priority strategies from 20 strategies that have been formulated
consisting of the W - O Strategy (5 strategies), the W - T Strategy (4 strategies), the S - O
Strategy (3 strategies), and the S Strategy. - T (2 strategies).
REFERENCES
Astuti, R., Silalahi, R. L. R., & Wijaya, G. D. P. (2015). Marketing Strategy Based on
Marketing Mix Influence on Purchasing Decisions of Malang Apples Consumers at Giant
Olympic Garden Mall (MOG), Malang City, East Java Province, Indonesia. Agriculture
and Agricultural Science Procedia, 3, 67–71.
https://doi.org/https://doi.org/10.1016/j.aaspro.2015.01.015
Botituhe, N., Akib, H., & Gani, H. A. (n.d.). Strategy Formulation through Identification Of
Asset Management Problem Of The Gorontalo City Government.
Boyd, W., & Harper, M. P. (2000). Suatu Pendekatan Strategis dengan Orientasi Global.
Jakarta: Erlangga, 133.
Evelyn, E. (2018). Analisis Manajemen Strategi Bersaing Dengan Matriks Ie, Matriks Swot Dan
Matriks Qspm Pada Pt. Xyz. Jurnal Manajemen Bisnis dan Kewirausahaan, 2(4).
Herdiansyah, H. (2010). Metodologi penelitian kualitatif untuk ilmu-ilmu sosial. In Jakarta:
Salemba Humanika.
Ibrahim, R., Boerhannoeddin, A., & Kazeem Kayode, B. (2017). Organizational culture and
development: Testing the structural path of factors affecting employees’ work
performance in an organization. Asia Pacific Management Review, 22(2), 104–111.
https://doi.org/https://doi.org/10.1016/j.apmrv.2016.10.002
Klein, D. A. (2009). The strategic management of intellectual capital. Routledge.
Kurniawati, R., Triyanti, N., & Daraba, D. (2019). Tourism Object Development Strategy in
Rejang Lebong Regency Bengkulu Province. PINISI Discretion Review, 3(2), 143–150.
Prasodjo, T. (2020). Knowledge Management: Sustainable Human Resource Development in
Public Sector Organizations. Jurnal Ad’ministrare, 6(2), 159–166.
Rangkuti, F. (2016). Personal SWOT Analysis Peluang di Balik Kesulitan. Jakarta: Gramedia.
Rasyid, A. R. (2020). Prototype of the Strategy for the Development of HR Competencies in the
State Civil Service in Barru Regency. Jurnal Ilmiah Ilmu Administrasi Publik, 10(1), 133–
142.
Sedarmayanti. (2018). Tata Kerja dan Produktivitas Kerja. In Bandung, CV Mandar Maju.
Setyosari, P. (2012). Research Methods Education and Development. Jakarta: Kencana Prenada
Media Group.
Sofjan, A. (2013). Strategic Management, Sustainable Competitive Advantages. Jakarta: PT.
Raja Grapindo Persada.
Sugiyono. (2017). Pendekatan Kuantitatif, Kualitatif, Kombinasi, R&D dan Penelitian Evaluasi.
Bandung: Alfa Beta.
226 Jurnal Administrare: Jurnal Pemikiran Ilmiah dan Pendidikan Administrasi Perkantoran
Volume 7 Number 2 July- December 2020. Pages 215-226