Embed Size (px)
Citation preview
8/3/2019 The Developments in the London Docklands Have Changed the Characteristics of the Whole Area
http://slidepdf.com/reader/full/the-developments-in-the-london-docklands-have-changed-the-characteristics-of 1/18
Rachel Cutenar 11HYB Mr Henderson
The developments in the London Docklands have
changed the characteristics of the whole area
Introduction
In the early 19th century the LondonDocklands was one of the busiest
Page | 1
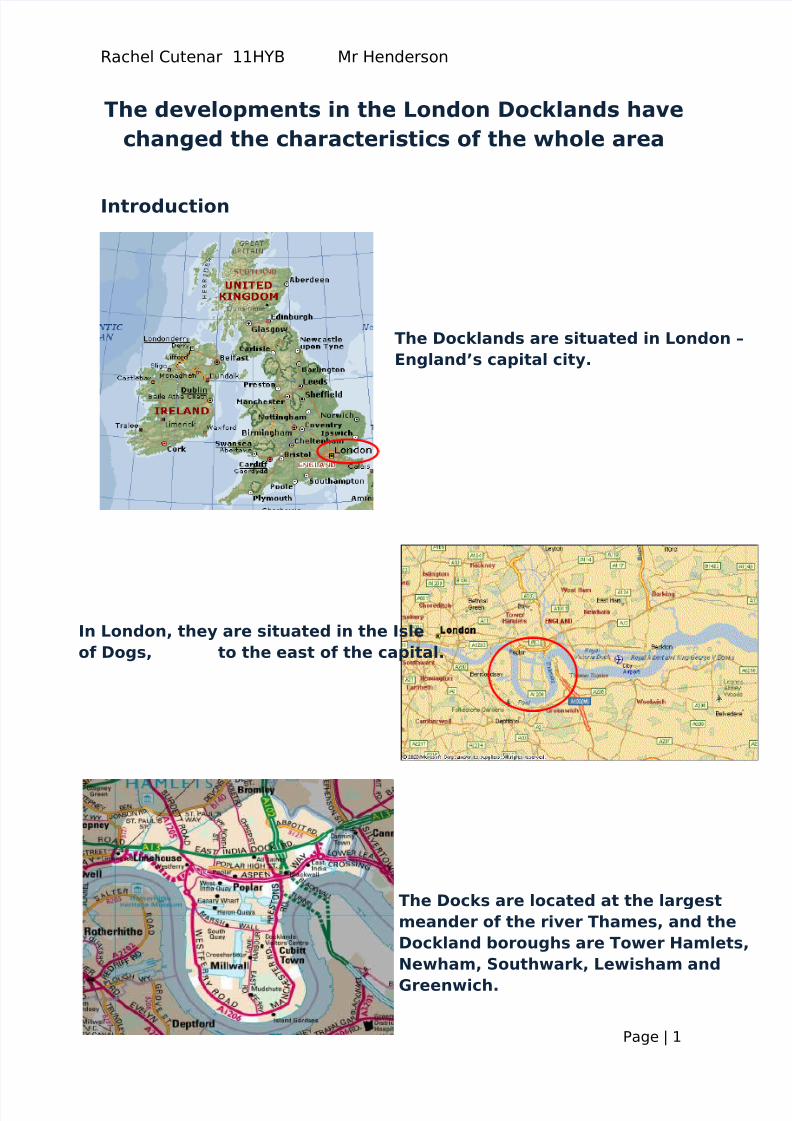
The Docklands are situated in London –
England’s capital city.
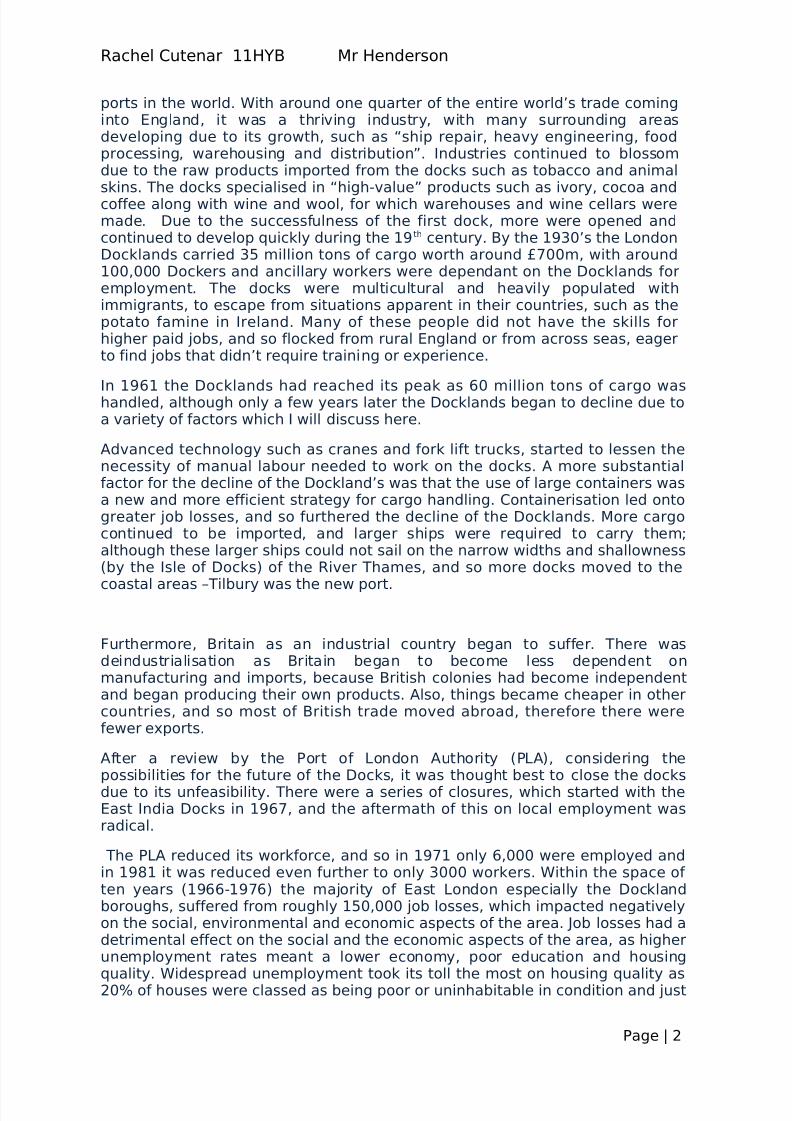
In London, they are situated in the Isle
of Dogs, to the east of the capital.
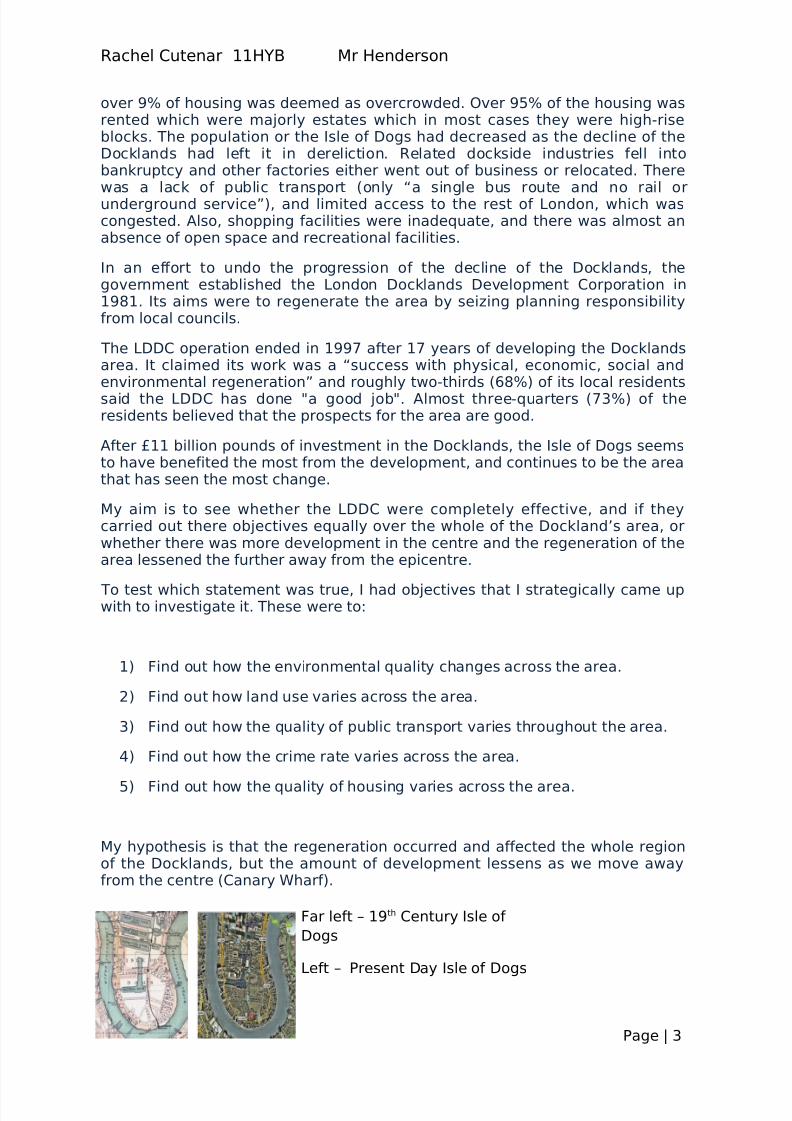
The Docks are located at the largest
meander of the river Thames, and the
Dockland boroughs are Tower Hamlets,
Newham, Southwark, Lewisham and
Greenwich.
8/3/2019 The Developments in the London Docklands Have Changed the Characteristics of the Whole Area
http://slidepdf.com/reader/full/the-developments-in-the-london-docklands-have-changed-the-characteristics-of 2/18
Rachel Cutenar 11HYB Mr Henderson
ports in the world. With around one quarter of the entire world’s trade cominginto England, it was a thriving industry, with many surrounding areasdeveloping due to its growth, such as “ship repair, heavy engineering, foodprocessing, warehousing and distribution”. Industries continued to blossomdue to the raw products imported from the docks such as tobacco and animal
skins. The docks specialised in “high-value” products such as ivory, cocoa andcoffee along with wine and wool, for which warehouses and wine cellars weremade. Due to the successfulness of the first dock, more were opened andcontinued to develop quickly during the 19 th century. By the 1930’s the LondonDocklands carried 35 million tons of cargo worth around £700m, with around100,000 Dockers and ancillary workers were dependant on the Docklands foremployment. The docks were multicultural and heavily populated withimmigrants, to escape from situations apparent in their countries, such as thepotato famine in Ireland. Many of these people did not have the skills forhigher paid jobs, and so flocked from rural England or from across seas, eagerto find jobs that didn’t require training or experience.
In 1961 the Docklands had reached its peak as 60 million tons of cargo washandled, although only a few years later the Docklands began to decline due toa variety of factors which I will discuss here.
Advanced technology such as cranes and fork lift trucks, started to lessen thenecessity of manual labour needed to work on the docks. A more substantialfactor for the decline of the Dockland’s was that the use of large containers wasa new and more efficient strategy for cargo handling. Containerisation led ontogreater job losses, and so furthered the decline of the Docklands. More cargocontinued to be imported, and larger ships were required to carry them;although these larger ships could not sail on the narrow widths and shallowness(by the Isle of Docks) of the River Thames, and so more docks moved to the
coastal areas –Tilbury was the new port.
Furthermore, Britain as an industrial country began to suffer. There wasdeindustrialisation as Britain began to become less dependent onmanufacturing and imports, because British colonies had become independentand began producing their own products. Also, things became cheaper in othercountries, and so most of British trade moved abroad, therefore there werefewer exports.
After a review by the Port of London Authority (PLA), considering the
possibilities for the future of the Docks, it was thought best to close the docksdue to its unfeasibility. There were a series of closures, which started with theEast India Docks in 1967, and the aftermath of this on local employment wasradical.
The PLA reduced its workforce, and so in 1971 only 6,000 were employed andin 1981 it was reduced even further to only 3000 workers. Within the space of ten years (1966-1976) the majority of East London especially the Docklandboroughs, suffered from roughly 150,000 job losses, which impacted negativelyon the social, environmental and economic aspects of the area. Job losses had adetrimental effect on the social and the economic aspects of the area, as higherunemployment rates meant a lower economy, poor education and housing
quality. Widespread unemployment took its toll the most on housing quality as20% of houses were classed as being poor or uninhabitable in condition and just
Page | 2
8/3/2019 The Developments in the London Docklands Have Changed the Characteristics of the Whole Area
http://slidepdf.com/reader/full/the-developments-in-the-london-docklands-have-changed-the-characteristics-of 3/18
Rachel Cutenar 11HYB Mr Henderson
over 9% of housing was deemed as overcrowded. Over 95% of the housing wasrented which were majorly estates which in most cases they were high-riseblocks. The population or the Isle of Dogs had decreased as the decline of theDocklands had left it in dereliction. Related dockside industries fell intobankruptcy and other factories either went out of business or relocated. There
was a lack of public transport (only “a single bus route and no rail orunderground service”), and limited access to the rest of London, which wascongested. Also, shopping facilities were inadequate, and there was almost anabsence of open space and recreational facilities.
In an effort to undo the progression of the decline of the Docklands, thegovernment established the London Docklands Development Corporation in1981. Its aims were to regenerate the area by seizing planning responsibilityfrom local councils.
The LDDC operation ended in 1997 after 17 years of developing the Docklandsarea. It claimed its work was a “success with physical, economic, social andenvironmental regeneration” and roughly two-thirds (68%) of its local residentssaid the LDDC has done "a good job". Almost three-quarters (73%) of theresidents believed that the prospects for the area are good.
After £11 billion pounds of investment in the Docklands, the Isle of Dogs seemsto have benefited the most from the development, and continues to be the areathat has seen the most change.
My aim is to see whether the LDDC were completely effective, and if theycarried out there objectives equally over the whole of the Dockland’s area, orwhether there was more development in the centre and the regeneration of thearea lessened the further away from the epicentre.
To test which statement was true, I had objectives that I strategically came upwith to investigate it. These were to:
1) Find out how the environmental quality changes across the area.
2) Find out how land use varies across the area.
3) Find out how the quality of public transport varies throughout the area.
4) Find out how the crime rate varies across the area.
5) Find out how the quality of housing varies across the area.
My hypothesis is that the regeneration occurred and affected the whole regionof the Docklands, but the amount of development lessens as we move awayfrom the centre (Canary Wharf).
Page | 3
Far left – 19th Century Isle of
Dogs
Left – Present Day Isle of Dogs

8/3/2019 The Developments in the London Docklands Have Changed the Characteristics of the Whole Area
http://slidepdf.com/reader/full/the-developments-in-the-london-docklands-have-changed-the-characteristics-of 4/18
Rachel Cutenar 11HYB Mr Henderson
Methodology
The aim of this research project was to find out if development andregeneration of the docklands was equal in all areas. We visited four different
locations: Island Gardens, Mud Chute, Canary wharf and Cross Harbour.
I tested environmental quality to see the effects of the LDDC, for example if there were still a lot of derelict land in undeveloped places of the Docklands, if the roads were still congested, if there was air pollution (lots of smog aboveroads) if there was still lots of litter etc. This would show me how muchdevelopment had gone into the area, as if there was lots of litter, and the areawas generally not in a good state, it shows there had not been muchregeneration. Also, to see how much money was being put into each area forthe cleaning and maintenance.
I tested land use to see whether land had been developed from derelict brown
field sites to built up areas of accommodation, office blocks etc. This wouldshow if there had been equal regeneration in all parts of the Docklands,because if there larger quantities of derelict land in one part of the Docklandsthan another, then it had not received as much development as one that didn’t.
The quality of transport would show how accessible an area of the Docklands is,and how it varies throughout it. More transport links would suggest that moreregeneration had happened.
More crime in different areas of the Docklands could link to poor security andpoor quality housing; it could also link in with lower education standards, andemployment rates. Less regeneration would result in more crime.
Housing quality would show how developed an area was and how it varies as wemoved into different areas of the Docklands. Poor housing quality, such asovercrowding, and broken windows etc, would indicate less regeneration.
Our first objective was to “see how land use varies in the Docklands”. I used
this objective to show how developed the area had become, for example in the
1970’s (the period when the Docklands were most destitute) most places at
Canary Wharf were Brownfield sites. Thirty years later, it is now one of the
most modern parts of the city. We can see from our land use map how much
regeneration has taken place by the amount of commercial, and retail land
there is, and also how much of the land is still a Brownfield sites. Lots of greenspace and Brownfield sites, without many links of public transportation indicates
less redevelopment, and so I can compare this on my map. Our method was a
land use map. A land use map shows an aerial plot of land that you wish to
survey, and through use of colour, it categorizes land use.
Firstly I located myself on the map, and then pin-pointed the buildings around
us, and according to what it was used for, coloured it in according to the key I
had made before. For example if I found a block of luxury flats, I would colour
the building in orange – which represented residential on my key.
To carry out the land use map I used convenience sampling – I simply recordedthe details of the use of each building/space as we passed them whilst walking.
Page | 4

8/3/2019 The Developments in the London Docklands Have Changed the Characteristics of the Whole Area
http://slidepdf.com/reader/full/the-developments-in-the-london-docklands-have-changed-the-characteristics-of 5/18
Rachel Cutenar 11HYB Mr Henderson
I used secondary sources such as the internet to fill out the rest of the map. I
thought that a land use map was the most fitting method for our
objective, because it is very visual and it is easy to compare the uses of
land at the four different sites It was also practical as we would be
passing many buildings and it would be time efficient if we just colouredthe according squares on the map.
With a land use map we can clearly see whether an area is more developed or
not. The disadvantages are that you cannot record multi-purpose buildings
(such as flats over a retail shop), as only one colour can be used for each
building. Also, the map I was given was outdated, for all the roads were not
marked on it. Despite its inadequacies, the land use map was still an effective
way to express my objective.
A blank land- use map
My next objective was to “find out if the quality of
housing varied throughout the Docklands”. For this I used a Housing Survey
table. This was a simple table that assessed the “score” of a house based on
the ratings that we gave it. The better the “score” the better condition it was in.
Houses got assessed in six fields: damaged roof tiles, broken windows, litter,brickwork, paint work and security. We would give a rating in each of these
areas – the lower the rating the better the score e.g. 1 being the highest 10
being lowest. I used systematic sampling for this, as soon as we stepped off of
the DLR we walked in a northerly direction for 5 minutes and then rated one in
three houses that we passed and rating 5 in total. We did this for every site that
we visited to make our results fair, because it allowed us to see the variety in all
the houses. Choosing consecutive houses would result in all of my data fairly
similar – which would make my results inaccurate as it is not a fair
representation of each area.
I chose the housing survey table because it was easy to compare the scores, ona graph as the numbers were simple. It was also very easy to fill out while I was
on the move, and the categories that we chose to assess the houses in were
effective in carrying out our aim to find out if the quality of houses varies
throughout the Docklands. Whilst surveying the houses I also took pictures and
compared them to see the difference in size and predicted size.
I used a secondary method to back up my results, as I looked on the internet for
house prices in each area, and at estate agents in the area. The higher the
house price, usually the better quality it was, as it has more space, more rooms
etc. Also, the higher the house price the more likely it was that the surrounding
Page | 5

8/3/2019 The Developments in the London Docklands Have Changed the Characteristics of the Whole Area
http://slidepdf.com/reader/full/the-developments-in-the-london-docklands-have-changed-the-characteristics-of 6/18
Rachel Cutenar 11HYB Mr Henderson
area was desirable, and so I could also cross-reference with environmental
quality.
Blank Housing Survey
Table
Estate Agent in Cross
Harbour
I backed up this information by using
the internet to look for break-ins in
each area of the Docklands, this would
show the security of the houses and
would also tie in with crime rates.
One of our methods was the Traffic
count to correspond to the aim “the
quality of public transport varies
throughout the area”. I carried out the
traffic count by using a tally chart to record the number of different modes of
transport that went by us. For this I used convenience sampling - I took the
nearest main road from the DLR Station and recorded the data. To make it more
accurate we took the same amount of time (5 minutes at each road).
I used the tally chart because it was a simple yet effective way to compare the
variety of public transport in each area. It was quick to complete and the data
could be manipulated easily from it.
Another objective was to test
environmental quality throughout
the Docklands. I tested
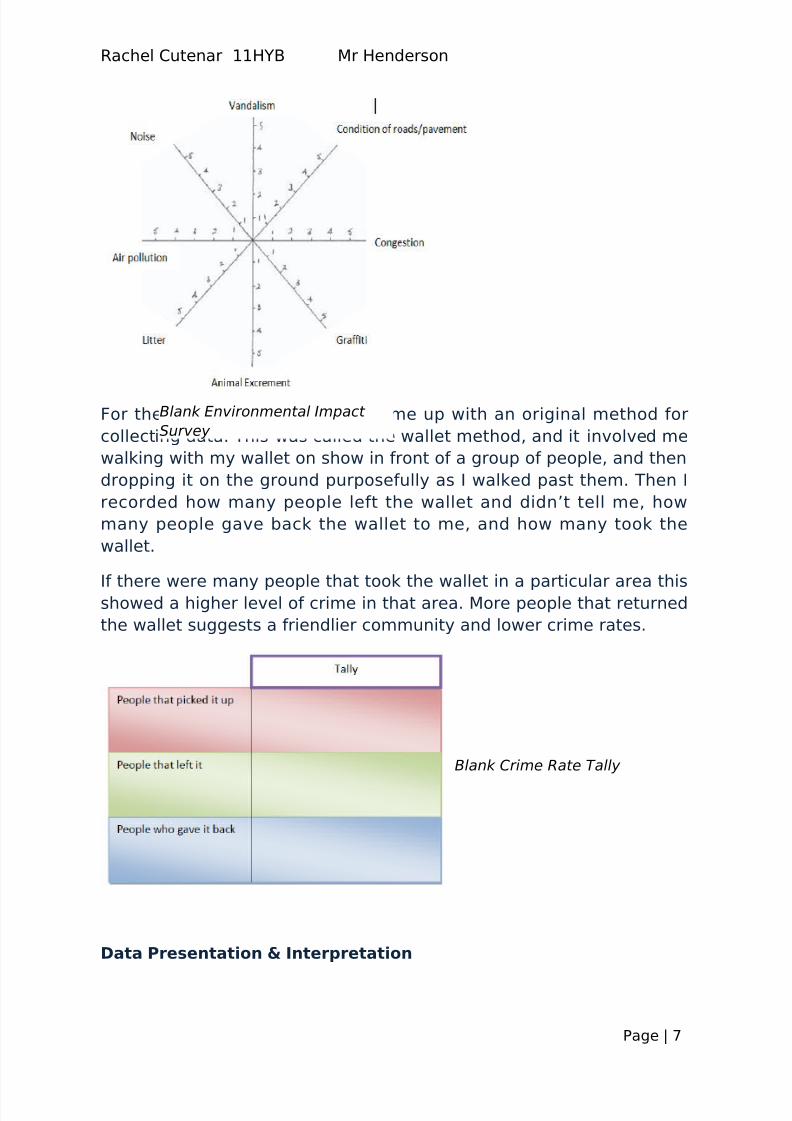
environmental quality using an environmental impact survey, and also I carried
out a questionnaire which linked to it. It was a simple star diagram, with 5 being
the highest and 1 being the lowest.
Page | 6
HouseNumber
1 2 3 4 5
Damagedroof
Brokenwindows
Litter
Brickwork
Paintwork
Security
I carried this out b
completing the star diagramafter I had seen the whole
area for the set amount o
time. This allowed me to go
through each area and get a
full picture of it, and then take
the average. I found the star
diagram was appropriate for
the objective because it goes
on public opinion of how the
find the environment. It wouldbe my opinion that would sa
whether an area was noisy or
congested, and altogether it is
the public’s opinion and
evidence that decides if a part
of the Docklands has been
Blank Traffic Count Table
8/3/2019 The Developments in the London Docklands Have Changed the Characteristics of the Whole Area
http://slidepdf.com/reader/full/the-developments-in-the-london-docklands-have-changed-the-characteristics-of 7/18
Rachel Cutenar 11HYB Mr Henderson
For the crime rates objective I came up with an original method for
collecting data. This was called the wallet method, and it involved me
walking with my wallet on show in front of a group of people, and then
dropping it on the ground purposefully as I walked past them. Then I
recorded how many people left the wallet and didn’t tell me, how
many people gave back the wallet to me, and how many took the
wallet.
If there were many people that took the wallet in a particular area thisshowed a higher level of crime in that area. More people that returned
the wallet suggests a friendlier community and lower crime rates.
Data Presentation & Interpretation
Page | 7
Blank Environmental Impact
Survey
Blank Crime Rate Tally
8/3/2019 The Developments in the London Docklands Have Changed the Characteristics of the Whole Area
http://slidepdf.com/reader/full/the-developments-in-the-london-docklands-have-changed-the-characteristics-of 8/18
Rachel Cutenar 11HYB Mr Henderson
The first objective was to see how land use varied throughout the
Docklands. I used my land use map for primary research methods and
also took pictures for examples of types of land use in different areas. For
secondary research I looked at a virtual land use map, and also the
amount of housing in different areas. From this I made a graph which Isuper-imposed on the images to compare the different things land is
used for in different areas.
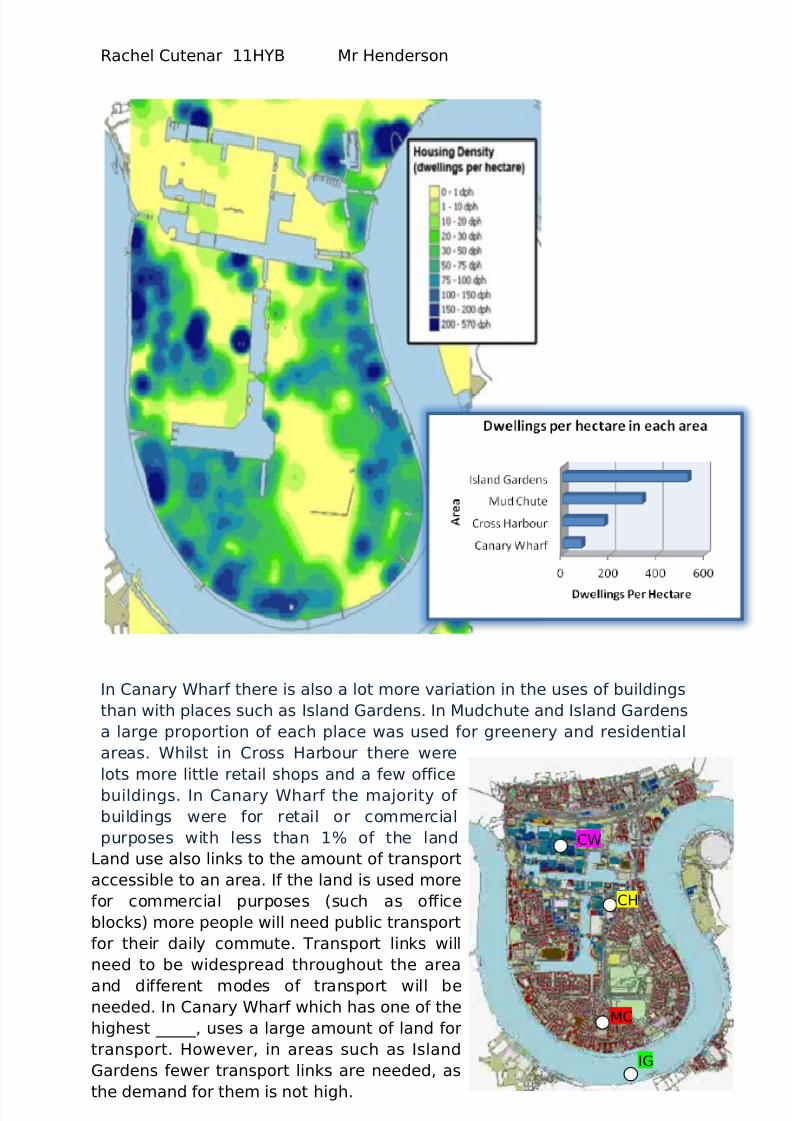
The coloured in land use map shows the trend of a lot more residential
areas as we move further and further from Canary Wharf. This is also
backed up by the chloropleth map which shows the concentration of
dwellings per hectare is increased the further we move away from
Canary Wharf.
I took the averages of the data from each area (by using the midpointfrom each data set) to compare how much of the area is used for
residential purposes. From the graph you can see that the amount of
residential dwellings increases considerably the further out from Canary
Wharf the area is. For example almost seven times as much land is used
for dwellings in Island Gardens than in Canary Wharf. This links to the
overall history of the regeneration of the Docklands, because in the 60’s
when the docklands were first closed the majority of workers were on low
incomes, and when new luxury flats were built in Canary Wharf they
could not afford the rent and so looked elsewhere for homes. In
Mudchute and Island Gardens priority was given to re-house residents
after the regeneration, and the most residential areas can be seen here.
Most of the workers that resettled in areas such as Island Gardens and
Mudchute were not very educated and so could not carry out the office
jobs in the city, this lack of education also links to the high crime rates
we see in this area which I will speak of later.
As there is a lot of residential areas further away from Canary Wharf this
shows that less development has taken place there because this requires
less money and will generate less money in the long term, because mostof the people were being re-housed rather than buying from new.
However in Canary Wharf a lot more money was put into creating office
spaces (which generates income from letting) and retail shops/public
spaces which would increase the numbers of people visiting –thus
increasing the local economy.
Page | 8
8/3/2019 The Developments in the London Docklands Have Changed the Characteristics of the Whole Area
http://slidepdf.com/reader/full/the-developments-in-the-london-docklands-have-changed-the-characteristics-of 9/18
Rachel Cutenar 11HYB Mr Henderson
In Canary Wharf there is also a lot more variation in the uses of buildings
than with places such as Island Gardens. In Mudchute and Island Gardens
a large proportion of each place was used for greenery and residential
areas. Whilst in Cross Harbour there were
lots more little retail shops and a few officebuildings. In Canary Wharf the majority of
buildings were for retail or commercial
purposes with less than 1% of the land
being used for open green spaces.
Differentiation between building use is most
noted at Canary Wharf as there are office
blocks to supermarkets and police stations
there.
The retail spaces in Canary Wharf, I noticedto be aimed at a particular target group –
Page | 9
IG
CW
CH
MC
Land use also links to the amount of transport
accessible to an area. If the land is used more
for commercial purposes (such as office
blocks) more people will need public transport
for their daily commute. Transport links will
need to be widespread throughout the area
and different modes of transport will be
needed. In Canary Wharf which has one of the
highest _____, uses a large amount of land for
transport. However, in areas such as Island
Gardens fewer transport links are needed, as
the demand for them is not high.

8/3/2019 The Developments in the London Docklands Have Changed the Characteristics of the Whole Area
http://slidepdf.com/reader/full/the-developments-in-the-london-docklands-have-changed-the-characteristics-of 10/18
Rachel Cutenar 11HYB Mr Henderson
city workers /business people, and prices were considerably higher within
these shops than in retail places in Mudchute. I took different pictures of
different types of land use.
In accordance with the objective I
researched on the internet to see the
amount of derelict land there was
before the London Docklands
Development Corporation regenerated
the area. In July 1981, the Isle of Dogs
had 200 hectares (ha) of derelict land –
the second most deprived area in the
Docklands. The largest of the fourplaces with derelict land is Canary
Wharf with Island Gardens with the
least. This shows that more
regeneration was needed in the Canary
Wharf area. Development occurred
throughout the Docklands although
more happened in the Canary Wharf
region because it was needed.
Page | 10
Residential Office
MixedOpen
Commerci
Retail Leisure
Local
Office

8/3/2019 The Developments in the London Docklands Have Changed the Characteristics of the Whole Area
http://slidepdf.com/reader/full/the-developments-in-the-london-docklands-have-changed-the-characteristics-of 11/18
Rachel Cutenar 11HYB Mr Henderson
In 1997 - once the development had
finished the land use map now looked
like this. None of the land was vacant
or not used, and the LDDC was
successful in its regeneration plans.Canary Wharf went through the most
changes at it went from derelict land to
be used for business, as we can see
from the photographs through the years.
Page | 11
Canary Wharf
1982 1985 19861987
1993 1996

8/3/2019 The Developments in the London Docklands Have Changed the Characteristics of the Whole Area
http://slidepdf.com/reader/full/the-developments-in-the-london-docklands-have-changed-the-characteristics-of 12/18
Rachel Cutenar 11HYB Mr Henderson
transport to Island Gardens had the least frequent. Canary Wharf also
had the highest form of private transport (taxis). This links to the daily
commute to work in Canary Wharf, most people using the transport were
from out of town and trying to get work in the city centre. Most of these
jobs were tertiary and were usually high paid, which links strongly tohouse prices in different areas. Most city dwellers can afford the luxury
flats in Canary Wharf due to their large salaries.
In accordance to the objective to see whether LDDC
actually made a difference to the whole Docklands area I
looked at the state of the transport before theregeneration. In 1980 there was no connection to the city
centre and public transport was virtually non-existent
throughout all areas of the Isle of Dogs. Transport
investment was priority of land development and
throughout a series of instalments public transport was
drastically improved. There was bus routes from the
Isle of Dogs to connect to the London underground
implemented, and in 1982 the Docklands Light
Railway was introduced. The shuttle bus was
improved by almost tripling its passenger capacity
(5000 to 12,000) and increasing its frequency from
every 5 minutes to every 15 minutes. The bus went
through the whole of the docklands so it improved
transport links in all area.
The DLR dramatically improved the public transport for the Isle of Dogs,
but it runs more frequently in the Canary Wharf and
Cross Harbour regions.
Page | 12
1980 Transport
Route of
“Clipper”
DLR Route Map
DLR at Canary
8/3/2019 The Developments in the London Docklands Have Changed the Characteristics of the Whole Area
http://slidepdf.com/reader/full/the-developments-in-the-london-docklands-have-changed-the-characteristics-of 13/18
Rachel Cutenar 11HYB Mr Henderson
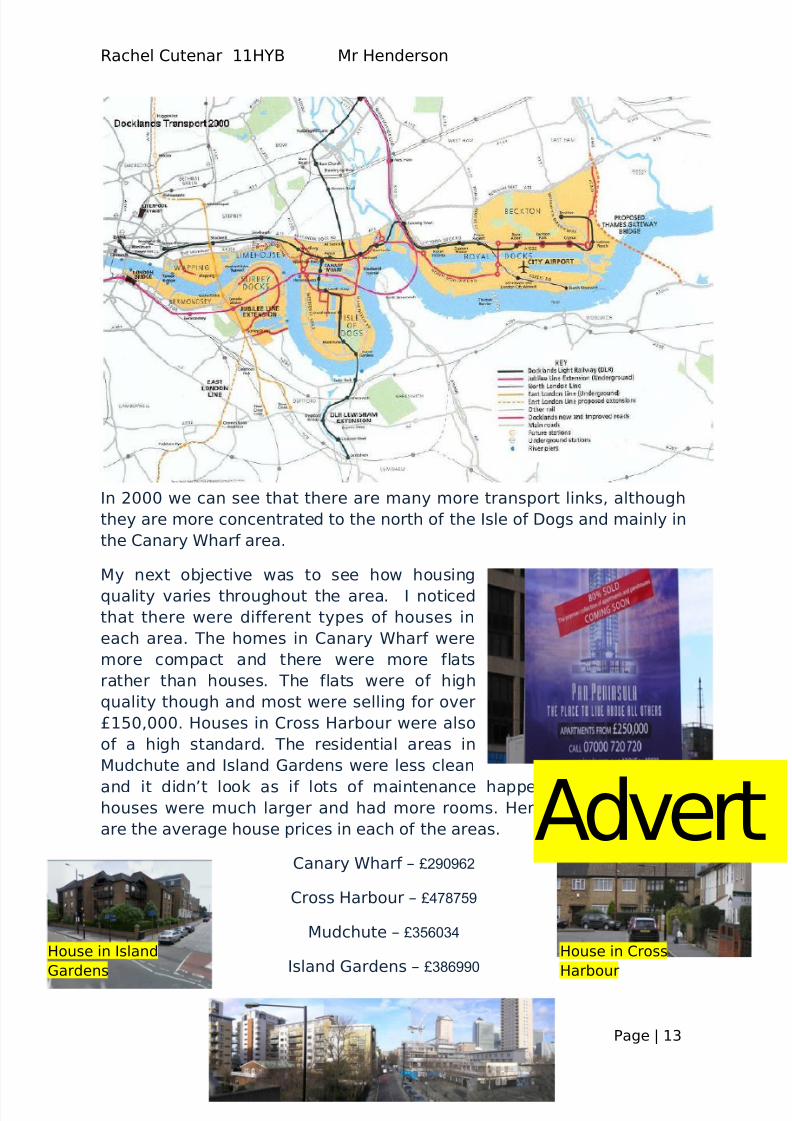
In 2000 we can see that there are many more transport links, although
they are more concentrated to the north of the Isle of Dogs and mainly in
the Canary Wharf area.
My next objective was to see how housing
quality varies throughout the area. I noticed
that there were different types of houses in
each area. The homes in Canary Wharf were
more compact and there were more flats
rather than houses. The flats were of high
quality though and most were selling for over
£150,000. Houses in Cross Harbour were also
of a high standard. The residential areas in
Mudchute and Island Gardens were less clean
and it didn’t look as if lots of maintenance happened, although thehouses were much larger and had more rooms. Here
are the average house prices in each of the areas.
Canary Wharf – £290962
Cross Harbour – £478759
Mudchute – £356034
Island Gardens – £386990
Page | 13
Advert
House in Island
Gardens
House in Cross
Harbour

8/3/2019 The Developments in the London Docklands Have Changed the Characteristics of the Whole Area
http://slidepdf.com/reader/full/the-developments-in-the-london-docklands-have-changed-the-characteristics-of 14/18
Rachel Cutenar 11HYB Mr Henderson
When taking house prices into consideration, location can hoist up the
value of a house. Since Canary Wharf is a desirable area to live in, and is
close to the city centre house prices would inevitably be high.
Canary Wharf
Cross Harbour
Mudchute
Houses were of good quality and
most were well secured. The
Page | 14
HouseNumber
1 2 3 4 5
Damaged roof
1 1 1 1 1
Brokenwindows
2 1 1 2 1
Litter 3 2 2 1 2
Brickwork
1 1 3 1 1
Paintwork
1 1 4 1 1
Security
1 1 1 1 2
HouseNumber
1 2 3 4 5
Damaged roof
1 2 2 1 1
Brokenwindows
3 2 7 2 1
Litter 5 2 8 4 3
Brickwork
4 2 6 2 1
Paintwork
3 3 7 2 3
Security
2 1 7 1 2
HouseNumber
1 2 3 4 5
Damaged roof
1 1 4 1 1
Brokenwindo
ws
2 2 3 2 2
Litter 4 2 2 1 3
Brickwork
1 2 3 1 1
Paintwork
5 2 4 2 2
Security
1 2 2 3 2
1- Good 10- Bad
Mudcute landscape
The housing conditions in Cross
Harbour were poor, but as I wen
around it looked as if they wer
getting developed once again, as
there was lots of scaffolding about.
There was also a lot of litter strewn
about
dwelling density.
There was hardly any residential
areas in Canary Wharf, although
the of the house and flats that
there were, they were of an
extremely high standard, and
many was labelled “luxury”.
Security in this area was very high,
and I noticed some gated flats with
8/3/2019 The Developments in the London Docklands Have Changed the Characteristics of the Whole Area
http://slidepdf.com/reader/full/the-developments-in-the-london-docklands-have-changed-the-characteristics-of 15/18
Rachel Cutenar 11HYB Mr Henderson
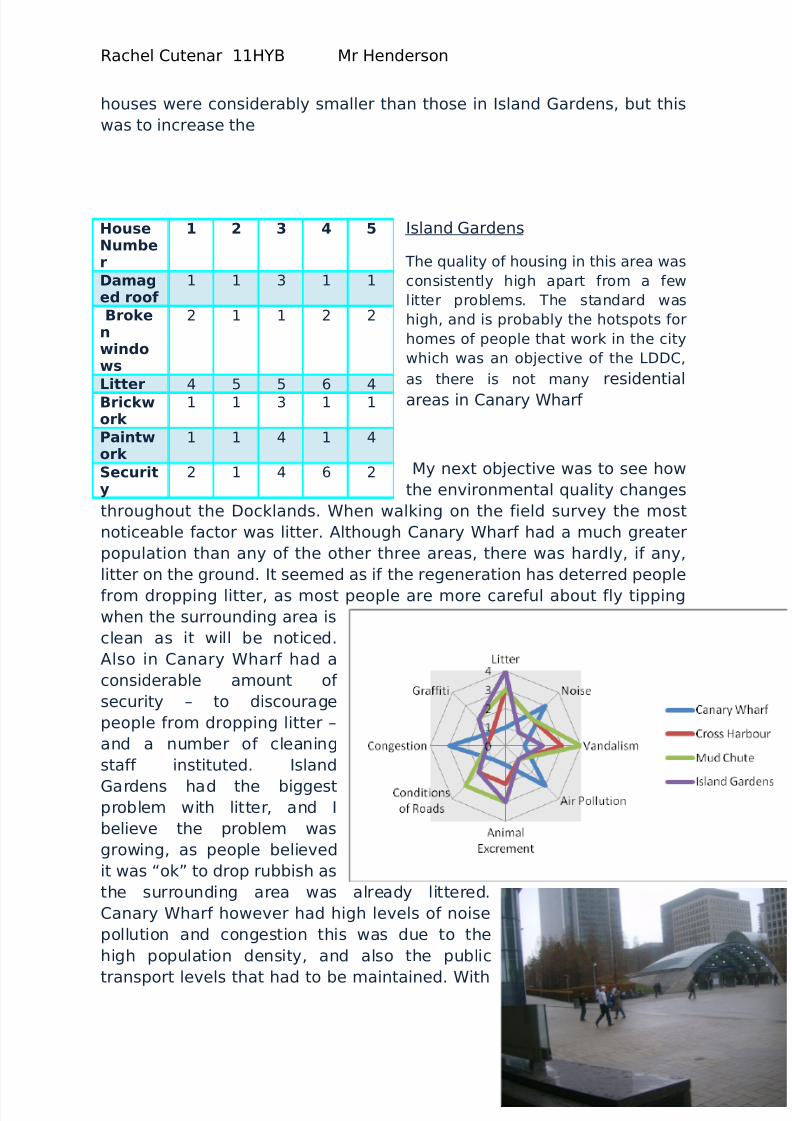
houses were considerably smaller than those in Island Gardens, but this
was to increase the
Island Gardens
The quality of housing in this area was
consistently high apart from a few
litter problems. The standard was
high, and is probably the hotspots for
homes of people that work in the city
which was an objective of the LDDC,
as there is not many residential
areas in Canary Wharf
My next objective was to see how
the environmental quality changes
throughout the Docklands. When walking on the field survey the most
noticeable factor was litter. Although Canary Wharf had a much greater
population than any of the other three areas, there was hardly, if any,
litter on the ground. It seemed as if the regeneration has deterred people
from dropping litter, as most people are more careful about fly tipping
when the surrounding area is
clean as it will be noticed.
Also in Canary Wharf had a
considerable amount of
security – to discourage
people from dropping litter –
and a number of cleaning
staff instituted. Island
Gardens had the biggestproblem with litter, and I
believe the problem was
growing, as people believed
it was “ok” to drop rubbish as
the surrounding area was already littered.
Canary Wharf however had high levels of noise
pollution and congestion this was due to the
high population density, and also the public
transport levels that had to be maintained. With
Page | 15
HouseNumber
1 2 3 4 5
Damaged roof
1 1 3 1 1
Brokenwindows
2 1 1 2 2
Litter 4 5 5 6 4Brickwork
1 1 3 1 1
Paintwork
1 1 4 1 4
Security
2 1 4 6 2
8/3/2019 The Developments in the London Docklands Have Changed the Characteristics of the Whole Area
http://slidepdf.com/reader/full/the-developments-in-the-london-docklands-have-changed-the-characteristics-of 16/18
Rachel Cutenar 11HYB Mr Henderson
lots of open green space in Mudchute and Island Gardens, there were
also increased animal excrement levels.
Overall, it is clear that in Cross Harbour, Mudchute and Island Gardens
the same amount of funds used for maintenance are not as dispensable
as Canary Wharf’s. This shows that Canary Wharf has generally been
developed more and has sustained its development in the long term by
security and cleaning staff. Although with lots of regeneration, Canary
Wharf has compromised its green space for commercial and retail
purposes, and it has more noise pollution.
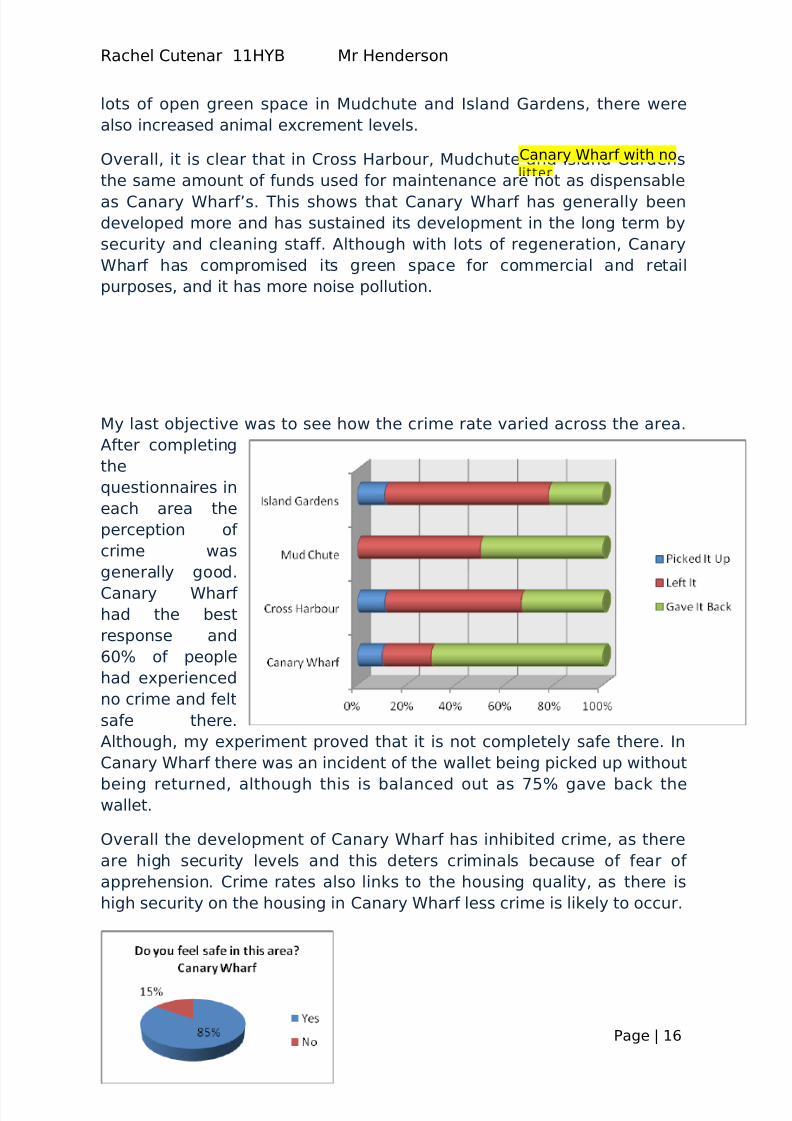
My last objective was to see how the crime rate varied across the area.
After completing
the
questionnaires in
each area the
perception of
crime was
generally good.
Canary Wharf
had the best
response and
60% of people
had experienced
no crime and felt
safe there.
Although, my experiment proved that it is not completely safe there. In
Canary Wharf there was an incident of the wallet being picked up without
being returned, although this is balanced out as 75% gave back thewallet.
Overall the development of Canary Wharf has inhibited crime, as there
are high security levels and this deters criminals because of fear of
apprehension. Crime rates also links to the housing quality, as there is
high security on the housing in Canary Wharf less crime is likely to occur.
Page | 16
Canary Wharf with no

8/3/2019 The Developments in the London Docklands Have Changed the Characteristics of the Whole Area
http://slidepdf.com/reader/full/the-developments-in-the-london-docklands-have-changed-the-characteristics-of 17/18
Rachel Cutenar 11HYB Mr Henderson
In conclusion, from the analysis of the data I collected on my field work
assignment, redevelopment is apparent throughout the whole of the
Docklands area, although Canary Wharf is where the area is most
improved. My hypothesis was the negative of this statement as I said
that development “lessens as we move away from the centre (Canary
Wharf)”. There is strong evidence of this throughout my results – although the
entire Docklands area has been changed for the better, more development has
happened in Canary Wharf. This development had different effects, most good,
although there were repercussions such as noise pollution.
Evaluation
Overall my fieldwork project was a success, as I managed to prove my
hypothesis without much difficulty. However I realise that the accuracy of my
results aren’t as they should be due to limiting factors such as time constraintsetc.
When colouring my land use map I couldn’t colour every building as it wasn’t
either very clear what the building was, or there wasn’t time to stop. This would
give unreliable results as some of the results could not be recorded and so not
give a full picture of the full range of land uses in an area. When comparing one
area to another one may seem to be more developed and have more residential
areas/office blocks, when in fact the other area didn’t have enough colouring.
The housing survey was little inaccurate, because the ratings were based on our
own opinions, for example my idea of a house with good security could be aburglar alarm, with a mortise lock and so I would give it a good score however
Page | 17

8/3/2019 The Developments in the London Docklands Have Changed the Characteristics of the Whole Area
http://slidepdf.com/reader/full/the-developments-in-the-london-docklands-have-changed-the-characteristics-of 18/18
Rachel Cutenar 11HYB Mr Henderson
someone else’s view of security could differ from this and so give the house a
lower score. My conclusions are still valid, because I proved this from people’s
views on the housing in their area in my questionnaire, and also looked at
house prices in the areas.
My questionnaire may have been unreliable because too few were given out. This is due to not enough people wanting to participate in completing one. This
especially occurred in Canary Wharf where I was greeted with “Sorry I’m
running late”, or “I’m busy at the moment”, although I think this reflected the
nature of the area. Also, I could only survey a select amount of residents and
this meant that not all age ranges were included. I did not come across any 65+
residents of the Isle of Dogs to give my questionnaire out to.
The traffic count worked well, although it was slightly unreliable because we
had to carry out the survey at different times. This was important because it
may look as if an area had good transport links in the morning rush hour
compared to an area when we conducted the survey in the early afternoon
when buses/trains etc don’t run as regularly. My overall conclusion was valid
because I looked at the amount of public transport in each of the locations, and
also used quotes from my questionnaire, and interview with staff from the TFL
team.
If I was to carry out the project again I would visit the site for longer and on two
separate occasions to make the results more reliable and accurate. Having
more time would enable me to gather more information and I would also add
more criteria for the environmental impact survey to give a broader base for
drawing conclusion.
Page | 18