Embed Size (px)
Citation preview

This rrtlcle assesses the recent dlffu- sion of new telecommunication tech- nologies. Drawing upon an historical framework, the authors find that new technologies face significant barriers to rapid penetration In the home and office. Data on cable tekvislon, electro- nic text sewkes, teleconferencing and alternative video distribution technolo- gies are analysed to highlight the con- stmints facing the growth of new tele- communications serviw.
Keywords: Telecommunications technolo- gy; Diffusion; Policy
John Carey is Director of Greystone Com- munications, 17 Bellair Drive, Dobbs Ferry, New York 10522, USA (Tel: 914 693- 2535). Mftchell Moss is Associate Profes- sor of Planning and Public Administration, Graduate School of Public Administration, New York University, 4 Washington Square North, New York, NY 10003, USA.
This article is based upon research sup- ported by the Corporation for Public Broad- casting. Any opinions, findings, or gener- alities expressed in this article are those of the authors and do not necessarily repre- sent those of the sponsoring agency. An earlier version of the research appeared in the report, New Telecommunications Technotogies and Public Broadcasting, Corporation for Public Broadcasting, Washington, DC, 1964.
‘For the seminal analysis of the diffusion of technology see Everett M. Rogers, Diffu- sion of Innovations. Free Press, 1962.
The diffusion of new telecommunication technologies
John Carey and Mitchell L. Moss
Almost all new telecommunications technologies are introduced as if they were sure-fire successes, as if a mass market was eagerly waiting for each new product or service. In fact, instant success is the exception, not the rule, in many of the new telecommunications services. This article examines the process of market penetration and diffusion in telecom- munications technologies and provides an historical perspective on the growth of new communications services. Drawing upon recent experi- ence with cable television, teleconferencing, and electronic text services, the article analyses the economic and technological constraints on the rapid diffusion of new telecommunications technologies.
Any assessment of new telecommunications services must distinguish between those technologies which merely represent the substitution of a new type of equipment for another and those technologies which require a substantial change in the behaviour of the user. In many cases, both equipment replacement and skills upgrading occur simultaneously. For example, the word processor is often the replacement for the typewriter but also requires substantial training for the user. The colour television represented a technological substitution, which required no behavioural change by the user, other than the act of purchasing. The use of a videocassette recorder (VCR) may result in behavioural changes in television viewing, but essentially builds upon existing skills and interests in television and/or movies.
It may be argued that a new telecommunications service must meet three criteria in order to achieve widespread acceptance: it must be cost-competitive with other ways of doing things; it must be compatible with users’ skills as well as their work or home environment; and, it must provide a specific service concept which the user values. The proliferation of new products in the telecommunications field is intensifying marketplace competition among new communications services. Yet, our understanding of the organizational, economic and technological constraints that influence the diffusion of new services has not kept pace with advances in technology.’ This article demonstrates the value of using an historical context in planning new telecommunica- tions services and understanding the diffusion process.
0306-5961/65/020145-14S3.00 @ 1965 Buttemorth & Co (Publishers) Ltd 145

The diffusion of new telecommunication technologies
Table 1. Market penetration of established medta.
Years to reach 59% US Media household penetration
Newspapers 100+ Telephone 70 Phonograph 55 Radio 10 Black and white TV 10
Source: Sterling and Haight, see text, op cir, Ret 2.
*Christopher Sterling and Timothy Haight, The Mass Media: Aspen institute Guide to Communication Industry Trends, Praeger Publishers, New York, 1979. %hiel de Sola Pool, ed, The Social Im- pacts of the Telephone, MIT Press, Cam- bridge, 1977. 4Leo Bogart, Press and Public, Lawrence Erlbaum Associates, Hillsdale, NJ, 1981.
Sources: Electronic Industries Association; Cablevision; The New York Times.
146 TELECOMMUNICATIONS POLICY June 1985
Establishing a baseline
In order to assess the development of new technologies, it is useful to establish a baseline against which to measure growth. For this analysis, a baseline has been constructed with two components: historical develop- ment and growth of established media such as newspapers, radio and television; and development of more recently introduced media such as pay television, videocassette recorders and videotex.
Many of the commonplace assumptions about the growth of new communication technologies are based on radio and television, which grew rapidly once they were made available to the public. Most communication technologies that are part of our everyday lives, however, required years to achieve mass penetration. Some of the media that have achieved mass penetration of US households are examined in Table 1. It is evident that most media required several decades to reach a 50% penetration level.2
Although we accept the telephone as a basic component of US households, it was primarily a business tool during its first 50 years of growth.” It was not until after the second world war that most households leased a telephone. Similarly, the newspaper, available since before the American Revolution, was a medium for businesses and a small group of professionals until the latter part of the 19th century. At that time, favourable postal rates for newspapers, increased literacy and advances in printing technology helped the newspaper reach half of all US households.4
Table 2 shows the growth of recent technologies with at least five years exposure on the market. Note that in Table 2 and throughout this report, the base is all US households, not households with television. If one were to use households with television as a base, the percentages would be slightly higher.
It is noteworthy that cable television required 32 years to enter one-third of US households, while VCRs have entered 20% of households in ten years. Both of these technologies are regarded as highly successful, yet their growth patterns are quite different from those of radio and television.
Another useful way to slice the same historical pie is to examine rates of growth during the first five years and then the first ten years of availability. By plotting the development of communication technolo- gies from this perspective, it becomes clear that few telecommunications services experience more than a 100 percent growth rate during each year of the first ten years of availability.
Table 3 suggests a useful baseline against which to compare the growth of a new telecommunications technologies: the mean rate of growth for existing communications services during their introduction to the marketplace. If one includes black and white television in this
Table 2. Market penetration of recent technologies.
Service
Cable TV Pay TV (all forms) Video games Videotex VCR Personal computers
Yearn available to consumers
34 13 10
5 10 9
Penetration of US households January 1985 (%)
39 24 27
0.2 20 15
The diffiuion of new telecommunication technologies
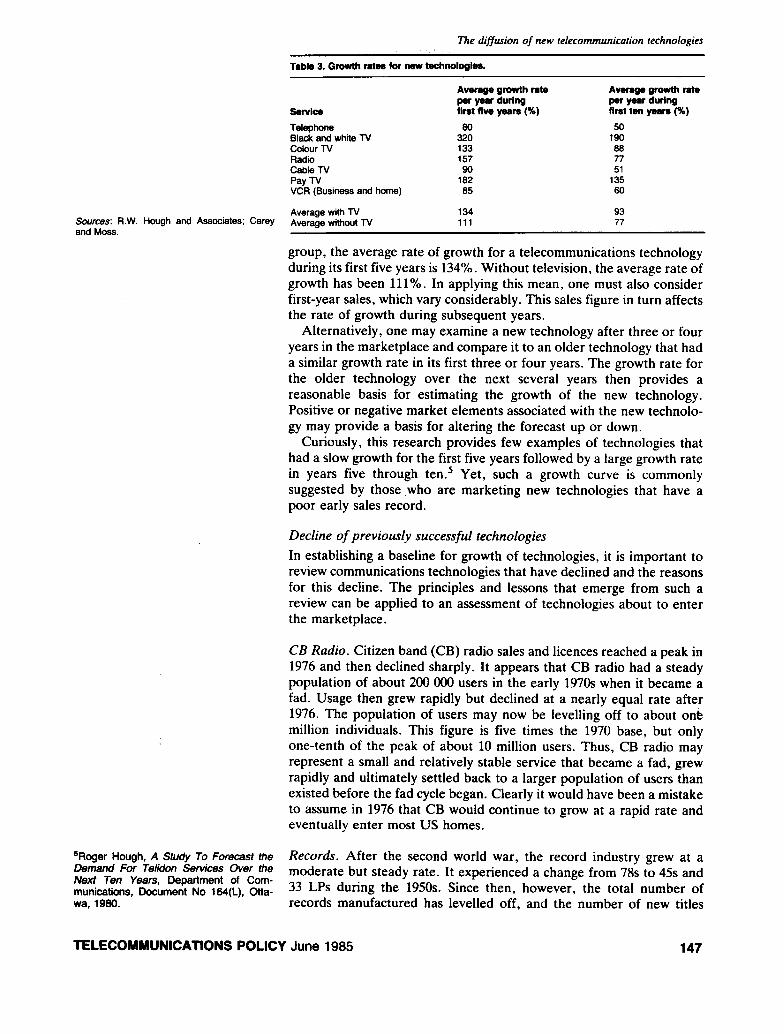
Table 3. Gmwth rates for new technologies.
Sources: R.W. Hough and Associates: Carey and Moss.
5Roger Hough, A Study To Forecast the Demand For Telidon Services Over the P&t Ten Years, Department of Com- munications, Document No 164(L). Otta- wa, 1980.
Bawi# Telephone Black and white N Colour N Radio cable N Pay N VCR (Business and home)
Average with N Average without N
Averqe growth rate Avenge growth rste per yesr during per year during first fiw years (%) first ten years (%)
90 50 320 190 133 88 157 77 90 51
182 135 85 80
134 111
93 77
group, the average rate of growth for a telecommunications technology during its first five years is 134%. Without television, the average rate of growth has been 111%. In applying this mean, one must also consider first-year sales, which vary considerably. This sales figure in turn affects the rate of growth during subsequent years.
Alternatively, one may examine a new technology after three or four years in the marketplace and compare it to an older technology that had a similar growth rate in its first three or four years. The growth rate for the older technology over the next several years then provides a reasonable basis for estimating the growth of the new technology. Positive or negative market elements associated with the new technolo- gy may provide a basis for altering the forecast up or down.
Curiously, this research provides few examples of technologies that had a slow growth for the first five years followed by a large growth rate in years five through ten.5 Yet, such a growth curve is commonly suggested by those who are marketing new technologies that have a poor early sales record.
Decline of previously successful technologies
In establishing a baseline for growth of technologies, it is important to review communications technologies that have declined and the reasons for this decline. The principles and lessons that emerge from such a review can be applied to an assessment of technologies about to enter the marketplace.
CB Radio. Citizen band (CB) radio sales and licences reached a peak in 1976 and then declined sharply. It appears that CB radio had a steady population of about 200 000 users in the early 1970s when it became a fad. Usage then grew rapidly but declined at a nearly equal rate after 1976. The population of users may now be levelling off to about onk million individuals. This figure is five times the 1970 base, but only one-tenth of the peak of about 10 million users. Thus, CB radio may represent a small and relatively stable service that became a fad, grew rapidly and ultimately settled back to a larger population of users than existed before the fad cycle began. Clearly it would have been a mistake to assume in 1976 that CB would continue to grow at a rapid rate and eventually enter most US homes.
Records. After the second world war, the record industry grew at a moderate but steady rate. It experienced a change from 78s to 45s and 33 LPs during the 1950s. Since then, however, the total number of records manufactured has levelled off, and the number of new titles
TELECOMMUNICATIONS POLICY June 1985

The diffusion of new telecommunication technologies
released has declined. The record industry has been affected by growth in the use of cassette tapes; increased competition from non-music products for entertainment dollars; and the absence of technological developments that might generate renewed interest in recordings (quadraphonic sound failed in the marketplace). In 1983-84, the record industry began to show signs of renewed strength. Curiously, the attractiveness of a potential competitor, music videos on cable, led to a short-term benefit for the record industry by encouraging the purchase of recordings of artists who appeared on music videos. In addition, the introduction of the digital audio disc brought public attention to the record industry. It remains unclear, however, whether the record industry is beginning a new cycle of growth or deviating momentarily from a long-term pattern of decline and replacement by digital audio discs.
Instant Cameras. Since their introduction to consumers in the 195Os, instant cameras (Polaroid and later Kodak) grew steadily until 1978, when the market peaked at 13.8 million units sold. Since then sales have declined 10 to 15% per year. It appears that instant cameras have been affected by other popular consumer electronic products such as video games, as well as a general decline in ‘car vacations’ when cameras are used heavily. The instant camera has prospered for too long to be described as a fad. It may represent a technology, like the 78 record, that runs its course in the marketplace and is eventually replaced. Alternatively, it may settle back to a reduced level of usage and remain there for the foreseeable future. It is difficult, however to construct a scenario of continued and rapid growth for instant cameras.
The telegraph represents another technology that ran a long course of development, decline and displacement by another medium - the telephone. In addition, there are strong signs that 8mm and Super 8mm movie cameras are being replaced as a home movie medium by half-inch videocassette and home video cameras.
In general, it appears that technologies decline because they represent a fad, encounter superior competition from new technologies, or lose appeal in a marketplace of abundant choice. In the latter case, people displace money from technology X for technology Y that provides a new service, rather than a competing one.
Outright failures
Among a long list of outright failures, two examples illustrate some important principles that commonly underlie failures in new telecom- munications technologies.
Quadraphonic sound. Four-channel sound, for the consumer market, did not represent an advance in technology. Rather, it represented an application of existing industrial technology (multitrack recording and playback) with a genuine industrial benefit (control of editing) into a home market where no benefit could be demonstrated. In addition, little software was developed for the new system, thus further reducing its appeal to consumers.
Videophone. The market history of the videophone is well known. It provided a superficial benefit (a low resolution image of a person at the
148 TELECOMMUNICATIONS POLICY June 1985

%lichael Nell and James Woods, ‘The use of Picturephone service in a hospital’, Tekommunicetions Policy, Voi 3, No 1, March 1979, pp 29-36.
Source: CableVision. proieciow: Carey and Moss.
The difjiuion of new felecommunication technologies
other end of a phone conversation) that consumers did not want, and it never solved the network problem (a person with a videophone requires a network of other people with videophones). But one of the general lessons associated with the videophone story masks a more fundamental principle: the videophone is often cited as an example of a technology that proved successful in market testing, only to fail in the marketplace. This is not the case. There was abundant evidence in the market testing that it would fail.6 AT&T ignored this evidence because it had already invested many millions of dollars in the product and had attracted enormous public attention. Some of the technologies in the 1980s appear to be in the same position of attracting enormous attention from the trade press while evidence from market trials is decidedly negative.
Comebacks and cyclical technologies
Another class of technologies, including 3-D movies and video teleconferencing, has experienced periodic introduction, decline and reintroduction into the marketplace. Typically, these technologies experience a limited success but do not take hold of a market or grow. After a period of hibernation, some business analysts suggest that the market has become ‘ready’ for the technology and it is reintroduced. In the case of both the 3-D movies of the 1950s and video teleconferencing of the late 1960s and early 197Os, high costs and technical problems or limitations appear to have weakened their chances in the marketplace. But some also argue that the services they offered represented technology push rather than user demand. Recent and renewed interest in 3-D movies and video teleconferencing, along with some resolution of economic and technical problems associated with their use, may provide a basis for better understanding of cyclical technologies.
Specialized cable services
Specialized cable services have attracted enormous attention from both the public and private sectors. This is understandable in light of the growth in cable penetration (more than 39% of US households providing gross revenues of about $2 billion for basic cable services). The early strength of pay cable services is even more noteworthy: a growth rate of 182% in its first five years; more than 24% penetration of US households thirteen years after its introduction; 60% penetration of homes that subscribe to basic cable; and gross revenues over $1 billion for pay channels during 1984.
Our assessment of market penetration for cable suggests strong growth through 1990 (Table 4) despite competition from new technolo- gies in the home such as videocassette recorders. Currently, basic cable subscriptions average $9 to $12 per month. The typical charge for a pay service is $9 to $11. The average home subscribing to cable pays about $20 a month for cable. Our analysis suggests that while basic cable service and pay services will grow, and households will pay more for
Tabk 4. Projactod gtuwth tar basic snd pay wbh through 1999.
BagInnIng 1965 1999 nouss -gs Houss holds (x10”) oftotsl holds(xlCP) !zz-
Basic cable 39 50 51
Pay cable 24 32 32
TELECOMMUNICATIONS POLICY June 1985 149

The diffusion of new telecommunication technologies
‘John Carey, Thomas Gherardi, Harold Kappes and Mitchell Moss, Modularization and Packaging of Public Television Prog- rams, Corporation for Public Broadcasting, Washington, DC, 1983. ‘Hazel Kahan, ‘The cable subscriber speaks: channels, choice or chaos’, Paper presented at the Advertising Research Foundation, New York, December 1983.
150
cable, a realistic projection of per household expenditures on cable is about $30 to $35 per month by 1990, not the $40 to $50 per month some analysts have suggested. Nonetheless, $30 to $35 per month would represents large revenues for cable operators and service providers (about $16 billion per year gross revenue by 1990).
With such large potential revenues available to broadcasters, news- papers and publishers, there has been tremendous momentum toward developing specialized cable services. Since 1976, when three special- ized cable channels were available, the offerings have burgeoned to over 90 specialized channels by the end of 1984. But fewer than 10% of these specialized channels showed a profit in 1984, and several have failed entirely.
Several problems have limited the economic feasibility of specialized cable services. The first is system capacity. In 1985, fewer than half of US cable systems have a capacity of 30 channels or more. The recent construction of several large systems in Boston, Dallas, Cincinnati and Pittsburgh has created a sense of unlimited capacity. However, even these systems have reduced their channel capacity, from more than 100 channels to between 50 and 70 channels. A reasonable estimate is that by 1990 about 20% of cable homes will be wired for 50 or more channels. As a consequence, about 100 specialized cable services in the late 1980s will be competing heavily for limited channels.
In addition, current experience with multiple-tier pay services suggests that of the 60 to 70% of new subscribers who opt for pay services, most limit their choices to one or two pay channels (average 1.8), after an initial period when they try three or four pay channels. There has been resistance to the purchase of more than two pay services on a continuing basis. Fewer than one-third of new cable subscribers can be expected to purchase three or more pay channels on a regular basis.
These figures are sobering if one reviews further the choices of pay subscribers. The overwhelming choice of households that subscribe to one pay service is a movie channel. Of homes subscribing to two pay channels, the overwhelming choices are two movie channels, with a small percentage choosing one movie and one sports channel. Thus, a provider of cultural programming along with all other non-movie, non-sports service providers will be competing for 20 to 30% of cable homes that might subscribe to one of their services - if the system operator carries the channel.
In the period 1982 to 1984, many advertiser supported services, eg CBS Cable and Ted Turner’s music video channel, failed after a brief appearance in the marketplace. The poor performance of most advertiser supported channels has led to a more cautious attitude by many industry groups who were planning new channels.’ At the same time, cable channels have in a slow but cumulative way eroded the audience base for the commercial broadcast networks. If this erosion continues, the economic viability of specialized cable channels may increase. However, it would be difficult to build a scenario in which more than a dozen specialized cable channels with national distribution achieve profitability in the 1980s. Even in those homes that do view cable originated non-network programming, their choices are limited to a few channe1s.s
Leasing
Channel leasing, an option available to many service providers in the
TELECOMMUNICATIONS POLICY June 1985
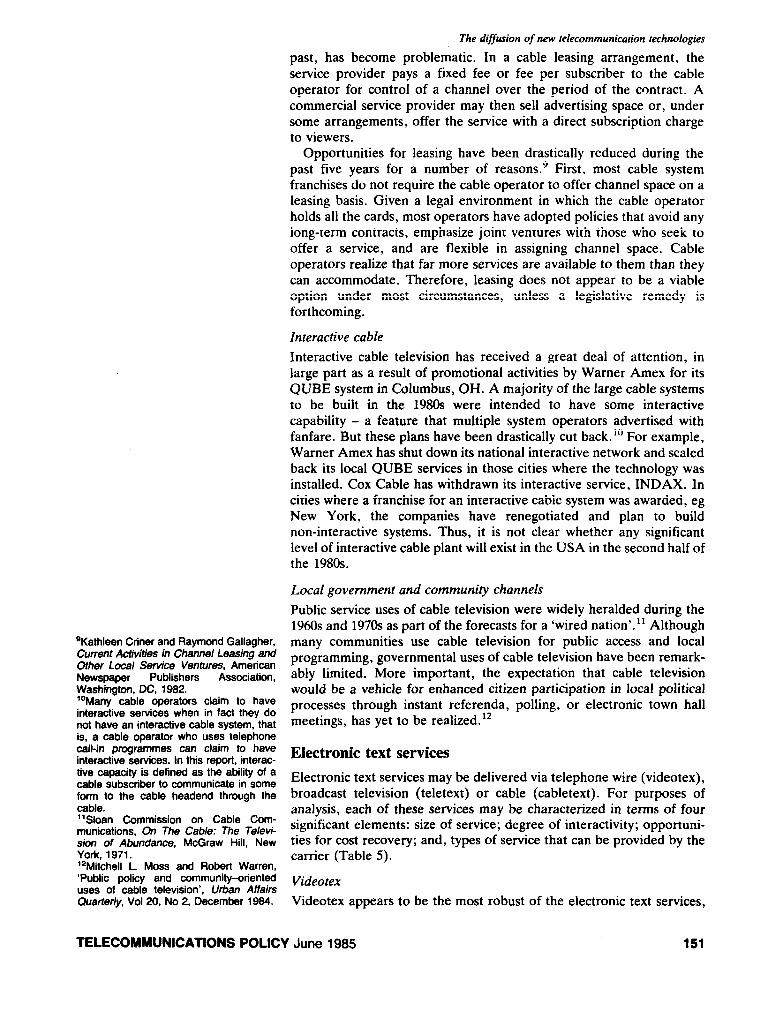
‘Kathleen Criner and Raymond Gallagher, Current Activities in Channel Leasing and Other Local Service Ventures, American Newspaper Publishers Association, Washington, DC, 1992. 10Many cable operators claim to have interactive services when in fact they do not have an interactive cable system, that is, a cable operator who uses telephone call-in programmes can claim to have interactive services. In this report, interac- tive capacity is defined as the ability of a cable subscriber to communicate in some form to the cable headend through the cable. “Sloan Commission on Cable Com- munications. On The Cable: The Televi- sion of Abundance, McGraw Hill, New York, 1971. 12Mitchell L. Moss and Robert Warren, ‘Public policy and community-oriented uses of cable television’, Urban Affairs Quarter/y, Vol29, No 2. December 1994.
The diffusion of new telecommunication technologies
past, has become problematic. In a cable leasing arrangement, the service provider pays a fixed fee or fee per subscriber to the cable operator for control of a channel over the period of the contract. A commercial service provider may then sell advertising space or, under some arrangements, offer the service with a direct subscription charge to viewers.
Opportunities for leasing have been drastically reduced during the past five years for a number of reasons.’ First, most cable system franchises do not require the cable operator to offer channel space on a leasing basis. Given a legal environment in which the cable operator holds all the cards, most operators have adopted policies that avoid any long-term contracts, emphasize joint ventures with those who seek to offer a service, and are flexible in assigning channel space. Cable operators realize that far more services are available to them than they can accommodate. Therefore, leasing does not appear to be a viable option under most circumstances, unless a legislative remedy is forthcoming.
Interactive cable
Interactive cable television has received a great deal of attention, in large part as a result of promotional activities by Warner Amex for its QUBE system in Columbus, OH. A majority of the large cable systems to be built in the 1980s were intended to have some interactive capability - a feature that multiple system operators advertised with fanfare. But these plans have been drastically cut back.“’ For example, Warner Amex has shut down its national interactive network and scaled back its local QUBE services in those cities where the technology was installed. Cox Cable has withdrawn its interactive service, INDAX. In cities where a franchise for an interactive cable system was awarded, eg New York, the companies have renegotiated and plan to build non-interactive systems. Thus, it is not clear whether any significant level of interactive cable plant will exist in the USA in the second half of the 1980s.
Local government and community channels
Public service uses of cable television were widely heralded during the 1960s and 1970s as part of the forecasts for a ‘wired nation’.” Although many communities use cable television for public access and local programming, governmental uses of cable television have been remark- ably limited. More important, the expectation that cable television would be a vehicle for enhanced citizen participation in local political processes through instant referenda, polling, or electronic town hall meetings, has yet to be realized.‘*
Electronic text services
Electronic text services may be delivered via telephone wire (videotex), broadcast television (teletext) or cable (cabletext). For purposes of analysis, each of these services may be characterized in terms of four significant elements: size of service; degree of interactivity; opportuni- ties for cost recovery; and, types of service that can be provided by the carrier (Table 5).
Videotex
Videotex appears to be the most robust of the electronic text services,
TELECOMMUNICATIONS POLICY June 1985 151

The diffusion of new telecommunication technologies
Table 5. General clwactw&ics ol ekctfonlc text smvice8.
Teletext
cost -VW Advertising
SiZOOl service
About 100 pages per channel
Interactivity
One-way
Videotex Advertising and/or user subscription
Unlimited Two-way
Cabletext Advertising and/or user subscription
100 pages VBI: 4000 pages for full channel
One-way or two-way
servrce provided
Information
Information, banking, showing. messaging
Information, banking, shopping, messaging
with the greatest number of options for service providers and users. For this reason, it attracted far more attention than cabletext or teletext in the period from 1975 through 1981. i3 Some early results from videotex trials and services have been mixed, however. The data suggest that videotex is generally expensive for operators and consumers alike. While many users like videotex, they are not willing to pay very much in order to receive it.
In the UK, where British Telecom invested more than $200 million in the Prestel videotex service, consumer usage has been disappointing. Fewer than 12 000 consumers subscribed to Prestel in early 1984, after five years of marketing effort. Business usage has been moderate with a few applications such as information for travel agents achieving heavy usage. It is reported, however, that fewer than 10% of the 140 information providers for Prestel are earning a profit. In addition, there have been several tests initiated by the British Council for Educational Technology (CET) to learn whether Prestel can provide a useful tool for educators. The reactions by students and teachers have been generally positive, but there has also been much concern about the high costs associated with Prestel.
During 1984, Prestel began to offer nationwide election mail as well as videotex information, and software packages that enabled home computers to access the service at greatly reduced prices. These changes appear to have attracted many new household subscribers. Indeed, the number of household subscribers doubled in 1984. However, the long term impact of these changes on household subscriber growth remains unclear.
There are six major US videotex services. Three of these have been operating since 1979 and are national services: Dow Jones News Retrieval, Source Telecomputing, and CompuServe (a subsidiary of H&R Block). The other three services were launched in 1983 or 1984 and provide service in a limited region: Viewtron (Southern Florida), Gateway (Southern California) and Keycom (Chicago). These serve business groups as well as home subscribers. Their growth is outlined in Table 6. About one-third of the total base of subscribers are estimated to be consumer households.
While the growth rate for household subscribers has been moderate, the base from which growth is measured is low. Applying historical
13Michael Tyler, ‘Videotex, Prestel and technology growth estimates to this base, one could project growth for teletext: the economics and Politics Of some electronic publishing media’, Tele-
the remainder of the decade at 65 to 70% annually over the first ten
communications Policy, Vol3, No 1, March years. This would yield an estimated penetration in the consumer 1979, pp 37-51. market that is considerably below many predictions in the trade press.
152 TELECOMMUNICATIONS POLICY June 1985

The diffusion of new telecommunication technologies
Table 6. Growth of US VideOtOX SMVbS (1879-84).
SoNice 1979 1980 1981 1982 1883 lS04
DowJones 6000 13500 29000 85 000 source 3ooo 7000 13500 zz 4oooa
17oooa 65000
CompuServe Viewtron Gateway
Note: %eunched in lest quarter of the year. Keycom SCMX?: Interactive Telecommunications PrOg- Totals ram, New York University.
1000 4000 18000 35ooo 65000 150000 l 3200
a . -
loo00 24500 60500 115ooa 19OOCQ 388 200
The data we have analysed, however, provide few reasons for a more optimistic scenario for services in which information is the principal commodity and which rely on a dedicated home terminal that can receive videotex and do nothing else. Perhaps for this reason, alternative configurations of videotex are beginning to emerge. Both the more established videotex services such as Source Telecomputing and new services such as Gateway are placing greater emphasis on transactional videotex services. These include electronic mail, home banking and home shopping. In addition, most of the system operators are now emphasizing the use of an adapted personal computer to receive videotex. It is not yet clear how the public will respond to these alternative configurations of videotex.
Teletext
Teletext has found strong market acceptance in the UK. Beginning with a test service in 1976, teletext is now received in more than 10% of UK households.
In Sweden and Finland, where teletext has been available for five years, growth rates of decoders have equalled or surpassed the UK experience. Moreover, user reactions to teletext have been positive. For example, in the UK where leasing television sets is much more common than in the USA, a manufacturer’s survey of those leasing teletext decoders found that about 90% either intended or were leaning toward a decision to renew their contract for a teletext set.
During the period 1980-83, several commercial broadcasting groups and public broadcasting stations in the US conducted teletext trials. These included: CBS/KCET/KNXT in Los Angeles, Field Enterprises (WFLD) in Chicago, Alternate Media Center/WETA in Washington, DC, WKRC in Cincinnati, KPIX in San Francisco and WGBH in Boston. Each had a small number of decoders in test homes or public locations. The public reaction to these test services was generally positive. In 1984, both CBS and NBC began a national teletext service. Since few decoders were available, both networks engaged in a number of promotional activities such as providing public location teletext kiosks at the Los Angeles Olympic Games and the New Orleans World Fair. Then, in late 1984, NBC abruptly closed down its teletext operations citing the continued lack of available decoders and an uncertain marketplace. Many individual stations, apparently seeing little opportunity in teletext, have leased the vertical blanking interval of their broadcast signal (ie the space where teletext is normally transmitted) to outside third parties who intend to offer private data networks to stock brokers and other business groups.
The US experience with teletext stands in marked contrast to the UK. In the USA, development of the service has been delayed by a long and unresolved battle over which technical standard to use; a reluctance by
TELECOMMUNICATIONS POLICY June 1985 153

The diffiion of new telecommunication technologies
the FCC to set a technical standard; hesitation by TV set manufacturers to build decoders; and, concern by local broadcasters about the revenue potential of teletext advertising. The apparent interest of consumers in teletext information services has not been a deciding factor. Thus, the future of teletext in the USA remains uncertain.
Cabletext
Cabletext can provide a number of alternative services. The 1983 Time, Inc trial in San Diego and Orlando provided a few thousand frames of information to test homes. This one-way service allowed users to select from a large stream of pages continuously transmitted over one 525-line channel. The Cox cabletext trial in San Diego provided an interactive service wherein a user could access pages from a database as well as make purchases and conduct electronic banking. Finally, open channel text services - requiring no decoder - have been available on cable for more than a decade. Indeed, more than 60 newspapers or news services currently provide open channel text services for cable systems.
Cable brings two assets to electronic text services: a rugged transmission environment (compared to broadcast VBI) and an existing body of subscribers who have already committed themselves to paying for communication services. In addition, cable does not have to address the issue of transmission standards. However, cable shares with broadcast teletext a need to attract manufacturers who will build large quantities of decoders.
Research data emerging from videotex and teletext trials can be applied, with some modifications, to those cabletext services that mimic a videotex or teletext model. For example, no data appear to support the argument that large numbers of consumers will pay $40 to $50 per month for an interactive text service on cable. An advertiser-supported VBI text service that is free to cable subscribers might grow at a moderate rate if inexpensive decoders were readily available. A large one-way cabletext channel offered for a fee of $7 to $10 per month will have to compete with pay movie and sports channels. A moderate market may exist for such a pay channel.
It is instructive that both Time, Inc and Cox Cable suspended cabletext services upon completion of their 1983 trials. Also, a national cable teletext service offered by Keycom and Satellite Syndicated Systems shut down after two years of market testing. Time, Inc indicated that its service was hindered by high production costs and a lack of decoders at a price the market could support. Neither Time, Inc, Keycom, or Cox have indicated that they plan to launch a cabletext service in the near future, However, a number of other groups, eg TCI, Taft Broadcasting and Group W, have not lost hope and have begun or announced plans to launch cabletext services.
Finally, open channel text services offered at no cost to subscribers and requiring no decoder are likely to continue to receive moderate viewership. A.C. Nielsen reported that about 60% of 1982 cable subscribers viewed a news text service daily while 70% viewed a weather text service daily. However, the revenue potential of such services may be limited.
Video teleconferencing
Video teleconferencing is not a new service. In the early 197Os, 23 video
154 TELECOMMUNICATIONS POLICY June 1985

‘.Martin Elton and John Carey, tm- plementhg Interactive Telecommunication Services, Alternate Media Center, New York, 1980; Ben Park, An introduction to Tdemedicine, Alternate Media Center, New York, 1974; and Ederyn Williams, ‘The Bell Canada conference television system’, Communication Studies Group Pi731 73iWL, London. 1973.
Note: T%timated costs of audio teleconferences ~surne an average distance of 1200 miles between each site and the bridge. Sources: Carey and Moss; Brown, Bortz and Coddington.
The diffusion of new telecommunication technologies
teleconferencing systems were operating in the USA, with a smaller number in Canada and the UK.14 Experimental systems began in the mid-to-late 1960s. The service has been less than successful, however. Of the 23 systems begun in the early 197Os, only five are still operating. Thus, recent attention directed toward video teleconferencing repre- sents a cyclical resurgence of interest in the technology, not the emergence of a new untested service. It remains an open question whether the early history of the service will be repeated.
Much of the early interest in video teleconferencing was based on a need to provide services to remote areas as well as a concern about the high cost of travel. In particular, it was believed that video telecon- ferencing might substitute for a proportion of business travel. These motivations were boosted by the oil embargo and energy crises in 1973-74. But strong user demand for video teleconferencing never emerged. The high cost of the service is cited as the principal reason. Most users found that audio teleconferencing or audio with some graphics or facsimile enhancement was sufficient for their needs. The relative cost of audio teleconferencing (on the average 50 to 100 times cheaper than video teleconferencing) further enhanced its acceptability.
Of those video teleconference systems that have continued since the early 1970s all are dedicated, on-premise systems used on a regular basis by a relatively small and stable population. Thus, there is no evidence from early experience with video teleconference systems to support an off-premise, irregularly used video teleconferencing service. Indeed, the industry’s current marketing push appears related more to the excess capacity of the Holiday Inn satellite network, PBS satellite network and AT&T video lines than to customer demand for the service.
It is difficult to estimate the growth of video teleconferences during the second half of the decade. On the one hand, the high cost of video teleconferencing has been a barrier to growth. In addition, research data suggest that video is not necessary for all but a small percentage of teleconference meetings. On the other hand, some technical advances in video compression have reduced the cost of video teleconferencing. This may provide an incentive for additional usage.
The costs for audio teleconferencing in Table 7 do not include enhancements such as slow-scan television or end instruments such as speakerphones. Such enhancements introduce much cost variability. The large cost differential between audio and video teleconferencing would remain under most scenarios of enhanced audio, however.
Based on these considerations, it is our judgment that a small non-dedicated video teleconference market will likely emerge, but not one that can support more than two or three video teleconference system operators.
rabk 7. Audio and vide0 tet~cOnferSncirlg oOStS: retSttVe WStS oi a OM-hOW, ten-Sk MttOMt tetecOntSfenw.
Audio VI&O
SSrVice COSt w SerVicS COSt 0)
Private bridge 240 PBS 5750-10200 AT&T 360 Commercial 22600-34500
Kt3llogg 345 Darome 425
TELECOMMUNICATIONS POLICY June 1985

The diffusion of new telecommunication technologies
Table 8. Growth of subscription television (1977-94).
Subscribers
1977 40 000 1978 150000 1979 400 000 1980 650 000 1961 980 000 1982 1380000 1963 800000 1984 600000
Source: Federal Communications Commission.
Tabte 9. Growth of multipoint distribution service5 (1976-94).
1976 1977 1978 1979
1981 1982 1983 1984
Subscribers
45 000 70000
140 000 260 000 400 000 547 000 850 000 550 000 450 000
Source: Federal Communications CornmissIon.
156 TELECOMMUNICATIONS POLICY June 1985
Alternative distribution technologies
Low-power television, multipoint distribution service (MDS), and subscription television are all alternative broadcast distribution paths. Each provides a means to reach new or more specialized audiences. In addition, low-power television appears especially well suited to reach rural areas not currently served by regular broadcast signals or cable television systems.
Subscription television (STV) utilizes a scrambled broadcast signal as a means to offer pay programming. The signal is descrambled in homes that lease equipment in order to receive the programming. The term STV, however, is used typically in relation to full-power UHF or VHF stations. In the current market, STV provides a way for consumers to receive a pay movie service in areas where there is no cable. During the period 1977 to 1981, STV grew into a significant market (see Table 8). Beginning in late 1982, however, STV began to lose customers due to greater competition from cable and higher operating costs that in turn led to increased prices for consumers. In 1984, STV subscribers paid an average of $25 to $30 per month for the service.
The fate of STV on UHF and VHF is not certain. A number of STV channels, after experiencing a loss in subscriber base during 1982 and 1983, have closed down. The base of subscribers continued to erode during 1984.
Multipoint distribution services provide an omnidirectional micro- wave transmission that requires special equipment to receive the signal. It is somewhat cheaper to operate and receive than UHF or VHF STV. Therefore, an MDS movie channel operator may be able to break even with 15 000 to 20 000 subscribers, whereas UHF or VHF STV typically requires 75 000 to 90 000 subscribers in order to break even. The average monthly subscriber fees for MDS movie channels ($20 to $25) are also lower than STV. Nonetheless, MDS also experienced an erosion of its subscriber base during 1983 and 1984 (Table 9).
MDS transmission has many applications beyond pay movie channels. It can be used for private video or data transmission. The 525-line signal can also be divided and leased to several groups. Indeed, some MDS operators offer a pay movie channel at night while leasing transmission space to businesses during the day.
With the allocation of additional spectrum space to MDS (the FCC has decided to take spectrum space away from ITFS transmission and assign it to MDS), many groups have become interested in multichan- nel, multipoint distribution services (MMDS). MMDS is viewed as an alternative to cable television in some areas, since it can provide four to six channels of programming rather than a single pay channel service. However after an initial flood of applications to the FCC (some groups filed hundreds of applications in an attempt to create a national MMDS service) interest in MMDS appears to be subsiding. Concerns about signal piracy as well as a closer examination of operating costs, potential revenues and competition from cable have led groups such as CBS to withdraw from MMDS.
Low-power television represents a potential tool for transmitting additional programming, as well as for reaching many US households that cannot currently receive more than one or two broadcast signals. There are, however, many uncertainties associated with this technology.
In early March 1982, the FCC opened the way for construction of 3 000 to 4 000 low-power TV stations. It is still not clear how this service

The diffusion of new relecommunication technologies
will develop. The FCC has been flooded with more than 20 000 applications and construction permits are being issued at a slow rate.‘” Some groups who saw an opportunity to create low-power STV stations are now reassessing this prospect in light of recent STV market developments. Currently, applications for rural area low-power stations are being processed by the FCC. For this reason, it appears that low-power TV will present local broadcasting groups with a near-term opportunity to reach new geographic areas currently underserved by regular broadcasting services. However, the revenue potential for low-power television in rural America is decidedly limited since the population in these areas tends to be scattered and the reach of low-power signals is limited.
Conclusion
This analysis of growth patterns for telecommunication technologies provides lessons about the diffusion of technology as well as specific guidelines for business and government. It can be argued that the growth of new telecommunication technologies is associated with the convergence of several elements: price acceptability for a potential user; service advantages relative to competitive technologies; user interest in and need for the new service; ease of use and motivation to change existing habits; a favourable regulatory environment; and, the presence of necessary support equipment or distribution paths. All of these elements need to be in place for a technology to grow or, alternatively, the new service must enjoy a favourable position relative to competitive services.
The argument may be presented more forcefully in a negative context: the absence of one of these elements can provide a significant barrier to growth. Teletext in the USA provides a good example of the negative proposition. During 1983-84 all of the elements appear to have been in place except one piece of necessary support equipment - decoders. As a consequence, teletext growth was stymied. Moreover, it is not clear whether US teletext may have missed a window of opportunity in the period 1982-84 when many of the elements necessary for growth were more favourable than they are likely to be in the second half of the 1980s. In this sense, telecommunication technologies generally may experience favourable but limited timeframes for introduction to the marketplace.
An historical perspective on telecommunication technology also reveals that there are several models of development and diffusion other than introduction followed by rapid growth. New technologies grow at many different rates. Some fail outright, while others are fads and still others experience cyclical patterns of growth, decline and renewed growth. Thus, radio, television or even the telephone are not necessarily appropriate models upon which to base the likely growth of a new telecommunication technology. Indeed, the proliferation of new tele- communication products has created a competitive environment that is unlike any preceding period. In this new environment, more products are likely to be introduced and more products are likely to fail.
A few other general patterns should also be noted. First, a new
15Electronic Industries Association, Hec- telecommunication technology may require a few decades before it
Wonic Market Data Book, 1984, Marketing enters a majority of households. Further, many successful technologies
Services Department, Electronic Industries never enter a majority of households. There are limits to growth or Association, Washington, DC, 1994. ‘penetration walls’ for a technology. Not every household requires an
TELECOMMUNICATIONS POLICY June 1985 157

The diffusion of new telecommunication technologies
electric typewriter and not every household wants cable television. Moreover, with the proliferation of technologies accompanied by a general decrease in household space it is reasonable to ask where people will put all this new equipment. Second, there are many new examples of a well established pattern in which selected technologies enter the business environment before households. This allows economies of scale to develop and thereby bring the price of a service into a more attractive range for household consumers. Third, consumer resistance to new telecommunication technologies can often be attributed to difficulty and/or inability to use the product. For example, one third of the US population is functionally illiterate. This imposes serious constraints on their use of teletext and videotex services. In addition, problems such as arthritis, weak or uncorrected eyesight and poor education restrict the use of certain technologies.
For those involved in the commercial development of new telecom- munication technologies, a few specific lessons emerge from this analysis. First, the market development of many new services has been characterized by excessive hyperbole and false expectations. It may be argued that hyperbole and marketing go hand-in-hand. However, if corporate strategists begin to believe the hyperbole of advertising copy, bad planning may follow. In particular, erroneous revenue projections may follow from such planning and a product with reasonable growth rates may be labelled as a failure. Many US commercial groups appear to be especially weak in long term planning and market development for new telecommunication services.
A second important lesson for the commercial sector is the need for flexibility and adaptibility in market development of these products. Often, a product must be changed significantly after it has been introduced in the marketplace. Videotex provides a good example. Introduced as an ‘information utility’ to be accessed by a dedicated terminal, videotex was not accepted in the consumer marketplace. By adapting videotex to provide transactional services that may be accessed via a personal computer, the service appears to growing at a more acceptable rate.
From a public policy perspective, the recent history of telecom- munication technologies points to some flaws in the deregulation of telecommunications. In essence, the Federal Communications Commis- sion has walked away from new telecommunication technologies and proclaimed that competition will lead to a more benign marketplace than a restrictive regulatory environment. However, the consequences have not fostered market development. The structure of regulation in low-power television and MMDS resulted in massive applications to the FCC for licences, often by opportunistic groups who did not intend to offer a service. The chaos that followed has postponed marketplace development of these services. A similar non-decision about teletext standards may have inhibited manufacturers from building decoders.
In some ways, deregulation has masked the absence of sound public policy principles to guide the regulation of new telecommunication technologies. Government’s role in telecommunications is not to pick ‘winners and losers’ among competing technologies, but rather to establish an environment that promotes marketplace innovation and growth. Clearly, there is a need for a more systematic understanding of the diffusion of new telecommunication technologies by both the public and private sectors.
158 TELECOMMUNICATIONS POLICY June 1985