Embed Size (px)
Citation preview

THE DIGESTIBILITY AND ENERGY VALUES OF FEEDS FOR HORSES *
By J. B. LINDSEY, C. L. BEALS, and J. G. ARCHIBALD,2 Massachusetts Agricultural
Experiment Station
INTRODUCTION
For a number of years investigations have been made at the Massachusetts Agricultural Experiment Station of the digestibility and metabolizable energy in the ordinary roughages, grains, and by- ? products likely to be fed to horses, especially horses intended for arm and other industrial uses. Lack of a respiration calorimeter
prevented the determination of heat radiation, hence, in addition to digestion coefficients, only metabolizable energy could be determined, and the. estimates for net energy were made according to the formula suggested by Zuntz.
Comparatrgèly few digestion and metabolism studies with concen- trated and coarse feeding stuffs with the horse have been made either in Europe or in this country. In a previous publication a brief review was made of the more fundamental studies on the nutrition of the horse (7, p. 243-249).* The work reported in the present paper covers a period of five consecutive seasons, beginning about JNovember 1 and ending early in April. The work of each year is called a series.
HORSES AND APPARATUS USED : HORSES -
Two relatively young horses, known as Tom and Joe, and weigh- ing substantially ly4Ô0 and 1,300 pounds, respectively, were used. In the fourth and fifth series another hoçse, uhub, was substituted for Tom. The horses were sound and jägforous, and were employed on the station farm during the workmgSéason.
STÄELS
Two stalls, elevated 1 foot 9 inches above the main floor, were built for the purpose in a small building devoted exclusively to the work The building was heated artificially to about 50° F. in cold weather, and was properly ventilated. The stalls were each 4 feet 3 inches wide and 10 feet 3 inches long. The mangers for the hay and grain were built together. The hay manger was 2 feet 9 inches by 1 foot 5 inches at the top; 1 foot 10 inches deep; and 2 feet 9 inches by 5 inches at the bottom, that is, a cross section was an inverted acute triangle. The grain box was 1 foot 5 inches by 11 inches by 1 foot 2 inches deep. The manger was hinged so that it opened forward and outward into the aisle for convenience in putting in the feed. An iron grill 2 feet 4 inches extended across the stall in front, above the feed box, to prevent throwing out the hay.
1 Received for publication Oct. 14, 1925; issued March, 1926. From the Department of Chemistry, Massachusetts Agricultural Experiment Station. Published with the permission of the director of the station.
2 Credit is due P. H. Smith and Ethel M. Bradley for considerable analytical work. * Reference is made by number (italic) to "Literature cited," p. 603.
Journal of Agricultural Research, Vol. XXXII, No. 6 Washington, D. C. Mar. 15,1926
Key No. Mass. 14 (569)

570 Journal of Agñculiural Research vol. xxxu, NO. 6
SCALES AND FEED RECEPTACLES
The horses were weighed on large platform scales of standard make. The feeds were weighed on sensitive scales to which a metric heam was attached. The hay was weighed out in three daily portions into 4-bushel baskets, and the grain into wooden measures or wooden trays.
HARNESSES
The leather parts of the harnesses were made by a local harness maker. The large bag for collecting the feces was made of fairly heavy duck. The funnel for the urine was made of rubber. The funnels were connected at the base with a rubber hose (one-half inch inside diameter), which at first ran through the floor of the stall into a 5-gallon glass jar beneath. This not working satisfactorily, the hose was run between the rear legs of the horses into the jar placed below and at the rear end of the stall, and was held in place by wire suspended from the ceiling (fig. 1). By this arrangement very little urine was lost, while the horses were allowed a limited amount of movement without disarranging the attachments.4
FIG. 1.—Showing the complete harness used for the recovery of the excreta
METHODS EMPLOYED
PERIODS
The experimental periods were from 15 to 21 days in length, depend- ing on the nature of the ration and the amount of time required to change from one ration to another. The feces and urine were col- lected during the last eight days. The horses were fed three times daily, and during the preliminary period were turned into a yard for several hours each day. Salt was kept before them constantly.
WEIGHING THE HORSES
The horses were weighed on the first two and the last two days of the period proper in each trial, and at the same time each day in all cases.
4 The plans for the harness, bag, funnel, and connections were made by Mr. Beals, who had full charge of the details oí the experiments. He kept all records and calculated results for four series. Some of the arçiilytical work was done and all of the calculations for the fifth series were made by Mr. Archibald, who also recalculated all of the results and was oí great help In preparing them for publication.

Mar. 15,1926 Digestibility and Energy Values of Feeds for Horses 571
SAMPLING AND WEIGHING FEEDS
The uncut hay and the grain were weighed out in advance. As the hay ration was weighed out a handful from each basket was placed in a sample basket. The composite sample wxas run through .a feed cutter, mixed, subsampled, and taken in closed tin pails to the labora- tory, where dry matter determinations were made and the samples prepared for chemical analysis. At each separate weighing of the grain into wooden measures a small sample was placed in a receptacle, and at the completion of the weighing the composite was mixed, sub- sampled, and taken to the laboratory for dry-matter determinations and further analysis. A careful record of the daily water consumption was kept.
SAMPLING AND WEIGHING EXCRETA
The canvas bags in which the feces were collected were emptied several times daily into galvanized-iron cans (17 inches in diameter and 2 feet deep) with tight-fitting covers. At the end of 24 hours the entire collection from each horse was weighed and spread out upon a clean, dry floor, quickly pulverized, and mixed. Small samples wTere taken here and there, and 1 per cent of the total amount was placed in a tightly-covered tin pail and taken to the laboratory, where it was partially dried in a shallow tin pan at a temperature of about 60° C. The daily samples, after drying, were weighed and mixed, and a dry-matter determination was made on the mixture, which was then ground fine and analyzed.
The funnels and hose were flushed out at the expiration of each 24 hours with 1,000 cubic centimeters of tap water (for which acorrection was made). The contents of the large glass receptacle were mixed and weighed, and 1 per cent of the total was drawn off with a pipette into a glass-stoppered bottle, preserved with chloroform and kept in a cool place. At the expiration of the experimental periods, the com- posite urine sample was analyzed.
METHODS OF ANALYSIS
FEEDS AND FECES
For use in subsequent estimations of digestibihty, complete fodder analyses were made on all samples of feed and feces, according to the methods of the Association of Official Agricultural Chemists (8). From the digestion coefficients obtained for crude fiber in each ration, an estimation of the excreted methane was made, using a factor from the work of Zuntz.
URINE
After careful mixing the specific gravity of the composite sample was determined, also the nitrogen by the Kjeldahl method, using a 10 cubic centimeter aliquot. Results of the latter determination were applied to a study of the nitrogen balance. Fifty grams were next used to determine total solids or dry matter, by evaporating and dry- ing at 60° C. to constant weight. In addition, a considerable quantity was carefully concentrated at 60° to a gummy consistency and later thoroughly dried in a vacuum oven at room temperature. This was pulverized, sifted, and tightly bottled for future use.

572 Journal of Agricultural Research vol. xxxn, No. 6
CALORIFIC DETERMINATIONS
These were made (1J^ grams of feed or feces and 1 gram of dried urine) by complete ignition under pressure in an atmosphere of oxygen. The apparatus used was an especially designed adiabatic bomb calorimeter of the Berthelot-Mahler-Kroecker type,5 described in detail elsewhere (4). Results were reported in large calories per f;ram, after corrections were made for moisture in the samples and or the production of nitric acid in the bomb. In the case of the urine,
difficulty was experienced due to hydroscopicity and weighing had to be done with the greatest possible rapidity. Perfect oxidation invariably took place, although the production of a strongly basic ash more than equalized the production of acid.
CALCULATIONS
DIGESTIBILITY
Having determined the amount and composition of dry matter in the feeds and feces, the calculation of digestibility is comparatively simple. The amount of dry matter and its components contained in the feces is deducted from the dry matter and its components con- tained in the feeds, the difference representing the amounts digested. The amounts digested, divided by the amounts consumed, give the coefficients of digestibility.
METABOLIZABLE ENERGY
This represents the total energy, minus that contained in the excreted feces, urine, and gases. The energy, expressed as calories, was determined in the feeds, feces, and urine by means of the bomb calorimeter already mentioned. The energy excreted in the form of methane was calculated from the amount of fiber digested, using the average figure by Lehmann, Hagemann and Zuntz {5) (0.7 calorie per gram of fiber digested).6 A typical calculation of metabolizable energy is as follows :
Intake : (1) 10,500 grams of hay fed grams dry matter. _ 9, 252. 60 (2) Calories per gram 4.26 (3) Total calories in hay fed 39, 416. 08
Excretion : (4) 4,913.12 grams of feces excreted grams dry matter. _ 4, 718. 56 (5) Calories per gram 4.69 (6) Total calories in the feces 22, 130. 05 (7) 6,280 grams of urine excreted grams dry matter. _ 326. 56 (8) Calories per gram 2.93 (9) Total calories in the urine 956. 82
(10) Fiber digested grams__ 1,261.60 (11) Calories per gram (CH4+H equivalent) ^ .7 (12) Total calories in gases excreted 883. 12 (13) Total excretion (6) + (9) + (12) calories. _ 23, 969. 99
Balance : (14) Minus calories excreted. See (13) 23,969.99 (15) Metabolizable calories . 15, 446. 09 (16) Metabolizable calories per kilo of hay fed 1, 471. 06
5 Especially designed by E. B. Holland, of this station, and built by the late E. A. Thompson, of Amherst. 6 In case of the horse, methane is produced largely in the colon and caecum, and is derived largely from
fermentation of the fiber. Ruminants produce more methane than does the horse (£, p. 6S5-6S9).

Mar. 15,1926 Digestibility and Energy Values of Feeds for Horses 573
NET ENERGY
This represents the metabolizable energy, minus the energy in the form of heat production resulting from the consumption of the feed. This loss of energy can be determined directly only by means of a respiration calorimeter. Such an apparatus not being available for this work the net energy was calculated indirectly from the meta- bolizable energy by using the formula suggested by Zuntz and Hage- mann (2, p. 676) for the horse. In common with other investigators, they recognized that this loss is made up of two items. (1) Loss of heat due to increase of metabolism, and (2) energy expended in di- gestion, in the form of heat, and being proportional to the amount of crude fiber present in the feed. They estimated the losses for these items to be for (1) 9 per cent of the metabolizable energy (al- ready determined as described above), and for (2) 2.65 calories for each gram of crude fiber present. Subtraction of these amounts from the metabolizable energy gives the net energy, which is the energy available for bodily maintenance and useful work. For con- venience, Zuntz and Hagemann's deduction factor for crude fiber has been converted by Armsby to a "therms and pounds" basis. On this basis, the deduction to be made is 1.202 therms for each pound of crude fiber. A typical calculation, on a dry-matter basis, follows : 9,252.60 grams of hay fed pounds__ 20. 40 Metabolizable energy (already determined) therms _ _ 15. 446 20.40 pounds hay do 15. 446
mn A x. 15.446X100 do 75 72 100 pounds hay= ofTÏO " Total crude fiber presents do 32. 81 Deductions :
Increase of metabolism, 9 per cent of the metabolizable energy, 75.72X0.09 6.81
Additional for crude fiber, 1.202X32.81 39.44
Total deductions therms., 46. 25
Net energy value per 100 pounds dry matter - therms. _ 29.47
In an average sample of hay, the net-energy value is less than half the metabolizable energy. The difference is used up in digesting the feed, and in the resulting increased heat radiation from the body.
THE RESULTS
All of the data, including daily food and water consumption, daily excreta, weight of animals, and calculation of results are on file. Only the results, with a brief discussion of each, are presented here.
ALFALFA AND TIMOTHY HAY ?
These trials were made to determine the digestibility and energy values of the alfalfa (Table I). Hay was used as the basal ration. The daily ration consisted of 5 kilograms each of alfalfa and hay.
7 For composition of this lot of hay and lots used subsequently in the work, see Table XXVIII.

574 Journal of Agricultural Research vol. xxxn, No. 6
TABLE I.—Digestion coefficients and energy values
Series Period
Digestion coeflicients (per cent) Energy values per 100 pounds
Horse
Dry matter Ash Pro-
tein Fiber N-free extract Fat
Metab- oliz- able
energy
Net energy
Joe- I I II II
5 5 4 4
48.35 50.68 49.08 51.01
52.62 52.85 37.04 42.97
59.48 63.74 65.14 66.68
39.93 42.98 41.46 42.25
54.87 56.56 54.58 56.69
None. None. None. None.
Therms 64.81 71.84 74.85 82.36
Therms 13.34
Tom Joe Tom
19.73 28.56 35 39
Average.._ __. 49.78 (') 63.76 41.66 55.68 None. 73.47 («)
a Not averaged.
The digestion coefficients of the mixture are very uniform, and, as the next section will show, were only slightly less than for the alfalfa alone. The net-energy value of the mixture was noticeably less in the first trial, due evidently to the higher fiber percentage of the alfalfa (39.57 as against 30.52).
ALFALFA
Two separate experiments were carried on with alfalfa fed com- bined with hay, as previously cited. That used in the first period was grown in New York State, was quite fine, and was said to be third cutting. The second lot was grown on the experiment station grounds.8 Both lots were of good quality, although the latter was somewhat dusty. The composition of the two lots is given in Table II.
TABLE II.—Composition
Period Source Water as fed
Dry-matter basis
Series
Ash Protein Fiber N-free extract Fat
Calo- rific
value per 100 pounds
I 5
4
New York State.
Experiment station.
Per cent 10.88
9.75
Per cent 6.96
8.65
Per cent 13.11
19.68
Per cent 39.57
30.52
Per cent 38.63
39.14
Per cent 1.73
2.01
Therms 190.97
II 197.32
From the standpoint of chemical composition, the locally grown sample was noticeably the better of the two. The digestibility and net-energy values are given in Table IIL
s Cutting not noted.

Mar. 15,1926 Digestibility and Energy Values of Feeds for Horses 575
TABLE III.—Digestion coefficients and energy values
Series Period
Digestion coefficients (per cent) Energy values per 100 pounds
Horse
Dry matter Ash Pro-
tein Fiber N-free extract Fat
Metab- oliz- able
energy
Net energy
Joe I I II II
5 5 4 4
46.66 51.38 51.15 55.00
67.20 67.63 43.92 53.55
62.23 69.13 71.10 73.94
31.39 37.31 37.39 37.94
58.50 62.33 59.12 63.92
None. None. None. None.
Therms 64.74 75.05 74.49 89.17
Therms 9.43
Tom 18.80 Joe 29.08 Tom 42.44
A verafffi 51.05 »58.00
58.00 47.00
58.08
""43."ÖÖ" 26.00
69.10 73.00 72.00 44.00
36.01 46.00 46.00 43.00
60.97 70.00 66.00 53.00
None. 14.00 24.00
75.86 (a) Average of six German trials (horses). A vP.racTA with shftAn (fí -n $1!)} Hay (largely timothy for comí )arison)_ 73.72 26.68
a Variations too great to warrant averaging the results. b Organic matter.
The digestion coefficients, although noticeably lower than those resulting from the German trials, as well as those obtained for sheep on the saine station lot of alfalfa, are reasonably concordant. The protein is quite well utilized, the fiber less so. Neither bovines nor horses are able to digest the fiber in alfalfa very thoroughly. There were about the same number of therms of metabolizable energy in the two samples of alfalfa as in the five samples of coarse hay tested (76 against 74). The lack of uniformity of the net-energy values is due in part to the inability of Joe to utilize the feed as wefl as Tom, and also, in the writer's opinion, to the higher fiber content of the the first sample (39.57 per cent against 30.52 per cent). It is proba- ble that the first sample was riper and the fiber somewhat more lignified, necessitating an expenditure of more energy to digest it. While the digestion coefficients for the two samples are substantially the same, they fail to indicate the final food or net-energy value of the material, assuming that the formula for net energy suggested by Zuntz and Hagemann is reasonably correct.
KANSAS RATION VERSUS SUBSTITUTE RATION
The Kansas ration (9), so-called, represented a combination of alfalfa, corn, and oats, and was recommended by that station and the United States Department of Agriculture, which experimented jointly for a period of 140 days with 17 artillery horses, doing what was termed rapid light draft.
It was recommended on the ground that a relatively small amount of alfalfa hay fed with a relatively large amount of corn would require a minimum amount of energy for its digestion; in addition, the alfalfa furnished the necessary protein. In view of the seem- ingly small amount of dry matter in the ration fed, and the apparent satisfaction obtained from it, it seemed worth while to determine its digestibility and energy value and to compare it with a substitute ration composed of hay, corn, oats, bran, and dried brewers' grains. The substitute ration was suggested because of the fact that little alfalfa is grown in Massachusetts, while English hay (timothy pre- dominating) is the common roughage. The protein deficiency was

576 Journal of Agricultural Research vol. xxxn, No. e
supplied in the form of brewers7 grains. The amounts fed to deter- mine digestibility are shown in Table IV, and were in the same pro- portions as those fed for work purposes. Each ration was supposed to satisfy maintenance requirements.
TABLE IV.—Rations fed
Kansas ration
Substi- tute
ration Kansas ration
Substi- tute
ration
Alfalfa Pounds
8.25 Pounds
1
Bran Pounds Pounds
1 21 Timothy 9.00
4.20 2.40
Brewers' grains - _ ... - 1.80 Corn 6.60
1.65 Total Oats 16.50 18 61
In Tables V and VI is given the chemical composition of the Kan- sas and substitute rations.
TABLE V.—Composition of the rations
Water as fed
Dry-matter basis
Material
Ash Protein Fiber N-free extract Fat
Calorific value
per 100 pounds
Kansas ration ... _. Per cent
13.72 11.42
Per cent 4.68 4.55
Per cent 13.66 11.91
Per cent 19.30 21.56
Per cent 58.82 58.17
Per cent 3.55 3.80
Therms 201.42
Substitute ration 203.84
On the basis of chemical composition, there is little choice between the two rations. If anything, one would expect slightly better results from the Kansas ration, because of its lower fiber content.
TABLE VI.—Digestion coefficients and energy values
KANSAS RATION
Horse
Joe... Tom.
Average..
» Not averaged.
Series Period
Digestion coefficients (per cent)
Dry matter
59.15 67.36
63.26
Ash
49.26 54.08
51.67
Pro- tein
76.1 79.1
77.89
Fiber
0.62 24.83
(a)
N-free extract
75.75 80.12
Fat
47.93 59.40
Energy value per 100 pounds
Metab- oliz- able
energy
Therms 98.70
118. 52
Net energy
Therms 67.08 84.65
75.87
SUBSTITUTE RATION
Joe I I
4 4
48.89 57.08
8.71 20.42
64.74 66.15
20.83 36.78
60.73 66.43
25.13 44.69
88.06 97.88
54.22 Tom. __. 63.16
Average 52.98 (•) 65.45 (•) 63.58 («) 92.97 58.69

Mar. 15,1926 Digestibility and Energy Values of Feeds for Horses 577
In the trials with both rations, as stated above, Joe showed less ability to digest than did Tom, although no outward signs of indi- gestion or debility were manifest. More fiber was digested in the substitute ration than in the alfalfa ration. In both cases, however, the percentage of fiber digested was noticeably less than in the combined ration of alfalfa and hay (42 per cent). The horses made better use of the Kansas ration than of the substitute ration; the dry matter in the former ration averaged 63 per cent digestible as against 53 for the substitute ration, while the metabolizable and net energy produced averaged 109 and 76 in the Kansas ration as against 93 and 59 in the substitute ration. One is therefore forced to conclude that, on the dry-matter basis, the Kansas combination should prove superior to the other in nutritional value.
The Kansas ration was fed to two horses at this station in sub- stantially the same amounts on the basis of 1,000 pounds live weight, as in the experiments reported by the Kansas station in Table IV.
TABLE VII.—Rations fed
Horse Weight
Amounts actually fed to horses
Alfalfa Corn Oats Total
Joe _ Pounds
1,310 1,390
Pounds 11
. 12
Pounds 9.88
10.50
Pounds 2.50 2.75
Pounds 23.38
Tom 25.25
The digestible nutrients and the metabolizable and net-energy values in the Kansas ration, as well as the nutrients contained in a like amount of the substitute ration (namely, 23.38 and 25.*25 pounds), are given in Table VIII.
TABLE VIII.—Composition of rations
KANSAS RATION
/ Horse Weight Protein Fiber Extract matter Fat
Total (fatX 2.2)
Metabo- lizable energy
Net en- ergy
Joe Pounds
1,310 1,390
Pmnds 2.12 2.36
Pounds Pounds 8.98
10.27
Pounds 0.35 .46
Pounds 11.87 13.64
Therms 19.91 25.83
Therms 13.53
Tom 18.45
Average 1,350 2.24 9.63 .40 12.76 22.87 15.99
SUBSTITUTE RATION FOR COMPARISON
Joe • 1,275 1,390
1.60 1.76
0.93 1.77
7.32 8.64
0.20 .38
11.29 13.01
18.24 21.90
11.23 Tom _. 14.13
Average 1,300 1.68 1.35 7.98 .29 12.15 20.07 12.68
In Table IX the above data are summarized, and figures from three accepted standards are also shown.

578 Journal of Agricultural Research vol. xxxn, NO. e
TABLE IX.—Summary
Average weight
of horses
Digestible nutrients and energy values
Protein Fiber Extract matter
Pounds 9.63 7.98
Fat Total Metabo- lizable energy
Net energy
Kansas Pounds
1,350 1,350 1,350 1,350 1,350
Pounds 2.24 1.68 1.80 2.59 2.16
Pounds Pounds 0.40 .29
Pounds 12.76 12.15 16.88
Therms 22.87 20.07
Therms 15.99
Substitute 1.35 12.68 Lavalard's standard Grandeau's standard - 17.32
19.17 Kellner's standard
Compared on a dry-matter basis, the Kansas ration contained rather more total digestible nutrients and noticeably more metab- olizable and net energy than did a like amount of the substitute ration. Compared with generally accepted standards, both the Kansas and the substitute rations were oelow the requirements for total digestible nutrients.
These digestion and energy values agree with practical work trials with the horses. When the Kansas ration was fed for two months in the autumn, the horses doing light work a considerable part of the time held their weights, but they seemed hungry and were very rest- less and quite unsatisfactory to the teamster in charge. Kansas Ration II, which represented the original ration plus 10 per cent of the grain mixture, was fed for 42 days the following spring to the same horses. They were worked lightly at first, and as the work was increased they began to show a gradual loss in weight and seemed nervous and hungry. As the season advanced the entire Ration II -was increased 10 per cent, which improved their general temper, but they still seemed rather uneasy and hungry. Part of this uneasy condition may have been due to the lack of bulk in the ration.
Identical amounts of dry matter in the form of the substitute ration were not fed to the horses at work, but for a-period of 28 days each horse daily received, 33 pounds of the substitute mixture, which was estimated to contain 15.5 pounds of digestible nutrients and 17.25 therms of net energy, and the conclusion at the time was that they received sufficient nutrients to keep them in normal condition and give satisfactory service.
The writer's general conclusion is that a combination of corn, oats, and alfalfa (the Kansas ration), on the basis of dry matter, furnishes more nutrients and net energy than does a like amount of a com- bination of timothy, corn, oats, bran, and dried brewers' grains (the substitute ration), and that such a combination is likely to prove more economical if alfalfa is cheap enough. However, it was evident both on the basis of digestible nutrients and net energy as actually determined, as well as on work performed, that the amount of the Kansas ration fed to the Army horses (6.8 pounds of corn, 1.7 pounds of oats, and 8.5 pounds of alfalfa hay per 1,000 pounds of live weight) was not sufficient for horses doing medium farm work, and that an increase of some 20 per cent over the above figures would be neces- sary for satisfactory results.

Mar. is, 1926 Digestibility and Energy Values of Feeds for Horses 579
GROUND BARLEY AND HAY
To obtain the requisite data for the digestibility and energy values of barley, it was fed to the horses in combination with hay. The ration fed was 8 kilograms hay and 2.5 kilograms barley (Table X).
TABLE X.—Digestion coefficients and energy values
Series Period
Digestion coefficients (per cent) Energy values per 100 pounds
Horse Dry
matter Ash Pro- tein Fiber N-free
extract Fat Metab-
oliz- able
energy
Net energy
Joe III III
6 6
56.13 56.68
42.56 43.73
57.47 55.07
38.03 39.69
66.11 66.51
9.84 9.00
Therms 96.61 96.13
Therms 57.82
Tom 57.38
Average ..56.41 43.15 56.27 38.86 66.31 9.42 96.37 57.60
GROUND BARLEY
Next to oats, barley is recognized as a very satisfactory grain for horses. It is used quite freely in Europe and California.
The average composition of its dry matter was: Ash, 2.95 per cent; protein, 12.14; fiber, 5.98; N-free extract, 76.27; fat, 2.66. Its calorific value as determined was 200.9 therms per 100 pounds.
TABLE XI.—Digestion coefficients and energy values
Series Period
Digestion coefficients (per cent) Energy values per 100 pounds
Horse Dry
matter Ash Pro- tein Fiber N-free
extract Fat Meta- boliz- able
energy
Net energy
Joe III III
6 6
76.57 78.94
105.84 113.98
93.96 88.26
None. None.
86.25 87.66
17.25 14.21
Therms 166.27 161.55
Therms 152.36
Tom 148.03
Average 77.76 61.07.
109.91 C)
91.11 75.09
None. None.
86.95 72.21
15.73 57.05
163.91 133.04
150.20 Oats for comparison. 118.20
a Not averaged.
The barley had a high digestibility in all constituents except fiber and fat, which are present in such small amounts as to render the results for these ingredients of uncertain value. In net energy the results in Table XI give it a higher value than any other single feed examined. Its value in comparison with other carbonaceous feeds, based on results obtained in these experiments, will be discussed further on. Its value was considerably above that for oats, due in large measure to its lower fiber content. On account of price, bar- ley is not likely to prove an economical grain for horses in the eastern part of the country.

580 Journal of Agricultural Research vol. xxxn. No. 6
BREWERS' GRAINS AND HAY
Two separate lots of brewers' grains were fed, one in each of two consecutive series of experiments. The composition of the two lots is shown in Table XII.
TABLE XII.—Composition
Water as fed
Dry-matter basis
Lot
Ash Protein Fiber N -free extract Fat
Calorific value
per 100 pounds
I Per cent
6.77 8.58
Per cent 3.41 3.28
Per cent 27.94 29.64
Per cent 16.06 15.11
Per cent 45.65 45.00
Per cent 6.94 6.97
Therms 229. 52
II . 229. 07
The composition is seen to have been uniform. The high calorific value is worthy of mention, due to the fat present. Table XIII shows the digestibility and net-energy coefficients of the combined ration of 8 kilograms hay and 2.5 kilograms brewers' grains.
TABLE XIII.—Digestion coefficients and energy values
BREWERS' GRAINS AND HAY
Series Period
Digestion coefficients (per cent) Energy values per 100 pounds
Horse
Dry matter Ash Pro-
tein Fiber N-free extract Fat
Meta- boliz- able
energy
Net energy
Joe.- . II II III III
5 5 3 3
43.40 47.96 49.70 51.17
24.27 28.60 22.00 27.32
65.07 66.75 59.09 61.03
37.62 42.85 39.98 41.30
44.96 49.86 56.35 57.17
19.57 24.66 23.86 31.47
Therms «75.06 «83.20
97.09 101.85
Therms «32.32
Tom «39.73 Joe - _ 54.73 Tom 59.06
Average.. 48.06 25.55 62.99 40.44 52.09 24.89 99.47 56.90
« Not included in the average.
In each of the two experiments, Joe digested less than did Tom. The two horses seemed to utilize the second ration better than the first, although the results do not show wide variations. Deducting the digestibility and energy values of the hay, as previously deter- mined, from those of the combined ration, the results for the brewers;
grains are as given in Table XIV.

Mar. 15,1926 Digestibility and Energy Values of Feeds for Horses 581
TABLE XIV.—Digestion coefficients and energy values
BREWERS' GRAINS
Series Period
Digestion coefficients (per cent) Energy values per 100 pounds
Horse Dry
matter Ash Pro- tein Fiber N-free
extract Fat Meta- boliz- able
energy
Net energy
Joe II II III iir
5 5 3 3
«32.26 50.93 48.03 54.06
15.02 42.49
None. 10.42
79.18 84.09 71.82 74.64
«None. 21.99 20.08
«30.09
«24.68 46.02 49.81 53.88
38.59 48.61 40.38 55.42
Therms «74.58 «107.04 163.37 180.43
Therms «45.60
Tom. « 75.19 Joe _ 133.06 Tom 148.61
Average 51.01 (*) 77.43 27.39 49.90 45.75 171.90 140.48
« Not included in the average. * Not averaged.
In the first experiment, assuming that Joe digested the fiber and extract matter in the ha^ when fed in the combined ration'as well as when fed by itself, it is evident that he'experienced difficulty in digest- ing these ingredients contained in the alfalfa, and these results are excluded from the average as well as those for the'metabohzable and net-energy values. The other results, excepting those for the metab- olizable and net energy in case of Tom in the first experiment are about as uniform as could be expected. In each experiment the horses experienced apparent-difficulty in digesting the fiber, extract matter, and fat, while they handled the protein without trouble. This is the only material investigated in which energy value (note Tom in Series II) is high when the total digestibility and fiber digestibility are relatively low. A satisfactory explanation is not apparent.
CORN AND ITS BY-PRODUCTS
Shelled corn, corn meal, corn bran, corncobs, and gluten feed were investigated. The object was to compare the digestibility of whole corn with corn meal, andjikewise to obtain some definite data relative to the ability of the horse to digest the several corn by-products. Analytical data are shown in Table XV.
TABLE XV.—Composition of corn and corn by-products
Water as fed
Dry-matter basis
Material Ash Protein Fiber N-free
extract Fat Calorific
value per 100 pounds
Corn (shelled) Per cent
13.40 15.91 16.81 9.38
13.03 18.67
Per cent 1.38 1.52 1.54 4.59 1.12 1.70
Per cent 9.88
10.93 10.09 28.58
7.54 3.14
Per cent 3.03 1.88 2.59 6.63
12.15 30.23
Per cent 81.58 80.65 82.13 57.69 77.86 64.22
Per cent 4.13 5.03 3.65 2.51 1.33 .72
Therms 199.58
Cracked corn «._ - 200.49 Com meal 203.67 Gluten feed * - 214.71 Com bran 203.21 Corncobs - 205.48
« Average of two lots. Lack of time prevented digestion and energy determinations. h Average of three lots.
§3560—m—§

582 Journal of Agricultural Research vol. xxxn, No. 6
The tabulation of Table XV simply emphasizes the strictly car- bonaceous nature and low ash content of these feeds, the one excep- tion being gluten feed, to which a little lime was evidently added in the process of manufacture. The calorific value of each of the products was substantially the same.
It was intended to have the corn meal represent the sample of whole corn ground, but judging from the anlaysis this was not strictly the case. The writers are reasonably sure, however, that the corn meal was ground whole corn.
SHELLED CORN AND HAY
Table XVI represents .the digestion coefficients and energy values of the combined ration of 8 kilograms hay and 2.5 kilograms corn.
TABLE XVI.—Digestion coefficients and energy values
Series Period
Digestion coefficients (per cent) Energy value per 100 pounds
Horse Dry
matter Ash Pro- tein Fiber N-free
extract Fat Metab-
oliz- able
energy
Net energy
Joe II II
7 7
72.28 76.69
None. 37.65
61.22 62.04
None. None.
86.10 84.40
13.16 30.82
Therms 87.57 89.32
Therms 47.01
Tom... 48.60
The results in regard to uniformity are all that could be expected.
CORN MEAL AND HAY
The digestion coefficients and energ y values of the combined ration (8 kilograms hay and 2.5 kilograms corn meal) are shown in Table XVII. The results agree quite closely with those for hay and shelled corn.
TABLE XVII.—Digestion coefficients and energy values
Series Period
Digestion coefficients (per cent) Energy value per 100 pounds
Horse Dry
matter Ash Pro- tein Fiber N-free
extract Fat Metab-
oliz- able
energy
Net energy
Joe. .. .. . II II
6 6
73.98 72.70
18.83 13.89
84.14 60.55
None. None.
86.43 84.99
32.31 25.28
Therms 87.64 88.27
Therms 48.08
Tom.-. 48.74
CORN (SHELLED)
The digestibility and energy values of the shelled corn were ob- tained by determining the values for the hay and corn as given above and then deducting therefrom the digestibility and energy of the hay as determined in a separate experiment. (Table XVIII.)

Mar. 15,1926 Digestibility and Energy Values of Feeds jor Horses 583
TABLE XVIII.—Digestion coefficients and energy values
Series Period
Digestion coefficients (per cent) Energy value per 100 pounds
Horse Dry
matter Ash Pro- tein Fiber N-free
extract Fat Metab-
oliz- able
energy
Net energy
Joe II II
7 7
72.28 76.69
None. 37.65
58.95 64.31
None. None.
86.10 84.41
41.73 59.39
Therms 128.25 134.86
Therms 109 53
Tom 115.54
Average 74.49 C) 61.63 None. 85.26 50.56 131.56 112.54
* Not averaged. CORN MEAL
The coefficients for the corn meal, determined in a similar way to the shelled corn, are given in Table XIX.
TABLE XIX.—Digestion coefficients and energy values
Series Period
Digestion coefficients (per cent) Energy value per 100 pounds
Horse Dry
matter Ash Pro- tein Fiber N-free
extract Fat Metab-
oliz- able
energy
Net energy
Joe II II
6 6
73.98 70.68
18.83 9.96
81.84 61.39
None. None.
86.43 83.52
66.13 58.65
Therms 129.80 131.10
Therms 116.18
Tom 117.31
Average 72.33 C) 71.62 None. 84.98 62.39 130.45 116.75
0 Not averaged. COMPARISON SHELLED CORN V. CORN MEAL
Period Dry matter Ash Protein Fiber
Ex- tract
matter Fat
Energy value per 100 pounds
Series Metab-
oliz- able
Net
H _ . 7 6
74.49 72.33
(?) (?)
61.63 71.62 8 85.26
84.98 50.56 62.39
Therms 131.56 130.45
Therms 112.54
II 116.75
OATS FOR COMPARISON
11. 5 61.07 (?) 75.09 (?) 72.21 57.05 133.04 118.20
The figures in Table XIX indicate that, so far as one is able to form an opinion from the results of a single trial with two horses, the animals were able to utilize the whole corn equally as well as the ground article. The net-energy values agree quite closely with those given by Armsby for dent corn (#, p. 7%1).

584 Journal of Agricultural Research vol. xxxn, No. e
CORN BRAN AND HAY
Corn bran is the outer layer or skin of the corn kernel. It seldom appears as such on the market, most of it being used as an ingredient in gluten feed and other commercial feeding materials. Compared with wheatábran;fit contains about half as much protein, less ash and fat, rather more fiber, and nearly 50 per cent more extract matter (Table XX). The ration fed was 8 kilograms hay and 2 kilograms corn bran.
TABLE XX.—Digestion coefficients and energy values
Series Period
Digestion coefficients (per cent) Energy value per 100 pounds
Horse Dry
matter Ash Pro- tein Fiber N-free
extract Fat Metab-
oliz- able
energy
Net energy
Joe II II
2 2
45.23 51.42
28.19 34.40
42.66 47.06
39.06 48.19
51.51 56.15
12.48 21.93
Therms 71.91 86.69
Therms 28.30
Tom 41.75
Average 48.33 1 31.30 44.86 43.63 53.83 17.21 79.30 35.03 -^
Joe was not digesting as well as Tom, both the coefficients and energy values for him being noticeably below those for Tom.
CORN BRAN
TABLE XXI.—Digestion coefficients and energy values
Series Period
Digestion coefficients (per cent) Energy value per 100 pounds
Horse Dry
matter Ash Pro- tein Fiber N-free
extract Fat Metab-
oliz- able
energy
Net energy
Joe. II II
2 2
66.58 85.80
180.90 190.91
35.08 69.97
123.18 157.82
60.89 72.60
16.08 81.37
Therms 100.61 160.11
Therms 73.78
Tom 127.90
Average 76.19 185.86 (a) 140.50 66.75 C) (*) (0) Wheat bran (for
comparison) & 51.00 16.44 83.37 65.32 45.78 (*) 69.93 52.34
a Not averaged. b The figures given here for wheat bran are not the average results presented later in this article but are those obtained in an experiment immediately succeeding the one in which corn bran was fed. Because of the close proximity of the two experiments, they are thought to be more comparable than the average results for wheat bran, in which there is a great deal of irregularity.
The results for the corn bran are not satisfactory, the divergencies being altogether too great. Joe had a markedly negative nitrogen balance, while Tom showed a gain in nitrogen. Despite the irregu- larity in results, the corn bran is probably fairly well utilized by horses, and evidently it has value considerably above wheat bran as an element in the horse ration.

Mar. 15,1926 Digestibility and Energy Values of Feeds for Horses 585
GLUTEN FEED AND HAY
Gluten feed combined with hay constitutes a very satisfactory basal ration for the study of materials that can not be successfully fed unless mixed with some other concentrate. Inf^the first of the two trials, results of which are recorded in Table XXII, it was fed as a |basal ration for corncobs. The second trial was included in a later series because of the poor results obtained for the gluten feed in the first. The ration fed consisted of 8.5 kilograms hay and 1.5 kilograms gluten feed.
TABLE XXII.—Digestion coefficients and energy values
Series Period
Digestion coefficients (per cent) Energy value per 100 pound
Horse Dry
matter Ash Pro- tein Fiber N-free
extract Fat Metab-
oliz- able
energy
Net energy
Joe IV IV V V
5 5 3 3
54.28 54.89 49.98 48.37
40.29 38.34 24.51 28.85
62.28 60.94 69.29 66,89
48.25 49.04 42.30 39.24
59.51 60.74 55.71 54.45
11.41 9.59
None. None.
Therms 84.02 85.31 84.47 80.73
Therms 41.71
Chub 42.88 Joe 41.83 Chub 38.49
Average 51.88 (•) 64.85 44.71 57.60 («) 83.63 41.23
» Not averaged.
The results for the combined ration are reasonably uniform. When an attempt was made to calculate the digestibility and energy- values for the gluten feed, by; deducting the amount of hay digested, the data for the gluten feed itself seemed so unsatisfactory that the results are not published.
CORNCOBS, GLUTEN FEED, AND HAY
Corncobs were added to a basal ration of gluten feed and hay in order to determine their digestibility and energy values, the ration fed being 8 kilograms hay, 1.5 kilograms gluten feed, and 1.5 kilo- grams corncobs (Table XXIII).
TABLE XXIII.—Digestion coefficients and energy values
Series Period
Digestion coefficients (per cent) Energy values per 100 pounds
Horse Dry
matter Ash Pro- tein Fiber N-free
extract Fat Metab-
oliz- able
energy
Net energy
Joe IV IV
6 6
51.33 51.52
29.12 32.19
60.81 57.72
43.13 43.70
57.79 58.19
None. None.
Therms 78.08 78.94
Therms 36.53
Chub 37.31
Average 51.43 30.66 59.27 43.42 57.99 None. 78,51 36.92
The data for the total rations are quite satisfactory, showing that each horse digested them equally well.

586 Journal of Agricultural Research vol. xxxn, No. n
CORNCOBS
TABLE XXIV.—Digestion coefficients and energy values
Series Period
Digestion coefficients (per cent) Energy values per 100 pounds
Horse Dry
matter Ash Pro- tein Fiber N-free
extract
44.01 46.86
Fat Metab-
oliz- able
energy
Net energy
Joe IV IV
6 6
24.38 25.91
None. None.
32.71 None.
2.46 6.97
None. None.
Therms 34.47 32.14
Therms None.
Chub None.
Average _ . 25.15 None. (a) (') 45.44 None. 33.31 None.
a Not averaged.
The horses were able to digest 25 per cent of the cobs, and this material evidently was the extractive or carbonaceous matter. Fiber (of which the cobs contained 30 per cent) was attacked very little if any, which evidently was due to its chemical structure. The energy expended in digesting the cobs rendered the net-energy value a minus quantity. The corn and cob may be ground together and fed; the latter comprises some 16 per cent of the ear, and can serve as a distributer of the grain, but can not be considered as furnishing the horse any real food (Table XXIV).
Summarizing the results with corn and its products : Whole corn and corn meal were about equally utilized and contain,
respectively, 113 and 117 therms of net energy per 100 pounds. The results with gluten feed were so unsatisfactory that they were
discarded. It can be assumed, however, that gluten feed contains about the same amount of energy per 100 pounds as does the corn from which it was made.
The results with corn bran were not satisfactory, but they indicated that it has considerable energy value, probably double that found in wheat bran.
Corncobs are of no energy value to horses.
COTTONSEED MEAL
Two lots of cottonseed meal were fed, the first in Series IV, with hay and wheat bran as the basal ration, the second in Series V with hay and oats.
The composition of the two lots is shown in Table XXV.
TABLE XXV.—Composition of cottonseed meal
Water as fed
Dry-matter basis
Lot Ash Protein Fiber N-free
extract Fat Calorific
value per 100 pounds
I Per cent
7.62 8.76
Per cent 7.10 6.68
Per cent 37.51 41.27
Per cent 19.69 12.79
Per cent 28.04 31.22
Per cent 7.66 8.01
Therms 224.53
II 225.44

Mar. 15,1926 Digestibílüy and Energy Values of Feeds for Horses 587
The analyses show the first lot to be the ordinary "good" grade of meal, while the second lot would be rated " choice. " The fiber in Lot I is unusually high, but is an average of six closely agreeing determinations, so the figure is not questioned.
COTTONSEED MEAL, WHEAT BRAN, AND HAY
In Series IV, period 3, the total ration consisted of 8.5 kilograms of hay, 1.5 kilograms of wheat bran, and 1.5 kilograms of cottonseed meal. In Series V, period 6, it consisted of 8.5 kilograms of hay, 1.5 kilograms of oats, and 1.5 kilograms of cottonseed meal. The horses digested and utilized the total ration in a fairly uniform man- ner. The results for the total ration are given in Table XXVI, and for cottonseed meal in Table XXVII.
TABLE XXVI.—Compositon
I. COTTONSEED MEAL, WHEAT BKAN, AND HAY
Series Period
Digestion coefficients (per cent) Energy value per 100 pounds
Horse Dry
matter Ash Pro- tein Fiber N-free
extract Fat Metab-
oliz- able
energy
Net energy
Joe.. - - IV IV
3 3
54.00 51/97
29.16 28.27
68.56 67.13
42.99 42.26
60.77 57.99
34.34 29.36
Therms 84.95 81.35
Therms 43.00
Chub 39.72
Average _ . 52.98 28.72 67.85 42.63 59.38 31.85 83.15 41.36
II. COTTONSEED MEAL, OATS, AND HAY
Joe Chub..
Average..
V V
47.34 48.32
25.00 29.24
27.12
70.19 68.99
38.02 «¿.85
49.65 51.93
40.03 42.05
41.04
80.71
82.19
39.39 42.08
40.74
TABLE XXVII.—Cottonseed meal
Series Period
Digestion coefficients (per cent)
_ Energy value
per 100 pounds
Horse Dry
matter Ash Pro- tein Fiber N-free
extract Fat Metab-
oliz- able
energy
Net energy
Joe- . IV IV V V
3 3 6 6
60.51 71.36 62.28 69.48
51.07 67.64 77.35
106.22
83.95 88.61 86.73 83.76
23.03 64.66 38.35 19.29
70.52 57.86 35.60 61.62
89.80 102.10 86.91 93.25
Therms 101.96 130.62 103.39 138.35
Therms 61.39
Chub 87.41 Joe 72.64 Chub 104.42
Strictly, the results for the two lots can not be compared, for the reason that the first lot was noticeably lower in protein and higher in fiber than the second lot. Joe continued his inability to handle the feed to as good advantage as Chub. The data show that the horses digested the protein quite well and as completely
588 Journal of Agricultural Research vol. xxxn, NO. 6
as do ruminants. The fiber was much less fully utilized, but on the whole the coefficients were apparently equal to the coefficients for bovines. The digestibility of the extract matter varied noticeably, and this material was less completely utilized than it is in the case of the ruminant. While the fat coefficients varied, it is evident that the horses were able to make almost complete use of the fat.
The net-energy values likewise varied, due in part to the poor digestion of the horse Joe. It is clear, however, that the meal with the high percentage of fiber yielded less energy than that with the smaller amount. It is hardly fair to average the results obtained with the two horses, although they show 74 and 88 therms per 100 pounds, respectively, for the two different lots of meal. The data obtained for Chub are probably more reliable than those for Joe.
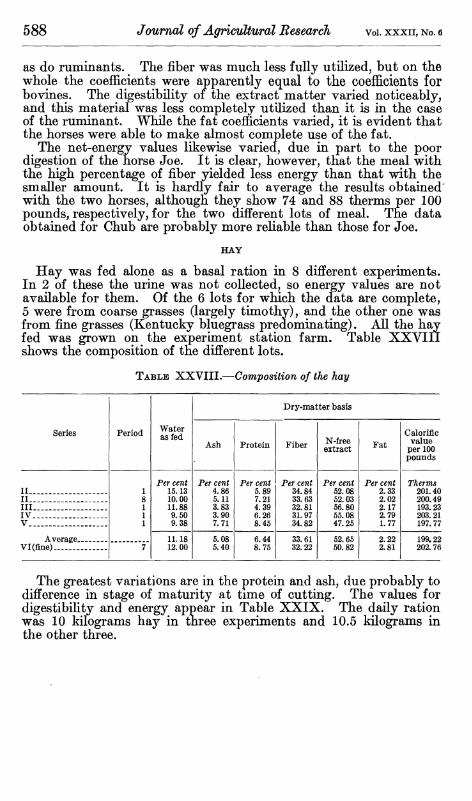
HAY
Hay was fed alone as a basal ration in 8 different experiments. In 2 of these the urine was not collected, so energy values are not available for them. Of the 6 lots for which the data are complete, 5 were from coarse grasses (largely timothy), and the other one was from fine grasses (Kentucky bluegrass predominating). All the hay fed was grown on the experiment station farm. Table XXVIÏ1 shows the composition of the different lots.
TABLE XXVIII.—Composition of the hay
Period Water as fed.
Dry-matter basis
Series Ash Protein Fiber N-free
extract Fat
Calorific value
per 100 pounds
II _. 1 8 1 1 1
Per cent 15.13 10.00 11.88 9.50 9.38
Per cent 4.86 5.11 3.83 3.90 7.71
Per cent 5.89 7.21 4.39 6.26 8.45
Per cent 34.84 33.63 32.81 31.97 34.82
Per cent 52.08 52.03 56.80 55.08 47.25
Per cent 2.33 2.02 2.17 2.79 1.77
Therms 201.40
11 200.49 III 193.23 IV._ _ .. 203.21 V __. 197.77
Average 11.18 12.00
5.08 5.40
6.44 8.75
33.61 32.22
52.65 50.82
2.22 2.81
199.22 Vl(fine)- 7 202. 76
The greatest variations are in the protein and ash, due probably to difference in stage of maturity at time of cutting. The values for digestibihty and energy appear in Table XXIX. The daily ration was 10 kilograms hay in three experiments and 10.5 kilograms in the other three.

Mar. 15,1926 Digestibility and Energy Values of Feeds for Horses 589
TABLE XXIX.—Digestion coefficients and energy values
COAESE HAY
Series Period
Digestion coefficients (per cent) Energy value per 100 pounds
Horse Dry
matter Ash Pro- tein Fiber N-free
extract Fat Metab-
oliz- able
energy
Net energy
Joe.... II II II II III III IV IV V V
1 1 8 8 1 1 1 1 1 1
39.89 43.46 46.65 46.78 49.00 50.67 54.17 53.86 42.25 41.82
20.11 26.36 26.09 26.06 29.56 34.57 40.42 43.92 19.48 21.90
44.89 39.72 49.47 47.44 34.25 26.85 48.38 45.60 55.51 52.84
32.11 39.03 45.48 45.78 41.56 43.88 47.77 46.15 42.03 41.43
47.64 49.78 51.19 51.37 57.38 59.14 61.52 61.89 45.79 45.61
11.78 13.62
None. None.
6.46 8.39
14.42 15.99
None. None.
Therms 64.88 68.70 75.22 75.49 75.72 76.51 84.66 83.98 67.06 65.21
Therms 17.16
Tom... -_ . 20.64 Joe — 28.03 Tom 28.27 Joe 29.47 Tom... 30.19 Joe . 38.61 Chub 37.99 Joe 19.17 Chub 17.49
Average 46.86 28.85 44.50 42.52 53.12 (a) 73.74 26.70
FINE HAY
Joe Chub.
IV IV
Average Timothy hay, average of 72 experi-
ments with sheep.
53.07 48.14
50.61
55.00
31.25 25.58
28.42
39.00
61.27 53.77
57.52
47.00
48.76 45.95
47.36
51.00
58.89 53.50
56.20
62.00
13.65 2.19
(«) 50.00
86.21 72.26
79.24
(6)
39.72 27.03
33.38
(>)
» Not averaged. 6 Not determined.
A study of the analysis and the results of the digestion and energy tests shows clearly that the higher the percentage of fiber the lower the metabolizable and net energy value. Thus, the hay fed in Series II, period 1, had 34.84 per cent of fiber; its metabolizable energy averaged 66.79, and its net-energy value averaged 18.9 therms per 100 pounds. The hay fed in Series V, period 1, contained sub- stantially the same percentage of fiber, and averaged 66.13 therms of metabolizable and 18.33 therms of net energy per 100 pounds. The hay fed in Series IV, period 1, contained the lowest amount of fiber, and its fiber content was quite close to that of the fine hay fed in Series IV, period 7, namely, 32 per cent; the metabolizable energy was 84.32 and 79.24 therms, respectively, and the net-energy values of the hays in these two periods were 38.30 and 33.37 therms per 100 pounds, respectively. In case of the fine hay (Series IV, period 7) Chub did not digest as well as Joe, which explains its apparent lower energy value. The hay in Series II, period 8, and Series III, period 1, averaged 33.22 per cent fiber; the metabolizable energy was 75.35 and 76.11 therms, respectively, and the respective net-energy values were 28.15 and 29.83, figures midway between the low and the high net-energy values for the other lots. These results confirm the writers7 hitherto accepted understanding, that stage of growth has a pronounced influence upon the nutritive value of hay—the more advanced the growth the higher the fiber content is likelv to be and the less the net-energy value. The results also indicate tnat stage of growth is likely to be fully as important as variety in furnisning energy. One can not say that timothy or redtop, when fed to the

590 Journal of Agricultural Research vol. xxxn, NO. e
horse, contains 25 or 30 or 35 therms of energy per 100 pounds, because the earhness or lateness of cutting is bound to have a pro- nounced influence. On the basis of the writers' results, hay with 35 per cent of fiber is not likely to furnish more than 20 therms, while hay with 32 per cent fiber may furnish 34 or more therms of net energy per 100 pounds. It would be interesting to still further study this particular problem.
LINSEED MEAL
The composition of ,the two lots of linseed meal used is shown in Table XXX.
TABLE XXX.—Composition of linseed meal
Water as fed
Dry-matter basis
Lot
Ash Protein Fiber N-free extract Fat
Calorific value
per 100 pounds
I Per cent
10.44 10.17
Per cent 5.14 6.63
Per cent 38.78 34.55
Per cent 8.95 8.55
Per cent 40.98 42.87
Per cent 6.15 7.40
Therms 205.03
II 214.55
It is quite evident that the oil had not been as completely extracted from Lot II as from Lot 1, this accounting for the somewhat higher fat percentage and calorific value for Lot II. The linseed meal was added to two distinct basal rations, namely, hay and wheat bran, and hay and oats. The digestion and energy results of the total ration are given in Table XXXI. The ration fed was 8.5 kilograms hay; 1.5 kilograms wheat bran, and 1.5 kilograms linseed meal.
TABLE XXXI.—Linseed meal, wheat bran, and hay
Series Period
Digestí on coefficients (per cent) Energy values per 100 pounds
Horse
Dry matter Ash Pro-
tein Fiber N-free extract Fat
Metab- oliz- able
energy
Net energy
Joe IV TV
4 4
53.17 51.71 52.44
52.98
30.46 32.30 31.38
28.72
71.83 68.63 70.23
67.85
42.26 38.18 40.22
42.63
58.78 58.78 58.78
59.38
20.62 19.14 19.88
31.85
Therms 88.84 85.06 86.95
83.15
Therms 48.14
nhnh 44.61 Average
Cottonseed, bran, narison) _, _
an d hay (for corn- 46.38
41.36
In Table XXXII are shown the results when 1.5 kilograms oats were fed instead of 1.5 kilograms wheat bran as shown in the pre- vious table.

Mar. 15,1926 DigesíibUity and Energy Values of Feeds for Horses 591
TABLE XXXII.—Linseed meal, oats, and hay
Horse Series Period
Digestion coefficients (per cent)
Dry matter Ash Pro-
tein Fiber N-free extract Fat
Energy values per 100 pounds
Metab- oliz- able
energy
Net energy
Joe V 7 Chub V 7
Average _ __ _. Cottonseed, oats, and hay (for com-
parison)
46.53 43.71 45.12
47.83
27.76 25.37 26.56
64.27 65.32
35.11 29.98 32.55
37.44
51.55 50.05 50.80
20.02 14.66 17.34
Therms 77.78 74.53 76.16
82.19
Therms 38.36 35.40 36.88
40.74
The combination of linseed meal, oats, and hay showed a lesser degree of digestibility and energy value than did the linseed meal, bran, and hay ration. However, the results obtained with the two horses in each trial are as uniform as could be expected.
TABLE XXXIII.—Digestion coefficients and energy values
Series Period
Digestion coefficients (per cent) Energy values per 100 pounds
Horse Dry
matter Ash Pro- tein Fiber N-free
extract Fat Metab-
oliz- able
energy
Net energy
Joe IV IV V V
4 4 7 7
54.27 69.77 56.59
« 35.59 60.21 65.91
71.54 116.97
> 101.22 83.88 93.40 (>)
92.34 93.01 79.12 73.41 84.47 85.76
None. None. None. None. None. None.
48.07 65.67 55.95 42.47 53.04 63.33
38.80 68.17 24.12 7.91 (b)
93,02
Therms 132.13 160.05 81.87 70.92 (6)
118,58
Therms 101.15
Chub . 125.84 Joe_- 65.79 Chub 55.74
A VAracp. (6) Cottonseed meal (for comparison) 81.47
1 Omitted from the average. » Not averaged.
The results given in Table XXXIII are quite unsatisfactory. A careful study of all the data fails to locate any particular cause for the variation. The protein coefficients indicate a high degree of digesti- bility, and it can be assumed that linseed meal should be fully as well utilized by horses as was the cottonseed meal.
OATS
Oats are generally regarded as being the food par excellence for horses, and because of the prevalence of this idea they are apt to be high-priced and at times uneconomical. They were fed in combina- tion with hay to determine their digestibility and energy values, and the combination was utilized as a basal ration for a similarstiidy of other concentrates. Their composition, as fed was water 10.97 per cent; and dry matter 89.03 per cent, of which (considering the dry matter as 100 per cent) 3.35 per cent was ash, 13.38 per cent protein, 10.39 per cent fiber, 67.56 per cent nitrogen-free extract, and fat 5.32 per cent. The calorific value was 207.75 therms per 100 pounds. The ration consisted of 8.5 kilograms hay and 1.5 kilograms oats (Table XXXIV).

592 Journal of Agricultural Research vol. xxxn, NO. e
TABLE XXXIV.—Digestion coefficients and energy values
OATS AND HAY
Series Period
Digestion coefficients (per cent) Energy values per 100 pounds
Horse Dry
matter Ash Pro- tein Fiber N-free
extract Fat Metab-
oliz- able
energy
Net energy
Joe_ V V
4 4
44.38 45.32
12.19 19.47
57.88 59.40
38.15 38.80
50.94 51.26
18.71 17.35
Therms 77.15 75.08
Therms 34.17
Chub 32.30
Average 44.85 15.83 58.64 38.48 51.10 18.03 76.12 33.24
OATS
Joe V V
4 4
57.95 64.19 ~""(j."98"
71.69 78.48
None. None.
71.45 72.97
59.32 54.78
134.86 131.22
119.88 Chub 116.51
Average 61.07 C) 75.09 None. 72.21 57.05 133.04 118. 20
Oats fed to bovines 1
70.00 74.49 ""(•)"■
77.00 61.63
35.00 None.
80.00 85.26
89.00 50.56 Corn (for comparison ) 131.56 112.54
« Not averaged.
The results for the combined rations (Table XXXIV) were all that could be desired, the coefficients and energy values being quite uniform. The data obtained for the coefficients and energy values for the oats themselves are also satisfactory, only comparatively small diflferences being noted.
The horses did not seem to digest the fiber, nor to digest the fat or extract matter as well as ruminants do, but the protein seems to have been as fully utilized. Corn, as a whole, is more completely digested than oats; but the oats in the present experiment, for some unexplain- able reason, apparently yielded more net energy than corn. Such data show that other experiments would be worth while, in order to ascertain definitely the comparative values of these two grains for horses.
OAT FEED
This material is a by-product of oatmeal manufacture, consisting of the reground hulls plus the middlings and dust from the first milling, its value as a feed for different classes of farm stock was studied by this station some years ago, and a report of the investiga- tion was published in bulletin form (<S).
Its composition was water 9.53 per cent and dry matter 90.47 per cent, of which (regarding all the dry matter as 100 per cent) 4.96 per cent was ash, 5.85 per cent protein, 26.72 per cent fiber, 58.98 per cent nitrogen-free extract, and 2.49 per cent fat. The calorific value was 199.13 therms per 100 pounds. Its digestibility and energy values are presented m Table XXXV, the ration fed being 8 kilograms hay and 2.5 kilograms of oat feed.

Mar. 15,1926 Digestibility and Energy Values of Feeds for Horses 593
TABLE XXXV.—Digestion coefficients and energy values OAT FEED AND HAY
Series Period
Digestion coeflScients (per cent) Energy values per 100 pounds
Horse Dry
matter Ash Pro- tein Fiber N-free
extract Fat Metab-
oliz- able
energy
Net energy
Joe III III
5 5
48.32 49.17
27.27 27.56
39.92 38.82
45.37 46.16
53.37 54.15
17.37 26.60
Therms 80.50 81.11
Therms 35.73
Tom 36.28
Average 48.75 27.42 39.37 45.77 53.76 21.99 80.81 36.01
OAT FEED
Joe Ill III
5 5
42.98 46.55 44.77
17.23 18.14 17.68
60.33 56.71 58.52
54.66 58.40 56.48
39.14 42.31 40.73
44.03 76.99 60.51
95.66 95.71 95.69
55.59 Tom 55.60
Average 55.60
The uniformity of the data for both the oat feed and hay and for the oat feed itself are quite remarkable. They show the fiber in the oat feed to be some 56 per cent digestible, while the fiber in the ground oats was not digested at all. This apparent contradiction must be due largely to the relatively small percentage of fiber in the ground oats as compared with that in the oat feed. The writer's experience also has made it seem that fiber especially may be more fully attacked in the digestive tract at some times than at others. Again, it hardly seems possible to the writer that oat feed, containing 26 per cent of fiber and composed of substantially 80 per cent oat hulls and 20 per cent of fine middlings, can contain 56 therms of net energy, or fully one-half as many as corn meal. (See also the results with oat hulls.) The data are presented as obtained, and it is hoped that it will be possible to maKe further study of this material, and also of the oats themselves. It can be said, tentatively, that oat feed of the character described here should be at least fully equal in feeding value to a good quality of hay.
OAT HULLS
Thousands of tons of oat hulls are produced annually by the oat- meal manufacturers. Most of this material is mixed with the oat middlings and dust and sold as "oat feed." Within the past few years considerable work has been carried on, both in this country and in Germany, in attempts to improve by various processes the nutritive value of this and other fibrous materials. In this country the Massachusetts station has done the most work {1 ) on the problem.
The hulls were fed with hay and dried brewers' grains as a basal ration. Their composition was as [follows: Water 8.57 per cent, and dry matter 91.43 per cent, 6.59 per cent of the dry matter being ash, 2.52 per cent protein, fiber 33.04 per cent, nitrogen-free extract 56.83 per cent, andj fat 1.02 per cent. Calorific value, 197.32 therms per 100 pounds, i The hulls consisted]principally of fiber and nitrogen- free extract, and these are made up largely of pentosans, cellulose, and lignin, there being very little readily soluble carbohydrate present. The results of the experiment are given in Table XXXVI, the ration fed being 8 kilograms hay, 2.5 kilograms brewers7 grains7 2 kilograms oat hulls.

594 Journal of Agricultural Research vol. xxxn, No. 6
TABLE XXXVI.—Digestion coefficients and energy values OAT HULLS, DRIED BREWERS' GRAINS, AND HAY
Horse Series Period
Digestion coefficients (per cent)
Dry matter
Pro- tein Fiber N-free
extract Fat
Energy values per 100 pounds
Meta- boliz- able
energy
Net energy
Joe... Tom.
Ill III
Average..
45.88 45.24
27.58 26.85
62.79 61.99
38.56 36.22
49.16 49.37
30.67 31.33
Therms] 78.66 78.61
Therms 37.29 37.24
27.22 62.39 37.39 31.00 78.64 37.27
Brewers' grains and hay (for com- parison) ¡ 48.06 25.55 62.99 40.44 52.09 24.89 99.47 56.90
OAT HULLS
Joe III III
4 4
24.36 20.39
35.68 32.66
122.76 104.80
27.86 15.30
9.75 11.00
76.46 88.42
None. None.
None. Tom None.
Average 22.38 34.17 113. 78 (*) 10.38 82.44 None. None.
«Not averaged.
The digestibility and energy value of the total ration obtained were very uniform. The addition of hulls to the basal ration of hay and brewers7 grains reduced the energy value one-third, that is, from 56.90 for the hay and brewers' grains to 37.27 for the hay, brewers' grains, and oat hulls.
While the results of the digestibility of the oat hulls themselves were concordant with the two horses, the coefficients are low, show- ing that scarcely one-fourth of the material was utilized. The fiber in the hulls was poorly digested, and as a result of the several trials with the oats, the oat feed, and the hulls, it can be assumed that horses are not able to digest the fiber to any appreciable extent. By the time the hulls were digested so much energy had been required in the process that none was left for production, which explains the negative net-energy value.
WHEAT BRAN
Wheat bran combined with hay was fed extensively throughout this entire investigation, in some cases as a component of a basal ration for other feeds, and in others to measure the value of the bran as a horse feed. ^The composition of the several lots of bran is given in Table XXXVII.
TABLE XXXVII.—Composition of wheat bran
Water as fed
Dry-matter basis
Lot Ash Protein Fiber N-free
extract Fat Calorific
value per 100 pounds
I Per cent
11.70 10.78 12.36 12.13
Per cent 7.10 6.87 7.49 7.54
Per cent 17.04 15.83 17.47 16.80
Per cent 10.57 11.29 10.53 11.40
Per cent 60.58 61.02 59.31 58.53
Per cent 4.71 4.99 5.20 5.73
Therms 190.97
II 203.67 III 208. 20 IV 207.75

Mar. 15,1926 Digestibility and Energy Values of Feeds for Horses 595
The results of the numerous trials are summarized in Table XXXVIIL
TABLE XXXVIII.—Digestion coefficients and energy values
WHEAT BRAN AND HAY
Ration fed: 8 kilograms hay, 2 kilograms bran
Series Period
Digestion coefficients (per cent) Energy values per 100 pounds
Horse
Dry matter Ash Pro-
tein Fiber N-free extract Fat
Metab- oliz- able
energy
Net energy
Joe II II
3 3
41.31 45.50
19.21 23.57
57.52 59.15
35.39 39.86
46.18 50.33
None. 9.01
Therms 63.73 71.11
Therms 22.25
Tom 28.96
Ration fed: 8 kilograms hay, 2.5 kilograms bran
Joe___ Tom.
Ill 2 51.56 33.00 61.61 38.39 59.55 18.10 III 2 45.90 26.41 55.37 30.73 54.94 13.31
85.71 73.55
45.49 34.43
• Ration fed: 8.5 kilograms hay, 1.5 kilograms bran
Joe . - IV IV
2 2
52.73 48. 73
23.78 19.34
56.86 50.84
45.48 40.41
60.30 57.55
15.41 4.47
82.35 73.82
40.19 Chub 32.43
Ration fed: 8.5 kilograms hay, 1.5 kilograms bran
Joe . - V 2 V 2
43.25 44.39
14.46 19.96
61.13 60.38
35.50 35.97
49.49 50.88
23.37 70.77 22.92 71. 73
29.17 iOhub 30.04
Ration fed: 1.5 kilograms bran, 8.5 kilograms hay, 1.5 kilograms oats
Joe V V
5 5
44.01 45.54
14.99 19.64
54.74 56.15
37.80 37.78
50.41 52.37
16.27 18.20
74.47 76.32
34.24 Chub 35.93
Average 44.78 17.32 55.45 37.79 51.39 17.24 75.40 35.09
These series can not be compared one with the other, because not only were différent amounts of hay and bran fed but in the several series the hay and also the bran were not of the same lot.
The results in each series are not as concordant as one could wish. It is evident that the horses had trouble in digesting the bran, for when hay was fed by itself both the digestion coefficients and net- energy values varied but little in each series. The most uniform results with the hay and bran were obtained in Series V, period 2. The results with the hay, oats, and bran showed uniformity.

596 Journal of Agricultural Research vol. xxxn, No. e
TABLE XXXIX.—Digestion coefficients and energy values
Series Period
Digestion coefficients (per cent) Energy value per 100 pounds
Horse Dry
matter Ash Pro- tein Fiber N-free
extract Fat Metab-
oliz- able
energy
Net energy
Joe - II II III III IV IV V V V V
3 3 2 2 2 2 2 2 5 5
46.53 55.47 56.53
«32.78 45.33
« 18.11 50.33 57.99
«37.46 49.17
16.77 16.10 35.00 15.33
None. None. None.
14.48 9.45
39.52
80.48 94.26 91.07 78.84 76.87
«58.63 81.59 78.66
«41.07 «47.02
79.57 51.06
None. None.
18.54 None. None. None. 34.22 33.87
«40.16 51.40 64.18
«45.78 51.10
« 33.51 «66.25
74.34 «46.90
60.53
None. 1.02
32.49 21.47 16.60
None. 83.16 81.54 10.54 18.87
Therms 59.15 80.70
«117.69 64.08 68.94
« 14.78 «91.85 «108.75 « 56.62
84.54
Therms 42.54
Tom_ 62.14 Joe « 96.77 Tom.. 48.03 Joe 49.39 Chub ».14 Joe « 85.97 Chub « 101.34 Joe « 34.74 Chub 60.06
Average 51.62 66.00
(?) 31.00
83.11 77.00
(?) 31.00
61.31 72.00 Ä0
71.50 52.44 Average for bovines 53.00
« Omitted from the average.
The coefficients and energy values in Table XXXIX were deter- mined in all cases by deducting the amounts of hay or hay and oats digested and metabolized from the amounts digested and metabolized in the total rations, the remainder being the wheat bran digested and metabolized. Comparatively slight differences in the remainder are likely to make rather noticeable differences in the coefficients and net-energy values. It is clear, however, that the horses did not find wheat bran easy to digest, as the variations in the different trials make clear. In the cases of the dry matter, protein, and nitrogen-freeg extract the results have been averaged after eliminating those which appear the most improbable. It is doubtful whether the horses were able to make much use of the fiber, and as a rule they were not able to digest the fat as well as ruminants. When it comes to net-energy value the problem is even more difficult. The extreme results have been eliminated and the other figures averaged, the result being a tentative net-energy value of 52.6 therms per 100 pounds. It is probable that this result is not far from correct. Armsby's estimated figure for ruminants is 53. Most of the digestion coefficients for ruminants are above those for horses, as the appended average shows. The writers conclude that wheat bran is not to be recommended as a source of nutrition for horses, but it may be fed to advantage in limited amounts because of its gentle laxative effect.
CORRELATION DATA
In Table XL are shown some correlations between crude-fiber con- tent, total digestible nutrients, and net energy.

Mar. 15,1926 Digestibility and Energy Values of Feeds jor Horses ' 597
TABLE XL.—Correlation between crude-fiber content, total digestible nutrients, and net energy in the different feeds
[Feeds arranged in order of merit]
Order of merit
Percentage of fiber, arranged on basis of minimum fiber content
Digestible dry matter, ar- ranged on basis of total digestible nutrients
Net energy, in therms, ar- ranged on basis of net energy value
First Corn meal 2.59 Ground barley Corn bran. _.
.. 77.70 _. 76.19
Ground barley Brewers' grains Oats Corn meal. _
150.20 Second Shelled corn
Ground barley Gluten feed. _ Linseed meal
... 3.03
.__ 5.98
... 6.66 8.75
- 140.84 Third Fourth
Shelled corn Gluten feed.
.. 74.49 __ 73.38
_ 118.20 . 116.75
Fifth __. Corn meal Cottonseed meal... Oats "Linseed meal
.. 72.33
.. 65.91
.. 61.07 . 60.21
Gluten feed Shelled corn Corn bran.. ...
(?) Sixth Oats
Wheat bran Corn bran _ _
... 10.39
... 11.04 12.15
. 112.54 Sevjenth. 100. 84 Eighth. _. Linseed meal 87.13 Ninth Tenth
Brewers' grains— Cottonseed meal.. Oat feed
... 15.59
... 16.24 26.72
Wheat bran Alfalfa Brewers' grains Hay (fine)
_. 51.68 ._ 51.05 ._ 51.01 .. 50.61
Cottonseed meal Oat feed ...
. 81.47
. 55.60 Eleventh Wheat bran
Hay (fine) Hay (coarse) _
. 52.44 Twelfth Corncobs
Hay (fine) ... 30.23
. 32.22 .. 33.38
Thirteenth _ _ _ Hay (coarse). _ 47.59 . 26.70 Fourteenth _ Oat hulls 33.04 Oat feed . 44.77 Alfalfa.
Corncobs Oat hulls—. __
24.94 Fifteenth Hay (coarse) ... 33.57 Corncobs
Oat hulls ._ 25.15
22.38 . None.
Sixteenth. _ _ Alfalfa ._ 35.05 None. 1
A careful study of the foregoing tables and of all the data on which they are based shows that the net energy is roughly inversely pro- portional to the amount of crude fiber present and directly propor- tional to the amount of digestible dry matter present. In other words, the higher the fiber content the less digestible matter and net energy the feed contains, and vice versa. Although high fiber and low net energy (or the reverse) are always associated, the nature of the fiber varies the relation somewhat. For example, the fiber in hay does not seem to be nearly so resistant to digestive action as it is in some materials which are not any higher or as high in fiber. The horses digested on an average about 43 per cent of the crude fiber of the hay, but apparently made noticeably less use of that contained in oats and wneat bran; on the other hand, digestibility may be influenced somewhat by the relative amounts of the different ingre- dients contained in the feed.
A relatively low percentage of any proximate constituent is often accompanied by a correspondingly low or even by a negative diges- tion coefficient. This may be only apparent, due to imperfections of the method employed, to ascertain digestibility, or it may be due to a selective action on the part of the digestive tract, those constituents of the feed which are most abundant and which are characteristic of it being most completely digested, and vice versa. Such selective action is of course purely involuntary, and is explainable on a physico- chemical basis, being governed by the law of mass action. It is prob- able also that when any proximate constituent (e. g., fat) is present only in small amounts it is less readily accessible to the digestive juices than it would be if it were a predominating constituent of a feed or ration.9 All things considered, the amount of digestible dry matter is probably a better index of the net-energy value than is the crude-fiber content, although both should be considered.
»The low digestibility of protein contained in feeds in small amounts is due to the presence of metabolic products in the feces.
82560—26t 7

598 Journal of Agricultural Research vol. xxxn, NO. e
PERCENTAGE ENERGY EFFICIENCY OF FEEDS FOR HORSES
It is interesting to compare the gross energy values of the different feeds with their net energy values and to note the percentages of utili- zation. This has been done in Table XLI.
TABLE XLI [Therms per 100 poundsj
Name of feed Gross energy
Net energy
Percent- age effi- ciency
Name of feed Gross energy
Net energy
Percent- age effi- ciency
Alfalfa 190.97 197.32
14.11 35.73
7.39 18.11
Hay (coarse) contd.-- Hay (fine)
197.77 202. 76
18.33 33.38
9 27 16.46
Average for hay-
Linseed meal
Average 194.15 24.92 12.75 199.81 27.82 13.91
Barley 200.94 229. 52 229. 07 199. 58 203.67 203.21 224. 53 225.44
150. 20 60.39
140.83 112.54 116. 75
74.75 26.31 61.48 56.39 57.32
205. 03 207. 75 199.13
_... Brewers' grains Oats 118. 20
55.60 56.90
Oat feed 27.92 Onrr» í'cl^o^^or^^
Wheat bran Corn (meal) ___ 190.97 203.67 208.20 207. 75
52.34 «48.03 «49.39 «60.06
27.41 Corn (bran) _ __
Average for wheat bran...
Total averages..
23.58 C ottonseed meal
74.40 88.53
33.14 39.27
23.72 28.91
Hay (coarse) - 201.40 200.49 193.23 203. 21
18.90 28.15 29.83 38.30
9.38 14.04 15.44 18.85
202.65 52.46 25.91
205.46 64.00 30.76
a One horse only.
The average total calorific value expressed in therms for all feeds tested was 205.46, with extremes of from 191 to 229, the latter figure being obtained from brewers7 grains, which naturally contained con- siderable fat. The therms of total energy for most cattle feeds per 100 pounds of dry matter will not vary much from 200, excepting for those with a high fat percentage.
The percentage of net energy utilized varied widely, from zero in case of corncobs and oat hulls to 74.7 in case of ground barley.10
Two samples of alfalfa showed from 7.4 to 18.1 per cent of net energy; 6 samples of hay from 9.4 to 18.8, with an average of 13.9 per cent, and 4 samples of wheat bran, with an average percentage utilization of 25.91. Armsby (2, p. 661), in.Table 203, computes the percentage of net energy available in case of ruminants as vary- ing between 5 and 24 per cent for roughages; for corn meal and hominy feed, 46 per cent; wheat bran, 29 per cent; beet molasses, 49 per cent, and starch, 43 per cent. The writers fail to find on record data of the percentage utilization of energy of individual feeds by horses. Zuntz and Hagemann (2) have shown that the net efficiency of rations varied widely, depending upon the work performed. Thus, in case of walking without a load, the average efficiency was 35 per cent, in different grades of ascent; without a load, from 33.7 to 36.2 per cent; and with a load, 22.7 per cent. Zuntz and Lehmann {2) have found that after maintenance requirements were satisfied the horse was able to make use of about 26 per cent of the remaining energy in the form of a definite kind of work (net efficiency of the horse).
WThis net energy is believed to be too high. Corn meal shows 57.3 per cent of the net energy utilized. It is surprising what a small percentage of the energy the horse is able to utilize, especially in case of the coarse feeds and by-products which contain much fiber.

Mar. 15,1926 Digestibility and Energy Values of Feeds for Horses 599
A COMPARISON OF THE DIRECT AND INDIRECT METHODS OF DETERMINING METABOLIZABLE AND NET ENERGY
The direct method is the one employed by the writers. It consists in actually determining the amount of metabolizable energy, by deducting from the total energy consumed the amounts excreted in the feces, urine, and methane.
The indirect method proposed by Zuntz and Hagemann {10, 2, p. 675-676) is computed by multiplying the pounds per hundred of digestible organic matter (previously accertained by an actual digestion experiment) by the factor 1.796, the results representing the metabolizable energy in therms per 100 pounds. This factor is based on several experiments with horses. The therms of net energy in either case are calculated by the formula described on page 573.
TABLE XLII.—Average metabolizable and net energy
Series Period Feeding stuff
Metabolizable Net
Direct Indirect Direct Indirect
I. II * 5,4 6 5 3 7 7 2 6 3 1 to 8—. 4 7 4 5 3,2,2,5_.
Alfalfa 75.86 163.91
/ 90.81 \ 171.90
131.56 130.45 130.36 33.31
/ 116.29 \ 120.87
73.74 146.09 76.40
133.04 95.69 82.95
86.67 133.67 79.91 86.99
131.42 131. 55 131.19 45.16
116.64 107. 79 83.59
110.32 79.89
108.36 73.40 77.71
24.94 150.20 60.40
140.84 112.54 116. 75 100.84 None. 74.40 88.53 26.70
113. 50 60.77
118.20 55.60 66.45
36.75 m "::::„ Barley. 144.45 ii yBrewers* grains 53.42 III_-_™ II Corn (shelled).
61.01 115.96
n. Corn (meal) _ 116.61 II Corn (bran) 104.79 IV Corncobs.. _ 4.76 IV Cottonseed meal 82.47
II, III, IV, V Hay (coarse, average) 82.73 35.72
IV. Linseed meal . . 89.64 v do 62.42 v Oats 86.11 III Oat feed 34.68 II, III, v Wheat bran. 57.44
The condensed table shows that the results are not at all concordant. The coarse feeds (e. g., alfalfa and hay) have given higher results by the indirect mçthod. In the case of corn, with little fiber, the energy values are quite uniform by both methods. Barley also, with little fiber, proved an exception. In case of cottonseed meal, the results with both methods are fairly uniform. The two results with linseed meal are at variance one with the other. Brewers7 grains and oats have given higher results by the direct method.
In view of the fact that either method may give variable results, one is not justified in claiming positive superiority for either. Natu- rally the direct method should De given the preference.

600 Journal of Agricultural Research vol. xxxii, No. e
NITROGEN BALANCES
The nitrogen balances of the horses were determined in all cases in the usual manner. Table XLIII summarizes the results :
TABLE XLIII.—Nitrogen balances
Ration fed: 5 kilograms alfalfa, 5 kilograms hay
Horse Series Period
Nitrogen (grams)
Con- sumed Excreted Balance
Joe___ Tom. Joe... Tom.
I I II II
151. 07 151.07 142. 77 142. 77
144. 51 139.80 141. 77 147.45
+6.56 +11. 27 +1.00 -4.68
Ration fed: 8.25 kilograms alfalfa, 6.6 kilograms corn, 1.65 kilograms oats (Kansas)
Joe I I
3 3
141. 35 141. 35
269. 71 154.40
— 128.36 Tom. —13.05
Ration fed: 9 kilograms hay, 4.2 kilograms corn, 2.4 kilograms oats, 1.21 kilograms bran, 1.8 kilogram brewers' grains
Joe.. I I
4 4
142.77 142. 77
141. 77 147.45
+1.00 Tom —4.68
Ration fed: 2.5 kilograms barley, 8 kilograms hay
Joe III III
6 6
100.31 100.31
92.43 92.69
+7.88 Tom .. +7.62
Ration fed: 2.5 kilograms brewers' grains, 8 kilograms hay
Joe... Tom. Joe..- Tom.
II 5 195. 74 223.48 II 5 195. 74 206.19 III 3 157. 25 144.06 III 3 157. 25 136.19
-27. 74 -10.45 +13.19 +21.06
Ration fed: 2.5 kilograms corn (shelled), 8 kilograms hay
Joe . 11 II
7 7
111. 92 111. 92
111. 37 100.37
+0.55 Tom +11. 55
Ration fed: 2.5 kilograms corn meal, 8 kilograms hay
Joe ___ . «_ _ _- II II
6 6
110.43 109.41
106.98 104.46
+3.45 Tom. . . +4.95
Ration fed: 2 kilograms corn bran, 8 kilograms hay
Joe.. __. _. _-. ._ II II
2 2
89.21 89.21
107.19 82.27
-17.98 Tom .. _ _ +6.94

Mar. i5,i826 Digestibility and Energy Values of Feeds jor Horses 601
TABLE XLIII.—Nitrogen balances—Continued
Ration fed: 1.5 kilograms gluten feed, 8.5 kilograms hay
Series Period
Nitrogen (grams)
Horse Con-
sumed Excreted Balance
Joe IV IV V V
5 5 3 3
140.71 140.71 167.20 165.98
127.14 128. 24 157.67 152.47
+13. 57 Chub 4-12.47 Joe +9.53 Chub +13. 51
Ration feed: 1.5 kilograms corn cobs, 1.5 kilograms gluten feed, 8 kilograms hay
Joe Chub.
+12. 87 +10.96
Ration fed: 1.5 kilograms cottonseed meal, 1.5 a kilograms wheat bran, 8.5 kilograms hay
Joe IV IV V V
3 3 6 6
193.94 193.94 223.83 223.83
182. 21 182. 73 215.19 194.13
+11.73 Chub +11.21 Joe --. +8.64 Chub __. +29.70
Ration fed: 10 kilograms h hay
Joe__- Tom. Joe__. Tom- Joe. _. Tom.. Joe... Chub. Joe... Chub.
II 1 79.78 93.76 II 1 79.78 92.95 II 8 103.50 101.78 II 8 103. 50 99.63 III 1 64.77 75.53 III 1 64.77 78.93 IV 1 95.03 94.67 IV 1 95.03 88.69 V 1 122.34 127.34 V 1 122. 34 124.02
-13.98 -13.17 +1.72 +3.87
-10.76 -14.16
+.36 +6.34 -5.00 -1.68
Ration fed: 10.5 kilograms fine hay
Joe IV V
7 7
129.36 129.36
114. 05 125.71
+15. 31 Chub.- _ +3.65
Ration fed: 1.5 kilograms linseed meal, 1.5 kilograms wheat bran, 8.5 kilograms hay
Joe Chub..
IV IV
198.25 198.25
170. 51 176.59
+27. 76 +21. 64
Ration fed: 1.5 kilograms linseed meal, 1.5 kilograms oats, 8.5 kilograms hay
Joe V V
7 7
203. 51 203. 51
200.44 185. 57
+3.07 Chub . .- +17.94
Ration fed: 1.5 kilograms oats, 8.5 kilograms hay
joe . - V V
4 4
130.10 129.53
132. 20 128.76
-2.10 Chub +.77
a In series V, period 6,1.5 kilograms oats in place of wheat bran. 6 In series III, period 1, and series IV, period 1, 10.5 kilograms hay fed.

602 Journal of Agricultural Research vol. xxxii. No. e
TABLE XLIII.—Nitrogen balances—Continued
Ration fed: 2.5 kilograms oat feed, 8 kilograms hay
Series Period
Nitrogen (grams)
Horse Con-
sumed Excreted Balance
Joe III III
5 5
70.01 70.01
75.15 89.90
—5.14 Tom„ —19 89
Ration fed: 2 kilograms oat hulls, 2.5 kilograms dried brewers' grains, 8 kilograms hay
Joe... Tom..
Ill III
165.48 165.48
138.46 151.12
+27.02 +14. 36
Ration ^fed: 2 kilograms wheat bran, 8 kilograms hay
Joe_ — Tom..
II II
136.21 136. 21
139. 59 134. 55
-3.38 +1.66
Ration fed: 2.5 kilograms wheat bran, 8 kilograms hay
Joe III III
2 2
110. 69 110. 69
101. 54 106.50
+9.15 Tom _ . __ +4.19
Ration fed: 1.5 kilograms wheat bran, 8 kilograms hay
Joe -— IV IV V V
2 2 2 2
111. 67 111. 67 137.30 137. 30
105.43 102.50 87.83 88.80
+6.24 Chub +9.17 Joe --. . +49.47 Chub +48. 50
Ration fed: 1.5 kilograms wheat bran, 1.5 kilograms oats, 8.5 kilograms hay
Joe .- - V V
5 5
149.15 149.15
155. 65 143.69
-6.50 Chub ,. +5.46
The object was to feed a maintenance ration which would keep the horses in substantial weight equilibrium. It was not possible to maintain the nitrogen equilibrium because of the frequent changes in the character of the rations, some containing decidedly more nitrogen than others. Thus, in case of the basal hay rations, while the amount fed in all cases was about the same (10 to 10.5 kilograms daily), the nitrogen in the same varied considerably, the two lowest showing 64.77 and 79.78 grams, in which cases the horses had a minus equilibrium from 10 to 14 grams of nitrogen, indicating a probable deficiency of nitrogen.
A complete study of the summary indicates that the variations from (equilibrium are not marked in the majority of c^ses and are mostly positive in character. Only one extreme case is observed, namely, a negative balance of 128.36 grams of nitrogen daily, when Joe was receiving the Kansas ration. This would indicate some temporary abnormal condition.

Mar. 15,1926 Digestibility and Energy Values of Feeds for Horses 603
GENERAL SUMMARY AND CONCLUSIONS
The ultimate object of this investigation was the determination of digestibility and net-energy values of numerous common feeds suitable for horses.
Thirty-one metabolism experiments, with two horses in each, were carried on. From the results of these experiments, the digestibility, metabolizable energy, and net energy of 16 individual feeds were calculated.
The cereal grains and their high-grade products had a higher net- energy value than the strictly nitrogenous concentrates. Wheat bran, as a horse feed, gave results inferior to those of any other con- centrate fed. Hay and alfalfa had about the same average net- energy value, but different samples varied widely, depending, evi- dently, on the stage of growth. Such materials as corncobs and oat hulls had no net-energy value.
The percentage net energy or production values varied from zero to 60 or more per cent, with an average of 32 per cent for all the feeds studied.
Net energy increases as crude-fiber content decreases, and is, as a rule, directly proportional to digestible dry matter. The net-energy value of any feed can be estimated approximately from these two values.
The character of the fiber influences its digestibility and the net- energy values. Thus, the fiber contained in corn bran has a higher energy value than that contained in oats, corncobs, or wheat bran.
The direct method of determining metabolizable energy is to be preferred to the indirect method suggested by Zuntz and Hagemann. The indirect method should be used only when it is not possible or convenient to make direct determinations.
The abundant constituents which characterize a feed or ration have, as a rule, an apparently higher digestibility than those present in minor amounts. This is due, at least in part, to imperfections of the method employed.
The nitrogen balances, with one exception, did not vary widely; and in most cases they were positive.
LITERATURE CITED (1) ARCHIBALD, J. G.
1924. THE EFFECT OF SODIUM HYDROXID ON THE COMPOSITION, DIGESTI- BILITY, AND FEEDING VALUE OF GRAIN HULLS AND OTHER FIBROUS MATERIAL. Jour. Agr. Research 27: 245-265.
(2) ARMSBY, H. P. 1917. THE NUTRITION OF FARM ANIMALS. 743 p., ÜluS. New York.
(3) ASSOCIATION OF OFFICIAL AGRICULTURAL CHEMISTS. 1920. OFFICIAL AND TENTATIVE METHODS OF ANALYSIS. AS COMPILED BY
THE COMMITTEE ON REVISION OF METHODS. REVISED TO NOV. i, 1919. 417 p., illus. Washington, D. C.
(4) HOLLAND, E. B., REED, J. C, and BUCKLEY, J. P. 1919. AN ADiABATic BOMB CALORIMETER. Chem. and Metall. Engin.
21: 190-191. (5) LEHMANN, F., HAGEMANN, O., and ZUNTZ, N.
1894. ZUR itENNTNiss DES STOFFWECHSELS BEIM PFERDE. Landw. Jahrb. 23: 125-165

604 Journal of Agricultural Research vol. xxxn, No. 6
(6) LINDSEY, J. B., BE ALS, G. L., and SMITH, P. H. 1917. DIGESTION EXPERIMENTS WITH SHEEP. Mass. Agr. Expt. Sta. Bui.
181: 241-335. (7)
1918. THE NUTRITION OF THE HORSE. Mass. Agr. Expt. Sta. Bui. 188: 243-263.
(8) and BEALS, C. L. 1920. THE NUTRITIVE VALUE OP CATTLE FEEDS. 2. OAT BY-PRODUCTS FOR
FARM STOCK. Mass. Agr. Expt. Sta. Bui. 200: 117-135. (9) MCCAMPBELL, C. W.
1912. FEEDING WORK HORSES. Kans. Agr. Expt. Sta. Bui. 186: 17-70, illus.
(10) ZUNTZ, N., HAGEMANN, O., LEHMANN, C, and FRENTZEL, J. 1898. UNTERSUCHUNGEN ÜBER DEN STOFFWECHSEL DES PFERDES BEI
RUHE UND ARBEIT. Neue Folge. Landw. Jahrb., Bd. 27, Ergänzbd. 3, 438 p., illus.
O