Embed Size (px)
Citation preview
THE DIGITAL DIVIDE IN THE TROPICS
A STATE OF THE TROPICS REPORT 2021.
James Cook University and the State of the Tropics leadership group acknowledge the contributions made by many individuals and institutions to the preparation and publication of this Report.
State of the Tropics leadership group institutions:
Project management and editorial team
Sandra Harding and Ann Penny (lead author)
Advice, assistance and reviews
Ian Atkinson, Daniel Christie, Carol Archer, Rakan Zahawi, Janet Hemingway, Benjamin Horton, Carol Archer, Jetsumon Prachumsri, Mark Ziembicki, Rodney McComiskie and Dennis Trewin.
Capstone Editing provided copyediting and proofreading services, according to the guidelines laid out in the university-endorsed national ‘Guidelines for Editing Research Theses’.
Published by James Cook University on behalf of the State of the Tropics Leadership Group
© Copyright 2021, James Cook University ISBN: 978-0-6489220-7-0
This work is copyright. Apart from any use permitted under the Copyright Act 1968, no part may be reproduced by any process nor may any other exclusive right be exercised without the permission of James Cook University.
This report should be cited as: State of the Tropics (2021) The Digital Divide in the Tropics. James Cook University, Townsville, Australia.
Disclaimer: The views and opinions expressed in this publication are those of the authors and do not necessarily reflect those of James Cook University or the leadership group for the State of the Tropics Project.
The designations employed and presentation of material in State of the Tropics does not imply the expression of any opinion of James Cook University or the State of the Tropics leadership group concerning the legal status of any country, territory, city of area of its authorities, or concerning the determination of their frontiers or boundaries.
Cover Photo: Kenyan school children. Hadynyah/Getty Images Layout and design: zephyrmedia.com.au
AUTHORS AND ACKNOWLEDGMENTS

Foreword – Professor Sandra Harding 2
Summary 4
List of Figures and Tables 7
CHAPTERS
1. Introduction 8
2. Digital Access in the Tropics 12
3. Education and Digital Literacy 34
4. Production, Trade, Use and Disposal of Digital Technology in the Tropics 50
CASE STUDIES
1. Information and Communication Technology in the Pacific 24
2. Digital Health in the Tropics 28
3. Mobile Money and the Story of M-Pesa 46
4. Cobalt Mining in the Democratic Republic of Congo 60
Appendix A 64
Appendix B 70
CONTENTS
CONTENTS 1

2 STATE OF THE TROPICS REPORT 2021
There can be no doubt that the future is digital and to be on the wrong side of the digital divide is to be on the wrong side of history.
More than three billion people, almost half the world’s population, are not online and most of those who are on the wrong side of the digital divide live in the tropical regions of the world.
The digital revolution has transformed lives. These new technologies have allowed people to connect with one another in a whole new way, overcoming distance and geography. A mobile phone means you can contact your family far away, receive money, avoid unnecessary and potentially dangerous travel and enjoy and share music and culture. As this technology develops, it will affect how we grow our food and receive health care and education, and makes possible a fairer and more equitable society.
However, just like all instruments of development, the success of information and communication technology to alleviate poverty and drive sustainable development, depends on the social, cultural and environmental context in which it operates. Where inequality persists, the impact of introducing new technology remains unequal. While fourth and fifth generation (4 and 5G) mobile broadband or new satellite constellations can make the internet potentially available for everyone on Earth, true universal access still requires reliable electricity, the knowledge of how to use technology, and affordable devices and data.
FOREWARD

FOREWARD 3
The importance of digital technologies was growing inexorably when, in 2020, the COVID-19 pandemic put the role that this technology plays in our lives front and centre. Trade, employment, learning, communications and everyday life rapidly shifted into the digital realm.
In 2019, prior to the pandemic, representatives of the State of the Tropics leadership group met in Singapore to discuss the way forward for this project. At that time, the impact of digital technologies and the persistent digital divide was considered an important future focus for this project. The events of 2020 and 2021 have only served to highlight the critical nature of this particular axis of inequality as digital technology was put to work across the globe.
This report shines a spotlight on the extent and impact of the digital divide in the Tropics, in education, business and at home.
Spanning this digital divide, including understanding the innovative ways that people are using technology, holds in prospect a brighter future for the peoples of the Tropics.
Professor Sandra Harding Vice Chancellor & President, James Cook University Convenor, State of the Tropics Project

SUMMARY
4 STATE OF THE TROPICS REPORT 2021
SUMMARY 5
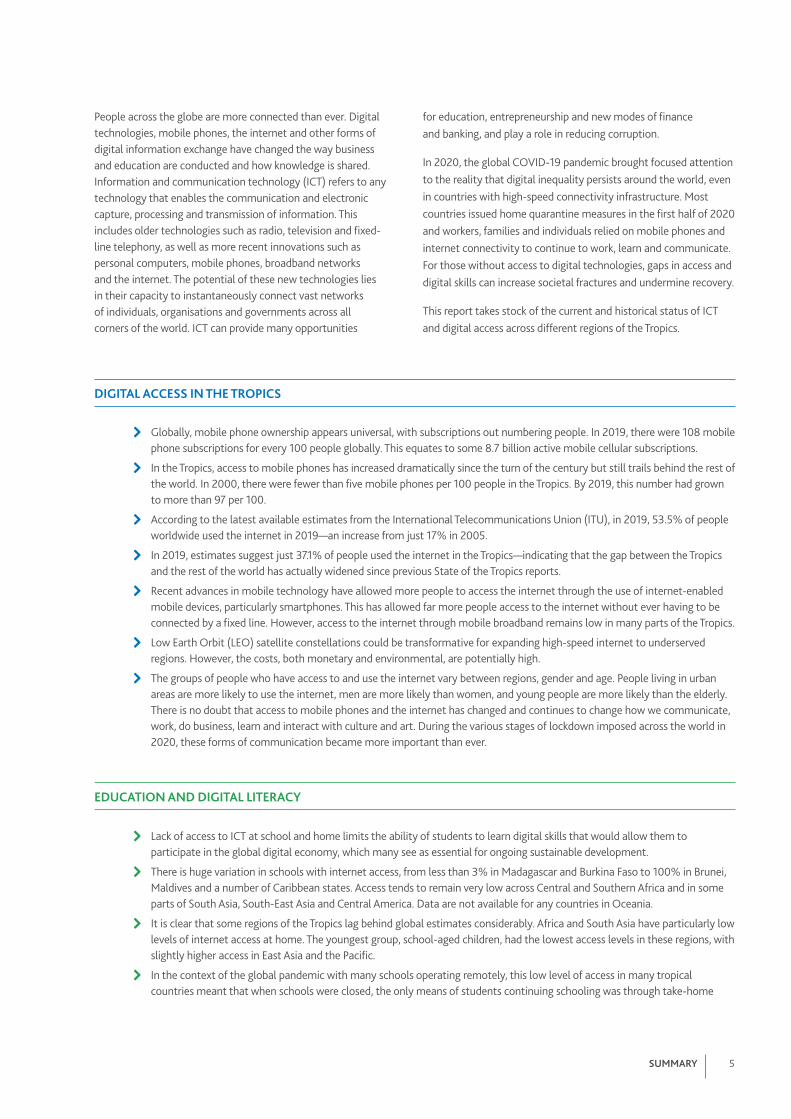
People across the globe are more connected than ever. Digital technologies, mobile phones, the internet and other forms of digital information exchange have changed the way business and education are conducted and how knowledge is shared. Information and communication technology (ICT) refers to any technology that enables the communication and electronic capture, processing and transmission of information. This includes older technologies such as radio, television and fixed-line telephony, as well as more recent innovations such as personal computers, mobile phones, broadband networks and the internet. The potential of these new technologies lies in their capacity to instantaneously connect vast networks of individuals, organisations and governments across all corners of the world. ICT can provide many opportunities
for education, entrepreneurship and new modes of finance and banking, and play a role in reducing corruption.
In 2020, the global COVID-19 pandemic brought focused attention to the reality that digital inequality persists around the world, even in countries with high-speed connectivity infrastructure. Most countries issued home quarantine measures in the first half of 2020 and workers, families and individuals relied on mobile phones and internet connectivity to continue to work, learn and communicate. For those without access to digital technologies, gaps in access and digital skills can increase societal fractures and undermine recovery.
This report takes stock of the current and historical status of ICT and digital access across different regions of the Tropics.
ŵ Globally, mobile phone ownership appears universal, with subscriptions out numbering people. In 2019, there were 108 mobile phone subscriptions for every 100 people globally. This equates to some 8.7 billion active mobile cellular subscriptions.
ŵ In the Tropics, access to mobile phones has increased dramatically since the turn of the century but still trails behind the rest of the world. In 2000, there were fewer than five mobile phones per 100 people in the Tropics. By 2019, this number had grown to more than 97 per 100.
ŵ According to the latest available estimates from the International Telecommunications Union (ITU), in 2019, 53.5% of people worldwide used the internet in 2019—an increase from just 17% in 2005.
ŵ In 2019, estimates suggest just 37.1% of people used the internet in the Tropics—indicating that the gap between the Tropics and the rest of the world has actually widened since previous State of the Tropics reports.
ŵ Recent advances in mobile technology have allowed more people to access the internet through the use of internet-enabled mobile devices, particularly smartphones. This has allowed far more people access to the internet without ever having to be connected by a fixed line. However, access to the internet through mobile broadband remains low in many parts of the Tropics.
ŵ Low Earth Orbit (LEO) satellite constellations could be transformative for expanding high-speed internet to underserved regions. However, the costs, both monetary and environmental, are potentially high.
ŵ The groups of people who have access to and use the internet vary between regions, gender and age. People living in urban areas are more likely to use the internet, men are more likely than women, and young people are more likely than the elderly. There is no doubt that access to mobile phones and the internet has changed and continues to change how we communicate, work, do business, learn and interact with culture and art. During the various stages of lockdown imposed across the world in 2020, these forms of communication became more important than ever.
DIGITAL ACCESS IN THE TROPICS
EDUCATION AND DIGITAL LITERACY
ŵ Lack of access to ICT at school and home limits the ability of students to learn digital skills that would allow them to participate in the global digital economy, which many see as essential for ongoing sustainable development.
ŵ There is huge variation in schools with internet access, from less than 3% in Madagascar and Burkina Faso to 100% in Brunei, Maldives and a number of Caribbean states. Access tends to remain very low across Central and Southern Africa and in some parts of South Asia, South-East Asia and Central America. Data are not available for any countries in Oceania.
ŵ It is clear that some regions of the Tropics lag behind global estimates considerably. Africa and South Asia have particularly low levels of internet access at home. The youngest group, school-aged children, had the lowest access levels in these regions, with slightly higher access in East Asia and the Pacific.
ŵ In the context of the global pandemic with many schools operating remotely, this low level of access in many tropical countries meant that when schools were closed, the only means of students continuing schooling was through take-home

6 STATE OF THE TROPICS REPORT 2021
packages. This has resulted simply in many students not accessing schooling at all, with potentially huge social and economic costs to the countries that can bear it the least.
ŵ Generally, ICT is far less likely to be included in primary school curriculums, particularly in Africa and the Middle East. However, by upper secondary, most countries reporting included ICT in the curriculum. Programs in Brazil, Malaysia and Thailand have increased the number of schools with the capacity to teach ICT skills in those countries.
ŵ Far fewer youth and adults have basic digital skills in the Tropics than in the rest of the world. However, there are some exceptions. Saudi Arabia, Malaysia and Singapore have relatively high digital literacy rates, with rates comparable to most countries reporting from the non-Tropics and higher than some countries.
ŵ Around 40% of all ICT goods are exported from tropical regions. These exports are dominated by South-East Asia and Central America. In other regions of the Tropics, the share of the global trade in ICT goods remains small.
ŵ South-East Asia is the only region in the Tropics that is a net exporter of ICT goods. All other regions in the Tropics import more technology than they produce and export.
ŵ Globally, almost one-quarter of all people used the internet to make a purchase in 2019; however, this was concentrated in wealthy countries in North America, Europe and East Asia. Far fewer people used the internet for purchasing throughout the Tropics, with some exceptions such as Saudi Arabia, Malaysia and Singapore. The largest growth markets in the Tropics have been Hong Kong and India.
ŵ The rapid expansion of electrical and electronic equipment manufacturing across the world due to industrialisation, economic expansion, technological development and growing wealth has led to complementary growth in electronic waste or e-waste.
ŵ On a per-capita basis, tropical countries, with the exception of tropical Australia and the US (Hawaii), produce far less e-waste than nations in North America and Europe. E-waste from North America and Europe is often exported to China, Brazil, Nigeria, Ghana and India.
PRODUCTION, TRADE, USE AND DISPOSAL OF ICT
CASE STUDIES
Information and Communication Technology in the Pacific takes a closer look at the tropical region with the least connectivity. Mobile phone penetration is around half the global rate, and in 2019, internet users represented less than 20% of the population outside of Australia and Hawaii. Nations in the Pacific are generally small, culturally diverse and separated by challenging terrain or vast ocean. Although submarine cables now connect most capital cities in this region, outer islands and remote areas remain unconnected.
Digital Health in the Tropics explores the potential benefits of building better digital health systems in the Tropics. Digital health programs can improve vaccination rates, monitor diseases and symptoms, detect disease outbreaks and connect specialist medicine to those who are unable to travel to urban centres. Although privacy and reliability issues remain, digital health has the capacity to enhance existing health systems.
Mobile Money and the Story of M-Pesa charts the rise of mobile money throughout the Tropics with a focus on M-Pesa, the most successful service. Mobile money is a money transfer system that uses mobile phones and a network of human agents who cash in and cash out for customers, exchanging e-money as text messages for hard currency. It does not require a smartphone, bank account, credit card or internet connection. Mobile money accounts can provide a gateway to life-enhancing services such as remittances, health care, education, employment and social protections.
Cobalt Mining in the Democratic Republic of Congo (DRC) discusses the origin of a vital component in digital systems and lithium-ion batteries—cobalt. The enormous and growing demand for digital devices and products globally has driven huge growth in mining for critical minerals used in components.
The vast majority of cobalt is mined in the DRC, where it has been shown to create jobs, alleviate poverty and encourage investment in social infrastructure. However, working conditions are often dangerous, miners are poorly paid, and, in some cases, child labour is involved.

SUMMARY 7
LIST OF FIGURES AND TABLES
Figure 1.3 Tropical regions of the world used in State of the Tropics analyses. 10
Figure 2.1 Mobile Phone Subscriptions per 100 people in the Tropics, globally and the rest of the world. 15
Figure 2.2 Mobile cellular subscriptions per 100 people across the tropical regions. 15
Figure 2.3 Internet users (% of population) in the Tropics, the rest of the world and globally. 16
Figure 2.4 Internet users (% of population) across the tropical regions. 17
Figure 2.5 Mobile Broadband Subscriptions per 100 people (latest available) 2015–2018. 18
Figure 2.6 Proportion of the population covered by at least third-generation (3G) mobile broadband coverage. 18
Figure 2.7 Average cost of 1 GB of mobile data in USD. 19
Figure 3.1 Percentage of educational institutions connected to the internet from select tropical nations. 37
Figure 3.2 Percentage of children and young people with internet access at home, by region. 38
Figure 3.3 Percentage of countries that include ICT as part of the school curriculum across available tropical regions based 40 on latest available estimates. Includes developing countries only.
Table 3.1 Spread of basic skills of youth and adults across select countries from the Tropics and the Rest of the World 41 based on latest available data.
Figure 4.1 ICT goods exported as a percentage of total exports globally, in the Tropics and in the Rest of the world. 53
Figure 4.2 ICT exports as a percentage of total exports across the tropical regions. 54
Figure 4.3 ICT imports as a percentage of total exports globally, in the Tropics and in the Rest of the World. 54
Figure 4.4 ICT imports as a percentage of total imports across the Tropical regions. 55
Figure 4.5 Percentage of people who used the internet to make a purchase in 2019. 56
Figure 4.6 Kilograms (kg) of e-waste generated per capita across the tropical regions and globally in 2019. 57
Figure 4.7 E-waste (kg per capita) produced globally. Arrows show major flows of e-waste from producing countries. 57

8 STATE OF THE TROPICS REPORT 2021
INTRODUCTION
1
8 STATE OF THE TROPICS REPORT 2021

INTRODUCTION 9
The growth of digital technologies, mobile communication and the internet is one of the major developments of the late twentieth and early twenty-first century. In September 2020, UN Secretary-General António Guterres said that access and use of ICT could be the greatest equaliser and enabler of our times (United Nations, 2020).
One of the key targets of the 2030 Agenda for Sustainable Development is to significantly increase access to ICT and strive to provide universal and affordable access to the internet in the least developed countries. This target actually expires in 2020 and has not been achieved. Although nearly the whole global population was covered by a mobile network in 2020—the actual access and use of digital technologies is a far more complex story. The latest estimates suggest that more than 3 billion people worldwide still do not use the internet in a meaningful way (ITU and UNESCO, 2020).
Many tropical communities are in danger of being left behind as digital technology expands into ever more complex systems. The divide between those with digital connectivity and those without has been shrinking. Still, progress is slower than it should be, often beset by barriers arising from broader social and cultural considerations, including lack of infrastructure, poor governance, insufficient education and gender inequality. Paradoxically, greater digital inclusion can also improve governance, education and gender equality. Digital technologies can help address some of the toughest development challenges, offering economic opportunities and overcoming remoteness and exclusion (World Bank, 2019).
In 2020, the global COVID-19 pandemic brought focused attention to the reality that digital inequality persists around the world due to gaps in universal access, even in countries with high-speed connectivity infrastructure (ITU and UNESCO, 2020). Most countries around the world issued home quarantine measures in the first
half of 2020, and workers, families and individuals relied on mobile phone and internet connectivity to continue to work, learn and communicate (ITU and UNESCO, 2020). During the height of the crisis, 90% of governments around the world closed schools and implemented remote learning practices (UNICEF, 2020). At their peak, school closures affected 1.5 billion school students from pre-primary to upper secondary.
In many ways, COVID-19 has accelerated digital development, forcing human interactions to occur online, growing e-commerce, online education and remote work (World Economic Forum, 2021). These shifts promise huge benefits to society well beyond the pandemic, but they also risk exacerbating and creating inequalities. For those without access to digital technologies during unprecedented stay at home directions, the gaps in access and skills and capabilities can worsen societal fractures and undermine recovery prospects (World Economic Forum, 2021).
The rate of technological change in the first part of the twenty-first century is so rapid that any publication of this kind will be out of date even before it is published. Combined with a global pandemic that has already seen multiple waves across the globe and changing political situations, a comprehensive overview will have significant gaps. Nevertheless, it remains important to understand how things were prior to the pandemic and what the digital divide means in terms of the Tropics. Although some data presented here are, without a doubt, dated, they still allow us to draw comparisons between regions and understand where the focus will need to reside if we are to close the digital divide in the Tropics.
This report will also focus on new, digital technologies rather than older communication technology such as fixed-line telephony, radio and television.
This report takes stock of the current and historical status of ICT and digital access across different regions of the Tropics. It presents a broad-ranging, statistical analysis of a set of indicators relating to ICT based on data collated from existing datasets from several authoritative and multi-lateral sources, including various United Nations agencies, the World Bank, the ITU and other repositories. The report considers access to communications technology, the role of ICT in education (particularly in the context of the pandemic), and the importance of ICT in global trade, e-commerce and global waste flows. It also includes case studies on the Pacific, mobile money, cobalt mining and digital health.
Regions of the Tropics
With most of the world’s biological and cultural diversity and a range of socio-political and economic systems, the world’s tropical zone is defined by its diversity. Nonetheless, the region is united
by shared characteristics and challenges. To facilitate meaningful analyses and reporting, it makes sense to develop groupings that ideally have some degree of commonality or internal homogeneity. There are several ways that this could be undertaken, including by climate (wet/dry/temperate tropics) and by national borders. As the majority of data available are reported on a national basis, it makes sense that ‘nations’ are the basis of regional aggregations. The regional groupings are listed below, and the nations that comprise each region are listed in Appendix A.
• Central and Southern Africa• Northern Africa and Middle East• Caribbean• Central America• South America• Oceania• South-East Asia• South Asia
ABOUT THIS REPORT

10 STATE OF THE TROPICS REPORT 2021
In early 2011, a group of leading research institutions with a common interest in the future of the tropical world came together to examine the condition of life in the Tropics. Their goal was to examine the condition of life in the Tropics and answer the underlying question: is life in the Tropics getting better?
The State of the Tropics 2014 Report was the first product of that collaboration. By assessing a broad range of environmental, social and economic indicators, it illuminated the people and issues of the tropical world and contributed to efforts to improve the lives of the people of the Tropics and their environments.
To answer the question of whether life is improving in the Tropics, an evaluation of progress was made on national, regional and global scales. In this case, progress refers to an increase in the sustainable and equitable wellbeing of a society. It is multidimensional and includes economic, social and environmental factors along with other areas considered important to quality of life (e.g., culture or the quality of governance). That report identified that life in the Tropics is indeed getting better, but progress is uneven and often at the expense of the natural environment.
A number of other key activities have taken place since the publication of the 2014 report. The State of the Tropics Project
Figure 1.3 Tropical regions of the world used in State of the Tropics analyses.
Central America Caribbean South America Central & South AfricaNorthern Africa & Middle East South Asia OceaniaSouth East Asia
Nations of the TropicsIn assessing which nations and territories should be included in the report, two processes were applied. The first used a population-based decision tool to assess whether nations partially in the Tropics should be included in the report, and the second reviewed data availability to assess whether sufficient data are available to warrant a nation’s inclusion in the report.
The geographic area that is the Tropics is clearly defined as the region between the Tropics of Cancer and Capricorn. However, national borders do not neatly align with these latitudinal lines, and there are many nations and territories that straddle the zone.
The following practical approach has been applied to select nations and territories to be included in the report:
• Nations that are wholly within the Tropics are included.• Nations partially within the Tropics are included if—
• the majority of the population (i.e., more than 50%) lives in the Tropics (e.g., Brazil and India), or
• the proportion of the population living in the Tropics is 5% or more of the region’s population living in the Tropics (e.g., Australia and China).
Using this decision tool, 134 nations and territories were assessed as being in the Tropics.
Countries and territories assessed as being in the Tropics can be found in Appendix A.
THE STATE OF THE TROPICS PROJECT

INTRODUCTION 11
continued to bring together leading research institutions from across the tropical world to assess the state of the region and to examine the implications of the immense changes the region is experiencing. In doing so, it aims to build effective partnerships between tropical research institutions, build local research capacity and argue for the critical importance of the tropical zone in achieving a sustainable, prosperous and equitable global future.
In 2016, the State of the Tropics Project welcomed the United Nation’s decision to declare 29 June as the International Day of the Tropics. The initiative was spearheaded by the Australian Government in close collaboration with the institutions involved in the State of the Tropics Project. The International Day of the Tropics was designated to raise awareness of the specific challenges faced by tropical areas, the far-reaching implications of the issues affecting the world’s tropical zone and the need, at all levels, to raise awareness and emphasise the vital role that countries in the Tropics will play in achieving the Sustainable Development Goals. The date was chosen, as it is the anniversary of the launch of the first State of the Tropics report by Nobel Laureate Daw Aung Sun Suu Kyi.
In 2017, a second major report was published focusing on sustainable infrastructure development in the Tropics. This report explored the tropical infrastructure gap and the challenges of meeting infrastructure needs while balancing environmental change and impacts on health and wellbeing.
Also in 2017, the State of the Tropics Project brought together a diverse group of distinguished researchers, private sector representatives, practitioners and policymakers through a Rockefeller
Bellagio Center Workshop to help shape a strategic road map to strengthen the State of the Tropics consortium of universities and other institutions. The consortium agreed to work together to drive productivity through better educational outcomes, improved health, greater equity and more informed policy leading to sustainable development in the Tropics. It will do this by having an orientation to the future, a clear timeframe for success, creating connectivity between regions of the Tropics, and focusing on the youth of the Tropics grounded in targeted and reliable data.
In 2019, a report on Health in the Tropics was published. This report took stock of the current and historical status of health and wellbeing across different regions of the Tropics. This report considered infectious disease, non-communicable disease, maternal and child health, mental Illness, substance abuse and accident and injury. It also explored the health workforce in the Tropics.
In 2020, another major report on the State of the Tropics was published. This report provided a timely update on the 2014 report and came at a critical time for the Tropics and its people. As the world faced the COVID-19 pandemic of 2020, it was an important time to stop and take stock once again. How far have we come? How far do we need to go? How will we get there? How will the Tropics overcome one of the greatest challenges facing the world in 100 years? The 2020 report will provide a baseline from which to measure the true impact of this world-changing event on the Tropics.
All State of the Tropics reports are available to download from jcu.edu.au/state-of-the-tropics.
REFERENCES
ITU & UNESCO 2020. The state of broadband: Tackling digital inequalities, a decade for action. Geneva: UNESCO.
UNICEF 2020. How many children and young people have internet access at home?: estimating digital connectivity during the COVID-19 pandemic. Geneva: UNICEF.
UNITED NATIONS 2020. Narrowing digital divide could become ‘greatest equalizer’ in promoting equality, Secretary-General tells online conference, calling on nations to support youth. New York, USA: United Nations.
WORLD BANK 2019. Digital development partnership—Annual review 2019. Making sure that no one is left behind in the digital age. The World Bank. Washington DC.
WORLD ECONOMIC FORUM 2021. The global risks report 2021—16th Edition. Insight Report. San Francisco, USA: World Economic Forum.

DIGITAL ACCESS IN THE TROPICS
2
12 STATE OF THE TROPICS REPORT 2021

SUMMARY
ŵ The impact of the mobile phone across the world has been profound.
ŵ Globally, mobile phone ownership appears universal, with subscriptions out numbering people. In 2019, there were 108 mobile phone subscriptions for every 100 people globally. This equates to some 8.7 billion active mobile cellular subscriptions.
ŵ In the Tropics, access to mobile phones has increased dramatically since the turn of the century but still trails behind the rest of the world. In 2000, there were fewer than five mobile phones per 100 people in the Tropics. By 2019, this number had grown to more than 97 per 100.
ŵ According to the latest available estimates from the ITU, in 2019, 53.5% of people worldwide used the internet in 2019—an increase from just 17% in 2005.
ŵ In 2019, estimates suggest just 37.1% of people used the internet in the Tropics—indicating that the gap between the Tropics and the rest of the world has actually widened since previous State of the Tropics reports.
ŵ Recent advances in mobile technology have allowed more people to access the internet through the use of internet-enabled mobile devices, particularly smartphones. This has allowed far more people access to the internet without ever having to be connected by a fixed line. However, access to the internet through mobile broadband remains low in many parts of the Tropics.
ŵ Low Earth Orbit (LEO) satellite constellations could be transformative for expanding high-speed internet to underserved regions. However, the costs, both monetary and environmental, are potentially high.
ŵ The groups of people who have access to and use the internet vary between regions, gender and age. People living in urban areas are more likely to use the internet, men are more likely than women, and young people are more likely than the elderly.
ŵ There is no doubt that access to mobile phones and the internet has changed and continues to change how we communicate, work, do business, learn and interact with culture and art. During the various stages of lockdown imposed across the world in 2020, these forms of communication became more important than ever.
2 :: DIGITAL ACCESS IN THE TROPICS 13 PHOTO: ARNE HOEL, WORLD BANK

14 STATE OF THE TROPICS REPORT 2021
People across the globe are more connected than ever. Digital technologies, mobile phones, the internet and other forms of digital information exchange have changed the way business and education are conducted and how knowledge is shared. ICT refers to any technology that enables the communication and electronic capture, processing and transmission of information. This includes older technologies such as radio, television and fixed-line telephony, as well as more recent innovations such as personal computers, mobile phones, broadband networks and the internet. The potential of these new technologies lies in their capacity to instantaneously connect vast networks of individuals, organisations and governments, across all corners of the world. ICT can provide many opportunities for education, entrepreneurship and new modes of finance and banking and play a role in reducing corruption.
Tropical nations have experienced rapid but uneven growth in ICT access and use in recent decades. Although mobile phones have become commonplace throughout the Tropics, the adoption of the internet and high-speed broadband in particular has been slower, limiting the diffusion of ICT to services, business and governments. Further, nominal access to technology is often not enough; a lack of digital literacy can prevent the realisation of the full potential of ICT. In many cases, poor access to other basic infrastructure and services is more important and overrides the benefits of ICT facilities. In many rural areas of the Tropics, for example, accessing electricity to charge a mobile phone or computer is often more difficult than purchasing the phone to begin with (World Bank, 2012). This may go some way to explaining why, according to the 2016 World Development Report, ‘the effect of technology on global productivity, expansion of opportunity for the poor and the middle class and the spread of accountable governance has been less than expected’ (World Bank, 2016b).
The very first aspect of the digital divide is simply having access to the technology. This chapter will cover access to mobile phones and the internet by individuals through both fixed and mobile connections.
Trends
Mobile phone useSince becoming publicly available some 30 years ago, the mobile phone has become the world’s most widely used communication technology. While on the surface, the number of mobile phones appears to exceed the total number of people
on the planet, a distortion in the data caused by multiple subscriptions and the inclusion of inactive accounts tends to overestimate the true number of people using mobile phones. Thus, some caution should be applied in interpreting total numbers in this indicator. However, subscription data provides an important insight into the increase in mobile connections and access and allows comparison between regions.
Mobile cellular telephone subscriptions are subscriptions to a public mobile telephone service using cellular technology. The indicator includes the number of post-paid subscriptions and the number of active prepaid accounts (i.e., that have been used during the last three months). The indicator applies to all mobile cellular subscriptions that offer voice communications. It excludes subscriptions via data cards or USB modems, subscriptions to public mobile data services, private trunked mobile radio, telepoint, radio paging and telemetry services (World Bank, 2020).
Globally, it appears mobile phone ownership is now universal, with subscriptions out numbering people according to the ITU (see Figure 2.1). In 2019, there were 108 mobile phone subscriptions for every 100 people globally. This equates to some 8.7 billion active mobile cellular subscriptions.
In the Tropics, access to mobile phones has increased dramatically since the turn of the century, but it still trails behind the rest of the world. In 2000, there were fewer than five mobile phones per 100 people in the Tropics. By 2019, this number had grown to more than 97 per 100—approaching universal access. The growth rate in mobile phone subscriptions has slowed in recent years, indicating saturation in many regions as well as, potentially, the correction of out-of-date subscription data (World Bank, 2016).
Although there has been considerable variation in the growth rate of mobile phone access across the tropical regions, uptake has been significant and rapid, particularly since 2005. Coverage in Central and Southern Africa, Oceania, the Caribbean and Northern Africa and the Middle East remained below 80 subscriptions per 100 people in 2019 despite rapid uptake over the past decade. But growth in subscriptions has slowed in these regions since 2015. In other regions, there has actually been a decline in the past couple of years. In South Asia, Central America and South America, it is largely due to corrections in the data associated with inactive subscriptions. However, there have also been economic impacts (particularly in South America) that have slowed the uptake of phones in more impoverished regions of these countries.
INTRODUCTION

2 :: DIGITAL ACCESS IN THE TROPICS 15
Figure 2.1 Mobile Phone Subscriptions per 100 people in the Tropics, globally and the rest of the world.
International Telecommunications Union, 2020
Figure 2.2 Mobile cellular subscriptions per 100 people across the tropical regions.
International Telecommunications Union, 2020
0
20
40
60
80
100
120
140
1990
1991
1992
1993
1994
1995
1996
1997
1998
1999
2000
2001
2002
2003
2004
2005
2006
2007
2008
2009
2010
2011
2012
2013
2014
2015
2016
2017
2018
2019
The Tropics Rest of the World World
Subs
crip
tions
per
100
peo
ple
0
20
40
60
80
100
120
140
160
1990
1991
1992
1993
1994
1995
1996
1997
1998
1999
2000
2001
2002
2003
2004
2005
2006
2007
2008
2009
2010
2011
2012
2013
2014
2015
2016
2017
2018
2019
Central & Southern Africa Northern Africa & Middle East South Asia
South East Asia Caribbean Central America
South America Oceania
Subs
crip
tions
per
100
peo
ple

16 STATE OF THE TROPICS REPORT 2021
Figure 2.3 Internet users (% of population) in the Tropics, the rest of the world and globally.
International Telecommunications Union, 2020
0
10
20
30
40
50
60
70
2000
2001
2002
2003
2004
2005
2006
2007
2008
2009
2010
2011
2012
2013
2014
2015
2016
2017
2018
2019
The Tropics Rest of the World World
% o
f pop
ulat
ion
Internet users
The World Wide Web has existed for just over 30 years; however, recent data estimates 21.7 billion devices are now connected—a number that continues to grow (ITU and UNESCO, 2019). Internet users are individuals who have used the internet from any location in the past three months of being surveyed. These data do not represent subscriptions; they are based on household surveys.
According to the latest available estimates from the ITU, in 2019, 53.5% of people worldwide used the internet in 2019—an increase from just 17% in 2005. In the non-tropical world, internet use far exceeds that of the Tropics. This considerable gap between the Tropics and the rest of the world has persisted since the turn of the century. In 2019, estimates suggest just 37.1% of people used the internet in the Tropics—indicating that the gap has actually widened since previous reporting in State of the Tropics reports.
The slower growth rate in the Tropics is driven by South Asia, particularly India (see Figure 2.4), where the most recent estimates actually show a decline in the proportion of people using the internet between 2017 and 2018. The reason for this decline is as
yet unclear and may be a correction on earlier estimates. But, if correct, it has important ramifications for India and the broader Tropics. Due to its large population, India has one of the largest and growing online populations in the world. It may simply represent a transition taking place from fixed-line to mobile broadband, and the data has not yet caught up. More recent estimates from other sources suggest internet use in India was as high as 45% in early 2021 (Datareportal, 2021).
In some parts of the Tropics, namely Latin America and the Caribbean, internet user rates are comparable to, or greater than, the global estimates (see Figure 2.6). Internet access growth has been rapid in these regions and has accelerated since 2010. Dedicated government-supported programs have helped drive growth in internet access. For example, in Colombia, a dedicated government ministry for Science, Technology and Innovation has supported funding for significant digital infrastructure and public–private partnerships aimed at closing the digital divide (OECD, 2019). These regions are also highly urbanised (most people live in cities), giving people more access to ICT infrastructure.

2 :: DIGITAL ACCESS IN THE TROPICS 17
Figure 2.4 Internet users (% of population) across the tropical regions.
International Telecommunications Union, 2020
0
10
20
30
40
50
60
70
2000
2001
2002
2003
2004
2005
2006
2007
2008
2009
2010
2011
2012
2013
2014
2015
2016
2017
2018
2019
Central & Southern Africa Northern Africa & Middle East South Asia
South East Asia Caribbean Central America
South America Oceania
% o
f pop
ulat
ion
In the tropical African regions, however, access remains below 25% despite rapid improvement since the early 2000s. In Oceania, internet use has now exceeded 30%, but growth in use has been slower than in other tropical regions. There are persistently low levels of internet access in Papua New Guinea, Solomon Islands and Kiribati. Low rates of internet use in Africa and Oceania point not only to a lack of ICT infrastructure but also unreliable energy sources and low rates of digital literacy. Both of these barriers to internet access will be discussed in subsequent chapters.
The groups of people who have access to and use the internet vary between regions, gender and age. People living in urban areas are more likely to use the internet, men are more likely than women, and young people are more likely than the elderly (World Bank, 2016).
Mobile broadbandRecent advances in mobile technology have allowed more people to access the internet through internet-enabled mobile devices, particularly smartphones. This has allowed far more people access to the internet without ever being connected by a fixed line.
Smartphones and mobile internet access are some of the most important and transformative technologies to arise in the twenty-first century. Smartphone technology and the rapid increase in third-party software applications means that low prices for smartphones in developing countries are driving a digital revolution with users and developers leveraging the potential and power of mobile networks to transform services across sectors, including agriculture, education, health, energy, water and sanitation management. However, access to the internet through mobile broadband remains low in many parts of the Tropics (see Figure 2.5). Recently, network coverage of at least third-generation (3G)
mobile broadband has increased to be almost global (see Figure 2.6). However, a gap exists between the population covered by mobile broadband networks and those actually using them. There are many barriers, including governmental, cost and infrastructure, particularly electricity. In some countries, the cost of data is prohibitively expensive.
The data included here are both active mobile broadband subscriptions per population and the percentage of the population covered by at least a 3G network. Time series data are not available for mobile broadband subscriptions, so the latest available data, 2015–2018, are used instead.
CHILD IN NIGERIA. PHOTO: ARNE HOEL, WORLD BANK
18 STATE OF THE TROPICS REPORT 2021
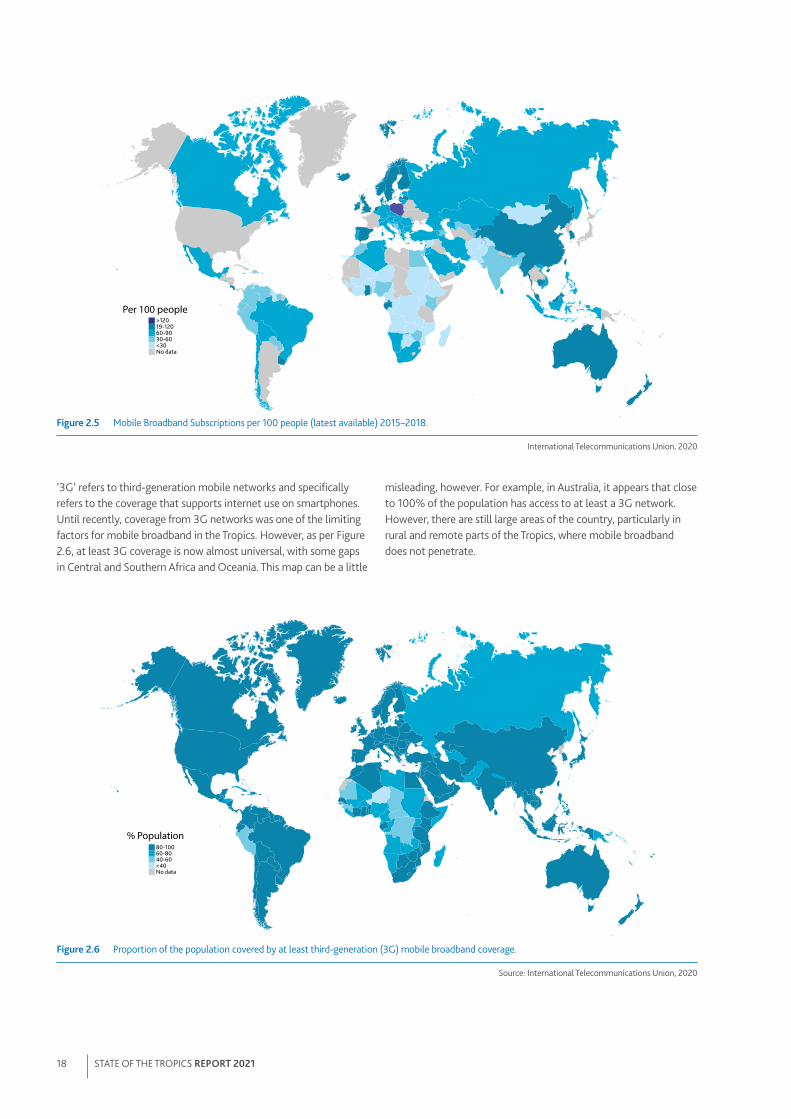
‘3G’ refers to third-generation mobile networks and specifically refers to the coverage that supports internet use on smartphones. Until recently, coverage from 3G networks was one of the limiting factors for mobile broadband in the Tropics. However, as per Figure 2.6, at least 3G coverage is now almost universal, with some gaps in Central and Southern Africa and Oceania. This map can be a little
misleading, however. For example, in Australia, it appears that close to 100% of the population has access to at least a 3G network. However, there are still large areas of the country, particularly in rural and remote parts of the Tropics, where mobile broadband does not penetrate.
Figure 2.5 Mobile Broadband Subscriptions per 100 people (latest available) 2015–2018.
International Telecommunications Union, 2020
Figure 2.6 Proportion of the population covered by at least third-generation (3G) mobile broadband coverage.
Source: International Telecommunications Union, 2020
No data<3030-6060-9019-120>120
Per 100 people
No data<4040-6060-8080-100
% Population
2 :: DIGITAL ACCESS IN THE TROPICS 19
Affordability of ICT
Affordability of a mobile phone and internet data are an essential part of the conversation around the digital divide. There is evidence to suggest that affordability, or the ability of individuals or households to pay for telecom services relative to their disposable income, is one of the main barriers to the use of mobile phones and the internet. Affordability depends not only on both price and income but also on other competing spending choices.
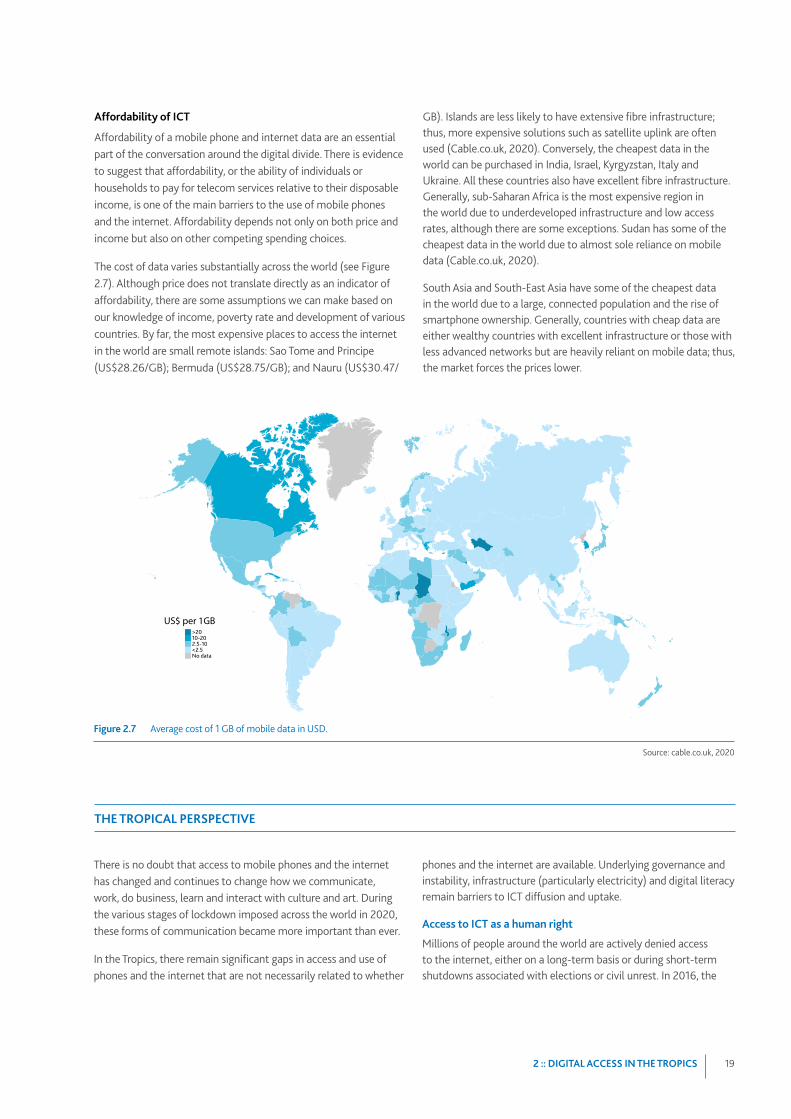
The cost of data varies substantially across the world (see Figure 2.7). Although price does not translate directly as an indicator of affordability, there are some assumptions we can make based on our knowledge of income, poverty rate and development of various countries. By far, the most expensive places to access the internet in the world are small remote islands: Sao Tome and Principe (US$28.26/GB); Bermuda (US$28.75/GB); and Nauru (US$30.47/
GB). Islands are less likely to have extensive fibre infrastructure; thus, more expensive solutions such as satellite uplink are often used (Cable.co.uk, 2020). Conversely, the cheapest data in the world can be purchased in India, Israel, Kyrgyzstan, Italy and Ukraine. All these countries also have excellent fibre infrastructure. Generally, sub-Saharan Africa is the most expensive region in the world due to underdeveloped infrastructure and low access rates, although there are some exceptions. Sudan has some of the cheapest data in the world due to almost sole reliance on mobile data (Cable.co.uk, 2020).
South Asia and South-East Asia have some of the cheapest data in the world due to a large, connected population and the rise of smartphone ownership. Generally, countries with cheap data are either wealthy countries with excellent infrastructure or those with less advanced networks but are heavily reliant on mobile data; thus, the market forces the prices lower.
There is no doubt that access to mobile phones and the internet has changed and continues to change how we communicate, work, do business, learn and interact with culture and art. During the various stages of lockdown imposed across the world in 2020, these forms of communication became more important than ever.
In the Tropics, there remain significant gaps in access and use of phones and the internet that are not necessarily related to whether
phones and the internet are available. Underlying governance and instability, infrastructure (particularly electricity) and digital literacy remain barriers to ICT diffusion and uptake.
Access to ICT as a human right
Millions of people around the world are actively denied access to the internet, either on a long-term basis or during short-term shutdowns associated with elections or civil unrest. In 2016, the
Figure 2.7 Average cost of 1 GB of mobile data in USD.
Source: cable.co.uk, 2020
No data<2.52.5-1010-20>20
US$ per 1GB
THE TROPICAL PERSPECTIVE
20 STATE OF THE TROPICS REPORT 2021
Human Rights Council of the General Assembly of the United Nations passed Resolution A/HRC/32/L.20, which covers the promotion, protection and enjoyment of human rights on the internet (United Nations, 2016). This resolution explicitly ‘condemns unequivocally measures to intentionally prevent or disrupt access to or dissemination of information online in violation of international human rights law and calls on all States to refrain and cease such measures’ (United Nations, 2016, p. 4).
Despite this, in 2020 alone, Bangladesh, the DRC, Egypt, India, Indonesia, Iran, Iraq, Sudan, Myanmar and Zimbabwe shut down the internet in all or some parts of their countries (Roth, 2020). In early 2021, following a coup d’état, the military-controlled government of Myanmar imposed several internet blackouts across the country. Governments use internet shutdowns during elections, anti-government protests or armed conflict. While some prolonged internet shutdowns are measures taken to tackle insurgency and political opposition, they have also been used for causes as small as preventing examination cheating (Kathuria et al., 2018). An internet shutdown has been defined by online digital rights organisations Access Now as: ‘an intentional disruption of internet or electronic communications, rendering them inaccessible or effectively unusable, for a specific population or within a location, often to exert control over the information’ (Taye, 2019, p. 2).
Internet shutdowns can have far-reaching consequences, even for countries with already low internet use rates. According to an analysis by the Brookings Institute, internet shutdowns have created significant negative economic impacts across the world (West, 2015). Looking at just the impact of shutdowns on GDP, the analysis estimates that in 2015, India lost $US 968 million; Saudi Arabia $US 465 million; Brazil $US 116 million; and the Republic of Congo, $72 million from their economies (West, 2015). It is important to note that this analysis did not include estimates for lost tax revenues, impacts on worker productivity, impacts on business expansion or potential loss of investments and are thus, underestimates (West, 2015).
Internet shutdowns also have negative social and health impacts. They tend to undermine trust in the reliability of the internet, separate family and friends, block access to online banking and government services and education and stop the media reporting (Internet Society, 2019).
During a health crisis such as the COVID-19 pandemic, they can be potentially deadly. The coronavirus pandemic highlights the role that the internet and mobile phones play as a service, not just a tool of business or education. According to Human Rights Watch, internet shutdowns harm stay at home orders, block essential information and thus undermine efforts to bring the pandemic under control (Human Rights Watch, 2020).
Mobile phones and poverty alleviation
Access to mobile phones is often cited as an important factor for economic growth and poverty alleviation. There is certainly clear evidence that mobile phone and internet access contribute
to growth in GDP (de Silva et al., 2008), but the evidence demonstrating poverty alleviation is less clear and, in some cases, may be overly optimistic.
A mobile phone is generally the first and only information communication technology used by people in the most remote and rural areas of the Tropics. There has long been an assumption that access to mobile phones will benefit people living in rural and remote regions, particularly in poor countries in the Tropics. However, the evidence for this is mixed, particularly among the poorest and most marginalised people in the Tropics.
There are a number of ways that mobile phones can empower the most impoverished people—they can mean safety, deliver education, provide access to health care, provide access to markets and banking and even strengthen democracy.
In Kerala, in southern India, small-scale fishers have benefitted immensely from widespread mobile phone adoption. Mobile phones have helped coordinate supply and demand, minimise wastage, integrate markets and reduce price fluctuations (Abraham, 2007). Importantly, fishers also felt less isolated and at-risk during emergencies (Abraham, 2007).
In the poorest parts of the world, people will often invest in mobile phone technology before meeting the needs of improved sanitation, water, health, housing and education. It seems in many cases, people are willing to make these sacrifices because they see the mobile phone offering economic improvement (Diga, 2007).
Mobiles phones are also known to provide a sense of safety and connection and help to avoid unforeseen shocks. Research in Uganda demonstrated that the communication device provided a means of timely responses, reduced surprises with available information, allowed the ability to multi-task and plan during shocks, engaged less time to physically search for individuals and less emotional distress during difficult ordeals (Diga, 2007).
However, more recent research in Tanzania demonstrated that most mobile phone users do not benefit materially from mobile phones. Most users only use their phone for socialising and entertainment and often sacrifice funds that might otherwise go towards essentials such as food (Malm and Toyama, 2021). Importantly, the upfront cost associated with purchasing and subscribing is often a large proportion of an individual’s income or savings (Malm and Toyama, 2021) and can thus impoverish people further.
In Indonesia, researchers found that, particularly in remote communities, people did not make new contacts or offset transport costs by owning a mobile phone. Generally, phones were simply used as an extension of their normal everyday life—they were used to talk to friends and family, take photos and listen to music (Matous, 2017).
Thus, the evidence for mobile phones alleviating poverty is mixed. On the one hand, mobile phones can help alleviate some of the

PHOTO: EVAN SCHNEIDER UN PHOTO
2 :: DIGITAL ACCESS IN THE TROPICS 21 MOBILE PHONE TOWER, PNG. PHOTO: MICHAEL JOHNSON.

22 STATE OF THE TROPICS REPORT 2021
dimensions of extreme poverty, such as having to walk to visit family or contact people during emergencies, but often people will sacrifice food, sanitation and other needs to pay for the mobile phone. For people who already have the means to access markets and wish to improve their situation, a mobile phone is an important tool. However, it is far from the panacea for extreme poverty it was often touted to be in the early years of the twenty-first century. Unfortunately, ICT is not yet a substitute for a lack of transportation or sanitation in already marginalised communities.
Bridging the divide: Satellite connectionsA recent critical development in bridging the digital divide, particularly for remote, unconnected regions, is the growing potential of satellite connections. Satellite technologies generally have a higher cost relative to terrestrial technology and are far slower, and thus are used only where cable-based systems are not financially viable due to low population densities or large distances between populations (Finau, 2019). For many people in the Tropics, a satellite connection is the only option available (Garrity and Husar, 2021). Even in situations where some terrestrial network infrastructure is available, satellite deployments might actually be preferred since they require only electrical power and a clear line of sight to the sky (Garrity and Husar, 2021). Until recently, most satellite-based internet was provided by geostationary orbit (GEO) satellites, positioned at an altitude of 35,700 km, providing coverage over a very wide area. But due to distance from the surface, use is expensive, LEO and with high latency (Garrity and Husar, 2021). Despite this, GEO satellites have proved incredibly useful. For example, the University of the South Pacific (USP) currently leases GEO satellite communications systems to provide regional connectivity for its satellite-based remote campuses (Finau, 2019). Known as USPNet, the university owns and operates this private network purely for USP use. For USP’s distant students and staff, USPNet provides for the opportunity to participate in interactive audio tutorials (conducted from any campus), communicate by email with a lecturer, tutor or another student, access the World Wide Web, watch a live video multicast, access multimedia material via server downloads and, more recently, live video conferences (and tutoring) (University of the South Pacific, 2021).
More recently, the increased use and potential of LEO constellations provide very different value propositions for internet connectivity in underserved regions (Garrity and Husar, 2021). LEO satellites operate between 160 and 2,000 km altitude and have previously been used, largely by governments, for Earth observation and remote sensing.
However, new commercial LEO constellations, such as those being deployed by Starlink by SpaceX, Project Kuiper by Amazon, OneWeb and Lightspeed by Telesat, among others, have the potential to dramatically expand the availability of high-speed broadband internet access with levels of service that rival fibre optic cables in terms of speed and latency, and at significantly reduced price levels compared to traditional GEO satellites (Garrity and Husar, 2021). Thus, LEO constellations are considered potentially transformational for internet connectivity around the world.
SpaceX’s Starlink is the most advanced LEO constellation in operation and is currently undergoing beta trials. Since 2019, they have launched over 1,400 satellites with approval for 10,000 and with plans to launch up to 42,000 (Rawls et al., 2020). According to SpaceX, one of the aims of Starlink is to deliver high-speed broadband internet to locations where access has been unreliable or completely unavailable (Starlink, 2021). There are some concerns, however, about the costs of LEO technology and its impact on ground-based astronomy (Rawls et al., 2020).
Although LEO constellations are likely to provide broadband for lower prices than traditional GEO satellites, the cost could still be a significant barrier, particularly in low- and middle-income countries. There are significant manufacturing and maintenance costs—a Starlink satellite would need to be replaced after around five years, and there are significant costs associated with launching new satellites (Daehnick et al., 2020). Some estimates suggest that in its current form, a LEO broadband subscription would be around US$80 per month with up to $300 in start-up costs, far more than the vast majority of people in the Tropics can afford, particularly if there are cheaper terrestrial options available (Rawls et al., 2020). The future might see prices come down, though, particularly as manufacturing and launch technology continues to improve.
One of the final criticisms of LEO technology come from astronomers who suggest that the efficacy of land-based observatories will be impacted by the light trails of thousands of satellites (Rawls et al., 2020). Satellites continue to reflect sunlight after sunset and will cause bright streaks in astronomical images for most of the night (Tregloan-Reed et al., 2020). Due to these concerns, Starlink and Amazon have committed to work with global astronomical observatories to develop darkening technologies to limit the impact of LEO constellations (Tregloan-Reed et al., 2020, Rawls et al., 2020).
Access to mobile phones and the internet is the first important step to bridge the digital divide in the Tropics. However, access and use of digital technologies are influenced by the political, cultural and geographical context in which it is used.
With the development of lower-cost, higher-quality satellite-based technology, access will become cheaper and perhaps even universal; however, this will be only one step towards financial inclusion and
poverty alleviation. Equality of education, access to transport, electricity, sanitation and health infrastructure all influence if and how people will use technology.
There are considerable barriers to overcome for the Tropics to achieve universal access to digital technologies. Some of these barriers will be discussed in subsequent chapters.
LOOKING FORWARD

2 :: DIGITAL ACCESS IN THE TROPICS 23
ABRAHAM, R. 2007. Mobile phones and economic development: Evidence from the fishing industry in India. Information Technologies and International Development, 4, 5–17.
CABLE.CO.UK 2020. Worldwide mobile data pricing: The cost of 1GB of mobile data in 228 countries. Available: https://www.cable.co.uk/mobiles/worldwide-data-pricing/ [Accessed 6 May 2020].
DAEHNICK, C., KLINGHOFFER, I., MARITZ, B. & WISEMAN, B. 2020. Large LEO satellite constellations: Will it be different this time? Advanced Industries [Online]. Available: https://www.mckinsey.com/industries/aerospace-and-defense/our-insights/large-leo-satellite-constellations-will-it-be-different-this-time [Accessed 01 June 2021].
DATAREPORTAL. 2021. Digital 2021—India [Online]. Available: https://datareportal.com/reports/digital-2021-india?rq=India [Accessed 18 May 2021].
DE SILVA, H., ZAINUDEEN, A. & RATNADIWAKARA, D. 2008. Perceived economic benefits of telecom access at the Bottom of the Pyramid in emerging Asia. Sri Lanka: LIRNEAsia.
DIGA, K. 2007. Mobile cell phones and poverty reduction: Technology spending patterns and poverty level change among households in Uganda. Masters Thesis. University of KwaZulu Natal, Durban.
FINAU, K. 2019. Satellite communications in Pacific Island countries. Asia-Pacific Information Superhighway Working Paper Series. Bangkok, Thailand: Asian Development Bank.
GARRITY, J. & HUSAR, A. 2021. Digital connectivity and low Earth orbit satellite constellations—Opportunities for Asia and the Pacific. ADB Sustainable Development Working Paper Series. Manila, Philippine: Asian Development Bank
HUMAN RIGHTS WATCH 2020. End internet shutdowns to manage COVID-19—Blocking access could cost lives. Available: https://www.hrw.org/news/2020/03/31/end-internet-shutdowns-manage-covid-19 [Accessed 04 January 2021].
INTERNATIONAL TELECOMMUNICATIONS UNION 2020. World telecommunications/ICT indicators database. Geneva, Switzerland: International Telecommunications Union.
INTERNET SOCIETY 2019. Internet shutdowns—An internet society public policy briefing. Geneva, Switzerland: Internet Society.
ITU & UNESCO 2019. State of broadband report 2019. Geneva, Switzerland: UNESCO
KATHURIA, R., KEDIA, M., VARMA, G., BAGCHI, K. & SEKHANI, R. 2018. The anatomy of an internet blackout: Measuring the economic impact of internet shutdowns in India. India: Indian Council for Research on International Economic Relations
MALM, M. K. & TOYAMA, K. 2021. The burdens and the benefits: Socio-economic impacts of mobile phone ownership in Tanzania. World Development Perspectives, 21, 100283.
MATOUS, P. 2017. Complementarity and substitution between physical and virtual travel for instrumental information sharing in remote rural regions: A social network approach. Transportation Research Part A: Policy and Practice, 99, 61–79.
OECD 2019. OECD Reviews of digital transformations: Going digital in Colombia. Paris: OECD
RAWLS, M. L., THIEMANN, H. B., CHEMIN, V., WALKOWICZ, L., PEEL, M. W. & GRANGE, Y. G. 2020. Satellite constellation internet affordability and need. Research Notes of the AAS, 4, 189.
ROTH, K. 2020. Shutting down the internet to shut up critics. Available: https://www.hrw.org/world-report/2020/country-chapters/global-5 [Accessed 07 January 2021].
STARLINK 2021. Starlink [Online]. Available: https://www.starlink.com [Accessed 01 June 2021].
TAYE, B. 2019. Targeted, cut off, and left in the dark. The #keepiton report on internet shutdowns in 2019. New York, USA: Access Now
TREGLOAN-REED, J., OTAROLA, A., ORTIZ, E., MOLINA, V., ANAIS, J., GONZÁLEZ, R., COLQUE, J. P. & UNDA-SANZANA, E. 2020. First observations and magnitude measurement of Starlink’s Darksat. Astronomy & Astrophysics, 637, L1.
UNITED NATIONS 2016. Resolution A/HRC/32/L2.0 The promotion, protection and enjoyment of human rights on the internet. New York, USA: United Nations General Assembly.
UNIVERSITY OF THE SOUTH PACIFIC 2021. USPNet [Online]. Suva, Fiji: University of the South Pacific. Available: https://www.usp.ac.fj/?3395 [Accessed 10 May 2021].
WEST, D. M. 2015. Internet Shutdowns cost countries $2.4 billion last year. Washington DC, USA: Centre for Technology Innovation at Brookings.
WORLD BANK 2016. World development report 2016—Digital dividends. Washington DC: The World Bank.
WORLD BANK 2020. World development indicators.
REFERENCES

1INFORMATION AND COMMUNICATIONS TECHNOLOGY IN THE PACIFIC
24 STATE OF THE TROPICS REPORT 2021

Tropical nations in the Pacific were relatively late in joining the digital revolution. Outside of Tropical Australia and Hawaii, tropical nations in Oceania only exceeded 50 mobile phone subscriptions per 100 people in 2014 (International Telecommunications Union, 2020). Prior to 2000, mobile phone connections were less than 2%. In 2019, there were an estimated 56 mobile phone subscriptions per 100 people, equating to around 50% penetration (GSMA, 2019). This is the lowest rate of subscriptions in the Tropics and almost half the global rate. Internet use in the region is even lower, with this report estimating that outside of tropical Australia and the USA, internet users represented less than 20% of the population in 2019.
Often in development and ICT literature, Pacific Islands are included in the discussion alongside South-East Asia and East Asia and, due to small populations relative to mainland Asia, their very specific needs and challenges are masked by the wealth of the greater population of mainland Asia.
Nations in the Pacific are small, culturally diverse and often separated by challenging terrain or vast ocean. Countries vary significantly in size from Papua New Guinea with 8.7 million people to Niue, with only a few thousand people. Much of the region is relatively remote and geographically challenging, with a combination of small island countries with large distances from the central islands or larger islands with difficult terrain (GSMA, 2015). The complexity of developing sound infrastructure within and between archipelagos with small distributed markets is an ongoing challenge to operators in the region.
Alongside geography, infrastructure challenges also remain. Currently, connectivity is provided by a combination of mobile, satellite, undersea cables and fixed networks (GSMA, 2015).
However, numerous countries have yet to complete the digital switchover process and allocate spectrum on the 700 MHz band to mobile services (GSMA, 2019). The scarcity of internet bandwidth is also a critical limiting factor, slowly being addressed through new submarine cables (GSMA, 2019). Submarine cables are now connected to Fiji, French Polynesia, Guam, the Marshall Islands, the Federated States of Micronesia, Yap, Palau, New Caledonia, Papua New Guinea, Samoa, Tonga and Vanuatu (Finau, 2019). However, inter-island connectivity remains constrained, with a high proportion of outer island and remote areas not yet connected (Finau, 2019).
Developing mobile phone and internet infrastructure in the region is expensive and, until recently, not profitable. Costs include negotiations with national land trust boards and customary landowners regarding the location of transmission towers, installing towers in remote locations (often requiring boats and helicopters) and establishing a retail network of vendors to sell and distribute handsets, SIM cards and airtime (Foster and Horst, 2018).
Maintenance also comes with a price—technicians may have to hike long distances or be carried by boat to service towers once they are built (Newens, 2021).
In some Pacific nations, the question of connectivity is as dependent on electricity as it is on towers and cables. Personal solar or small generators can charge basic mobile phones, but more sophisticated smartphones have much shorter battery life. As more people start using smartphones, generating enough electricity to keep them charged is a profound challenge (Newens, 2021).
Nevertheless, Pacific Island nations have embraced new and more mobile technologies and have incorporated them into the way they do business, and family and village life. Mobile phones increasingly
CS1 :: INFORMATION AND COMMUNICATIONS TECHNOLOGY IN THE PACIFIC 25
PHOTO: TOM PERRY, WORLD BANK

26 STATE OF THE TROPICS REPORT 2021
provide more business opportunities but also connectivity that previously had been denied due to culture and distance. The diversity of the pacific islands has also supported a diverse group of ways that people use and interact with technology.
In Papua New Guinea, as mobile phones spread further, it became commonplace for people, during cheap call times, to randomly dial numbers hoping to connect with new people. This phenomenon, known as ‘phone friends’ in Papua New Guinea, has grown to the point where particularly young people can have many phone friends whom they never actually meet in person (Wardlow, 2018). Sometimes these connections are used to develop romantic liaisons but are often just for reaching out and meeting new people. Phone friends have been shown to be particularly beneficial for women with HIV who are often isolated from family and friends (Wardlow, 2018).
In Vanuatu, building a network of social contacts is culturally important for building status and renown. Thus, using a mobile phone to randomly connect with others is simply seen as an extension of this—particularly for young men living in urban Port Vila (Kraemer, 2018). In many cases, these young men are those who may have lost or been distanced from their home-island place connections, so mobile phones and the currency of phone credit allows them to build their own networks and thus status among their peers (Kraemer, 2018).
In the Solomon Islands, mobile phone ownership is popular even in island villages with no phone signal. Mobile phones are instead used to play music, take photos and watch foreign films, often provided on microSD cards from relatives living in urban areas (Hobbis and Hobbis, 2020). The trade of films on microSD cards is often used in lieu of gifts or even money (Hobbis and Hobbis, 2020).
PUBLIC AND PRIVATE PLAYERS
One of the biggest drivers of digital transformation in the Pacific has been the telecommunications company Digicel (Newens, 2021). Digicel, a Caribbean-based company, is the largest provider of mobile phones and mobile internet in the region (particularly in Melanesia) and is well known for breaking into new markets or those previously held by monopolies and state-owned enterprises (GSMA, 2019). It operates in the Caribbean, Latin American and more recently, the Pacific. Its largest and fastest growing market in the region is PNG, where it has been responsible for providing access to millions of people in recent years (Jogensen, 2018). It also operates in Fiji, Tonga, Samoa and Vanuatu.
In May 2020, Digicel filed for bankruptcy in Bermuda due to unsustainable debts. In June 2020, lenders alleviated some debt, and operations have continued uninterrupted (Burkitt-Gray, 2020). However, news reports suggest Digicel is looking to sell its Pacific assets (Galloway, 2021). This potentially creates a complex diplomatic situation in the Pacific since it is suggested that China Mobile (a Chinese state-owned company) will bid for the sale. This is likely to alarm other developed nations in the region, such as Australia and New Zealand, due to the potential security ramifications (Galloway, 2021).
CONCLUSION
The delivery of ICT, mobile phone and internet connectivity in the Pacific is complex: financially, culturally and geographically. It is likely remote communities will always lag behind global trends in infrastructure and ICT access. Mobile and satellite technology has the growing potential to bridge the digital divide in the Pacific, although barriers associated with existing challenges in the region, including low literacy rates, poor health outcomes and lack of opportunity, will also need to be overcome. Digital technology remains a tool rather than a solution for the region’s economic and social challenges.
PHOTO: ALISON OFOTALAU

CS1 :: INFORMATION AND COMMUNICATIONS TECHNOLOGY IN THE PACIFIC 27
REFERENCES
BURKITT-GRAY, A. 2020. Digicel lenders agree to cut debt by $.16bn and interest by $125m a year. Capacity [Online]. Available: https://www.capacitymedia.com/articles/3825793/digicel-lenders-agree-to-cut-debt-by-16bn-and-interest-by-125m-a-year [Accessed 10 May 2021].
FINAU, K. 2019. Satellite communications in Pacific Island countries. Asia-Pacific Information Superhighway Working Paper Series. Bangkok, Thailand.
FOSTER, R. J. & HORST, H. A. 2018. Introduction. In: HORST, R. J. F. A. H. A. (ed.) The moral economy of mobile phones—Pacific Island perspectives. Canberra, Australia: Australian National University Press.
GALLOWAY, A. 2021. Australia may finance buyer for Pacific mobile network Digicel to block China. Sydney Morning Herald.
GSMA 2015. The mobile economy: Pacific Islands 2015. London, UK: GSMA Intelligence.
GSMA 2019. The mobile economy—Pacific Islands. London, UK: GSMA Intelligence.
HOBBIS, S. K. & HOBBIS, G. 2020. Non-/human infrastructures and digital gifts: The cables, waves and brokers of Solomon Island’s internet. Ethnos, 1–23.
INTERNATIONAL TELECOMMUNICATIONS UNION 2020. World telecommunications/ICT indicators database. Geneva, Switzerland: International Telecommunications Union.
JOGENSEN, D. 2018. Toby and ‘the mobile system’: Apocalypse and salvation in Papua New Guinea’s wireless network. In: FOSTER, R. J. & HORST, H. A. (eds.) The moral economy of mobile phones. Pacific Island perspectives. Canberra, Australia: Australian National University Press.
KRAEMER, D. 2018. ‘Working the mobile’: Giving and spending phone credit in Port Vila, Vanuatu. In: FOSTER, R. J. & HORST, H. A. (eds) The moral economy of mobile phones. Pacific Island perspectives. Canberra, Australia: Australian National University Press.
NEWENS, C. 2021. Papua New Guinea calling. Rest of world [Online]. Available: https://restofworld.org/2021/papua-new-guinea-calling/ [Accessed 23 April 2021].
WARDLOW, H. 2018. HIV, phone friends and affective technology. In: FOSTER, R. J. & HORST, H. A. (eds.) Moral economy of mobile phones. Pacific Island perspectives. Canberra, Australia: Australian National University Press.
28 STATE OF THE TROPICS REPORT 2021
2DIGITAL HEALTH—A HEALTHIER FUTURE FOR THE TROPICS

The enormous growth of digital technologies in the twenty-first century has provided evidence that these technologies have the potential to improve health care provision and promotion and overcome geographical and socioeconomic barriers (Lupton, 2014). Although there is some debate around whether digital services can be safely used to replace face-to-face consultations and treatment, there is certainly evidence they provide benefits and have enormous potential. These benefits are seen particularly where mobile and digital communications have a greater reach into populations than existing health services.
There are numerous ways in which digital technologies are used or could be used. According to a review by Lupton (2014), there are many examples, including:
• telemedicine and telehealth—medical consultations, clinical diagnosis and health care delivery, offered remotely via digital technologies
• medical education, training and exchange of information between doctors and other health care providers using digital technologies
• digital diagnostic, genomic, risk-assessment and decision-making technologies—including apps, online tools and add-on technologies to smartphones for use by doctors
• digitised devices for delivering medicine or regulating/enhancing bodily functions (cochlear implants, cardiac monitors, insulin pumps, digital pills and so on)
• health informatics such as electronic patient records and other online health information, triage and appointment booking systems
• digital health promotion—disseminating health education messages via digital technologies
• biometric tracking, patient self-care and monitoring devices—apps, smartphones, smart objects and wearable technologies for monitoring and tracking bodily functions and activities
• patient blogs, social media sites and dedicated platforms for exchange of information by patients, enrolment into drug trials and crowdfunding for medical research
• digital epidemiology—tracking disease outbreaks and spread using digital media
• sensor-based environmental monitoring, community development and citizen science initiatives
• digital health games—console, online and app games designed for fitness, tracking biometrics, health promotion and health education.
According to a survey by the World Health Organization (WHO) in 2015, the vast majority of nations have a funded, government-supported digital health strategy (WHO, 2016).
In the Tropics, digital health has the capacity to enhance existing health care in many ways. This case study will briefly discuss some of the ways that digital technology can and has improved health delivery in the Tropics.
CS2 :: DIGITAL HEALTH—A HEALTHIER FUTURE FOR THE TROPICS 29
PHOTO: REBECCA MBUYA-BROWN
IMPROVED MANAGEMENT OF CHRONIC CONDITIONS
Tuberculosis (TB) is an infectious disease caused by the bacterium Mycobacterium tuberculosis that has potentially killed more people throughout history than any other microbial pathogen (Daniel, 2006). In 2016, 10.4 million people fell ill with TB, and 1.7 million died from the disease. Since 2011, it has been the leading cause of death worldwide from a single infectious agent and was the leading cause of death in West Papua (Indonesia) in 2016 (Wang et al., 2016). It is far more prevalent in the Tropics than in the rest of the world (State of the Tropics, 2019). Deaths from TB can be prevented with early diagnosis and appropriate treatment, and millions of people are successfully treated every year (WHO, 2017). However, without treatment, an active infection is almost always fatal. Adherence to treatment is essential for curing patients, slowing the spread of infection and minimising drug resistance.
The WHO, along with a number of other health development institutions have encouraged the use of digital technologies to assist with medication adherence in TB sufferers. In particular, mobile messaging services systems have been shown to have some effectiveness in improving patient adherence to treatment (Gashu et al., 2020). Thus, digital interventions are being rolled out across the world to help facilitate better medication and treatment adherence and thus health outcomes. Similar evidence suggests that text messaging interventions are effective for the self-management of diabetes, weight loss, smoking cessation and medication adherence for anti-retrovirus therapies (Amankwaa et al., 2018; Hall et al., 2015; Marcolino et al., 2018).
MATERNAL AND CHILD HEALTH
The vast majority (>80%) of maternal and neonatal deaths occur in the Tropics (State of the Tropics, 2019). Many of these deaths are preventable, given appropriate education and health care intervention. Women and children have disproportionately poorer access to adequate health services and education than men. While there has been progress, far too few women, children and adolescents have access to essential good-quality health services and education in the Tropics.
Digital technology has the capacity to bridge some of these gaps and to support pregnant women through the antenatal, birth and postnatal period (Sondaal et al., 2016). Similar to the treatment of chronic diseases mentioned above, digital interventions such as text messages and other forms of communication to pregnant women provided essential information and a form of continuity of care where health workers are scarce (Sondaal et al., 2016). In some cases, mobile phones can go beyond being a tool to access maternal health care and also improve women’s maternal health literacy and knowledge about accessing more general health and wellbeing information (Dasuki and Zamani, 2019). Women also experience better outcomes during emergencies as they are able to contact their midwives in a more timely fashion (Dasuki and
Zamani, 2019). Mobile phones and other digital services also have an empowering influence. Women are able to interact more with other pregnant women and talk more freely about their health issues with their midwives (Sondaal et al., 2016). Thus, using digital technologies can enhance the capabilities and overall wellbeing of pregnant women.
EXPANDED VACCINATION COVERAGE
The immunisation of children has been and will continue to be an important driver of improved health outcomes throughout the Tropics. Generally, however, children living in rural and remote areas and more impoverished urban areas have lower immunisation rates than do their wealthy urban counterparts (Uddin et al., 2016). In 2019, the WHO estimated that 14 million infants worldwide failed to receive basic childhood immunisations (WHO, 2020). Digital health services can help overcome some of the challenges affecting immunisation programs by reducing human error, improving data quality and identifying unvaccinated populations (Kim et al., 2017). Existing successful programs include digital programs supporting reminders and recalls, monitoring and surveillance, and advertising campaigns (Kim et al., 2017). In Bangladesh, an experimental program that adapted a smartphone application to register pregnant women allows women to register births through SMS, sends vaccination reminders to new mothers, and provides data to existing health databases, resulted in vaccination rates in the targeted population growing by almost 30% in both rural and urban settings (Uddin et al., 2016). The growing body of evidence that digital technologies can assist with vaccine delivery will be particularly important in the context of rolling out COVID-19 vaccinations to underserved populations throughout the Tropics.
DATA COLLECTION FOR DISEASE MONITORING AND TREATMENT
Digital technologies have revolutionised how data collection and monitoring is conducted, even in remote regions of the Tropics. The use of digital technologies such as mobile phones and GPS-enabled devices can facilitate remote data collection, remote monitoring and monitoring of diseases and epidemic outbreaks, as well as other health outcomes such as diagnostic and treatment support (Tilahun et al., 2021).
An emerging and increasingly important tool is digital disease detection. Digital disease detection uses a wide range of sources on the internet to collate public health data. Systems using informal data have been used to reduce the time to recognise an outbreak, prevent governments from suppressing outbreak information, and facilitate public health responses to outbreaks and emerging diseases (Brownstein et al., 2009). How this works is that rather than relying on formal official sources, information from affected
30 STATE OF THE TROPICS REPORT 2021

people or witnesses is received directly from reports sent through different communication channels, such as social media or established alert systems, and information channels, such as news, public health networks, and non-governmental organisations (O’Shea, 2017). These systems can complement existing monitoring programs and are often inexpensive, transparent and flexible, particularly as digital technology continues to penetrate rural and remote human populations (O’Shea, 2017).
A key tropical example of digital disease detection is the surveillance and outbreak management response system (SORMAS), a collaboration between the Helmholtz Center for Infectious Research, Robert Koch-Institute, Bernhard-Nocht Institute and the Nigeria Field Epidemiology & Laboratory Training Program (Denecke, 2017). It was initiated in 2014 when there was a high potential for Ebola outbreaks in Nigeria due to the ongoing epidemic in West Africa. SORMAS was developed specifically to provide demographic data of any Ebola infections to the National Nigerian Ebola Emergency Operation Centre; support the detection of suspected cases and contacts; and manage surveillance of close contacts (Denecke, 2017). Through a smartphone and tablet app, SORMAS allowed real-time, bi-directional information exchange between field workers and the Emergency Operations Centre and included contact follow-up, automated status reports and GPS tracking with all data stored on a secure cloud-based system (Denecke, 2017). SORMAS has more recently been adapted for use for other infectious diseases, including COVID-19, cholera, congenital rubella, dengue fever, guinea worm, human rabies, influenza, Lassa virus, malaria, measles, meningitis (CSM), monkeypox, plague, poliomyelitis and yellow fever (SORMAS, 2020).
As well as disease detection, technology is also used to monitor symptoms and aid treatment. Leishmaniasis is a neglected tropical disease caused by a protozoan parasite transmitted by sandfly bite. It is common in Brazil, which accounts for 97% of all infections in Latin America. It is largely a disease of poverty, more readily contracted in situations of poor housing and sanitary conditions (WHO, 2020). A smartphone application called Leishcare was developed through a collaboration between medical researchers and software engineers to assist health professionals in diagnosing and managing the condition in rural and remote settings (da Silva et al., 2020). The application provides treatment suggestions and allows users to store patient information to track their progress and share de-identified information with colleagues for advice. The application used the data entered to provide information on how serious the infection was and what treatment options were available (da Silva et al., 2020). Trials of the applications were considered highly successful, and variations of the app have been developed in other parts of the Tropics, such as Africa, with locally relevant information (da Silva et al., 2020).
Other forms of emerging technology are being used in the Tropics to monitor and treat other neglected tropical diseases such as schistosomiasis. For example, the Geshiyaro Project, based in Ethiopia, uses biometric fingerprint technology to identify and track
participants in a project evaluating the feasibility of treatments for schistosomiasis in Ethiopia (Mekete et al., 2019).
LIMITATIONS OF DIGITAL HEALTH
Given the infancy of digital and mobile health programs in the Tropics, it is perhaps too soon for measurable positive outcomes to be reflected in key health indicators such as life expectancy and maternal mortality. However, in terms of effectiveness, digital technologies, particularly mobile phones, have been shown to provide access to medical services for remote populations, enhance communication flows and coordination among medical organisations, improved education and training of health care workers, allow timely data collection (Chib, 2013).
However, all interactions with mobile and digital health are not necessarily positive and, in some cases, could have unintended negative consequences. Digital technology is far from perfect, and many devices and applications can be erratic, frightening and difficult to use (Lupton, 2014). As discussed in the chapter on education, digital literacy is a key barrier to the use of a wide range of technology. Access to a mobile phone or the internet does not guarantee that a user is confident using the technology for
CS2 :: DIGITAL HEALTH—A HEALTHIER FUTURE FOR THE TROPICS 31
PHOTO: PHOTO: TOM PERRY, WORLD BANK

32 STATE OF THE TROPICS REPORT 2021
complex processes such as data entry or health care information. Even among health professionals, there is sometimes reluctance to rely on digital technologies since they do not replace local and contextualised knowledge developed over time through their work (Lupton, 2014).
Additionally, there are privacy concerns. The proliferation of m-health and e-health applications has led to a large amount of sensitive data being generated (Benjumea et al., 2020). Concerns around privacy are often a barrier facing the adoption of digital health technologies, particularly among older users and those for whom digital literacy is low (Fox and Connolly, 2018). More broadly, however, concerns around the privacy of m-health are justified because many health apps on the market lack appropriate security to protect the integrity of the data they collect and display (Galvin and DeMuro, 2020). Different countries have different legal requirements for privacy, and there is no universal system to score the privacy rating of health applications.
Physical security is also an issue (Galvin and DeMuro, 2020). Mobile phone usage practices of device sharing make the dissemination of sensitive medical information difficult for groups
such as women who might be reliant on male partners or village leaders for access to technology (Chib, 2013). Additionally, more than a third of smartphone users do not apply security measures to prevent access, and thus misplacement, theft or loss of mobile devices can lead to privacy breaches (Galvin and DeMuro, 2020).
CONCLUSION
It is clear that digital technologies have the potential to continue to transform how health care is delivered in the Tropics and potentially have far-reaching positive health outcomes. However, it is a tool, not a panacea, and its value will always be influenced by the personal, cultural, social and environmental context in which it is used. Digital health technologies are not likely to be able to replace face-to-face interactions between patients, health care workers, nurses and physicians, but they can add value.
PHOTO: DOMINIC CHAVEZ, WORLD BANK

CS2 :: DIGITAL HEALTH—A HEALTHIER FUTURE FOR THE TROPICS 33
AMANKWAA, I., BOATENG, D., QUANSAH, D. Y., AKUOKO, C. P. & EVANS, C. 2018. Effectiveness of short message services and voice call interventions for antiretroviral therapy adherence and other outcomes: A systematic review and meta-analysis. PloS one, 13, e0204091–e0204091.
BENJUMEA, J., ROPERO, J., RIVERA-ROMERO, O., DORRONZORO-ZUBIETE, E. & CARRASCO, A. 2020. Privacy assessment in mobile health apps: Scoping review. JMIR Mhealth Uhealth, 8, e18868.
BROWNSTEIN, J. S., FREIFELD, C. C. & MADOFF, L. C. 2009. Digital disease detection—Harnessing the web for public health surveillance. The New England Journal of Medicine, 360, 2153–2157.
CHIB, A. 2013. The promise and peril of mHealth in developing countries. Mobile Media & Communication, 1, 69–75.
DA SILVA, P. E. F., DOS SANTOS FONSECA JUNIOR, G., AMBROZIO, R. B., TIBURCIO, M. G. S., MACHADO, G. B., DE CARVALHO, S. F. G., DE OLIVEIRA, E. J., DE ALMEIDA SILVA TEIXEIRA, L. & JORGE, D. C. 2020. Development of a software for mobile devices designed to help with the management of individuals with neglected tropical diseases. Research on Biomedical Engineering, 36, 527–537.
DANIEL, T. M. 2006. The history of tuberculosis. Respiratory Medicine, 100, 1862–1870.
DASUKI, S. I. & ZAMANI, E. D. 2019. Assessing mobile phone use by pregnant women in Nigeria: A capability perspective. The Electronic Journal of Information Systems in Developing Countries, 85, e12092.
DENECKE, K. 2017. An ethical assessment model for digital disease detection technologies. Life Sciences, Society and Policy, 13 (1): 1-11.
FOX, G. & CONNOLLY, R. 2018. Mobile health technology adoption across generations: Narrowing the digital divide. Information Systems Journal, 28, 995–1019.
GALVIN, H. K. & DEMURO, P. R. 2020. Developments in privacy and data ownership in mobile health technologies, 2016–2019. Yearbook of Medical Informatics, 29, 32–43.
GASHU, K. D., GELAYE, K. A., MEKONNEN, Z. A., LESTER, R. & TILAHUN, B. 2020. Does phone messaging improves tuberculosis treatment success? A systematic review and meta-analysis. BMC Infectious Diseases, 20, 42–42.
HALL, A. K., COLE-LEWIS, H. & BERNHARDT, J. M. 2015. Mobile text messaging for health: A systematic review of reviews. Annual Review of Public Health, 36, 393–415.
KIM, S. S., PATEL, M. & HINMAN, A. 2017. Use of m-health in polio eradication and other immunization activities in developing countries. Vaccine, 35, 1373–1379.
LUPTON, D. 2014. Critical perspectives on digital health technologies. Sociology Compass, 8, 1344–1359.
MARCOLINO, M. S., OLIVEIRA, J. A. Q., D’AGOSTINO, M., RIBEIRO, A. L., ALKMIM, M. B. M. & NOVILLO-ORTIZ, D. 2018. The impact of mhealth interventions: Systematic review of systematic reviews. JMIR Mhealth Uhealth, 6, e23.
MEKETE, K., OWER, A., DUNN, J., SIME, H., TADESSE, G., ABATE, E., NIGUSSU, N., SEIFE, F., MCNAUGHTON, E., ANDERSON, R. M. & PHILLIPS, A. E. 2019. The Geshiyaro project: A study protocol for developing a scalable model of interventions for moving towards the interruption of the transmission of soil-transmitted helminths and schistosome infections in the Wolaita zone of Ethiopia. Parasites & Vectors, 12 (1): 1-12.
O’SHEA, J. 2017. Digital disease detection: A systematic review of event-based internet biosurveillance systems. International Journal of Medical Informatics, 101, 15–22.
SONDAAL, S. F. V., BROWNE, J. L., AMOAKOH-COLEMAN, M., BORGSTEIN, A., MILTENBURG, A. S., VERWIJS, M. & KLIPSTEIN-GROBUSCH, K. 2016. Assessing the effect of mhealth interventions in improving maternal and neonatal care in low- and middle-income countries: A systematic review. PloS ONE, 11, e0154664.
SORMAS 2020. SORMAS. The real-time software for outbreak and epidemic surveillance [Online]. Helmholtz Center for Infectious Research. Available: https://sormas.org [Accessed 15 April 2021].
STATE OF THE TROPICS 2019. Health in the Tropics. Townsville, Australia. James Cook University.
TILAHUN, B., GASHU, K. D., MEKONNEN, Z. A., ENDEHABTU, B. F. & ANGAW, D. A. 2021. Mapping the role of digital health technologies in the case detection, management, and treatment outcomes of neglected tropical diseases: a scoping review. Tropical Medicine and Health, 49 (1): 1-10.
UDDIN, M. J., SHAMSUZZAMAN, M., HORNG, L., LABRIQUE, A., VASUDEVAN, L., ZELLER, K., CHOWDHURY, M., LARSON, C. P., BISHAI, D. & ALAM, N. 2016. Use of mobile phones for improving vaccination coverage among children living in rural hard-to-reach areas and urban streets of Bangladesh. Vaccine, 34, 276–283.
WANG, H., NAGHAVI, M., ALLEN, C., BARBER, R. M., BHUTTA, Z. A., CARTER, A., et al. 2016. Global, regional, and national life expectancy, all-cause mortality, and cause-specific mortality for 249 causes of death, 1980–2015: A systematic analysis for the global burden of disease study 2015. The Lancet, 388, 1459–1544.
WHO 2016. Global diffusion of eHealth: Making universal health coverage achievable. Report of the third global survey on eHealth. Geneva: World Health Organization.
WHO 2017. Global tuberculosis report 2017. Geneva.
WHO 2020. Leishmaniasis [Online]. Geneva: World Health Organisation. Available: https://www.who.int/news-room/fact-sheets/detail/leishmaniasis [Accessed 15 April 2021].
WHO 2020. The Global Health Observatory—Immunization [Online]. Geneva, Switzerland: World Health Organization. Available: https://www.who.int/data/gho/data/themes/immunization [Accessed 12 April 2021].
REFERENCES

EDUCATION AND DIGITAL L ITERACY
3
34 STATE OF THE TROPICS REPORT 2021

SUMMARY
ŵ Lack of access to ICT at school and at home limits the ability of students to learn digital skills that would allow them to participate in the global digital economy, which many see as essential for ongoing sustainable development.
ŵ There is huge variation in schools with internet access, from less than 3% in Madagascar and Burkina Faso to 100% in Brunei, Maldives and a number of Caribbean states. Access tends to remain very low across Central and Southern Africa and in some parts of South Asia, South-East Asia and Central America. Data are not available for any countries in Oceania.
ŵ Africa and South Asia have particularly low levels of internet access at home. The youngest group, school-aged children, had the lowest access levels in these regions, with slightly higher access in East Asia and the Pacific.
ŵ In the context of the global pandemic with many schools operating remotely, this low level of access in many tropical countries meant that when schools were closed, the only means of students continuing schooling was through take-home packages—this has resulted simply in many students not accessing schooling at all with potentially huge social and economic costs to the countries that can bear it the least.
ŵ Generally, ICT is far less likely to be included in primary school curriculums, particularly in Africa and the Middle East. However, by upper secondary, most countries reporting included ICT in the curriculum. Programs in Brazil, Malaysia and Thailand have increased the number of schools with the capacity to teach ICT skills in those countries.
ŵ Far fewer youth and adults have basic digital skills in the Tropics than in the rest of the world. However, there are some exceptions. Saudi Arabia, Malaysia and Singapore have relatively high digital literacy rates, with rates comparable to most countries reporting from the non-Tropics and higher than some countries.
3 :: EDUCATION AND DIGITAL LITERACY 35 PHOTO: CHARLOTTE KESI, WORLD BANK

36 STATE OF THE TROPICS REPORT 2021
Education underpins all aspects of human rights and sustainable development. Well educated people tend to live longer, make better-informed health choices and have higher incomes. Access to quality education for all people is central to achieving the 2030 Agenda for Sustainable Development.
Lack of access to ICT at school and at home limits the ability of students to learn digital skills that would allow them to participate in the global digital economy, which many see as essential for ongoing sustainable development. Access to ICT, and the knowledge to use it, is increasingly important for employability and will only increase in importance as the use of digital technology continues to grow and penetrate across the Tropics. A key indicator of the Sustainable Development Goal Education for all is the proportion of youth and adults with ICT skills, by type of skill.
In 2020, according to UNESCO, 191 countries closed their schools for varying lengths of time due to the COVID-19 pandemic (UNESCO, 2020a). More than 1.5 billion students, from pre-primary to tertiary level, were disrupted by these closures, with classroom-based teaching disrupted (Montoya, 2020). The State of the Tropics project
has clearly demonstrated that even prior to the pandemic of 2020, rates of children out of school were much higher in the Tropics than in the rest of the world (State of the Tropics, 2020). Before the pandemic, children from the poorest households were already almost five times more likely to be out of primary school than their wealthier counterparts.
Thus, without adequate ICT devices, internet access, appropriate resources for distance learning and teacher training, millions of students across the world simply could not partake in ongoing education. It is likely this disruption has disproportionately affected students in low-income, resource-poor and rural areas (Montoya, 2020). From another perspective, school closures seen all over the world in 2020 are not unusual in many tropical countries due to natural disasters, conflict and budgetary and labour negotiations.
This chapter will explore access to the internet for schools and households and the implications for education going forward. It will also explore digital literacy as a barrier to ICT uptake and reasonable use.
ICT access at school
It is widely accepted that in the education sector, access to ICT can help individuals to compete in a global economy by creating a skilled workforce and facilitating social mobility (UNESCO, 2015). Specifically, ICT is known to have a multiplying effect throughout the education system through providing new sets of skills, reaching students with little or no access, training teachers and reducing costs associated with traditional education.
Unfortunately, there is a lack of systematic data collection in measuring ICT in education in both developed and developing countries. In developed countries, we may assume that the vast majority of schools will have some access to ICT, particularly computers with internet access. However, in many tropical countries, access is likely to be much lower. There are not sufficient data available on ICT access at schools to produce regional estimates, but some country-level data is available across the Tropics (see Figure 3.1). Comparable data are not available for Nigeria, India or China, which represent a large proportion of the tropical population and tend to drive broader regional trends.
Among the available data, there is huge variation in schools with internet access, from less than 3% in Madagascar and Burkina Faso to 100% in Brunei, Maldives and a number of Caribbean states. Access tends to remain very low across Central and Southern Africa and in some parts of South Asia, South-East Asia and Central America. Data are not available for any countries in Oceania.
Although these data are likely to be an underestimate due to the time lag in reporting, it is clear that in many nations in the Tropics, most schools have no internet available to them. The importance of understanding how and if schools have connectivity has been noted by the global community, and Project Connect—an initiative by UNICEF—aims to map every school in the world and assess the quality of each school’s internet connectivity with the goal of creating an observable metric of society’s progress towards enabling access to information and opportunity for every community on Earth (UNICEF, 2019). Although far from complete, as this platform is populated further, it will enable governments, development agencies and NGOs to identify where ICT infrastructure is lacking and develop targeted solutions, working to get all schools online in the future.
INTRODUCTION
TRENDS

3 :: EDUCATION AND DIGITAL LITERACY 37
Figure 3.1 Percentage of educational institutions connected to the internet from select tropical nations—latest data available.
Source: UNESCO, 2019
0 10 20 30 40 50 60 70 80 90 100
Dominican Republic
Dominica
Jamaica
Antigua and Barbuda
Saint Kitts and Nevis
Saint Lucia
Saint Vincent and the Grenadines
Nicaragua
Panama
El Salvador
Costa Rica
Guyana
Ecuador
Colombia
Brazil
Cambodia
Philippines
Indonesia
Malaysia
Thailand
Brunei Darussalam
Sri Lanka
Bangladesh
Maldives
Niger
Burkina Faso
Madagascar
Guinea
Cameroon
Zambia
Gambia
Sao Tome and Principe
Botswana
Mauritius
% of schools

38 STATE OF THE TROPICS REPORT 2021
ICT access at home
Learning has never been confined to school only; children and young people continue to learn outside formal schooling, through parents and other relatives, life experiences and, increasingly, online through the internet (Daoud et al., 2020). During the height of the COVID-19 crisis in 2020, 90% of governments around the world closed schools and implemented remote learning practices (UNICEF, 2020b). At their peak, school closures affected 1.5 billion school students from pre-primary to upper secondary (UNICEF).
Given that two-thirds of all children and young people do not have an internet connection at home (UNICEF, 2020b), remote learning poses a range of challenges. During 2020, schools and governments worldwide used a range of tools, including digital, TV- and radio-based, and take-home packages (UNICEF, 2020a). Despite these
efforts, UNICEF estimates that at least 463 million—or 31%—of schoolchildren globally could not be reached by digital or broadcast remote learning programs enacted to counter school closures (UNICEF, 2020a). Additionally, although several platforms were used for remote learning that do not need internet access, internet access vastly improves the range of tools that schools, educators and students can use to access and share knowledge (Krönke, 2020). Thus, the impact of not having access to ICT at home can increase disadvantage and has likely widened the gap between rich and poor, particularly during school closures in 2020 and 2021.
For this measure, data are not available at a country level, so State of the Tropics estimates could not be calculated. However, UNICEF has developed estimates for regions that are broadly comparable to the regions used in the State of the Tropics analysis (see Figure 3.1). These data include developing countries only.
It is clear that some regions of the Tropics lag behind global estimates considerably. Africa and South Asia have particularly low levels of internet access at home. The youngest group, school-aged children, had the lowest access levels in these regions, with slightly higher access in East Asia and the Pacific.
In the context of the global pandemic with many schools operating remotely, this low level of access in many tropical countries meant that when schools were closed, the only means of students continuing schooling was through take-home packages. This has resulted simply in many students not accessing schooling at all
(UNICEF, 2020a), with potentially huge social and economic costs to the countries that can bear it the least.
Beyond the pandemic, low levels of internet access at home also reduce the potential for children and young people to have success in school, work and life in an increasingly digital world (UNICEF, 2020b). Research has also demonstrated that having the internet at home improved students’ performances across literacy, mathematics, sciences and digital competencies (Daoud et al., 2020). Additionally, access to the internet at home can have a positive influence on socialisation (Daoud et al., 2020).
Figure 3.2 Percentage of children and young people with internet access at home, by region. Adapted from UNICEF (2020a). These are UNICEF regional aggregations, not those used by the State of the Tropics.
Source: UNESCO, (2020a)
0
10
20
30
40
50
60
70
East Asia andthe Pacific
Eastern andSouthern
Africa
West andCentral Africa
Middle Eastand North
Africa
LatinAmerican and
Caribbean
South Asia EasternEurope andCentral Asia
World
Children and youths (0 - 25 years old) Youths (15-24) School aged children

3 :: EDUCATION AND DIGITAL LITERACY 39
Digital literacyAccess to technology does not automatically provide all the benefits of the technology (Scheerder et al., 2017). A huge barrier to the adoption and use of ICT in the Tropics is the ability to understand and use computers, the internet and other forms of technology. Digital illiteracy forms an important component of the digital divide, and as the world becomes increasingly digital, will exacerbate existing inequalities. Digital literacy is inextricably linked with education and thus included in this chapter.
As defined by UNESCO, ‘Digital literacy is the ability to access, manage, understand, integrate, communicate, evaluate and create information safely and appropriately through digital devices and networked technologies for participation in economic and social life. It includes competencies that are variously referred to as computer literacy, ICT literacy, information literacy, and media literacy’ (Antonisis and Montoya, 2018, p. 6).
Digital literacy is one of the key targets of Sustainable Development Goal 4.4: ‘substantially increase the number of youth and adults who have relevant skills, including technical and vocational skills, for employment, decent jobs and entrepreneurship’. It is considered the final barrier to true digital inclusion.
ICT included in school curriculumsA key component of building digital literacy will involve including ICT teaching and learning in school curriculums from primary
to secondary. To achieve this, schools will not only have to have access to ICT infrastructure (as mentioned above) but also have appropriately trained teachers.
UNESCO provides some data from developing countries about how ICT is included in school curriculums (UNESCO, 2020b). Unfortunately, data are sparse and poorly reported throughout the Tropics. Additionally, these data are likely to be underestimates since there is some delay in reporting. However, it does give us some idea of the spread of where and how ICT skills are taught in schools.
Generally, ICT is far less likely to be included in primary school curriculums, particularly in Africa and the Middle East. However, by upper secondary, most countries reported included ICT in the curriculum (see Figure 3.3). Programs in Brazil (CETIC BR, 2019), Malaysia and Thailand have increased the number of schools with the capacity to teach ICT skills in those countries.
Although these data do not include India, in all other countries in South Asia, there has been a concerted effort to include ICT in all upper secondary curriculum. In Bangladesh, as part of the Bangladesh Vision 2021, a program called Digital Bangladesh was developed. This program included plans to expand internet infrastructure, digitise government services and facilitate universal digital literacy. Similar programs in Sri Lanka and Maldives means that by upper secondary, all schools now include ICT in their curriculum.
PHOTO: JOHN HOGG, WORLD BANK

Digital skillsAn important output measure of ICT education is whether young people and adults possess the skills to effectively use technology and the internet when it is available to them. UNESCO collates data on various basic skills for a select number of countries. Unfortunately, regional estimates are not possible; however, data from individual countries can provide some insight (see Table 3.1).
Far fewer youth and adults have basic digital skills in the Tropics than in the rest of the world. However, there are some exceptions.
Saudi Arabia, Malaysia and Singapore have relatively high digital literacy rates, which are comparable to most countries reporting from the non-Tropics and higher than some countries. This is likely due to the combination of access to ICT infrastructure and devices and growing established ICT education programs in those countries.
It is clear that for the full impact of access to digital technology to be realised, digital literacy will need to be prioritised in the Tropics.
PHOTO: SIMONE MCCOURTIE
Figure 3.3 Percentage of countries that include ICT as part of the school curriculum across available tropical regions based on latest available estimates. Includes developing countries only.
Source: UNESCO, 2020b
0%
10%
20%
30%
40%
50%
60%
70%
80%
90%
100%
Central andSouthern Africa
Northern Africaand Middle East
South America South Asia South East Asia Rest of the World(developingcountries)
Primary Lower Secondary Upper secondary
% o
f cou
ntrie
s rep
ortin
g
40 STATE OF THE TROPICS REPORT 2021 PHOTO: JC MCILLWAINE, UN PHOTO

3 :: EDUCATION AND DIGITAL LITERACY 41
Table 3.1 Spread of basic skills of youth and adults across select countries from the Tropics and the Rest of the World based on latest available data.
Source: UNESCO, 2020b
CountryCopying or moving a file or folder
Using basic arithmetic formula in a spreadsheet
Finding, downloading, installing and configuring software
Writing a computer program using a specialized programming language
Botswana 34.85 19.66 4.77Cabo Verde 41.58 22.51 5.27Cote d'Ivoire 23.59 3.07 8.72 0.73Togo 3.56 1.41 2.36 0.50Zambia 63.60 22.90 32.80 6.60Zimbabwe 5.12 1.83 1.85 0.57Djibouti 19.93 12.33 13.32 4.52Niger 3.87 0.79 1.28 0.33Saudi Arabia 75.59 49.30 51.10 14.50Sudan 4.39 1.77 2.36 1.60Brunei Darussalam 59.46 42.45 42.61 27.69Cambodia 27.77 8.98 0.63 0.14China, Hong Kong SAR 5.75 33.01 29.99 2.67China, Macao SAR 43.67 34.92 42.14 7.72Indonesia 59.48 25.16 25.49 3.52Malaysia 56.26 25.90 34.69 7.85Singapore 55.46 40.73 54.86 7.44Thailand 19.67 15.09 4.56 1.99Cuba 22.49 20.49 9.55 5.16Dominican Republic 24.38 10.85 12.57 6.73Jamaica 15.82 5.87 5.88 1.53Costa Rica 25.34 15.86 3.66Mexico 33.70 26.99 2.85 7.71Brazil 22.23 12.41 14.73 2.86Colombia 37.49 24.65 17.47 6.14Peru 26.95 15.58 1.25 2.95Algeria 21.46 9.41 15.55 6.89Egypt 57.23 13.70 38.50 8.80Morocco 5.23 22.37 34.91 6.76Tunisia 22.67 15.94 15.30 14.67Japan 6.99 5.53 5.69 4.80Mongolia 16.99 13.63 1.57 4.21South Korea 44.84 64.99 6.63Kazakhstan 27.28 38.92 16.96 5.88Uzbekistan 39.40 4.60Iran 29.96 7.01 8.73 1.28Pakistan 5.47 2.08 3.44 1.45Azerbaijan 65.57 20.75 8.42 0.69Bahrain 71.17 45.85 59.66 9.87Cyprus 49.80 23.52 44.51 2.79Georgia 32.24 9.38 1.56 0.46Iraq 48.86 6.80 23.00 4.70Kuwait 71.78 38.40 66.37 13.36Oman 9.91 27.53 28.74 6.92Qatar 55.54 24.94 37.12 5.56Turkey 42.36 18.97 3.16United Arab Emirates 73.33 34.01 31.28Belarus 4.21 17.60 24.47 2.39Bulgaria 44.29 27.46 1.23Czechia 58.92 40.73 26.15 3.93Hungary 53.70 36.97 35.98 4.28Poland 49.86 28.85 33.94 3.32Romania 6.97 13.73 2.83 1.30Russian Federation 37.80 22.36 2.91 1.15Slovakia 6.26 41.58 29.97 3.70Denmark 69.41 56.35 61.38 13.85Estonia 56.39 44.37 5.94 6.94Finland 61.31 49.53 59.84 9.96Iceland 71.21 71.26 7.76 12.88Ireland 5.20 36.00 57.80 5.81Latvia 48.22 32.17 45.63 2.54Lithuania 59.67 41.64 37.36 4.55Norway 62.86 55.02 74.34 11.93Sweden 61.44 50.57 65.15 11.48United Kingdom 49.71 64.25Andorra 59.59 52.80 5.98Bosnia and Herzegovina 44.60 7.53 22.29 2.14Croatia 46.15 32.15 41.73 4.83Greece 57.23 39.18 23.45 5.87Italy 48.97 30.70 34.92 4.35Malta 54.53 39.93 5.17 5.69Montenegro 7.89 25.30 39.49 3.56Portugal 49.98 38.01 36.74 7.98Serbia 53.64 24.48 19.34 4.13Slovenia 57.31 42.17 32.45 4.50Spain 59.17 38.22 58.45 6.85North Macedonia 4.34 21.44 17.58 2.88Austria 68.39 45.54 56.87 7.27Belgium 69.75 44.39 41.29 9.00France 52.56 5.62Germany 64.71 35.04 62.68 5.43Luxembourg 78.88 68.54 71.31 1.77Netherlands 7.75 51.70 68.27 8.16Switzerland 61.71 57.00 62.19 9.32Chile 25.49 11.56

42 STATE OF THE TROPICS REPORT 2021
The digital divide is more than just access to technology, the internet or even a smartphone. The ability to learn remotely, to use technology for work or to run a business represents the second and third levels of the divide.
In the context of education, the digital divide between the Tropics and the rest of the world has been shrinking slowly but unevenly. It remains significant. The COVID-19 pandemic has highlighted this divide and potentially, at least for the short term, increased it. It is clear that better infrastructure development is necessary, but not sufficient, to help bridge this divide. It is not just the technology but how it is used.
Infrastructure challengesThe global pandemic of 2020 has clearly demonstrated that people have been expected to work, learn and study with flexibility. In many parts of the Tropics, this is just not possible. ICT related to education must sit on top of national education infrastructures. Access to technology and thus technology education is dependent on basic things such as appropriate rooms or buildings to house the technology, appropriate electrical wiring, heating and cooling and also security and safety (Mbodila et al., 2013). Given the low rate of internet access at home in tropical countries and even in tropical schools, this will be a major challenge for universal access going forward. Mobile technology has the potential to alleviate the infrastructure challenge but is often expensive for individuals to access. Internet access points such as internet cafes and community centres remain important for ongoing access.
According to the State of the Tropics 2020 Report, electricity access is far from universal in the Tropics (State of the Tropics, 2020). Currently, more people in the Tropics own a mobile phone than have reliable electricity to charge it. Universal access to clean, decentralised energy is a clear goal of the Sustainable Development Goals, and it will be difficult to achieve universal access to ICT and ICT education without it.
Cultural challengesCultural diversity also influences the role that ICT plays in education and the ICT skills of broader society. In the late
1990s, 80% of all internet content was estimated to be written in English (Pimienta et al., 2009); however, by 2017, new estimates suggest it has decreased to between 32% and 45%, suggesting the internet has become far more linguistically diverse (Pimienta, 2019). However, of the world’s 7,000 languages, only 10 languages account for 90% of all online content. Tropical countries are incredibly linguistically diverse, representing 92% of all spoken languages worldwide (State of the Tropics, 2020; Eberhard et al., 2020).
A large proportion of online educational software produced in the world market is in English, as is most of the content indexed by major search engines such as Google (Mbodila et al., 2013). In tropical countries where English, Spanish, French or Chinese is not the first language, this represents a serious barrier to integrating ICTs into the education system (Mbodila et al., 2013; Pimienta et al., 2009).
There are additional social and cultural factors that influence digital literacy. The same drivers of education and income inequality also drive inequality of ICT knowledge and use. Fewer women than men use and have access to ICT than men as a direct result of unfavourable conditions with respect to employment, education and income. In some low- and lower middle–income countries, the lower social status of women often means providing education and use of ICT to women is not considered important (Anwar et al., 2020). In many tropical countries, particularly in South Asia, Northern Africa and the Middle East, men largely occupy academic, management and technical roles, allowing them greater access to technology and learning (Anwar et al., 2020).
However, recent research across Central and Southern Africa, South and South-East Asia has shown the perceived gender gap in digital literacy is closing, particularly among young people. For example, in India, women accounted for 23% of the ICT workforce in 2005, but had increased to 34% in 2015, with gender parity expected in the sector by the early 2020s (Agarwal and Malhotra, 2016).
The vast majority of knowledge associated with the positive impacts of ICT in education come from developed countries where access to technology is approaching universal. The context in the Tropics, particularly poorer parts of the Tropics, is quite different. The challenge for tropical countries will be to ensure that existing inequalities are reduced, not exacerbated by the role that technology plays in education and everyday life.
Increasing education in ICT and digital literacy will have considerable positive outcomes for tropical countries. As the world
continues to digitise, having ICT skills will become almost essential for engaging in modern economies. The full impact of children missing school or learning remotely where possible due to the Covid-19 pandemic will not be fully understood for some time. However, in places where internet and communication technology are poor, it is likely to be more significant, exacerbating existing inequalities. However, the pandemic has also highlighted the resilience of tropical countries, with many pivoting to new forms of delivering education surprisingly quickly.
THE TROPICAL PERSPECTIVE
LOOKING FORWARD

PHOTO: TOM PERRY, WORLD BANK 3 :: EDUCATION AND DIGITAL LITERACY 43

REFERENCES
AGARWAL, R. & MALHOTRA, G. 2016. Women and access to ICT: A case study of India. African Journal of Business Management, 10, 288–297.
ANTONISIS, M. & MONTOYA, S. 2018. A global framework to measure digital literacy. Available from: http://uis.unesco.org/en/blog/global-framework-measure-digital-literacy.
ANWAR, T., JIMENEZ, A., BIN NAJEEB, A., UPADHYAYA, B. & MCGILL, M. M. 2020. Exploring the enacted computing curriculum in K–12 schools in South Asia: Bangladesh, Nepal, Pakistan, and Sri Lanka. Proceedings of the 2020 ACM Conference on International Computing Education Research 79–90.
CETIC BR 2019. ICT in education 2018—Survey on the use of information and communication technologies in Brazilian schools. Sao Paulo: CETIC BR.
DAOUD, R., STARKEY, L., EPPEL, E., VO, T. D. & SYLVESTER, A. 2020. The educational value of internet use in the home for school children: A systematic review of literature. Journal of Research on Technology in Education, 1–22.
EBERHARD, D. M., SIMONS, G. F. & FENNIG, C. D. 2020. Ethnologue: Languages of the world. Twenty-fourth edition. Dallas, Texas: SIL International.
KRÖNKE, M. 2020. Africa’s digital divide and the promise of e-learning. Afrobarometer Policy Paper. Acrra, Ghana: Afrobarometer.
MBODILA, M., JONES, T. & MUHANDJI, K. 2013. Integration of ICT in education: Key challenges Scholarly Journal of Mathematics and Computer Science 2(5), pp. 54-60.
MONTOYA, S. 2020. The importance of monitoring and improving ICT use in education post-confinement. UIS Blog [Online] Available: http://uis.unesco.org/en/blog/importance-monitoring-and-improving-ict-use-education-post-confinement [Accessed January 2021]
PIMIENTA, D. 2019. Indicators of languages in the internet. Proceedings of the Language Technologies for All (LT4All). UNESCO Headquarters, Paris. European Language Resources Association (ELRA), 315–319.
PIMIENTA, D., PRADO, D. & BLANCO, Á. 2009. Twelve years of measuring linguistic diversity in the internet: Balance and perspectives. United Nations Educational, Scientific and Cultural Organization Paris.
SCHEERDER, A., VAN DEURSEN, A. & VAN DIJK, J. 2017. Determinants of internet skills, uses and outcomes. A systematic review of the second- and third-level digital divide. Telematics and Informatics, 34, 1607–1624.
STATE OF THE TROPICS 2020. State of the Tropics 2020 report. Cairns, Australia.
UNESCO 2015. Information and communication information technology (ICT) in education in Sub-Saharan Africa. A comparative analysis of basic e-readiness in schools. Information Paper. Quebec: UNESCO.
UNESCO 2019. UIS Stat. Canada: United Nations Educational, Social and Cultural Organisation Institute for Statistics.
UNESCO 2020a. Responding to COVID 19 and beyond—The Global Education Coalition in action. Paris.
UNESCO 2020b. UIS Stat. Canada: United Nations Educational, Social and Cultural Organisation Institute for Statistics.
UNICEF 2019. Project Connect [Online]. Available: https://www.projectconnect.world [Accessed 20 January 2021].
UNICEF 2020a. COVID-19: Are children able to continue learning during school closures? A global analysis of the potential reach of remote learning policies. Geneva: UNICEF
UNICEF 2020b. How many children and young people have internet access at home?: Estimating digital connectivity during the COVID-19 pandemic. Geneva: UNICEF.
44 STATE OF THE TROPICS REPORT 2021

3 :: EDUCATION AND DIGITAL LITERACY 45 PHOTO BY MARK ZIEMBICKI

3 MOBILE MONEY AND THE STORY OF M-PESA
46 STATE OF THE TROPICS REPORT 2021

Although it has only been available for just over a decade, mobile money has transformed how people access financial services, particularly in the Tropics. With just a basic mobile phone, mobile money allows people to safely store, send and transact money via text messages. This extends financial services to unbanked people at a very low cost (Logan, 2017; Suri and Jack, 2016). Unlike more modern payment apps such as Venmo or WeChat pay, it does not require a smartphone, bank account, credit card or internet connection (Kusimba, 2021). Mobile money is a money transfer system that uses mobile phones and a network of human agents who cash in and cash out for customers, exchanging e-money as text messages for hard currency (Kusimba, 2021). First introduced in South Africa and the Philippines in the mid-2000s, by 2018, the mobile money industry had reached 866 million people across some 90 countries by 2018 (GSMA, 2018). Mobile money accounts allow people to pay for things without having to use cash and thus can provide a gateway to life-enhancing services such as health care, education, employment and social protections (GSMA, 2018).
In 2007, Safaricom, the largest mobile network operator in Kenya, launched a phone-based money transfer service known as M-Pesa. Pesa is the Swahili term for money. It has now spread to the DRC, Egypt, Ghana, Kenya, Lesotho, Mozambique and Tanzania. It is used in 96% of Kenyan households and is considered Africa’s most successful mobile money service and the region’s largest fintech platform (Suri and Jack, 2016; Vodafone, 2020). According to Safaricom’s parent company Vodafone, in 2019, M-Pesa had 41.5 million active customers who carried out more than 12 billion transactions (Vodafone, 2020).
M-Pesa turns small businesses and other people into ATMs. When it was launched, the average distance from an individual to a bank was 9.2 kilometres (Logan, 2017). By 2015, the average distance to an M-Pesa agent was just 1.4 kilometres meaning far more people were in reach of one (Logan, 2017). The rapid uptake of M-Pesa is attributed to the fact its rollout coincided with growing mobile phone use, its simplicity of use and on the ground marketing by Safaricom (Suri and Jack, 2016). Importantly, M-Pesa has allowed a dramatic increase in internal remittances, particularly from urban areas to rural areas. Although urbanising rapidly, most of Kenya’s population remains rural. M-Pesa has allowed remittances to flow from large towns and cities to rural areas quickly and safely.
Generally, M-Pesa is perceived to have had a positive impact on poverty alleviation and economic development in Kenya. Some estimates suggest that M-Pesa alone has lifted as many as 194,000 households out of poverty and has been effective in improving the economic lives of poor women and members of female-led households (Suri and Jack, 2016). It has reportedly done this through more efficient allocation of labour, savings and better risk management (Suri and Jack, 2016).
However, as with questions around the impact of microfinance in other parts of the Tropics (Duvendack and Palmer-Jones, 2012), the effect of M-Pesa has also been reported to be unclear and likely not the panacea that many studies report it to be (Bateman et al., 2019).
There have also been drawbacks associated with mobile money and its ability to exacerbate existing inequalities and potential to exploit some of the vulnerable people in the Tropics in the name of
CS3 :: MOBILE MONEY AND THE STORY OF M-PESA 47
PHOTO: ERIC HERSHMAN

profit for international stakeholders. Evidence suggests that M-Pesa has been more successful and has more customers in wealthy urban areas than in poorer areas and slums (Bateman et al., 2019).
One of the key criticisms of mobile money in general and M-Pesa in particular is that due to its popularity, it has become very profitable, but these profits are not passed on to customers. M-Pesa is owned by Kenyan registered company Safaricom, which is now 40% owned by UK-based multinational Vodafone. Safaricom is Kenya’s largest company and in 2019, posted a US$620 million profit, thus providing considerable dividends for shareholders, most of which are in the UK (Bateman et al., 2019). Thus, the perception could be that wealthy shareholders are profiting from the transactions of some of the poorest people in the world.
M-Pesa has also led to the development of other platforms for loans and savings that come with their own risks and rewards. M-Shwari, for example, is a digital savings and loan banking product built on M-Pesa and owned by Safaricom. M-Shwari loans do not require collateral and must be repaid within 30 days. Customers are charged a 7.5% facilitation fee and can access loans through
M-Shwari even if they do not have a banking or credit history (Suri and Gubbins, 2018). For small loan consumers, the money has been found to be mostly used for school fees or emergency purposes rather than for consumption goods or productive assets, indicating it is used to smooth shocks rather than improve income (Suri and Gubbins, 2018). There are increasing concerns, however, that small, easy to access loans can lead to a culture of indebtedness (Alushula, 2019). A lack of knowledge around the true cost of loans and using loans for unproductive expenses such as gambling are seen as a growing risk for those using loans linked to M-Pesa (Alushula, 2019; Bateman et al., 2019). There is also a lack of consumer protection, which leaves many vulnerable to fraud and unfair product pricing, among other malpractices (Alushula, 2019).
Thus M-Pesa has been shown to have enormous benefit for many of its users but also has the potential to increase risk and potentially exacerbate existing inequalities. Although potentially transformational, mobile money is not necessarily the panacea for poverty alleviation and sustainable development it is often purported to be. As with many economic and development instruments, its success or otherwise will depend on the social, cultural and environmental context in which it operates.
48 STATE OF THE TROPICS REPORT 2021 PHOTO: ERIC HERSHMAN

CS3 :: MOBILE MONEY AND THE STORY OF M-PESA 49
REFERENCES
ALUSHULA, P. 2019. Alarm as easy digital loans yoke more Kenyans to debt. Business Daily [Online]. Available: https://www.businessdailyafrica.com/datahub/Alarm-as-easy-digital-loans-yoke-more-Kenyans-to-debt/3815418-5063014-en2bp7z/index.html [Accessed 05 May 2021].
BATEMAN, M., DUVENDACK, M. & LOUBERE, N. 2019. Is fin-tech the new panacea for poverty alleviation and local development? Contesting Suri and Jack’s M-Pesa findings published in Science. Review of African Political Economy, 46, 480–495.
DUVENDACK, M. & PALMER-JONES, R. 2012. High noon for microfinance impact evaluations: Re-investigating the evidence from Bangladesh. The Journal of Development Studies, 48, 1864–1880.
GSMA 2018. State of the industry report on mobile money. London, UK: GSMA.
KUSIMBA, S. 2021. Reimagining money: Kenya in the digital finance revolution, Stanford, CA, Stanford University Press.
LOGAN, S. 2017. Study provides fresh insights into the benefits of mobile money in Kenya. The Conversation Africa Edition [Online]. Available: https://theconversation.com/study-provides-fresh-insights-into-the-benefits-of-mobile-money-in-kenya-70432 [Accessed 04 March 2021].
SURI, T. & GUBBINS, P. 2018. How is digital credit changing the lives of Kenyans? Evidence from an evaluation of the impact of M-Shwari. Research Brief. Nairobi, Kenya.
SURI, T. & JACK, W. 2016. The long-run poverty and gender impacts of mobile money. Science, 354 (6317) pp. 1288-1292.
VODAFONE 2020. M-Pesa [Online]. Newberry UK: Vodafone. Available: https://www.vodafone.com/what-we-do/services/m-pesa [Accessed 04 March 2021].

PRODUCTION, TRADE, USE AND DISPOSAL OF ICT IN THE TROPICS
4
50 STATE OF THE TROPICS REPORT 2020
PHOTO: TOMIZAK

SUMMARY
ŵ Around 40% of all ICT goods are exported from tropical regions. These exports are dominated by South-East Asia and Central America. In other regions of the Tropics, the share of the global trade in ICT goods remains small.
ŵ South-East Asia is the only region in the Tropics that is a net exporter of ICT goods. All other regions in the Tropics import more technology than they produce and export.
ŵ Globally almost one-quarter of all people used the internet to make a purchase in 2019; however, this was concentrated in wealthy countries in North America, Europe and East Asia. Far fewer people use the internet for purchasing throughout the Tropics, with some exceptions such as Saudi Arabia, Malaysia and Singapore. The largest growth markets in the Tropics have been Hong Kong and India.
ŵ The rapid expansion of electrical and electronic equipment manufacturing across the world due to industrialisation, economic expansion, technological development and growing wealth has led to complementary growth in electronic waste or e-waste.
ŵ On a per-capita basis, tropical countries, with the exception of tropical Australia and the USA (Hawaii), produce far less e-waste than nations in North America and Europe. E-waste from North America and Europe is often exported to China, Brazil, Nigeria, Ghana and India.
4 :: PRODUCTION, TRADE, USE AND DISPOSAL OF ICT IN THE TROPICS 51

52 STATE OF THE TROPICS REPORT 2021
Trade in ICT goods and services and the emergence of global value chains has been a defining feature of global trade in the twenty-first century. ICT goods comprise a significant component of many countries trade, but the use of ICT has also shifted the way that international trade is conducted and organised—particularly the fragmentation of global trade into global value chains rather than simple supply chains. Increasingly, waste associated with technology is also becoming an important aspect of the global flows of ICT.
The trade of electronics and other parts and components associated with information communications and technology provides huge opportunities for tropical countries to take part in a lucrative global market through the production of parts and components or higher-level products such as computers or mobile phones.
Previous chapters have explored the impact of ICT on economic growth and education. Examining the trade of ICT goods and services provides additional information on tropical countries’ competitiveness, their contribution to global value chains and the weight of ICT in their structure of exports (Ciriani and Perin, 2017). In advanced economies, investment in ICT assets: computer hardware, software and internet and broadband infrastructure are crucial determinates of growth (Henry-Nickie et al., 2019).
Central to discussions of the trade of ICT products is the changing nature of global trade itself. International trade has moved from a simple supply chain, where one country extracts or creates a
product that it sells to another country, to global value chains, where production is far more fragmented and takes place in multiple countries. This fragmentation of production was driven in part by the ICT revolution in the 1990s and 2000s that brought forth cheaper and more reliable telecommunications, information management software and increasingly powerful computers (World Bank, 2020b).
As well as transforming trade, technology has changed how small-scale purchases and payments occur as well. Buying and selling over digital networks have grown rapidly alongside the digital revolution, particularly in South-East Asia. As digital economies expand globally, there is potential for more countries in the Tropics to engage with and benefit from e-commerce to aid in economic growth and sustainable development. The growth of mobile money in the Tropics (see Case Study: Mobile Money and the Story of M-Pesa) is a clear indicator that there a great deal of opportunity for enterprises in the Tropics to join the digital economy.
It is also important to acknowledge, alongside the positive impacts of the production, trade and use of ICT products, there are also negative effects, including growing e-waste and carbon emissions. Electronic waste is the fastest growing waste product worldwide.
This chapter will cover how ICT goods and services are traded from and within the Tropics and how ICT has impacted how goods, services and information are bought, sold and exchanged. It will also explore the growing challenge of e-waste.
ICT exports and imports
ICT goods exports include computers and peripheral equipment, communication equipment, consumer electronic equipment, electronic components, and other information and technology goods (World Bank, 2020a).
Around 40% of all ICT goods are exported from tropical regions. Thus, exports of ICT goods are proportionally a more important part of the economy in the Tropics (see Figure 4.1), despite the total value being far less than the rest of the world. However, these exports are dominated by South-East Asia and Central America. In other regions of the Tropics, the share of the global trade in ICT goods remains small. These estimates do not include the raw materials for ICT such a copper, zinc, cobalt and a range of rare earth metals, much of which does come from tropical countries.
Exports of ICT goods as a proportion of total exports declined globally since the dot com boom of the early 2000s but have made some recovery since 2013, as the world is becoming increasingly
digitised. It is important to note that the total value of exports of ICT goods has increased consistently since the turn of the century while comprising a relatively steady proportion of all exports. Fluctuations in exports of ICT goods from 2007–2009 were likely caused by the Global Financial Crisis as demands for goods and manufacturing fluctuated. Electronic components have also become smaller and cheaper since the turn of the century (World Bank, 2020b).
The South-East Asia region accounts for the vast majority of ICT exports in the Tropics (92%) and globally (37%). Although dominated by tropical China, Hong Kong, Malaysia, Singapore, Vietnam and Thailand are also all important ICT exporters and have increased their share in recent years. These smaller Asian nations play a particularly important role in the production and export of integrated circuits and electronic components (Vu, 2017). Shifts in export patterns in this region tend to drive global patterns, despite important ongoing contributions made by North America and Europe.
INTRODUCTION
TRENDS

3 :: OCEANS 53
Elsewhere in the Tropics, Mexico and Costa Rica are also important suppliers of electrical components, with ICT goods comprising 9% of all exports from the Tropics. Costa Rica has been an important manufacturing base for multinational companies for many years. By 2012, around 40 firms were operating exclusively in the electronics and electrical industries in Costa Rica (Frederick and Gereffi, 2013). Firms cited political stability and safety, competitive labour and operating costs, availability of qualified, skilled labour and proximity to large markets in the USA and Latin America as reasons for selecting Costa Rica (Frederick and Gereffi, 2013).
Mexico, with a large skilled population, is one of the largest exporters of ICT goods in the world, comparable to Thailand and the Philippines. Economic integration with the USA has been an important driver of ICT production in Mexico; however, it is likely that some ICT goods manufacturing and exports are underestimated due to the production occurring within large multinational, USA-based firms (Schatan and Enríquez, 2016).
PHOTO: JESSICA STELLA
Figure 4.1 ICT goods exported as a percentage of total exports globally, in the Tropics and in the Rest of the world.
Source: World Bank, 2020a
0%
5%
10%
15%
20%
25%
2000
2001
2002
2003
2004
2005
2006
2007
2008
2009
2010
2011
2012
2013
2014
2015
2016
2017
2018
% o
f tot
al e
xpor
ts
The Tropics Rest of World World
PHOTO: FAIRPHONE

54 STATE OF THE TROPICS REPORT 2021
Nations and regions that export ICT goods also tend to be the largest importers of technology as well. Given different parts of the digital manufacturing cycle require different components, it makes sense that countries with digital manufacturing would be both high importers and exporters.
Figure 4.2 ICT exports as a percentage of total exports across the tropical regions.
Source: World Bank, 2020a
Figure 4.3 ICT imports as a percentage of total exports globally, in the Tropics and in the Rest of the World.
Source: World Bank, 2020a
0%
5%
10%
15%
20%
25%
30%
35%
2000
2001
2002
2003
2004
2005
2006
2007
2008
2009
2010
2011
2012
2013
2014
2015
2016
2017
2018
% o
f toa
l exp
orts
Central & Southern Africa Northern Africa & Middle East South Asia
South East Asia Caribbean Central America
South America Oceania
0%
5%
10%
15%
20%
25%
2000
2001
2002
2003
2004
2005
2006
2007
2008
2009
2010
2011
2012
2013
2014
2015
2016
2017
2018
% o
f tot
al im
port
s
The Tropics Rest of the World World

4 :: PRODUCTION, TRADE, USE AND DISPOSAL OF ICT IN THE TROPICS 55
South-East Asia is the only region in the Tropics that is a net exporter of ICT goods. All other regions in the Tropics import more technology than they produce and export (see Figure 4.5).
Evidence suggests that increasing ICT imports, particularly for lower income countries, will have a positive impact on economic growth (Yoon, 2019). ICT goods are used to further develop ICT access and diffusion and drive innovation (Yoon, 2019). ICT goods imports also improve both the efficiency of ICT accumulation and the efficiency of the domestic production process due to the technological progress embodied in these imported goods (Yoon, 2019). Thus, growing ICT imports are expected to have a positive impact on tropical countries. Growth in South Asia is particularly notable. This is driven by India, the fastest growing technology market on the planet, as its young population becomes increasingly educated and connected.
E-commerce
According to the World Trade Organization (WTO, 2013 p.1), e-commerce is ‘the sale or purchase of goods and services conducted over computer networks by methods specifically designed for the purpose of receiving or placing of orders’. Payment and delivery of goods and services do not have to necessarily occur online.
Measuring the value of electronic commerce remains a challenge. Although more governments are now collecting information on e-commerce, most countries still do not publish official statistics in this area. Those that publish data on the value of e-commerce sometimes do not follow international guidelines, and statistics are often revised. Instead, we can measure the behaviour of people. The Global Findex Database measures financial inclusion and whether people use the internet to buy things (World Bank, 2019).
Figure 4.4 ICT imports as a percentage of total imports across the Tropical regions.
Source: World Bank, 2019
0%
5%
10%
15%
20%
25%
30%
35%
2000
2001
2002
2003
2004
2005
2006
2007
2008
2009
2010
2011
2012
2013
2014
2015
2016
2017
2018
% o
f tot
al im
port
s
Central & Southern Africa Northern Africa & Middle East South AsiaSouth East Asia Caribbean Central America
South America Oceania
PHOTO: BASAL ACTION NETWORK

56 STATE OF THE TROPICS REPORT 2021
Globally, almost one-quarter of all people used the internet to make a purchase in 2019; however, this was concentrated in wealthy countries in North America, Europe and East Asia (World Bank, 2019; see Figure 4.5). Far fewer people use the internet for purchasing throughout the Tropics, with some exceptions such as Saudi Arabia, Malaysia and Singapore (see Figure 4.5). The largest growth markets in the Tropics have been Hong Kong and India (UNESCAP, 2018). Some estimates suggest that the e-commerce market in India is expected to grow from US$33 billion in 2017 to US$200 billion by 2026. There are no data available for tropical island nations of the Pacific but given internet access remains low in that region, it is likely e-commerce is rare outside of urban areas.
Using ICTs and e-commerce can lower transaction costs for small- and medium-sized enterprises and has been shown to support rural development. It is a crucial way for businesses to expand into new and bigger markets. However, given the unequal access to ICTs throughout the Tropics and the rural and urban divide, there is potential that e-commerce may exacerbate existing inequalities. Lack of access to the internet becomes a major barrier, and it is a constraint for both enterprises and consumers (OECD and WTO, 2017).
As well as low internet access, many communities in the Tropics are unbanked and thus do not have access to secure payment methods (such as credit and debit cards) used in the majority of e-commerce transactions. However, there are opportunities to integrate e-commerce with mobile money particularly based on a cash on delivery model. Mobile money is explored further in Case Study: Mobile Money and the Story of M-Pesa.
There is evidence from some tropical countries that the COVID-19 pandemic has accelerated e-commerce development in some developing countries. There have been many small innovations
helping to support tropical communities develop e-commerce further. For example, in Uganda, the Ministry of ICT has made a call to develop digital solutions in the fight against COVID-19 to support health systems and public service delivery, and in Senegal, the Ministry of Trade and small to medium enterprises (SMEs) has partnered with the private sector to facilitate the delivery of essential goods and services through e-commerce (Kituyi, 2020).
Despite these innovations, throughout the Tropics, the digital economy faces numerous obstacles, including digital literacy, e-commerce readiness and cross-border trading challenges (Kituyi, 2020). Globally, the e-commerce market is concentrated with a small number of very large companies; thus, those nations wishing to expand e-commerce activity need to either engage with existing platforms or provide important points of differences.
E-commerce is still an opportunity for communities in the Tropics, despite readiness currently being relatively low and the potential for it to exacerbate existing inequalities.
E-wasteThe rapid expansion of electrical and electronic equipment manufacturing across the world due to industrialisation, economic expansion, technological development and growing wealth has led to complementary growth in electronic waste or e-waste (Rautela et al., 2021). Alongside the growth in new products, the average lifespan of electronics has been decreasing, compounding the growth of e-waste. E-waste refers to any items of electrical and electronic equipment and their parts that have been discarded by the owner as waste without the intention of re-use (STEP, 2014). The way that electronic equipment is produced, consumed and disposed of is currently unsustainable despite considerable efforts to improve recycling processes in recent years (Forti et al., 2020).
Figure 4.5 Percentage of people who used the internet to make a purchase in 2019.
Source: World Bank, 2019
No data<2020-4040-60>60
% of people
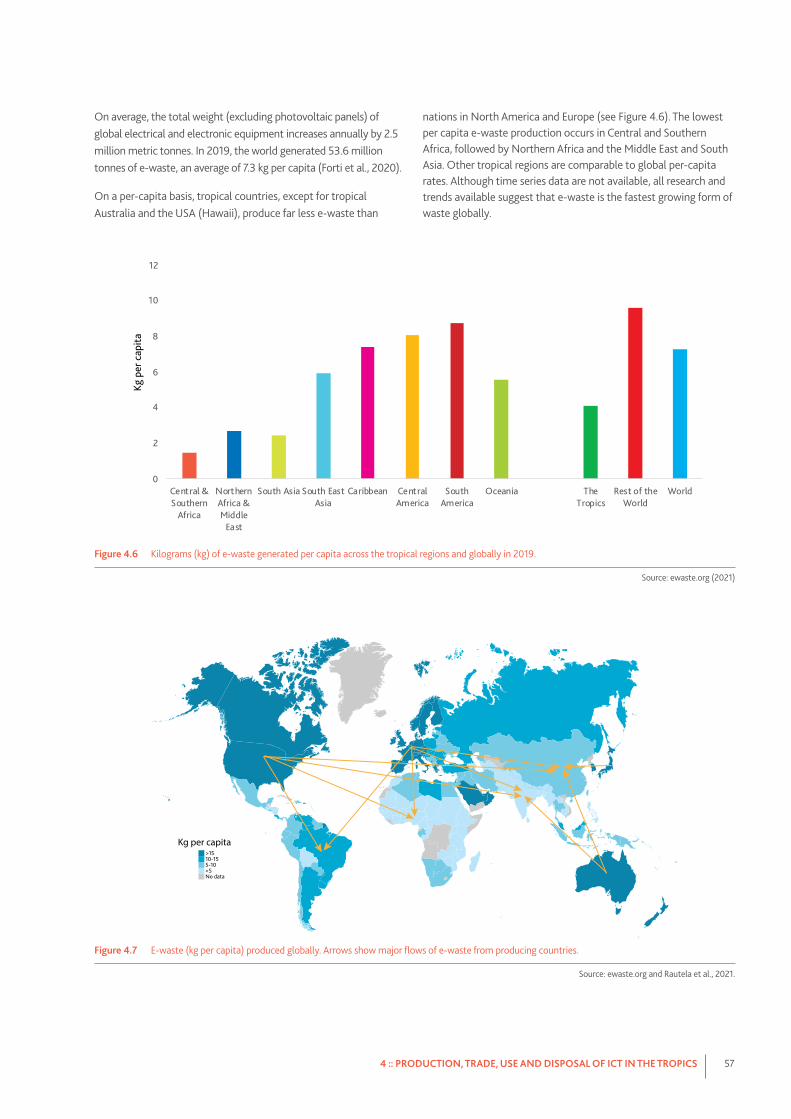
4 :: PRODUCTION, TRADE, USE AND DISPOSAL OF ICT IN THE TROPICS 57
On average, the total weight (excluding photovoltaic panels) of global electrical and electronic equipment increases annually by 2.5 million metric tonnes. In 2019, the world generated 53.6 million tonnes of e-waste, an average of 7.3 kg per capita (Forti et al., 2020).
On a per-capita basis, tropical countries, except for tropical Australia and the USA (Hawaii), produce far less e-waste than
nations in North America and Europe (see Figure 4.6). The lowest per capita e-waste production occurs in Central and Southern Africa, followed by Northern Africa and the Middle East and South Asia. Other tropical regions are comparable to global per-capita rates. Although time series data are not available, all research and trends available suggest that e-waste is the fastest growing form of waste globally.
Figure 4.6 Kilograms (kg) of e-waste generated per capita across the tropical regions and globally in 2019.
Source: ewaste.org (2021)
Figure 4.7 E-waste (kg per capita) produced globally. Arrows show major flows of e-waste from producing countries.
Source: ewaste.org and Rautela et al., 2021.
0
2
4
6
8
10
12
Central &Southern
Africa
NorthernAfrica &Middle
East
South Asia South EastAsia
Caribbean CentralAmerica
SouthAmerica
Oceania TheTropics
Rest of theWorld
World
Kg p
er c
apita
No data<55-1010-15>15
Kg per capita

58 STATE OF THE TROPICS REPORT 2021
From an economic and trade perspective, the extraction, production, trade, use and recycling of ICT products provide many opportunities for countries in the Tropics. There are challenges
associated with safety, exploitation and inequality, but with better governance and empowerment, ICT and its components will be an essential part of the tropical economy going forward.
Currently, an estimated 82.6% of e-waste generated globally is informally recycled and rarely in its country of origin (Forti et al., 2020). According to Rautela et al. (2021), e-waste from North America and Europe is often exported to China, Brazil, Nigeria, Ghana and India (see Figure 4.7). E-waste from Australia generally finds its way to China and India (see Figure 4.7).
In a very real way, countries from outside the Tropics outsource their e-waste footprint and recycling to the Tropics both legally and illegally. The recycling and disposal of e-waste from the non-Tropics thus falls to poorer countries and communities in the Tropics. E-waste is composed of various metals and non-metals in a diverse and unique composition—some of which are very valuable, but often the recycling process is hazardous to human health. Crude practices such as open burning, chemical extraction and handling heavy metals without appropriate personal protection equipment pose enormous threats to human health and the environment (Asibey et al., 2021).
The Basel Convention on the Control of the Transboundary Movements of Hazardous Wastes and their Disposal was adopted on 22 March 1989 by the Conference of Plenipotentiaries in Basel, Switzerland. The overarching objective of the Basal Convention is to protect human health and the environment against the adverse effects of hazardous waste. Although most countries are signatories to the Basel Convention, both legal and illegal trade of e-waste continues, and particular locations in the Tropics are hotspots for informal and unsafe recycling practices.
A region called Guiyu in the tropical Chinese province of Guangdong has been the largest destination for e-waste in the world. The whole region’s economy was based on recycling e-waste, both formal and informal. Once, whole villages would process e-waste by hand, breaking apart and melting e-waste in pots and pans to access valuable minerals, particularly gold and copper (Fu et al., 2018). However, this had huge environmental and health effects. In addition to organic pollutants, crude e-waste processing methods resulted in heavy metals such as lead and chromium polluting grounds and river systems around Guiyu,
exceeding the threshold set to protect human health (Li and Achal, 2020). The land is no longer suitable for growing food, and water is not safe to drink (Li and Achal, 2020).
However, in 2018, China tightened regulations on imported waste and electronic recycling and banned imported waste from a number of countries. There have also been concerted efforts to reduce informal recycling in Guiyu by building industrial parks to house workshops for previously informal waste recyclers to use in safer conditions (Mujezinovic, 2019). This has certainly improved pollution in the area but has also pushed small operators who cannot afford the expensive rent of the workshops out of the city and into more precarious employment or unemployment altogether (Mujezinovic, 2019).
The changes in China, however, have caused flows of e-waste to increase to other major recycling centres in the Tropics. Seelampur in India, Agbogbloshie in Ghana and Alaba in Nigeria are major e-waste destinations, and although they have not been in use as long a Guiyu, they are experiencing similar impacts. The Alaba International Market in Nigeria is the largest market for used and new electronics and electrical equipment in West Africa (Isimekhai et al., 2017). Within the market is an informal e-waste and dismantling site known as ‘Alaba Rago’, where levels of heavy metals in soil samples such as copper, lead, zinc and manganese are constantly higher than recommended to be safe by international soil guidelines and much higher in the dry season when recycling activity peaks (Isimekhai et al., 2017).
Despite the ongoing health and environmental impacts of e-waste, there are also great opportunities for the Tropics. E-waste recycling is essential for the continued sustainability of the world and the Tropics. Electronics include a great deal of valuable and reusable components. Recycling activities, both formal and informal, can be very lucrative for small and family businesses across the Tropics and, coupled with appropriate regulation, safety equipment and safe extraction methods, could be a sustainable industry for countries in the Tropics going forward.
PHOTO: MILTON GRANT UN PHOTO
LOOKING FORWARD

REFERENCES
ASIBEY, M. O., KING, R. S., LYKKE, A. M. & INKOOM, D. K. B. 2021. Urban planning trends on e-waste management in Ghanaian cities. Cities, 108, 102943.
CIRIANI, S. & PERIN, P. 2017. Trends in Global ICT Trade. Communications & Strategies, 107: pp 17-201.
FORTI, V., BALDÉ, C. P., KUEHR, R. & BEL, G. 2020. The global e-waste monitor 2020. Quantities, flows and the circular economy potential. Bonn/Geneva/Rotterdam.
FREDERICK, S. & GEREFFI, G. 2013. Costa Rica in the electronics global value chain—Opportunities for upgrading. North Carolina: CGGC.
FU, J., ZHANG, H., ZHANG, A. & JIANG, G. 2018. E-waste recycling in China: A challenging field. Environmental Science & Technology, 52, 6727–6728.
HENRY-NICKIE, M., FRIMPONG, K. & SUN, H. 2019. Trends in the information technology sector. Washington DC.
ISIMEKHAI, K. A., GARELICK, H., WATT, J. & PURCHASE, D. 2017. Heavy metals distribution and risk assessment in soil from an informal e-waste recycling site in Lagos State, Nigeria. Environmental Science and Pollution Research, 24, 17206–17219.
KITUYI, M. 2020. The intricacies, impact and opportunities of e-commerce for trade and development. Available from: https://unctad.org/news/intricacies-impact-and-opportunities-e-commerce-trade-and-development [Accessed 22 June 2020].
LI, W. & ACHAL, V. 2020. Environmental and health impacts due to e-waste disposal in China—A review. Science of The Total Environment, 737, 139745.
MUJEZINOVIC, D. 2019. Electronic waste in Guiyu: A city under change? Arcadia, Summer.
OECD & WTO 2017. Aid for trade at a glance 2017: Promoting trade, inclusiveness and connectivity for sustainable development. Geneva: Organisation for Economic Cooperation and Development.
RAUTELA, R., ARYA, S., VISHWAKARMA, S., LEE, J., KIM, K.-H. & KUMAR, S. 2021. E-waste management and its effects on the environment and human health. Science of The Total Environment, 773, 145623.
SCHATAN, C. & ENRÍQUEZ, L. 2016. Mexico: Industrial policies and the production of information and communication technology goods and services. CEPAL Review 117 pp 147-163.
STEP 2014. One global definition of e-waste—Solving the e-waste problem (step). White Paper. Tokyo: STEP.
UNESCAP 2018. Embracing the e-commerce revolution in Asia and the Pacific. Bangkok, Thailand: UNESCAP.
VU, K. M. 2017. ICT diffusion and production in ASEAN countries: Patterns, performance, and policy directions. Telecommunications Policy, 41, 962–977.
WORLD BANK 2019. Global Findex Database. Washington DC.: World Bank.
WORLD BANK 2020a. World development indicators.
WORLD BANK 2020b. World development report 2020—Trading for development in the age of global value chains. Washington DC.
WTO 2013. E-commerce in developing countries. Opportunities for small and medium enterprises. Geneva, Switzerland:WTO.
YOON, S.-C. 2019. The Impact of ICT Goods Imports on Economic Growth: Evidence from Asia-Pacific Countries. Journal of Korea Trade, 23, 1–12.
4 :: PRODUCTION, TRADE, USE AND DISPOSAL OF ICT IN THE TROPICS 59

4COBALT MINING IN THE DEMOCRATIC REPUBLIC OF CONGO
60 STATE OF THE TROPICS REPORT 2021

When we discuss the impact of the digital revolution in the Tropics, although it has had enormous benefits in terms of education, health and financial inclusion, there is also a dark side, found in the mineral foundations of technology.
The enormous and growing demand for digital devices and products globally has driven huge growth in mining for critical minerals used in components. Cobalt is a particularly critical component in rechargeable lithium-ion batteries, used in mobile phones, computers, electric vehicles, wind turbines, lighting, solar panels and even fuel cells and nuclear reactors (Bazilian, 2018). Cobalt is used for batteries due to its extreme resilience and heat resistant qualities, extending the range and life of the battery system (Zeuner, 2018). Lithium-ion batteries have the potential to transform energy systems everywhere, leading to a more sustainable future for the world through lower carbon emissions. However, cobalt mining, alongside mining for other rare earth minerals, is having far-reaching impacts, particularly in the Tropics where the vast majority of mining takes place.
Mining for cobalt occurs across the world, including in Australia, Brazil, Canada, the Philippines and China. However, the majority (>55%) of cobalt is mined in the DRC (McCarthy, 2019). Due to demand, global cobalt production increased from 65,000 tonnes in 2010 to 90,000 tonnes in 2015. Some estimates suggest that demand will continue to grow and exceed 250,000 tonnes before 2030 (Sovacool, 2019).
In the DRC, cobalt is mined alongside copper in Lualaba and Haut Katanga provinces, a region that contains some of the richest cobalt deposits in the world (Amnesty, 2016; Banza Lubaba Nkulu et al., 2018). This region is undergoing an unprecedented mining boom. There is no doubt there are positive outcomes of the cobalt mining boom. Cobalt mining has been shown to create jobs and alleviate poverty; encourage investment in infrastructure such as schools, roads, housing and other services; provide some income and opportunities for marginalised refugees and migrants; drive ancillary economic activity such as shops selling food and water;
provide state revenue; and create a strong sense of social and cultural identity (Sovacool, 2019).
However, although these economic benefits of cobalt mining are real, they can carry a high cost. There are huge risks involved, particularly for artisanal cobalt miners. An estimated 20% of all cobalt exported from the DRC comes from artisanal miners. (Amnesty, 2016). In this region, cobalt is abundant in surface deposits, often concentrated in thin and friable layers (Banza Lubaba Nkulu et al., 2018). Thus, thousands of diggers work in often precarious and hazardous conditions mining these surface deposits in an unregulated industry with few protections. Political instability, coupled with armed conflict and some of the highest corruption rates in the world, has driven the spread of informal mining activity in the DRC (Krummel and Siegfried, 2021).
Risks faced by artisanal mining and miners include accidents and occupational hazards, environmental pollution and degraded community health, exploitation of miners (particularly children),
unfair market prices, and the erosion of democracy via corruption and conflict (Sovacool, 2019). Artisanal mines in the DRC are often poorly constructed and can occur in heavily populated areas, with miners tunnelling under homes and community buildings (Sovacool, 2019). Accidents caused by mine tunnel collapses are common, resulting in injury and death (Amnesty, 2016).
There are other serious environmental and health concerns as well. All forms of cobalt mining, from large scale to artisanal, have a deleterious impact on both environmental and human health. Cobalt mining pollutes rivers, soil and crops, and dust is spread through the air (Sovacool, 2019). In tropical Australia, the second-largest producer of cobalt globally, there are fears heavy metals including cobalt have polluted otherwise pristine river systems in remote areas (Standen, 2019), and in Cuba, cobalt levels in soils in urban areas near mines exceed safe levels by up to three times (Diaz Rizo et al., 2011). Cobalt has been shown to act as a biological inhibitor in soil and thus have negative impacts on vegetation and
CS4 :: COBALT MINING IN THE DEMOCRATIC REPUBLIC OF CONGO 61
PHOTO: FAIRPHONE

62 STATE OF THE TROPICS REPORT 2021
crop growth (Zaborowska et al., 2016). According to the World Bank, cobalt mining, particularly artisanal mining, through the dumping of waste, tailings and effluences, contributes to river damage in alluvial areas, heavy metal pollution, land degradation and soil erosion, and the loss of biodiversity (World Bank, 2007).
However, the most significant negative impacts of cobalt mining, particularly in the DRC, are on human health and wellbeing. Research has found that both miners and nearby residents (even those not associated with mining) are heavily contaminated with cobalt (Banza Lubaba Nkulu et al., 2018). It is inhaled in dust and ingested through contaminated water and food (Sovacool, 2019). High doses and long-term exposure may affect the heart, lungs, blood and thyroid (Paustenbach et al., 2013). In Zambia, silicosis and tuberculosis were high among miners working in copper/cobalt mines (Mwaanga et al., 2019), and there is evidence of exposure-related oxidative DNA damage in highly exposed children in the DRC, which will likely lead to an increased risk of cancer later in life (Banza Lubaba Nkulu et al., 2018). Also, although preliminary, there is evidence of increased rates of birth defects associated with paternal mining exposure in the DRC copper belt (Van Brusselen et al., 2020).
The industry is also responsible for the exploitation of some of the most vulnerable people in the Tropics. The incredible rise in demand for cobalt from large international companies has driven efforts to formalise the artisanal mining sector to guarantee a steady supply of cobalt and assuage international concern about artisanal mining, particularly child labour (Calvão et al., 2021). Although sound in theory, it has led to large-scale mining corporations integrating artisanal miners into an essentially wage-less workforce paid by production output without a base salary or other social protections (Calvão et al., 2021). There are also few incentives for workers to become part of a cooperative described above and mine legally. There are costs and tax disadvantages for the miners of being a member and holding an official mining card (Krummel and Siegfried, 2021). Additionally, the government has been unable to monitor or enforce this formalisation process (Krummel and Siegfried, 2021).
One of the most controversial aspects of artisanal mining for cobalt in the DRC is the use of child labour. Although children are rarely used in the mines, they are active in collecting minerals from tailings or working in streams and lakes to wash and sort the stones (Amnesty International, 2016). Any form of child labour ‘which by its nature or the circumstances in which it is carried out is likely the harm the health safety or morals
of children’ is considered by the International Labour Organisation (1999 p.2) as the ‘worst forms of child labour’.
A common task carried out by children around the mines requires them to carry heavy sacks of mineral ore that can weigh between 20 and 40 kg, resulting in injuries and long-term damage such as joint and bone deformities (Amnesty International, 2016). Those that worked in the open, often worked in high temperatures or in the rain with little or no protective equipment such as masks or gloves (Amnesty International, 2016). Thus, they are directly exposed to cobalt dust and other pollutants, causing ongoing health concerns as mentioned above. Many children worked 12–14 hours per day, and even those who went to school, often worked after school and on weekends (Banza Lubaba Nkulu et al., 2018).
Cobalt mining in the Congo is precarious. The demand for cobalt continues to rise, and as electric vehicles become more ubiquitous, it will continue for some time. This remains a significant opportunity for the DRC. Artisanal mining operations are vital to the livelihoods of hundreds of thousands of families. Still, they are essentially dangerous holes in the ground, often operated without tools and protection, putting children at risk (Sovacool, 2019). The vast wealth created by the digital revolution and manufacture of lithium-ion batteries does not flow down to those who extract the core mineral components.
The cobalt mining industry remains a huge opportunity for tropical countries, particularly the DRC, to profit from the digital and energy revolution. Many companies are making a great deal of money from Congolese cobalt. However, the booming international market does not always benefit those who provide the source material.
PHOTO: FAIRPHONE

CS4 :: COBALT MINING IN THE DEMOCRATIC REPUBLIC OF CONGO 63
REFERENCES
AMNESTY INTERNATIONAL 2016. ‘This is what we die for’: Human rights abuses in the Democratic Republic of the Congo power the global trade in cobalt, Amnesty International.
BANZA LUBABA NKULU, C., CASAS, L., HAUFROID, V., DE PUTTER, T., SAENEN, N. D., KAYEMBE-KITENGE, T., MUSA OBADIA, P., KYANIKA WA MUKOMA, D., LUNDA ILUNGA, J.-M., NAWROT, T. S., LUBOYA NUMBI, O., SMOLDERS, E. & NEMERY, B. 2018. Sustainability of artisanal mining of cobalt in DR Congo. Nature Sustainability, 1, 495–504.
BAZILIAN, M. D. 2018. The mineral foundation of the energy transition. The Extractive Industries and Society, 5, 93–97.
CALVÃO, F., MCDONALD, C. E. A. & BOLAY, M. 2021. Cobalt mining and the corporate outsourcing of responsibility in the Democratic Republic of Congo. The Extractive Industries and Society. In Press.
DIAZ RIZO, O., COTO HERNÁNDEZ, I., LÓPEZ, J., DÍAZ ARADO, O., PINO, N. & RODRIGUEZ, K. 2011. Chromium, cobalt and nickel contents in urban soils of Moa, Northeastern Cuba. Bulletin of Environmental Contamination and Toxicology, 86, 189–193.
INTERNATIONAL LABOUR ORGANISATION 1999. World forms of child labour convention no. 182. Geneva: International Labour Organisation.
KRUMMEL, D. & SIEGFRIED, P. 2021. The dark side of Samsung’s value chain: The human costs of cobalt mining—Blood, sweat and cobalt. Journal of Geoscience and Environmental Protection, 9, 182–283.
MCCARTHY, A. 2019. About cobalt—production and supply [Online]. Guidford, UK: Cobalt Institute. Available: https://www.cobaltinstitute.org/production-and-supply.html#:~:text=Cobalt%20is%20only%20extracted%20alone,production%20comes%20from%20nickel%20ores. [Accessed 15 March 2021].
MWAANGA, P., SILONDWA, M., KASALI, G. & BANDA, P. M. 2019. Preliminary review of mine air pollution in Zambia. Heliyon, 5, e02485.
PAUSTENBACH, D. J., TVERMOES, B. E., UNICE, K. M., FINLEY, B. L. & KERGER, B. D. 2013. A review of the health hazards posed by cobalt. Critical Reviews in Toxicology, 43, 316–362.
SOVACOOL, B. K. 2019. The precarious political economy of cobalt: Balancing prosperity, poverty, and brutality in artisanal and industrial mining in the Democratic Republic of the Congo. The Extractive Industries and Society, 6, 915–939.
STANDEN, S. 2019. Whim Creek copper mine faces questions of possible Pilbara River pollution. ABC News [Online]. Available: https://www.abc.net.au/news/2019-08-18/balla-balla-creek-poisoned-by-upstream-copper-mine/11379570 [Accessed 17 March 2021].
VAN BRUSSELEN, D., KAYEMBE-KITENGE, T., MBUYI-MUSANZAYI, S., LUBALA KASOLE, T., KABAMBA NGOMBE, L., MUSA OBADIA, P., KYANIKA WA MUKOMA, D., VAN HERCK, K., AVONTS, D., DEVRIENDT, K., SMOLDERS, E., NKULU, C. B. L. & NEMERY, B. 2020. Metal mining and birth defects: A case-control study in Lubumbashi, Democratic Republic of the Congo. The Lancet Planetary Health, 4, e158–e167.
WORLD BANK 2007. Artisanal mining in the DRC: Key issues, challenges, and opportunities. Washington DC: The World Bank.
ZABOROWSKA, M., KUCHARSKI, J. & WYSZKOWSKA, J. 2016. Biological activity of soil contaminated with cobalt, tin, and molybdenum. Environmental Monitoring and Assessment, 188 (7): pp.1-10.
ZEUNER, B. 2018. An obsolescing bargain in a rentier state: Multinationals, artisanal miners, and cobalt in the Democratic Republic of Congo. Frontiers in Energy Research, 6, pp 1-6.

64 STATE OF THE TROPICS REPORT 2021

APPENDIX A
APPENDIX A 65

66 STATE OF THE TROPICS REPORT 2021
REGION/Nation Population 2020 (millions) % of Population in the Tropics % of Regional population in the Tropics
CENTRAL AND SOUTHERN AFRICA
Angola 32.87 100.0% 3.6%
Benin 12.12 100.0% 1.3%
Botswana 2.35 51.5% 0.3%
Burkina Faso 20.90 100.0% 2.3%
Burundi 11.89 100.0% 1.3%
Cameroon 26.55 100.0% 2.9%
Cape Verde 0.56 100.0% 0.1%
Central African Republic 4.83 100.0% 0.5%
Comoros 0.87 100.0% 0.1%
Democratic Republic of the Congo 89.56 100.0% 9.8%
Congo 5.52 100.0% 0.6%
Cote d’Ivoire 26.38 100.0% 2.9%
Equatorial Guinea 1.40 100.0% 0.2%
Ethiopia 114.96 100.0% 12.5%
Gabon 2.23 100.0% 0.2%
Gambia 2.42 100.0% 0.3%
Ghana 31.07 100.0% 3.4%
Guinea 13.13 100.0% 1.4%
Guinea-Bissau 1.97 100.0% 0.2%
Kenya 53.77 100.0% 5.9%
Liberia 5.06 100.0% 0.6%
Madagascar 27.69 91.8% 3.0%
Malawi 19.13 100.0% 2.1%
Mauritius 1.27 100.0% 0.1%
Mozambique 31.26 80.3% 3.4%
Namibia 2.54 80.3% 0.3%
Nigeria 206.14 100.0% 22.5%
Rwanda 12.95 100.0% 1.4%
Sao Tome and Principe 0.22 100.0% 0.0%
Seychelles 0.10 100.0% 0.0%
Sierra Leone 7.98 100.0% 0.9%
Tanzania 59.73 100.0% 6.5%
Togo 8.28 100.0% 0.9%
Uganda 45.74 100.0% 5.0%
Zambia 18.38 100.0% 2.0%
Zimbabwe 14.86 100.0% 1.6%
NORTHERN AFRICAL AND MIDDLE EAST
Djibouti 0.99 100.0% 0.5%
Chad 16.43 100.0% 8.1%
Eritrea 3.55 100.0% 1.8%
Mali 20.25 99.9% 10.0%
Mauritania 4.65 99.3% 2.3%
Niger 24.21 100.0% 12.0%
Saudi Arabia* 14.28 41.3% 7.1%
Senegal 16.74 100.0% 8.3%
Somalia 15.89 100.0% 7.9%

APPENDIX A 67
REGION/Nation Population 2020 (millions) % of Population in the Tropics % of Regional population in the Tropics
South Sudan 11.19 100.0% 5.5%
Sudan 43.85 100.0% 21.7%
Yemen 29.83 100.0% 14.8%
SOUTH ASIA
Bangladesh* 60.18 36.6% 6.9%
India* 792.00 54.0% 90.6%
Maldives 0.54 100.0% 0.1%
Sri Lanka 21.41 100.0% 2.4%
SOUTH EAST ASIA
Brunei Darussalam 0.44 100.0% 0.1%
Cambodia 16.72 100.0% 2.0%
China* 169.52 7.9% 20.0%
China, Hong Kong SAR 7.50 100.0% 0.9%
China, Macao SAR 0.65 100.0% 0.1%
Indonesia 273.52 100.0% 32.3%
Lao People’s Democratic Republic 7.28 100.0% 0.9%
Malaysia 32.37 100.0% 3.8%
Myanmar 54.41 90.8% 6.4%
Philippines 109.58 100.0% 12.9%
Singapore 5.85 100.0% 0.7%
Thailand 69.80 100.0% 8.2%
Timor-Leste 1.32 100.0% 0.2%
Vietnam 97.34 100.0% 11.5%
CARRIBBEAN
Antigua and Barbuda 0.10 100.0% 0.2%
Barbados 0.29 100.0% 0.7%
Cuba 11.33 100.0% 27.2%
Dominica 0.07 100.0% 0.2%
Dominican Republic 10.85 100.0% 26.1%
Haiti 11.40 100.0% 27.4%
Jamaica 2.96 100.0% 7.1%
Puerto Rico 2.86 100.0% 6.9%
Saint Kitts and Nevis 0.05 100.0% 0.1%
Saint Lucia 0.18 100.0% 0.4%
Saint Vincent and the Grenadines 0.11 100.0% 0.3%
Trinidad and Tobago 1.40 100.0% 3.4%
CENTRAL AMERICA
Belize 0.40 100.0% 0.3%
Costa Rica 5.09 100.0% 3.4%
El Salvador 6.49 100.0% 4.3%
Guatemala 17.92 100.0% 11.9%
Honduras 9.90 100.0% 6.6%
Mexico* 100.39 77.7% 66.4%
Nicaragua 6.62 100.0% 4.4%
Panama 4.31 100.0% 2.9%

68 STATE OF THE TROPICS REPORT 2021
REGION/Nation Population 2020 (millions) % of Population in the Tropics % of Regional population in the Tropics
SOUTH AMERICA
Bolivia 11.67 100.0% 3.6%
Brazil* 181.95 82.4% 56.0%
Colombia 50.88 100.0% 15.7%
Ecuador 17.64 100.0% 5.4%
Guyana 0.79 100.0% 0.2%
Peru 32.97 100.0% 10.1%
Suriname 0.59 100.0% 0.2%
Venezuela 28.44 100.0% 8.8%
OCEANIA
Australia* 1.44 5.7% 9.7%
Fiji 0.90 100.0% 6.0%
French Polynesia 0.28 100.0% 1.9%
Kiribati 0.12 100.0% 0.8%
Marshall Islands 0.06 100.0% 0.4%
Micronesia (Fed. States of) 0.12 100.0% 0.8%
New Caledonia 0.29 100.0% 1.9%
Palau 0.02 100.0% 0.1%
Papua New Guinea 8.95 100.0% 59.9%
Samoa 0.20 100.0% 1.3%
Solomon Islands 0.69 100.0% 4.6%
Tonga 0.11 100.0% 0.7%
Tuvalu 0.01 100.0% 0.1%
United States of America* 1.45 0.4% 9.7%
Vanuatu 0.31 100.0% 2.1%
*Tropical population only. These nations have large populations and area and straddle the Tropics. Sub-national calculations were used and these nations divided into tropical and non-tropical regions for the analyses. See Appendix C.

PHOTO: MARK ZIEMBICKI

70 STATE OF THE TROPICS REPORT 2021

APPENDIX B
APPENDIX B 71
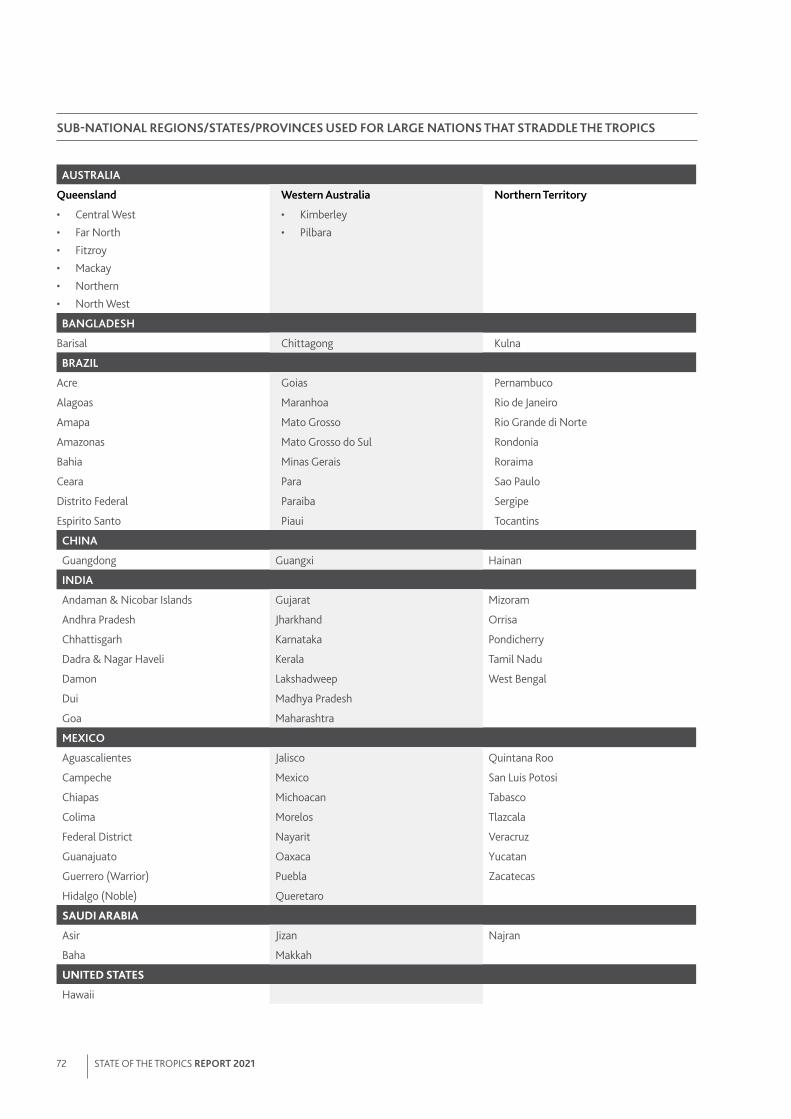
72 STATE OF THE TROPICS REPORT 2021
SUB-NATIONAL REGIONS/STATES/PROVINCES USED FOR LARGE NATIONS THAT STRADDLE THE TROPICS
AUSTRALIA
Queensland
• Central West• Far North• Fitzroy• Mackay• Northern• North West
Western Australia
• Kimberley• Pilbara
Northern Territory
BANGLADESH
Barisal Chittagong Kulna
BRAZIL
Acre Goias Pernambuco
Alagoas Maranhoa Rio de Janeiro
Amapa Mato Grosso Rio Grande di Norte
Amazonas Mato Grosso do Sul Rondonia
Bahia Minas Gerais Roraima
Ceara Para Sao Paulo
Distrito Federal Paraiba Sergipe
Espirito Santo Piaui Tocantins
CHINA
Guangdong Guangxi Hainan
INDIA
Andaman & Nicobar Islands Gujarat Mizoram
Andhra Pradesh Jharkhand Orrisa
Chhattisgarh Karnataka Pondicherry
Dadra & Nagar Haveli Kerala Tamil Nadu
Damon Lakshadweep West Bengal
Dui Madhya Pradesh
Goa Maharashtra
MEXICO
Aguascalientes Jalisco Quintana Roo
Campeche Mexico San Luis Potosi
Chiapas Michoacan Tabasco
Colima Morelos Tlazcala
Federal District Nayarit Veracruz
Guanajuato Oaxaca Yucatan
Guerrero (Warrior) Puebla Zacatecas
Hidalgo (Noble) Queretaro
SAUDI ARABIA
Asir Jizan Najran
Baha Makkah
UNITED STATES
Hawaii


stateofthetropics.org