Embed Size (px)
Citation preview
U.S. Department of the InteriorU.S. Geological Survey
Scientific Investigations Report 2013–5136
Prepared in cooperation with Douglas County and the Carson Water Subconservancy District
The Distribution and Modeling of Nitrate Transport in the Carson Valley Alluvial Aquifer, Douglas County, Nevada

The Distribution and Modeling of Nitrate Transport in the Carson Valley Alluvial Aquifer, Douglas County, Nevada
By Ramon C. Naranjo, Toby L. Welborn, and Michael R. Rosen
Prepared in cooperation with Douglas County and the Carson Water Subconservancy District
Scientific Investigations Report 2013–5136
U.S. Department of the InteriorU.S. Geological Survey
U.S. Department of the InteriorSally Jewell, Secretary
U.S. Geological SurveySuzette M. Kimball, Acting Director
U.S. Geological Survey, Reston, Virginia: 2013
For more information on the USGS—the Federal source for science about the Earth, its natural and living resources, natural hazards, and the environment, visit http://www.usgs.gov or call 1–888–ASK–USGS.
For an overview of USGS information products, including maps, imagery, and publications, visit http://www.usgs.gov/pubprod.
To order this and other USGS information products, visit http://store.usgs.gov.
Any use of trade, firm, or product names is for descriptive purposes only and does not imply endorsement by the U.S. Government.
Although this information product, for the most part, is in the public domain, it also may contain copyrighted materials as noted in the text. Permission to reproduce copyrighted items must be secured from the copyright owner.
Suggested citation:Naranjo, R.C., Welborn, T.L., and Rosen, M.R ., 2013, The distribution and modeling of nitrate transport in the Carson Valley alluvial aquifer, Douglas County, Nevada: U.S. Geological Survey Scientific Investigations Report 2013–5136, 51 p.
iii
Contents
Abstract .......................................................................................................................................................... 1Introduction ................................................................................................................................................... 1
Purpose and Scope ............................................................................................................................. 3Description of Study Area .................................................................................................................. 3
Hydrogeology ................................................................................................................................................ 4Data Collection and Analysis ..................................................................................................................... 4
Groundwater Sampling ...................................................................................................................... 4Sample Analysis .................................................................................................................................. 4Quality Assurance ............................................................................................................................... 7Land-Use Analysis .............................................................................................................................. 7Nitrate-N Observations in Groundwater ......................................................................................... 8Nitrate-N Trends in Groundwater .................................................................................................... 8Nitrate-N Sources in Groundwater ............................................................................................... 13Apparent Groundwater Age ............................................................................................................ 14
Nitrogen-N Contribution from Septic Systems ..................................................................................... 15Numerical Transport Models ................................................................................................................... 17Groundwater Flow and Transport-Model Design ................................................................................. 17
Nitrate-N Transport in the Unsaturated Zone .............................................................................. 17Nitrate-N Transport in the Saturated Zone ................................................................................... 19
Domestic wells and septic systems ...................................................................................... 19Transport Parameters and Assumptions ............................................................................. 22
Numerical Transport-Model Results and Discussion .......................................................................... 22Groundwater-Flow and Transport Models .................................................................................... 22
Groundwater Flow ................................................................................................................... 22Nitrate-N Transport ................................................................................................................. 22Hypothetical Scenarios ........................................................................................................... 27Sensitivity Analysis .................................................................................................................. 31
Limitations of the Analysis ............................................................................................................... 32Summary and Conclusions ....................................................................................................................... 34References Cited ........................................................................................................................................ 35
Figures 1. Map showing location of major drainages, major roads, and areas with septic
systems and monitoring wells sampled in Carson Valley, Douglas County, Nevada, 2008 ............................................................................................................................... 2
2. Graph showing population and total number of septic systems for Douglas County, Nevada, 1860–2008 ..................................................................................................................... 3
3. Geologic cross-section of Carson Valley, Nevada, shown from transect A in figure 1 ....... 5 4. Map showing spatial distribution of land use and sampled wells, Douglas county,
Nevada, 2008 ............................................................................................................................... 6
iv
5. Map showing nitrate-nitrogen concentrations in milligrams per liter in sampled wells and parcels with septic systems in Carson Valley, Douglas County, Nevada, 2008–09 ......................................................................................................................... 9
6. Graph showing geochemical results for sampled wells for the 2008–09 sampling events. Nitrate compared to A, dissolved oxygen; B, chloride; C, screen depth; and D, specific conductance .................................................................................................. 10
7. Graph showing range of nitrate as nitrogen concentrations relative to land-use and percentage of land use: A, single-family residential; B, residential multifamily; C, rural; and D, vacant land ..................................................................................................... 11
8. Graph showing cumulative frequency of observed nitrate as nitrogen concentrations for Carson Valley, Douglas County, Nevada 1980–2010 ...................................................... 13
9. Graph showing geochemical results for wells sampled for A, nitrogen and oxygen isotopes of nitrate; B, tritium; and C, chlorofluorocarbons; and D, mean nitrate concentrations associated with parcel size ........................................................................ 14
10. Schematic diagram representing A, sources of nitrate as nitrogen (N) from septic systems as a result of oxidation of ammonia or urea leaching to groundwater and removal from domestic pumping; B, modeling approach for simulating nitrate-N transport in the unsaturated and saturated zones; and C, the stoichiometry for the denitrification process ...................................................................................................... 15
11. Graph showing septic-system densities required to maintain nitrate as nitrogen concentrations less than 10 milligrams per liter, as a function of effluent concen- tration, or Np, in milligrams per liter, and recharge rate, in inches per year ................. 16
12. Map showing the boundaries of the Carson Valley regional groundwater-flow model from Yager and others (2012) and the transport models for the Johnson Lane and Ruhenstroth areas in Carson Valley, Nevada and California .......... 18
13. Graph showing VS2DT solute-breakthrough curves for different depths below land surface and mean arrival-time regression equation used for interpolation of results to Johnson Lane and Ruhenstroth transport models ............................................ 19
14. Diagrams showing the spatial distribution of input data for Johnson Lane hypothetical models: A, Log of hydraulic conductivity; B, Net recharge; and C, Boundary conditions and cells with wells and septic tanks ......................................... 20
15. Diagrams showing the spatial distribution of input data for Ruhenstroth hypothetical models: A, Log of hydraulic conductivity; B, Net recharge; and C, Boundary conditions and cells with wells and septic tanks ................................................................ 21
16. Map showing hypothetical scenario model 2005 simulated water table compared to Carson Valley regional groundwater model 2005 simulated water table for A, Johnson Lane and B, Ruhenstroth in Carson Valley, Douglas County, Nevada ........ 23
17. Graph showing A, The cumulative number of septic tanks by year; and B, diagrams showing the spatial distribution of arrival times for Johnson Lane and C, Ruhenstroth transport models ........................................................................................... 24
18. Graphs and map showing observed 2008–09 compared to simulated 2009 nitrate as nitrogen (N) concentrations for the Johnson Lane model 2009 time-step: A, Observed compared to simulated; B, Observed compared to simulated at observation cells and all cells; and C, Map depicting spatial distribution of nitrate-N 2009 time step with observed nitrate-N concentrations for 2008–09 ............. 25
v
19. Graphs and map showing observed 2008–09 compared to simulated nitrate as nitrogen (N) concentrations for the Ruhenstroth model 2009 time-step: A, Observed compared to simulated; B, Observed compared to simulated at observation cells and all cells; and C, Map depicting spatial distribuiton of nitrate-N 2009 time step with observed Nitrate-N concentrations for 2008–09 ............. 26
20. Map showing distribution of simulated nitrate as nitrogen concentrations within the Johnson Lane and Ruhenstroth transport models from 1970–2059 for hypothetical scenarios of discontinued use of septic systems in 2030 and discontinued use of septic systems and domestic-well pumping in 2030 ........................................................... 28
21. Diagrams showing distribution of simulated nitrate as nitrogen concentrations at Johnson Lane: A, 2009; B, 2059; C, 2059 discontinued use of septic systems in 2030; and D, 2059 discontinued use of septic systems and domestic-well pumping in 2030 ......................................................................................................................................... 29
22. Diagram showing distribution of simulated nitrate as nitrogen concentrations at Ruhenstroth: A, 2009; B, 2059; C, 2059 discontinued use of septic systems 2030; and D, 2059 discontinued use of septic systems and domestic-well pumping 2030 ..... 30
23. Graphs showing the cumulative distribution of simulated nitrate as nitrogen concentrations at 2009, 2059, and H1 and H2 scenarios with the removal of septic systems and domestic pumping at A, Johnson and B, Ruhenstroth areas .................... 31
24. Graphs showing summary of concentrations at observations given incremental changes to transport parameters located at A, Johnson Lane, and B, Ruhenstroth model areas, where prediction corresponds to base case simulation ........................... 32
25. Graph showing nitrate as nitrogen concentration frequency plot for wells sampled in Spanish Springs, Washoe County, Nevada, 2008–09 .......................................................... 33
Tables 1. Quality-assurance data collected for this study ........................................................................ 7 2. Correlation coefficients for select land-use and water-quality parameters ......................... 8 3. Kendall tau results for nitrate-nitrogen and total dissolved solids ....................................... 12 4. Simulated maximum nitrate as nitrogen concentration, total area exceeding the
maximum contaminant level of 10 milligrams per liter in 2009, 2059, and for the hypothetical scenarios where discontinued use of septic systems, and discontinued use of septic systems and domestic-well pumping .................................... 27
Appendix tables 1. Field, nutrient, chloride, and bromide chemical data; and land use and
number of septic tanks within 500 meters of each well ..................................................... 38 2. Tritium, chlorofluorocarbon, and dissolved gas (nitrogen, argon, oxygen,
carbon dioxide, and methane) data for selected wells . ..................................................... 48 3. Nitrogen and oxygen isotope data for selected wells . ............................................................ 50 4. Field and lab chemical data for nitrogen, bromide, and chloride for
selected wells ........................................................................................................................... 51
vi
Conversion Factors and Datums
Inch/Pound to SI
Multiply By To obtainLength
foot (ft) 0.3048 meter (m)inch (in) 25.4 millimeter (mm)mile (mi) 1.609 kilometer (km)
Areaacre 0.4047 hectare (ha)
Flow rateacre-foot per year (acre-ft/yr) 1,233 cubic meter per year (m3/yr)foot per day (ft/d) 0.3048 meter per day (m/d)
Transmissivityfoot squared per day (ft2/d) 0.09290 meter squared per day (m2/d)
Temperature in degrees Celsius (°C) may be converted to degrees Fahrenheit (°F) as follows:
°F=(1.8×°C)+32
Vertical coordinate information is referenced to the National Geodetic Vertical Datum of 1929 (NGVD 29).
Horizontal coordinate information is referenced to the North American Datum of 1983 (NAD 83).
Altitude, as used in this report, refers to distance above the vertical datum.
Specific conductance is given in microsiemens per centimeter at 25 degrees Celsius (μS/cm at 25 °C).
Concentrations of chemical constituents in water are given either in milligrams per liter (mg/L) or micrograms per liter (μg/L).
Acronyms and Additional AbbreviationsCFC chlorofluorocarbonsET evapotranspiration ISE ion specific electrode MCL maximum contaminant levelNWQL National Water Quality LaboratoryUSEPA U.S. Environmental Protection AgencyUSGS U.S. Geological Survey
vii
AcknowledgmentsFunding for this project was provided through a cooperative agreement between Douglas
County, the Carson Water Subconservancy District, and the U.S. Geological Survey. Appreciation is extended to all homeowners, businesses, and public-water suppliers who participated in this study.
Many thanks also go to Doug Maurer, Keith Halford, Karen Thomas, Dick Yager of the USGS, and former student Joel Jacobson for their help in the field and laboratory, and for reviews of draft manuscripts. The authors also wish to thank Richard Winston and Richard Niswonger (from USGS) for modeling support.
The Distribution and Modeling of Nitrate Transport in the Carson Valley Alluvial Aquifer, Douglas County, Nevada
By Ramon C. Naranjo, Toby L. Welborn, and Michael R. Rosen
used to simulate future transport as a result of removal of septic systems (source of nitrate-N contamination) and the termination of domestic pumping of groundwater. The models showed the largest decrease in nitrate-N concentrations when septic systems were removed and wells continued to pump. Nitrate-N concentrations probably will continue to increase in areas that are dependent on septic systems for waste disposal either under current land-use conditions in the valley or with continued growth and change in land use in the valley.
IntroductionResidents of Carson Valley in Douglas County, Nevada
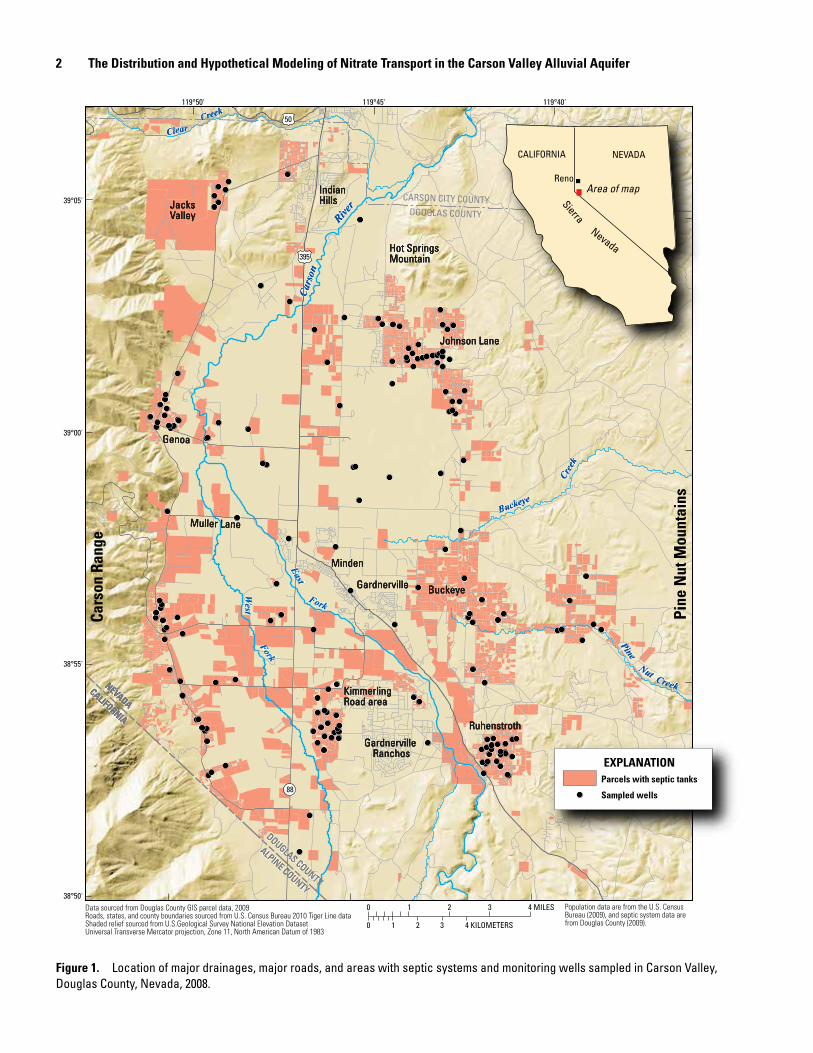
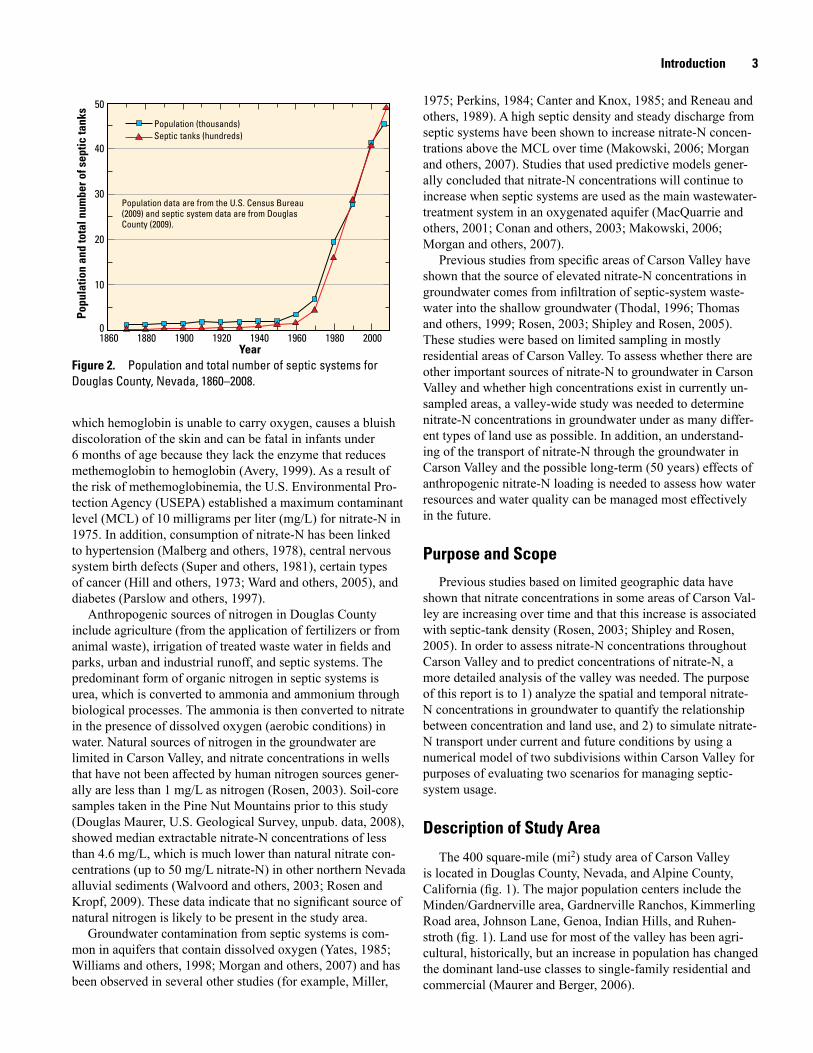
(fig. 1), rely on groundwater from an alluvial aquifer for domestic use and agricultural irrigation. Currently, there are more than 5,000 wells in the valley (Douglas County, 2006), most of which are private domestic wells screened within 250 feet (ft) of the land surface (State of Nevada, 2009). Since the 1970s, the valley has experienced a rapid increase in development and population, which has coincided with deg-radation of groundwater quality in some areas (Rosen, 2003; Shipley and Rosen, 2005). During the same period, septic systems have been installed at a rate of about 1,000 per decade in Douglas County (fig. 2).
In general, the high density of septic systems in a given area is the most important factor influencing groundwater con-tamination by septic systems (Yates, 1985). Elevated ground-water concentrations of nitrate-nitrogen (nitrate-N), chloride, and total dissolved solids are associated with septic systems (Canter and Knox, 1985; Williams and others, 1998; Rosen, 2003; Makowski, 2006; Morgan and others, 2007). Recent studies have shown elevated nitrate-N concentrations posi-tively correlated to single-family land use in the Carson Valley and septic-system density (Shipley and Rosen, 2005). In addi-tion, wells monitored by the U.S. Geological Survey (USGS) since the mid-1980s, have shown an increase in nitrate-N and total dissolved solids concentrations in several areas of the valley (Rosen, 2003).
Health risks associated with consumption of water hav-ing elevated nitrate-N concentrations have been documented since the 1940s. The research by Comly (1945) indicated a consistent pattern of high-nitrate-N drinking water in infantile methemoglobinemia cases. Methemoglobinemia, a disease in
AbstractResidents of Carson Valley in Douglas County, Nevada,
rely on groundwater from an alluvial aquifer for domestic use and agricultural irrigation. Since the 1970s, there has been a rapid increase in population in several parts of the valley that rely on domestic wells for drinking water and septic systems for treatment of household waste. As a result, the density of septic systems in the developed areas is greater than one septic system per 3 acres, and the majority of the domestic wells are shallow (screened within 250 feet of the land surface).
The distribution of nitrate as nitrogen (referred to herein as nitrate-N) concentrations in groundwater was determined by collecting more than 200 samples from 8 land-use catego-ries: single family residential, multifamily residential, rural (including land use for agriculture), vacant land, commercial, industrial, utilities, and unclassified. Nitrate-N concentra-tions ranged from below detection (less than 0.05 milligrams per liter) to 18 milligrams per liter. The results of nitrate-N concentrations that were sampled from three wells equalled or exceeded the maximum contaminant level of 10 milligrams per liter set by the U.S. Environmental Protection Agency. Nitrate-N concentrations in sampled wells showed a positive correlation between elevated nitrate-N concentrations and the percentage of single-family land use and septic-system density. Wells sampled in other land-use categories did not have any correlation to nitrate-N concentrations. In areas with greater than 50-percent single-family land use, nitrate-N con-centrations were two times greater than in areas with less than 50 percent single-family land use. Nitrate-N concentrations in groundwater near septic systems that had been used more than 20 years were more than two times greater than in areas where septic systems had been used less than 20 years. Lower nitrate-N concentrations in the areas where septic systems were less than 20 years old probably result from temporary storage of nitrogen leaching from septic systems into the unsaturated zone.
In areas where septic systems are abundant, nitrate-N concentrations were predicted to 2059 by using numerical models within the Ruhenstroth and Johnson Lane subdivisions in the Carson Valley. Model results indicated that nitrate-N concentrations will continue to increase and could exceed the maximum contaminant level over extended areas inside and outside the subdivisions. Two modeling scenarios were
2 The Distribution and Hypothetical Modeling of Nitrate Transport in the Carson Valley Alluvial Aquifer
Figure 1. Location of major drainages, major roads, and areas with septic systems and monitoring wells sampled in Carson Valley, Douglas County, Nevada, 2008.
CARSON CITY COUNTYDOUGLAS COUNTY
NEVADACALIFORNIA
NEVADACALIFORNIA
DOUGLAS COUNTY
ALPINE COUNTY
DOUGLAS COUNTY
ALPINE COUNTY
Cars
onCa
rson
River
River
EastEast
West
West
ForkFork
ForkFork
BuckeyeBuckeye
Cree
kCr
eek
CreekCreek
PinePine
ClearClearCreekCreek
NutNut
88
395
50
4 MILES2 310
4 KILOMETERS2 310
Data sourced from Douglas County GIS parcel data, 2009Roads, states, and county boundaries sourced from U.S. Census Bureau 2010 Tiger Line dataShaded relief sourced from U.S.Geological Survey National Elevation Dataset Universal Transverse Mercator projection, Zone 11, North American Datum of 1983
119°40'119°45'119°50'
39°05'
39°00'
38°55'
38°50'
Cars
on R
ange
Pine
Nut
Mou
ntai
ns
MindenMindenMinden
GardnervilleGardnervilleGardnerville
Johnson LaneJohnson LaneJohnson Lane
RuhenstrothRuhenstrothRuhenstroth
GenoaGenoaGenoa
Kimmerling Road areaKimmerling Road areaKimmerling Road area
Hot Springs MountainHot Springs MountainHot Springs Mountain
Indian HillsIndian HillsIndian HillsJacks
ValleyJacks ValleyJacks Valley
BuckeyeBuckeyeBuckeye
Muller LaneMuller LaneMuller Lane
Gardnerville Ranchos
Gardnerville Ranchos
Gardnerville Ranchos
EXPLANATIONParcels with septic tanks
Sampled wells
Area of mapReno
CALIFORNIA NEVADA
Sierra Nevada
Population data are from the U.S. Census Bureau (2009), and septic system data are from Douglas County (2009).
Introduction 3
Figure 2. Population and total number of septic systems for Douglas County, Nevada, 1860–2008.
Popu
latio
n an
d to
tal n
umbe
r of s
eptic
tank
s
Year
0
10
20
30
40
50
1860 1880 1900 1920 1940 1960 1980 2000
Population (thousands) Septic tanks (hundreds)
Population data are from the U.S. Census Bureau (2009) and septic system data are from Douglas County (2009).
which hemoglobin is unable to carry oxygen, causes a bluish discoloration of the skin and can be fatal in infants under 6 months of age because they lack the enzyme that reduces methemoglobin to hemoglobin (Avery, 1999). As a result of the risk of methemoglobinemia, the U.S. Environmental Pro-tection Agency (USEPA) established a maximum contaminant level (MCL) of 10 milligrams per liter (mg/L) for nitrate-N in 1975. In addition, consumption of nitrate-N has been linked to hypertension (Malberg and others, 1978), central nervous system birth defects (Super and others, 1981), certain types of cancer (Hill and others, 1973; Ward and others, 2005), and diabetes (Parslow and others, 1997).
Anthropogenic sources of nitrogen in Douglas County include agriculture (from the application of fertilizers or from animal waste), irrigation of treated waste water in fields and parks, urban and industrial runoff, and septic systems. The predominant form of organic nitrogen in septic systems is urea, which is converted to ammonia and ammonium through biological processes. The ammonia is then converted to nitrate in the presence of dissolved oxygen (aerobic conditions) in water. Natural sources of nitrogen in the groundwater are limited in Carson Valley, and nitrate concentrations in wells that have not been affected by human nitrogen sources gener-ally are less than 1 mg/L as nitrogen (Rosen, 2003). Soil-core samples taken in the Pine Nut Mountains prior to this study (Douglas Maurer, U.S. Geological Survey, unpub. data, 2008), showed median extractable nitrate-N concentrations of less than 4.6 mg/L, which is much lower than natural nitrate con-centrations (up to 50 mg/L nitrate-N) in other northern Nevada alluvial sediments (Walvoord and others, 2003; Rosen and Kropf, 2009). These data indicate that no significant source of natural nitrogen is likely to be present in the study area.
Groundwater contamination from septic systems is com-mon in aquifers that contain dissolved oxygen (Yates, 1985; Williams and others, 1998; Morgan and others, 2007) and has been observed in several other studies (for example, Miller,
1975; Perkins, 1984; Canter and Knox, 1985; and Reneau and others, 1989). A high septic density and steady discharge from septic systems have been shown to increase nitrate-N concen-trations above the MCL over time (Makowski, 2006; Morgan and others, 2007). Studies that used predictive models gener-ally concluded that nitrate-N concentrations will continue to increase when septic systems are used as the main wastewater-treatment system in an oxygenated aquifer (MacQuarrie and others, 2001; Conan and others, 2003; Makowski, 2006; Morgan and others, 2007).
Previous studies from specific areas of Carson Valley have shown that the source of elevated nitrate-N concentrations in groundwater comes from infiltration of septic-system waste-water into the shallow groundwater (Thodal, 1996; Thomas and others, 1999; Rosen, 2003; Shipley and Rosen, 2005). These studies were based on limited sampling in mostly residential areas of Carson Valley. To assess whether there are other important sources of nitrate-N to groundwater in Carson Valley and whether high concentrations exist in currently un-sampled areas, a valley-wide study was needed to determine nitrate-N concentrations in groundwater under as many differ-ent types of land use as possible. In addition, an understand-ing of the transport of nitrate-N through the groundwater in Carson Valley and the possible long-term (50 years) effects of anthropogenic nitrate-N loading is needed to assess how water resources and water quality can be managed most effectively in the future.
Purpose and Scope
Previous studies based on limited geographic data have shown that nitrate concentrations in some areas of Carson Val-ley are increasing over time and that this increase is associated with septic-tank density (Rosen, 2003; Shipley and Rosen, 2005). In order to assess nitrate-N concentrations throughout Carson Valley and to predict concentrations of nitrate-N, a more detailed analysis of the valley was needed. The purpose of this report is to 1) analyze the spatial and temporal nitrate-N concentrations in groundwater to quantify the relationship between concentration and land use, and 2) to simulate nitrate-N transport under current and future conditions by using a numerical model of two subdivisions within Carson Valley for purposes of evaluating two scenarios for managing septic-system usage.
Description of Study Area
The 400 square-mile (mi2) study area of Carson Valley is located in Douglas County, Nevada, and Alpine County, California (fig. 1). The major population centers include the Minden/Gardnerville area, Gardnerville Ranchos, Kimmerling Road area, Johnson Lane, Genoa, Indian Hills, and Ruhen-stroth (fig. 1). Land use for most of the valley has been agri-cultural, historically, but an increase in population has changed the dominant land-use classes to single-family residential and commercial (Maurer and Berger, 2006).
4 The Distribution and Hypothetical Modeling of Nitrate Transport in the Carson Valley Alluvial Aquifer
HydrogeologyCarson Valley is located in the rain shadow of the Sierra
Nevada mountain range and had a 77-year average precipita-tion of 8.4 in/yr from 1928 to 2005 (Station 265191 Minden, Nevada) at the valley floor with more precipitation at higher elevations, mostly along the Carson Range. The Carson River flows through the center of Carson Valley and dominates the hydrology in the basin. Water from the river is diverted throughout the valley through a system of canals and ditches used for flood irrigation (Maurer and Berger, 2006). Infiltra-tion from the streambed and ditches contributes to a shallow groundwater table that is less than 5-ft deep under much of the valley floor near the river (Maurer and Peltz, 1994).
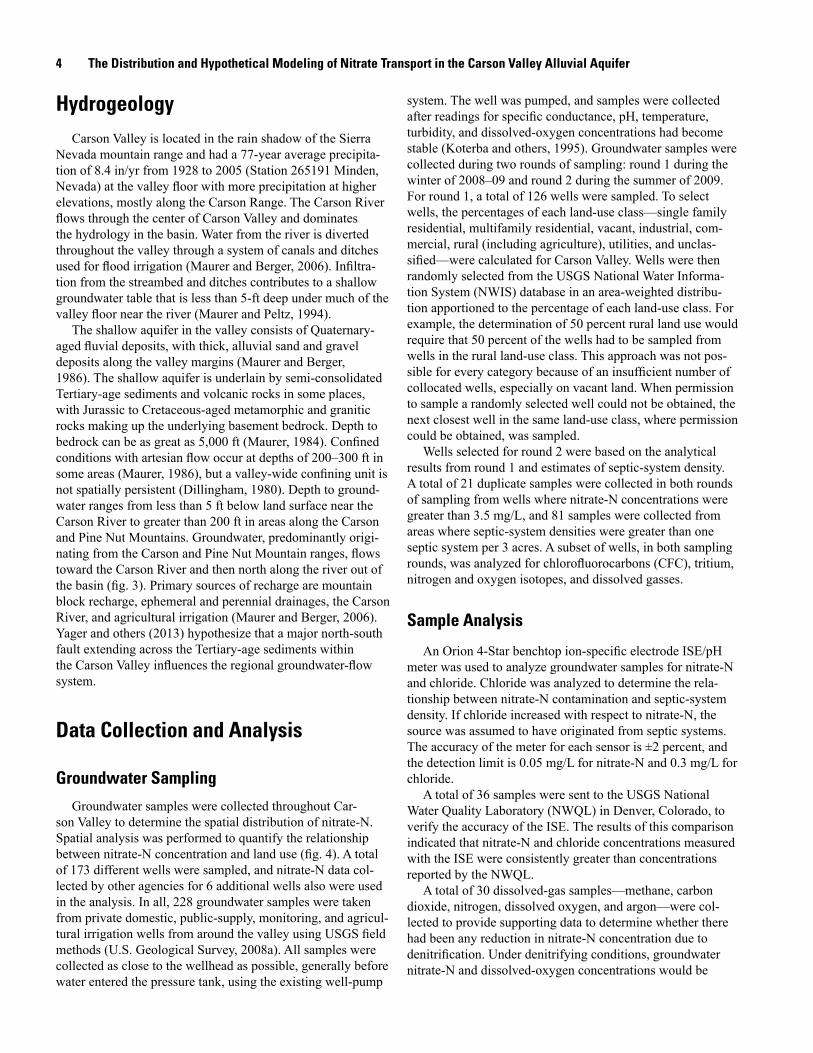
The shallow aquifer in the valley consists of Quaternary-aged fluvial deposits, with thick, alluvial sand and gravel deposits along the valley margins (Maurer and Berger, 1986). The shallow aquifer is underlain by semi-consolidated Tertiary-age sediments and volcanic rocks in some places, with Jurassic to Cretaceous-aged metamorphic and granitic rocks making up the underlying basement bedrock. Depth to bedrock can be as great as 5,000 ft (Maurer, 1984). Confined conditions with artesian flow occur at depths of 200–300 ft in some areas (Maurer, 1986), but a valley-wide confining unit is not spatially persistent (Dillingham, 1980). Depth to ground-water ranges from less than 5 ft below land surface near the Carson River to greater than 200 ft in areas along the Carson and Pine Nut Mountains. Groundwater, predominantly origi-nating from the Carson and Pine Nut Mountain ranges, flows toward the Carson River and then north along the river out of the basin (fig. 3). Primary sources of recharge are mountain block recharge, ephemeral and perennial drainages, the Carson River, and agricultural irrigation (Maurer and Berger, 2006). Yager and others (2013) hypothesize that a major north-south fault extending across the Tertiary-age sediments within the Carson Valley influences the regional groundwater-flow system.
Data Collection and Analysis
Groundwater Sampling
Groundwater samples were collected throughout Car-son Valley to determine the spatial distribution of nitrate-N. Spatial analysis was performed to quantify the relationship between nitrate-N concentration and land use (fig. 4). A total of 173 different wells were sampled, and nitrate-N data col-lected by other agencies for 6 additional wells also were used in the analysis. In all, 228 groundwater samples were taken from private domestic, public-supply, monitoring, and agricul-tural irrigation wells from around the valley using USGS field methods (U.S. Geological Survey, 2008a). All samples were collected as close to the wellhead as possible, generally before water entered the pressure tank, using the existing well-pump
system. The well was pumped, and samples were collected after readings for specific conductance, pH, temperature, turbidity, and dissolved-oxygen concentrations had become stable (Koterba and others, 1995). Groundwater samples were collected during two rounds of sampling: round 1 during the winter of 2008–09 and round 2 during the summer of 2009. For round 1, a total of 126 wells were sampled. To select wells, the percentages of each land-use class—single family residential, multifamily residential, vacant, industrial, com-mercial, rural (including agriculture), utilities, and unclas-sified—were calculated for Carson Valley. Wells were then randomly selected from the USGS National Water Informa-tion System (NWIS) database in an area-weighted distribu-tion apportioned to the percentage of each land-use class. For example, the determination of 50 percent rural land use would require that 50 percent of the wells had to be sampled from wells in the rural land-use class. This approach was not pos-sible for every category because of an insufficient number of collocated wells, especially on vacant land. When permission to sample a randomly selected well could not be obtained, the next closest well in the same land-use class, where permission could be obtained, was sampled.
Wells selected for round 2 were based on the analytical results from round 1 and estimates of septic-system density. A total of 21 duplicate samples were collected in both rounds of sampling from wells where nitrate-N concentrations were greater than 3.5 mg/L, and 81 samples were collected from areas where septic-system densities were greater than one septic system per 3 acres. A subset of wells, in both sampling rounds, was analyzed for chlorofluorocarbons (CFC), tritium, nitrogen and oxygen isotopes, and dissolved gasses.
Sample Analysis
An Orion 4-Star benchtop ion-specific electrode ISE/pH meter was used to analyze groundwater samples for nitrate-N and chloride. Chloride was analyzed to determine the rela-tionship between nitrate-N contamination and septic-system density. If chloride increased with respect to nitrate-N, the source was assumed to have originated from septic systems. The accuracy of the meter for each sensor is ±2 percent, and the detection limit is 0.05 mg/L for nitrate-N and 0.3 mg/L for chloride.
A total of 36 samples were sent to the USGS National Water Quality Laboratory (NWQL) in Denver, Colorado, to verify the accuracy of the ISE. The results of this comparison indicated that nitrate-N and chloride concentrations measured with the ISE were consistently greater than concentrations reported by the NWQL.
A total of 30 dissolved-gas samples—methane, carbon dioxide, nitrogen, dissolved oxygen, and argon—were col-lected to provide supporting data to determine whether there had been any reduction in nitrate-N concentration due to denitrification. Under denitrifying conditions, groundwater nitrate-N and dissolved-oxygen concentrations would be
Data Collection and Analysis 5
0
-1,000
1,000
2,000
3,000
4,000
5,000
6,000
7,000
8,000
9,000
10,000
Alti
tude
, in
feet
abo
ve s
ea le
vel
0 5 10 15 20Distance, in miles
Vertical exaggeration X5
Pine NutMountains
CarsonRange
A’A Infiltration of
ephemeral streamflowInfiltration of
ephemeral streamflow
Tertiary sediments
Tertiary sediments
Alluvial fansediments
FluvialsedimentsConfining
layers
Pumping
ET
GW-SWexchange
HypothesizedHot Springs Mountain fault
Consolidated bedrock
Groundwater inflow
Groundwater inflow
US 395
wel
l log
CarsonRiver
?
?Upward gradient
Fish Spring Flat2 miles south of section
Area of mapReno
CALIFORNIA NEVADASierra Nevada
NEVADACALIFORNIA
NEVADACALIFORNIA
Carson ValleyCarson ValleyEast Fork
East Fork
West Fork
West Fork
Carson
River
Carson
River
DouglasCounty
DouglasCounty
AlpineCountyAlpineCounty
Carson City CountyCarson City County LyonCounty
LyonCounty
A’A’AA
Modified from Yager and others, 2012
Figure 3. Geologic cross-section of Carson Valley, Nevada, shown from transect A in figure 1.
expected to be low, and anaerobic bacteria that use the oxygen in the nitrate for energy generate nitrogen gas as waste. Gas samples were collected based on USGS collection methods (U.S. Geological Survey, 2008b) and were analyzed at the USGS Chlorofluorocarbon Laboratory in Reston, Virginia.
A total of 37 groundwater samples were collected for nitro-gen (δ 15N) and oxygen (δ 18O) isotope analysis to determine the source of nitrogen in the groundwater. Samples were collected using the methods developed by Révész and Cas-ciotti (2007). Samples were sent to the USGS Stable Isotope Laboratory in Reston, Virginia, for analysis using the bacterial conversion of nitrate-N to nitrous oxide method. Concentra-tions were measured on a continuous flow isotope ratio spec-trometer (Silva and others, 2000; Sigman and others, 2001) and were reported as delta (δ) ratios in per mil (‰) relative to nitrogen gas air for nitrogen and Vienna Standard Mean Ocean Water for oxygen.
A total of 30 groundwater samples were collected and analyzed for CFCs and tritium to determine the apparent age of the groundwater. Groundwater apparent age is defined as
the length of time that has passed between recharge and sam-pling. It is determined by CFC and tritium, and incorporates a mixture of groundwater from different source areas. Samples were collected using standard USGS methods (U.S. Geologi-cal Survey, 2008a) and sent to the USGS Chlorofluorocar-bon Laboratory in Reston, Virginia, for analysis of CFC-11, CFC-12, and CFC-113 concentrations. Samples were analyzed by using a purge-and-trap gas chromatography procedure with an electron-capture detector (U.S. Geological Survey, 2008a). Apparent ages calculated from CFC-11, CFC-12, and CFC-113 for this study showed agreement between each CFC measured and generally were within about 5 years of each other (appendix 2). Concentrations of the dissolved gases argon and neon were used to constrain recharge temperatures needed for the age determinations, which varied between 4 to 15 degrees Celsius. Most of the apparent groundwater recharged between 1970 and 1990, a period for which the recharge temperature does not change the apparent CFC ages in Carson Valley by more than 2 years (Hinkle and others, 2010). A total of 37 tritium samples were collected and sent
6 The Distribution and Hypothetical Modeling of Nitrate Transport in the Carson Valley Alluvial Aquifer
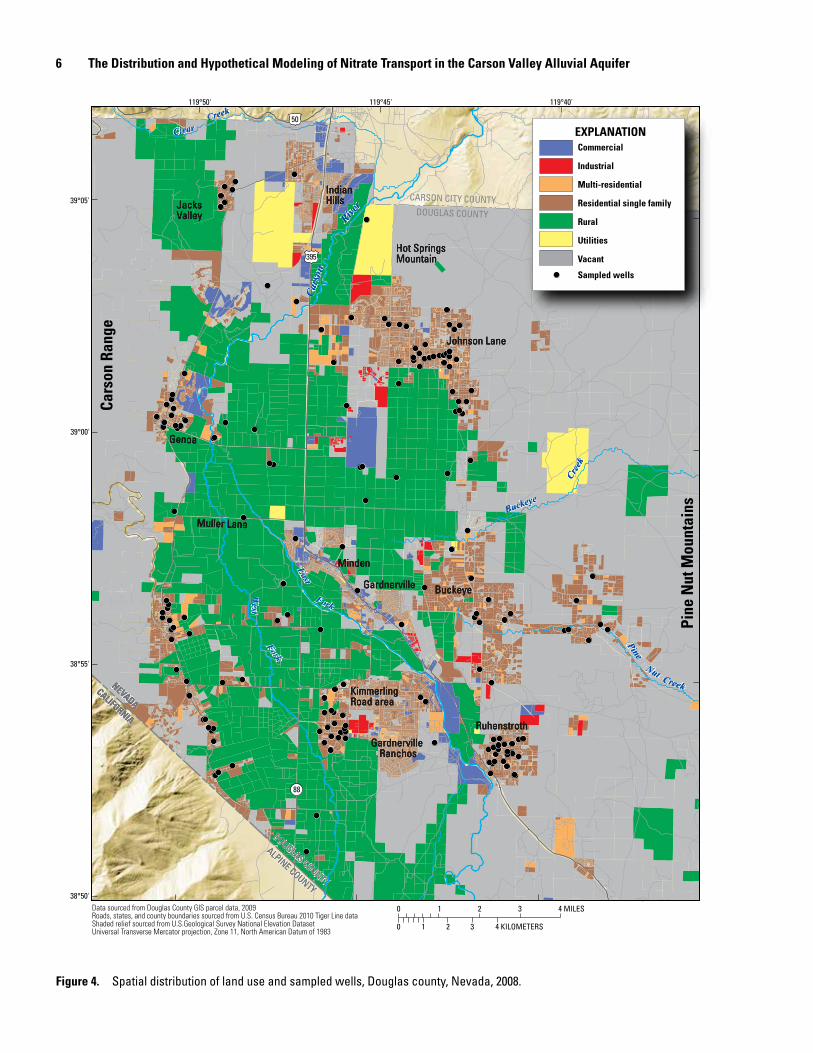
Figure 4. Spatial distribution of land use and sampled wells, Douglas county, Nevada, 2008.
CARSON CITY COUNTYDOUGLAS COUNTY
NEVADACALIFORNIA
NEVADACALIFORNIA
DOUGLAS COUNTY
ALPINE COUNTY
DOUGLAS COUNTY
ALPINE COUNTY
Cars
onCa
rson
River
River
EastEast
West
West
ForkFork
ForkFork
BuckeyeBuckeye
Cree
kCr
eek
CreekCreek
PinePine
ClearClearCreekCreek
NutNut
88
395
50
4 MILES2 310
4 KILOMETERS2 310
Data sourced from Douglas County GIS parcel data, 2009Roads, states, and county boundaries sourced from U.S. Census Bureau 2010 Tiger Line dataShaded relief sourced from U.S.Geological Survey National Elevation Dataset Universal Transverse Mercator projection, Zone 11, North American Datum of 1983
119°40'119°45'119°50'
39°05'
39°00'
38°55'
38°50'
Cars
on R
ange
Pine
Nut
Mou
ntai
ns
MindenMindenMinden
GardnervilleGardnervilleGardnerville
Johnson LaneJohnson LaneJohnson Lane
RuhenstrothRuhenstrothRuhenstroth
GenoaGenoaGenoa
Kimmerling Road areaKimmerling Road areaKimmerling Road area
Hot Springs MountainHot Springs MountainHot Springs Mountain
Indian HillsIndian HillsIndian HillsJacks
ValleyJacks ValleyJacks Valley
BuckeyeBuckeyeBuckeye
Muller LaneMuller LaneMuller Lane
Gardnerville Ranchos
Gardnerville Ranchos
Gardnerville Ranchos
Commercial
Industrial
Multi-residential
Residential single family
Rural
Utilities
Vacant
Sampled wells
EXPLANATION
Data Collection and Analysis 7
to the University of Miami Tritium Laboratory in Miami, Florida, for analysis by using low-level gas proportional counting (University of Miami, 2009). The tritium values were used to verify the CFC-age determinations. Tritium values that were below detection (0.05 tritium units) were considered to be older than atmospheric nuclear bomb testing, which sent large amounts of tritium into the atmosphere beginning around 1953. Tritium values greater than detection were considered to be either younger than 1953 or a mixture of water that was both younger and older than 1953.
Quality AssuranceReplicate samples were taken during both rounds of sam-
pling for all constituents. During round 1, replicate samples were collected at 7 percent of the sites for nitrate-N and chloride and at 10 percent of the sites for CFC, tritium, dis-solved gas, and nitrogen and oxygen isotopes. During round 2, replicate samples were collected at 10 percent of the sites for all analyses. Analytical results for all replicate samples were within 9 percent of the original measurement result. Nitrate-N concentrations less than 0.05 milligrams per liter noted in the report refer to concentrations that were below the method detection limit.
For round 2, laboratory blanks were analyzed using the ISE. All results for the laboratory blanks were below detec-tion for each probe. Three sample spikes were analyzed during round 2 for nitrate-N and chloride. Recovery for nitrate-N
and chloride was ±4 percent of the added amount (table 1). Standards used to calibrate the nitrate-N and chloride ISE probes were sent to the USGS NWQL for analysis at different dilutions. Results for nitrate-N were within -9 percent of the measured concentration at low concentrations and within ±2 percent at concentrations greater than 2 mg/L (table 1). Chlo-ride concentrations at all dilutions were all within 7 percent of the measured concentration (table 1).
Land-Use AnalysisNitrate-N concentrations were compared to septic-system
density and land use. Land-use classes were based on previ-ously established designations from the Douglas County parcel database (fig. 4) and include residential single-family, residential multifamily, vacant, rural (including agricultural), commercial, industrial, and utilities (Douglas County, 2009). Areas not classified by the Douglas County parcel database were given a land-use class of unclassified. The date the septic systems were permitted on each parcel was included in the database. The percentage of land-use class, number of septic systems, and number of wells were calculated for a 1,640-ft (500-meter) buffer area around each sampled well. This method evaluates the contribution of local land uses and the effect on groundwater quality at a particular well (Koterba and others, 1995). This method of analysis is the same that was used in a previous land-use study of Carson Valley that was based on a smaller number of wells (Shipley and Rosen, 2005).
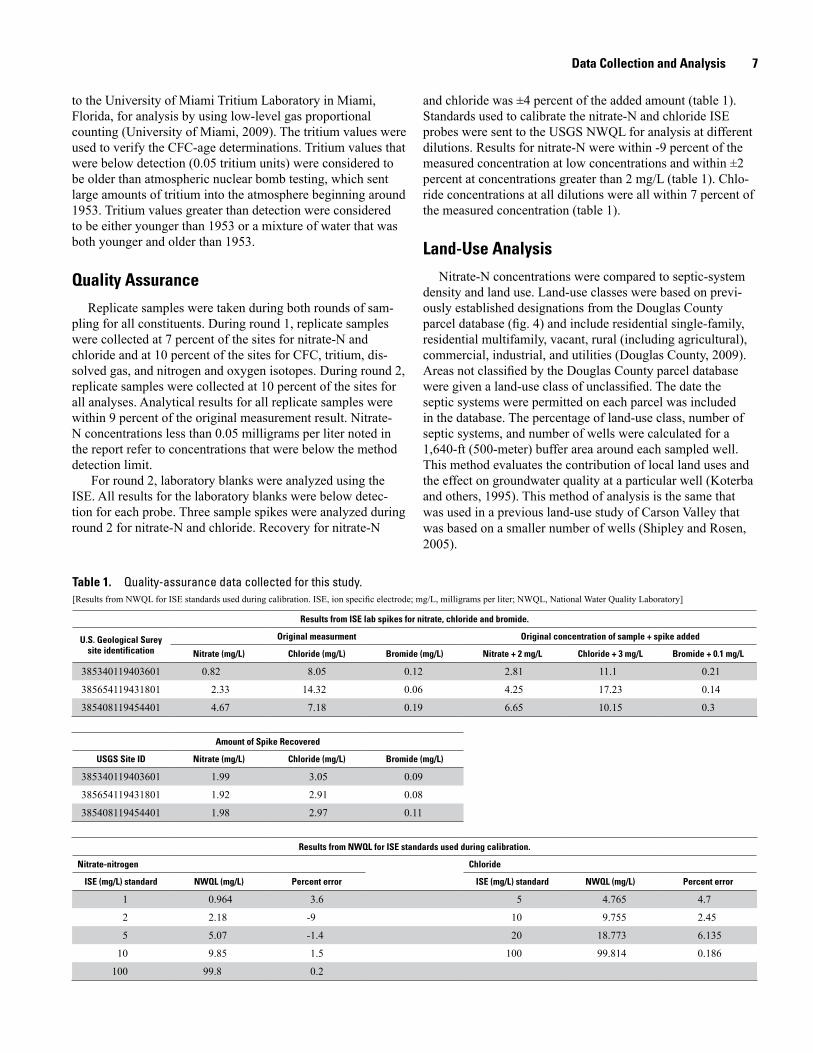
Table 1. Quality-assurance data collected for this study. [Results from NWQL for ISE standards used during calibration. ISE, ion specific electrode; mg/L, milligrams per liter; NWQL, National Water Quality Laboratory]
Results from ISE lab spikes for nitrate, chloride and bromide.
U.S. Geological Surey site identification
Original measurment Original concentration of sample + spike added
Nitrate (mg/L) Chloride (mg/L) Bromide (mg/L) Nitrate + 2 mg/L Chloride + 3 mg/L Bromide + 0.1 mg/L
385340119403601 0.82 8.05 0.12 2.81 11.1 0.21
385654119431801 2.33 14.32 0.06 4.25 17.23 0.14
385408119454401 4.67 7.18 0.19 6.65 10.15 0.3
Amount of Spike Recovered
USGS Site ID Nitrate (mg/L) Chloride (mg/L) Bromide (mg/L)
385340119403601 1.99 3.05 0.09
385654119431801 1.92 2.91 0.08
385408119454401 1.98 2.97 0.11
Results from NWQL for ISE standards used during calibration.
Nitrate-nitrogen Chloride
ISE (mg/L) standard NWQL (mg/L) Percent error ISE (mg/L) standard NWQL (mg/L) Percent error
1 0.964 3.6 5 4.765 4.7
2 2.18 -9 10 9.755 2.45
5 5.07 -1.4 20 18.773 6.135
10 9.85 1.5 100 99.814 0.186
100 99.8 0.2
8 The Distribution and Hypothetical Modeling of Nitrate Transport in the Carson Valley Alluvial Aquifer
Nitrate-N Observations in Groundwater
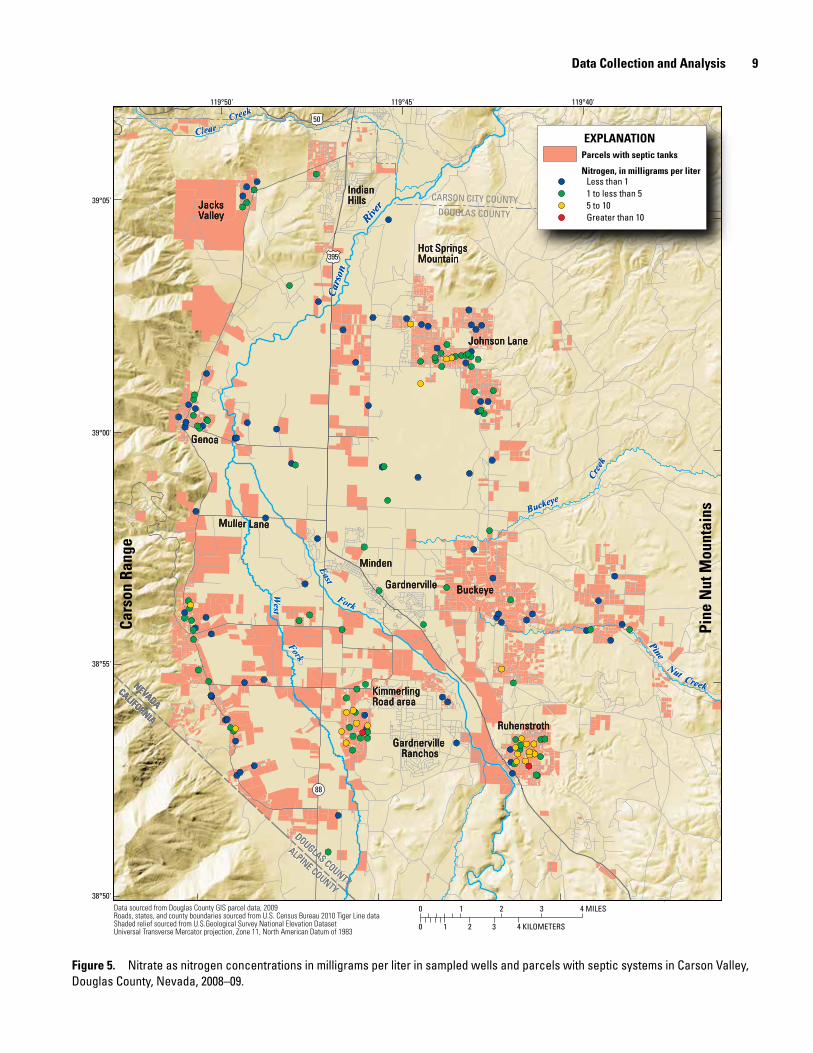
Out of 228 samples, 2 had a nitrate-N concentration that exceeded the MCL of 10 mg/L, and 6 samples had concentra-tions less than 0.05 mg/L (fig. 5). Nitrate-N concentrations for the valley as a whole ranged from below detection to 18.3 mg/L, with a mean concentration of 2.2 mg/L and median of 1.2 mg/L (appendix 1).
Chloride concentrations ranged from below detection (less than 0.3 mg/L) to 238 mg/L, with a mean of 12.2 mg/L and a median of 8.0 mg/L. All results except for one were less than 70 mg/L, well below the secondary U.S. EPA drinking water MCL of 250 mg/L. Specific conductance, which is related to total dissolved solids, ranged from 42 to 3,220 µS/cm, with a mean of 257 µS/cm and a median of 210 µS/cm (appendix 1). High dissolved oxygen concentrations (greater than 4.0 mg/L) and low excess nitrogen gas production indicated that denitri-fication was not a major process controlling the attenuation of nitrate-N concentrations in groundwater (appendix 1).
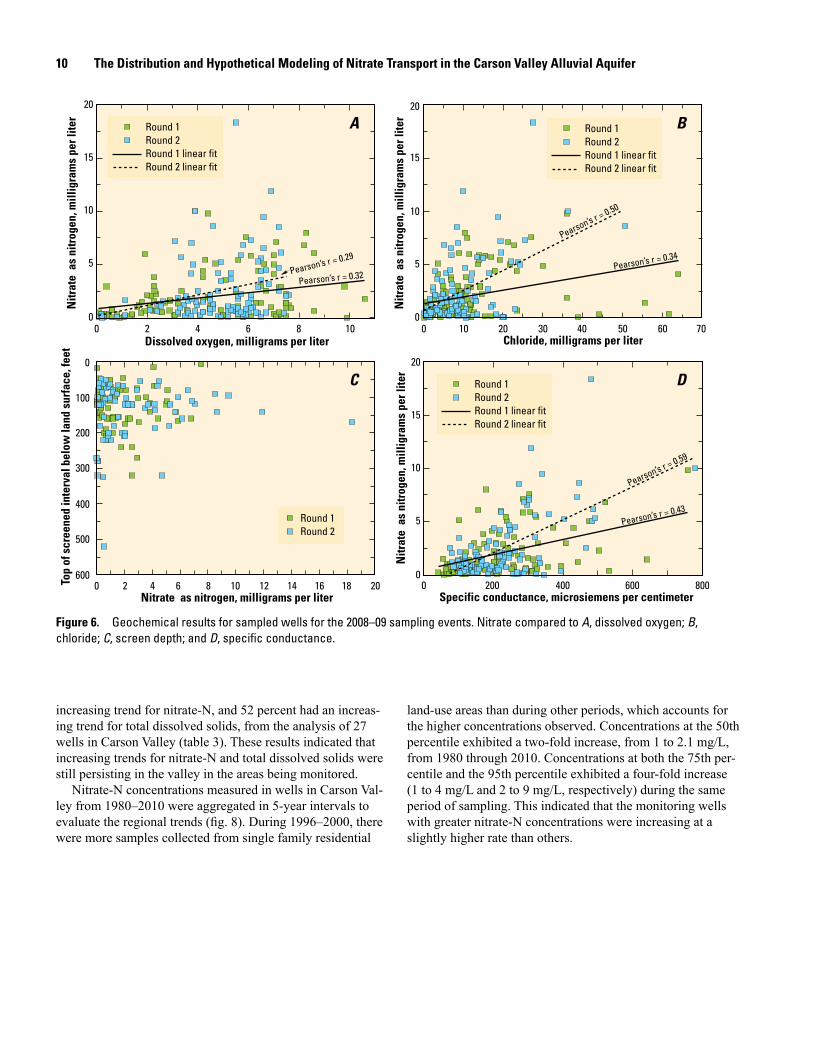
The nitrate-N concentrations were plotted against dis-solved oxygen (fig. 6A), chloride (fig. 6B), depth to the top of screened interval below land surface (fig. 6C), and specific conductance values (fig. 6D). One high value for specific con-ductance and chloride was not included in the regression. The correlation between these variables and nitrate-N improved during round 2, which focused on wells that contained elevated concentrations of nitrate and were in single-family residential areas. A positive correlation was found between nitrate-N and both chloride and specific conductance, which is a proxy for total dissolved solids (fig. 6B and 6D). Nitrate-N concentrations in shallow wells were greater than in deeper wells (fig. 6C). In both sampling events, there was a cluster of wells screened between 75 and 150 feet from land surface that had nitrate-N concentrations greater than 3 mg/L.
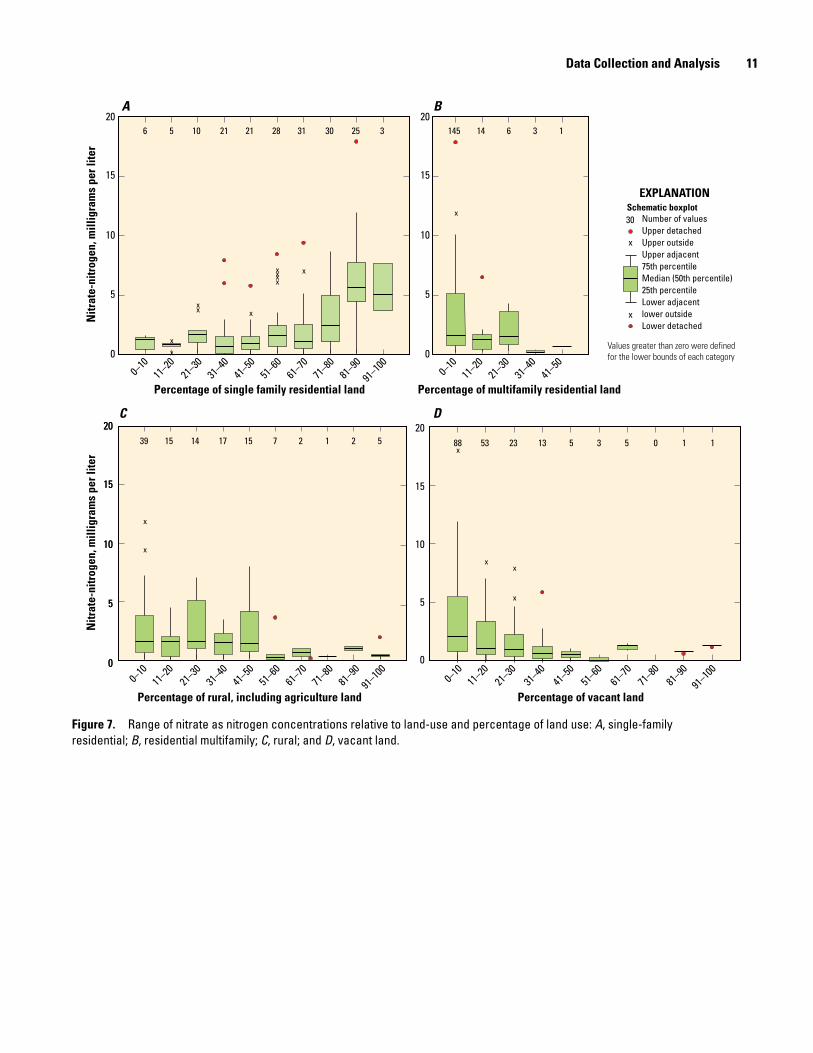
A positive correlation exists between nitrate-N concentra-tions and the percentage of the residential single-family land use (table 2) for all data. A negative correlation for nitrate-N concentrations in rural and vacant land use indicated that concentrations of nitrate-N on groundwater were lower with less development. The median groundwater nitrate-N concentration correlated with percentage of residential single-family land use (fig. 7A). The median nitrate-N con-centration for residential multifamily, rural, and vacant land uses decreased slightly and was less variable with increased
land-use percentages (fig. 7B, 7C, and 7D). The mean nitrate-N concentration for wells in areas with greater than 50-percent single-family land use was 2.87 mg/L, which is twice as high as in wells with less than 50-percent residential single-family land use (1.31 mg/L). The lower nitrate-N concentrations with increasing percent of multifamily residential, rural, and vacant land together indicates the influence of adjacent developed land.
Nitrate-N Trends in Groundwater
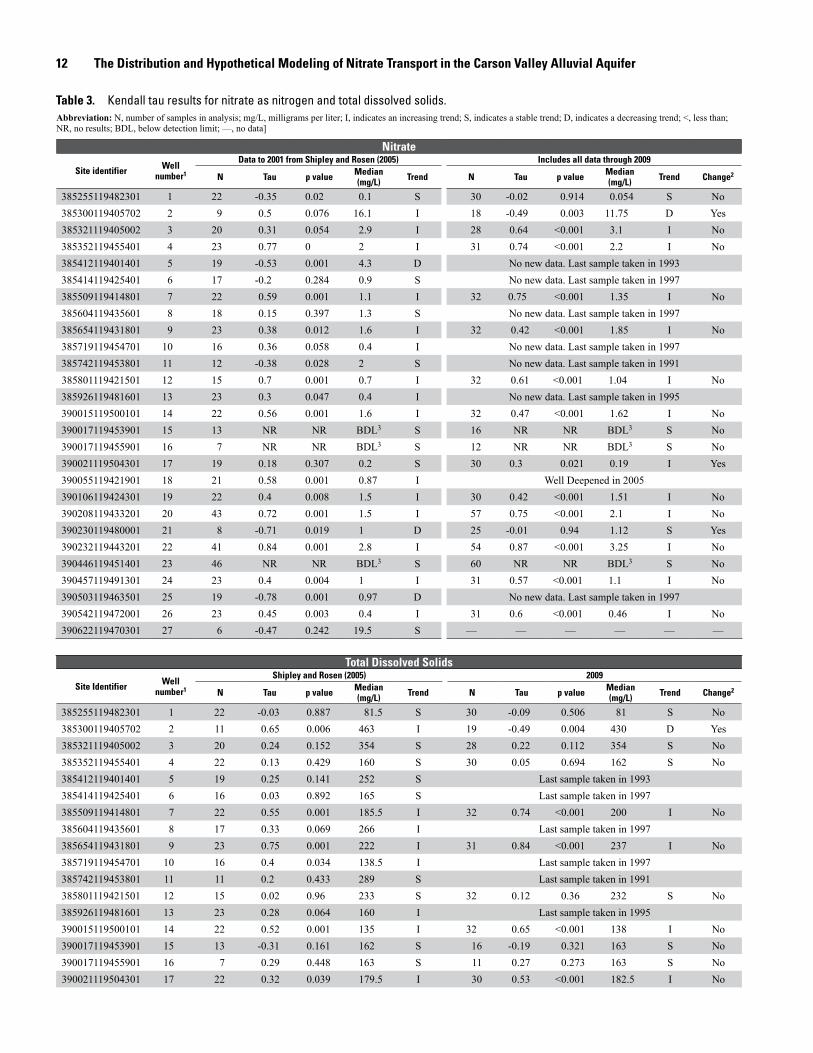
Rosen (2003) and Shipley and Rosen (2005) performed trend analyses using the nonparametric Kendall’s tau statis-tic with a Sen slope estimate (Lorenz and others, 2011) on 27 long-term monitoring wells in Carson Valley. Since these studies were completed, 19 of these wells are still being monitored in the valley, and some have been sampled since 1985 for nitrate-N and total dissolved-solids concentrations. In 2005, however, 1of the 19 wells that was still being monitored was deepened, and subsequent concentrations of nitrate-N and total dissolved solids were lower, so it was not included in the analysis. In order to assess whether concentrations of nitrate-N and total dissolved-solids concentrations changed over time, and whether the changes observed in the previous studies are consistent with recent data, the same Kendall’s tau test was used to test for trends in nitrate-N and total dissolved solids for these wells (table 3; see Shipley and Rosen, 2005, for details of the tests performed). With this test, a p-value less than 0.05 represents a statistically significant monotonic trend at the 95-percent confidence limit. Positive tau values indicate increasing trends, and negative tau values indicate decreasing trends.
Analysis from 12 of the 18 wells (67 percent) revealed statistically significant increasing trends for nitrate-N (table 3). Only one well had a decreasing trend for nitrate-N, and the results for five wells (28 percent) indicated stable concentra-tions with no apparent trend. Analysis from 11 of the 18 wells (61 percent) indicated that concentrations of total dissolved solids also were increasing significantly (p<0.05). Only one well had a decreasing trend, and the results for six wells indi-cated stable concentrations of total dissolved solids with no apparent trend (table 3).
There were changes in trends for five individual wells com-pared to the Shipley and Rosen (2005) study for both nitrate-N and total dissolved solids. In one well, increasing trends for both nitrate-N and dissolved solids changed to decreasing trends. In the five other wells, either nitrate-N or total dis-solved solids changed from decreasing to stable or stable to increasing trends.
Overall, the percentage of wells with increasing concentra-tions in nitrate-N and total dissolved solids trends was similar to Rosen (2003; methods and results presented in Shipley and Rosen, 2005). In Rosen (2003), 58 percent of the wells had an
Table 2. Correlation coefficients for select land-use and water-quality parameters.
Land use Nitrate Dissolved oxygen Chloride Specific
conductance
Residential single family 0.43 0.14 -0.08 -0.10
Residential multifamily -0.14 -0.05 -0.12 -0.12
Rural -0.24 -0.16 -0.06 -0.03
Vacant land -0.25 0.10 -0.07 -0.09
Data Collection and Analysis 9
CARSON CITY COUNTYDOUGLAS COUNTY
NEVADACALIFORNIA
NEVADACALIFORNIA
DOUGLAS COUNTY
ALPINE COUNTY
DOUGLAS COUNTY
ALPINE COUNTY
Cars
onCa
rson
River
River
BuckeyeBuckeye
Cree
kCr
eek
CreekCreek
PinePine
ClearClearCreekCreek
NutNut
EastEast
West
West
ForkFork
ForkFork
88
395
50
4 MILES2 310
4 KILOMETERS2 310
Data sourced from Douglas County GIS parcel data, 2009Roads, states, and county boundaries sourced from U.S. Census Bureau 2010 Tiger Line dataShaded relief sourced from U.S.Geological Survey National Elevation Dataset Universal Transverse Mercator projection, Zone 11, North American Datum of 1983
119°40'119°45'119°50'
39°05'
39°00'
38°55'
38°50'
Cars
on R
ange
Pine
Nut
Mou
ntai
ns
MindenMindenMinden
GardnervilleGardnervilleGardnerville
Johnson LaneJohnson LaneJohnson Lane
RuhenstrothRuhenstrothRuhenstroth
GenoaGenoaGenoa
Kimmerling Road areaKimmerling Road areaKimmerling Road area
Hot Springs MountainHot Springs MountainHot Springs Mountain
Indian HillsIndian HillsIndian HillsJacks
ValleyJacks ValleyJacks Valley
BuckeyeBuckeyeBuckeye
Muller LaneMuller LaneMuller Lane
Gardnerville Ranchos
Gardnerville Ranchos
Gardnerville Ranchos
EXPLANATIONParcels with septic tanks
Nitrogen, in milligrams per literLess than 11 to less than 55 to 10Greater than 10
Figure 5. Nitrate as nitrogen concentrations in milligrams per liter in sampled wells and parcels with septic systems in Carson Valley, Douglas County, Nevada, 2008–09.
10 The Distribution and Hypothetical Modeling of Nitrate Transport in the Carson Valley Alluvial Aquifer
increasing trend for nitrate-N, and 52 percent had an increas-ing trend for total dissolved solids, from the analysis of 27 wells in Carson Valley (table 3). These results indicated that increasing trends for nitrate-N and total dissolved solids were still persisting in the valley in the areas being monitored.
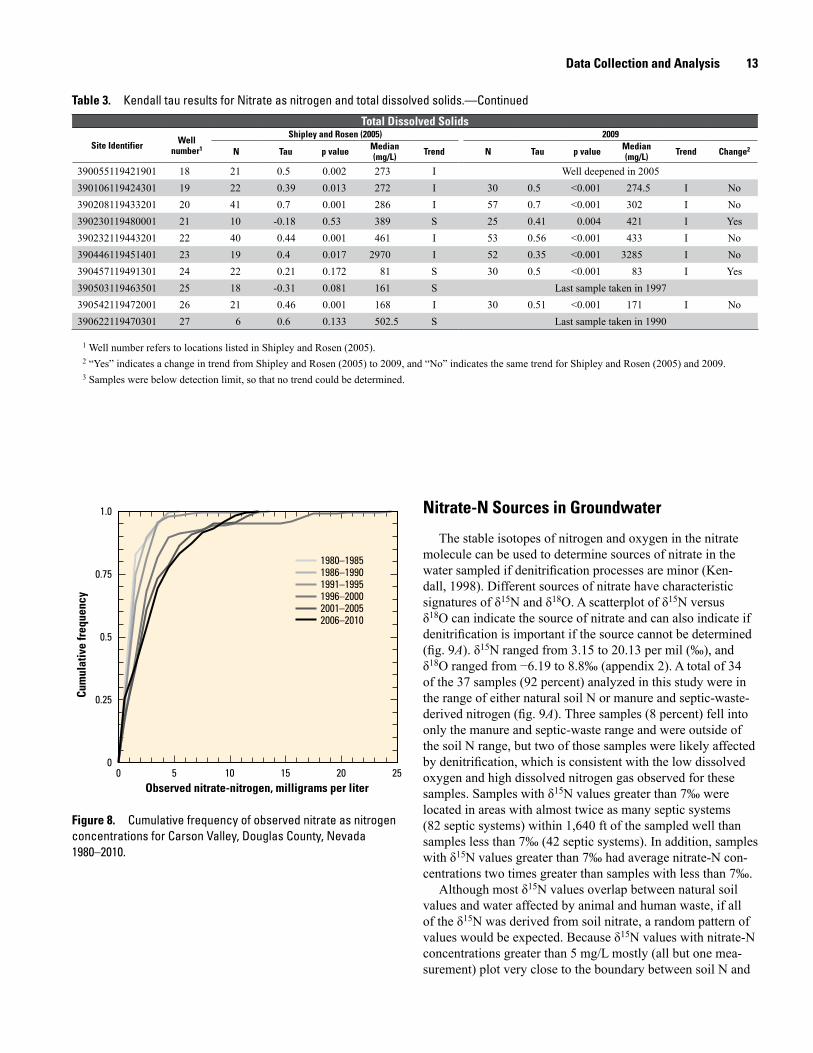
Nitrate-N concentrations measured in wells in Carson Val-ley from 1980–2010 were aggregated in 5-year intervals to evaluate the regional trends (fig. 8). During 1996–2000, there were more samples collected from single family residential
land-use areas than during other periods, which accounts for the higher concentrations observed. Concentrations at the 50th percentile exhibited a two-fold increase, from 1 to 2.1 mg/L, from 1980 through 2010. Concentrations at both the 75th per-centile and the 95th percentile exhibited a four-fold increase (1 to 4 mg/L and 2 to 9 mg/L, respectively) during the same period of sampling. This indicated that the monitoring wells with greater nitrate-N concentrations were increasing at a slightly higher rate than others.
Figure 6. Geochemical results for sampled wells for the 2008–09 sampling events. Nitrate compared to A, dissolved oxygen; B, chloride; C, screen depth; and D, specific conductance.
Nitr
ate
as
nitr
ogen
, mill
igra
ms
per l
iter
Nitr
ate
as
nitr
ogen
, mill
igra
ms
per l
iter
Nitr
ate
as
nitr
ogen
, mill
igra
ms
per l
iter
Top
of s
cree
ned
inte
rval
bel
ow la
nd s
urfa
ce, f
eet
0
5
10
15
20
0
5
10
15
200
500
400
600
300
100
200
0
5
10
15
20
0 60 7030 4010 5020
0 600 800400
10
200
0 6
2010
4
4
82
0 16 188 122 146Nitrate as nitrogen, milligrams per liter
Dissolved oxygen, milligrams per liter Chloride, milligrams per liter
Specific conductance, microsiemens per centimeter
A B
C D
Round 1Round 2Round 1 linear fitRound 2 linear fit
Pearson’s r = 0.29
Pearson’s r = 0.32
Pearson’s r = 0.50
Pearson’s r = 0.34
Pearson’s r = 0.59
Pearson’s r = 0.43
Round 1Round 2Round 1 linear fitRound 2 linear fit
Round 1Round 2Round 1 linear fitRound 2 linear fit
Round 1Round 2
Data Collection and Analysis 11
Figure 7. Range of nitrate as nitrogen concentrations relative to land-use and percentage of land use: A, single-family residential; B, residential multifamily; C, rural; and D, vacant land.
xx
xx x
xxxx
x
x
x
x
x
x
x
x
Number of valuesUpper detachedUpper outsideUpper adjacent75th percentileMedian (50th percentile)25th percentileLower adjacentlower outsideLower detached
EXPLANATION Schematic boxplot
x
x
0
15
10
5
20
0
15
10
5
206 21105 32530312821
A B
21–30
31–40
41–50
51–60
61–70
71–80
81–90
91–10
00–
1011
–20
21–30
31–40
41–50
51–60
61–70
71–80
81–90
91–10
00–
1011
–2021
–3031
–4041
–5051
–6061
–7071
–8081
–90
91–10
00–
1011
–20
Percentage of single family residential land Percentage of multifamily residential land
30
C D
0–10
11–20
21–30
31–40
41–50
13614145
0
15
10
5
20
0
15
10
5
20
0
15
10
5
20
Nitr
ate-
nitr
ogen
, mill
igra
ms
per l
iter
Nitr
ate-
nitr
ogen
, mill
igra
ms
per l
iter
Percentage of rural, including agriculture land Percentage of vacant land
39 171415 5212715 88 132353 110535
Values greater than zero were defined for the lower bounds of each category
12 The Distribution and Hypothetical Modeling of Nitrate Transport in the Carson Valley Alluvial Aquifer
Abbreviation: N, number of samples in analysis; mg/L, milligrams per liter; I, indicates an increasing trend; S, indicates a stable trend; D, indicates a decreasing trend; <, less than; NR, no results; BDL, below detection limit; —, no data]
Nitrate
Site identifier Well number1
Data to 2001 from Shipley and Rosen (2005) Includes all data through 2009
N Tau p value Median (mg/L) Trend N Tau p value Median
(mg/L) Trend Change2
385255119482301 1 22 -0.35 0.02 0.1 S 30 -0.02 0.914 0.054 S No385300119405702 2 9 0.5 0.076 16.1 I 18 -0.49 0.003 11.75 D Yes385321119405002 3 20 0.31 0.054 2.9 I 28 0.64 <0.001 3.1 I No385352119455401 4 23 0.77 0 2 I 31 0.74 <0.001 2.2 I No385412119401401 5 19 -0.53 0.001 4.3 D No new data. Last sample taken in 1993385414119425401 6 17 -0.2 0.284 0.9 S No new data. Last sample taken in 1997385509119414801 7 22 0.59 0.001 1.1 I 32 0.75 <0.001 1.35 I No385604119435601 8 18 0.15 0.397 1.3 S No new data. Last sample taken in 1997385654119431801 9 23 0.38 0.012 1.6 I 32 0.42 <0.001 1.85 I No385719119454701 10 16 0.36 0.058 0.4 I No new data. Last sample taken in 1997385742119453801 11 12 -0.38 0.028 2 S No new data. Last sample taken in 1991385801119421501 12 15 0.7 0.001 0.7 I 32 0.61 <0.001 1.04 I No385926119481601 13 23 0.3 0.047 0.4 I No new data. Last sample taken in 1995390015119500101 14 22 0.56 0.001 1.6 I 32 0.47 <0.001 1.62 I No390017119453901 15 13 NR NR BDL3 S 16 NR NR BDL3 S No390017119455901 16 7 NR NR BDL3 S 12 NR NR BDL3 S No390021119504301 17 19 0.18 0.307 0.2 S 30 0.3 0.021 0.19 I Yes390055119421901 18 21 0.58 0.001 0.87 I Well Deepened in 2005390106119424301 19 22 0.4 0.008 1.5 I 30 0.42 <0.001 1.51 I No390208119433201 20 43 0.72 0.001 1.5 I 57 0.75 <0.001 2.1 I No390230119480001 21 8 -0.71 0.019 1 D 25 -0.01 0.94 1.12 S Yes390232119443201 22 41 0.84 0.001 2.8 I 54 0.87 <0.001 3.25 I No390446119451401 23 46 NR NR BDL3 S 60 NR NR BDL3 S No390457119491301 24 23 0.4 0.004 1 I 31 0.57 <0.001 1.1 I No390503119463501 25 19 -0.78 0.001 0.97 D No new data. Last sample taken in 1997390542119472001 26 23 0.45 0.003 0.4 I 31 0.6 <0.001 0.46 I No390622119470301 27 6 -0.47 0.242 19.5 S — — — — — —
Total Dissolved Solids
Site Identifier Well number1
Shipley and Rosen (2005) 2009
N Tau p value Median (mg/L) Trend N Tau p value Median
(mg/L) Trend Change2
385255119482301 1 22 -0.03 0.887 81.5 S 30 -0.09 0.506 81 S No385300119405702 2 11 0.65 0.006 463 I 19 -0.49 0.004 430 D Yes385321119405002 3 20 0.24 0.152 354 S 28 0.22 0.112 354 S No385352119455401 4 22 0.13 0.429 160 S 30 0.05 0.694 162 S No385412119401401 5 19 0.25 0.141 252 S Last sample taken in 1993385414119425401 6 16 0.03 0.892 165 S Last sample taken in 1997385509119414801 7 22 0.55 0.001 185.5 I 32 0.74 <0.001 200 I No385604119435601 8 17 0.33 0.069 266 I Last sample taken in 1997385654119431801 9 23 0.75 0.001 222 I 31 0.84 <0.001 237 I No385719119454701 10 16 0.4 0.034 138.5 I Last sample taken in 1997385742119453801 11 11 0.2 0.433 289 S Last sample taken in 1991385801119421501 12 15 0.02 0.96 233 S 32 0.12 0.36 232 S No385926119481601 13 23 0.28 0.064 160 I Last sample taken in 1995390015119500101 14 22 0.52 0.001 135 I 32 0.65 <0.001 138 I No390017119453901 15 13 -0.31 0.161 162 S 16 -0.19 0.321 163 S No390017119455901 16 7 0.29 0.448 163 S 11 0.27 0.273 163 S No390021119504301 17 22 0.32 0.039 179.5 I 30 0.53 <0.001 182.5 I No
Table 3. Kendall tau results for nitrate as nitrogen and total dissolved solids.
Data Collection and Analysis 13
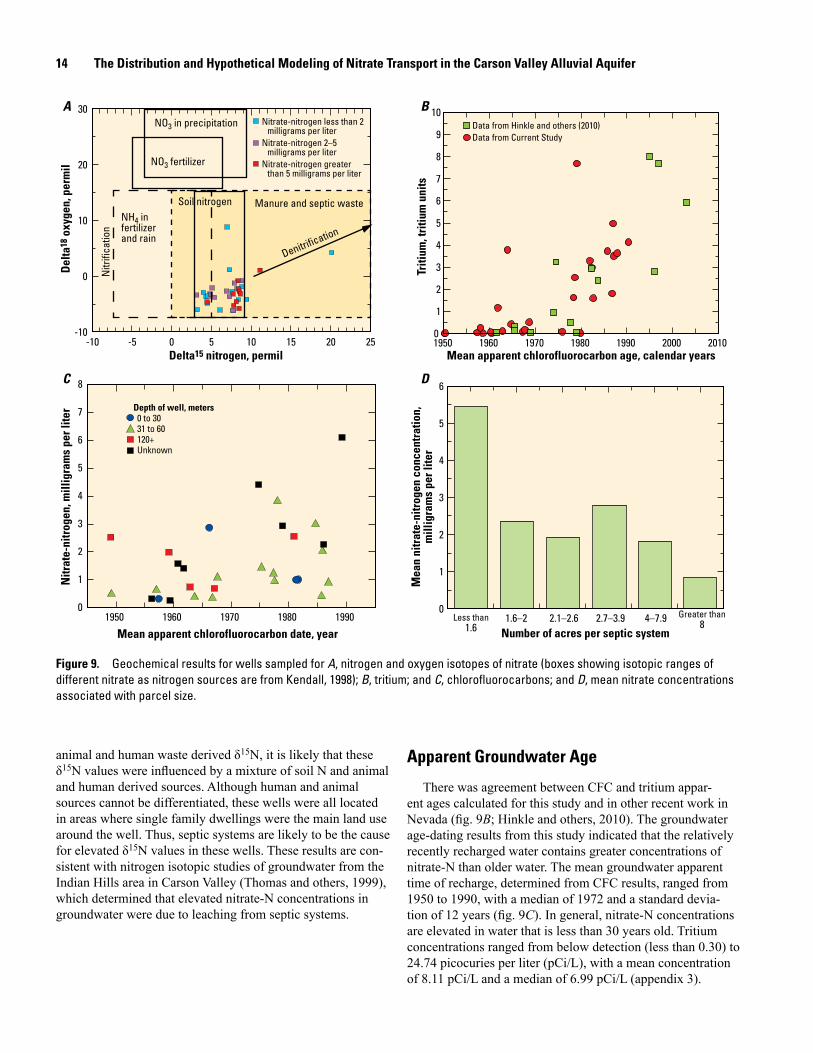
Nitrate-N Sources in Groundwater
The stable isotopes of nitrogen and oxygen in the nitrate molecule can be used to determine sources of nitrate in the water sampled if denitrification processes are minor (Ken-dall, 1998). Different sources of nitrate have characteristic signatures of δ15N and δ18O. A scatterplot of δ15N versus δ18O can indicate the source of nitrate and can also indicate if denitrification is important if the source cannot be determined (fig. 9A). δ15N ranged from 3.15 to 20.13 per mil (‰), and δ18O ranged from −6.19 to 8.8‰ (appendix 2). A total of 34 of the 37 samples (92 percent) analyzed in this study were in the range of either natural soil N or manure and septic-waste-derived nitrogen (fig. 9A). Three samples (8 percent) fell into only the manure and septic-waste range and were outside of the soil N range, but two of those samples were likely affected by denitrification, which is consistent with the low dissolved oxygen and high dissolved nitrogen gas observed for these samples. Samples with δ15N values greater than 7‰ were located in areas with almost twice as many septic systems (82 septic systems) within 1,640 ft of the sampled well than samples less than 7‰ (42 septic systems). In addition, samples with δ15N values greater than 7‰ had average nitrate-N con-centrations two times greater than samples with less than 7‰.
Although most δ15N values overlap between natural soil values and water affected by animal and human waste, if all of the δ15N was derived from soil nitrate, a random pattern of values would be expected. Because δ15N values with nitrate-N concentrations greater than 5 mg/L mostly (all but one mea-surement) plot very close to the boundary between soil N and
Total Dissolved Solids
Site Identifier Well number1
Shipley and Rosen (2005) 2009
N Tau p value Median (mg/L) Trend N Tau p value Median
(mg/L) Trend Change2
390055119421901 18 21 0.5 0.002 273 I Well deepened in 2005390106119424301 19 22 0.39 0.013 272 I 30 0.5 <0.001 274.5 I No390208119433201 20 41 0.7 0.001 286 I 57 0.7 <0.001 302 I No390230119480001 21 10 -0.18 0.53 389 S 25 0.41 0.004 421 I Yes390232119443201 22 40 0.44 0.001 461 I 53 0.56 <0.001 433 I No390446119451401 23 19 0.4 0.017 2970 I 52 0.35 <0.001 3285 I No390457119491301 24 22 0.21 0.172 81 S 30 0.5 <0.001 83 I Yes390503119463501 25 18 -0.31 0.081 161 S Last sample taken in 1997390542119472001 26 21 0.46 0.001 168 I 30 0.51 <0.001 171 I No390622119470301 27 6 0.6 0.133 502.5 S Last sample taken in 1990
1 Well number refers to locations listed in Shipley and Rosen (2005).2 “Yes” indicates a change in trend from Shipley and Rosen (2005) to 2009, and “No” indicates the same trend for Shipley and Rosen (2005) and 2009.3 Samples were below detection limit, so that no trend could be determined.
Table 3. Kendall tau results for Nitrate as nitrogen and total dissolved solids.—Continued
Figure 8. Cumulative frequency of observed nitrate as nitrogen concentrations for Carson Valley, Douglas County, Nevada 1980–2010.
0
0.25
0.5
0.75
1.0
0 5 10 15 20 25
Cum
ulat
ive
freq
uenc
y
Observed nitrate-nitrogen, milligrams per liter
1980–19851986–19901991–19951996–20002001–20052006–2010
14 The Distribution and Hypothetical Modeling of Nitrate Transport in the Carson Valley Alluvial Aquifer
animal and human waste derived δ15N, it is likely that these δ15N values were influenced by a mixture of soil N and animal and human derived sources. Although human and animal sources cannot be differentiated, these wells were all located in areas where single family dwellings were the main land use around the well. Thus, septic systems are likely to be the cause for elevated δ15N values in these wells. These results are con-sistent with nitrogen isotopic studies of groundwater from the Indian Hills area in Carson Valley (Thomas and others, 1999), which determined that elevated nitrate-N concentrations in groundwater were due to leaching from septic systems.
Apparent Groundwater Age
There was agreement between CFC and tritium appar-ent ages calculated for this study and in other recent work in Nevada (fig. 9B; Hinkle and others, 2010). The groundwater age-dating results from this study indicated that the relatively recently recharged water contains greater concentrations of nitrate-N than older water. The mean groundwater apparent time of recharge, determined from CFC results, ranged from 1950 to 1990, with a median of 1972 and a standard devia-tion of 12 years (fig. 9C). In general, nitrate-N concentrations are elevated in water that is less than 30 years old. Tritium concentrations ranged from below detection (less than 0.30) to 24.74 picocuries per liter (pCi/L), with a mean concentration of 8.11 pCi/L and a median of 6.99 pCi/L (appendix 3).
Figure 9. Geochemical results for wells sampled for A, nitrogen and oxygen isotopes of nitrate (boxes showing isotopic ranges of different nitrate as nitrogen sources are from Kendall, 1998); B, tritium; and C, chlorofluorocarbons; and D, mean nitrate concentrations associated with parcel size.
A B
C D
Nitr
ate-
nitr
ogen
, mill
igra
ms
per l
iter
Mea
n ni
trat
e-ni
trog
en c
once
ntra
tion,
mill
igra
ms
per l
iter
0
1
2
3
4
5
6
0
1
2
3
4
5
6
7
8
Mean apparent chlorofluorocarbon date, year Number of acres per septic system
Mean apparent chlorofluorocarbon age, calendar years
1950 1960 1970 1980 1990 Greater than84–7.92.7–3.92.1–2.61.6–2Less than
1.6
Depth of well, meters0 to 3031 to 60120+Unknown
Del
ta18
oxy
gen,
per
mil
Delta15 nitrogen, permil-10 -5 0 5 10 15 20 25
-10
0
10
20
30NO3 in precipitation
NO3 fertilizer
NH4 infertilizerand rain
Nitr
ifica
tion
Soil nitrogen Manure and septic waste
Denitrification
Nitrate-nitrogen less than 2 milligrams per liter
Nitrate-nitrogen 2–5 milligrams per liter
Nitrate-nitrogen greater than 5 milligrams per liter
Triti
um, t
ritiu
m u
nits
0
1
2
3
4
5
6
7
8
9
10
1950 1960 1970 1980 1990 2000 2010
Data from Hinkle and others (2010)Data from Current Study
Nitrogen-N Contribution from Septic Systems 15
The apparent ages of water in the aquifer, calculated from CFC and tritium, were generally between 20 and 40 years and were older than those calculated from the numerical model (see later). The differences in estimated age can be attributed to representing the mean chemical age of water as a mix-ture of water traveling from recharge areas in the mountains (long flow paths) outside of the model boundaries with water recharged from septic tanks and irrigation drainage (short flow paths). Simulated arrival times from the unsaturated-zone model accounted for only the discharge of septic effluent and not the mixing of water from the aquifer. Therefore, the appar-ent ages and the simulated arrival times were only an estimate of different mixtures of water and probably do not reflect the actual age of water in the aquifer.
The mean nitrate-N concentration for wells with high septic system densities (less than 1.6 acres per septic system) within the buffer area was 5.5 mg/L (fig. 9D), which is twice as much as for wells with lower septic system densities (greater than 1.6 acres per septic system). The amount of time a septic system has been in use also could be related to nitrate-N concentrations. Some areas around the valley have high septic-system densities, but low overall nitrate-N concentrations (less than 1.0 mg/L) that could be attributed to the age of the septic system.
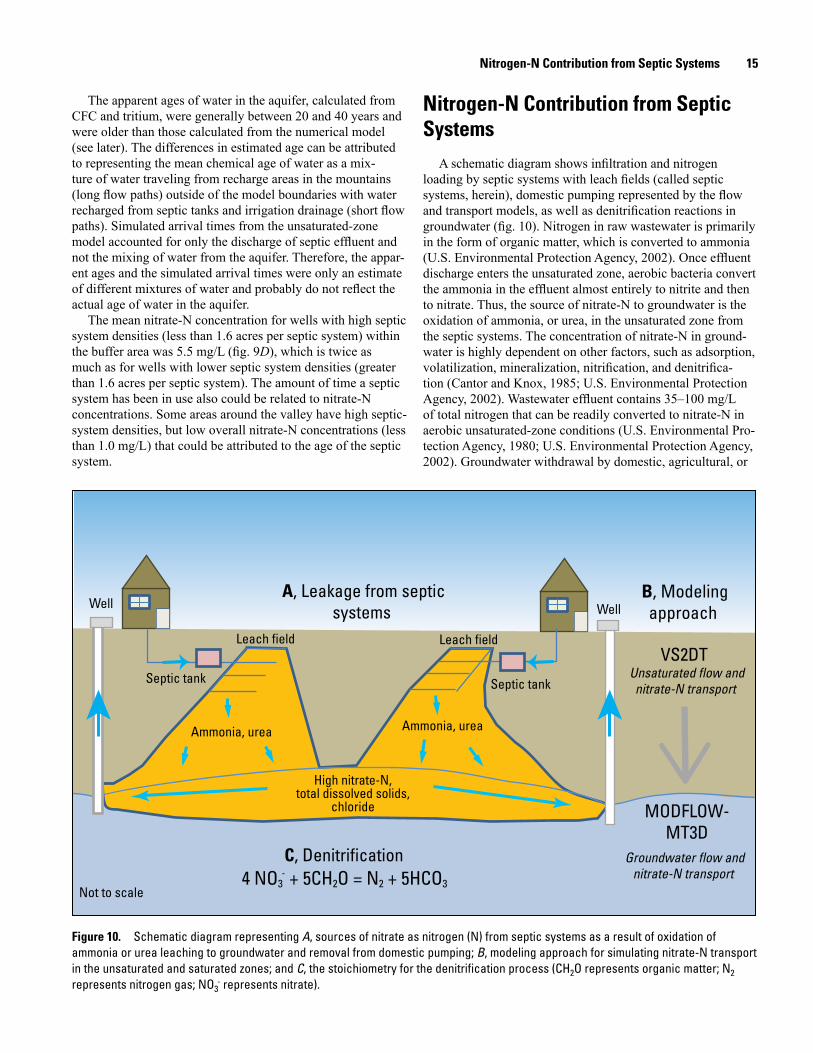
Nitrogen-N Contribution from Septic Systems
A schematic diagram shows infiltration and nitrogen loading by septic systems with leach fields (called septic systems, herein), domestic pumping represented by the flow and transport models, as well as denitrification reactions in groundwater (fig. 10). Nitrogen in raw wastewater is primarily in the form of organic matter, which is converted to ammonia (U.S. Environmental Protection Agency, 2002). Once effluent discharge enters the unsaturated zone, aerobic bacteria convert the ammonia in the effluent almost entirely to nitrite and then to nitrate. Thus, the source of nitrate-N to groundwater is the oxidation of ammonia, or urea, in the unsaturated zone from the septic systems. The concentration of nitrate-N in ground-water is highly dependent on other factors, such as adsorption, volatilization, mineralization, nitrification, and denitrifica-tion (Cantor and Knox, 1985; U.S. Environmental Protection Agency, 2002). Wastewater effluent contains 35–100 mg/L of total nitrogen that can be readily converted to nitrate-N in aerobic unsaturated-zone conditions (U.S. Environmental Pro-tection Agency, 1980; U.S. Environmental Protection Agency, 2002). Groundwater withdrawal by domestic, agricultural, or
Figure 10. Schematic diagram representing A, sources of nitrate as nitrogen (N) from septic systems as a result of oxidation of ammonia or urea leaching to groundwater and removal from domestic pumping; B, modeling approach for simulating nitrate-N transport in the unsaturated and saturated zones; and C, the stoichiometry for the denitrification process (CH2O represents organic matter; N2 represents nitrogen gas; NO3
- represents nitrate).
Septic tank
Well
Leach field
Well
Septic tank
A, Leakage from septicsystems
Leach field
Ammonia, urea
High nitrate-N,total dissolved solids,
chloride
Ammonia, urea
B, Modelingapproach
Unsaturated flow andnitrate-N transport
VS2DT
MODFLOW-MT3D
C, Denitrification 4 NO3
- + 5CH2O = N2 + 5HCO3Not to scale
Groundwater flow andnitrate-N transport
16 The Distribution and Hypothetical Modeling of Nitrate Transport in the Carson Valley Alluvial Aquifer
municipal pumping can affect the transport of the nitrate-N by controlling the groundwater-flow gradient and removing mass. Likewise, nitrate-N can become concentrated in groundwa-ter if the rate of discharge from septic systems increases or groundwater flow is reduced as a result of low permeability aquifer materials. In anaerobic environments, denitrification can remove nitrate-N when an electron donor, such as carbon, is present, but this process usually occurs in the saturated zone and produces nitrogen gas. For the interpretation of the water-quality data, the criteria used for identifying whether denitrification is occurring are low dissolved oxygen and the production of nitrogen gas in groundwater samples.
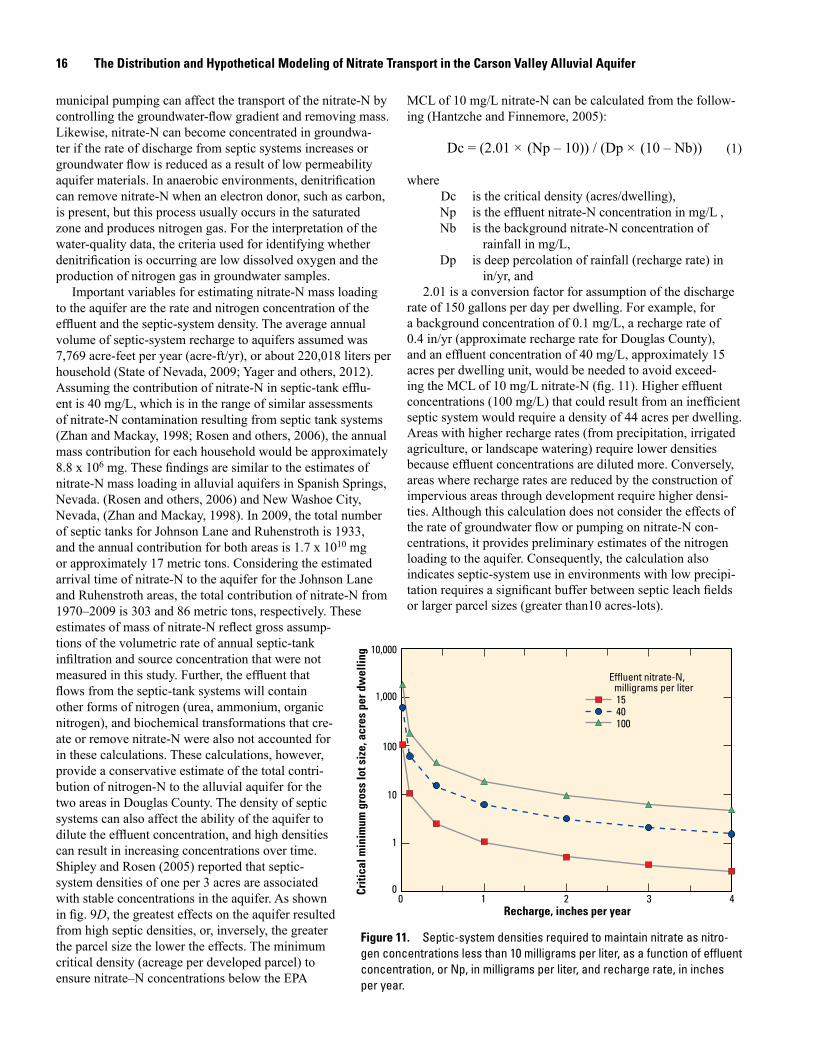
Important variables for estimating nitrate-N mass loading to the aquifer are the rate and nitrogen concentration of the effluent and the septic-system density. The average annual volume of septic-system recharge to aquifers assumed was 7,769 acre-feet per year (acre-ft/yr), or about 220,018 liters per household (State of Nevada, 2009; Yager and others, 2012). Assuming the contribution of nitrate-N in septic-tank efflu-ent is 40 mg/L, which is in the range of similar assessments of nitrate-N contamination resulting from septic tank systems (Zhan and Mackay, 1998; Rosen and others, 2006), the annual mass contribution for each household would be approximately 8.8 x 10⁶ mg. These findings are similar to the estimates of nitrate-N mass loading in alluvial aquifers in Spanish Springs, Nevada. (Rosen and others, 2006) and New Washoe City, Nevada, (Zhan and Mackay, 1998). In 2009, the total number of septic tanks for Johnson Lane and Ruhenstroth is 1933, and the annual contribution for both areas is 1.7 x 10¹⁰ mg or approximately 17 metric tons. Considering the estimated arrival time of nitrate-N to the aquifer for the Johnson Lane and Ruhenstroth areas, the total contribution of nitrate-N from 1970–2009 is 303 and 86 metric tons, respectively. These estimates of mass of nitrate-N reflect gross assump-tions of the volumetric rate of annual septic-tank infiltration and source concentration that were not measured in this study. Further, the effluent that flows from the septic-tank systems will contain other forms of nitrogen (urea, ammonium, organic nitrogen), and biochemical transformations that cre-ate or remove nitrate-N were also not accounted for in these calculations. These calculations, however, provide a conservative estimate of the total contri-bution of nitrogen-N to the alluvial aquifer for the two areas in Douglas County. The density of septic systems can also affect the ability of the aquifer to dilute the effluent concentration, and high densities can result in increasing concentrations over time. Shipley and Rosen (2005) reported that septic-system densities of one per 3 acres are associated with stable concentrations in the aquifer. As shown in fig. 9D, the greatest effects on the aquifer resulted from high septic densities, or, inversely, the greater the parcel size the lower the effects. The minimum critical density (acreage per developed parcel) to ensure nitrate–N concentrations below the EPA
MCL of 10 mg/L nitrate-N can be calculated from the follow-ing (Hantzche and Finnemore, 2005):
Dc = (2.01 × (Np – 10)) / (Dp × (10 – Nb)) (1)
where Dc is the critical density (acres/dwelling), Np is the effluent nitrate-N concentration in mg/L , Nb is the background nitrate-N concentration of
rainfall in mg/L, Dp is deep percolation of rainfall (recharge rate) in
in/yr, and 2.01 is a conversion factor for assumption of the discharge
rate of 150 gallons per day per dwelling. For example, for a background concentration of 0.1 mg/L, a recharge rate of 0.4 in/yr (approximate recharge rate for Douglas County), and an effluent concentration of 40 mg/L, approximately 15 acres per dwelling unit, would be needed to avoid exceed-ing the MCL of 10 mg/L nitrate-N (fig. 11). Higher effluent concentrations (100 mg/L) that could result from an inefficient septic system would require a density of 44 acres per dwelling. Areas with higher recharge rates (from precipitation, irrigated agriculture, or landscape watering) require lower densities because effluent concentrations are diluted more. Conversely, areas where recharge rates are reduced by the construction of impervious areas through development require higher densi-ties. Although this calculation does not consider the effects of the rate of groundwater flow or pumping on nitrate-N con-centrations, it provides preliminary estimates of the nitrogen loading to the aquifer. Consequently, the calculation also indicates septic-system use in environments with low precipi-tation requires a significant buffer between septic leach fields or larger parcel sizes (greater than10 acres-lots).
Figure 11. Septic-system densities required to maintain nitrate as nitro-gen concentrations less than 10 milligrams per liter, as a function of effluent concentration, or Np, in milligrams per liter, and recharge rate, in inches per year.
0 1 2 3 40
1
10
100
1,000
10,000
Criti
cal m
inim
um g
ross
lot s
ize,
acr
es p
er d
wel
ling
Recharge, inches per year
Effluent nitrate-N, milligrams per liter1540100
Groundwater Flow and TransportModel Design 17
Numerical Transport Models The one-dimensional transport of nitrate-N from septic
systems to the shallow aquifer through the unsaturated zone was simulated with VS2DT (Hsieh and others, 2000; Healy and Ronan, 1996), a program that simulates flow and solute transport through variably saturated porous media. Three-dimensional transport of nitrate-N in the shallow aquifer was simulated by using the groundwater-flow model MOD-FLOW-2005 (Harbaugh, 2005) and transport model MT3DMS (Zheng and Wang, 1999) within the graphical user interface MODELMUSE (Winston, 2009). The transport of nitrate-N was simulated from 1970 through 2009 and predicted to 2059, given the pumping from domestic wells and loading of nitrate-N to the aquifer from conditions extrapolated from 2009. The results of the current (2009) and predictive (2059) models served as a basis for comparison to two additional hypothetical transport scenarios: 1) H1 with discontinued use of septic systems in 2030 but allowing continued pumping from domestic supply wells, and 2) H2 with discontinued use of septic systems and termination of domestic well pumpage in 2030. Groundwater recharge and withdrawals from indus-trial, agricultural, and municipal use were assumed to remain constant during 2009–59.
Groundwater Flow and Transport Model Design
A transient, regional groundwater-flow model developed for the Carson Valley (Yager and others, 2013) was used as the basis for the transport model and hypothetical scenarios. The regional flow model was developed to predict potential effects of changes in water use and management for the valley and was calibrated to transient water-table elevations and dis-charge in the Carson River. MODFLOW and MT3D models were constructed for two areas of interest—Johnson Lane and Ruhenstroth (fig. 12)—where groundwater contains nitrate-N concentrations greater than 3.5 mg/L and septic system densities are greater than one septic system per 3 acres. The timing and variation of nitrate-N concentrations in the shallow aquifer are dependent on the distance and arrival time from the septic-tank systems to the water table, the hydraulic properties, and the rate of septic discharge. The arrival time of nitrate-N loading through the unsaturated zone to the aquifer is hereby called the arrival time.
The transport models were used to predict the relative effects of changes to future septic-system usage and domestic pumping on nitrate-N concentrations in two developed areas within Carson Valley. The models are not intended to be exact replications of transport of nitrate-N in the shallow aquifer or to be used to project when concentrations at monitoring wells will exceed or not exceed the MCL because insufficient data are available to adequately describe the distribution and movement of nitrate-N in these areas. The models provide a reasonable approximation of transport, within the constraints
and limitations of available data, and can be used to simulate the overall behavior of nitrate-N transport, given the future reduction of loading from septic-tank systems and domestic pumping stresses. A sensitivity analysis was used to quantify the effect of hydraulic and transport parameters on simulated nitrate-N concentrations in 2009.
Nitrate-N Transport in the Unsaturated ZoneTransport of nitrate-N through the unsaturated zone was
determined by using a VS2DT model constructed to simu-late leakage from a septic system to the shallow aquifer. The arrival time to the water table was estimated from VS2DT results and later used to account for the delay between the infiltration of nitrate-N in septic discharge and the arrival at the water table in the MODFLOW/MT3D models. The unsatu-rated zone was represented in the VS2DT model as homoge-neous and isotropic media, so the soil properties did not vary with depth. A characteristic curve for soil that relates unsatu-rated hydraulic conductivity to the degree of saturation within VS2DT for a sandy loam and medium sand textures (Hsiesh and others, 2000), which represent low to moderate infiltra-tion rates, was initially used to determine the range in arrival times to the aquifer. Based on initial simulations, a medium sand texture better represented the nitrate-N concentrations observed in the wells sampled in 2008–09. Therefore, the soil properties saturated hydraulic conductivity, porosity, and dispersivity were specified as 55 feet per hour (ft/hr), 0.375, and 32 ft, respectively, to represent medium sand texture in the unsaturated zone.
The model grid for the VS2DT simulation was speci-fied with 1,000 rows that were each 0.32 ft thick. The over-all dimension of the model was 131 ft by 328 ft; however, transport was assumed to be only in the vertical downward direction. The septic-system leach field was defined as an area of 1,200 square feet (ft2), assuming a leach field of two 75-ft trenches with an area of 16 ft2 required for a 4-bedroom house and a 1,200-gallon septic tank, as specified in the Doug-las County Building Division Septic Application (Douglas County, 2006). A constant flux of approximately 6.5 ft/yr (Maurer and Berger, 2006; Yager and others, 2012), which was the sum of natural recharge from precipitation (0.035 ft/yr) and leakage from the septic system (6.47 ft/yr), was applied at the top boundary. The septic-system leakage was assumed to contain nitrate-N at a concentration of 40 mg/L—the median nitrate-N concentration (n = 96) obtained from lysimeter data beneath septic leach fields in Spanish Springs, Nevada, (Rosen and others, 2006). Initial concentration within the model was assumed to be 0.0 mg/L, and the bottom boundary was represented as the water table with a specified pressured head of 0.0 ft.
Solute breakthrough curves were analyzed to determine the mean arrival time at various depths within the model bound-ary. Five grid cells, at depths of 24, 68, 162, 252, and 322-ft, were analyzed within the model domain to estimate the mean arrival time and to develop a regression equation to be applied to the Johnson Lane and Ruhenstroth areas (fig. 13).
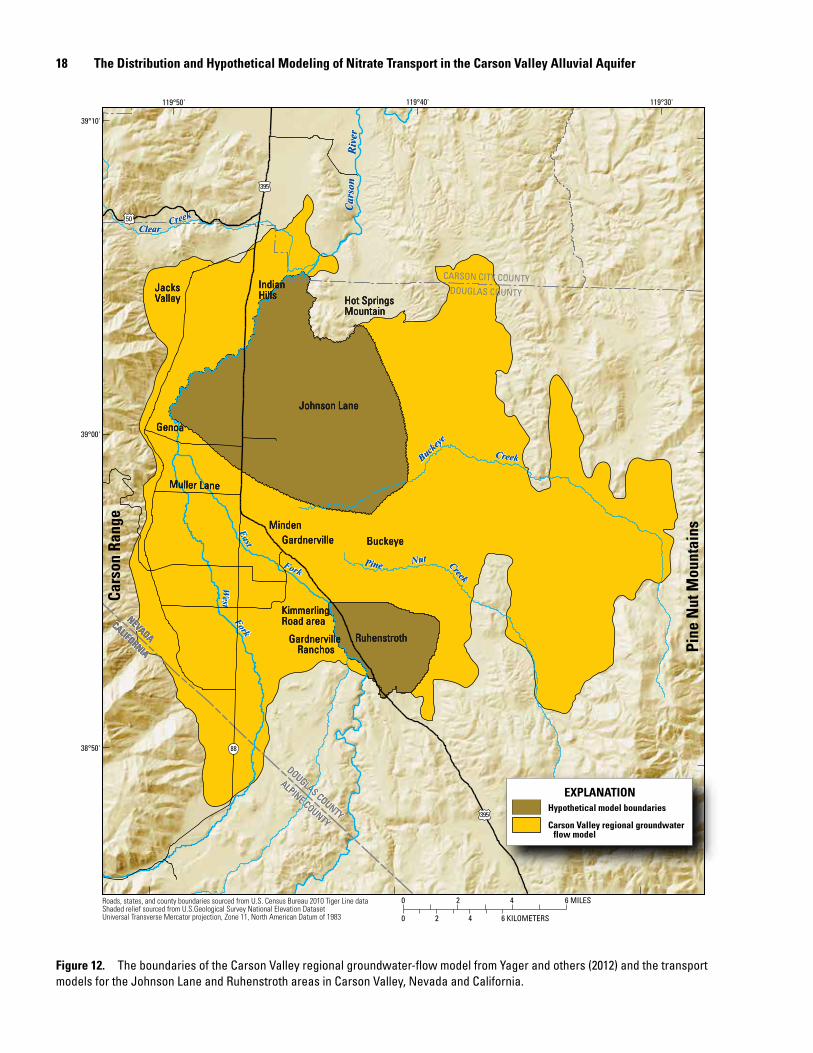
18 The Distribution and Hypothetical Modeling of Nitrate Transport in the Carson Valley Alluvial Aquifer
Figure 12. The boundaries of the Carson Valley regional groundwater-flow model from Yager and others (2012) and the transport models for the Johnson Lane and Ruhenstroth areas in Carson Valley, Nevada and California.
CARSON CITY COUNTYDOUGLAS COUNTY
NEVADACALIFORNIA
NEVADACALIFORNIA
DOUGLAS COUNTY
ALPINE COUNTY
DOUGLAS COUNTY
ALPINE COUNTY
Car
son
Car
son
Riv
erR
iver
EastEast
West
West
ForkFork
ForkFork
Buckeye
Buckeye
CreekCreek
CreekCreek
PinePine
ClearClearCreekCreek
NutNut
88
395
395
50
6 MILES2 40
6 KILOMETERS2 40
Roads, states, and county boundaries sourced from U.S. Census Bureau 2010 Tiger Line dataShaded relief sourced from U.S.Geological Survey National Elevation Dataset Universal Transverse Mercator projection, Zone 11, North American Datum of 1983
119°40' 119°30'119°50'
39°10'
39°00'
38°50'
Cars
on R
ange
Pine
Nut
Mou
ntai
nsMindenMindenMindenGardnervilleGardnervilleGardnerville
Johnson LaneJohnson LaneJohnson Lane
RuhenstrothRuhenstrothRuhenstroth
GenoaGenoaGenoa
Kimmerling Road areaKimmerling Road areaKimmerling Road area
Hot Springs MountainHot Springs MountainHot Springs Mountain
Indian HillsIndian HillsIndian Hills
Jacks ValleyJacks ValleyJacks Valley
BuckeyeBuckeyeBuckeye
Muller LaneMuller LaneMuller Lane
Gardnerville Ranchos
Gardnerville Ranchos
Gardnerville Ranchos
EXPLANATIONHypothetical model boundaries
Carson Valley regional groundwater flow model
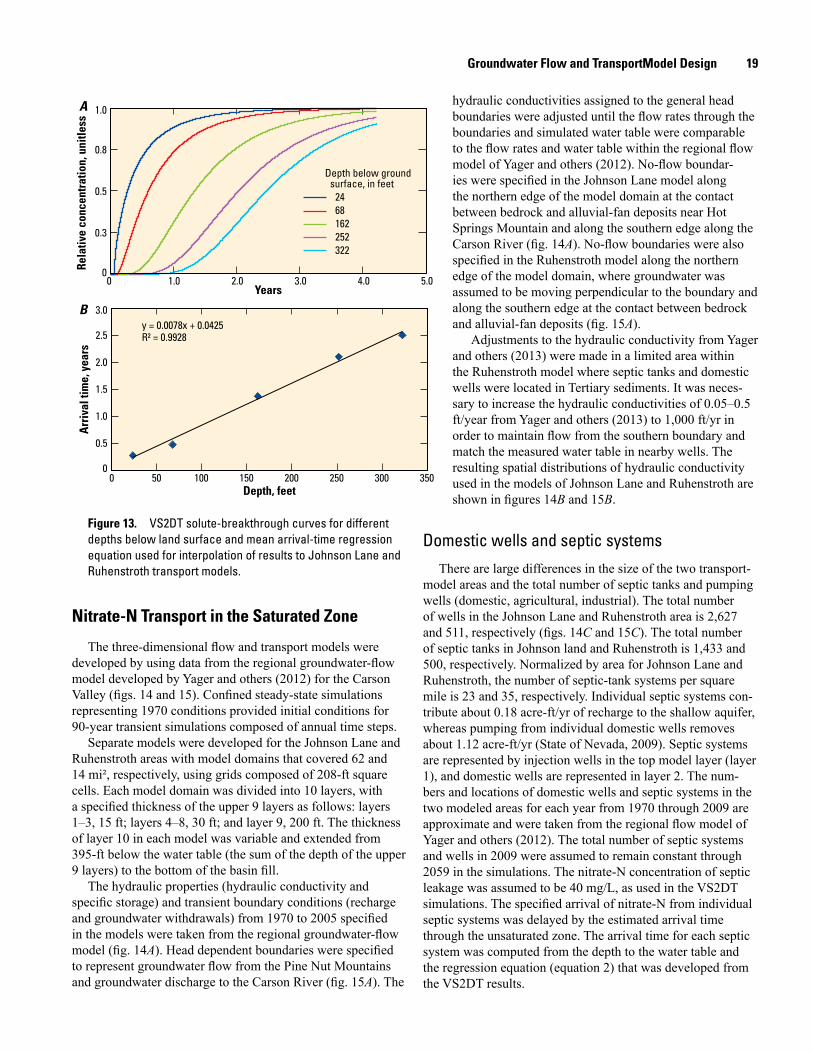
Groundwater Flow and TransportModel Design 19
A
B
Arr
ival
tim
e, y
ears
Depth, feet
Rela
tive
conc
entr
atio
n, u
nitle
ss
Years
y = 0.0078x + 0.0425R² = 0.9928
0 50 100 150 200 250 300 350
0 1.0 2.0 3.0 4.0 5.0
0
0.5
1.0
1.5
2.0
2.5
3.0
0
0.3
0.5
0.8
1.0
Depth below ground surface, in feet
2468162252322
Nitrate-N Transport in the Saturated Zone
The three-dimensional flow and transport models were developed by using data from the regional groundwater-flow model developed by Yager and others (2012) for the Carson Valley (figs. 14 and 15). Confined steady-state simulations representing 1970 conditions provided initial conditions for 90-year transient simulations composed of annual time steps.
Separate models were developed for the Johnson Lane and Ruhenstroth areas with model domains that covered 62 and 14 mi², respectively, using grids composed of 208-ft square cells. Each model domain was divided into 10 layers, with a specified thickness of the upper 9 layers as follows: layers 1–3, 15 ft; layers 4–8, 30 ft; and layer 9, 200 ft. The thickness of layer 10 in each model was variable and extended from 395-ft below the water table (the sum of the depth of the upper 9 layers) to the bottom of the basin fill.
The hydraulic properties (hydraulic conductivity and specific storage) and transient boundary conditions (recharge and groundwater withdrawals) from 1970 to 2005 specified in the models were taken from the regional groundwater-flow model (fig. 14A). Head dependent boundaries were specified to represent groundwater flow from the Pine Nut Mountains and groundwater discharge to the Carson River (fig. 15A). The
hydraulic conductivities assigned to the general head boundaries were adjusted until the flow rates through the boundaries and simulated water table were comparable to the flow rates and water table within the regional flow model of Yager and others (2012). No-flow boundar-ies were specified in the Johnson Lane model along the northern edge of the model domain at the contact between bedrock and alluvial-fan deposits near Hot Springs Mountain and along the southern edge along the Carson River (fig. 14A). No-flow boundaries were also specified in the Ruhenstroth model along the northern edge of the model domain, where groundwater was assumed to be moving perpendicular to the boundary and along the southern edge at the contact between bedrock and alluvial-fan deposits (fig. 15A).
Adjustments to the hydraulic conductivity from Yager and others (2013) were made in a limited area within the Ruhenstroth model where septic tanks and domestic wells were located in Tertiary sediments. It was neces-sary to increase the hydraulic conductivities of 0.05–0.5 ft/year from Yager and others (2013) to 1,000 ft/yr in order to maintain flow from the southern boundary and match the measured water table in nearby wells. The resulting spatial distributions of hydraulic conductivity used in the models of Johnson Lane and Ruhenstroth are shown in figures 14B and 15B.
Domestic wells and septic systemsThere are large differences in the size of the two transport-
model areas and the total number of septic tanks and pumping wells (domestic, agricultural, industrial). The total number of wells in the Johnson Lane and Ruhenstroth area is 2,627 and 511, respectively (figs. 14C and 15C). The total number of septic tanks in Johnson land and Ruhenstroth is 1,433 and 500, respectively. Normalized by area for Johnson Lane and Ruhenstroth, the number of septic-tank systems per square mile is 23 and 35, respectively. Individual septic systems con-tribute about 0.18 acre-ft/yr of recharge to the shallow aquifer, whereas pumping from individual domestic wells removes about 1.12 acre-ft/yr (State of Nevada, 2009). Septic systems are represented by injection wells in the top model layer (layer 1), and domestic wells are represented in layer 2. The num-bers and locations of domestic wells and septic systems in the two modeled areas for each year from 1970 through 2009 are approximate and were taken from the regional flow model of Yager and others (2012). The total number of septic systems and wells in 2009 were assumed to remain constant through 2059 in the simulations. The nitrate-N concentration of septic leakage was assumed to be 40 mg/L, as used in the VS2DT simulations. The specified arrival of nitrate-N from individual septic systems was delayed by the estimated arrival time through the unsaturated zone. The arrival time for each septic system was computed from the depth to the water table and the regression equation (equation 2) that was developed from the VS2DT results.
Figure 13. VS2DT solute-breakthrough curves for different depths below land surface and mean arrival-time regression equation used for interpolation of results to Johnson Lane and Ruhenstroth transport models.
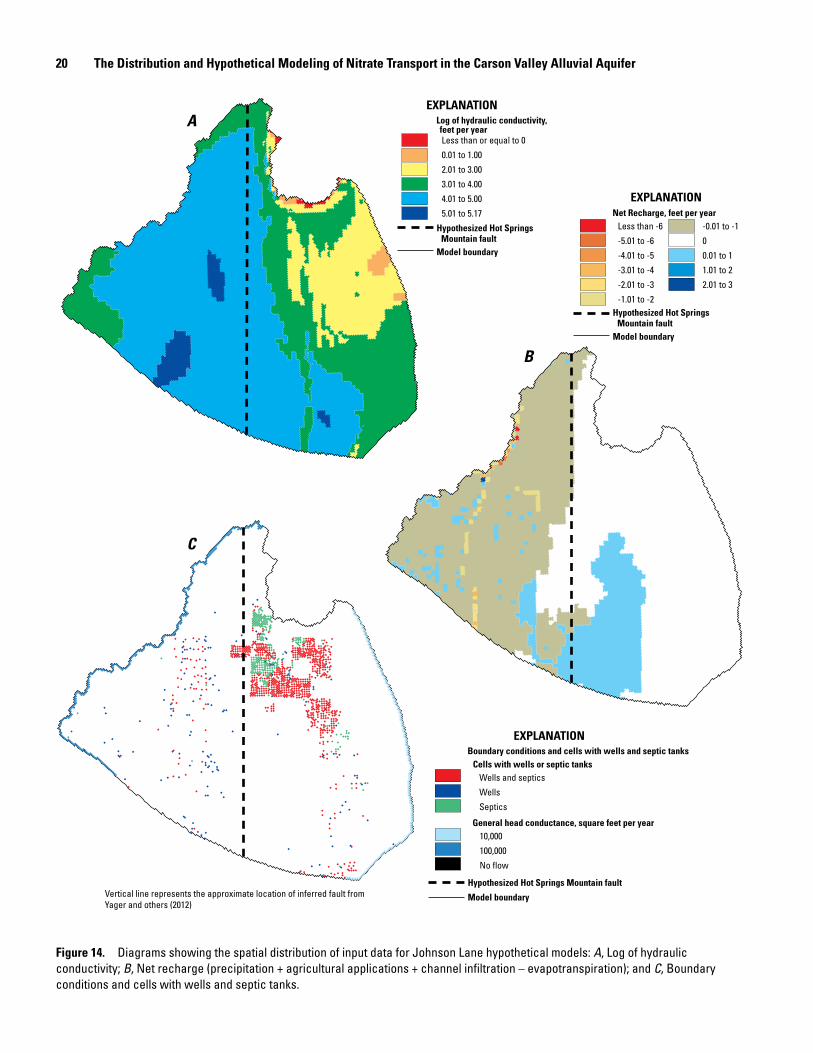
20 The Distribution and Hypothetical Modeling of Nitrate Transport in the Carson Valley Alluvial Aquifer
Figure 14. Diagrams showing the spatial distribution of input data for Johnson Lane hypothetical models: A, Log of hydraulic conductivity; B, Net recharge (precipitation + agricultural applications + channel infiltration – evapotranspiration); and C, Boundary conditions and cells with wells and septic tanks.
B
Net Recharge, feet per yearLess than -6 -0.01 to -1
-5.01 to -6 0
-4.01 to -5 0.01 to 1
-3.01 to -4 1.01 to 2
-2.01 to -3 2.01 to 3
-1.01 to -2Hypothesized Hot Springs
Mountain faultModel boundary
A
C
Log of hydraulic conductivity, feet per yearLess than or equal to 0
0.01 to 1.00
2.01 to 3.00
3.01 to 4.00
4.01 to 5.00
5.01 to 5.17
Hypothesized Hot Springs Mountain fault
Model boundary
EXPLANATION
EXPLANATION
EXPLANATION
Boundary conditions and cells with wells and septic tanksCells with wells or septic tanks
Wells and septics
Wells
Septics
General head conductance, square feet per year10,000
100,000
No flow
Hypothesized Hot Springs Mountain fault
Model boundaryVertical line represents the approximate location of inferred fault from Yager and others (2012)
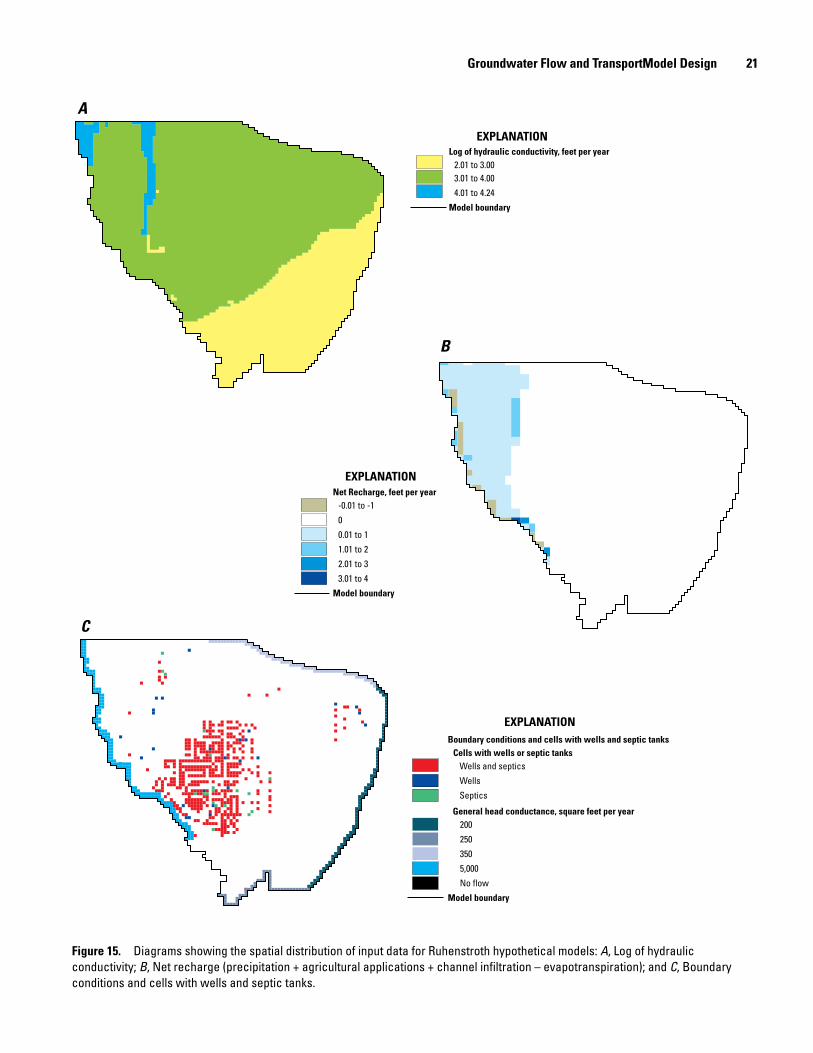
Groundwater Flow and TransportModel Design 21
Figure 15. Diagrams showing the spatial distribution of input data for Ruhenstroth hypothetical models: A, Log of hydraulic conductivity; B, Net recharge (precipitation + agricultural applications + channel infiltration – evapotranspiration); and C, Boundary conditions and cells with wells and septic tanks.
Net Recharge, feet per year-0.01 to -1
0
0.01 to 1
1.01 to 2
2.01 to 3
3.01 to 4
Model boundary
A
C
B
Log of hydraulic conductivity, feet per year2.01 to 3.003.01 to 4.00
4.01 to 4.24
Model boundary
EXPLANATION
EXPLANATION
EXPLANATION
Boundary conditions and cells with wells and septic tanksCells with wells or septic tanks
Wells and septics
Wells
Septics
General head conductance, square feet per year200
250
350
5,000
No flow
Model boundary
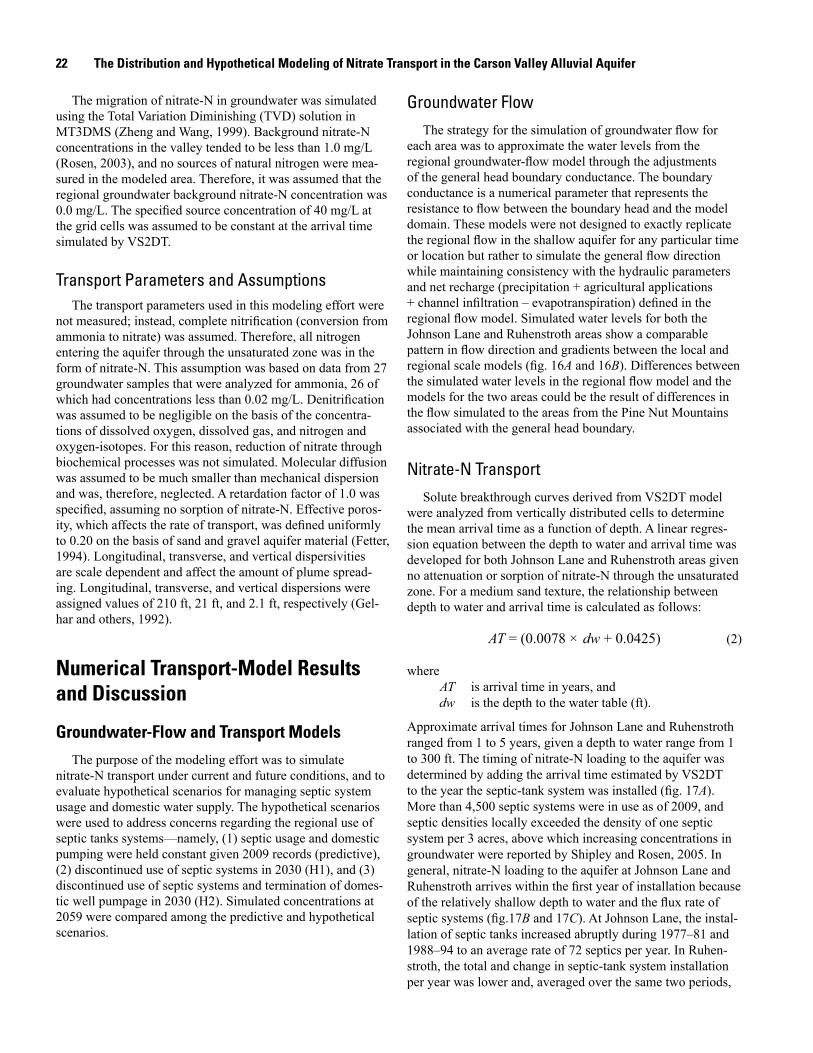
22 The Distribution and Hypothetical Modeling of Nitrate Transport in the Carson Valley Alluvial Aquifer
The migration of nitrate-N in groundwater was simulated using the Total Variation Diminishing (TVD) solution in MT3DMS (Zheng and Wang, 1999). Background nitrate-N concentrations in the valley tended to be less than 1.0 mg/L (Rosen, 2003), and no sources of natural nitrogen were mea-sured in the modeled area. Therefore, it was assumed that the regional groundwater background nitrate-N concentration was 0.0 mg/L. The specified source concentration of 40 mg/L at the grid cells was assumed to be constant at the arrival time simulated by VS2DT.
Transport Parameters and Assumptions The transport parameters used in this modeling effort were
not measured; instead, complete nitrification (conversion from ammonia to nitrate) was assumed. Therefore, all nitrogen entering the aquifer through the unsaturated zone was in the form of nitrate-N. This assumption was based on data from 27 groundwater samples that were analyzed for ammonia, 26 of which had concentrations less than 0.02 mg/L. Denitrification was assumed to be negligible on the basis of the concentra-tions of dissolved oxygen, dissolved gas, and nitrogen and oxygen-isotopes. For this reason, reduction of nitrate through biochemical processes was not simulated. Molecular diffusion was assumed to be much smaller than mechanical dispersion and was, therefore, neglected. A retardation factor of 1.0 was specified, assuming no sorption of nitrate-N. Effective poros-ity, which affects the rate of transport, was defined uniformly to 0.20 on the basis of sand and gravel aquifer material (Fetter, 1994). Longitudinal, transverse, and vertical dispersivities are scale dependent and affect the amount of plume spread-ing. Longitudinal, transverse, and vertical dispersions were assigned values of 210 ft, 21 ft, and 2.1 ft, respectively (Gel-har and others, 1992).
Numerical Transport-Model Results and Discussion
Groundwater-Flow and Transport ModelsThe purpose of the modeling effort was to simulate
nitrate-N transport under current and future conditions, and to evaluate hypothetical scenarios for managing septic system usage and domestic water supply. The hypothetical scenarios were used to address concerns regarding the regional use of septic tanks systems—namely, (1) septic usage and domestic pumping were held constant given 2009 records (predictive), (2) discontinued use of septic systems in 2030 (H1), and (3) discontinued use of septic systems and termination of domes-tic well pumpage in 2030 (H2). Simulated concentrations at 2059 were compared among the predictive and hypothetical scenarios.
Groundwater Flow The strategy for the simulation of groundwater flow for
each area was to approximate the water levels from the regional groundwater-flow model through the adjustments of the general head boundary conductance. The boundary conductance is a numerical parameter that represents the resistance to flow between the boundary head and the model domain. These models were not designed to exactly replicate the regional flow in the shallow aquifer for any particular time or location but rather to simulate the general flow direction while maintaining consistency with the hydraulic parameters and net recharge (precipitation + agricultural applications + channel infiltration – evapotranspiration) defined in the regional flow model. Simulated water levels for both the Johnson Lane and Ruhenstroth areas show a comparable pattern in flow direction and gradients between the local and regional scale models (fig. 16A and 16B). Differences between the simulated water levels in the regional flow model and the models for the two areas could be the result of differences in the flow simulated to the areas from the Pine Nut Mountains associated with the general head boundary.
Nitrate-N Transport Solute breakthrough curves derived from VS2DT model
were analyzed from vertically distributed cells to determine the mean arrival time as a function of depth. A linear regres-sion equation between the depth to water and arrival time was developed for both Johnson Lane and Ruhenstroth areas given no attenuation or sorption of nitrate-N through the unsaturated zone. For a medium sand texture, the relationship between depth to water and arrival time is calculated as follows:
AT = (0.0078 × dw + 0.0425) (2)
where AT is arrival time in years, and dw is the depth to the water table (ft).
Approximate arrival times for Johnson Lane and Ruhenstroth ranged from 1 to 5 years, given a depth to water range from 1 to 300 ft. The timing of nitrate-N loading to the aquifer was determined by adding the arrival time estimated by VS2DT to the year the septic-tank system was installed (fig. 17A). More than 4,500 septic systems were in use as of 2009, and septic densities locally exceeded the density of one septic system per 3 acres, above which increasing concentrations in groundwater were reported by Shipley and Rosen, 2005. In general, nitrate-N loading to the aquifer at Johnson Lane and Ruhenstroth arrives within the first year of installation because of the relatively shallow depth to water and the flux rate of septic systems (fig.17B and 17C). At Johnson Lane, the instal-lation of septic tanks increased abruptly during 1977–81 and 1988–94 to an average rate of 72 septics per year. In Ruhen-stroth, the total and change in septic-tank system installation per year was lower and, averaged over the same two periods,
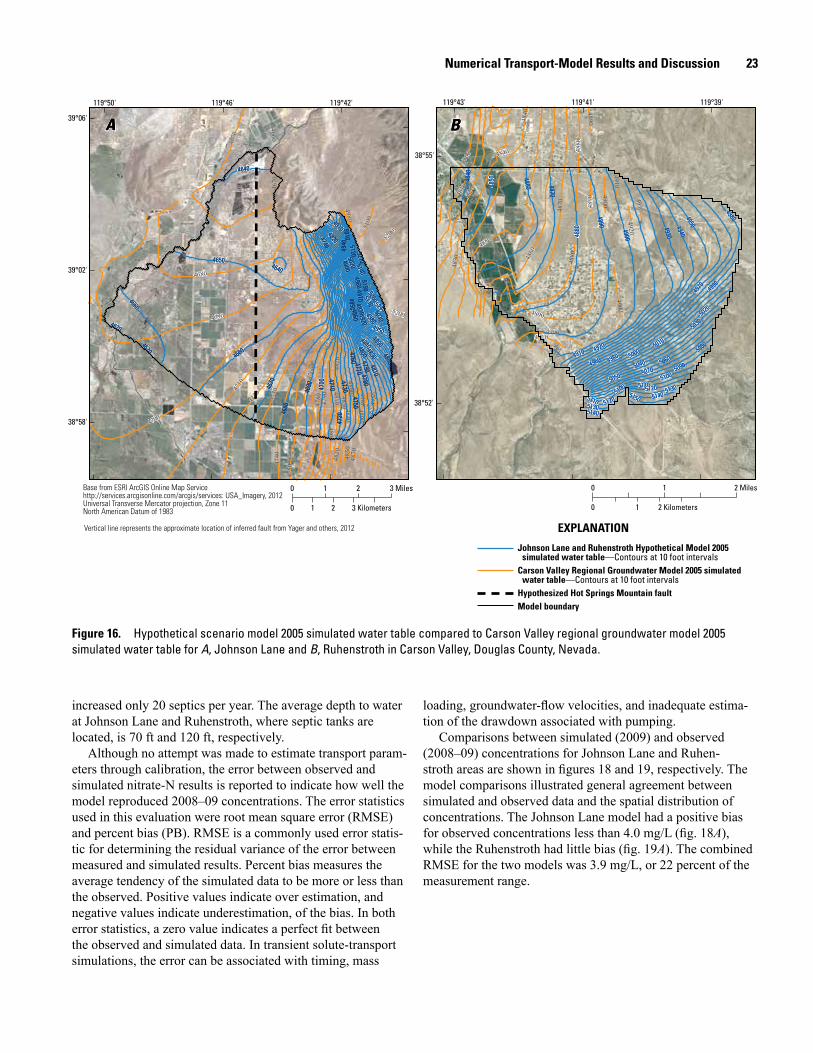
Numerical Transport-Model Results and Discussion 23
increased only 20 septics per year. The average depth to water at Johnson Lane and Ruhenstroth, where septic tanks are located, is 70 ft and 120 ft, respectively.
Although no attempt was made to estimate transport param-eters through calibration, the error between observed and simulated nitrate-N results is reported to indicate how well the model reproduced 2008–09 concentrations. The error statistics used in this evaluation were root mean square error (RMSE) and percent bias (PB). RMSE is a commonly used error statis-tic for determining the residual variance of the error between measured and simulated results. Percent bias measures the average tendency of the simulated data to be more or less than the observed. Positive values indicate over estimation, and negative values indicate underestimation, of the bias. In both error statistics, a zero value indicates a perfect fit between the observed and simulated data. In transient solute-transport simulations, the error can be associated with timing, mass
loading, groundwater-flow velocities, and inadequate estima-tion of the drawdown associated with pumping.
Comparisons between simulated (2009) and observed (2008–09) concentrations for Johnson Lane and Ruhen-stroth areas are shown in figures 18 and 19, respectively. The model comparisons illustrated general agreement between simulated and observed data and the spatial distribution of concentrations. The Johnson Lane model had a positive bias for observed concentrations less than 4.0 mg/L (fig. 18A), while the Ruhenstroth had little bias (fig. 19A). The combined RMSE for the two models was 3.9 mg/L, or 22 percent of the measurement range.
4870
4870
4860
4860
4840
4840
48504850
4830
4830
4820
48204810
4810
4800
4800
4880
4880
48904890
4900490049104910
49204920
49304930
48404840
49004900
48904890
49004900
4880
4880
4890
4890
49104910
49204920
47004700
4710
4710
4720
4720 4730
4730
4740
4740
4750
4750
4760
4760
4770
4770
4780
4780
4690469047
9047
90
48004800
48104810
46804680
4670
4670
4820
4820
48304830 4840
484048604860
48904890
4910
4910
49304930
46604660
5200
5200
49804980
4820
4820
4780
4780
49304930
47404740
48004800
4850
4850
4950
4950
5100
5100
47604760
47504750
52005200
4670
4670
47304730
4870
4870
47704770
47504750
47304730
47404740
4720
4720
47604760
4710471047
0047
00
4690
4690
47704770
4680
4680
47804780
47904790
48004800
4670
4670
48104810
48204820
46604660 4830
4830
48404840
48504850 4860
4860
48904890
49204920
49104910
49004900
49304930
4940
4940
49504950
49604960
49704970
49804980
46504650
48804880
50105010
50205020
50305030
51105110
51205120
51405140
51505150
46404640
52405240
52605260
52705270
46704670
46604660
46704670
46404640
49804980
4970
4970
49604960
495049504940
4940
4990
4990
49104910 49204920
49304930
49004900
5000500050105010
5020
5020
48904890
5030
5030
4880
4880
50405040
50505050
50605060
48704870
50705070
50805080
50905090
4860486048
5048
50
5100510051105110
5120512051305130
4840
4840
5140514051505150
49804980
51005100
51405140
5110511051305130
51205120
AA BB
119°42'119°46'119°50'
39°02'
38°58'
39°06'
EXPLANATION
Base from ESRI ArcGIS Online Map Servicehttp://services.arcgisonline.com/arcgis/services: USA_Imagery, 2012Universal Transverse Mercator projection, Zone 11North American Datum of 1983
0 2 Miles1
0 2 Kilometers1
0 2 3 Miles1
0 2 3 Kilometers1
119°39'119°41'119°43'
38°55'
38°52'
Johnson Lane and Ruhenstroth Hypothetical Model 2005 simulated water table—Contours at 10 foot intervals
Carson Valley Regional Groundwater Model 2005 simulated water table—Contours at 10 foot intervals
Hypothesized Hot Springs Mountain faultModel boundary
Vertical line represents the approximate location of inferred fault from Yager and others, 2012
Figure 16. Hypothetical scenario model 2005 simulated water table compared to Carson Valley regional groundwater model 2005 simulated water table for A, Johnson Lane and B, Ruhenstroth in Carson Valley, Douglas County, Nevada.
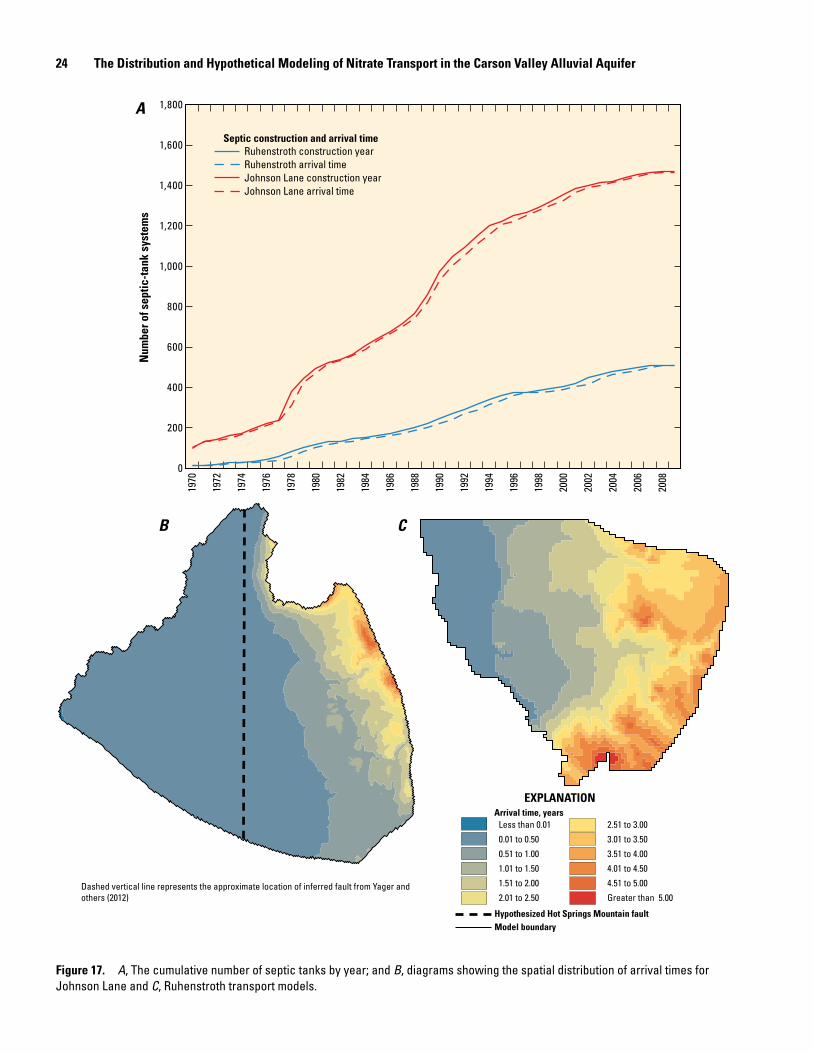
24 The Distribution and Hypothetical Modeling of Nitrate Transport in the Carson Valley Alluvial Aquifer
Figure 17. A, The cumulative number of septic tanks by year; and B, diagrams showing the spatial distribution of arrival times for Johnson Lane and C, Ruhenstroth transport models.
Arrival time, yearsLess than 0.01 2.51 to 3.00
0.01 to 0.50 3.01 to 3.50
0.51 to 1.00 3.51 to 4.00
1.01 to 1.50 4.01 to 4.50
1.51 to 2.00 4.51 to 5.00
2.01 to 2.50 Greater than 5.00
Hypothesized Hot Springs Mountain faultModel boundary
A
CB
EXPLANATION
1970
1972
1974
1976
1978
1980
1982
1984
1986
1988
1990
1992
1994
1996
1998
2000
2002
2004
2006
2008
0
200
400
600
800
1,000
1,200
1,400
1,600
1,800
Num
ber o
f sep
tic-t
ank
syst
ems
Septic construction and arrival timeRuhenstroth construction yearRuhenstroth arrival timeJohnson Lane construction yearJohnson Lane arrival time
Dashed vertical line represents the approximate location of inferred fault from Yager and others (2012)
Numerical Transport-Model Results and Discussion 25
Figure 18. Observed 2008–09 compared to simulated 2009 nitrate as nitrogen (N) concentrations for the Johnson Lane model 2009 time-step: A, Observed compared to simulated; B, Observed compared to simulated at observation cells and all cells; and C, Map depicting spatial distribution of nitrate-N 2009 time step with observed nitrate-N concentrations for 2008–09.
C
BAJohnson Lane1:1
0 2.0 4.0 6.0 8.0 10.0 12.0 14.0 16.0 18.0 20.00
2.0
4.0
6.0
8.0
10.0
12.0
14.0
16.0
18.0
20.0
Sim
ulat
ed n
itrat
e-ni
trog
en,
mill
igra
ms
per l
iter
Observed nitrate-nitrogen, milligrams per liter
Observed 2008–09Simulated 2009 concentrations at
sampled wellsSimulated 2009 concentrations
within nitrate-nitrogen bearing water
0 5 10 15 20 250
0.25
0.5
0.75
1
Cum
ulat
ive
freq
uenc
y
Nitrate-nitrogen, milligrams per liter
Base from ESRI ArcGIS Online Map Servicehttp://services.arcgisonline.com/arcgis/services: USA_Imagery, 2012Universal Transverse Mercator projection, Zone 11 NorthNorth American Datum of 1983
0 2 4 Miles1
0 2
3
3 4 Kilometers1
119°38'119°52'
39°05'
38°58'
Simulated concentrations, 2009 nitrogen, milligrams per liter
0.01 to 1Greater than 1 to 5Greater than 5 to 10Greater than 10Hypothesized Hot Springs Mountain
faultModel boundaryObserved concentrations, 2008–09
nitrogen, milligrams per literLess than 1 1 to less than 55 to less than 10 10 or greater
EXPLANATION
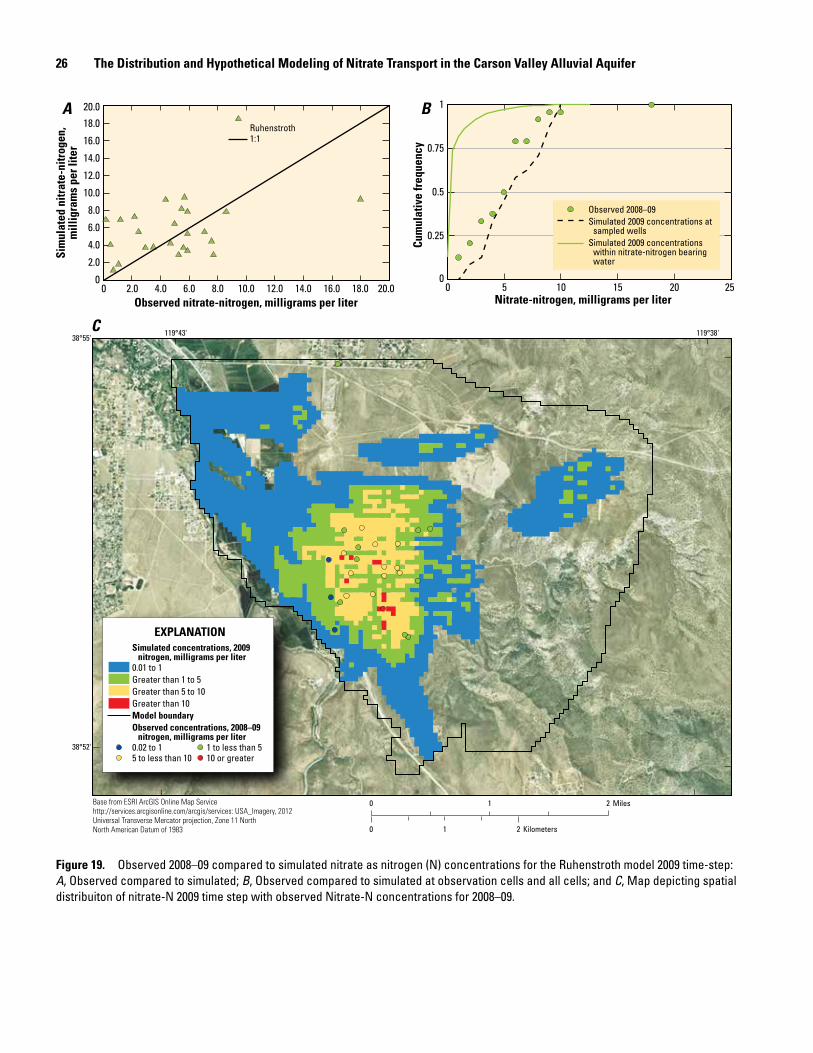
26 The Distribution and Hypothetical Modeling of Nitrate Transport in the Carson Valley Alluvial Aquifer
Figure 19. Observed 2008–09 compared to simulated nitrate as nitrogen (N) concentrations for the Ruhenstroth model 2009 time-step: A, Observed compared to simulated; B, Observed compared to simulated at observation cells and all cells; and C, Map depicting spatial distribuiton of nitrate-N 2009 time step with observed Nitrate-N concentrations for 2008–09.
BARuhenstroth1:1
0 2.0 4.0 6.0 8.0 10.0 12.0 14.0 16.0 18.0 20.00
2.0
4.0
6.0
8.0
10.0
12.0
14.0
16.0
18.0
20.0
Sim
ulat
ed n
itrat
e-ni
trog
en,
mill
igra
ms
per l
iter
Observed nitrate-nitrogen, milligrams per liter
Observed 2008–09Simulated 2009 concentrations at
sampled wellsSimulated 2009 concentrations
within nitrate-nitrogen bearing water
0 5 10 15 20 250
0.25
0.5
0.75
1
Cum
ulat
ive
freq
uenc
y
Nitrate-nitrogen, milligrams per liter
Base from ESRI ArcGIS Online Map Servicehttp://services.arcgisonline.com/arcgis/services: USA_Imagery, 2012Universal Transverse Mercator projection, Zone 11 NorthNorth American Datum of 1983
C 119°38'119°43'38°55'
38°52'
0 21 Miles
0 21 Kilometers
Simulated concentrations, 2009 nitrogen, milligrams per liter
0.01 to 1Greater than 1 to 5Greater than 5 to 10Greater than 10Model boundaryObserved concentrations, 2008–09
nitrogen, milligrams per liter0.02 to 1 1 to less than 55 to less than 10 10 or greater
EXPLANATION
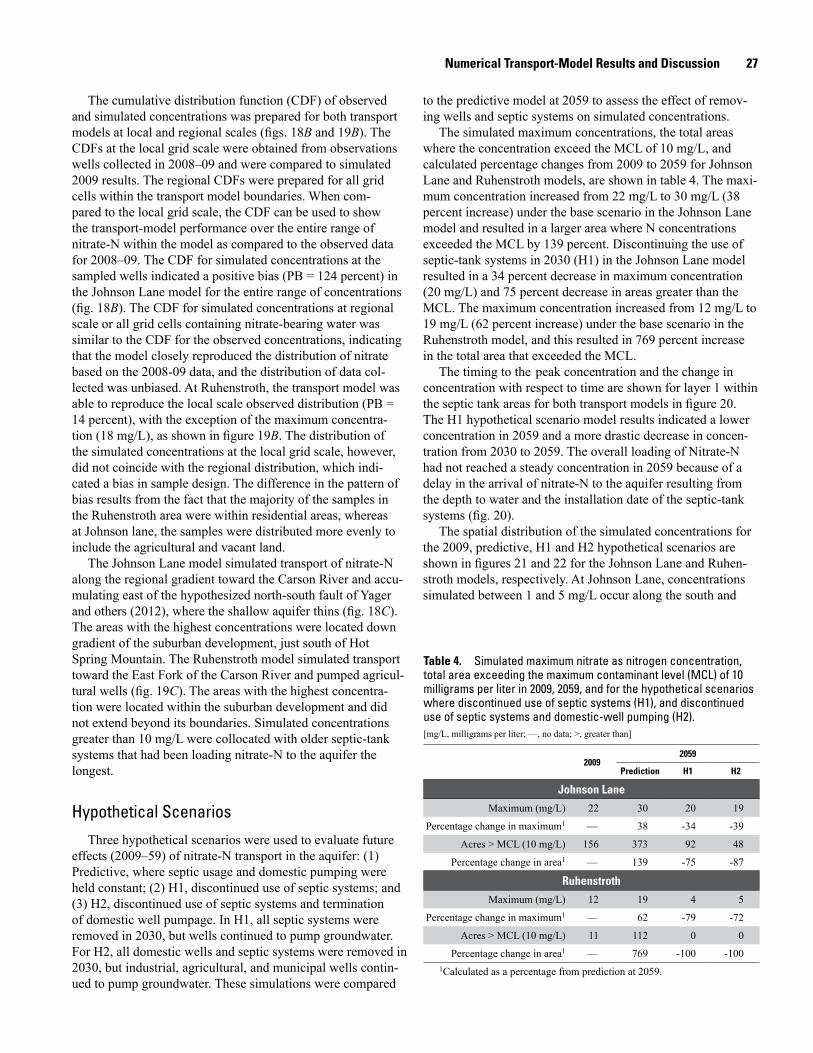
Numerical Transport-Model Results and Discussion 27
The cumulative distribution function (CDF) of observed and simulated concentrations was prepared for both transport models at local and regional scales (figs. 18B and 19B). The CDFs at the local grid scale were obtained from observations wells collected in 2008–09 and were compared to simulated 2009 results. The regional CDFs were prepared for all grid cells within the transport model boundaries. When com-pared to the local grid scale, the CDF can be used to show the transport-model performance over the entire range of nitrate-N within the model as compared to the observed data for 2008–09. The CDF for simulated concentrations at the sampled wells indicated a positive bias (PB = 124 percent) in the Johnson Lane model for the entire range of concentrations (fig. 18B). The CDF for simulated concentrations at regional scale or all grid cells containing nitrate-bearing water was similar to the CDF for the observed concentrations, indicating that the model closely reproduced the distribution of nitrate based on the 2008-09 data, and the distribution of data col-lected was unbiased. At Ruhenstroth, the transport model was able to reproduce the local scale observed distribution (PB = 14 percent), with the exception of the maximum concentra-tion (18 mg/L), as shown in figure 19B. The distribution of the simulated concentrations at the local grid scale, however, did not coincide with the regional distribution, which indi-cated a bias in sample design. The difference in the pattern of bias results from the fact that the majority of the samples in the Ruhenstroth area were within residential areas, whereas at Johnson lane, the samples were distributed more evenly to include the agricultural and vacant land.
The Johnson Lane model simulated transport of nitrate-N along the regional gradient toward the Carson River and accu-mulating east of the hypothesized north-south fault of Yager and others (2012), where the shallow aquifer thins (fig. 18C). The areas with the highest concentrations were located down gradient of the suburban development, just south of Hot Spring Mountain. The Ruhenstroth model simulated transport toward the East Fork of the Carson River and pumped agricul-tural wells (fig. 19C). The areas with the highest concentra-tion were located within the suburban development and did not extend beyond its boundaries. Simulated concentrations greater than 10 mg/L were collocated with older septic-tank systems that had been loading nitrate-N to the aquifer the longest.
Hypothetical ScenariosThree hypothetical scenarios were used to evaluate future
effects (2009–59) of nitrate-N transport in the aquifer: (1) Predictive, where septic usage and domestic pumping were held constant; (2) H1, discontinued use of septic systems; and (3) H2, discontinued use of septic systems and termination of domestic well pumpage. In H1, all septic systems were removed in 2030, but wells continued to pump groundwater. For H2, all domestic wells and septic systems were removed in 2030, but industrial, agricultural, and municipal wells contin-ued to pump groundwater. These simulations were compared
to the predictive model at 2059 to assess the effect of remov-ing wells and septic systems on simulated concentrations.
The simulated maximum concentrations, the total areas where the concentration exceed the MCL of 10 mg/L, and calculated percentage changes from 2009 to 2059 for Johnson Lane and Ruhenstroth models, are shown in table 4. The maxi-mum concentration increased from 22 mg/L to 30 mg/L (38 percent increase) under the base scenario in the Johnson Lane model and resulted in a larger area where N concentrations exceeded the MCL by 139 percent. Discontinuing the use of septic-tank systems in 2030 (H1) in the Johnson Lane model resulted in a 34 percent decrease in maximum concentration (20 mg/L) and 75 percent decrease in areas greater than the MCL. The maximum concentration increased from 12 mg/L to 19 mg/L (62 percent increase) under the base scenario in the Ruhenstroth model, and this resulted in 769 percent increase in the total area that exceeded the MCL.
The timing to the peak concentration and the change in concentration with respect to time are shown for layer 1 within the septic tank areas for both transport models in figure 20. The H1 hypothetical scenario model results indicated a lower concentration in 2059 and a more drastic decrease in concen-tration from 2030 to 2059. The overall loading of Nitrate-N had not reached a steady concentration in 2059 because of a delay in the arrival of nitrate-N to the aquifer resulting from the depth to water and the installation date of the septic-tank systems (fig. 20).
The spatial distribution of the simulated concentrations for the 2009, predictive, H1 and H2 hypothetical scenarios are shown in figures 21 and 22 for the Johnson Lane and Ruhen-stroth models, respectively. At Johnson Lane, concentrations simulated between 1 and 5 mg/L occur along the south and
Table 4. Simulated maximum nitrate as nitrogen concentration, total area exceeding the maximum contaminant level (MCL) of 10 milligrams per liter in 2009, 2059, and for the hypothetical scenarios where discontinued use of septic systems (H1), and discontinued use of septic systems and domestic-well pumping (H2). [mg/L, milligrams per liter; —, no data; >, greater than]
20092059
Prediction H1 H2
Johnson LaneMaximum (mg/L) 22 30 20 19
Percentage change in maximum1 — 38 -34 -39
Acres > MCL (10 mg/L) 156 373 92 48
Percentage change in area1 — 139 -75 -87
RuhenstrothMaximum (mg/L) 12 19 4 5
Percentage change in maximum1 — 62 -79 -72
Acres > MCL (10 mg/L) 11 112 0 0
Percentage change in area1 — 769 -100 -1001Calculated as a percentage from prediction at 2059.
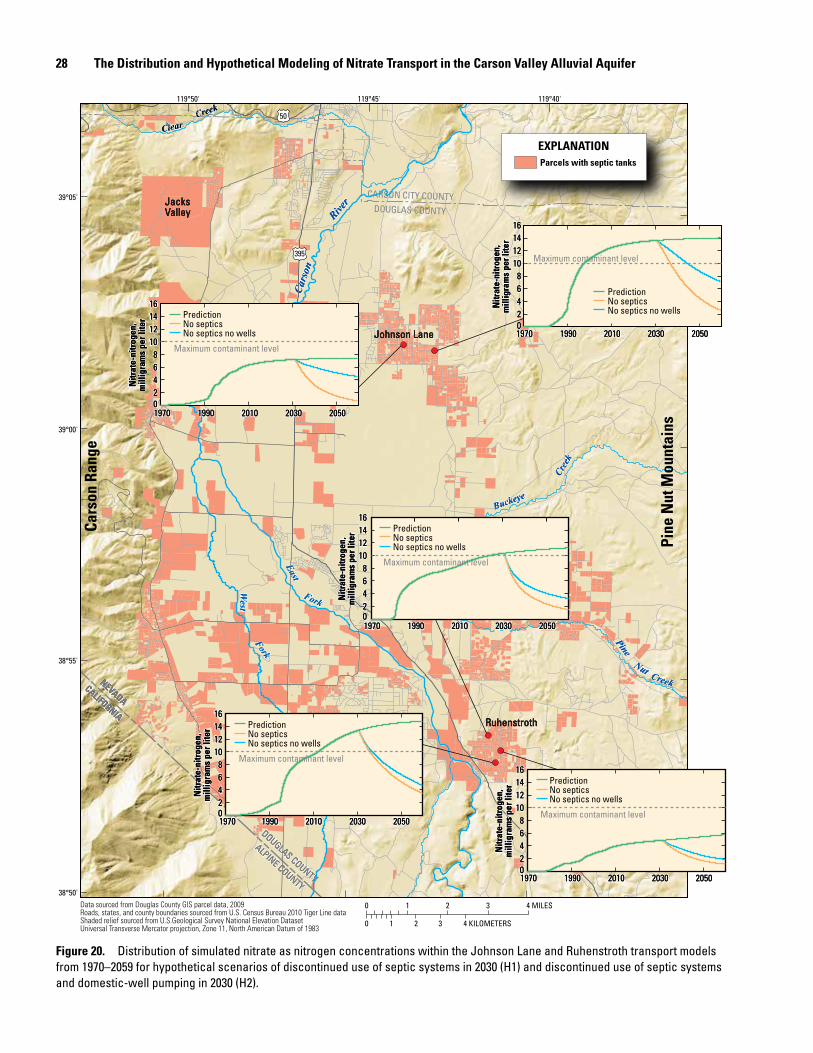
28 The Distribution and Hypothetical Modeling of Nitrate Transport in the Carson Valley Alluvial Aquifer
Figure 20. Distribution of simulated nitrate as nitrogen concentrations within the Johnson Lane and Ruhenstroth transport models from 1970–2059 for hypothetical scenarios of discontinued use of septic systems in 2030 (H1) and discontinued use of septic systems and domestic-well pumping in 2030 (H2).
CARSON CITY COUNTYDOUGLAS COUNTY
NEVADACALIFORNIA
NEVADACALIFORNIA
DOUGLAS COUNTY
ALPINE COUNTY
DOUGLAS COUNTY
ALPINE COUNTY
Cars
onCa
rson
River
River
EastEast
West
West
ForkFork
ForkFork
BuckeyeBuckeye
Cree
kCr
eek
CreekCreek
PinePine
ClearClearCreekCreek
NutNut
88
395
50
4 MILES2 310
4 KILOMETERS2 310
Data sourced from Douglas County GIS parcel data, 2009Roads, states, and county boundaries sourced from U.S. Census Bureau 2010 Tiger Line dataShaded relief sourced from U.S.Geological Survey National Elevation Dataset Universal Transverse Mercator projection, Zone 11, North American Datum of 1983
119°40'119°45'119°50'
39°05'
39°00'
38°55'
38°50'
Cars
on R
ange
Pine
Nut
Mou
ntai
ns
Johnson LaneJohnson LaneJohnson Lane
RuhenstrothRuhenstrothRuhenstroth
Jacks ValleyJacks ValleyJacks Valley
EXPLANATIONParcels with septic tanks
19701970 19901990 20102010 20302030 20502050
19701970 19901990 20102010 20302030 20502050
Nitr
ate-
nitr
ogen
,m
illig
ram
s pe
r lite
rN
itrat
e-ni
trog
en,
mill
igra
ms
per l
iter
0022446688
1010121214141616
Maximum contaminant level
PredictionNo septicsNo septics no wells
19701970 19901990 20102010 20302030 20502050
19701970 19901990 20102010 20302030 20502050
19701970 19901990 20102010 20302030 20502050
Nitr
ate-
nitr
ogen
,m
illig
ram
s pe
r lite
rN
itrat
e-ni
trog
en,
mill
igra
ms
per l
iter
0022446688
1010121214141616
Maximum contaminant level
PredictionNo septicsNo septics no wells
Nitr
ate-
nitr
ogen
,m
illig
ram
s pe
r lite
rN
itrat
e-ni
trog
en,
mill
igra
ms
per l
iter
0022446688
1010121214141616
Maximum contaminant level
PredictionNo septicsNo septics no wells
Nitr
ate-
nitr
ogen
,m
illig
ram
s pe
r lite
rN
itrat
e-ni
trog
en,
mill
igra
ms
per l
iter
0022446688
1010121214141616
Maximum contaminant level
PredictionNo septicsNo septics no wellsN
itrat
e-ni
trog
en,
mill
igra
ms
per l
iter
Nitr
ate-
nitr
ogen
,m
illig
ram
s pe
r lite
r
0022446688
1010121214141616
Maximum contaminant level
PredictionNo septicsNo septics no wells
Numerical Transport-Model Results and Discussion 29
A B
DC
0 4 Miles2
0 4 Kilometers2
Dashed vertical line represents the approximate location of inferred fault from Yager and others (2012)
Nitrogen, milligrams per liter0.01 to 1
Greater than 1 to 5
Greater than 5 to 10
Greater than 10
Hypothesized Hot Springs Mountain faultModel boundary
EXPLANATION
Figure 21. Distribution of simulated nitrate as nitrogen concentrations at Johnson Lane: A, 2009; B, 2059; C, 2059 discontinued use of septic systems in 2030 (H1); and D, 2059 discontinued use of septic systems and domestic-well pumping in 2030 (H2).
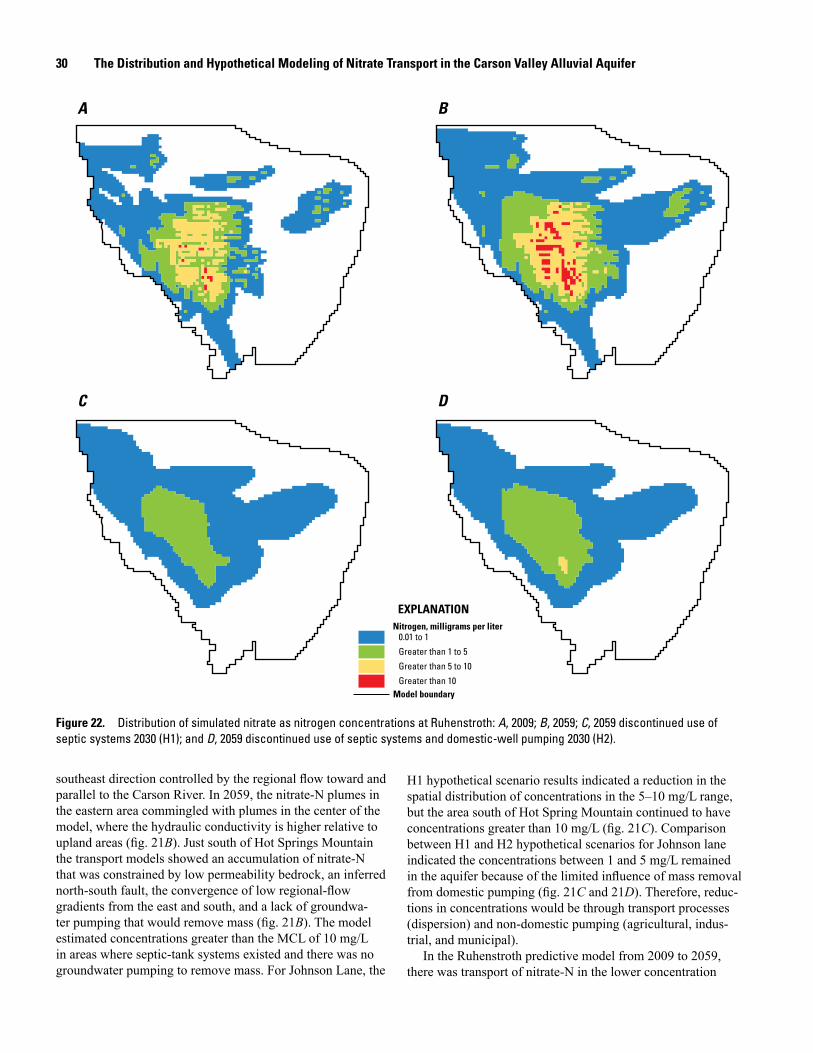
30 The Distribution and Hypothetical Modeling of Nitrate Transport in the Carson Valley Alluvial Aquifer
southeast direction controlled by the regional flow toward and parallel to the Carson River. In 2059, the nitrate-N plumes in the eastern area commingled with plumes in the center of the model, where the hydraulic conductivity is higher relative to upland areas (fig. 21B). Just south of Hot Springs Mountain the transport models showed an accumulation of nitrate-N that was constrained by low permeability bedrock, an inferred north-south fault, the convergence of low regional-flow gradients from the east and south, and a lack of groundwa-ter pumping that would remove mass (fig. 21B). The model estimated concentrations greater than the MCL of 10 mg/L in areas where septic-tank systems existed and there was no groundwater pumping to remove mass. For Johnson Lane, the
A B
DC
Nitrogen, milligrams per liter0.01 to 1
Greater than 1 to 5
Greater than 5 to 10
Greater than 10Model boundary
EXPLANATION
Figure 22. Distribution of simulated nitrate as nitrogen concentrations at Ruhenstroth: A, 2009; B, 2059; C, 2059 discontinued use of septic systems 2030 (H1); and D, 2059 discontinued use of septic systems and domestic-well pumping 2030 (H2).
H1 hypothetical scenario results indicated a reduction in the spatial distribution of concentrations in the 5–10 mg/L range, but the area south of Hot Spring Mountain continued to have concentrations greater than 10 mg/L (fig. 21C). Comparison between H1 and H2 hypothetical scenarios for Johnson lane indicated the concentrations between 1 and 5 mg/L remained in the aquifer because of the limited influence of mass removal from domestic pumping (fig. 21C and 21D). Therefore, reduc-tions in concentrations would be through transport processes (dispersion) and non-domestic pumping (agricultural, indus-trial, and municipal).
In the Ruhenstroth predictive model from 2009 to 2059, there was transport of nitrate-N in the lower concentration
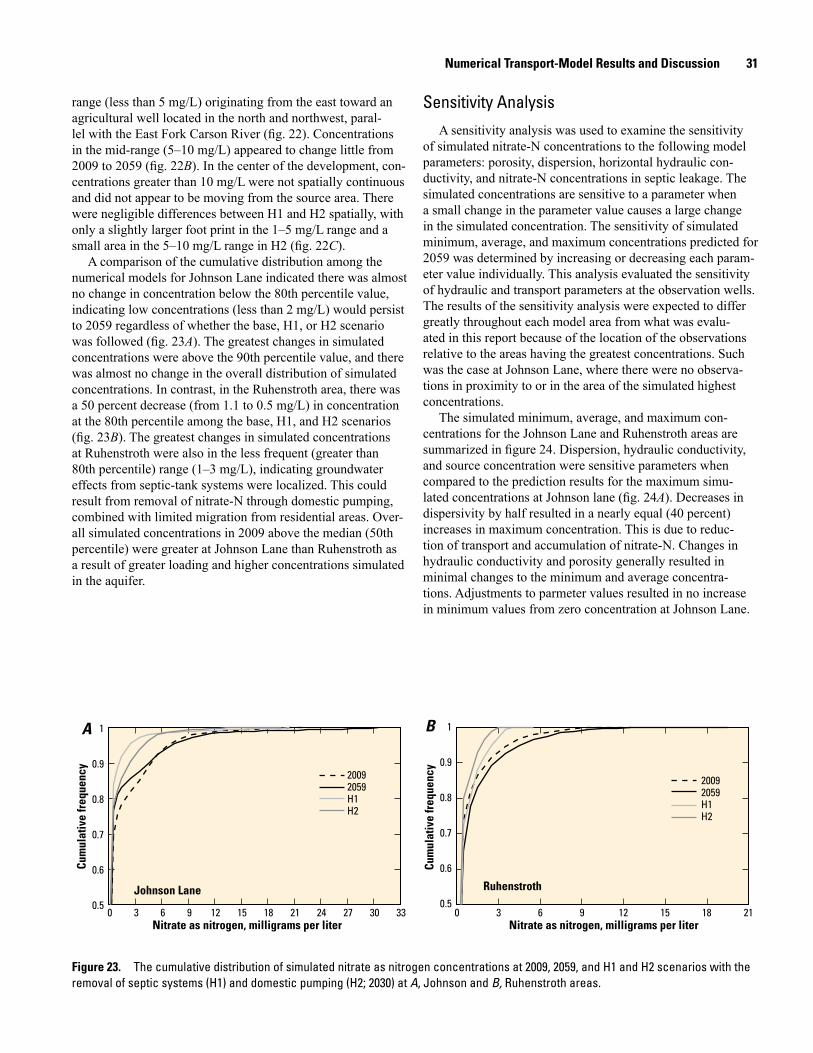
Numerical Transport-Model Results and Discussion 31
range (less than 5 mg/L) originating from the east toward an agricultural well located in the north and northwest, paral-lel with the East Fork Carson River (fig. 22). Concentrations in the mid-range (5–10 mg/L) appeared to change little from 2009 to 2059 (fig. 22B). In the center of the development, con-centrations greater than 10 mg/L were not spatially continuous and did not appear to be moving from the source area. There were negligible differences between H1 and H2 spatially, with only a slightly larger foot print in the 1–5 mg/L range and a small area in the 5–10 mg/L range in H2 (fig. 22C).
A comparison of the cumulative distribution among the numerical models for Johnson Lane indicated there was almost no change in concentration below the 80th percentile value, indicating low concentrations (less than 2 mg/L) would persist to 2059 regardless of whether the base, H1, or H2 scenario was followed (fig. 23A). The greatest changes in simulated concentrations were above the 90th percentile value, and there was almost no change in the overall distribution of simulated concentrations. In contrast, in the Ruhenstroth area, there was a 50 percent decrease (from 1.1 to 0.5 mg/L) in concentration at the 80th percentile among the base, H1, and H2 scenarios (fig. 23B). The greatest changes in simulated concentrations at Ruhenstroth were also in the less frequent (greater than 80th percentile) range (1–3 mg/L), indicating groundwater effects from septic-tank systems were localized. This could result from removal of nitrate-N through domestic pumping, combined with limited migration from residential areas. Over-all simulated concentrations in 2009 above the median (50th percentile) were greater at Johnson Lane than Ruhenstroth as a result of greater loading and higher concentrations simulated in the aquifer.
Sensitivity AnalysisA sensitivity analysis was used to examine the sensitivity
of simulated nitrate-N concentrations to the following model parameters: porosity, dispersion, horizontal hydraulic con-ductivity, and nitrate-N concentrations in septic leakage. The simulated concentrations are sensitive to a parameter when a small change in the parameter value causes a large change in the simulated concentration. The sensitivity of simulated minimum, average, and maximum concentrations predicted for 2059 was determined by increasing or decreasing each param-eter value individually. This analysis evaluated the sensitivity of hydraulic and transport parameters at the observation wells. The results of the sensitivity analysis were expected to differ greatly throughout each model area from what was evalu-ated in this report because of the location of the observations relative to the areas having the greatest concentrations. Such was the case at Johnson Lane, where there were no observa-tions in proximity to or in the area of the simulated highest concentrations.
The simulated minimum, average, and maximum con-centrations for the Johnson Lane and Ruhenstroth areas are summarized in figure 24. Dispersion, hydraulic conductivity, and source concentration were sensitive parameters when compared to the prediction results for the maximum simu-lated concentrations at Johnson lane (fig. 24A). Decreases in dispersivity by half resulted in a nearly equal (40 percent) increases in maximum concentration. This is due to reduc-tion of transport and accumulation of nitrate-N. Changes in hydraulic conductivity and porosity generally resulted in minimal changes to the minimum and average concentra-tions. Adjustments to parmeter values resulted in no increase in minimum values from zero concentration at Johnson Lane.
Figure 23. The cumulative distribution of simulated nitrate as nitrogen concentrations at 2009, 2059, and H1 and H2 scenarios with the removal of septic systems (H1) and domestic pumping (H2; 2030) at A, Johnson and B, Ruhenstroth areas.
Nitrate as nitrogen, milligrams per liter Nitrate as nitrogen, milligrams per liter
A B
Cum
ulat
ive
freq
uenc
y
Cum
ulat
ive
freq
uenc
y
0.5
0.6
0.7
0.8
0.9
1
0.5
0.6
0.7
0.8
0.9
1
0 3 6 9 12 15 18 210 3 6 9 12 15 18 21 24 27 30 33
Ruhenstroth Johnson Lane
20092059H1H2
20092059H1H2
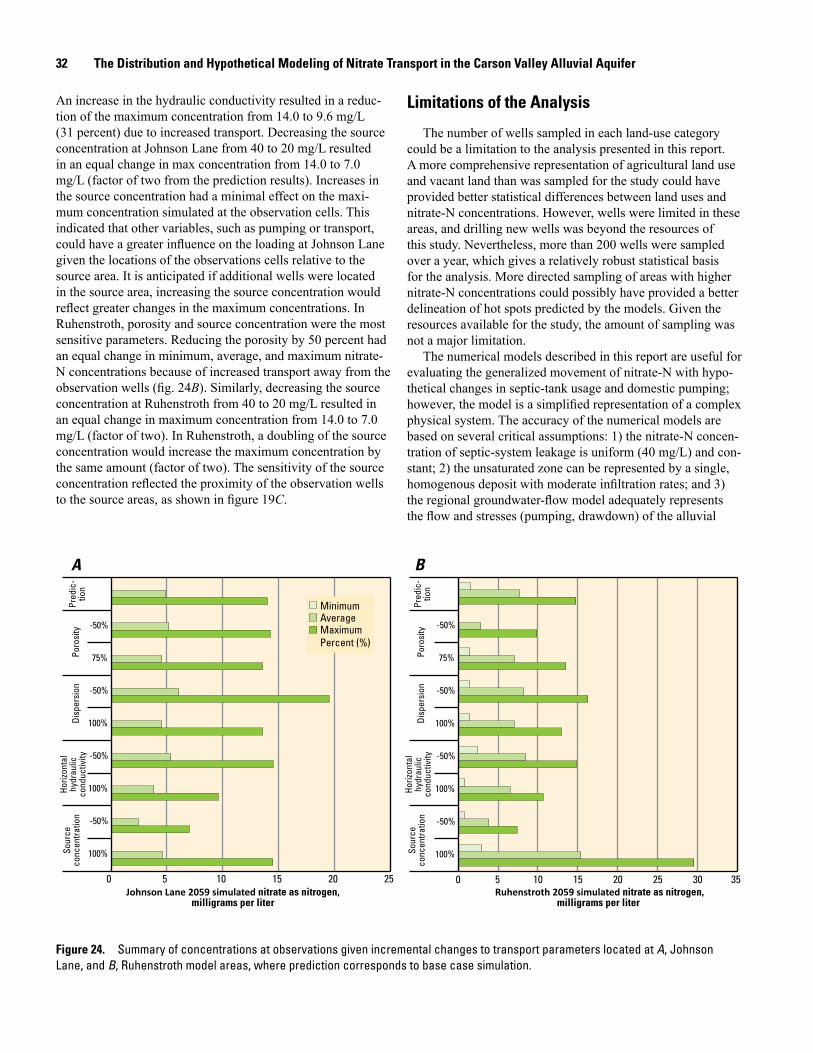
32 The Distribution and Hypothetical Modeling of Nitrate Transport in the Carson Valley Alluvial Aquifer
An increase in the hydraulic conductivity resulted in a reduc-tion of the maximum concentration from 14.0 to 9.6 mg/L (31 percent) due to increased transport. Decreasing the source concentration at Johnson Lane from 40 to 20 mg/L resulted in an equal change in max concentration from 14.0 to 7.0 mg/L (factor of two from the prediction results). Increases in the source concentration had a minimal effect on the maxi-mum concentration simulated at the observation cells. This indicated that other variables, such as pumping or transport, could have a greater influence on the loading at Johnson Lane given the locations of the observations cells relative to the source area. It is anticipated if additional wells were located in the source area, increasing the source concentration would reflect greater changes in the maximum concentrations. In Ruhenstroth, porosity and source concentration were the most sensitive parameters. Reducing the porosity by 50 percent had an equal change in minimum, average, and maximum nitrate-N concentrations because of increased transport away from the observation wells (fig. 24B). Similarly, decreasing the source concentration at Ruhenstroth from 40 to 20 mg/L resulted in an equal change in maximum concentration from 14.0 to 7.0 mg/L (factor of two). In Ruhenstroth, a doubling of the source concentration would increase the maximum concentration by the same amount (factor of two). The sensitivity of the source concentration reflected the proximity of the observation wells to the source areas, as shown in figure 19C.
Limitations of the Analysis
The number of wells sampled in each land-use category could be a limitation to the analysis presented in this report. A more comprehensive representation of agricultural land use and vacant land than was sampled for the study could have provided better statistical differences between land uses and nitrate-N concentrations. However, wells were limited in these areas, and drilling new wells was beyond the resources of this study. Nevertheless, more than 200 wells were sampled over a year, which gives a relatively robust statistical basis for the analysis. More directed sampling of areas with higher nitrate-N concentrations could possibly have provided a better delineation of hot spots predicted by the models. Given the resources available for the study, the amount of sampling was not a major limitation.
The numerical models described in this report are useful for evaluating the generalized movement of nitrate-N with hypo-thetical changes in septic-tank usage and domestic pumping; however, the model is a simplified representation of a complex physical system. The accuracy of the numerical models are based on several critical assumptions: 1) the nitrate-N concen-tration of septic-system leakage is uniform (40 mg/L) and con-stant; 2) the unsaturated zone can be represented by a single, homogenous deposit with moderate infiltration rates; and 3) the regional groundwater-flow model adequately represents the flow and stresses (pumping, drawdown) of the alluvial
MinimumAverageMaximumPercent (%)
A B
Johnson Lane 2059 simulated nitrate as nitrogen,milligrams per liter
Ruhenstroth 2059 simulated nitrate as nitrogen,milligrams per liter
0 5 10 15 20 25 30 350 5 10 15 20 25
-50%
75%
-50%
100%
-50%
100%
-50%
100%
-50%
75%
-50%
100%
-50%
100%
-50%
100%
Pred
ic-
tion
Poro
sity
Disp
ersi
onHo
rizon
tal
hydr
aulic
cond
uctiv
ity
Sour
ceco
ncen
tratio
n
Pred
ic-
tion
Poro
sity
Disp
ersi
onHo
rizon
tal
hydr
aulic
cond
uctiv
ity
Sour
ceco
ncen
tratio
n
Figure 24. Summary of concentrations at observations given incremental changes to transport parameters located at A, Johnson Lane, and B, Ruhenstroth model areas, where prediction corresponds to base case simulation.
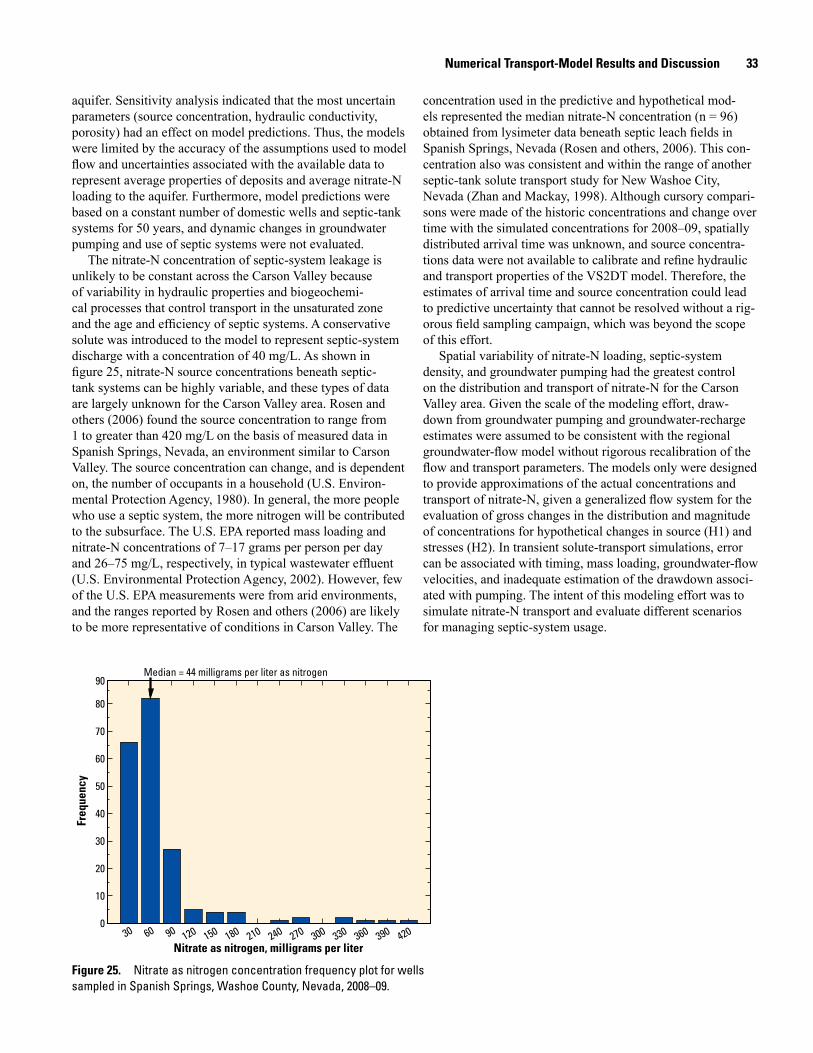
Numerical Transport-Model Results and Discussion 33
aquifer. Sensitivity analysis indicated that the most uncertain parameters (source concentration, hydraulic conductivity, porosity) had an effect on model predictions. Thus, the models were limited by the accuracy of the assumptions used to model flow and uncertainties associated with the available data to represent average properties of deposits and average nitrate-N loading to the aquifer. Furthermore, model predictions were based on a constant number of domestic wells and septic-tank systems for 50 years, and dynamic changes in groundwater pumping and use of septic systems were not evaluated.
The nitrate-N concentration of septic-system leakage is unlikely to be constant across the Carson Valley because of variability in hydraulic properties and biogeochemi-cal processes that control transport in the unsaturated zone and the age and efficiency of septic systems. A conservative solute was introduced to the model to represent septic-system discharge with a concentration of 40 mg/L. As shown in figure 25, nitrate-N source concentrations beneath septic-tank systems can be highly variable, and these types of data are largely unknown for the Carson Valley area. Rosen and others (2006) found the source concentration to range from 1 to greater than 420 mg/L on the basis of measured data in Spanish Springs, Nevada, an environment similar to Carson Valley. The source concentration can change, and is dependent on, the number of occupants in a household (U.S. Environ-mental Protection Agency, 1980). In general, the more people who use a septic system, the more nitrogen will be contributed to the subsurface. The U.S. EPA reported mass loading and nitrate-N concentrations of 7–17 grams per person per day and 26–75 mg/L, respectively, in typical wastewater effluent (U.S. Environmental Protection Agency, 2002). However, few of the U.S. EPA measurements were from arid environments, and the ranges reported by Rosen and others (2006) are likely to be more representative of conditions in Carson Valley. The
Figure 25. Nitrate as nitrogen concentration frequency plot for wells sampled in Spanish Springs, Washoe County, Nevada, 2008–09.
30 60 90 120 150 180 210 240 270 300 330 360 390 420
Freq
uenc
y
Nitrate as nitrogen, milligrams per liter
0
10
20
30
40
50
60
70
80
90Median = 44 milligrams per liter as nitrogen
concentration used in the predictive and hypothetical mod-els represented the median nitrate-N concentration (n = 96) obtained from lysimeter data beneath septic leach fields in Spanish Springs, Nevada (Rosen and others, 2006). This con-centration also was consistent and within the range of another septic-tank solute transport study for New Washoe City, Nevada (Zhan and Mackay, 1998). Although cursory compari-sons were made of the historic concentrations and change over time with the simulated concentrations for 2008–09, spatially distributed arrival time was unknown, and source concentra-tions data were not available to calibrate and refine hydraulic and transport properties of the VS2DT model. Therefore, the estimates of arrival time and source concentration could lead to predictive uncertainty that cannot be resolved without a rig-orous field sampling campaign, which was beyond the scope of this effort.
Spatial variability of nitrate-N loading, septic-system density, and groundwater pumping had the greatest control on the distribution and transport of nitrate-N for the Carson Valley area. Given the scale of the modeling effort, draw-down from groundwater pumping and groundwater-recharge estimates were assumed to be consistent with the regional groundwater-flow model without rigorous recalibration of the flow and transport parameters. The models only were designed to provide approximations of the actual concentrations and transport of nitrate-N, given a generalized flow system for the evaluation of gross changes in the distribution and magnitude of concentrations for hypothetical changes in source (H1) and stresses (H2). In transient solute-transport simulations, error can be associated with timing, mass loading, groundwater-flow velocities, and inadequate estimation of the drawdown associ-ated with pumping. The intent of this modeling effort was to simulate nitrate-N transport and evaluate different scenarios for managing septic-system usage.
34 The Distribution and Hypothetical Modeling of Nitrate Transport in the Carson Valley Alluvial Aquifer
Summary and ConclusionsResults from groundwater sampling and analysis of 179
wells (228 total samples) located in areas with different land uses throughout Carson Valley showed nitrate-N con-centrations in the aquifer ranged from less than detection (0.05 mg/L) to greater than 18 mg/L. Nitrate-N concentrations above the U.S. Environmental Protection Agency’s maximum contaminant level of 10 mg/L were found in three wells (0.2 percent of wells sampled). Land-use analysis indicated that elevated nitrate-N concentrations were related to septic-system density, groundwater age, and residential, single-family land use. The positive correlation between septic-system density and nitrate-N concentration was consistent with previous studies (Rosen, 2003; Shipley and Rosen, 2005) that contained more limited data for Carson Valley. There was no statistical correlation between nitrate-N concentrations and agricultural or other land uses in the valley.
Background concentrations (wells sampled away from anthropogenic sources of nitrate-N) of nitrate-N in Carson Valley were generally less than 1 mg/L. The mean nitrate-N concentration for the valley was 2.2 mg/L, indicating that, in general, the nitrate-N concentration of the valley was elevated above background. In addition, several areas of the valley had mean nitrate-N concentrations greater than 4 mg/L, and all of the areas with elevated mean nitrate-N were dependent on sep-tic systems for wastewater disposal. Nitrate-N concentrations were also greater in wells less than 250-ft below land surface, which indicated that the likely source was near the water table.
The results from nitrogen and oxygen isotope analyses showed a correlation between nitrate-N concentrations and δ15N values. Groundwater samples with nitrate-N concentra-tions greater than 5 mg/L and δ15N values greater than 7‰ were collocated in areas with a high density of septic systems in single-family residential areas. Nitrogen isotope values in this range indicate that animal and human waste was the main source of this nitrogen, although a lesser contribution of natural soil nitrate-N was possible. The relatively high dis-solved oxygen concentration, low dissolved nitrogen gas, and high values of nitrogen isotopes indicated that the potential for reduction of nitrate-N through denitrification was limited. The nitrate-N concentrations could continue to increase under areas that receive additional inputs of nitrogen as a result of the low denitrification potential of the aquifer.
In general, age-dating of water from selected wells indi-cated that much of the water infiltrated between 1970 and 1995, although mixing with water that is older and younger than that period contributed to this range of ages. This indi-cated that nitrate-N contamination from septic systems could last for a long time after it enters the groundwater system (greater than 50 years).
The continued increase in nitrate-N concentrations based on samples collected from long-term trend wells located throughout Carson Valley indicated that increases in nitrate-N was not limited to just the Ruhenstroth and Johnson Lane areas, but also could be of concern for other down-gradient
areas in the valley where septic-system density is greater than one per 3 acres. The presence of high nitrate-N concentrations in some areas of the valley could be an indication that the dilution capacity of the aquifer has been exceeded, and further development should consider the cumulative effects of septic-system use.
The numerical models used in the study are a representation of our conceptual understanding of the geochemical processes and the groundwater-flow system. The results of the transport model indicated that nitrate-N concentrations would continue to increase and transport away from source areas. The depth to groundwater and age of septic systems were directly related to the nitrate-N concentrations in the alluvial aquifer, and there was a time lag between the construction date of the septic-tank system and the arrival of nitrate-N to the aquifer. Thus, nitrate-N loading aquifer is expected to continue to rise into the future, and the magnitude of the groundwater nitrate-N concentrations is dependent on the proximity to groundwater pumping and the Carson River.
The hypothetical models used in this study indicated that the continual persistence of nitrate-N contamination in ground-water is a concern long after the removal or discontinuation of septic-system usage. However, if the septic-tank systems were no longer used (H1 scenario), groundwater nitrate-N concen-trations would rapidly decrease within 30 years as a result of removal of mass through groundwater pumping. If septic-tank systems were no longer used and domestic pumping was ter-minated (H2 scenario), groundwater nitrate-N concentrations would also decline, but at a slower rate. The results of the hypothetical scenarios indicated that nitrate-N transport in the alluvial aquifer was largely influenced by groundwater pump-ing, and usage for consumptive purposes should continue to be monitored into future.
References Cited 35
References Cited
Avery, A.A., 1999, Infantile methemoglobinemia—Reexam-ining the role of drinking water nitrates: Environmental Health Perspectives, v. 107, no. 7, p. 583–586.
Canter, L.W., and Knox, R.C., 1985, Septic system effects on groundwater quality: Chelsea, Michigan, Lewis Publishers, 336 p.
Comly, H.H., 1945, Cyanosis in infants caused by nitrates in well water: Journal of the American Medical Association, v. 29, p. 112–116.
Conan, C., Bouraoui, F., Turpin, N., de Marsily, G., and Bido-glio, G., 2003, Modeling flow and nitrate fate at catchment scale in Brittany, France: Journal of Environmental Quality, v. 32, p. 2,026–2,032.
Dillingham, H.L, 1980, Washoe Project, Nevada-California, ground-water geology and resources, definite plan appen-dix, Carson Valley, Nevada: U.S. Bureau of Reclamation, Sacramento, California, 82 p.
Douglas County, 2006, Douglas County Building Division Septic Application: Accessed at http://nv-douglascounty.civicplus.com/DocumentCenter/Home/View/26.
Douglas County, Nevada, 2009, Assessor parcel search: Accessed at http://assessor.co.douglas.nv.us/database/2008/parcel/index.asp.
Drever, J.I., 1997, The geochemistry of natural waters—Sur-face and groundwater environments (3d ed.): Englewood Cliffs, New Jersey, Prentice-Hall, 436 p.
Freeze, R.A., and Cherry J.A., 1979, Groundwater: Engle-wood Cliffs, New Jersey, Prentice-Hall, 604 p.
Gelhar, L.W., Welty, C., Rehfeldt, K.R., 1992, A critical review of data on field-scale dispersion in aquifers: Water Resources Research, v. 28, p. 1955–1974.
Hantzche, N.N., and Finnemore, E.J., 2005, Predicting Ground-Water Nitrate-Nitrogen Impacts: Ground Water, v. 30, no. 4, p. 490–498
Harbaugh, A.W., 2005, MODFLOW-2005, the U.S. Geologi-cal Survey modular groundwater model—the groundwater flow process: U.S. Geological Survey Techniques and Meth-ods, book 6, chap. A16.
Healy, R.W., and Ronan, A.D., 1996, Documentation of com-puter program VS2DH for simulation of energy transport in variably saturated porous media—modification of the U.S. Geological Survey’s computer program VS2DT: U.S. Geological Survey Water-Resources Investigations Report 96–4230, 36 p. An electronic version of this report can be downloaded from: http://pubs.er.usgs.gov/pubs/wri/wri964230
Hem, J.D., 1992, The study and interpretation of the chemical characteristics of natural water (3d ed.): U.S. Geological Survey Water-Supply Paper 2254, 225 p.
Hill, M.J., Hawksworth, G., and Tattersall, G., 1973, Bacteria, nitrosamines and cancer of the stomach: British Journal of Cancer, v. 28, p. 562–567.
Hinkle, S.R., Shapiro, S.D., Plummer, L.N., Busenberg, E., Widman, P.K., Casile, G.C., and Wayland, J.E., 2010, Estimates of tracer-based piston-flow ages of groundwater from selected sites—National Water-Quality Assessment Program, 1992–2005: U.S. Geological Survey Scientific Investigations Report 2010–5229, 90 p.
Hsieh, P.A., Wingle, William, and Healy, R.W., 2000, VS2DI—A graphical software package for simulating fluid flow and solute or energy transport in variably saturated porous media: U.S. Geological Survey Water-Resources Investigations Report 99–4130, 16 p.
Kendall, C., 1998, Tracing nitrogen sources and cycling in catchments in Kendall, C., and McDonnell, J.J. (eds.), Iso-tope tracers in catchment hydrology: Amsterdam, Elsevier, p. 519–576.
Koterba, M.T, Wilde, F.D., and Lapham, W.W., 1995, Ground-water data-collection protocols and procedures for the National Water-Quality Assessment Program: Collection and documentation of water-quality samples and related data: U.S. Geological Survey Open-File Report 95–399, 113 p.
Lorenz, D.L., Ahearn, E.A., Carter, J.M., Cohn, T.A., Dan-chuk, W.J., Frey, J.W., Helsel, D.R., Lee, K.E., Leeth, D.C., Martin, J.D., McGuire, V.L., Neitzert, K.M., Robertson, D.M., Slack, J.R., Starn, J., Vecchia, A.V., Wilkison, D.H., and Williamson, J. E., 2011, USGS library for S-PLUS for Windows—Release 4.0: U.S. Geological Survey Open-File Report 2011–1130. http://water.usgs.gov/software/S-PLUS/.
MacQuarrie, K.T.B., Sudicky, E.A., and Robertson, W.D., 2001, Numerical simulation of a fine-grained denitrifica-tion layer for removing septic system nitrate from shallow groundwater: Journal of Contaminant Hydrology, v. 52, p. 29–55.
Makowski, Anna, 2006, Modeling nitrate transport in Spanish Springs Valley, Washoe County, Nevada: Reno, University of Nevada, M.S. thesis.
Malberg, J.W., Savage, E.P., and Osterhoung, J., 1978, Nitrates in drinking water and the early onset of hypertension: Envi-ronmental Pollution, v. 15, p. 155–160.
Maurer, D.K., 1984, Gravity survey and depth to bedrock in Carson Valley, Nevada-California: U.S. Geologic Survey Water-Resources Investigation Report 84–4202, 20 p.
36 The Distribution and Hypothetical Modeling of Nitrate Transport in the Carson Valley Alluvial Aquifer
Maurer, D.K., 1986, Geohydrology and simulated response to ground-water pumpage in Carson Valley, a river-dominated basin in Douglas County, Nevada, and Alpine County, Cali-fornia: U.S. Geological Survey Water-Resources Investiga-tions Report 86–4328, 109 p.
Maurer, D.K., and Berger, D.L., 2006, Water budgets and potential effects of land and water-use changes for Car-son Valley, Douglas County, Nevada, and Alpine County, California: U.S. Geological Survey Scientific Investigations Report 2006–5305, 64 p.
Maurer, D.K., and Peltz, L.A., 1994, Potential for, and pos-sible effects of, artificial recharge in Carson Valley, Douglas County, Nevada: U.S. Geological Survey Water-Resources Investigations Report 94–4126, 4 map sheets.
Miller, J.C., 1975, Nitrate contamination of the water-table aquifer by septic tank systems in the coastal plain of Dela-ware in Water Pollution Control in Low Density Areas: Pro-ceedings of Rural Environmental Engineering Conference, Hanover, New Hampshire, September 1973, Jewell, W.S., and Swan, R., eds.: Hanover, New Hampshire, University Press of New England, p. 121–133.
Morgan, D.S., Hinkle, S.R., and Weick, R.J., 2007, Evaluation of approaches for managing nitrate loading from on-site wastewater systems near La Pine, Oregon: U.S. Geological Survey Scientific Investigations Report 2007–5237, 66 p.
Parslow, R.C., McKinney, P.A., Law, G.R., Staines, A., Wil-liams, R., and Bodansky, H.J., 1997, Incidence of childhood diabetes mellitus in Yorkshire, northern England, is associ-ated with nitrate in drinking water—An ecological analysis: Diabetologia, v. 40, p. 550–556.
Perkins, R.J., 1984, Septic system, lot size and pollution of water table aquifers: Journal of Environmental Health, v. 46, p. 346–354.
Reneau, R.B., Jr., Hagedorn, C., and Degen, M.J., 1989, Fate and transport of biological and inorganic contaminants from on-site disposal of domestic wastewater: Journal of Envi-ronmental Quality, v. 18, no. 2, p. 298–304.
Révész, Kinga, and Casciotti, Karen, 2007, Determination of the δ(15N/14N) and δ(18O/16O) of Nitrate in Water: RSIL Lab Code 2900, chap. C17 of Révész, Kinga, and Coplen, Tyler B., eds., Methods of the Reston Stable Isotope Laboratory: Reston, Virginia, U.S. Geological Survey, Techniques and Methods, book 10, sec. C, chap. 17, 24 p.
Rosen, M.R., 2003, Trends in nitrate and dissolved-solids concentrations in ground water, Carson Valley, Douglas County, Nevada, 1985–2001: U.S. Geological Survey Water Resources Investigations Report 03–4152, 6 p.
Rosen, M.R., Kropf, C., and Thomas, K.A., 2006, Quantifica-tion of the contribution of nitrogen from septic systems to ground water in Spanish Springs Valley, Nevada: U.S. Geo-logical Survey Scientific Investigations Report 2006–5206, prepared in cooperation with Washoe County Department of Water Resources, Reno, Nevada, 12 p.
Shipley, D.O., and Rosen, M.R., 2005, Identification of nitrate and dissolved-solids sources in ground water by GIS analy-sis: Environmental Practice, v. 7, p. 32–43.
Sigman, D.M., Casciotti, K.L., Andreani, M., Barford, C., Galanter, M., and Böhlke, J.K, 2001, A Bacterial method for the nitrogen isotopic analysis of nitrate in seawater and freshwater: Analytical. Chemistry, v. 73, no. 17, p. 4,145–4,153.
Silva, S.R., Kendall, C., Wilkison, D.H., Ziegler, A.C., Chang, C.C.Y., and Avanzino, R.J., 2000, A new method for collec-tion of nitrate from fresh water and the analysis of nitrogen and oxygen isotope ratios: Journal of Hydrology, v. 21, p. 22–36.
State of Nevada, 2009, Mapping & Data—Well log database query tool: Division of Water Resources, http://water.nv.gov/data/welllog/.
Super, M., Heese, H., Mackenzie, D., Dempster, W.S., duPless, J., and Ferreira, J.J., 1981, An epidemiologic study of well-water nitrates in a group of South West African Namnian infants: Water Resources, v. 15, p. 1,265–1,270.
Thodal, C.E. 1996. Trends in chloride, dissolved-solids, and nitrate concentrations in ground water, Carson Valley and Topaz Lake areas, Douglas County, Nevada, 1959–1988. U.S. Geological Survey Water-Resources Investigations Report 95–4254, 32 p.
Thomas, J.M., Thodal, C.E., and Seiler, R.L., 1999, Identifica-tion of nitrate sources contributing to ground water in the Indian Hills area of Douglas County, Nevada: U.S. Geologi-cal Survey Water-Resources Investigations Report 99–4042, 22 p.
U.S. Census Bureau, 2009, State and County Quick Facts—Douglas County, Nevada: Accessed at http://quickfacts.census.gov/qfd/states/32/32005lk.html.
U.S. Environmental Protection Agency, 1980, Onsite wastewa-ter treatment and disposal systems design manual: Cincin-nati, Ohio, EPA-625/1-80-012, 391 p.
U.S. Environmental Protection Agency, 2002, Onsite wastewa-ter treatment systems manual, U.S. Environmental Protec-tion Agency, Office of Water, EPA600/R-00/008.
U.S. Geological Survey, 2008a, CFC sampling method–bottles: Chloroflourocarbon Laboratory, accessed at http://water.usgs.gov/lab/chlorofluorocarbons/sampling/bottles/.
References Cited 37
U.S. Geological Survey, 2008b, Dissolved gas sampling instructions: Accessed at http://water.usgs.gov/lab/dis-solved-gas/sampling/.
University of Miami, 2009, The Tritium Laboratory: Rosen-stiel School of Marine and Atmospheric Science, accessed at http://www.rsmas.miami.edu/groups/tritium/.
Walvoord, M.A., Phillips, F.M., Stonestrom, D.A., Evans, R.D., Hartsough, P.C., Newman, B.D., and Striegl, R.G., 2003, A reservoir of nitrate beneath desert soils: Science, v. 302, no. 7, p. 1,021–1,024.
Ward, M.H., deKok, T.M., Levallois, P., Brender, J., Gulis, G., Nolan, B.T., and VanDerslice, J., 2005, Workgroup Report: Drinking-water nitrate and health—recent findings and research needs: Environmental Health Perspectives, v. 113, no. 11, p. 1,607–1,614.
Western Regional Climate Center, 2006, Historic Climate Information: Accessed at http://www.wrcc.dri.edu/.
Williams, A.E., Lund, L.J., Johnson, J.A., and Kabala, Z.J., 1998, Natural and anthropogenic nitrate contamination of groundwater in a rural community, California: Environmen-tal Science and Technology, v. 32, no. 1, p. 32–39.
Winston, R.B., 2009, ModelMuse—A graphical user interface for MODFLOW–2005 and PHAST: U.S. Geological Survey Techniques and Methods, book 6, chap. A29, 52 p.
Yager, R.M., Maurer, D.K., and Mayers, C.J., 2012, Assessing potential effects of changes in water use with a numerical groundwater-flow model of Carson Valley, Douglas County, Nevada, and Alpine County, California: U.S. Geological Survey Scientific Investigations Report 2012–5262, 73 p.
Yates, M.V., 1985, Septic system density and ground-water contamination: Ground Water, v. 23, p. 586–591.
Zhan, H. and W.A. Mckay, 1998, An assessment of nitrate occurrence and transport in Washoe Valley, Nevada: Envi-ronmental & Engineering Geoscience, vol. 4, no. 4, p. 479–489.
Zheng, C., and Wang, P.P., 1999, MT3DMS, A modular three-dimensional multi-species transport model for simulation of advection, dispersion and chemical reactions of contami-nants in groundwater systems; documentation and user’s guide, Vicksburg, Miss., U.S. Army Engineer Research and Development Center Contract Report SERDP-99-1, 202 p.
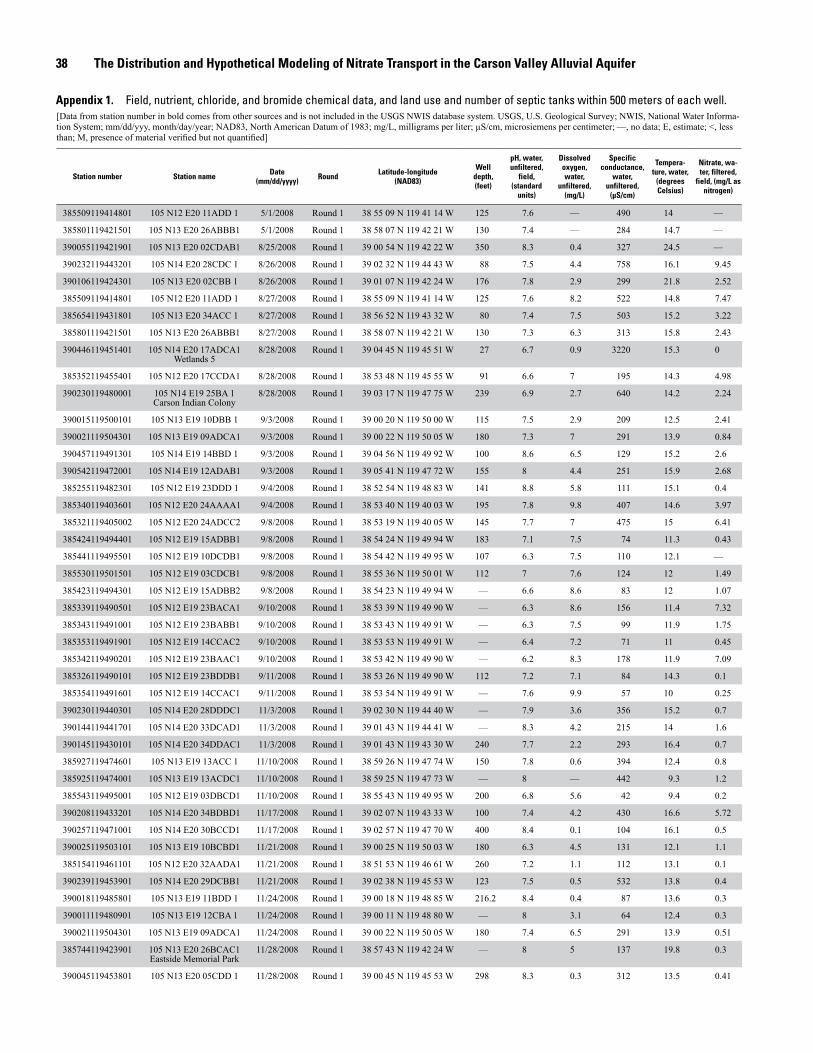
38 The Distribution and Hypothetical Modeling of Nitrate Transport in the Carson Valley Alluvial Aquifer
[Data from station number in bold comes from other sources and is not included in the USGS NWIS database system. USGS, U.S. Geological Survey; NWIS, National Water Informa-tion System; mm/dd/yyy, month/day/year; NAD83, North American Datum of 1983; mg/L, milligrams per liter; µS/cm, microsiemens per centimeter; —, no data; E, estimate; <, less than; M, presence of material verified but not quantified]
Station number Station name Date(mm/dd/yyyy) Round Latitude-longitude
(NAD83)
Welldepth,(feet)
pH, water, unfiltered,
field,(standard
units)
Dissolved oxygen, water,
unfiltered,(mg/L)
Specific conductance,
water, unfiltered,
(µS/cm)
Tempera-ture, water,
(degrees Celsius)
Nitrate, wa-ter, filtered,
field, (mg/L as nitrogen)
385509119414801 105 N12 E20 11ADD 1 5/1/2008 Round 1 38 55 09 N 119 41 14 W 125 7.6 — 490 14 —
385801119421501 105 N13 E20 26ABBB1 5/1/2008 Round 1 38 58 07 N 119 42 21 W 130 7.4 — 284 14.7 —
390055119421901 105 N13 E20 02CDAB1 8/25/2008 Round 1 39 00 54 N 119 42 22 W 350 8.3 0.4 327 24.5 —
390232119443201 105 N14 E20 28CDC 1 8/26/2008 Round 1 39 02 32 N 119 44 43 W 88 7.5 4.4 758 16.1 9.45
390106119424301 105 N13 E20 02CBB 1 8/26/2008 Round 1 39 01 07 N 119 42 24 W 176 7.8 2.9 299 21.8 2.52
385509119414801 105 N12 E20 11ADD 1 8/27/2008 Round 1 38 55 09 N 119 41 14 W 125 7.6 8.2 522 14.8 7.47
385654119431801 105 N13 E20 34ACC 1 8/27/2008 Round 1 38 56 52 N 119 43 32 W 80 7.4 7.5 503 15.2 3.22
385801119421501 105 N13 E20 26ABBB1 8/27/2008 Round 1 38 58 07 N 119 42 21 W 130 7.3 6.3 313 15.8 2.43
390446119451401 105 N14 E20 17ADCA1Wetlands 5
8/28/2008 Round 1 39 04 45 N 119 45 51 W 27 6.7 0.9 3220 15.3 0
385352119455401 105 N12 E20 17CCDA1 8/28/2008 Round 1 38 53 48 N 119 45 55 W 91 6.6 7 195 14.3 4.98
390230119480001 105 N14 E19 25BA 1Carson Indian Colony
8/28/2008 Round 1 39 03 17 N 119 47 75 W 239 6.9 2.7 640 14.2 2.24
390015119500101 105 N13 E19 10DBB 1 9/3/2008 Round 1 39 00 20 N 119 50 00 W 115 7.5 2.9 209 12.5 2.41
390021119504301 105 N13 E19 09ADCA1 9/3/2008 Round 1 39 00 22 N 119 50 05 W 180 7.3 7 291 13.9 0.84
390457119491301 105 N14 E19 14BBD 1 9/3/2008 Round 1 39 04 56 N 119 49 92 W 100 8.6 6.5 129 15.2 2.6
390542119472001 105 N14 E19 12ADAB1 9/3/2008 Round 1 39 05 41 N 119 47 72 W 155 8 4.4 251 15.9 2.68
385255119482301 105 N12 E19 23DDD 1 9/4/2008 Round 1 38 52 54 N 119 48 83 W 141 8.8 5.8 111 15.1 0.4
385340119403601 105 N12 E20 24AAAA1 9/4/2008 Round 1 38 53 40 N 119 40 03 W 195 7.8 9.8 407 14.6 3.97
385321119405002 105 N12 E20 24ADCC2 9/8/2008 Round 1 38 53 19 N 119 40 05 W 145 7.7 7 475 15 6.41
385424119494401 105 N12 E19 15ADBB1 9/8/2008 Round 1 38 54 24 N 119 49 94 W 183 7.1 7.5 74 11.3 0.43
385441119495501 105 N12 E19 10DCDB1 9/8/2008 Round 1 38 54 42 N 119 49 95 W 107 6.3 7.5 110 12.1 —
385530119501501 105 N12 E19 03CDCB1 9/8/2008 Round 1 38 55 36 N 119 50 01 W 112 7 7.6 124 12 1.49
385423119494301 105 N12 E19 15ADBB2 9/8/2008 Round 1 38 54 23 N 119 49 94 W — 6.6 8.6 83 12 1.07
385339119490501 105 N12 E19 23BACA1 9/10/2008 Round 1 38 53 39 N 119 49 90 W — 6.3 8.6 156 11.4 7.32
385343119491001 105 N12 E19 23BABB1 9/10/2008 Round 1 38 53 43 N 119 49 91 W — 6.3 7.5 99 11.9 1.75
385353119491901 105 N12 E19 14CCAC2 9/10/2008 Round 1 38 53 53 N 119 49 91 W — 6.4 7.2 71 11 0.45
385342119490201 105 N12 E19 23BAAC1 9/10/2008 Round 1 38 53 42 N 119 49 90 W — 6.2 8.3 178 11.9 7.09
385326119490101 105 N12 E19 23BDDB1 9/11/2008 Round 1 38 53 26 N 119 49 90 W 112 7.2 7.1 84 14.3 0.1
385354119491601 105 N12 E19 14CCAC1 9/11/2008 Round 1 38 53 54 N 119 49 91 W — 7.6 9.9 57 10 0.25
390230119440301 105 N14 E20 28DDDC1 11/3/2008 Round 1 39 02 30 N 119 44 40 W — 7.9 3.6 356 15.2 0.7
390144119441701 105 N14 E20 33DCAD1 11/3/2008 Round 1 39 01 43 N 119 44 41 W — 8.3 4.2 215 14 1.6
390145119430101 105 N14 E20 34DDAC1 11/3/2008 Round 1 39 01 43 N 119 43 30 W 240 7.7 2.2 293 16.4 0.7
385927119474601 105 N13 E19 13ACC 1 11/10/2008 Round 1 38 59 26 N 119 47 74 W 150 7.8 0.6 394 12.4 0.8
385925119474001 105 N13 E19 13ACDC1 11/10/2008 Round 1 38 59 25 N 119 47 73 W — 8 — 442 9.3 1.2
385543119495001 105 N12 E19 03DBCD1 11/10/2008 Round 1 38 55 43 N 119 49 95 W 200 6.8 5.6 42 9.4 0.2
390208119433201 105 N14 E20 34BDBD1 11/17/2008 Round 1 39 02 07 N 119 43 33 W 100 7.4 4.2 430 16.6 5.72
390257119471001 105 N14 E20 30BCCD1 11/17/2008 Round 1 39 02 57 N 119 47 70 W 400 8.4 0.1 104 16.1 0.5
390025119503101 105 N13 E19 10BCBD1 11/21/2008 Round 1 39 00 25 N 119 50 03 W 180 6.3 4.5 131 12.1 1.1
385154119461101 105 N12 E20 32AADA1 11/21/2008 Round 1 38 51 53 N 119 46 61 W 260 7.2 1.1 112 13.1 0.1
390239119453901 105 N14 E20 29DCBB1 11/21/2008 Round 1 39 02 38 N 119 45 53 W 123 7.5 0.5 532 13.8 0.4
390018119485801 105 N13 E19 11BDD 1 11/24/2008 Round 1 39 00 18 N 119 48 85 W 216.2 8.4 0.4 87 13.6 0.3
390011119480901 105 N13 E19 12CBA 1 11/24/2008 Round 1 39 00 11 N 119 48 80 W — 8 3.1 64 12.4 0.3
390021119504301 105 N13 E19 09ADCA1 11/24/2008 Round 1 39 00 22 N 119 50 05 W 180 7.4 6.5 291 13.9 0.51
385744119423901 105 N13 E20 26BCAC1Eastside Memorial Park
11/28/2008 Round 1 38 57 43 N 119 42 24 W — 8 5 137 19.8 0.3
390045119453801 105 N13 E20 05CDD 1 11/28/2008 Round 1 39 00 45 N 119 45 53 W 298 8.3 0.3 312 13.5 0.41
Appendix 1. Field, nutrient, chloride, and bromide chemical data, and land use and number of septic tanks within 500 meters of each well.
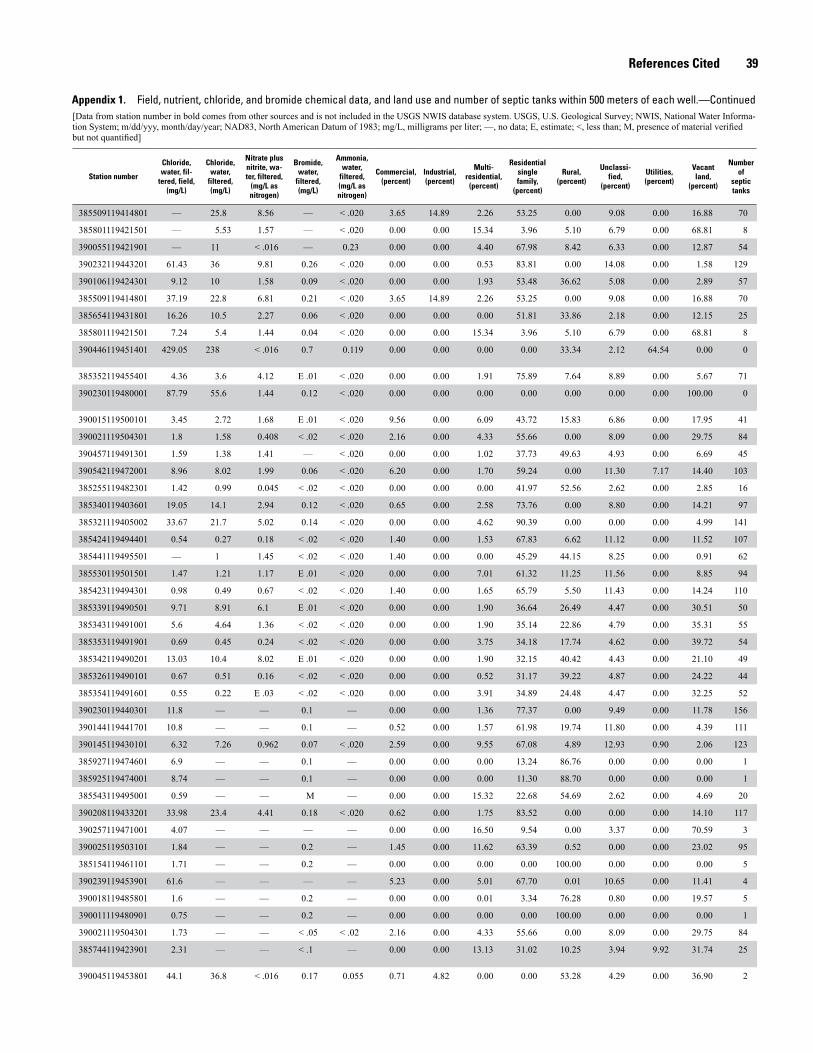
References Cited 39
[Data from station number in bold comes from other sources and is not included in the USGS NWIS database system. USGS, U.S. Geological Survey; NWIS, National Water Informa-tion System; m/dd/yyy, month/day/year; NAD83, North American Datum of 1983; mg/L, milligrams per liter; —, no data; E, estimate; <, less than; M, presence of material verified but not quantified]
Station number
Chloride, water, fil-
tered, field, (mg/L)
Chloride, water,
filtered, (mg/L)
Nitrate plus nitrite, wa-ter, filtered,
(mg/L as nitrogen)
Bromide, water,
filtered, (mg/L)
Ammonia, water,
filtered, (mg/L as nitrogen)
Commercial,(percent)
Industrial,(percent)
Multi-residential,
(percent)
Residential single family,
(percent)
Rural,(percent)
Unclassi-fied,
(percent)
Utilities,(percent)
Vacantland,
(percent)
Numberof
septictanks
385509119414801 — 25.8 8.56 — < .020 3.65 14.89 2.26 53.25 0.00 9.08 0.00 16.88 70
385801119421501 — 5.53 1.57 — < .020 0.00 0.00 15.34 3.96 5.10 6.79 0.00 68.81 8
390055119421901 — 11 < .016 — 0.23 0.00 0.00 4.40 67.98 8.42 6.33 0.00 12.87 54
390232119443201 61.43 36 9.81 0.26 < .020 0.00 0.00 0.53 83.81 0.00 14.08 0.00 1.58 129
390106119424301 9.12 10 1.58 0.09 < .020 0.00 0.00 1.93 53.48 36.62 5.08 0.00 2.89 57
385509119414801 37.19 22.8 6.81 0.21 < .020 3.65 14.89 2.26 53.25 0.00 9.08 0.00 16.88 70
385654119431801 16.26 10.5 2.27 0.06 < .020 0.00 0.00 0.00 51.81 33.86 2.18 0.00 12.15 25
385801119421501 7.24 5.4 1.44 0.04 < .020 0.00 0.00 15.34 3.96 5.10 6.79 0.00 68.81 8
390446119451401 429.05 238 < .016 0.7 0.119 0.00 0.00 0.00 0.00 33.34 2.12 64.54 0.00 0
385352119455401 4.36 3.6 4.12 E .01 < .020 0.00 0.00 1.91 75.89 7.64 8.89 0.00 5.67 71
390230119480001 87.79 55.6 1.44 0.12 < .020 0.00 0.00 0.00 0.00 0.00 0.00 0.00 100.00 0
390015119500101 3.45 2.72 1.68 E .01 < .020 9.56 0.00 6.09 43.72 15.83 6.86 0.00 17.95 41
390021119504301 1.8 1.58 0.408 < .02 < .020 2.16 0.00 4.33 55.66 0.00 8.09 0.00 29.75 84
390457119491301 1.59 1.38 1.41 — < .020 0.00 0.00 1.02 37.73 49.63 4.93 0.00 6.69 45
390542119472001 8.96 8.02 1.99 0.06 < .020 6.20 0.00 1.70 59.24 0.00 11.30 7.17 14.40 103
385255119482301 1.42 0.99 0.045 < .02 < .020 0.00 0.00 0.00 41.97 52.56 2.62 0.00 2.85 16
385340119403601 19.05 14.1 2.94 0.12 < .020 0.65 0.00 2.58 73.76 0.00 8.80 0.00 14.21 97
385321119405002 33.67 21.7 5.02 0.14 < .020 0.00 0.00 4.62 90.39 0.00 0.00 0.00 4.99 141
385424119494401 0.54 0.27 0.18 < .02 < .020 1.40 0.00 1.53 67.83 6.62 11.12 0.00 11.52 107
385441119495501 — 1 1.45 < .02 < .020 1.40 0.00 0.00 45.29 44.15 8.25 0.00 0.91 62
385530119501501 1.47 1.21 1.17 E .01 < .020 0.00 0.00 7.01 61.32 11.25 11.56 0.00 8.85 94
385423119494301 0.98 0.49 0.67 < .02 < .020 1.40 0.00 1.65 65.79 5.50 11.43 0.00 14.24 110
385339119490501 9.71 8.91 6.1 E .01 < .020 0.00 0.00 1.90 36.64 26.49 4.47 0.00 30.51 50
385343119491001 5.6 4.64 1.36 < .02 < .020 0.00 0.00 1.90 35.14 22.86 4.79 0.00 35.31 55
385353119491901 0.69 0.45 0.24 < .02 < .020 0.00 0.00 3.75 34.18 17.74 4.62 0.00 39.72 54
385342119490201 13.03 10.4 8.02 E .01 < .020 0.00 0.00 1.90 32.15 40.42 4.43 0.00 21.10 49
385326119490101 0.67 0.51 0.16 < .02 < .020 0.00 0.00 0.52 31.17 39.22 4.87 0.00 24.22 44
385354119491601 0.55 0.22 E .03 < .02 < .020 0.00 0.00 3.91 34.89 24.48 4.47 0.00 32.25 52
390230119440301 11.8 — — 0.1 — 0.00 0.00 1.36 77.37 0.00 9.49 0.00 11.78 156
390144119441701 10.8 — — 0.1 — 0.52 0.00 1.57 61.98 19.74 11.80 0.00 4.39 111
390145119430101 6.32 7.26 0.962 0.07 < .020 2.59 0.00 9.55 67.08 4.89 12.93 0.90 2.06 123
385927119474601 6.9 — — 0.1 — 0.00 0.00 0.00 13.24 86.76 0.00 0.00 0.00 1
385925119474001 8.74 — — 0.1 — 0.00 0.00 0.00 11.30 88.70 0.00 0.00 0.00 1
385543119495001 0.59 — — M — 0.00 0.00 15.32 22.68 54.69 2.62 0.00 4.69 20
390208119433201 33.98 23.4 4.41 0.18 < .020 0.62 0.00 1.75 83.52 0.00 0.00 0.00 14.10 117
390257119471001 4.07 — — — — 0.00 0.00 16.50 9.54 0.00 3.37 0.00 70.59 3
390025119503101 1.84 — — 0.2 — 1.45 0.00 11.62 63.39 0.52 0.00 0.00 23.02 95
385154119461101 1.71 — — 0.2 — 0.00 0.00 0.00 0.00 100.00 0.00 0.00 0.00 5
390239119453901 61.6 — — — — 5.23 0.00 5.01 67.70 0.01 10.65 0.00 11.41 4
390018119485801 1.6 — — 0.2 — 0.00 0.00 0.01 3.34 76.28 0.80 0.00 19.57 5
390011119480901 0.75 — — 0.2 — 0.00 0.00 0.00 0.00 100.00 0.00 0.00 0.00 1
390021119504301 1.73 — — < .05 < .02 2.16 0.00 4.33 55.66 0.00 8.09 0.00 29.75 84
385744119423901 2.31 — — < .1 — 0.00 0.00 13.13 31.02 10.25 3.94 9.92 31.74 25
390045119453801 44.1 36.8 < .016 0.17 0.055 0.71 4.82 0.00 0.00 53.28 4.29 0.00 36.90 2
Appendix 1. Field, nutrient, chloride, and bromide chemical data, and land use and number of septic tanks within 500 meters of each well.—Continued
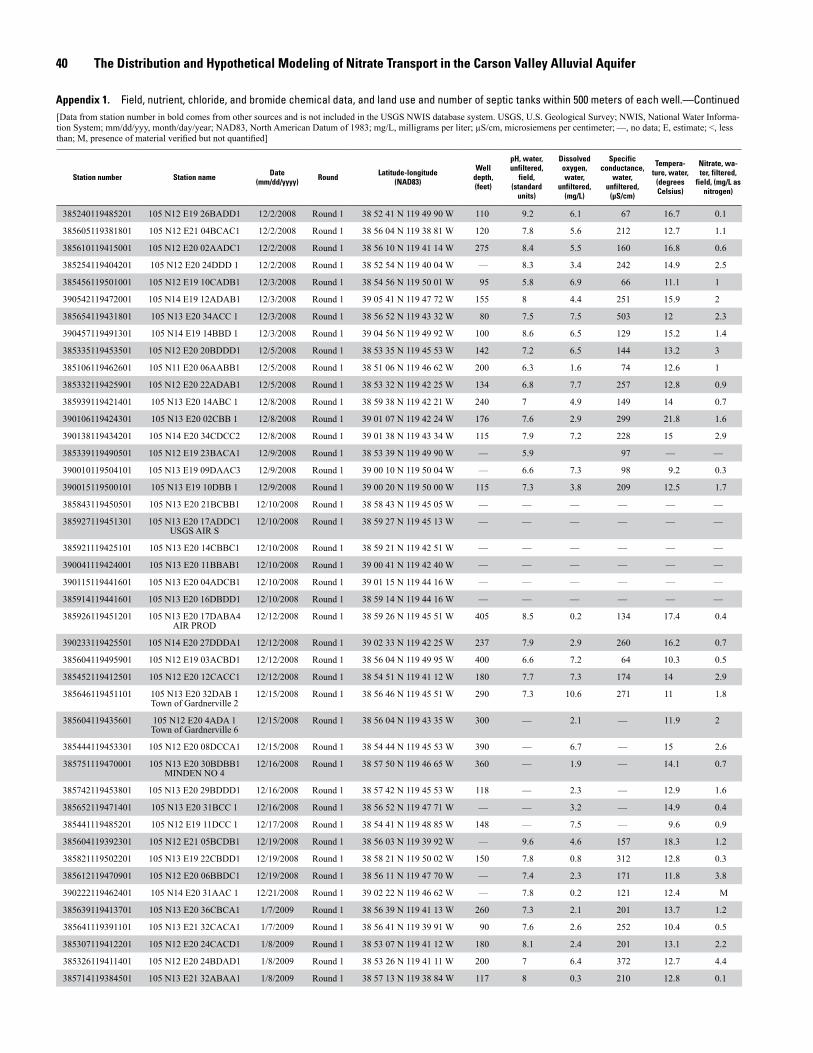
40 The Distribution and Hypothetical Modeling of Nitrate Transport in the Carson Valley Alluvial Aquifer
[Data from station number in bold comes from other sources and is not included in the USGS NWIS database system. USGS, U.S. Geological Survey; NWIS, National Water Informa-tion System; mm/dd/yyy, month/day/year; NAD83, North American Datum of 1983; mg/L, milligrams per liter; µS/cm, microsiemens per centimeter; —, no data; E, estimate; <, less than; M, presence of material verified but not quantified]
Station number Station name Date(mm/dd/yyyy) Round Latitude-longitude
(NAD83)
Welldepth,(feet)
pH, water, unfiltered,
field,(standard
units)
Dissolved oxygen, water,
unfiltered,(mg/L)
Specific conductance,
water, unfiltered,
(µS/cm)
Tempera-ture, water,
(degrees Celsius)
Nitrate, wa-ter, filtered,
field, (mg/L as nitrogen)
385240119485201 105 N12 E19 26BADD1 12/2/2008 Round 1 38 52 41 N 119 49 90 W 110 9.2 6.1 67 16.7 0.1
385605119381801 105 N12 E21 04BCAC1 12/2/2008 Round 1 38 56 04 N 119 38 81 W 120 7.8 5.6 212 12.7 1.1
385610119415001 105 N12 E20 02AADC1 12/2/2008 Round 1 38 56 10 N 119 41 14 W 275 8.4 5.5 160 16.8 0.6
385254119404201 105 N12 E20 24DDD 1 12/2/2008 Round 1 38 52 54 N 119 40 04 W — 8.3 3.4 242 14.9 2.5
385456119501001 105 N12 E19 10CADB1 12/3/2008 Round 1 38 54 56 N 119 50 01 W 95 5.8 6.9 66 11.1 1
390542119472001 105 N14 E19 12ADAB1 12/3/2008 Round 1 39 05 41 N 119 47 72 W 155 8 4.4 251 15.9 2
385654119431801 105 N13 E20 34ACC 1 12/3/2008 Round 1 38 56 52 N 119 43 32 W 80 7.5 7.5 503 12 2.3
390457119491301 105 N14 E19 14BBD 1 12/3/2008 Round 1 39 04 56 N 119 49 92 W 100 8.6 6.5 129 15.2 1.4
385335119453501 105 N12 E20 20BDDD1 12/5/2008 Round 1 38 53 35 N 119 45 53 W 142 7.2 6.5 144 13.2 3
385106119462601 105 N11 E20 06AABB1 12/5/2008 Round 1 38 51 06 N 119 46 62 W 200 6.3 1.6 74 12.6 1
385332119425901 105 N12 E20 22ADAB1 12/5/2008 Round 1 38 53 32 N 119 42 25 W 134 6.8 7.7 257 12.8 0.9
385939119421401 105 N13 E20 14ABC 1 12/8/2008 Round 1 38 59 38 N 119 42 21 W 240 7 4.9 149 14 0.7
390106119424301 105 N13 E20 02CBB 1 12/8/2008 Round 1 39 01 07 N 119 42 24 W 176 7.6 2.9 299 21.8 1.6
390138119434201 105 N14 E20 34CDCC2 12/8/2008 Round 1 39 01 38 N 119 43 34 W 115 7.9 7.2 228 15 2.9
385339119490501 105 N12 E19 23BACA1 12/9/2008 Round 1 38 53 39 N 119 49 90 W — 5.9 97 — —
390010119504101 105 N13 E19 09DAAC3 12/9/2008 Round 1 39 00 10 N 119 50 04 W — 6.6 7.3 98 9.2 0.3
390015119500101 105 N13 E19 10DBB 1 12/9/2008 Round 1 39 00 20 N 119 50 00 W 115 7.3 3.8 209 12.5 1.7
385843119450501 105 N13 E20 21BCBB1 12/10/2008 Round 1 38 58 43 N 119 45 05 W — — — — — —
385927119451301 105 N13 E20 17ADDC1USGS AIR S
12/10/2008 Round 1 38 59 27 N 119 45 13 W — — — — — —
385921119425101 105 N13 E20 14CBBC1 12/10/2008 Round 1 38 59 21 N 119 42 51 W — — — — — —
390041119424001 105 N13 E20 11BBAB1 12/10/2008 Round 1 39 00 41 N 119 42 40 W — — — — — —
390115119441601 105 N13 E20 04ADCB1 12/10/2008 Round 1 39 01 15 N 119 44 16 W — — — — — —
385914119441601 105 N13 E20 16DBDD1 12/10/2008 Round 1 38 59 14 N 119 44 16 W — — — — — —
385926119451201 105 N13 E20 17DABA4AIR PROD
12/12/2008 Round 1 38 59 26 N 119 45 51 W 405 8.5 0.2 134 17.4 0.4
390233119425501 105 N14 E20 27DDDA1 12/12/2008 Round 1 39 02 33 N 119 42 25 W 237 7.9 2.9 260 16.2 0.7
385604119495901 105 N12 E19 03ACBD1 12/12/2008 Round 1 38 56 04 N 119 49 95 W 400 6.6 7.2 64 10.3 0.5
385452119412501 105 N12 E20 12CACC1 12/12/2008 Round 1 38 54 51 N 119 41 12 W 180 7.7 7.3 174 14 2.9
385646119451101 105 N13 E20 32DAB 1Town of Gardnerville 2
12/15/2008 Round 1 38 56 46 N 119 45 51 W 290 7.3 10.6 271 11 1.8
385604119435601 105 N12 E20 4ADA 1Town of Gardnerville 6
12/15/2008 Round 1 38 56 04 N 119 43 35 W 300 — 2.1 — 11.9 2
385444119453301 105 N12 E20 08DCCA1 12/15/2008 Round 1 38 54 44 N 119 45 53 W 390 — 6.7 — 15 2.6
385751119470001 105 N13 E20 30BDBB1MINDEN NO 4
12/16/2008 Round 1 38 57 50 N 119 46 65 W 360 — 1.9 — 14.1 0.7
385742119453801 105 N13 E20 29BDDD1 12/16/2008 Round 1 38 57 42 N 119 45 53 W 118 — 2.3 — 12.9 1.6
385652119471401 105 N13 E20 31BCC 1 12/16/2008 Round 1 38 56 52 N 119 47 71 W — — 3.2 — 14.9 0.4
385441119485201 105 N12 E19 11DCC 1 12/17/2008 Round 1 38 54 41 N 119 48 85 W 148 — 7.5 — 9.6 0.9
385604119392301 105 N12 E21 05BCDB1 12/19/2008 Round 1 38 56 03 N 119 39 92 W — 9.6 4.6 157 18.3 1.2
385821119502201 105 N13 E19 22CBDD1 12/19/2008 Round 1 38 58 21 N 119 50 02 W 150 7.8 0.8 312 12.8 0.3
385612119470901 105 N12 E20 06BBDC1 12/19/2008 Round 1 38 56 11 N 119 47 70 W — 7.4 2.3 171 11.8 3.8
390222119462401 105 N14 E20 31AAC 1 12/21/2008 Round 1 39 02 22 N 119 46 62 W — 7.8 0.2 121 12.4 M
385639119413701 105 N13 E20 36CBCA1 1/7/2009 Round 1 38 56 39 N 119 41 13 W 260 7.3 2.1 201 13.7 1.2
385641119391101 105 N13 E21 32CACA1 1/7/2009 Round 1 38 56 41 N 119 39 91 W 90 7.6 2.6 252 10.4 0.5
385307119412201 105 N12 E20 24CACD1 1/8/2009 Round 1 38 53 07 N 119 41 12 W 180 8.1 2.4 201 13.1 2.2
385326119411401 105 N12 E20 24BDAD1 1/8/2009 Round 1 38 53 26 N 119 41 11 W 200 7 6.4 372 12.7 4.4
385714119384501 105 N13 E21 32ABAA1 1/8/2009 Round 1 38 57 13 N 119 38 84 W 117 8 0.3 210 12.8 0.1
Appendix 1. Field, nutrient, chloride, and bromide chemical data, and land use and number of septic tanks within 500 meters of each well.—Continued
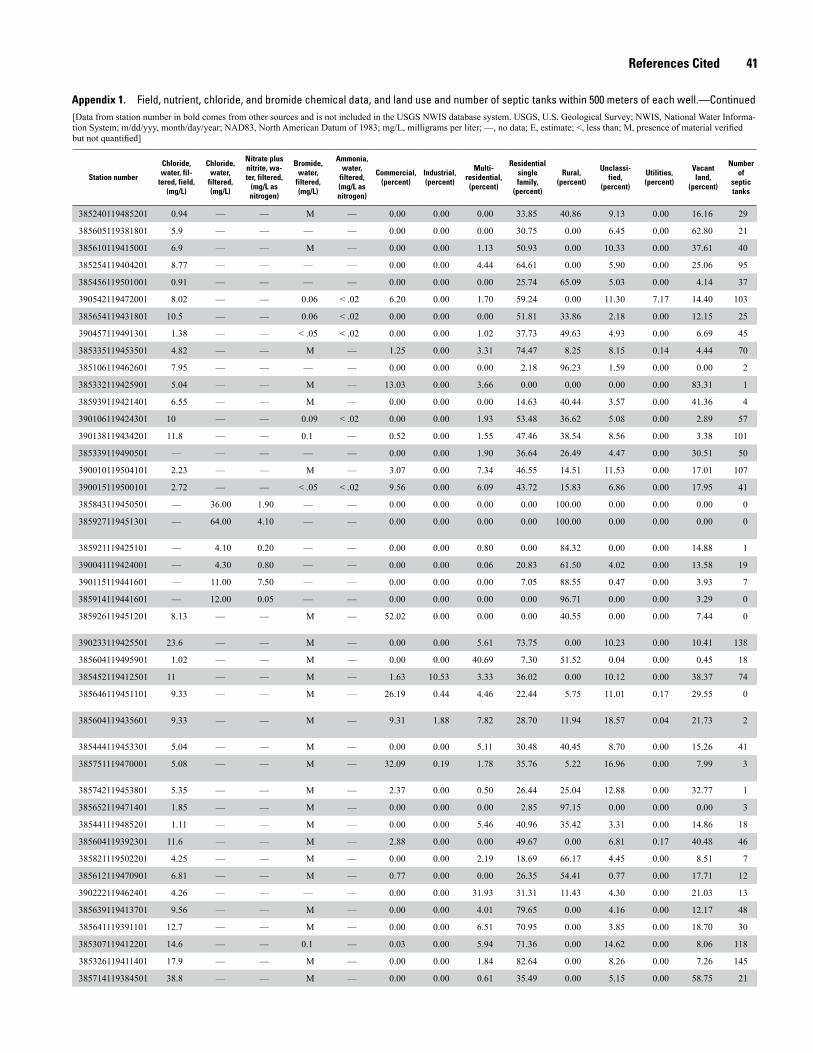
References Cited 41
[Data from station number in bold comes from other sources and is not included in the USGS NWIS database system. USGS, U.S. Geological Survey; NWIS, National Water Informa-tion System; m/dd/yyy, month/day/year; NAD83, North American Datum of 1983; mg/L, milligrams per liter; —, no data; E, estimate; <, less than; M, presence of material verified but not quantified]
Station number
Chloride, water, fil-
tered, field, (mg/L)
Chloride, water,
filtered, (mg/L)
Nitrate plus nitrite, wa-ter, filtered,
(mg/L as nitrogen)
Bromide, water,
filtered, (mg/L)
Ammonia, water,
filtered, (mg/L as nitrogen)
Commercial,(percent)
Industrial,(percent)
Multi-residential,
(percent)
Residential single family,
(percent)
Rural,(percent)
Unclassi-fied,
(percent)
Utilities,(percent)
Vacantland,
(percent)
Numberof
septictanks
385240119485201 0.94 — — M — 0.00 0.00 0.00 33.85 40.86 9.13 0.00 16.16 29
385605119381801 5.9 — — — — 0.00 0.00 0.00 30.75 0.00 6.45 0.00 62.80 21
385610119415001 6.9 — — M — 0.00 0.00 1.13 50.93 0.00 10.33 0.00 37.61 40
385254119404201 8.77 — — — — 0.00 0.00 4.44 64.61 0.00 5.90 0.00 25.06 95
385456119501001 0.91 — — — — 0.00 0.00 0.00 25.74 65.09 5.03 0.00 4.14 37
390542119472001 8.02 — — 0.06 < .02 6.20 0.00 1.70 59.24 0.00 11.30 7.17 14.40 103
385654119431801 10.5 — — 0.06 < .02 0.00 0.00 0.00 51.81 33.86 2.18 0.00 12.15 25
390457119491301 1.38 — — < .05 < .02 0.00 0.00 1.02 37.73 49.63 4.93 0.00 6.69 45
385335119453501 4.82 — — M — 1.25 0.00 3.31 74.47 8.25 8.15 0.14 4.44 70
385106119462601 7.95 — — — — 0.00 0.00 0.00 2.18 96.23 1.59 0.00 0.00 2
385332119425901 5.04 — — M — 13.03 0.00 3.66 0.00 0.00 0.00 0.00 83.31 1
385939119421401 6.55 — — M — 0.00 0.00 0.00 14.63 40.44 3.57 0.00 41.36 4
390106119424301 10 — — 0.09 < .02 0.00 0.00 1.93 53.48 36.62 5.08 0.00 2.89 57
390138119434201 11.8 — — 0.1 — 0.52 0.00 1.55 47.46 38.54 8.56 0.00 3.38 101
385339119490501 — — — — — 0.00 0.00 1.90 36.64 26.49 4.47 0.00 30.51 50
390010119504101 2.23 — — M — 3.07 0.00 7.34 46.55 14.51 11.53 0.00 17.01 107
390015119500101 2.72 — — < .05 < .02 9.56 0.00 6.09 43.72 15.83 6.86 0.00 17.95 41
385843119450501 — 36.00 1.90 — — 0.00 0.00 0.00 0.00 100.00 0.00 0.00 0.00 0
385927119451301 — 64.00 4.10 — — 0.00 0.00 0.00 0.00 100.00 0.00 0.00 0.00 0
385921119425101 — 4.10 0.20 — — 0.00 0.00 0.80 0.00 84.32 0.00 0.00 14.88 1
390041119424001 — 4.30 0.80 — — 0.00 0.00 0.06 20.83 61.50 4.02 0.00 13.58 19
390115119441601 — 11.00 7.50 — — 0.00 0.00 0.00 7.05 88.55 0.47 0.00 3.93 7
385914119441601 — 12.00 0.05 — — 0.00 0.00 0.00 0.00 96.71 0.00 0.00 3.29 0
385926119451201 8.13 — — M — 52.02 0.00 0.00 0.00 40.55 0.00 0.00 7.44 0
390233119425501 23.6 — — M — 0.00 0.00 5.61 73.75 0.00 10.23 0.00 10.41 138
385604119495901 1.02 — — M — 0.00 0.00 40.69 7.30 51.52 0.04 0.00 0.45 18
385452119412501 11 — — M — 1.63 10.53 3.33 36.02 0.00 10.12 0.00 38.37 74
385646119451101 9.33 — — M — 26.19 0.44 4.46 22.44 5.75 11.01 0.17 29.55 0
385604119435601 9.33 — — M — 9.31 1.88 7.82 28.70 11.94 18.57 0.04 21.73 2
385444119453301 5.04 — — M — 0.00 0.00 5.11 30.48 40.45 8.70 0.00 15.26 41
385751119470001 5.08 — — M — 32.09 0.19 1.78 35.76 5.22 16.96 0.00 7.99 3
385742119453801 5.35 — — M — 2.37 0.00 0.50 26.44 25.04 12.88 0.00 32.77 1
385652119471401 1.85 — — M — 0.00 0.00 0.00 2.85 97.15 0.00 0.00 0.00 3
385441119485201 1.11 — — M — 0.00 0.00 5.46 40.96 35.42 3.31 0.00 14.86 18
385604119392301 11.6 — — M — 2.88 0.00 0.00 49.67 0.00 6.81 0.17 40.48 46
385821119502201 4.25 — — M — 0.00 0.00 2.19 18.69 66.17 4.45 0.00 8.51 7
385612119470901 6.81 — — M — 0.77 0.00 0.00 26.35 54.41 0.77 0.00 17.71 12
390222119462401 4.26 — — — — 0.00 0.00 31.93 31.31 11.43 4.30 0.00 21.03 13
385639119413701 9.56 — — M — 0.00 0.00 4.01 79.65 0.00 4.16 0.00 12.17 48
385641119391101 12.7 — — M — 0.00 0.00 6.51 70.95 0.00 3.85 0.00 18.70 30
385307119412201 14.6 — — 0.1 — 0.03 0.00 5.94 71.36 0.00 14.62 0.00 8.06 118
385326119411401 17.9 — — M — 0.00 0.00 1.84 82.64 0.00 8.26 0.00 7.26 145
385714119384501 38.8 — — M — 0.00 0.00 0.61 35.49 0.00 5.15 0.00 58.75 21
Appendix 1. Field, nutrient, chloride, and bromide chemical data, and land use and number of septic tanks within 500 meters of each well.—Continued
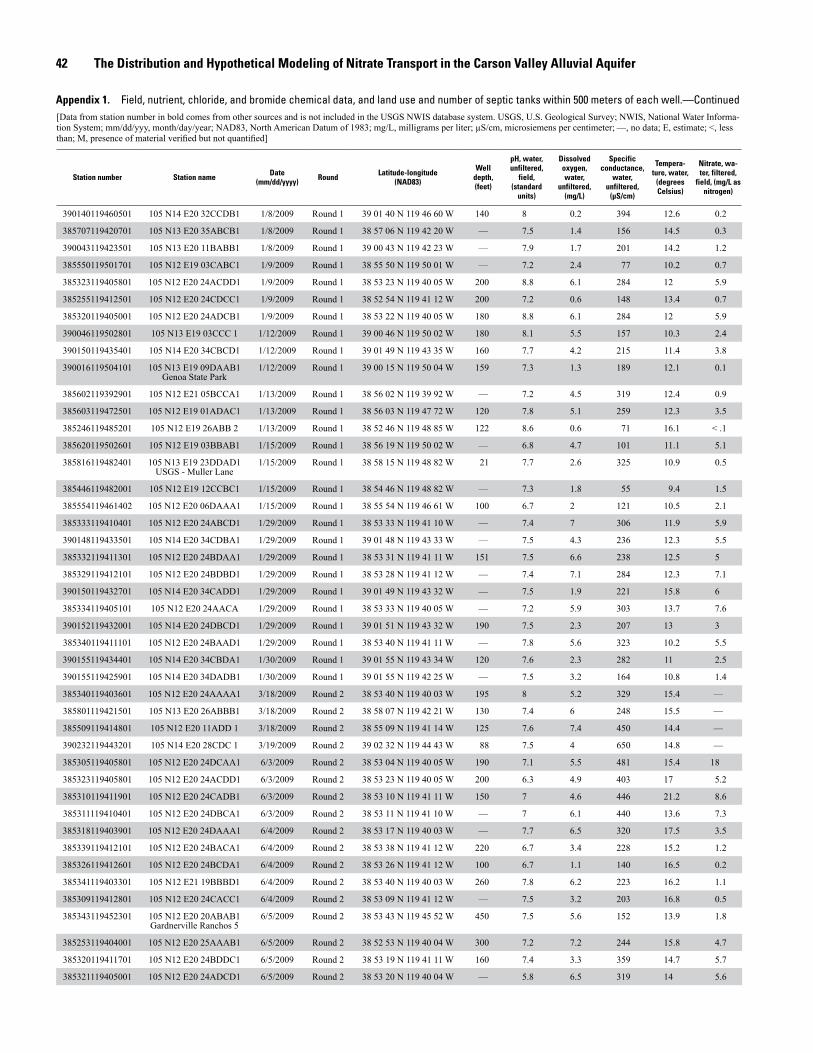
42 The Distribution and Hypothetical Modeling of Nitrate Transport in the Carson Valley Alluvial Aquifer
[Data from station number in bold comes from other sources and is not included in the USGS NWIS database system. USGS, U.S. Geological Survey; NWIS, National Water Informa-tion System; mm/dd/yyy, month/day/year; NAD83, North American Datum of 1983; mg/L, milligrams per liter; µS/cm, microsiemens per centimeter; —, no data; E, estimate; <, less than; M, presence of material verified but not quantified]
Station number Station name Date(mm/dd/yyyy) Round Latitude-longitude
(NAD83)
Welldepth,(feet)
pH, water, unfiltered,
field,(standard
units)
Dissolved oxygen, water,
unfiltered,(mg/L)
Specific conductance,
water, unfiltered,
(µS/cm)
Tempera-ture, water,
(degrees Celsius)
Nitrate, wa-ter, filtered,
field, (mg/L as nitrogen)
390140119460501 105 N14 E20 32CCDB1 1/8/2009 Round 1 39 01 40 N 119 46 60 W 140 8 0.2 394 12.6 0.2
385707119420701 105 N13 E20 35ABCB1 1/8/2009 Round 1 38 57 06 N 119 42 20 W — 7.5 1.4 156 14.5 0.3
390043119423501 105 N13 E20 11BABB1 1/8/2009 Round 1 39 00 43 N 119 42 23 W — 7.9 1.7 201 14.2 1.2
385550119501701 105 N12 E19 03CABC1 1/9/2009 Round 1 38 55 50 N 119 50 01 W — 7.2 2.4 77 10.2 0.7
385323119405801 105 N12 E20 24ACDD1 1/9/2009 Round 1 38 53 23 N 119 40 05 W 200 8.8 6.1 284 12 5.9
385255119412501 105 N12 E20 24CDCC1 1/9/2009 Round 1 38 52 54 N 119 41 12 W 200 7.2 0.6 148 13.4 0.7
385320119405001 105 N12 E20 24ADCB1 1/9/2009 Round 1 38 53 22 N 119 40 05 W 180 8.8 6.1 284 12 5.9
390046119502801 105 N13 E19 03CCC 1 1/12/2009 Round 1 39 00 46 N 119 50 02 W 180 8.1 5.5 157 10.3 2.4
390150119435401 105 N14 E20 34CBCD1 1/12/2009 Round 1 39 01 49 N 119 43 35 W 160 7.7 4.2 215 11.4 3.8
390016119504101 105 N13 E19 09DAAB1Genoa State Park
1/12/2009 Round 1 39 00 15 N 119 50 04 W 159 7.3 1.3 189 12.1 0.1
385602119392901 105 N12 E21 05BCCA1 1/13/2009 Round 1 38 56 02 N 119 39 92 W — 7.2 4.5 319 12.4 0.9
385603119472501 105 N12 E19 01ADAC1 1/13/2009 Round 1 38 56 03 N 119 47 72 W 120 7.8 5.1 259 12.3 3.5
385246119485201 105 N12 E19 26ABB 2 1/13/2009 Round 1 38 52 46 N 119 48 85 W 122 8.6 0.6 71 16.1 < .1
385620119502601 105 N12 E19 03BBAB1 1/15/2009 Round 1 38 56 19 N 119 50 02 W — 6.8 4.7 101 11.1 5.1
385816119482401 105 N13 E19 23DDAD1USGS - Muller Lane
1/15/2009 Round 1 38 58 15 N 119 48 82 W 21 7.7 2.6 325 10.9 0.5
385446119482001 105 N12 E19 12CCBC1 1/15/2009 Round 1 38 54 46 N 119 48 82 W — 7.3 1.8 55 9.4 1.5
385554119461402 105 N12 E20 06DAAA1 1/15/2009 Round 1 38 55 54 N 119 46 61 W 100 6.7 2 121 10.5 2.1
385333119410401 105 N12 E20 24ABCD1 1/29/2009 Round 1 38 53 33 N 119 41 10 W — 7.4 7 306 11.9 5.9
390148119433501 105 N14 E20 34CDBA1 1/29/2009 Round 1 39 01 48 N 119 43 33 W — 7.5 4.3 236 12.3 5.5
385332119411301 105 N12 E20 24BDAA1 1/29/2009 Round 1 38 53 31 N 119 41 11 W 151 7.5 6.6 238 12.5 5
385329119412101 105 N12 E20 24BDBD1 1/29/2009 Round 1 38 53 28 N 119 41 12 W — 7.4 7.1 284 12.3 7.1
390150119432701 105 N14 E20 34CADD1 1/29/2009 Round 1 39 01 49 N 119 43 32 W — 7.5 1.9 221 15.8 6
385334119405101 105 N12 E20 24AACA 1/29/2009 Round 1 38 53 33 N 119 40 05 W — 7.2 5.9 303 13.7 7.6
390152119432001 105 N14 E20 24DBCD1 1/29/2009 Round 1 39 01 51 N 119 43 32 W 190 7.5 2.3 207 13 3
385340119411101 105 N12 E20 24BAAD1 1/29/2009 Round 1 38 53 40 N 119 41 11 W — 7.8 5.6 323 10.2 5.5
390155119434401 105 N14 E20 34CBDA1 1/30/2009 Round 1 39 01 55 N 119 43 34 W 120 7.6 2.3 282 11 2.5
390155119425901 105 N14 E20 34DADB1 1/30/2009 Round 1 39 01 55 N 119 42 25 W — 7.5 3.2 164 10.8 1.4
385340119403601 105 N12 E20 24AAAA1 3/18/2009 Round 2 38 53 40 N 119 40 03 W 195 8 5.2 329 15.4 —
385801119421501 105 N13 E20 26ABBB1 3/18/2009 Round 2 38 58 07 N 119 42 21 W 130 7.4 6 248 15.5 —
385509119414801 105 N12 E20 11ADD 1 3/18/2009 Round 2 38 55 09 N 119 41 14 W 125 7.6 7.4 450 14.4 —
390232119443201 105 N14 E20 28CDC 1 3/19/2009 Round 2 39 02 32 N 119 44 43 W 88 7.5 4 650 14.8 —
385305119405801 105 N12 E20 24DCAA1 6/3/2009 Round 2 38 53 04 N 119 40 05 W 190 7.1 5.5 481 15.4 18
385323119405801 105 N12 E20 24ACDD1 6/3/2009 Round 2 38 53 23 N 119 40 05 W 200 6.3 4.9 403 17 5.2
385310119411901 105 N12 E20 24CADB1 6/3/2009 Round 2 38 53 10 N 119 41 11 W 150 7 4.6 446 21.2 8.6
385311119410401 105 N12 E20 24DBCA1 6/3/2009 Round 2 38 53 11 N 119 41 10 W — 7 6.1 440 13.6 7.3
385318119403901 105 N12 E20 24DAAA1 6/4/2009 Round 2 38 53 17 N 119 40 03 W — 7.7 6.5 320 17.5 3.5
385339119412101 105 N12 E20 24BACA1 6/4/2009 Round 2 38 53 38 N 119 41 12 W 220 6.7 3.4 228 15.2 1.2
385326119412601 105 N12 E20 24BCDA1 6/4/2009 Round 2 38 53 26 N 119 41 12 W 100 6.7 1.1 140 16.5 0.2
385341119403301 105 N12 E21 19BBBD1 6/4/2009 Round 2 38 53 40 N 119 40 03 W 260 7.8 6.2 223 16.2 1.1
385309119412801 105 N12 E20 24CACC1 6/4/2009 Round 2 38 53 09 N 119 41 12 W — 7.5 3.2 203 16.8 0.5
385343119452301 105 N12 E20 20ABAB1Gardnerville Ranchos 5
6/5/2009 Round 2 38 53 43 N 119 45 52 W 450 7.5 5.6 152 13.9 1.8
385253119404001 105 N12 E20 25AAAB1 6/5/2009 Round 2 38 52 53 N 119 40 04 W 300 7.2 7.2 244 15.8 4.7
385320119411701 105 N12 E20 24BDDC1 6/5/2009 Round 2 38 53 19 N 119 41 11 W 160 7.4 3.3 359 14.7 5.7
385321119405001 105 N12 E20 24ADCD1 6/5/2009 Round 2 38 53 20 N 119 40 04 W — 5.8 6.5 319 14 5.6
Appendix 1. Field, nutrient, chloride, and bromide chemical data, and land use and number of septic tanks within 500 meters of each well.—Continued
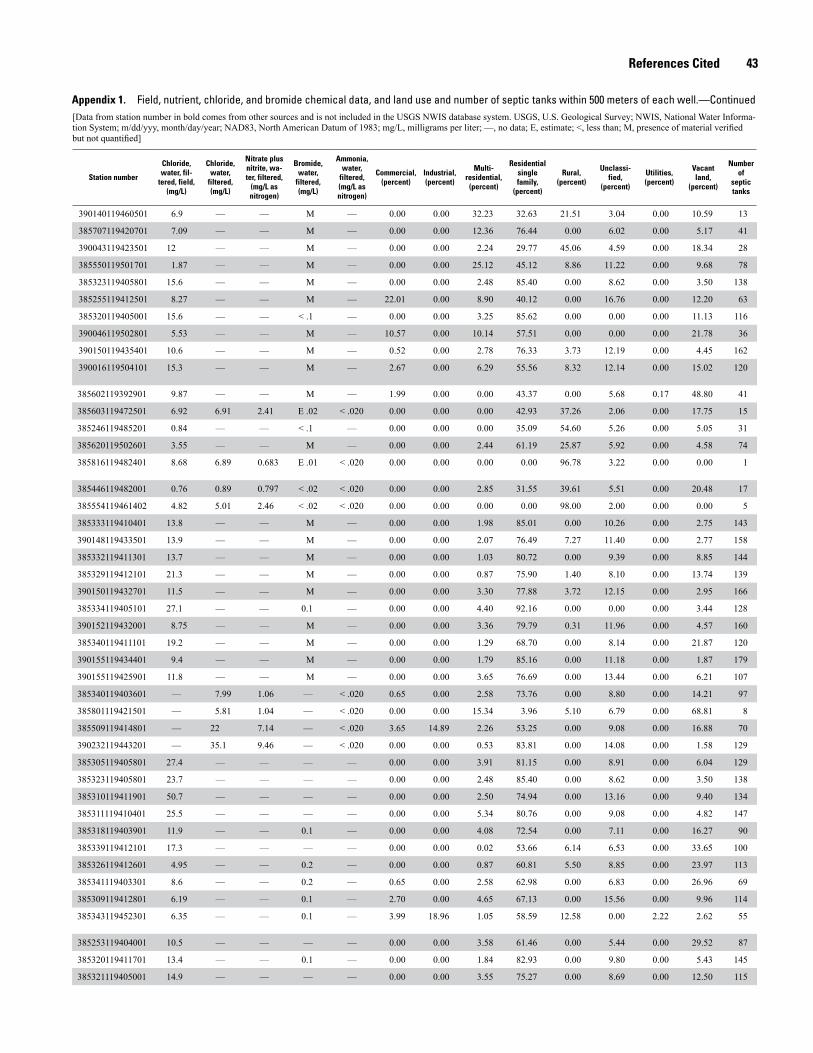
References Cited 43
[Data from station number in bold comes from other sources and is not included in the USGS NWIS database system. USGS, U.S. Geological Survey; NWIS, National Water Informa-tion System; m/dd/yyy, month/day/year; NAD83, North American Datum of 1983; mg/L, milligrams per liter; —, no data; E, estimate; <, less than; M, presence of material verified but not quantified]
Station number
Chloride, water, fil-
tered, field, (mg/L)
Chloride, water,
filtered, (mg/L)
Nitrate plus nitrite, wa-ter, filtered,
(mg/L as nitrogen)
Bromide, water,
filtered, (mg/L)
Ammonia, water,
filtered, (mg/L as nitrogen)
Commercial,(percent)
Industrial,(percent)
Multi-residential,
(percent)
Residential single family,
(percent)
Rural,(percent)
Unclassi-fied,
(percent)
Utilities,(percent)
Vacantland,
(percent)
Numberof
septictanks
390140119460501 6.9 — — M — 0.00 0.00 32.23 32.63 21.51 3.04 0.00 10.59 13
385707119420701 7.09 — — M — 0.00 0.00 12.36 76.44 0.00 6.02 0.00 5.17 41
390043119423501 12 — — M — 0.00 0.00 2.24 29.77 45.06 4.59 0.00 18.34 28
385550119501701 1.87 — — M — 0.00 0.00 25.12 45.12 8.86 11.22 0.00 9.68 78
385323119405801 15.6 — — M — 0.00 0.00 2.48 85.40 0.00 8.62 0.00 3.50 138
385255119412501 8.27 — — M — 22.01 0.00 8.90 40.12 0.00 16.76 0.00 12.20 63
385320119405001 15.6 — — < .1 — 0.00 0.00 3.25 85.62 0.00 0.00 0.00 11.13 116
390046119502801 5.53 — — M — 10.57 0.00 10.14 57.51 0.00 0.00 0.00 21.78 36
390150119435401 10.6 — — M — 0.52 0.00 2.78 76.33 3.73 12.19 0.00 4.45 162
390016119504101 15.3 — — M — 2.67 0.00 6.29 55.56 8.32 12.14 0.00 15.02 120
385602119392901 9.87 — — M — 1.99 0.00 0.00 43.37 0.00 5.68 0.17 48.80 41
385603119472501 6.92 6.91 2.41 E .02 < .020 0.00 0.00 0.00 42.93 37.26 2.06 0.00 17.75 15
385246119485201 0.84 — — < .1 — 0.00 0.00 0.00 35.09 54.60 5.26 0.00 5.05 31
385620119502601 3.55 — — M — 0.00 0.00 2.44 61.19 25.87 5.92 0.00 4.58 74
385816119482401 8.68 6.89 0.683 E .01 < .020 0.00 0.00 0.00 0.00 96.78 3.22 0.00 0.00 1
385446119482001 0.76 0.89 0.797 < .02 < .020 0.00 0.00 2.85 31.55 39.61 5.51 0.00 20.48 17
385554119461402 4.82 5.01 2.46 < .02 < .020 0.00 0.00 0.00 0.00 98.00 2.00 0.00 0.00 5
385333119410401 13.8 — — M — 0.00 0.00 1.98 85.01 0.00 10.26 0.00 2.75 143
390148119433501 13.9 — — M — 0.00 0.00 2.07 76.49 7.27 11.40 0.00 2.77 158
385332119411301 13.7 — — M — 0.00 0.00 1.03 80.72 0.00 9.39 0.00 8.85 144
385329119412101 21.3 — — M — 0.00 0.00 0.87 75.90 1.40 8.10 0.00 13.74 139
390150119432701 11.5 — — M — 0.00 0.00 3.30 77.88 3.72 12.15 0.00 2.95 166
385334119405101 27.1 — — 0.1 — 0.00 0.00 4.40 92.16 0.00 0.00 0.00 3.44 128
390152119432001 8.75 — — M — 0.00 0.00 3.36 79.79 0.31 11.96 0.00 4.57 160
385340119411101 19.2 — — M — 0.00 0.00 1.29 68.70 0.00 8.14 0.00 21.87 120
390155119434401 9.4 — — M — 0.00 0.00 1.79 85.16 0.00 11.18 0.00 1.87 179
390155119425901 11.8 — — M — 0.00 0.00 3.65 76.69 0.00 13.44 0.00 6.21 107
385340119403601 — 7.99 1.06 — < .020 0.65 0.00 2.58 73.76 0.00 8.80 0.00 14.21 97
385801119421501 — 5.81 1.04 — < .020 0.00 0.00 15.34 3.96 5.10 6.79 0.00 68.81 8
385509119414801 — 22 7.14 — < .020 3.65 14.89 2.26 53.25 0.00 9.08 0.00 16.88 70
390232119443201 — 35.1 9.46 — < .020 0.00 0.00 0.53 83.81 0.00 14.08 0.00 1.58 129
385305119405801 27.4 — — — — 0.00 0.00 3.91 81.15 0.00 8.91 0.00 6.04 129
385323119405801 23.7 — — — — 0.00 0.00 2.48 85.40 0.00 8.62 0.00 3.50 138
385310119411901 50.7 — — — — 0.00 0.00 2.50 74.94 0.00 13.16 0.00 9.40 134
385311119410401 25.5 — — — — 0.00 0.00 5.34 80.76 0.00 9.08 0.00 4.82 147
385318119403901 11.9 — — 0.1 — 0.00 0.00 4.08 72.54 0.00 7.11 0.00 16.27 90
385339119412101 17.3 — — — — 0.00 0.00 0.02 53.66 6.14 6.53 0.00 33.65 100
385326119412601 4.95 — — 0.2 — 0.00 0.00 0.87 60.81 5.50 8.85 0.00 23.97 113
385341119403301 8.6 — — 0.2 — 0.65 0.00 2.58 62.98 0.00 6.83 0.00 26.96 69
385309119412801 6.19 — — 0.1 — 2.70 0.00 4.65 67.13 0.00 15.56 0.00 9.96 114
385343119452301 6.35 — — 0.1 — 3.99 18.96 1.05 58.59 12.58 0.00 2.22 2.62 55
385253119404001 10.5 — — — — 0.00 0.00 3.58 61.46 0.00 5.44 0.00 29.52 87
385320119411701 13.4 — — 0.1 — 0.00 0.00 1.84 82.93 0.00 9.80 0.00 5.43 145
385321119405001 14.9 — — — — 0.00 0.00 3.55 75.27 0.00 8.69 0.00 12.50 115
Appendix 1. Field, nutrient, chloride, and bromide chemical data, and land use and number of septic tanks within 500 meters of each well.—Continued
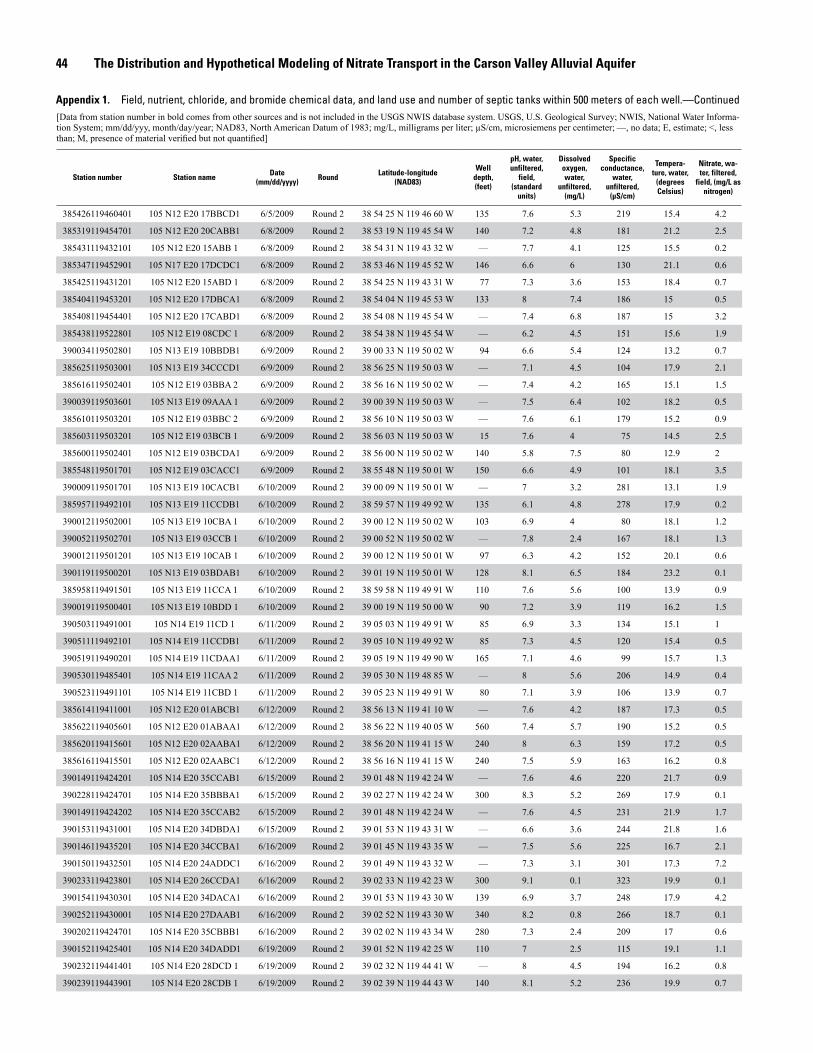
44 The Distribution and Hypothetical Modeling of Nitrate Transport in the Carson Valley Alluvial Aquifer
[Data from station number in bold comes from other sources and is not included in the USGS NWIS database system. USGS, U.S. Geological Survey; NWIS, National Water Informa-tion System; mm/dd/yyy, month/day/year; NAD83, North American Datum of 1983; mg/L, milligrams per liter; µS/cm, microsiemens per centimeter; —, no data; E, estimate; <, less than; M, presence of material verified but not quantified]
Station number Station name Date(mm/dd/yyyy) Round Latitude-longitude
(NAD83)
Welldepth,(feet)
pH, water, unfiltered,
field,(standard
units)
Dissolved oxygen, water,
unfiltered,(mg/L)
Specific conductance,
water, unfiltered,
(µS/cm)
Tempera-ture, water,
(degrees Celsius)
Nitrate, wa-ter, filtered,
field, (mg/L as nitrogen)
385426119460401 105 N12 E20 17BBCD1 6/5/2009 Round 2 38 54 25 N 119 46 60 W 135 7.6 5.3 219 15.4 4.2
385319119454701 105 N12 E20 20CABB1 6/8/2009 Round 2 38 53 19 N 119 45 54 W 140 7.2 4.8 181 21.2 2.5
385431119432101 105 N12 E20 15ABB 1 6/8/2009 Round 2 38 54 31 N 119 43 32 W — 7.7 4.1 125 15.5 0.2
385347119452901 105 N17 E20 17DCDC1 6/8/2009 Round 2 38 53 46 N 119 45 52 W 146 6.6 6 130 21.1 0.6
385425119431201 105 N12 E20 15ABD 1 6/8/2009 Round 2 38 54 25 N 119 43 31 W 77 7.3 3.6 153 18.4 0.7
385404119453201 105 N12 E20 17DBCA1 6/8/2009 Round 2 38 54 04 N 119 45 53 W 133 8 7.4 186 15 0.5
385408119454401 105 N12 E20 17CABD1 6/8/2009 Round 2 38 54 08 N 119 45 54 W — 7.4 6.8 187 15 3.2
385438119522801 105 N12 E19 08CDC 1 6/8/2009 Round 2 38 54 38 N 119 45 54 W — 6.2 4.5 151 15.6 1.9
390034119502801 105 N13 E19 10BBDB1 6/9/2009 Round 2 39 00 33 N 119 50 02 W 94 6.6 5.4 124 13.2 0.7
385625119503001 105 N13 E19 34CCCD1 6/9/2009 Round 2 38 56 25 N 119 50 03 W — 7.1 4.5 104 17.9 2.1
385616119502401 105 N12 E19 03BBA 2 6/9/2009 Round 2 38 56 16 N 119 50 02 W — 7.4 4.2 165 15.1 1.5
390039119503601 105 N13 E19 09AAA 1 6/9/2009 Round 2 39 00 39 N 119 50 03 W — 7.5 6.4 102 18.2 0.5
385610119503201 105 N12 E19 03BBC 2 6/9/2009 Round 2 38 56 10 N 119 50 03 W — 7.6 6.1 179 15.2 0.9
385603119503201 105 N12 E19 03BCB 1 6/9/2009 Round 2 38 56 03 N 119 50 03 W 15 7.6 4 75 14.5 2.5
385600119502401 105 N12 E19 03BCDA1 6/9/2009 Round 2 38 56 00 N 119 50 02 W 140 5.8 7.5 80 12.9 2
385548119501701 105 N12 E19 03CACC1 6/9/2009 Round 2 38 55 48 N 119 50 01 W 150 6.6 4.9 101 18.1 3.5
390009119501701 105 N13 E19 10CACB1 6/10/2009 Round 2 39 00 09 N 119 50 01 W — 7 3.2 281 13.1 1.9
385957119492101 105 N13 E19 11CCDB1 6/10/2009 Round 2 38 59 57 N 119 49 92 W 135 6.1 4.8 278 17.9 0.2
390012119502001 105 N13 E19 10CBA 1 6/10/2009 Round 2 39 00 12 N 119 50 02 W 103 6.9 4 80 18.1 1.2
390052119502701 105 N13 E19 03CCB 1 6/10/2009 Round 2 39 00 52 N 119 50 02 W — 7.8 2.4 167 18.1 1.3
390012119501201 105 N13 E19 10CAB 1 6/10/2009 Round 2 39 00 12 N 119 50 01 W 97 6.3 4.2 152 20.1 0.6
390119119500201 105 N13 E19 03BDAB1 6/10/2009 Round 2 39 01 19 N 119 50 01 W 128 8.1 6.5 184 23.2 0.1
385958119491501 105 N13 E19 11CCA 1 6/10/2009 Round 2 38 59 58 N 119 49 91 W 110 7.6 5.6 100 13.9 0.9
390019119500401 105 N13 E19 10BDD 1 6/10/2009 Round 2 39 00 19 N 119 50 00 W 90 7.2 3.9 119 16.2 1.5
390503119491001 105 N14 E19 11CD 1 6/11/2009 Round 2 39 05 03 N 119 49 91 W 85 6.9 3.3 134 15.1 1
390511119492101 105 N14 E19 11CCDB1 6/11/2009 Round 2 39 05 10 N 119 49 92 W 85 7.3 4.5 120 15.4 0.5
390519119490201 105 N14 E19 11CDAA1 6/11/2009 Round 2 39 05 19 N 119 49 90 W 165 7.1 4.6 99 15.7 1.3
390530119485401 105 N14 E19 11CAA 2 6/11/2009 Round 2 39 05 30 N 119 48 85 W — 8 5.6 206 14.9 0.4
390523119491101 105 N14 E19 11CBD 1 6/11/2009 Round 2 39 05 23 N 119 49 91 W 80 7.1 3.9 106 13.9 0.7
385614119411001 105 N12 E20 01ABCB1 6/12/2009 Round 2 38 56 13 N 119 41 10 W — 7.6 4.2 187 17.3 0.5
385622119405601 105 N12 E20 01ABAA1 6/12/2009 Round 2 38 56 22 N 119 40 05 W 560 7.4 5.7 190 15.2 0.5
385620119415601 105 N12 E20 02AABA1 6/12/2009 Round 2 38 56 20 N 119 41 15 W 240 8 6.3 159 17.2 0.5
385616119415501 105 N12 E20 02AABC1 6/12/2009 Round 2 38 56 16 N 119 41 15 W 240 7.5 5.9 163 16.2 0.8
390149119424201 105 N14 E20 35CCAB1 6/15/2009 Round 2 39 01 48 N 119 42 24 W — 7.6 4.6 220 21.7 0.9
390228119424701 105 N14 E20 35BBBA1 6/15/2009 Round 2 39 02 27 N 119 42 24 W 300 8.3 5.2 269 17.9 0.1
390149119424202 105 N14 E20 35CCAB2 6/15/2009 Round 2 39 01 48 N 119 42 24 W — 7.6 4.5 231 21.9 1.7
390153119431001 105 N14 E20 34DBDA1 6/15/2009 Round 2 39 01 53 N 119 43 31 W — 6.6 3.6 244 21.8 1.6
390146119435201 105 N14 E20 34CCBA1 6/16/2009 Round 2 39 01 45 N 119 43 35 W — 7.5 5.6 225 16.7 2.1
390150119432501 105 N14 E20 24ADDC1 6/16/2009 Round 2 39 01 49 N 119 43 32 W — 7.3 3.1 301 17.3 7.2
390233119423801 105 N14 E20 26CCDA1 6/16/2009 Round 2 39 02 33 N 119 42 23 W 300 9.1 0.1 323 19.9 0.1
390154119430301 105 N14 E20 34DACA1 6/16/2009 Round 2 39 01 53 N 119 43 30 W 139 6.9 3.7 248 17.9 4.2
390252119430001 105 N14 E20 27DAAB1 6/16/2009 Round 2 39 02 52 N 119 43 30 W 340 8.2 0.8 266 18.7 0.1
390202119424701 105 N14 E20 35CBBB1 6/16/2009 Round 2 39 02 02 N 119 43 34 W 280 7.3 2.4 209 17 0.6
390152119425401 105 N14 E20 34DADD1 6/19/2009 Round 2 39 01 52 N 119 42 25 W 110 7 2.5 115 19.1 1.1
390232119441401 105 N14 E20 28DCD 1 6/19/2009 Round 2 39 02 32 N 119 44 41 W — 8 4.5 194 16.2 0.8
390239119443901 105 N14 E20 28CDB 1 6/19/2009 Round 2 39 02 39 N 119 44 43 W 140 8.1 5.2 236 19.9 0.7
Appendix 1. Field, nutrient, chloride, and bromide chemical data, and land use and number of septic tanks within 500 meters of each well.—Continued
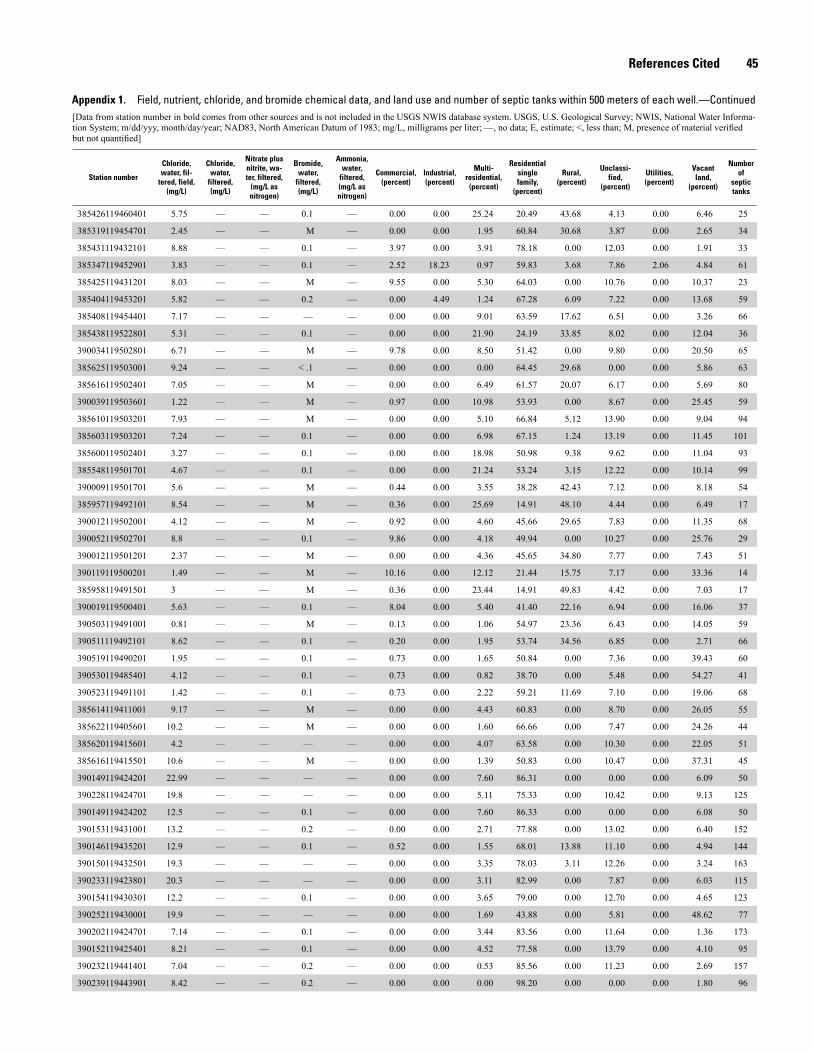
References Cited 45
[Data from station number in bold comes from other sources and is not included in the USGS NWIS database system. USGS, U.S. Geological Survey; NWIS, National Water Informa-tion System; m/dd/yyy, month/day/year; NAD83, North American Datum of 1983; mg/L, milligrams per liter; —, no data; E, estimate; <, less than; M, presence of material verified but not quantified]
Station number
Chloride, water, fil-
tered, field, (mg/L)
Chloride, water,
filtered, (mg/L)
Nitrate plus nitrite, wa-ter, filtered,
(mg/L as nitrogen)
Bromide, water,
filtered, (mg/L)
Ammonia, water,
filtered, (mg/L as nitrogen)
Commercial,(percent)
Industrial,(percent)
Multi-residential,
(percent)
Residential single family,
(percent)
Rural,(percent)
Unclassi-fied,
(percent)
Utilities,(percent)
Vacantland,
(percent)
Numberof
septictanks
385426119460401 5.75 — — 0.1 — 0.00 0.00 25.24 20.49 43.68 4.13 0.00 6.46 25
385319119454701 2.45 — — M — 0.00 0.00 1.95 60.84 30.68 3.87 0.00 2.65 34
385431119432101 8.88 — — 0.1 — 3.97 0.00 3.91 78.18 0.00 12.03 0.00 1.91 33
385347119452901 3.83 — — 0.1 — 2.52 18.23 0.97 59.83 3.68 7.86 2.06 4.84 61
385425119431201 8.03 — — M — 9.55 0.00 5.30 64.03 0.00 10.76 0.00 10.37 23
385404119453201 5.82 — — 0.2 — 0.00 4.49 1.24 67.28 6.09 7.22 0.00 13.68 59
385408119454401 7.17 — — — — 0.00 0.00 9.01 63.59 17.62 6.51 0.00 3.26 66
385438119522801 5.31 — — 0.1 — 0.00 0.00 21.90 24.19 33.85 8.02 0.00 12.04 36
390034119502801 6.71 — — M — 9.78 0.00 8.50 51.42 0.00 9.80 0.00 20.50 65
385625119503001 9.24 — — < .1 — 0.00 0.00 0.00 64.45 29.68 0.00 0.00 5.86 63
385616119502401 7.05 — — M — 0.00 0.00 6.49 61.57 20.07 6.17 0.00 5.69 80
390039119503601 1.22 — — M — 0.97 0.00 10.98 53.93 0.00 8.67 0.00 25.45 59
385610119503201 7.93 — — M — 0.00 0.00 5.10 66.84 5.12 13.90 0.00 9.04 94
385603119503201 7.24 — — 0.1 — 0.00 0.00 6.98 67.15 1.24 13.19 0.00 11.45 101
385600119502401 3.27 — — 0.1 — 0.00 0.00 18.98 50.98 9.38 9.62 0.00 11.04 93
385548119501701 4.67 — — 0.1 — 0.00 0.00 21.24 53.24 3.15 12.22 0.00 10.14 99
390009119501701 5.6 — — M — 0.44 0.00 3.55 38.28 42.43 7.12 0.00 8.18 54
385957119492101 8.54 — — M — 0.36 0.00 25.69 14.91 48.10 4.44 0.00 6.49 17
390012119502001 4.12 — — M — 0.92 0.00 4.60 45.66 29.65 7.83 0.00 11.35 68
390052119502701 8.8 — — 0.1 — 9.86 0.00 4.18 49.94 0.00 10.27 0.00 25.76 29
390012119501201 2.37 — — M — 0.00 0.00 4.36 45.65 34.80 7.77 0.00 7.43 51
390119119500201 1.49 — — M — 10.16 0.00 12.12 21.44 15.75 7.17 0.00 33.36 14
385958119491501 3 — — M — 0.36 0.00 23.44 14.91 49.83 4.42 0.00 7.03 17
390019119500401 5.63 — — 0.1 — 8.04 0.00 5.40 41.40 22.16 6.94 0.00 16.06 37
390503119491001 0.81 — — M — 0.13 0.00 1.06 54.97 23.36 6.43 0.00 14.05 59
390511119492101 8.62 — — 0.1 — 0.20 0.00 1.95 53.74 34.56 6.85 0.00 2.71 66
390519119490201 1.95 — — 0.1 — 0.73 0.00 1.65 50.84 0.00 7.36 0.00 39.43 60
390530119485401 4.12 — — 0.1 — 0.73 0.00 0.82 38.70 0.00 5.48 0.00 54.27 41
390523119491101 1.42 — — 0.1 — 0.73 0.00 2.22 59.21 11.69 7.10 0.00 19.06 68
385614119411001 9.17 — — M — 0.00 0.00 4.43 60.83 0.00 8.70 0.00 26.05 55
385622119405601 10.2 — — M — 0.00 0.00 1.60 66.66 0.00 7.47 0.00 24.26 44
385620119415601 4.2 — — — — 0.00 0.00 4.07 63.58 0.00 10.30 0.00 22.05 51
385616119415501 10.6 — — M — 0.00 0.00 1.39 50.83 0.00 10.47 0.00 37.31 45
390149119424201 22.99 — — — — 0.00 0.00 7.60 86.31 0.00 0.00 0.00 6.09 50
390228119424701 19.8 — — — — 0.00 0.00 5.11 75.33 0.00 10.42 0.00 9.13 125
390149119424202 12.5 — — 0.1 — 0.00 0.00 7.60 86.33 0.00 0.00 0.00 6.08 50
390153119431001 13.2 — — 0.2 — 0.00 0.00 2.71 77.88 0.00 13.02 0.00 6.40 152
390146119435201 12.9 — — 0.1 — 0.52 0.00 1.55 68.01 13.88 11.10 0.00 4.94 144
390150119432501 19.3 — — — — 0.00 0.00 3.35 78.03 3.11 12.26 0.00 3.24 163
390233119423801 20.3 — — — — 0.00 0.00 3.11 82.99 0.00 7.87 0.00 6.03 115
390154119430301 12.2 — — 0.1 — 0.00 0.00 3.65 79.00 0.00 12.70 0.00 4.65 123
390252119430001 19.9 — — — — 0.00 0.00 1.69 43.88 0.00 5.81 0.00 48.62 77
390202119424701 7.14 — — 0.1 — 0.00 0.00 3.44 83.56 0.00 11.64 0.00 1.36 173
390152119425401 8.21 — — 0.1 — 0.00 0.00 4.52 77.58 0.00 13.79 0.00 4.10 95
390232119441401 7.04 — — 0.2 — 0.00 0.00 0.53 85.56 0.00 11.23 0.00 2.69 157
390239119443901 8.42 — — 0.2 — 0.00 0.00 0.00 98.20 0.00 0.00 0.00 1.80 96
Appendix 1. Field, nutrient, chloride, and bromide chemical data, and land use and number of septic tanks within 500 meters of each well.—Continued
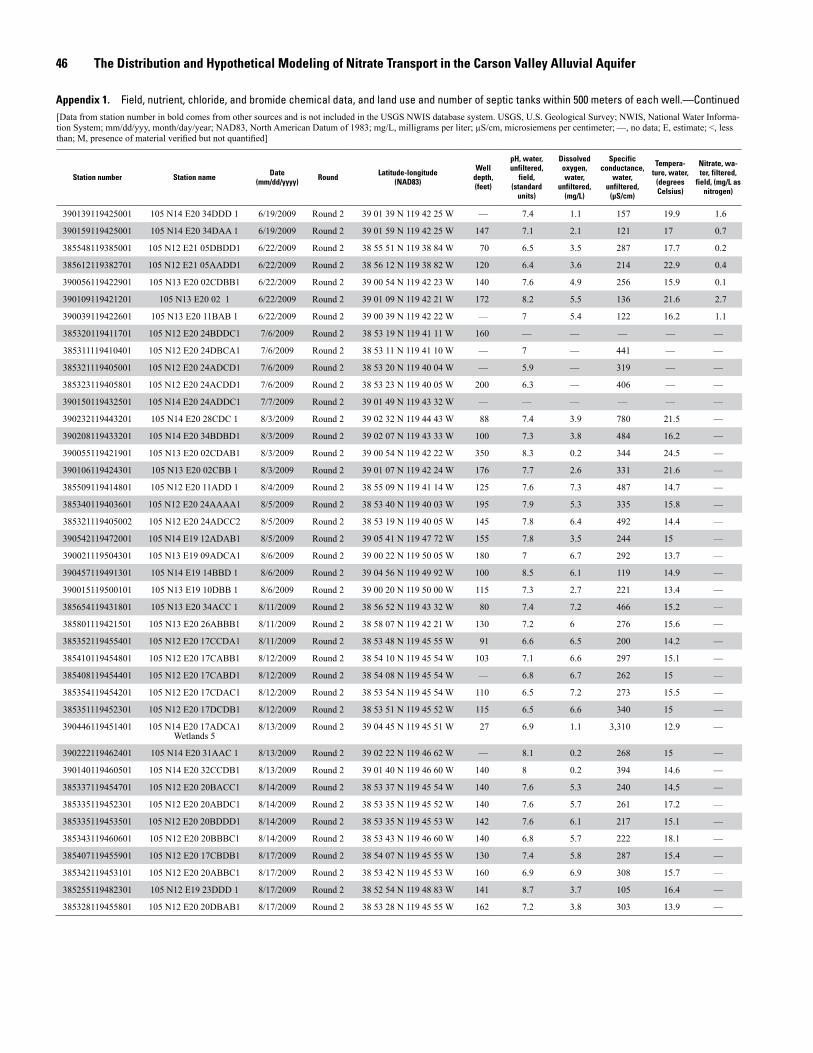
46 The Distribution and Hypothetical Modeling of Nitrate Transport in the Carson Valley Alluvial Aquifer
[Data from station number in bold comes from other sources and is not included in the USGS NWIS database system. USGS, U.S. Geological Survey; NWIS, National Water Informa-tion System; mm/dd/yyy, month/day/year; NAD83, North American Datum of 1983; mg/L, milligrams per liter; µS/cm, microsiemens per centimeter; —, no data; E, estimate; <, less than; M, presence of material verified but not quantified]
Station number Station name Date(mm/dd/yyyy) Round Latitude-longitude
(NAD83)
Welldepth,(feet)
pH, water, unfiltered,
field,(standard
units)
Dissolved oxygen, water,
unfiltered,(mg/L)
Specific conductance,
water, unfiltered,
(µS/cm)
Tempera-ture, water,
(degrees Celsius)
Nitrate, wa-ter, filtered,
field, (mg/L as nitrogen)
390139119425001 105 N14 E20 34DDD 1 6/19/2009 Round 2 39 01 39 N 119 42 25 W — 7.4 1.1 157 19.9 1.6
390159119425001 105 N14 E20 34DAA 1 6/19/2009 Round 2 39 01 59 N 119 42 25 W 147 7.1 2.1 121 17 0.7
385548119385001 105 N12 E21 05DBDD1 6/22/2009 Round 2 38 55 51 N 119 38 84 W 70 6.5 3.5 287 17.7 0.2
385612119382701 105 N12 E21 05AADD1 6/22/2009 Round 2 38 56 12 N 119 38 82 W 120 6.4 3.6 214 22.9 0.4
390056119422901 105 N13 E20 02CDBB1 6/22/2009 Round 2 39 00 54 N 119 42 23 W 140 7.6 4.9 256 15.9 0.1
390109119421201 105 N13 E20 02 1 6/22/2009 Round 2 39 01 09 N 119 42 21 W 172 8.2 5.5 136 21.6 2.7
390039119422601 105 N13 E20 11BAB 1 6/22/2009 Round 2 39 00 39 N 119 42 22 W — 7 5.4 122 16.2 1.1
385320119411701 105 N12 E20 24BDDC1 7/6/2009 Round 2 38 53 19 N 119 41 11 W 160 — — — — —
385311119410401 105 N12 E20 24DBCA1 7/6/2009 Round 2 38 53 11 N 119 41 10 W — 7 — 441 — —
385321119405001 105 N12 E20 24ADCD1 7/6/2009 Round 2 38 53 20 N 119 40 04 W — 5.9 — 319 — —
385323119405801 105 N12 E20 24ACDD1 7/6/2009 Round 2 38 53 23 N 119 40 05 W 200 6.3 — 406 — —
390150119432501 105 N14 E20 24ADDC1 7/7/2009 Round 2 39 01 49 N 119 43 32 W — — — — — —
390232119443201 105 N14 E20 28CDC 1 8/3/2009 Round 2 39 02 32 N 119 44 43 W 88 7.4 3.9 780 21.5 —
390208119433201 105 N14 E20 34BDBD1 8/3/2009 Round 2 39 02 07 N 119 43 33 W 100 7.3 3.8 484 16.2 —
390055119421901 105 N13 E20 02CDAB1 8/3/2009 Round 2 39 00 54 N 119 42 22 W 350 8.3 0.2 344 24.5 —
390106119424301 105 N13 E20 02CBB 1 8/3/2009 Round 2 39 01 07 N 119 42 24 W 176 7.7 2.6 331 21.6 —
385509119414801 105 N12 E20 11ADD 1 8/4/2009 Round 2 38 55 09 N 119 41 14 W 125 7.6 7.3 487 14.7 —
385340119403601 105 N12 E20 24AAAA1 8/5/2009 Round 2 38 53 40 N 119 40 03 W 195 7.9 5.3 335 15.8 —
385321119405002 105 N12 E20 24ADCC2 8/5/2009 Round 2 38 53 19 N 119 40 05 W 145 7.8 6.4 492 14.4 —
390542119472001 105 N14 E19 12ADAB1 8/5/2009 Round 2 39 05 41 N 119 47 72 W 155 7.8 3.5 244 15 —
390021119504301 105 N13 E19 09ADCA1 8/6/2009 Round 2 39 00 22 N 119 50 05 W 180 7 6.7 292 13.7 —
390457119491301 105 N14 E19 14BBD 1 8/6/2009 Round 2 39 04 56 N 119 49 92 W 100 8.5 6.1 119 14.9 —
390015119500101 105 N13 E19 10DBB 1 8/6/2009 Round 2 39 00 20 N 119 50 00 W 115 7.3 2.7 221 13.4 —
385654119431801 105 N13 E20 34ACC 1 8/11/2009 Round 2 38 56 52 N 119 43 32 W 80 7.4 7.2 466 15.2 —
385801119421501 105 N13 E20 26ABBB1 8/11/2009 Round 2 38 58 07 N 119 42 21 W 130 7.2 6 276 15.6 —
385352119455401 105 N12 E20 17CCDA1 8/11/2009 Round 2 38 53 48 N 119 45 55 W 91 6.6 6.5 200 14.2 —
385410119454801 105 N12 E20 17CABB1 8/12/2009 Round 2 38 54 10 N 119 45 54 W 103 7.1 6.6 297 15.1 —
385408119454401 105 N12 E20 17CABD1 8/12/2009 Round 2 38 54 08 N 119 45 54 W — 6.8 6.7 262 15 —
385354119454201 105 N12 E20 17CDAC1 8/12/2009 Round 2 38 53 54 N 119 45 54 W 110 6.5 7.2 273 15.5 —
385351119452301 105 N12 E20 17DCDB1 8/12/2009 Round 2 38 53 51 N 119 45 52 W 115 6.5 6.6 340 15 —
390446119451401 105 N14 E20 17ADCA1Wetlands 5
8/13/2009 Round 2 39 04 45 N 119 45 51 W 27 6.9 1.1 3,310 12.9 —
390222119462401 105 N14 E20 31AAC 1 8/13/2009 Round 2 39 02 22 N 119 46 62 W — 8.1 0.2 268 15 —
390140119460501 105 N14 E20 32CCDB1 8/13/2009 Round 2 39 01 40 N 119 46 60 W 140 8 0.2 394 14.6 —
385337119454701 105 N12 E20 20BACC1 8/14/2009 Round 2 38 53 37 N 119 45 54 W 140 7.6 5.3 240 14.5 —
385335119452301 105 N12 E20 20ABDC1 8/14/2009 Round 2 38 53 35 N 119 45 52 W 140 7.6 5.7 261 17.2 —
385335119453501 105 N12 E20 20BDDD1 8/14/2009 Round 2 38 53 35 N 119 45 53 W 142 7.6 6.1 217 15.1 —
385343119460601 105 N12 E20 20BBBC1 8/14/2009 Round 2 38 53 43 N 119 46 60 W 140 6.8 5.7 222 18.1 —
385407119455901 105 N12 E20 17CBDB1 8/17/2009 Round 2 38 54 07 N 119 45 55 W 130 7.4 5.8 287 15.4 —
385342119453101 105 N12 E20 20ABBC1 8/17/2009 Round 2 38 53 42 N 119 45 53 W 160 6.9 6.9 308 15.7 —
385255119482301 105 N12 E19 23DDD 1 8/17/2009 Round 2 38 52 54 N 119 48 83 W 141 8.7 3.7 105 16.4 —
385328119455801 105 N12 E20 20DBAB1 8/17/2009 Round 2 38 53 28 N 119 45 55 W 162 7.2 3.8 303 13.9 —
Appendix 1. Field, nutrient, chloride, and bromide chemical data, and land use and number of septic tanks within 500 meters of each well.—Continued
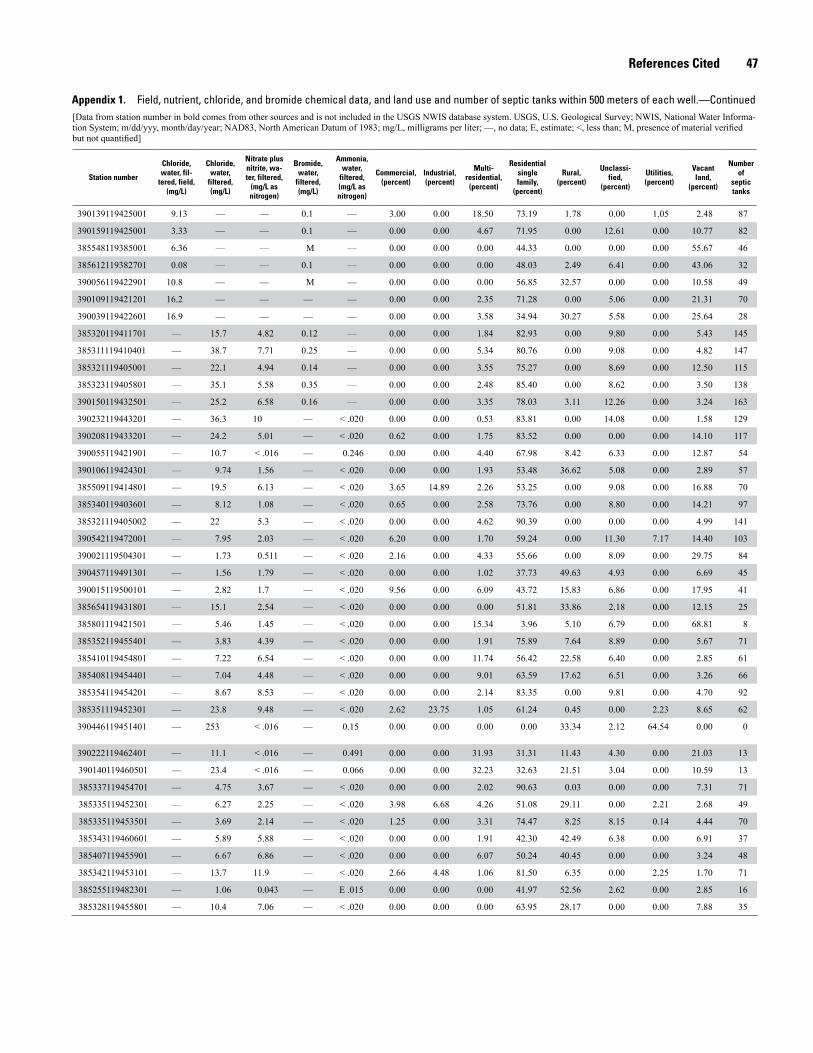
References Cited 47
[Data from station number in bold comes from other sources and is not included in the USGS NWIS database system. USGS, U.S. Geological Survey; NWIS, National Water Informa-tion System; m/dd/yyy, month/day/year; NAD83, North American Datum of 1983; mg/L, milligrams per liter; —, no data; E, estimate; <, less than; M, presence of material verified but not quantified]
Station number
Chloride, water, fil-
tered, field, (mg/L)
Chloride, water,
filtered, (mg/L)
Nitrate plus nitrite, wa-ter, filtered,
(mg/L as nitrogen)
Bromide, water,
filtered, (mg/L)
Ammonia, water,
filtered, (mg/L as nitrogen)
Commercial,(percent)
Industrial,(percent)
Multi-residential,
(percent)
Residential single family,
(percent)
Rural,(percent)
Unclassi-fied,
(percent)
Utilities,(percent)
Vacantland,
(percent)
Numberof
septictanks
390139119425001 9.13 — — 0.1 — 3.00 0.00 18.50 73.19 1.78 0.00 1.05 2.48 87
390159119425001 3.33 — — 0.1 — 0.00 0.00 4.67 71.95 0.00 12.61 0.00 10.77 82
385548119385001 6.36 — — M — 0.00 0.00 0.00 44.33 0.00 0.00 0.00 55.67 46
385612119382701 0.08 — — 0.1 — 0.00 0.00 0.00 48.03 2.49 6.41 0.00 43.06 32
390056119422901 10.8 — — M — 0.00 0.00 0.00 56.85 32.57 0.00 0.00 10.58 49
390109119421201 16.2 — — — — 0.00 0.00 2.35 71.28 0.00 5.06 0.00 21.31 70
390039119422601 16.9 — — — — 0.00 0.00 3.58 34.94 30.27 5.58 0.00 25.64 28
385320119411701 — 15.7 4.82 0.12 — 0.00 0.00 1.84 82.93 0.00 9.80 0.00 5.43 145
385311119410401 — 38.7 7.71 0.25 — 0.00 0.00 5.34 80.76 0.00 9.08 0.00 4.82 147
385321119405001 — 22.1 4.94 0.14 — 0.00 0.00 3.55 75.27 0.00 8.69 0.00 12.50 115
385323119405801 — 35.1 5.58 0.35 — 0.00 0.00 2.48 85.40 0.00 8.62 0.00 3.50 138
390150119432501 — 25.2 6.58 0.16 — 0.00 0.00 3.35 78.03 3.11 12.26 0.00 3.24 163
390232119443201 — 36.3 10 — < .020 0.00 0.00 0.53 83.81 0.00 14.08 0.00 1.58 129
390208119433201 — 24.2 5.01 — < .020 0.62 0.00 1.75 83.52 0.00 0.00 0.00 14.10 117
390055119421901 — 10.7 < .016 — 0.246 0.00 0.00 4.40 67.98 8.42 6.33 0.00 12.87 54
390106119424301 — 9.74 1.56 — < .020 0.00 0.00 1.93 53.48 36.62 5.08 0.00 2.89 57
385509119414801 — 19.5 6.13 — < .020 3.65 14.89 2.26 53.25 0.00 9.08 0.00 16.88 70
385340119403601 — 8.12 1.08 — < .020 0.65 0.00 2.58 73.76 0.00 8.80 0.00 14.21 97
385321119405002 — 22 5.3 — < .020 0.00 0.00 4.62 90.39 0.00 0.00 0.00 4.99 141
390542119472001 — 7.95 2.03 — < .020 6.20 0.00 1.70 59.24 0.00 11.30 7.17 14.40 103
390021119504301 — 1.73 0.511 — < .020 2.16 0.00 4.33 55.66 0.00 8.09 0.00 29.75 84
390457119491301 — 1.56 1.79 — < .020 0.00 0.00 1.02 37.73 49.63 4.93 0.00 6.69 45
390015119500101 — 2.82 1.7 — < .020 9.56 0.00 6.09 43.72 15.83 6.86 0.00 17.95 41
385654119431801 — 15.1 2.54 — < .020 0.00 0.00 0.00 51.81 33.86 2.18 0.00 12.15 25
385801119421501 — 5.46 1.45 — < .020 0.00 0.00 15.34 3.96 5.10 6.79 0.00 68.81 8
385352119455401 — 3.83 4.39 — < .020 0.00 0.00 1.91 75.89 7.64 8.89 0.00 5.67 71
385410119454801 — 7.22 6.54 — < .020 0.00 0.00 11.74 56.42 22.58 6.40 0.00 2.85 61
385408119454401 — 7.04 4.48 — < .020 0.00 0.00 9.01 63.59 17.62 6.51 0.00 3.26 66
385354119454201 — 8.67 8.53 — < .020 0.00 0.00 2.14 83.35 0.00 9.81 0.00 4.70 92
385351119452301 — 23.8 9.48 — < .020 2.62 23.75 1.05 61.24 0.45 0.00 2.23 8.65 62
390446119451401 — 253 < .016 — 0.15 0.00 0.00 0.00 0.00 33.34 2.12 64.54 0.00 0
390222119462401 — 11.1 < .016 — 0.491 0.00 0.00 31.93 31.31 11.43 4.30 0.00 21.03 13
390140119460501 — 23.4 < .016 — 0.066 0.00 0.00 32.23 32.63 21.51 3.04 0.00 10.59 13
385337119454701 — 4.75 3.67 — < .020 0.00 0.00 2.02 90.63 0.03 0.00 0.00 7.31 71
385335119452301 — 6.27 2.25 — < .020 3.98 6.68 4.26 51.08 29.11 0.00 2.21 2.68 49
385335119453501 — 3.69 2.14 — < .020 1.25 0.00 3.31 74.47 8.25 8.15 0.14 4.44 70
385343119460601 — 5.89 5.88 — < .020 0.00 0.00 1.91 42.30 42.49 6.38 0.00 6.91 37
385407119455901 — 6.67 6.86 — < .020 0.00 0.00 6.07 50.24 40.45 0.00 0.00 3.24 48
385342119453101 — 13.7 11.9 — < .020 2.66 4.48 1.06 81.50 6.35 0.00 2.25 1.70 71
385255119482301 — 1.06 0.043 — E .015 0.00 0.00 0.00 41.97 52.56 2.62 0.00 2.85 16
385328119455801 — 10.4 7.06 — < .020 0.00 0.00 0.00 63.95 28.17 0.00 0.00 7.88 35
Appendix 1. Field, nutrient, chloride, and bromide chemical data, and land use and number of septic tanks within 500 meters of each well.—Continued
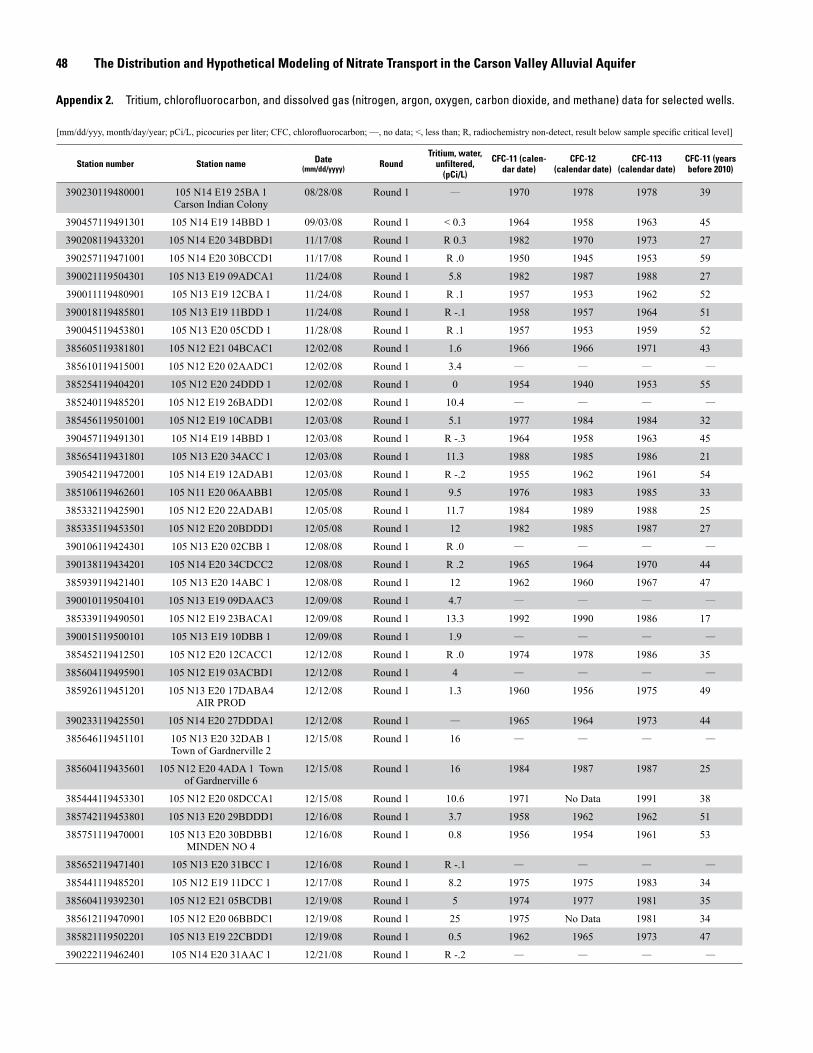
48 The Distribution and Hypothetical Modeling of Nitrate Transport in the Carson Valley Alluvial Aquifer
[mm/dd/yyy, month/day/year; pCi/L, picocuries per liter; CFC, chlorofluorocarbon; —, no data; <, less than; R, radiochemistry non-detect, result below sample specific critical level]
Station number Station name Date(mm/dd/yyyy) Round
Tritium, water,unfiltered,
(pCi/L)
CFC-11 (calen-dar date)
CFC-12(calendar date)
CFC-113(calendar date)
CFC-11 (years before 2010)
390230119480001 105 N14 E19 25BA 1Carson Indian Colony
08/28/08 Round 1 — 1970 1978 1978 39
390457119491301 105 N14 E19 14BBD 1 09/03/08 Round 1 < 0.3 1964 1958 1963 45
390208119433201 105 N14 E20 34BDBD1 11/17/08 Round 1 R 0.3 1982 1970 1973 27
390257119471001 105 N14 E20 30BCCD1 11/17/08 Round 1 R .0 1950 1945 1953 59
390021119504301 105 N13 E19 09ADCA1 11/24/08 Round 1 5.8 1982 1987 1988 27
390011119480901 105 N13 E19 12CBA 1 11/24/08 Round 1 R .1 1957 1953 1962 52
390018119485801 105 N13 E19 11BDD 1 11/24/08 Round 1 R -.1 1958 1957 1964 51
390045119453801 105 N13 E20 05CDD 1 11/28/08 Round 1 R .1 1957 1953 1959 52
385605119381801 105 N12 E21 04BCAC1 12/02/08 Round 1 1.6 1966 1966 1971 43
385610119415001 105 N12 E20 02AADC1 12/02/08 Round 1 3.4 — — — —
385254119404201 105 N12 E20 24DDD 1 12/02/08 Round 1 0 1954 1940 1953 55
385240119485201 105 N12 E19 26BADD1 12/02/08 Round 1 10.4 — — — —
385456119501001 105 N12 E19 10CADB1 12/03/08 Round 1 5.1 1977 1984 1984 32
390457119491301 105 N14 E19 14BBD 1 12/03/08 Round 1 R -.3 1964 1958 1963 45
385654119431801 105 N13 E20 34ACC 1 12/03/08 Round 1 11.3 1988 1985 1986 21
390542119472001 105 N14 E19 12ADAB1 12/03/08 Round 1 R -.2 1955 1962 1961 54
385106119462601 105 N11 E20 06AABB1 12/05/08 Round 1 9.5 1976 1983 1985 33
385332119425901 105 N12 E20 22ADAB1 12/05/08 Round 1 11.7 1984 1989 1988 25
385335119453501 105 N12 E20 20BDDD1 12/05/08 Round 1 12 1982 1985 1987 27
390106119424301 105 N13 E20 02CBB 1 12/08/08 Round 1 R .0 — — — —
390138119434201 105 N14 E20 34CDCC2 12/08/08 Round 1 R .2 1965 1964 1970 44
385939119421401 105 N13 E20 14ABC 1 12/08/08 Round 1 12 1962 1960 1967 47
390010119504101 105 N13 E19 09DAAC3 12/09/08 Round 1 4.7 — — — —
385339119490501 105 N12 E19 23BACA1 12/09/08 Round 1 13.3 1992 1990 1986 17
390015119500101 105 N13 E19 10DBB 1 12/09/08 Round 1 1.9 — — — —
385452119412501 105 N12 E20 12CACC1 12/12/08 Round 1 R .0 1974 1978 1986 35
385604119495901 105 N12 E19 03ACBD1 12/12/08 Round 1 4 — — — —
385926119451201 105 N13 E20 17DABA4 AIR PROD
12/12/08 Round 1 1.3 1960 1956 1975 49
390233119425501 105 N14 E20 27DDDA1 12/12/08 Round 1 — 1965 1964 1973 44
385646119451101 105 N13 E20 32DAB 1 Town of Gardnerville 2
12/15/08 Round 1 16 — — — —
385604119435601 105 N12 E20 4ADA 1 Town of Gardnerville 6
12/15/08 Round 1 16 1984 1987 1987 25
385444119453301 105 N12 E20 08DCCA1 12/15/08 Round 1 10.6 1971 No Data 1991 38
385742119453801 105 N13 E20 29BDDD1 12/16/08 Round 1 3.7 1958 1962 1962 51
385751119470001 105 N13 E20 30BDBB1 MINDEN NO 4
12/16/08 Round 1 0.8 1956 1954 1961 53
385652119471401 105 N13 E20 31BCC 1 12/16/08 Round 1 R -.1 — — — —
385441119485201 105 N12 E19 11DCC 1 12/17/08 Round 1 8.2 1975 1975 1983 34
385604119392301 105 N12 E21 05BCDB1 12/19/08 Round 1 5 1974 1977 1981 35
385612119470901 105 N12 E20 06BBDC1 12/19/08 Round 1 25 1975 No Data 1981 34
385821119502201 105 N13 E19 22CBDD1 12/19/08 Round 1 0.5 1962 1965 1973 47
390222119462401 105 N14 E20 31AAC 1 12/21/08 Round 1 R -.2 — — — —
Appendix 2. Tritium, chlorofluorocarbon, and dissolved gas (nitrogen, argon, oxygen, carbon dioxide, and methane) data for selected wells.
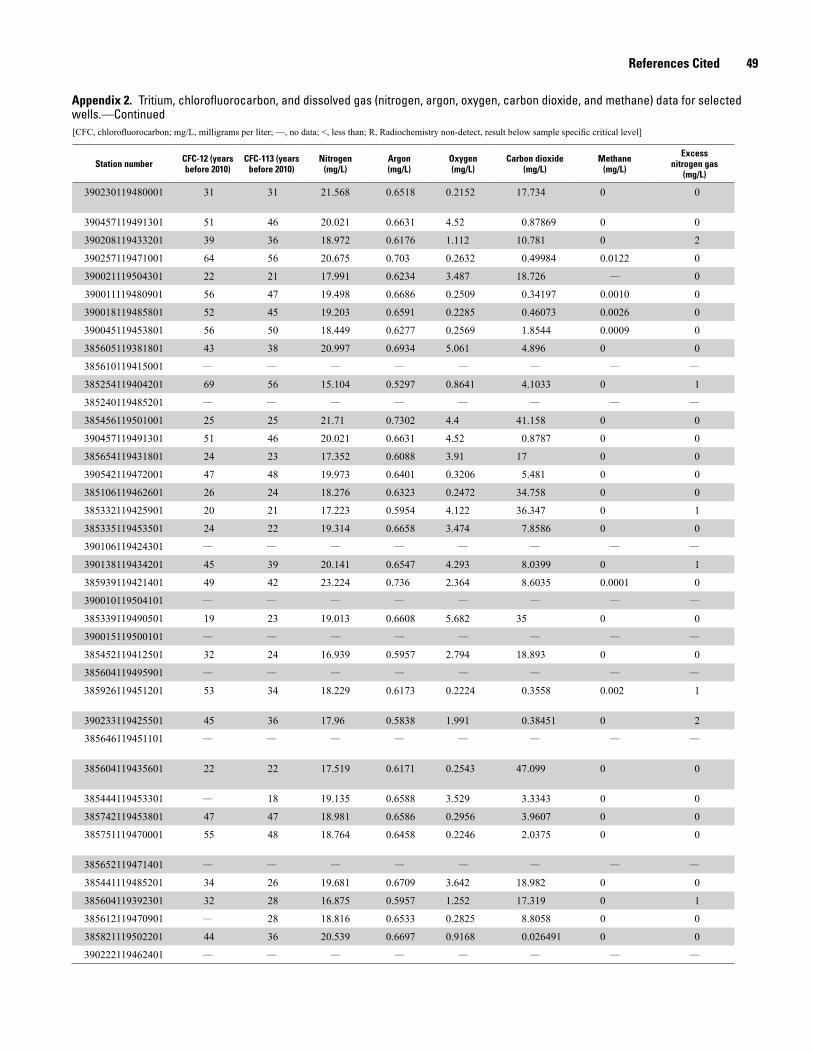
References Cited 49
[CFC, chlorofluorocarbon; mg/L, milligrams per liter; —, no data; <, less than; R, Radiochemistry non-detect, result below sample specific critical level]
Station number CFC-12 (years before 2010)
CFC-113 (years before 2010)
Nitrogen(mg/L)
Argon(mg/L)
Oxygen(mg/L)
Carbon dioxide(mg/L)
Methane(mg/L)
Excessnitrogen gas
(mg/L)
390230119480001 31 31 21.568 0.6518 0.2152 17.734 0 0
390457119491301 51 46 20.021 0.6631 4.52 0.87869 0 0
390208119433201 39 36 18.972 0.6176 1.112 10.781 0 2
390257119471001 64 56 20.675 0.703 0.2632 0.49984 0.0122 0
390021119504301 22 21 17.991 0.6234 3.487 18.726 — 0
390011119480901 56 47 19.498 0.6686 0.2509 0.34197 0.0010 0
390018119485801 52 45 19.203 0.6591 0.2285 0.46073 0.0026 0
390045119453801 56 50 18.449 0.6277 0.2569 1.8544 0.0009 0
385605119381801 43 38 20.997 0.6934 5.061 4.896 0 0
385610119415001 — — — — — — — —
385254119404201 69 56 15.104 0.5297 0.8641 4.1033 0 1
385240119485201 — — — — — — — —
385456119501001 25 25 21.71 0.7302 4.4 41.158 0 0
390457119491301 51 46 20.021 0.6631 4.52 0.8787 0 0
385654119431801 24 23 17.352 0.6088 3.91 17 0 0
390542119472001 47 48 19.973 0.6401 0.3206 5.481 0 0
385106119462601 26 24 18.276 0.6323 0.2472 34.758 0 0
385332119425901 20 21 17.223 0.5954 4.122 36.347 0 1
385335119453501 24 22 19.314 0.6658 3.474 7.8586 0 0
390106119424301 — — — — — — — —
390138119434201 45 39 20.141 0.6547 4.293 8.0399 0 1
385939119421401 49 42 23.224 0.736 2.364 8.6035 0.0001 0
390010119504101 — — — — — — — —
385339119490501 19 23 19.013 0.6608 5.682 35 0 0
390015119500101 — — — — — — — —
385452119412501 32 24 16.939 0.5957 2.794 18.893 0 0
385604119495901 — — — — — — — —
385926119451201 53 34 18.229 0.6173 0.2224 0.3558 0.002 1
390233119425501 45 36 17.96 0.5838 1.991 0.38451 0 2
385646119451101 — — — — — — — —
385604119435601 22 22 17.519 0.6171 0.2543 47.099 0 0
385444119453301 — 18 19.135 0.6588 3.529 3.3343 0 0
385742119453801 47 47 18.981 0.6586 0.2956 3.9607 0 0
385751119470001 55 48 18.764 0.6458 0.2246 2.0375 0 0
385652119471401 — — — — — — — —
385441119485201 34 26 19.681 0.6709 3.642 18.982 0 0
385604119392301 32 28 16.875 0.5957 1.252 17.319 0 1
385612119470901 — 28 18.816 0.6533 0.2825 8.8058 0 0
385821119502201 44 36 20.539 0.6697 0.9168 0.026491 0 0
390222119462401 — — — — — — — —
Appendix 2. Tritium, chlorofluorocarbon, and dissolved gas (nitrogen, argon, oxygen, carbon dioxide, and methane) data for selected wells.—Continued
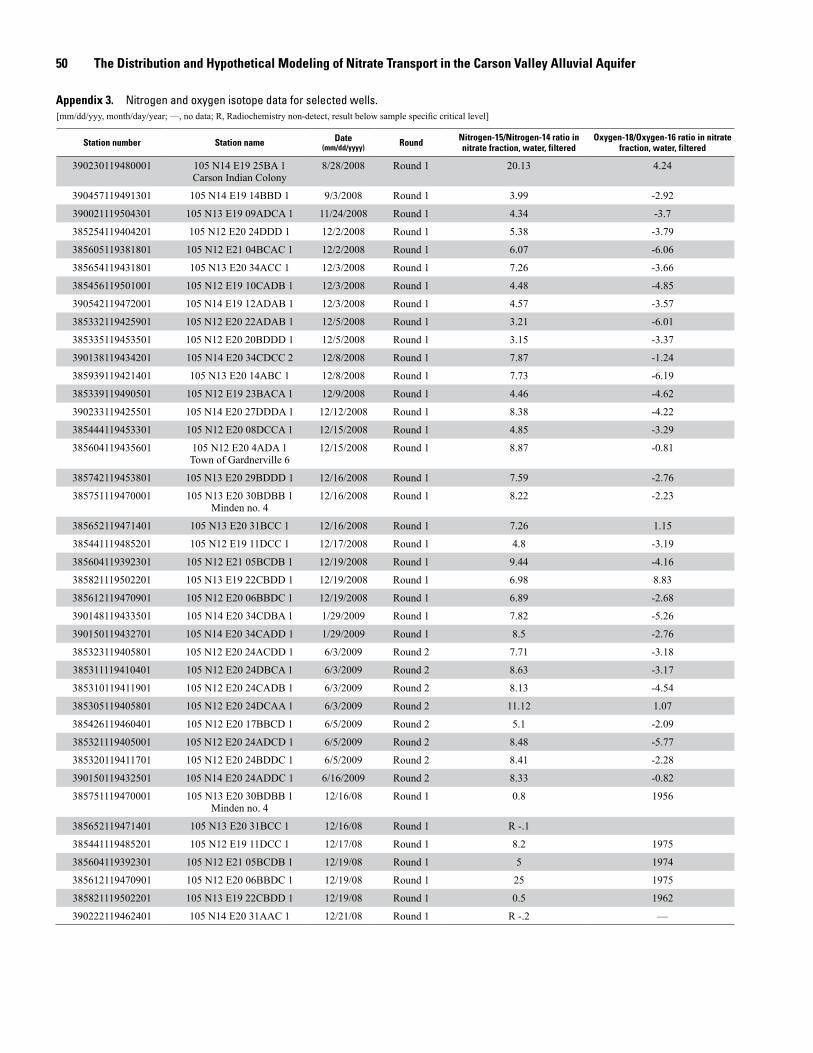
50 The Distribution and Hypothetical Modeling of Nitrate Transport in the Carson Valley Alluvial Aquifer
[mm/dd/yyy, month/day/year; —, no data; R, Radiochemistry non-detect, result below sample specific critical level]
Station number Station name Date(mm/dd/yyyy) Round Nitrogen-15/Nitrogen-14 ratio in
nitrate fraction, water, filteredOxygen-18/Oxygen-16 ratio in nitrate
fraction, water, filtered
390230119480001 105 N14 E19 25BA 1Carson Indian Colony
8/28/2008 Round 1 20.13 4.24
390457119491301 105 N14 E19 14BBD 1 9/3/2008 Round 1 3.99 -2.92
390021119504301 105 N13 E19 09ADCA 1 11/24/2008 Round 1 4.34 -3.7
385254119404201 105 N12 E20 24DDD 1 12/2/2008 Round 1 5.38 -3.79
385605119381801 105 N12 E21 04BCAC 1 12/2/2008 Round 1 6.07 -6.06
385654119431801 105 N13 E20 34ACC 1 12/3/2008 Round 1 7.26 -3.66
385456119501001 105 N12 E19 10CADB 1 12/3/2008 Round 1 4.48 -4.85
390542119472001 105 N14 E19 12ADAB 1 12/3/2008 Round 1 4.57 -3.57
385332119425901 105 N12 E20 22ADAB 1 12/5/2008 Round 1 3.21 -6.01
385335119453501 105 N12 E20 20BDDD 1 12/5/2008 Round 1 3.15 -3.37
390138119434201 105 N14 E20 34CDCC 2 12/8/2008 Round 1 7.87 -1.24
385939119421401 105 N13 E20 14ABC 1 12/8/2008 Round 1 7.73 -6.19
385339119490501 105 N12 E19 23BACA 1 12/9/2008 Round 1 4.46 -4.62
390233119425501 105 N14 E20 27DDDA 1 12/12/2008 Round 1 8.38 -4.22
385444119453301 105 N12 E20 08DCCA 1 12/15/2008 Round 1 4.85 -3.29
385604119435601 105 N12 E20 4ADA 1Town of Gardnerville 6
12/15/2008 Round 1 8.87 -0.81
385742119453801 105 N13 E20 29BDDD 1 12/16/2008 Round 1 7.59 -2.76
385751119470001 105 N13 E20 30BDBB 1 Minden no. 4
12/16/2008 Round 1 8.22 -2.23
385652119471401 105 N13 E20 31BCC 1 12/16/2008 Round 1 7.26 1.15
385441119485201 105 N12 E19 11DCC 1 12/17/2008 Round 1 4.8 -3.19
385604119392301 105 N12 E21 05BCDB 1 12/19/2008 Round 1 9.44 -4.16
385821119502201 105 N13 E19 22CBDD 1 12/19/2008 Round 1 6.98 8.83
385612119470901 105 N12 E20 06BBDC 1 12/19/2008 Round 1 6.89 -2.68
390148119433501 105 N14 E20 34CDBA 1 1/29/2009 Round 1 7.82 -5.26
390150119432701 105 N14 E20 34CADD 1 1/29/2009 Round 1 8.5 -2.76
385323119405801 105 N12 E20 24ACDD 1 6/3/2009 Round 2 7.71 -3.18
385311119410401 105 N12 E20 24DBCA 1 6/3/2009 Round 2 8.63 -3.17
385310119411901 105 N12 E20 24CADB 1 6/3/2009 Round 2 8.13 -4.54
385305119405801 105 N12 E20 24DCAA 1 6/3/2009 Round 2 11.12 1.07
385426119460401 105 N12 E20 17BBCD 1 6/5/2009 Round 2 5.1 -2.09
385321119405001 105 N12 E20 24ADCD 1 6/5/2009 Round 2 8.48 -5.77
385320119411701 105 N12 E20 24BDDC 1 6/5/2009 Round 2 8.41 -2.28
390150119432501 105 N14 E20 24ADDC 1 6/16/2009 Round 2 8.33 -0.82
385751119470001 105 N13 E20 30BDBB 1 Minden no. 4
12/16/08 Round 1 0.8 1956
385652119471401 105 N13 E20 31BCC 1 12/16/08 Round 1 R -.1
385441119485201 105 N12 E19 11DCC 1 12/17/08 Round 1 8.2 1975
385604119392301 105 N12 E21 05BCDB 1 12/19/08 Round 1 5 1974
385612119470901 105 N12 E20 06BBDC 1 12/19/08 Round 1 25 1975
385821119502201 105 N13 E19 22CBDD 1 12/19/08 Round 1 0.5 1962
390222119462401 105 N14 E20 31AAC 1 12/21/08 Round 1 R -.2 —
Appendix 3. Nitrogen and oxygen isotope data for selected wells.
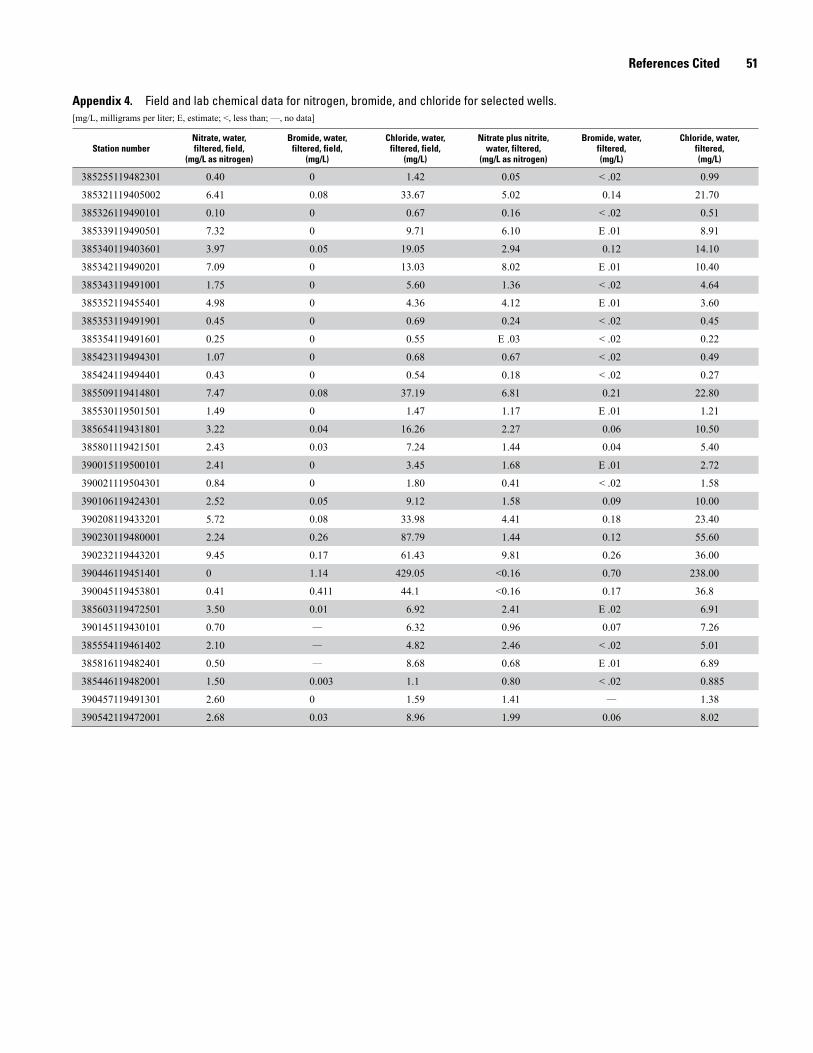
References Cited 51
Appendix 4. Field and lab chemical data for nitrogen, bromide, and chloride for selected wells. [mg/L, milligrams per liter; E, estimate; <, less than; —, no data]
Station numberNitrate, water,filtered, field,
(mg/L as nitrogen)
Bromide, water,filtered, field,
(mg/L)
Chloride, water,filtered, field,
(mg/L)
Nitrate plus nitrite, water, filtered,
(mg/L as nitrogen)
Bromide, water,filtered,(mg/L)
Chloride, water,filtered,(mg/L)
385255119482301 0.40 0 1.42 0.05 < .02 0.99
385321119405002 6.41 0.08 33.67 5.02 0.14 21.70
385326119490101 0.10 0 0.67 0.16 < .02 0.51
385339119490501 7.32 0 9.71 6.10 E .01 8.91
385340119403601 3.97 0.05 19.05 2.94 0.12 14.10
385342119490201 7.09 0 13.03 8.02 E .01 10.40
385343119491001 1.75 0 5.60 1.36 < .02 4.64
385352119455401 4.98 0 4.36 4.12 E .01 3.60
385353119491901 0.45 0 0.69 0.24 < .02 0.45
385354119491601 0.25 0 0.55 E .03 < .02 0.22
385423119494301 1.07 0 0.68 0.67 < .02 0.49
385424119494401 0.43 0 0.54 0.18 < .02 0.27
385509119414801 7.47 0.08 37.19 6.81 0.21 22.80
385530119501501 1.49 0 1.47 1.17 E .01 1.21
385654119431801 3.22 0.04 16.26 2.27 0.06 10.50
385801119421501 2.43 0.03 7.24 1.44 0.04 5.40
390015119500101 2.41 0 3.45 1.68 E .01 2.72
390021119504301 0.84 0 1.80 0.41 < .02 1.58
390106119424301 2.52 0.05 9.12 1.58 0.09 10.00
390208119433201 5.72 0.08 33.98 4.41 0.18 23.40
390230119480001 2.24 0.26 87.79 1.44 0.12 55.60
390232119443201 9.45 0.17 61.43 9.81 0.26 36.00
390446119451401 0 1.14 429.05 <0.16 0.70 238.00
390045119453801 0.41 0.411 44.1 <0.16 0.17 36.8
385603119472501 3.50 0.01 6.92 2.41 E .02 6.91
390145119430101 0.70 — 6.32 0.96 0.07 7.26
385554119461402 2.10 — 4.82 2.46 < .02 5.01
385816119482401 0.50 — 8.68 0.68 E .01 6.89
385446119482001 1.50 0.003 1.1 0.80 < .02 0.885
390457119491301 2.60 0 1.59 1.41 — 1.38
390542119472001 2.68 0.03 8.96 1.99 0.06 8.02


Naranjo and others—
The Distribution and M
odeling of Nitrate Transport in the Carson Valley A
lluvial Aquifer, D
ouglas County, Nevada—
SIR 2013–5136