Embed Size (px)
Citation preview

The Distribution of Health Care Resources inEgypt: Implications for Equity
An Analysis Using a National Health AccountsFramework
Ravi P. Rannan-Eliya*Associate Fellow
Health Policy Programme, Institute of Policy Studies, Sri Lanka
Claudia Blanco-VidalDepartment of Economics, Boston University, Boston, MA
A. K. NandakumarData for Decision Making Project, Harvard School of Public Health, Boston, MA
United States Agency for International DevelopmentCooperative Agreement No. DPE-A-00-91-00052-22
Partnerships for Health ReformAbt Associates Inc.
Contract No. HRN-5974-C-00-5024-00
* Contact Address:Dr. Ravi P. Rannan-EliyaAssociate Fellow, Health Policy ProgrammeInstitute of Policy Studies99, St. Michael’s RoadColombo 3, Sri LankaTel: +94-1-431-368Fax: +94-1-431-395Email: [email protected]

Distribution of health care resources in Egypt: Implications for Equity i
Abstract
National health accounts combined with data from a nationally representative household surveyof health care utilization and expenditures are used to compile a description of the distribution ofall health expenditures across a national population. This approach extends the earlier traditionof benefit-incidence studies by using NHA data to constrain the levels of public and privateexpenditures to allow a true direct comparison of the distributions of each. It overcomes earlierproblems in comparing public and private expenditures on health, when information is derivedfrom non-comparable data sources, and also deepens the analysis by using additional secondarydata to account for differences in spending levels within the public sector by geographical areaand facility type and level. This is a refinement on the approach used in the COMAC-HSRstudies of European and US health care spending.
The methodology requires a comprehensive, nationally representative data set on actualutilization and expenditures. The utilization data are used to allocate public subsidy expendituresfor non-market services, while the household expenditure data are used to distribute privateexpenditures, the total of which is derived directly from the more reliable NHA estimate. Thedata can be combined with NHA and other public budgetary information in a data set thatallocates all known health expenditures across the whole population using appropriateassumptions. The resulting data set, containing 50,000, observations, is then used to directlyquantify the distribution of any component of health spending according to the householddemographic or socioeconomic characteristics measured in the original survey.
The results indicate that the incidence of overall health expenditures rise with increasing incomelevel. This is due to a distribution of private expenditures which increases with income, as well asa distribution of public expenditures which more modestly also increases with rising incomelevel. The bias in public expenditures in favor of higher income groups is found to be primarilydue to the distribution of revenue financing through the social insurance program, as well asthrough revenue spending at higher quality urban academic hospitals in the public sector, whichlargely serve higher income urban households owing to reasons of better access throughproximity, as well as the charging of user fees which discourages use by poorer households. Inconclusion, the social insurance programs in Egypt and the use of cost recovery in some publicsector institutions combine to greater inequality in access to health care resources, both whenevaluated from the level of income levels, as well as by gender.
The 1994-95 expansion of social health insurance coverage to children has not improved thedistribution of health care spending in favor of lower income households. It is argued that ifpolicy-makers wish to improve the targeting of public expenditures in the health care sector, theyshould refocus efforts on the main public sector delivery system run by MOHP, and be cautiousabout expanding financing and delivery through other means. MOHP services while relativelyequally distributed across income levels, do contribute significantly to the welfare of lower-income households, adding more than 10% to the net income of the poorest quintile, comparedwith only 2% for the richest household quintile.

Distribution of health care resources in Egypt: Implications for Equity ii
Contents
TABLES III
FIGURES IV
ACRONYMS V
ACKNOWLEDGMENTS VI
BACKGROUND 1
APPROACH 2
EGYPT’S HEALTH CARE SYSTEM 5
Methodology of study 6Data and variable definitions, and assumptions 6
National Health Accounts 6Household survey data 11Budget Tracking System 12Facility costing studies 12Expenditure definitions 12
Choice of illness and need measures 14Method of analysis 14
Public expenditures 15Private expenditures 17
Results 19Distribution of need 19Distribution of health care utilization by income level 20Distribution of health care expenditures by income level 22
Expenditures through HIO 23Other ministries and University and teaching hospitals 23Private expenditures 24
Comparison with other Countries 24Distribution of utilization and expenditures by governorate 25Distribution of utilization and expenditures by age-group and gender 27Income transfers from health expenditures 29
Implications 31
Bibliography 33
Statistical Annex 35

Distribution of health care resources in Egypt: Implications for Equity iii
Tables
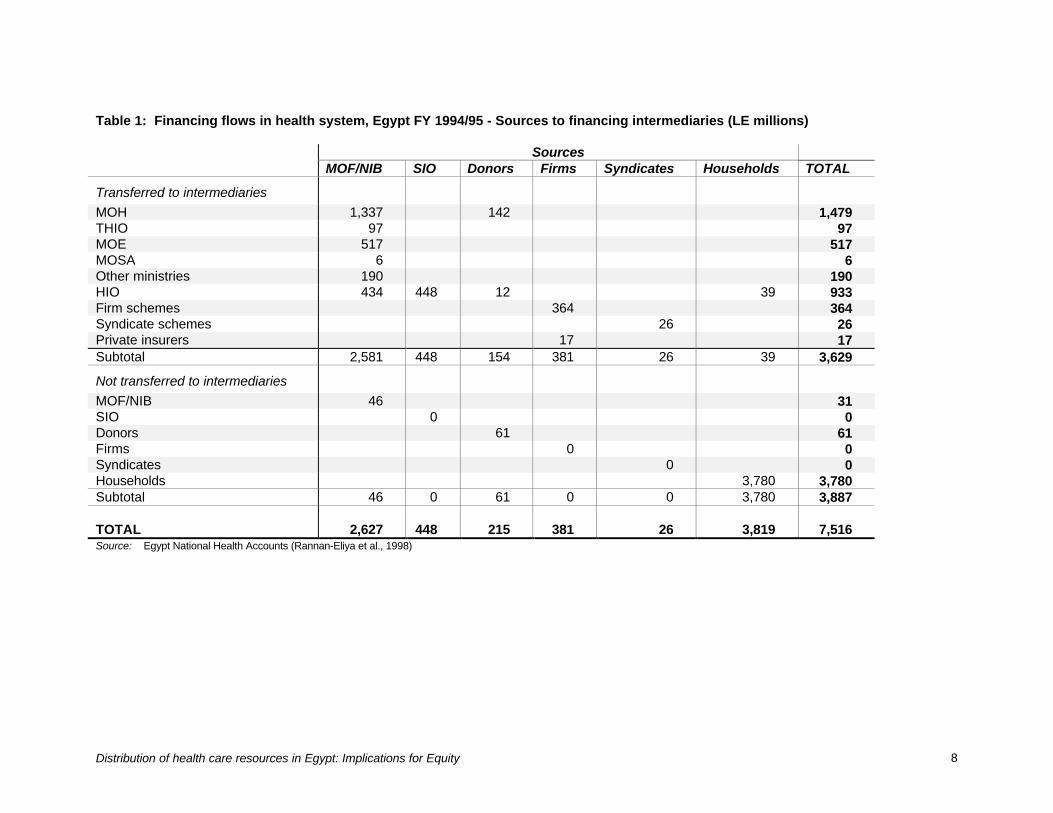
Table 1: Financing flows in health system, Egypt FY 1994/95 - Sources to financingintermediaries (LE millions) 8
Table 2: Financing flows in health system, Egypt FY 1994/95 - Financing intermediariesto providers (LE millions) 9
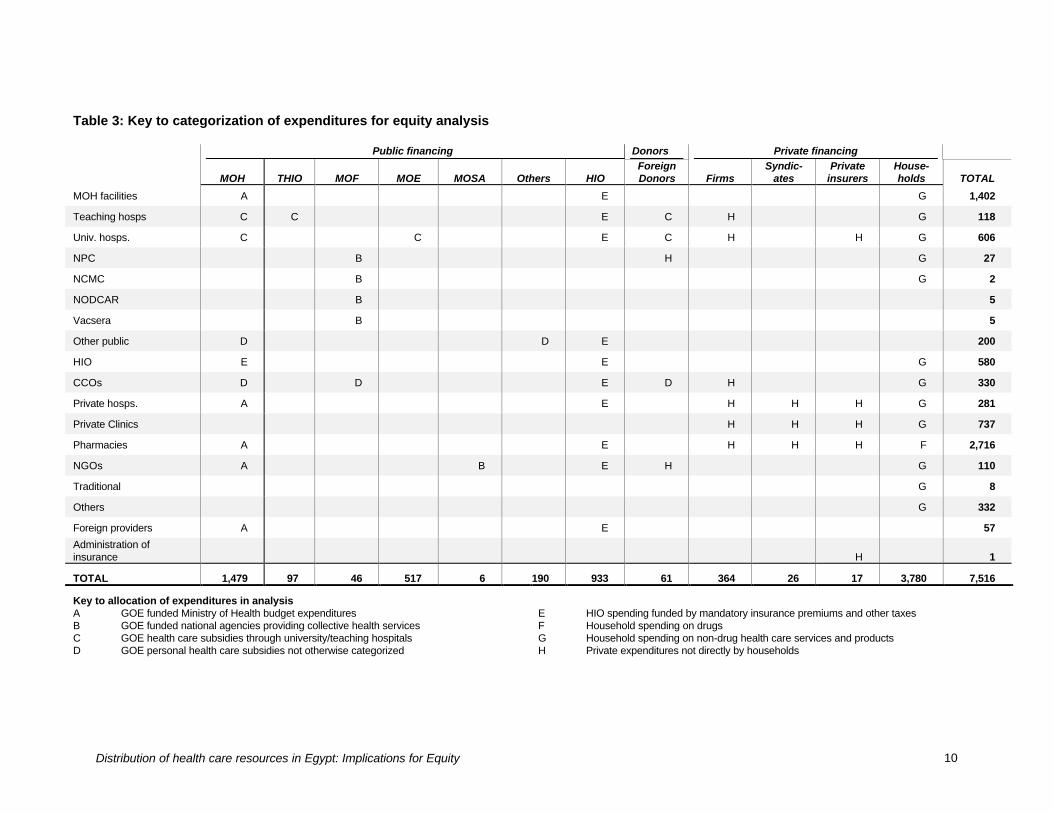
Table 3: Key to categorization of expenditures for equity analysis 10Table 4: Estimates of distribution of per capita household expenditures in Egypt 11Table 5: Governorates and programs separately considered in analysis 15Table 6: Elements of disaggregation used in estimating public program expenditures 17Table 7: Distribution of morbidity by income quintiles 19Table 8: Reported ill health by region, and for children in lowest income quintile 20Table 9: Distribution of public health expenditures by income quintile (%) 22Table 10: Distribution of public and private health expenditures by income quintile (%) 22Table 11: Distribution of HIO SMIP subsidies per capita compared with per child (LE) 23Table 12: The incidence of public health spending in selected countries 25Table 13: Use of public outpatient health services by gender and age group (annual
visits per capita) 27Table 14: Use of all outpatient services by gender and age group (annual visits per
capita) 28Table 15: Public health expenditures as a share of household consumption 30Table A1: Use of public outpatient health services by income decile (annual visits per
capita) 35Table A2: Use of all outpatient services by income decile (annual visits per capita) 35Table A3: Use of public inpatient health services by income decile (bed-days per capita
per year) 36Table A4: Use of all inpatient services by income decile (bed-days per capita per year) 36Table A5: Distribution of public health expenditures by income decile (%) 36Table A6: Distribution of public and private health expenditures by income decile (%) 37Table A7: Distribution of public health expenditures by governorate (per capita) 37Table A8: Income, health status, and distribution of total health expenditures by
governorate (1994/95 in LE) 38Table A9: Distribution of public health expenditures by gender and age group (LE per
capita) 38Table A10: Distribution of public and private health expenditures by gender and age-group
(LE per capita) 38
Distribution of health care resources in Egypt: Implications for Equity iv
Figures
Figure 1: Outpatient visits per capita per year 21Figure 2: Inpatient bed-days per capita per year 21Figure 3: Per capita health expenditures by governorate, ranked from poorest to richest,
Egypt 1994/95 26Figure 4: Per capita health expenditures by governorate, ranked according to infant
mortality rate, Egypt 1994/95 26Figure 5: Health expenditures by gender 28Figure 6: Health expenditures by age group 29Figure 7: Public health expenditures as a share of gross household consumption 30

Distribution of health care resources in Egypt: Implications for Equity v
Acronyms
ADL Activities of Daily LivingBTS Budget Tracking SystemCAPMAS Central Agency for Public Mobilization and StatisticsCCO Curative Care OrganizationCDC Cairo Demographic CenterCOMAC-HSR Commission of the European Communities – Health Services ResearchDDM Data for Decision Making Project, Harvard School of Public HealthDOP Department of Planning, Ministry of HealthFP Family PlanningFY Fiscal YearGDP Gross Domestic ProductGNP Gross National ProductGOE Government of EgyptHIO Health Insurance OrganizationLE Egyptian PoundMCH Maternal and Child HealthMOE Ministry of EducationMOF Ministry of FinanceMOH Ministry of HealthMOSA Ministry of Social AffairsNHA National Health AccountsNHHEUS 95 National Household Health Utilization and Expenditure Survey 1994-95NCMC National Child and Motherhood CouncilNODCAR National Drug Control and Regulation AgencyNPC National Population CouncilOECD Organization for Economic Cooperation and DevelopmentPIO Pensions and Insurance OrganizationSMIP Student Medical Insurance ProgramSIO Social Insurance OrganizationTHIO Teaching Hospitals and Institutes OrganizationUSAID U.S. Agency for International Development
na Not available/not applicable

Distribution of health care resources in Egypt: Implications for Equity vi
Acknowledgments
This study was only made possible because of the efforts of many colleagues over severalyears, who have been associated with the Harvard School of Public Health/DDM Project inEgypt. Studies carried out by Harvard and colleagues at the Directorate of Planning, MOPH,Research Triangle Institute, and Cairo Demographic Center provided important inputs into thisstudy. In particular, mention must be made of the staff and consultants in the NHA team atMOPH, Abeer Kamal, and Dr. Khaled Nada, all of whom worked on the preparation of the1994/95 NHA estimates, and secured additional data that were required for this analysis. Specialmention must be made of Mr. Ahmed Ibrahim of the Ministry of Finance, without whoseassistance in accessing information, the Egyptian health care financing system would haveremained considerably opaque. Dr. Hassan Salah at the Harvard/DDM office in Cairo in additionto being responsible for the costing studies that were used in this work, also provided supportthroughout, especially during visits to Cairo by the principal author.
The authors are grateful to Dr. Peter Berman of the Harvard School of Public Health for hisdetailed comments on drafts of this paper, as well as Marty Makinen of Abt Associates whomade some observations on the findings of the study. Our thanks also to DananjaneeSenagama of the Institute of Policy Studies who provided some assistance with the statisticalprogramming.
The US Agency for International Development through its Cairo mission provided financialsupport for the various studies utilized in this analysis, as well as this study itself. This work wasfinanced mainly by the Data for Decision Making Project at Harvard School of Public Health(USAID Cooperative Agreement No. DPE-A-00-91-00052-22). Some additional support forcompleting this work came through the Partnerships for Health Reform Project(Contract No. HRN-5974-C-00-5024-00).

Distribution of health care resources in Egypt: Implications for Equity 1
Background
Equity in access to and use of health services is a common goal for policy-makers in mostcountries. Poverty alleviation through the re-distributive effect of public health spending isanother important welfare goal in many countries. However, assessment of the extent to whichthese goals are achieved in reality is rare, outside the developed world. This study examines thedistribution of public and private health spending across households and individuals in Egypt,their relationship to the utilization of health services and illness, the impact of public spending onhealth services on net household income, and the implications for equity.
Although much of the pattern of equity found in a particular health system is a function of thepre-existing patterns of social and economic equity, as they are found outside the health systemitself, it is generally presumed that the structure and organization of the delivery and financing ofhealth care itself can play a significant role in determining the pattern of equity in access to anduse of health services. However, with the exception of the COMAS-HSR study in OECDcountries, there has been little systematic study of the equity characteristics of alternative healthcare financing and delivery systems (van Doorslaer, Wagstaff and Rutten, 1993). In this context,Egypt offers a particularly interesting case, as its health system comprises most of the majorhealth care financing and delivery mechanisms found in developing countries. This studytherefore also uses its results to assess the different health care programs existing in Egypt fromthe perspective of equity between different social groups.

Distribution of health care resources in Egypt: Implications for Equity 2
Approach
Equity is a stated goal for policy-makers in the health care systems of most countries, and in theagenda of many international organizations (Whitehead, 1990). Equity as a goal can becontrasted with efficiency, and in essence relates to a concept of social justice. Equity as anevaluative concept can also be applied both to the financing of health care, as well as itsdelivery. However, there is no agreed definition of what constitutes equity with respect to healthsystems. This lack of an agreed and consistent definition stems from underlying differences inphilosophical approach.
Two generally dominant approaches to discussing equity are the egalitarian and libertarianapproaches. Egalitarians would judge equity by assessing the extent to which health care isdistributed in practice according to need, and in practice financing according to ability to pay.Libertarians, in contrast, would focus attention on the extent to which people are free to purchasethe health care they want, subject to the proviso that the poor and sick are adequately providedfor. In practice, in most countries, policy makers are probably concerned with an egalitarianapproach to equity. That is they are concerned with ensuring equality in access to health care.However, there tends to be some confusion even in this, with some understanding this to beequivalent to equity in access to treatment, and others understanding this as equity in receipt oftreatment. Nevertheless, the most common interpretation of equity of access to health care isequity in receipt of treatment, that is that health care should be distributed according to need(van Doorslaer, Wagstaff and Rutten, 1993). When looking at financing, most policy makers andanalysts appear to accept the principle that equity means that payments for health care shouldbe according to ability to pay rather than in relation to the amount of medical care received.
In all these approaches, the goal of equity is being applied only with respect to distribution ofhealth services. A variant on the egalitarian approach should be noted. In this the concern is notwith the distribution of health services as such, but with the distribution of income within society.In this variant, reduction in inequality of “final” incomes is regarded as the equity goal. VanDoorslaer et al. (1993) argue that in developed countries this type of equity goal is rarely used inargument with respect to health services. However, it may be more important in developingcountries, where public spending is more constrained, and where poverty alleviation may have ahigher ranking in priorities than other social objectives.
In this study of Egypt’s health care system, the focus is on the equity of distribution of healthservices, for reasons discussed later. There are two major approaches to estimating thedistributional outcomes of public spending (van de Walle, 1996). The longest-established isrepresented by benefit-incidence studies, which assume that the value of the benefits of a publicservice to the individual equals the unit cost of providing the service. Benefit incidence studiesexamining health services have been carried out in developing countries for at least twodecades. Examples include Malaysia (Meerman, 1979), Colombia (Selkowsky, 1979), Sri Lanka(Alailima and Mohideen, 1983), Chile (Foxley, 1979), Ghana (Demery, Chao, Bernier, andMehra, 1995), Côte d’Ivoire, Jamaica, Peru and Bolivia (Baker and van der Gaag, 1993).
Benefit incidence studies are methodologically simple, but have faced two sets of problems. Thefirst relates to availability of accurate data on the welfare ranking of individuals and households,the utilization of services, and variation in unit costs of services within a health system,particularly in the context of geographically differentiated services. Lack of disaggregation inavailable data, and other inaccuracies in measurement, for example of household income, canlead to significant biases and errors in the estimations. The unit costs of services may vary, withlower level services or services in certain parts of the country being less well-funded. Thenassuming that unit costs of a service are the same across a country would lead to a bias in theresults, if households use of the different levels of services is non-uniform. However, oftenresearchers make such assumptions because of lack of more detailed data. For example, in the
Distribution of health care resources in Egypt: Implications for Equity 3
COMAC-HSR study of equity in financing of health care in nine European countries and USA,the majority of national studies assumed that the unit cost of publicly-financed services was thesame across a country and at all levels of a health system (van Doorslaer, Wagstaff, and Rutten,1993). Similarly, data on utilization of services come typically from special household surveys,but these often contain inadequate measurements of household income, which do not permitaccurate ranking of households according to current welfare. This problem is particularlycommon in developing countries, with large non-formal sector workforces, significantsubsistence production, and where high rates of tax evasion may be prevalent.
The second set of problems relates to the inherent conceptual limitations of the approach.Benefit incidence studies assume that the value of public spending to a household is equivalentto the monetary value of the expenditures used to produce the consumed services. However,household welfare may benefit in other ways. For example, health status may improve, and thevaluation of this by the individual or by society may differ from the value of the expenditures. Inthe absence of working insurance markets, risk-averse households may derive welfare from theprovision of implicit insurance coverage against catastrophic illness in the form of free publicinpatient provision, and the value of these welfare gains are likely to vary by income, sincelower-income persons may find it harder to obtain actuarially-fair insurance in a private market.Another problem relates to second-round indirect benefits of public spending. For example,immunization services or TB chemotherapy may provide protection to those who are notrecipients by reducing the overall risk of infection. These indirect benefits are in practice difficultto predict or to evaluate, and most studies usually ignore them.
The second approach to estimating the distributional outcomes of public spending involves so-called “behavioral approaches” (van der Walle, 1996). These approaches attempt to modelbehavioral responses of households to public programs, and explicitly examine the marginalimpact of program changes. They address a more basic problem of the conventional benefitincidence studies, which is that they do not tell us necessarily what the net impact of publicspending is, since they do not compare the distribution of welfare with what would havehappened in the absence of public spending. To know this requires that we understand thebehavioral response of households in order to be able to predict their economic behavior andconsumption in the absence of the public program under examination. However, experience todate with modeling such behavioral responses is quite limited, and where such studies havebeen done, they have usually failed to generate different qualitative conclusions (Ravallion, vande Walle, and Gautam, 1995). In this context, the value or additional information gained fromthese studies remains questionable (van de Walle, 1996).
This study of the distribution of health care resources in Egypt uses the first approach, and is inthe classical benefit incidence tradition. However, unlike most previous studies, it attempts toexamine the distribution of resources within the context of an available set of national healthaccounts, and attempts to account for intracountry geographical variations in the level ofbudgetary funding for public services, as well as differences in the amount of funding fordifferent levels in the public health sector. This was made possible by the availability of a set ofnational health accounts, high quality budgetary data and costing studies from previous workconducted by colleagues and associates of the authors, as well as the availability of data from aspecially designed national household survey of health care utilization and expenditures.
One other distinctive and important feature of this study relates to its treatment of privateexpenditures. Most studies examining the distribution of private expenditures use unadjusteddata from household surveys, although evidence from most countries indicates that there alwaysdifferences between the level of household expenditures on health reported in national surveys,and that derived from more comprehensive national health accounts estimates of householdspending, which take into account other data on private spending (Rannan-Eliya and Berman,1993). This study uses Egypt’s National Health Accounts to constrain the level of expendituresreported in the household survey, in order make them fully comparable to the data on public and

Distribution of health care resources in Egypt: Implications for Equity 4
institutional expenditures. In addition, all other known health expenditures in Egypt aredistributed according to the presumed beneficiaries. The resulting estimates of the distribution ofhealth care expenditures are thus fully consistent with the official national health accounts forEgypt, and in fact describe the distribution of all health care spending in Egypt. The availabilityand use of national health accounts data finally make it possible to treat the eventual results asapplicable to the totality of health care delivery in Egypt, and not just to one or more individualcomponents of the health care system.
Ideally, this analysis should have used the full methodology as used by the authors in theCOMAC-HSR study (van Doorslaer, Wagstaff, and Rutten, 1993). The COMAC-HSR studyinvolved ten case studies, each looking at the equity in financing and delivery of health care indifferent OECD economies. The COMAC-HSR methodology is again in the benefit incidencetradition, but developed a comprehensive standard methodology for its comparative nationalstudies. This methodology involved three elements:
(1) Measuring the equity of financing by estimating the contribution made by eachincome group to each of the identified financing mechanisms, including generalrevenue taxation, social insurance premiums and out-of-pocket financing.
(2) Measuring the distribution of health care delivery by imputing the financial cost ofthe health care services utilized by each income group.
(3) Measuring the distribution of need by quantifying the distribution of acute andchronic illness in each income group using self-reported sickness data.
The methodology in this study attempts to replicate those elements of the COMAC-HSR studythat were feasible given available data. In practice this meant only the second element in toto.Measuring equity of financing was not feasible for the most part, as studies and data are notavailable giving the fiscal incidence of taxes and social insurance premia in Egypt.
Similar data to those used in the COMAC-HSR study were available for looking at thedistribution of self-reported sickness. However, there are much greater differences betweenincome groups in Egypt in their apparent tolerance of sickness and likelihood to self-reportsickness than observed in developed countries. This results in a situation in Egypt, where therich are more likely to report illness than the poor, despite the objective evidence indicating thatthe burden of illness and mortality is greater in the poor. For this reason, although some of thedata on reported sickness rates are reported here, they are not used to control the distribution ofhealth care expenditures as in the COMAC-HSR study.

Distribution of health care resources in Egypt: Implications for Equity 5
Egypt’s Health Care System
Egypt is a low-income developing country; per capita GNP was US$ 790 in 1995. Healthconditions are comparatively poor, with life expectancy reported as 65.3 years at birth in 1992,and the infant mortality rate as 42.5 per 1000 in 1991 (National Institute of Planning, 1995). Thehealth care system is pluralistic with several public health programs and considerable privatesector provision. In 1995, approximately 25% of financing came from general revenue sources,20% from social insurance financing, and 55% from private, mostly out-of-pocket householdspending. Total health care spending was estimated to be equivalent to 3.7 % of GDP in 1994/95(Rannan-Eliya and associates,1998).1
The major provider of care is the Ministry of Health, which runs a nationwide system of healthservices, ranging from outpatient clinics to large urban-based hospitals, and providing a mix ofinpatient and outpatient care. These services are administered on a decentralized basis, withmost service facilities run by Egypt’s 27 governorates, which are the major sub-nationalgovernmental authorities in Egypt. The governorates are funded through a decentralized healthbudget provided by the Ministry of Finance. MOH services are subsidized, and provided largelyfree to all citizens.
The second major public financier and provider of care is the Health Insurance Organization(HIO). This is a compulsory social insurance agency, which levies mandatory payrollcontributions on all formal sector workers and their employers, and public pensioners. HIO wasestablished in 1964 with the intention of eventually covering the whole population. However, aswith similar programs in other low-income to lower-middle income countries, universal coveragehas remained elusive, and coverage has remained restricted to the small urban, formal sector.From 1965 to 1995, the number of beneficiaries increased from 140,000 to 5,851,549 (9.7% ofthe national population).
Premiums range from two to five per cent of assessed salaries. Widows are covered under aseparate program, but do not make premium payments. Small co-payments are required ofsome workers, but these are quite small in relation to benefits provided. Coverage applies only tothe enrolled worker, and does not extend to dependents. Although, HIO operates as an insuranceagency, in practice its annual expenditures are greater than its income from premiums.Consequently, it receives ad hoc subsidies from the Egyptian government in order for it to payunpaid creditors, and occasionally for capital expenditures. HIO can thus be regarded as afunding mechanism combining features of both social insurance as well as general revenuefinancing. During the 1994/95 fiscal year, HIO expenditures in its main workers and pensionerand widows programs amounted to LE 635 millions, but total revenues from premium paymentswere only LE 408 millions. The deficit was not funded in that year, but was carried forwarded tothe future accounting periods, when it would typically be paid off by general revenuecontributions.
A separate HIO program introduced in 1993, known as the Student Medical Insurance Program(SMIP), provides insurance coverage to over 7 million students. SMIP is financed by a mix ofindividual premiums paid by enrolled students (LE 4 per child), a special ear-marked cigarettetax of 10 piastres per packet, and a contribution from general revenues of LE 4 per child. Onlyregistered students are eligible to enroll. Children who are not going to school, typically thosefrom the poorest families, are not eligible. SMIP combines elements of social insurance andgeneral revenue financing, but it can be characterized as a general revenue funded program witha modest insurance element. During the 1994/95 fiscal year, SMIP’s funding was derived 76%from general revenue contributions by GOE, and only 14% from premiums by students. Taking
1 Estimates are for GOE Fiscal Year, July 1, 1994 to June 30, 1995.

Distribution of health care resources in Egypt: Implications for Equity 6
both SMIP and the general programs together, HIO in 1994/95 was more than 50% funded fromgovernment revenues other than the mandatory payroll taxes levied in the form of premiums.
Public funding in the form of general revenues is also used to finance several other publicproviders of health services. The Health Ministry runs a small number of specialized nationalteaching hospitals, which provide largely free care. The Education Ministry through its budgetsupports twenty university hospitals, with over 15,000 beds. These provide a higher quality ofcare than MOH facilities, and receive a higher level of government subsidies per unit of service.The university hospitals are linked to the universities, but they are open to all patients. Theycharge user fees from patients, although they remain largely subsidized. Finally, other ministries,including Transport and the Armed Forces, run their own facilities for staff and their dependents,and in some cases these facilities are also available for use by the general public.
While public provision dominates inpatient care services, Egyptians make considerable use ofprivate ambulatory services. These are provided mostly in private clinics, but include pharmaciesand non-governmental clinic services. Private clinics are staffed for the most part by governmentdoctors, who are allowed to work privately in their off-duty hours. There is a small privatehospital sector which is concentrated in the Cairo-Giza metropolitan area.
Egyptian doctors are not legally permitted to dispense drugs, and this is restriction is generallyadhered to. Households make substantial use of pharmacies for obtaining drugs, and in somecases treatment advice. These private services are all funded by private out-of-pocket spending,supplemented by a very small amount of private insurance.
Methodology of Study
The primary objective of this study is to examine the distribution of health care resources inEgypt by estimating or imputing the value of health care services delivered to differentpopulation subgroups. To do this requires two types of information:
(1) Data on the expenditures incurred in delivering each type of health serviceexamined
(2) Data on the proportional utilization of each type of health service by differentpopulation subgroups
If the utilization of health services is known, then the share of medical expenditures received byeach population subgroup can be simply estimated by assuming that there are no differences inthe intensity of resource use per treatment episode across population subgroups, and bymultiplying the utilization data into the data for medical expenditures.
A major additional concern of this study, which is a methodological one, is that the expendituresdistributed across each population subgroup should be derived from those estimated in theEgypt’s national health accounts. This provides an overall framework for the estimations whichwill ensure full comparability in the levels of expenditures incurred in each health care program.
Data and variable definitions, and assumptions
National Health Accounts
The central source of data for this study is the National Health Accounts (NHA) of Egypt for1994/95. Other reports give detailed information on the compilation and structure of Egypt’sNHA, which are the official estimate of national health expenditures in Egypt (Rannan-Eliya andassociates, 1998). Egypt’s NHA provide the most accurate available estimates of total healthcare spending in Egypt, and of the structure and the flow of funds between financing agents andhealth care providers. The NHA are organized in a matrix format, which ensures internal

Distribution of health care resources in Egypt: Implications for Equity 7
consistency, as all funds provided by funding agents must balance with the funds received byproviders. The NHA database which supports estimation of the NHA includes multiple datasources, including the MOF audited accounts of government agencies and departments, andsurvey data from autonomous government health care providers, private insurance companies,employers and pharmaceutical companies. In the case of government sector organizations, theNHA typically includes only audited expenditures, while private expenditures are based onestimates derived from reconciling information from a combination of household and providersurveys and other secondary data.
For this study, the 1994/95 NHA database provided the following data:
(i) MOF audited expenditure figures for all governorate health departments(ii) MOF audited expenditure figures for MOH, HIO and teaching hospitals and
several specialized health agencies
According to the NHA, total national health expenditures in Egypt in 1994/95 were the equivalentof 3.7% of GDP. Tables 1 and 2 provide an overview of the flow of funds within Egypt’s healthcare system as estimated in the NHA. Table 1 shows the flow of funds from the ultimate sourcesof financing to financing intermediaries or final providers, when the funds do not pass throughintermediaries. Table 2 shows the flow of funds from financing intermediaries to actual providersof health care services.
As can be observed, the NHA identifies the following providers of health care in Egypt:
(i) MOH facilities and services(ii) Teaching hospitals(iii) University hospitals(iv) Other national health agencies(v) Other public medical providers (including Defense Ministry hospitals)(vi) Health Insurance Organization(vii) Private hospitals(viii) Private clinics(ix) Pharmacies(x) Traditional providers(xi) Others
This study distributes all expenditures for services provided by each of these provider typesacross the population.
Distribution of health care resources in Egypt: Implications for Equity 8
Table 1: Financing flows in health system, Egypt FY 1994/95 - Sources to financing intermediaries (LE millions)
SourcesMOF/NIB SIO Donors Firms Syndicates Households TOTAL
Transferred to intermediaries
MOH 1,337 142 1,479THIO 97 97MOE 517 517MOSA 6 6Other ministries 190 190HIO 434 448 12 39 933Firm schemes 364 364Syndicate schemes 26 26Private insurers 17 17Subtotal 2,581 448 154 381 26 39 3,629
Not transferred to intermediaries
MOF/NIB 46 31SIO 0 0Donors 61 61Firms 0 0Syndicates 0 0Households 3,780 3,780Subtotal 46 0 61 0 0 3,780 3,887
TOTAL 2,627 448 215 381 26 3,819 7,516Source: Egypt National Health Accounts (Rannan-Eliya et al., 1998)

Distribution of health care resources in Egypt: Implications for Equity 9
Table 2: Financing flows in health system, Egypt FY 1994/95 - Financing intermediaries to providers (LE millions)
Public Financing Donors Private financing
MOH THIO MOF MOE MOSA Others HIOForeignDonors Firms
Syndic-ates
Privateinsurers
House-holds TOTAL
MOH facilities 1,305 17 80 1,402
Teaching hosps 14 97 3 2 2 1 118
Univ. hosps. 30 517 30 26 1 1 2 606
NPC 20 5 2 27
NCMC 1 1 2
NODCAR 5 5
Vacsera 5 5
Other public 4 190 6 200
HIO 1 530 49 580
CCOs 11 15 28 3 221 49 330
Private hosps. 42 71 23 20 5 120 281
Private Clinics 57 5 5 670 737
Pharmacies 17 237 60 1 5 2,396 2,716
NGOs 3 6 6 25 70 110
Traditional 8 8
Others 332 332
Foreign providers52 5 57
Administration ofprivate insurance
1 1
TOTAL 1,479 97 46 517 6 190 933 61 364 26 17 3,780 7,516
Source: Egypt National Health Accounts (Rannan-Eliya et al., 1998)
Distribution of health care resources in Egypt: Implications for Equity 10
Table 3: Key to categorization of expenditures for equity analysis
Public financing Donors Private financing
MOH THIO MOF MOE MOSA Others HIOForeignDonors Firms
Syndic-ates
Privateinsurers
House-holds TOTAL
MOH facilities A E G 1,402
Teaching hosps C C E C H G 118
Univ. hosps. C C E C H H G 606
NPC B H G 27
NCMC B G 2
NODCAR B 5
Vacsera B 5
Other public D D E 200
HIO E E G 580
CCOs D D E D H G 330
Private hosps. A E H H H G 281
Private Clinics H H H G 737
Pharmacies A E H H H F 2,716
NGOs A B E H G 110
Traditional G 8
Others G 332
Foreign providers A E 57
Administration ofinsurance H 1
TOTAL 1,479 97 46 517 6 190 933 61 364 26 17 3,780 7,516
Key to allocation of expenditures in analysisA GOE funded Ministry of Health budget expendituresB GOE funded national agencies providing collective health servicesC GOE health care subsidies through university/teaching hospitalsD GOE personal health care subsidies not otherwise categorized
E HIO spending funded by mandatory insurance premiums and other taxesF Household spending on drugsG Household spending on non-drug health care services and productsH Private expenditures not directly by households

Distribution of health care resources in Egypt: Implications for Equity 11
Household Survey Data
The source of household data used in this analysis is the National Household Health Utilizationand Expenditure Survey carried out during 1994-95 (NHHEUS 95). This was a national surveydesigned by Harvard University and Cairo Demographic Center (CDC) in collaboration with theMinistry of Health to accurately measure utilization of health services during 1994-95. Thesurvey took a self-weighting stratified sample of 21 governorates. Five governorates (Matrouh,Red Sea, North Sinai, South Sinai, New Valley) were not included in the sample on grounds ofcost, but these account for only 1.2% of Egypt’s total population. The survey covered 10,664households, of which 9,931 were successfully interviewed giving a response rate of 93.1%. Ofthe 55,824 individuals living in the interviewed households, 50,984 were actually interviewed,giving a response rate of 94.7%. The overall response rate was thus 88.2%. The survey wasconducted in two national rounds in order to control for seasonal variations. The first round washeld during November 1994 to February 1995, and the second round was during July 1995 toAugust 1995. All adult members of the sampled households were administered the surveyinstrument separately, and children were interviewed using adult proxies. The survey instrumentused different schedules for adults and children, and for inpatient and outpatient utilization.
Respondents were asked about utilization of ambulatory care services in the past two weeks, andinpatient services in the previous 12 months. The survey instrument differentiated betweendifferent types of public facilities (MOH urban hospitals, MOH rural hospitals, MOH MCH centers,MOH urban health centers, MOH rural health units), as well as between public and privateproviders.
Questions about outpatient utilization of health care providers were contingent on individualsreporting an illness episode during the previous two weeks, and for each illness episoderespondents were allowed to name up to six different providers, in the order in which they wereused. For each of these different provider episodes, respondents were asked about theassociated expenditures. In the case of inpatient use, respondents were asked about anyinpatient episodes during the previous 12 months, and they were allowed to list up to 4successive episodes each, with details requested on the name and type of inpatient provider,associated expenses and length of stay.
NHHEUS 95 provides data on the consumption level of each household based on a detailedschedule which enquired after household expenditures. The information on total householdexpenditures was used to rank households into quintiles on the basis of mean total householdexpenditures per capita for each household. For the purposes of analysis, adults were treated asbeing equal to children in this calculation. It is not possible to independently verify the accuracyof the average household expenditures reported, as Egypt does not publish detailed data on thedistribution of household income. However, comparison of the average household expenditureper capita with that implied by the National Income Accounts, and other published incomedistribution data (World Bank, 1999), suggests that NHHEUS 95 recorded relatively accuratedata on the levels and distribution of household expenditures. Table 4 shows the distribution ofexpenditure in the sample, compared with estimates published by the World Bank. It should alsobe noted that there is a discrepancy between the average level of household expendituresreported in NHHEUS and that implied in Egypt’s national income accounts. Householdexpenditures in NHHEUS are some 30-40% lower than private consumption as given in thenational income accounts. This is not surprising as the survey concentrated on health careutilization and expenditures, and used only a short schedule for recording other householdconsumption. Thus some underestimation of overall household consumption would have beenexpected and did occur, but is assumed not to have biased the relative ranking of households.
Table 4: Estimates of distribution of per capita household expenditures in Egypt

Distribution of health care resources in Egypt: Implications for Equity 12
Expenditure quintilesI II III IV V Gini
NHHEUS (1994/95) 6.3 10.0 14.0 20.2 49.5 0.420World Bank (1991) 8.7 12.5 16.3 21.4 41.1 0.320Note: Parentheses indicate year which estimate applies to. World Bank from World Bank (1999). Quintiles arranged frompoorest to richest, with I the poorest.
Budget Tracking System
In any benefit-incidence study, one of the problems is how to allocate government healthexpenditures between types of facility and service. In most cases, including Egypt, this cannot bedone through examination of the official accounts. In the Egyptian government’s officialaccounting system, all expenditures are classified and recorded under four categories only:Chapter 1 (personnel salaries and benefits), Chapter 2 (non-salary recurrent expenditures,including drugs, supplies, utilities, etc.), Chapter 3 (capital purchases and investments), andChapter 4 (debt repayments and other investment transfers). This system does not permitanalysis of expenditures by end-use. To overcome this problem, the Health Ministry is currentlydeveloping a separate Budget Tracking System (BTS).
The BTS is a management information system designed to allow tracking of all health ministryexpenditures according to various classifications of their ultimate use. These classificationsinclude type of health care unit, location (urban-rural, district, governorate), and medicalfunction. The BTS has been developed by carrying out detailed studies of actual expenditurepatterns in a large number of representative facilities in three governorates: Alexandria, BeniSuef and Port Said. Alexandria and Beni Suef were chosen as being representative of urban andrural governorates respectively. Based on the observed variation in spending patterns betweenindividual facilities of the same type, estimating procedures have been defined which allowannual estimation of spending breakdowns at the governorate level, based on returns from astatistically representative number of facilities.
The BTS is currently being expanded from the original three pilot governorates to allgovernorates. While this is occurring, accurate data on spending patterns in the three pilotgovernorates are available, and these were used in this study to estimate the distribution ofspending in all governorates across different facility types through a process of extrapolation.
Facility Costing Studies
Salah and associates have carried out a number of detailed costing studies in a large sample ofMOH facilities (Salah, Walsh and Nandakumar, 1997a, 1997b, 1997c). These studies are anaccurate and reliable source of data on the allocation of expenditures in sampled facilitiesbetween capital and recurrent uses, between individual departments, and between inpatient andoutpatient use. These studies have been carried out in the same three governorates as the pilotphase of the BTS (Alexandria, Beni Suef and Suez), but were considered representative of thedistribution of costs within MOH facilities in other governorates.
Expenditure Definitions
Public subsidies for health services were valued at the actual cost to the government ofproducing the services. They were not valued at the market price of such services. The cost tothe government was taken as the net cost, excluding any income that the public facilitiesreceived as user fees from patients as official payment. To avoid double counting ofexpenditures, the data for MOH expenditures in each governorate were adjusted by the amountsrecorded in user fees in that governorate.

Distribution of health care resources in Egypt: Implications for Equity 13
Inpatient services were defined as any services which involved the patient staying overnight in afacility. Outpatient services were defined as all services which involved individual contacts withproviders, and did not involve an overnight stay. Public collective services were defined as thoseservices whose benefits could not be attributed to any individual, and which benefited groups ofindividuals within the population; examples include vector control, drug regulatory functionsexercised by central agencies, and health education.
The population surveyed in the NHHEUS 95 was categorized into urban and rural according tothe official GOE classification of the areas in which households were located. Reportedhousehold consumption was used as the measure of the welfare ranking of households. Totalannual expenditures were divided into the number of persons in the household to obtain a percapita expenditure figure, which was then used rank households into deciles and quintiles. Inother studies conducted in developed countries, an adult equivalence scale is often used to takeinto account the fact that children require a lower level of consumption (van Doorslaer et al,1993). This was not done in this case, as there was no such scale validated for use with Egyptianhousehold survey data. Expenditure was used throughout as a proxy for household income.
Private health expenditures in this study largely relate to household out-of-pocket spending.Household health expenditures were defined as including all expenditures by households fordirectly purchasing medical services or supplies, whether the purpose was curative, preventativeor rehabilitative. This definition excluded household expenditures on travel to and from healthcare providers. Payments for private health insurance by individuals and by firms are ignored inthis analysis, as the data are not sufficient to enable an analysis of their distribution. However, itshould be noted that very few people in Egypt are enrolled in private health insurance schemes,with most recent estimates putting the numbers at less than 50,000 individuals, or 0.1% of thenational population.

Distribution of health care resources in Egypt: Implications for Equity 14
Choice of Illness and Need Measures
Many policy makers would accept the objective that health care ought to be distributed accordingto need and not according to ability to pay. This can be expressed in the principle of horizontalequity: that persons in equal need ought to be treated the same irrespective of ability to pay. Theextent to which this occurs can provide one yardstick of the equity in a health care system. Needcan be correlated directly with sickness or illness requiring medical treatment or action by thehealth system.
Assessment of the distribution of need, or sickness in a population ideally requires objectiveclinical information. However, this type of data is not normally available, and instead analysts areleft with measures of the reported sickness of individuals. In this case, NHHEUS 95 providesdata on reported sickness of individuals. All individuals in the survey were asked a series ofquestions about whether they had experienced acute symptoms of illness during the past twoweeks, as well the presence of longer-lasting symptoms which had persisted for more than threemonths. These two sets of questions were used as measures of acute sickness and chronicsickness respectively. It should be emphasized that both of these are perceptions of illness, andtherefore are related to actual clinically recognized illness only through the medium of theindividual’s subjective perceptions.
In addition to these questions on the presence of acute and chronic symptoms, individuals werealso asked to rate their general health status in comparison with others of their same age group.They were allowed to choose from five responses, which ranged from “excellent” to “poor”.
A somewhat more objective measure of ill-health or disease is to ask about inability to performnormal tasks. NHHEUS 95 included a series of questions which enquired about the ability toundertake normal day to day tasks, such as bathing, walking, etc., based on the ‘Activities ofdaily living’ used in U.S. surveys. The summed responses to this set of questions provides anordinal measure of relative disability. This ADL (Activities of Daily Living) measure was alsoexamined as a possible measure of relative ill-health.
Method of Analysis
This analysis of health expenditures in Egypt is designed to distribute national healthexpenditures as estimated in Egypt’s NHA for 1994/95 (Tables 1 and 2). The NHA provides theoverall framework and constraints within which allocations are determined. This implies thefollowing principles:
1. All expenditures calculated must sum to the corresponding totals in the rows andcolumns of the NHA matrices.
2. The total of public subsidy expenditures and private expenditures must equal totalnational health expenditures as given in the NHA.
3. All expenditures must be distributed; if no information is available to do so, thenexpenditures should be distributed conservatively, i.e., equally across all individualswho are identified beneficiaries.
To ensure complete compatibility with the NHA estimates, the following methodology wasemployed, treating public subsidy expenditures separately to private expenditures. In doing so,the study explicitly ignores external assistance from foreign donors as a separate source offinancing in the health care system. Estimated foreign donor support is aggregated with therelevant public funding for each type of organization.

Distribution of health care resources in Egypt: Implications for Equity 15
The following section describes in detail how the each item of expenditure was treated in theanalysis. Table 3 provides an overview of how expenditures were categorized and grouped forthe purpose of analysis.
Public Expenditures
All national totals for particular program subsidies were derived from the relevant cells of the1994/95 NHA matrix (Table 2). Information from the NHA database was then used to distributeexpenditures of individual public programs or activities by governorate or by appropriatepopulation sub-group.
If CX is total national expenditure by the government on a particular provision program X, CXG isthe government’s expenditure on program X in governorate G. Then total national expendituresby the government on program X are given by
CX = CXGG∑
Table 5 lists the programs and governorates which were separately considered in the analysis.Note that four Frontier governorates were not included as they were not represented in theNHHEUS 95. Adjustment was made for this omission in the analysis, and in the presentation ofresults.
Table 5: Governorates and programs separately considered in analysis
Governorates Public provision programsCairo Ministry of HealthAlexandria Health Insurance Organization (General)Port Said Health Insurance Organization (SMIP)Suez University hospitalsDamietta Teaching hospitalsDaqahlia Defense and other ministriesSharqiaQalyoubiaKafr El SheikhGharbiaMenoufiaBeheiraIsmailiaGizaBeni SuefFayoumMinyaAssiutSohagQenaAswan
In the case of MOH services, the BTS and facility costing studies were used to distributegovernorate expenditures firstly by level of facility and secondly by inpatient and outpatientservices (Table 6). In doing so, it was assumed that the expenditure patterns in Alexandria andBeni-Suef were representative of urban and rural governorates respectively, except for Suez,where the Suez results were used. The BTS provided data which allowed allocation of

Distribution of health care resources in Egypt: Implications for Equity 16
expenditures within a governorate according to the following categories: public collectiveservices, urban hospitals, rural hospitals, urban health units, rural health units, and MCH centers.Expenditures within types of facilities were then further allocated to inpatient and outpatientservices according to the patterns observed in the facility costing studies. Again as with the BTSdata, the patterns in Alexandria and Beni-Suef were assumed to be representative of urban andrural governorates respectively, except for Suez. If H refers to the expenditure category within agovernorate, and I refers to whether services are inpatient or outpatient, then
CXGHI = Total expenditure in program X in governorate G for category H and service I.
For most other public sector providers, such detailed costing information was not available, andexpenditures were allocated to types of service, assuming that their expenditure allocations weresimilar to those observed in similar MOH facilities. This procedure produces governorate-levelestimates of expenditures on inpatient and outpatient services for each major public provisionprogram, and in some cases disaggregated by level of facility.
Utilization data from the NHHEUS was then used to allocate these global amounts at thegovernorate level across individuals in the NHHEUS data set according to their reported levelsof utilization of those specific services, assuming that each unit of service utilized within agovernorate cost the same amount. The units of service used were outpatient visits and inpatientbed-days. If uXGHIn is the number of units of service I, provided by facility type H, used by the nthindividual in a particular governorate G, then the average public subsidy per unit of serviceconsumed, cXGHI , is calculated as:
cXGHI =C XGHI
u XGHInn
∑
From this, the average subsidy received by each individual in the survey was obtained bymultiplying the average subsidy per unit of service by the total number of units of service utilizedby that individual. This is equivalent to:
u XGHIC XGHI
u XGHInn
∑
Note that in doing this we are allocating the actual national expenditure on a program not acrossthe whole national population, but over the individuals in the survey. This procedure thusproduces an estimate of subsidies received per individual which is greater than thecorresponding real level in the same ratio that the national population is greater than the numberof respondents in the survey. This ratio, or sampling fraction, is 1049 at the national level,although it varies around this number in each governorate. If the estimated subsidy perindividual is then divided by these ratios, it yields a direct estimate of the per capita subsidiesreceived in reality by any individual or any group of individuals. On the other hand, simplysumming the subsidies received by any group of individuals in the data set yields a directestimate of the total subsidies received by that section of the national population which thatgroup is representative of.
This is possible, because the survey sample was selected to be a self-weighting representativesample of the whole Egyptian population.2 For example, if the total subsidies received by all the
2 Although the sample in the survey was a self-weighting sample representative at both national and regional levels,
the resulting sampling fractions at the governorate level were not the same. For this reason, when preparingtabulations, the appropriate governorate-specific sampling weights were used.
Distribution of health care resources in Egypt: Implications for Equity 17
females in the sample are summed, it yields a total which is an estimate of the total subsidiesreceived by the whole female population of Egypt. Similarly, if the average subsidy received byall females in the sample is divided by 1049, this yields a direct estimate of the per capitasubsidy for females in the national population.3
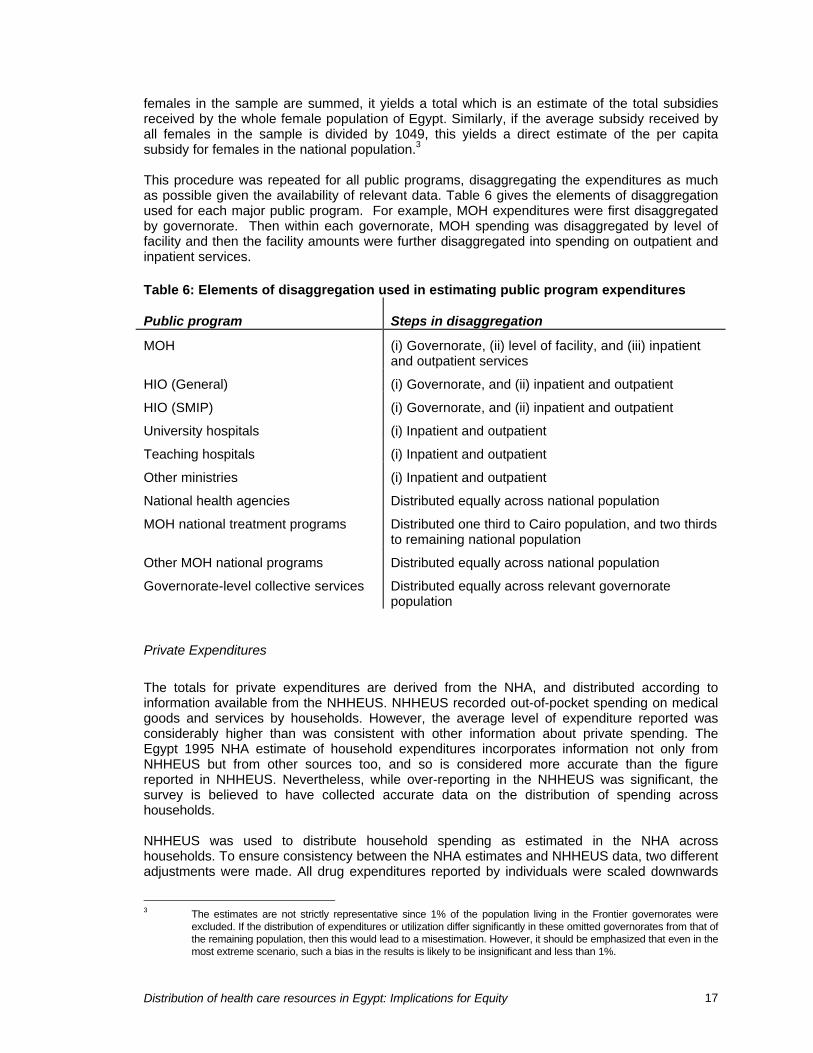
This procedure was repeated for all public programs, disaggregating the expenditures as muchas possible given the availability of relevant data. Table 6 gives the elements of disaggregationused for each major public program. For example, MOH expenditures were first disaggregatedby governorate. Then within each governorate, MOH spending was disaggregated by level offacility and then the facility amounts were further disaggregated into spending on outpatient andinpatient services.
Table 6: Elements of disaggregation used in estimating public program expenditures
Public program Steps in disaggregation
MOH (i) Governorate, (ii) level of facility, and (iii) inpatientand outpatient services
HIO (General) (i) Governorate, and (ii) inpatient and outpatient
HIO (SMIP) (i) Governorate, and (ii) inpatient and outpatient
University hospitals (i) Inpatient and outpatient
Teaching hospitals (i) Inpatient and outpatient
Other ministries (i) Inpatient and outpatient
National health agencies Distributed equally across national population
MOH national treatment programs Distributed one third to Cairo population, and two thirdsto remaining national population
Other MOH national programs Distributed equally across national population
Governorate-level collective services Distributed equally across relevant governoratepopulation
Private Expenditures
The totals for private expenditures are derived from the NHA, and distributed according toinformation available from the NHHEUS. NHHEUS recorded out-of-pocket spending on medicalgoods and services by households. However, the average level of expenditure reported wasconsiderably higher than was consistent with other information about private spending. TheEgypt 1995 NHA estimate of household expenditures incorporates information not only fromNHHEUS but from other sources too, and so is considered more accurate than the figurereported in NHHEUS. Nevertheless, while over-reporting in the NHHEUS was significant, thesurvey is believed to have collected accurate data on the distribution of spending acrosshouseholds.
NHHEUS was used to distribute household spending as estimated in the NHA acrosshouseholds. To ensure consistency between the NHA estimates and NHHEUS data, two differentadjustments were made. All drug expenditures reported by individuals were scaled downwards
3 The estimates are not strictly representative since 1% of the population living in the Frontier governorates were
excluded. If the distribution of expenditures or utilization differ significantly in these omitted governorates from that ofthe remaining population, then this would lead to a misestimation. However, it should be emphasized that even in themost extreme scenario, such a bias in the results is likely to be insignificant and less than 1%.

Distribution of health care resources in Egypt: Implications for Equity 18
by 36%, and all other non-drug expenditures by individuals were scaled downwards by 19%. Theevidence indicates that expenditures on drugs were over-reported in NHHEUS to a greaterdegree than other non-drug expenditures. These adjustments produce a data set, in which percapita expenditures on health are consistent with the NHA estimates. Since the survey sampleitself is representative of the whole national population, the average per capita expenditure ofany group of individuals in the data set is also a direct estimate of the average per capitaexpenditure of that section of the national population which that group is representative of. Thisfeature of the data set lends itself to rapid estimation of the per capita expenditures of anypopulation group.
Other private expenditures on health in Egypt are very small, consisting mainly of spending onprivate health insurance, spending by syndicates, which are professional associations, and someemployer spending on health services for private sector employees. It is estimated that theseother expenditures account for less than 10% of total national private health expenditures. Asdata are not available to examine the distribution of such expenditures, it is assumed that theseexpenditures are distributed equally across the whole population. Since most of theseexpenditures will be associated with higher income and formal sector employment, thisassumption would have the effect of marginally understating any bias in expenditures towardsthe upper income groups.
Distribution of health care resources in Egypt: Implications for Equity 19
Results
The methodology described above created a data matrix containing information on thedistribution of health expenditures across individuals in a representative national sample ofEgyptians. The matrix consists of estimates of the health care resources received by eachindividual in the data set through each health program or type of health service. Derivation of percapita expenditure levels and aggregate spending levels for sub-national population groups isthen relatively simple by a process of tabulation.
Tables 7 - 8 present the results of the analysis, tabulating results according to income group, ageand sex categories, and governorates.
Distribution of Need
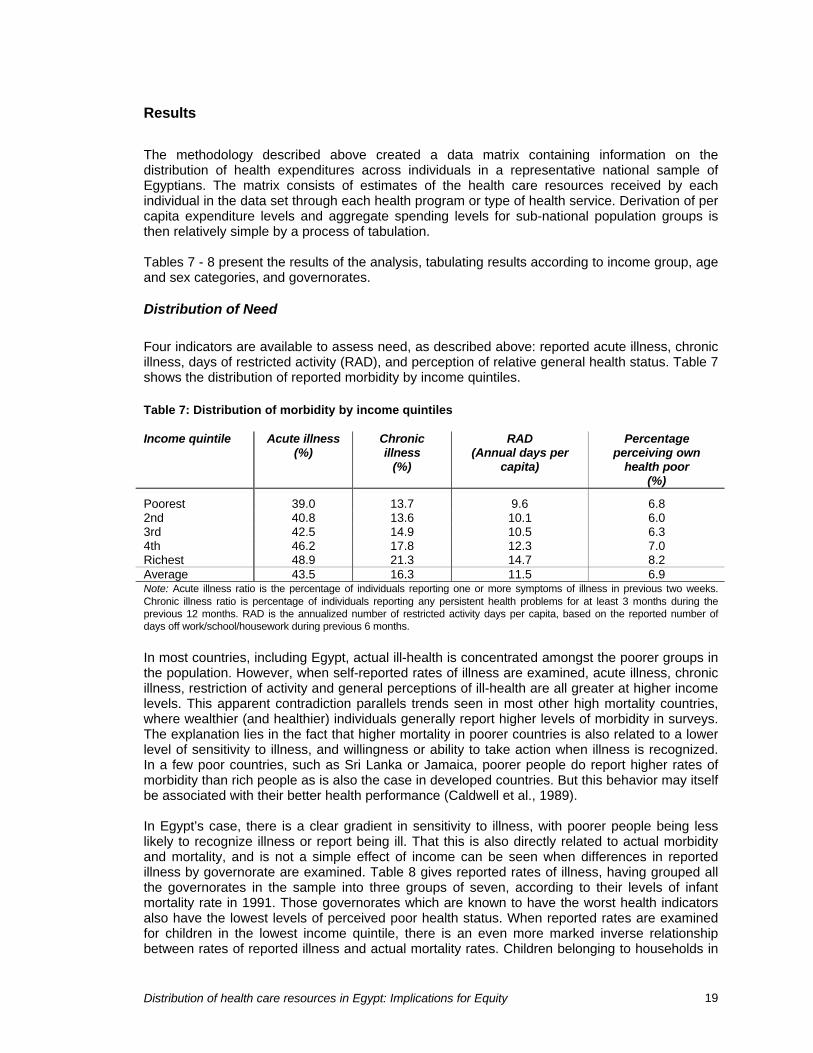
Four indicators are available to assess need, as described above: reported acute illness, chronicillness, days of restricted activity (RAD), and perception of relative general health status. Table 7shows the distribution of reported morbidity by income quintiles.
Table 7: Distribution of morbidity by income quintiles
Income quintile Acute illness(%)
Chronicillness
(%)
RAD(Annual days per
capita)
Percentageperceiving own
health poor(%)
Poorest 39.0 13.7 9.6 6.82nd 40.8 13.6 10.1 6.03rd 42.5 14.9 10.5 6.34th 46.2 17.8 12.3 7.0Richest 48.9 21.3 14.7 8.2Average 43.5 16.3 11.5 6.9Note: Acute illness ratio is the percentage of individuals reporting one or more symptoms of illness in previous two weeks.Chronic illness ratio is percentage of individuals reporting any persistent health problems for at least 3 months during theprevious 12 months. RAD is the annualized number of restricted activity days per capita, based on the reported number ofdays off work/school/housework during previous 6 months.
In most countries, including Egypt, actual ill-health is concentrated amongst the poorer groups inthe population. However, when self-reported rates of illness are examined, acute illness, chronicillness, restriction of activity and general perceptions of ill-health are all greater at higher incomelevels. This apparent contradiction parallels trends seen in most other high mortality countries,where wealthier (and healthier) individuals generally report higher levels of morbidity in surveys.The explanation lies in the fact that higher mortality in poorer countries is also related to a lowerlevel of sensitivity to illness, and willingness or ability to take action when illness is recognized.In a few poor countries, such as Sri Lanka or Jamaica, poorer people do report higher rates ofmorbidity than rich people as is also the case in developed countries. But this behavior may itselfbe associated with their better health performance (Caldwell et al., 1989).
In Egypt’s case, there is a clear gradient in sensitivity to illness, with poorer people being lesslikely to recognize illness or report being ill. That this is also directly related to actual morbidityand mortality, and is not a simple effect of income can be seen when differences in reportedillness by governorate are examined. Table 8 gives reported rates of illness, having grouped allthe governorates in the sample into three groups of seven, according to their levels of infantmortality rate in 1991. Those governorates which are known to have the worst health indicatorsalso have the lowest levels of perceived poor health status. When reported rates are examinedfor children in the lowest income quintile, there is an even more marked inverse relationshipbetween rates of reported illness and actual mortality rates. Children belonging to households in

Distribution of health care resources in Egypt: Implications for Equity 20
the poorest income quintile, and living in the seven governorates with lowest IMR, are more thanthree times as likely to be reported to be having generally poor health status as childrenbelonging to households at the same income level living in the highest mortality governorates.
Table 8: Reported ill-health by region, and for children in lowest income quintile
Children <5 years and inlowest national income quintile
Governoratemortality group
IMR(1991)
Acute illness(%)
Poor healthstatus (%)
Acute illness(%)
Poor healthstatus (%)
Highest IMR 57 35.8 5.3 29.9 3.1Intermediate IMR 39 41.0 6.3 33.7 4.3Lowest IMR 31 50.8 8.4 43.0 9.8Average 43.5 6.9 33.6 4.8Note: Acute illness ratio is the percentage of individuals reporting one or more symptoms of illness in previous two weeks.Highest IMR group consists of Menia, Assiut, Beni Suef, Qena, Sohag, Fayoum and Aswan. Intermediate IMR groups consistsof Giza, Qalyoubia, Suez, Menoufia, Sharkia, Ismailia, and Gharbia. Lowest IMR group consists of Cairo, Damietta, Beheira,Daqahlia, Alexandria, Port Said and Kafr El-Sheikh.
This lack of correlation between perceived health status and actual levels of morbidity andmortality places considerable doubt on the validity of these indicators as measures of need.Therefore, they are not used in the analysis for this purpose. Nevertheless, it illustrates oneimportant issue. Poorer people are presumably sicker in Egypt than richer people, but theirperception of ill-health is lower. This reduced sensitivity to illness may be one of the mechanismswhich ensure that poorer people in Egypt experience substantially higher rates of mortality thanthe rest of the population, despite the actual widespread nominal availability of modern medicalservices to the whole population. It also represents one area in which public intervention may beneeded to in order to reduce mortality rates, perhaps by reducing the access costs of publicservices for the poor and encouraging them to use modern services more frequently and rapidly.
Distribution of health care utilization by income level
Figures 1 to 2 give the distribution of utilization of health care services by income level,separately for outpatient and inpatient services (further details given in tables in StatisticalAnnex). As can be observed, utilization of both public and private health care services show asignificant income gradient, with richer Egyptians using higher volumes of both inpatient andoutpatient services, with the exception of MOH outpatient services which are used more bypoorer Egyptians. If it can be assumed that poorer Egyptians are sicker than richer Egyptians,and are thus in greater need of health care, then this distribution does not indicate that access tohealth care is equal for those of equal need.

Distribution of health care resources in Egypt: Implications for Equity 21
Figure 1: Outpatient visits per capita per year
0.0
0.5
1.0
1.5
2.0
2.5
3.0
3.5
4.0
4.5
Poorest 2 3 4 5 6 7 8 9 Richest
Income decile Public Private
Figure 2: Inpatient bed-days per capita per year
0.00
0.05
0.10
0.15
0.20
0.25
0.30
Poorest 2 3 4 5 6 7 8 9 Richest
Income decile
MOH HIO Other public sector Total private

Distribution of health care resources in Egypt: Implications for Equity 22
Distribution of health care expenditures by income level
Table 9 shows the distribution of public health expenditures by income quintile. Table 10compares the distribution of public and private health expenditures, and gives the distribution oftotal health expenditures. More details are given in the tables in the Annex.
The higher utilization rates of most public services by higher income groups translates into anexpenditure pattern in which public subsidies increase with income. Only MOH expenditures areequally distributed across income groups, and that is largely due the higher use of MOHoutpatient services by the poor, which compensates for the higher use of MOH inpatient servicesby richer Egyptians.
Table 9: Distribution of public health expenditures by income quintile (%)
Income quintile MOH HIO(General)
HIO(Students)
OtherMinistry
Total
Poorest 19.4 14.5 17.5 13.0 16.42nd 20.3 16.1 17.6 14.4 17.53rd 20.1 15.7 20.9 19.5 19.14th 21.9 20.5 23.9 28.2 23.5Richest 19.3 33.6 20.3 25.3 23.6
Total (%) 100.0 100.0 100.0 100.0 100.0
Average per capita LE 24.1 LE 10.4 LE 5.5 LE 15.4 LE 55.9Note: Total for public health expenditures includes an additional LE 0.63 per capita of government health spending onnational regulatory agencies, public administration, and support for charities which was allocated equally across the wholepopulation.
Table 10: Distribution of public and private health expenditures by income quintile(%)
Income quintile Public Private Total
Poorest 16.4 9.2 11.32nd 17.5 12.6 13.63rd 19.1 15.3 15.84th 23.5 20.1 20.5Richest 23.6 42.8 33.2
Total (%) 100.0 100.0 100.0
Average per capita LE 55.9 LE 71.5 LE 127.4Note: Private expenditures refer to household out-of-pocket spending mostly, plus LE 7.40 per capita, which consists ofprivate insurance, syndicate and employer spending, which was allocated equally across all groups.
Public health programs exhibit somewhat different patterns of distribution. The one which favorsthe poor the most are MOH outpatient services. These are utilized by all income groups to someextent, but the poorest quintiles receive slightly more benefits than the richer groups. However,in the case of MOH inpatient services, these are almost equally distributed across all incomegroups. This apparent equal distribution of public spending by MOH is however countered bypublic health expenditures though HIO, the university hospitals and other ministries, which allfavor the higher income groups. In the case of HIO, the richest quintile captures more than 36%

Distribution of health care resources in Egypt: Implications for Equity 23
of HIO spending, compared with 12% in the case of the poorest quintile. A similar pattern isobserved in the case of spending through other public sector facilities.
Overall, the distribution of combined health expenditures favors the higher income groups. Thisis a consequence of a distribution of private health expenditures which is skewed towards thehighest income groups, and a distribution of public health expenditures which moderately favorsthe higher income groups.
Expenditures through HIO
The bias in HIO spending towards the higher income groups is not surprising, given than HIOmembership is largely restricted to the urban formal sector workforce. The student program ofHIO (SMIP) does not display as much an unequal distribution as the main program. This isrelated to the fact that membership in SMIP isn’t restricted to formal sector employees. However,the fact that only school-going children are permitted to enroll means that the poor do not benefitas much as the richest households. In Egypt not all children attend school, and non-enrollmentis highest in poorer families. In total, the poorest quintile receives only 16% of SMIPexpenditures compared with 19% in the richest quintile, and 25% in the case of the secondrichest quintile. It should be noted that these figures do not take into account varying family sizesat different income levels. Poorer families in Egypt tend to have more children, and so a perchild distribution of SMIP spending reveals a more inequitable distribution than this per capitaanalysis. While on a per capita basis, the richest quintile of households receives only one fifthmore than households in the poorest quintile, the difference is almost two fold when comparedon a per child basis (Table 11).
Table 11: Distribution of HIO SMIP subsidies per capita compared with per child (LE)
Income quintile Per capita basis Per child basis
Poorest 4.8 13.02nd 4.8 13.93rd 5.7 17.54th 6.5 22.4Richest 5.6 23.6
Total (%) 100.0 100.0
Average per capita LE 5.5 LE 17.4Note: Private expenditures refer to household out-of-pocket spending mostly, plus LE 7.40 per capita, which consists ofprivate insurance, syndicate and employer spending, which was allocated equally across all groups.
Other ministries and University and teaching hospitals
University hospitals on the other hand are available to all Egyptians, but in practice their urbanlocation and their practice of charging modest user fees would discourage or prevent mostpoorer people and rural residents from benefiting from their services. Since HIO, SMIP,university and other ministry spending accounts for more than half of all GOE health spending,the net impact of government health expenditures favors the richest groups most. Table 9combines expenditures through university and teaching hospitals with those through facilities runby other ministries, including Defense. As data for accurate distribution of these expenditureswere limited, the figures given actually underestimate any bias in spending in favor of higherincome groups. Overall, the richest quintile receives 25% of these government health subsidiesprovided through these non-MOH facilities compared with only 13% received by the poorestquintile.

Distribution of health care resources in Egypt: Implications for Equity 24
Private Expenditures
When private spending and overall utilization rates are taken into consideration, it is apparentthat the equal distribution of MOH spending is due to self-selection by higher income groups ofprivate provision. Higher income groups use all health services in greater quantities, but higherincome is associated with greater utilization of private providers and greater out-of-pocketspending on health. As richer households switch to private services, it allows a greater share ofMOH spending to be captured by the poorer households. The availability of private services,particularly in the ambulatory sector, therefore contributes to a more equitable distribution ofgovernment health subsidies.
Comparison with other countries
Data for the distribution of public health expenditures by income group are limited for mostdeveloping countries. Table 12 compares the distribution of public health subsidies as found inEgypt with data for some other developing countries.
Egypt’s performance is comparable with many developing countries. Although equity is a statedconcern of policy makers in most developing countries, when providing government healthservices, most developing countries display considerable inequity in their public funding of healthcare services. This is in contrast with developed countries, including the USA, where utilizationof health care services tends to be more equitably distributed across all income groups, andpublic spending better targeted on poorer households.
Although Egypt’s performance cannot be characterized as exceptionally poor in comparison withother developing countries, there is considerable room for improvement. Countries such asMalaysia and Sri Lanka show that it is possible to target health care subsidies effectively to thepoor, without extensive means testing or explicit targeting. The pattern of spending in Egyptconfirms what is evident from studies in OECD, and other developing countries. Public fundingfor health care services through free publicly provided health care services tends to be moreequitable than through social insurance funding. Private spending, particularly out-of-pocketspending, tends to be related to income, and wealthier households are able to spend more inabsolute terms than poorer households, although as a proportion of household income, richerhouseholds may spend less than poorer ones.
In fact, the performance of Egypt’s MOH services in equity terms is better than for most publicsystems, although still far short of the superior performers. The major reason for the pro-richdistribution of government health care subsidies is their distribution through university hospitalsand HIO services, rather than poor targeting of MOH services. If the distribution of public healthcare subsidies in Egypt more closely resembled that of MOH services, then Egypt would beperforming better than most developing countries, although failing far short of countries such asMalaysia, Sri Lanka and Jamaica, which manage to ensure the poor use MOH servicesconsiderably more than wealthier households.

Distribution of health care resources in Egypt: Implications for Equity 25
Table 12: The incidence of public health spending in selected countries
Share of subsidy (%)Poorest quintile Richest quintile
Sri Lanka 1979 30 9Jamaica 1989 30 9Malaysia 1989 29 11Brazil 1985 17 42Tanzania 1992/93 17 29Egypt 1995 16 24South Africa 1994 16 17Kenya 1993 14 24Vietnam 1992 12 29Indonesia 1989 12 29Ghana 1992 11 34Source: Authors estimates based on Alailima and Mohideen, 1983, Demery et al 1995, Grosh 1994, Castro-Leal et al., 1999,and authors’ estimates.
Distribution of utilization and expenditures by governorate
The pro-rich distribution of government health expenditures is paralleled by the distribution ofgovernment health expenditures across districts. Figures 3 and 4 show the distribution of healthexpenditures across governorates, arranged first according to income and then according to theinfant mortality rate (Statistical Annex gives more details).

Distribution of health care resources in Egypt: Implications for Equity 26
MOH allocations to governorates do not appear to be related in any apparent way to overall
Figure 3: Per capita health expenditures by governorate, ranked from poorest to richest, Egypt 1994/95
0
50
100
150
200
250
Ass
iut
Men
ya
Kal
yubi
a
Beh
era
Fay
oum
Ben
i Sue
f
Men
oufia
Asw
an
Soh
ag
Qen
a
Sha
rkia
Giz
a
Gha
rbia
Sue
z
Ale
xand
ria
Ism
ailia
Kaf
r E
l-She
ikh
Cai
ro
Dam
ietta
Dak
ahlia
Por
t Sai
d
Exp
end
itu
res
per
cap
ita
-
500
1,000
1,500
2,000
2,500
3,000
3,500
4,000
MOH HIO (General) HIO (SMIP) Other public Private GDP per capita
Figure 4: Per capita health expenditures by governorate, ranked according to infant mortality rate, Egypt 1994/95
0
50
100
150
200
250
Men
ya
Ass
iut
Ben
i Sue
f
Qen
a
Soh
ag
Fay
oum
Asw
an
Giz
a
Kal
yubi
a
Sue
z
Men
oufia
Sha
rkia
Ism
ailia
Gha
rbia
Cai
ro
Dam
ietta
Beh
era
Dak
ahlia
Ale
xand
ria
Por
t Sai
d
Kaf
r E
l-She
ikh
Exp
endi
ture
s pe
r ca
pita
0
10
20
30
40
50
60
70
80
IMR
(19
91)
MOH HIO (General) HIO (SMIP)Other public Private IMR (1991)

Distribution of health care resources in Egypt: Implications for Equity 27
levels of health status or income. Most of the poorest governorates with the greatest healthproblems in fact receive below-average levels of MOH spending, e.g., Menia, Fayoum, Sohagand Qena. The governorates which receive less MOH spending also tend to be the ones whichbenefit least from government health spending through other programs or ministries. If MOHspending is a government intervention designed to promote health in those areas, where othergovernment services are least active and where the need is greatest, there is no evidence thatMOH spending is currently allocated to achieving this. For example, per capita MOH spending intwo of the poorest governorates with the worst health indicators, Sohag and Menia, averagesless than LE 21 per capita, while MOH spending in Port Said averages almost LE 55 per capita.This pattern of geographical spending contributes to the poor targeting of MOH health caresubsidies to the poor.
As is the case with spending across income groups, HIO and university hospital spending ismostly concentrated in the better-off governorates, particularly the urbanized governorates, andin Lower Egypt more than Upper Egypt. Again the distribution is much more skewed than MOHspending, with levels of spending varying more than seven fold between governorates.
Distribution of utilization and expenditures by age-group and gender
The methodology used permits an assessment of the distribution of health expenditures by agegroups and gender. Tables 13 and 14 show the distribution of outpatient health care utilizationby demographic groups. Figures 5 and 6 give the estimated distributions for health carespending.
Table 13: Use of public outpatient health services by gender and age group(annual visits per capita)
Demographicgroup
MOH HIO(General)
HIO(Students)
UniversityHospitals
OtherMinistries
Total
Female 0.77 0.16 0.19 0.12 0.17 1.23Male 0.62 0.36 0.26 0.08 0.27 1.30
0-4 1.08 0.00 .. 0.09 0.04 1.215-15 0.55 .. 0.23 0.03 0.39 1.2016-29 0.58 0.12 .. 0.12 0.11 0.9330-39 0.83 0.39 .. 0.14 0.17 1.5440-49 0.85 0.66 .. 0.12 0.25 1.8850-59 0.70 0.43 .. 0.19 0.28 1.6060-69 0.63 0.28 .. 0.25 0.10 1.2770-98 0.60 0.32 .. 0.28 0.09 1.29
Average percapita
0.70 0.26 0.23 0.10 0.22 1.27

Distribution of health care resources in Egypt: Implications for Equity 28
Table 14: Use of all outpatient services by gender and age group(annual visits per capita)
Demographic group Public Private Total
Female 1.21 2.36 3.58Male 1.28 1.82 3.13
0-4 1.21 3.08 4.295-15 1.20 1.12 2.2916-29 0.93 1.81 2.7030-39 1.54 2.57 4.1340-49 1.88 2.67 4.5350-59 1.60 3.12 4.6860-69 1.27 3.45 4.8170-98 1.29 3.03 4.30
Average per capita 1.27 2.09 3.34
Figure 5: Health expenditures by gender
0
20
40
60
80
100
120
Male Female
Gender
LE
per
cap
ita
MOH Subsidy per capita Non-MOH Subsidy per capita HIO Expenditure per capita HH Spending per capital
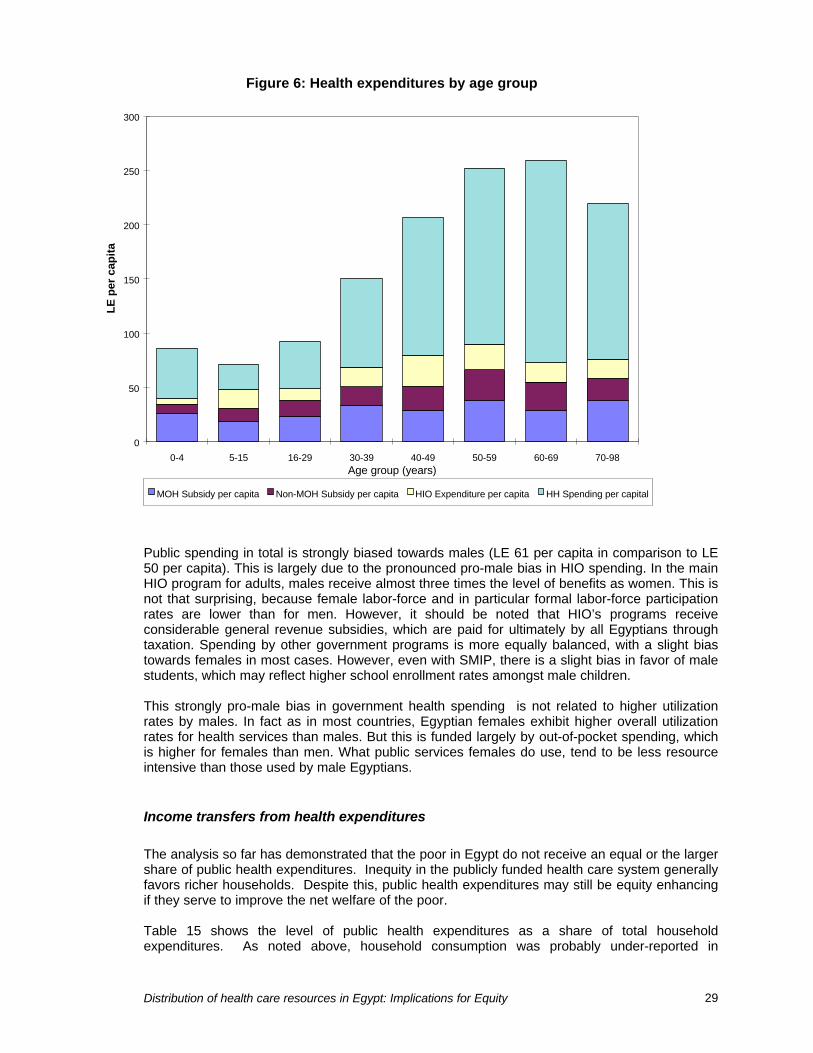
Distribution of health care resources in Egypt: Implications for Equity 29
Public spending in total is strongly biased towards males (LE 61 per capita in comparison to LE50 per capita). This is largely due to the pronounced pro-male bias in HIO spending. In the mainHIO program for adults, males receive almost three times the level of benefits as women. This isnot that surprising, because female labor-force and in particular formal labor-force participationrates are lower than for men. However, it should be noted that HIO’s programs receiveconsiderable general revenue subsidies, which are paid for ultimately by all Egyptians throughtaxation. Spending by other government programs is more equally balanced, with a slight biastowards females in most cases. However, even with SMIP, there is a slight bias in favor of malestudents, which may reflect higher school enrollment rates amongst male children.
This strongly pro-male bias in government health spending is not related to higher utilizationrates by males. In fact as in most countries, Egyptian females exhibit higher overall utilizationrates for health services than males. But this is funded largely by out-of-pocket spending, whichis higher for females than men. What public services females do use, tend to be less resourceintensive than those used by male Egyptians.
Income transfers from health expenditures
The analysis so far has demonstrated that the poor in Egypt do not receive an equal or the largershare of public health expenditures. Inequity in the publicly funded health care system generallyfavors richer households. Despite this, public health expenditures may still be equity enhancingif they serve to improve the net welfare of the poor.
Table 15 shows the level of public health expenditures as a share of total householdexpenditures. As noted above, household consumption was probably under-reported in
Figure 6: Health expenditures by age group
0
50
100
150
200
250
300
0-4 5-15 16-29 30-39 40-49 50-59 60-69 70-98Age group (years)
LE
per
cap
ita
MOH Subsidy per capita Non-MOH Subsidy per capita HIO Expenditure per capita HH Spending per capital

Distribution of health care resources in Egypt: Implications for Equity 30
NHHEUS, so these figures exaggerate the importance of health subsidies. Nevertheless, publichealth expenditures,despite their pro-rich distribution, do amount to a significant source of consumption for poorerhouseholds. It would be wrong to conclude that simply because government health programs donot target the poor effectively that they are of no value to the poor. Government healthsubsidies, particularly through MOH, account for a substantial proportion of total householdconsumption, and presumably contribute to a substantial increase in overall welfare.
Table 15: Public health expenditures as a share of household consumption
Income quintile Mean household income percapita (LE)
Public health expendituresas a share of household
spending
Poorest 428 10.8%2nd 680 7.2%3rd 947 5.6%4th 1,370 4.8%Richest 3,356 2.0%
Total 1,356 100 %
Note: Public expenditures are the sum of expenditures through MOH, HIO, university hospitals and other public sectoragencies and facilities.
Figure 7: Public health expenditures as a share of gross household consumption
0%
2%
4%
6%
8%
10%
12%
14%
Poorest 2 3 4 5 6 7 8 9 Richest
Expenditure decile
Rat
io to
gro
ss h
ouse
hold
exp
endi
ture

Distribution of health care resources in Egypt: Implications for Equity 31
Implications
It is not possible to obtain health status indicators for different income levels, but it would bereasonable to assume that overall health status is worse at lower income levels. If need isdefined in terms of the burden of morbidity and mortality, then the lower income groups wouldhave greater need for health services. Yet the distribution of overall health expenditures in Egyptevidently favors the wealthier sections of the population. This is the consequence of both themanner in which health care in Egypt is financed and differences in health behavior. On theexpenditure side there is a pattern in private spending which is regressive, and which favorshigher income groups, and a public spending profile which does little to compensate for this. Onthe behavior side, there is some evidence in this study, that the poor, who are presumably sickerand in greatest need, also have a lower level of sensitivity to sickness, and therefore make lessuse of available health services.
The bias in public spending towards higher income groups occurs for several reasons. The mostimportant ones are:
(i) A substantial proportion of government health spending through several large programsother than MOH, which receive substantial government subsidies, but which by their verynature tend to benefit only the urban and formal sector populations.
(ii) Lack of any apparent mechanism to use MOH geographical allocations as a method ofcounteracting the geographical imbalance in health care resources due to private spendingand other government programs.
(iii) Public spending on health through social insurance programs is in practice a regressivemechanism of funding health services, as observed in other countries with large ruralpopulations and informal sectors.
(iv) Lower utilization rates of all health services by lower income groups, which ensures that theyutilize fewer resources than might be expected from government health programs.
(v) Lack of significant concern with equity as a major policy goal in the health sector, whichmanifests itself in little discussion of distributional issues, or with high priority being attachedto the distributional consequences of government health policies.
In the short run, there is little that GOE could do to alter the distributional impact of governmenthealth spending, if it wanted to. MOH budgets at the governorate level are largely dictated byexisting staffing levels, and reallocations would be difficult to achieve. Nevertheless, MOHservices are the major source of health care services for the poor, and for most rural Egyptiansmay be the only source of publicly-funded health care readily available. They are also a majorsource of household consumption, and act to improve overall living standards of the verypoorest. Given that the Egyptian economy is now experiencing modest economic growth andgovernment tax revenues are increasing each year, there is a strong case to use additionalgovernment resources that become available to expanding or improving MOH services. If anysuch increase in resources can be made selectively available to the poorer and least healthygovernorates, this might be expected to have a greater impact on the poor.
Non-MOH health expenditures may be difficult to address directly as they are used to fund healthservices for the more politically vocal sections of society. However, at the very least GOE mightseriously reconsider any steps to expand non-MOH health programs to first take into accountequity implications. Although there are problems in the distribution of MOH spending, it is theleast regressive of the major government health programs. Social insurance, including the SMIP,
Distribution of health care resources in Egypt: Implications for Equity 32
does not contribute to a more progressive distribution of health care resources. This reflects thefact that it is a contributory scheme, with eligibility based on contributions from the wages ofthose in formal sector employment. Social insurance expenditures in Egypt, as elsewhere,benefit primarily richer households, but also favor men instead of women, and urban areasinstead of rural areas. It could be argued that the distribution of HIO expenditures should not beof particular concern, as it involves an insurance mechanism where the recipients pay premiums.However, there is evidence of a significant cross-subsidy from general revenue and this subsidyis not being used in a progressive way, but is benefiting a more advantaged population, when itmay be more needed by the poor. To this extent the regular and ad-hoc general revenuesubsidies extended to HIO constitute a regressive method of financing.
The most recent GOE reform in the health sector was to establish an insurance program forchildren to deal with what was considered a major gap in provision. However, as shown even thisprogram largely fails to provide substantial benefits to the poorest and most vulnerable childrenwho are most in need of such additional service provision. This particular program should be ofconcern, as the results given here suggest that SMIP as a program fails to make a significantimpact on the utilization of health services in the child age-groups; only 0.23 visits per capitawere reported to be at HIO/SMIP providers, compared with an overall utilization of 1.20outpatient visits per capita at all providers for the 5-15 year age group. It also benefits thepoorest children significantly less than the richer children, since most poor children do not attendschool. The average child in the poorest quintile receives only half the subsidy expenditurethrough SMIP that the average child in the richest quintile receives. If the objective of SMIP is toreduce disparities in access to health care resources between children in poor and richhouseholds, then this is not currently being met by SMIP.
More importantly, expansion of non-MOH programs might be additionally detrimental for otherreasons to the interests of the poor. NHA data for Egypt show that the share of governmenthealth spending accounted for by MOH declined from the 1970s to 1990, and then again from1990 to 1995. As the utilization data indicate, MOH is largely utilized by the poor, and non-MOHservices account for the bulk of health service provision for upper income and urban groups.Given this pattern, it is likely that political support for MOH services is less than for other non-MOH public health services, and this may be part of the reason for the relative decline in MOHspending. There is considerable evidence from Latin America, where social insurance programssuch as in Egypt are common-place, that these programs have reduced political support forthose government programs which assist the very poorest, who are not in formal employment.
In the longer run, GOE should give serious consideration to allocating any new increments ingovernment health care spending to the MOH budget and not to further expansion of universityand teaching hospitals and the various social insurance programs. Although this is likely to leadto little initial change, it may be more feasible political than the alternative of radical reallocation.
Distribution of health care resources in Egypt: Implications for Equity 33
Bibliography
Alailima, Patricia J. and Faiz Mohideen. 1983. Health Sector Commodity Requirements andExpenditure Flows. Unpublished report. Colombo: National Planning Department.
Baker, Judy L. And Jacques van der Gaag. 1993. Equity in health care and health care financing:evidence from five developing countries. In van Doorslaer, Eddy, Adam Wagstaff, and FransRutten (Eds.) 1993.
Caldwell, John, Indra Gajayanayake, Pat Caldwell, and Indrani Peiris. 1989. "Sensitization toIllness and the Risk of Death: An Explanation for Sri Lanka's Approach to Good Health for All."Social Science and Medicine 28(4):365-79.
Castro-Leal, Florencia, Julia Dayton, Lionel Demery and Kalpana Mehra. 1999. “Public SocialSpending in Africa: Do the Poor Benefit?” The World Bank Research Observer 14(1): 49-72.
Demery, Lionel, Shiyan Chao, Rene Bernier, and Kalpanna Mehra. 1995. The Incidence of SocialSpending in Ghana, 1989-92. Draft unpublished report. Ghana Extended Poverty Study.Washington, DC: World Bank.
Foxley, Alejandro. 1979. Redistributive effects of government programs. Oxford: PergamonPress.Institute of National Planning. 1995. Egypt Human Development Report 1995. Cairo: Institute ofNational Planning.
Meerman, Jacob. 1979. Public Expenditure in Malaysia: Who Benefits and Why. New York:Oxford University Press.
Rannan-Eliya, Ravindra and Peter Berman. 1993. National Health Accounts in DevelopingCountries: Improving the Foundation. Data for Decision Making Publication. No. 2. Boston, MA:Harvard School of Public Health.
Rannan-Eliya, Ravindra P., Khaled H. Nada, Abeer M. Kamal and Ahmed Ibrahim Ali. 1998.Egypt National Health Accounts 1994-1995. Special Initiatives Report No. 3. Bethesda, MD:Partnerships for Health Reform Project, Abt Associates, Inc.
Ravallion, Martin, Dominique van de Walle, and Madhur Gautam. 1995. "Testing a Social SafetyNet." Journal of Public Economics 57:175-99.
Salah, Hassan, Julia Walsh and AK Nandakumar. 1997a. Cost Analysis and Efficiency Indicatorsfor Health Care. Report No. 1: Bani Suef General Hospital Summary Output for1993-94. Cairo:Data for Decision Making Project.
Salah, Hassan, Julia Walsh and AK Nandakumar. 1997b. Cost Analysis and Efficiency Indicatorsfor Health Care. Report No. 2: Suez General Hospital Summary Output for1993-94. Cairo: Datafor Decision Making Project.
Salah, Hassan, Julia Walsh and AK Nandakumar. 1997c. Cost Analysis and Efficiency Indicatorsfor Health Care. Report No. 3: El Gamhuria General Hospital Summary Output for1993-94. Cairo:Data for Decision Making Project.
Distribution of health care resources in Egypt: Implications for Equity 34
Selkowsky, Marcelo. 1979. Who Benefits From Government Expenditure? A Case Study ofColombia. New York: Oxford University Press.
van de Walle, Dominique. 1996. Assessing the Welfare Impacts of Public Spending. PolicyResearch Working Paper, No. 1670 ed. Washington, DC: World Bank.
van Doorslaer, Eddy, Adam Wagstaff, and Frans Rutten, Editors. 1993. Equity in the Financeand Delivery of Health Care: An International Perspective. Oxford: Oxford University Press.
Wabha, Saneya. 1992. An Ethnographic Study of Acute Respiratory Infection in Young Childrenof Upper Egypt: Sohag Governorate 1991. Cairo: United Nations Children’s Fund.
Whitehead, Margaret. 1990. The concepts and principles of equity and health. WHO DiscussionPaper, EUR/ICP/RPD 414. Copenhagen: WHO Regional Office for Europe.
World Bank. 1999. World Development Report 1998/99: Knowledge for Development. Oxford:Oxford University Press.
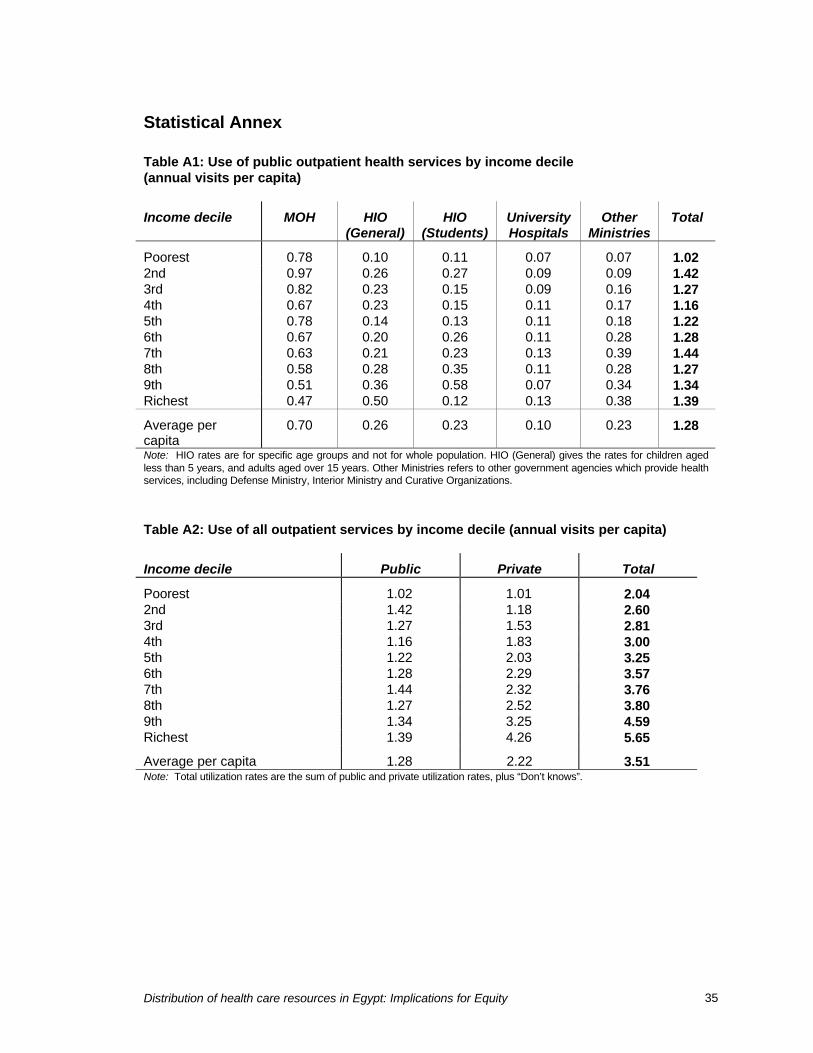
Distribution of health care resources in Egypt: Implications for Equity 35
Statistical Annex
Table A1: Use of public outpatient health services by income decile(annual visits per capita)
Income decile MOH HIO(General)
HIO(Students)
UniversityHospitals
OtherMinistries
Total
Poorest 0.78 0.10 0.11 0.07 0.07 1.022nd 0.97 0.26 0.27 0.09 0.09 1.423rd 0.82 0.23 0.15 0.09 0.16 1.274th 0.67 0.23 0.15 0.11 0.17 1.165th 0.78 0.14 0.13 0.11 0.18 1.226th 0.67 0.20 0.26 0.11 0.28 1.287th 0.63 0.21 0.23 0.13 0.39 1.448th 0.58 0.28 0.35 0.11 0.28 1.279th 0.51 0.36 0.58 0.07 0.34 1.34Richest 0.47 0.50 0.12 0.13 0.38 1.39
Average percapita
0.70 0.26 0.23 0.10 0.23 1.28
Note: HIO rates are for specific age groups and not for whole population. HIO (General) gives the rates for children agedless than 5 years, and adults aged over 15 years. Other Ministries refers to other government agencies which provide healthservices, including Defense Ministry, Interior Ministry and Curative Organizations.
Table A2: Use of all outpatient services by income decile (annual visits per capita)
Income decile Public Private Total
Poorest 1.02 1.01 2.042nd 1.42 1.18 2.603rd 1.27 1.53 2.814th 1.16 1.83 3.005th 1.22 2.03 3.256th 1.28 2.29 3.577th 1.44 2.32 3.768th 1.27 2.52 3.809th 1.34 3.25 4.59Richest 1.39 4.26 5.65
Average per capita 1.28 2.22 3.51Note: Total utilization rates are the sum of public and private utilization rates, plus “Don’t knows”.

Distribution of health care resources in Egypt: Implications for Equity 36
Table A3: Use of public inpatient health services by income decile(bed-days per capita per year)
Income decile MOH HIO(General)
HIO(Students)
Other publicsector
Total
Poorest 0.12 0.01 0.00 0.07 0.192nd 0.08 0.01 0.01 0.03 0.123rd 0.10 0.04 0.05 0.03 0.174th 0.13 0.00 0.01 0.05 0.185th 0.16 0.02 0.02 0.08 0.266th 0.17 0.06 0.00 0.06 0.277th 0.26 0.08 0.04 0.18 0.508th 0.16 0.04 0.00 0.06 0.249th 0.19 0.10 0.03 0.10 0.37Richest 0.15 0.04 0.01 0.10 0.28
Average per capita 0.15 0.04 0.02 0.07 0.26
Table A4: Use of all inpatient services by income decile (bed-days per capita per year)
Income decile Public Private Total
Poorest 0.19 0.02 0.222nd 0.12 0.01 0.133rd 0.17 0.00 0.184th 0.18 0.01 0.195th 0.26 0.03 0.296th 0.27 0.01 0.287th 0.50 0.02 0.528th 0.24 0.03 0.279th 0.37 0.04 0.41Richest 0.28 0.06 0.34
Average per capita 0.26 0.02 0.28
Table A5: Distribution of public health expenditures by income decile (%)
Income decile MOH HIO(General)
HIO(Students)
OtherMinistry
Total
Poorest 10.7 5.8 6.7 7.5 8.42nd 8.7 8.7 10.9 5.2 7.83rd 9.6 8.0 7.9 6.3 8.14th 10.7 8.1 9.7 7.9 9.25th 10.6 6.6 8.1 10.1 9.46th 9.6 9.0 12.7 9.3 9.67th 12.7 9.7 7.8 19.2 13.48th 9.3 10.7 16.1 9.6 10.19th 9.6 13.9 14.3 11.0 11.1Richest 9.6 19.7 5.9 14.0 12.2
Total (%) 100.0 100.0 100.0 100.0 100.0
Average per capita LE 24.07 LE 10.4 LE 5.5 LE 15.4 LE 55.9Note: Total for public health expenditures includes and additional LE 0.63 per capita of government health spending onnational regulatory agencies, public administration, support for charities which was allocated equally across the wholepopulation.
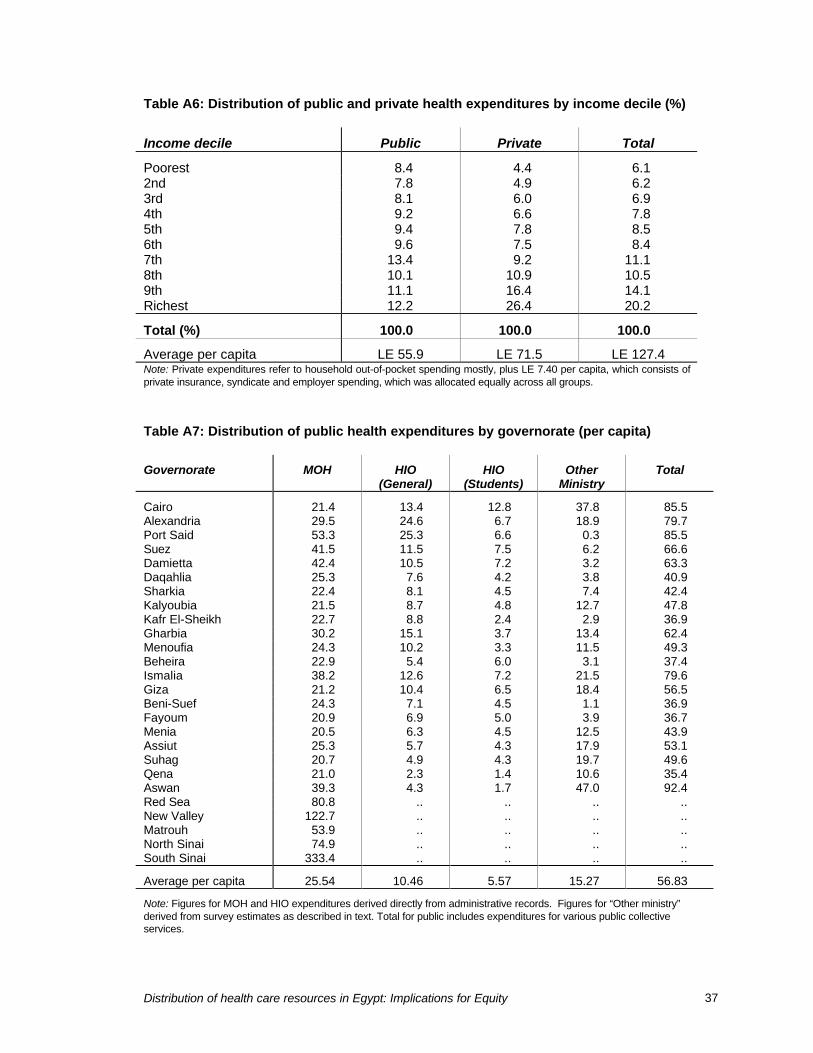
Distribution of health care resources in Egypt: Implications for Equity 37
Table A6: Distribution of public and private health expenditures by income decile (%)
Income decile Public Private Total
Poorest 8.4 4.4 6.12nd 7.8 4.9 6.23rd 8.1 6.0 6.94th 9.2 6.6 7.85th 9.4 7.8 8.56th 9.6 7.5 8.47th 13.4 9.2 11.18th 10.1 10.9 10.59th 11.1 16.4 14.1Richest 12.2 26.4 20.2
Total (%) 100.0 100.0 100.0
Average per capita LE 55.9 LE 71.5 LE 127.4Note: Private expenditures refer to household out-of-pocket spending mostly, plus LE 7.40 per capita, which consists ofprivate insurance, syndicate and employer spending, which was allocated equally across all groups.
Table A7: Distribution of public health expenditures by governorate (per capita)
Governorate MOH HIO(General)
HIO(Students)
OtherMinistry
Total
Cairo 21.4 13.4 12.8 37.8 85.5Alexandria 29.5 24.6 6.7 18.9 79.7Port Said 53.3 25.3 6.6 0.3 85.5Suez 41.5 11.5 7.5 6.2 66.6Damietta 42.4 10.5 7.2 3.2 63.3Daqahlia 25.3 7.6 4.2 3.8 40.9Sharkia 22.4 8.1 4.5 7.4 42.4Kalyoubia 21.5 8.7 4.8 12.7 47.8Kafr El-Sheikh 22.7 8.8 2.4 2.9 36.9Gharbia 30.2 15.1 3.7 13.4 62.4Menoufia 24.3 10.2 3.3 11.5 49.3Beheira 22.9 5.4 6.0 3.1 37.4Ismalia 38.2 12.6 7.2 21.5 79.6Giza 21.2 10.4 6.5 18.4 56.5Beni-Suef 24.3 7.1 4.5 1.1 36.9Fayoum 20.9 6.9 5.0 3.9 36.7Menia 20.5 6.3 4.5 12.5 43.9Assiut 25.3 5.7 4.3 17.9 53.1Suhag 20.7 4.9 4.3 19.7 49.6Qena 21.0 2.3 1.4 10.6 35.4Aswan 39.3 4.3 1.7 47.0 92.4Red Sea 80.8 .. .. .. ..New Valley 122.7 .. .. .. ..Matrouh 53.9 .. .. .. ..North Sinai 74.9 .. .. .. ..South Sinai 333.4 .. .. .. ..
Average per capita 25.54 10.46 5.57 15.27 56.83
Note: Figures for MOH and HIO expenditures derived directly from administrative records. Figures for “Other ministry”derived from survey estimates as described in text. Total for public includes expenditures for various public collectiveservices.

Distribution of health care resources in Egypt: Implications for Equity 38
Table A8: Income, health status, and distribution of total health expenditures by governorate(1994/95 in LE)
Governorate GDP percapita1992
IMR(adjusted)
1991
Publicexpenditures per capita
Privateexpenditures per capita
Totalexpenditures
per capita
Cairo 2,782 35.1 86 107 193Alexandria 2,310 25.9 80 100 180Port Said 3,715 25.7 85 112 197Suez 2,170 39.7 67 134 201Damietta 3,201 32.5 63 125 188Daqahlia 3,489 30.1 41 85 125Sharkia 2,050 37.5 42 70 113Kalyoubia 1,554 40.6 48 66 113Kafr El-Sheikh 2,612 23.6 37 80 117Gharbia 2,133 35.4 62 63 125Menoufia 1,666 38.0 49 56 106Beheira 1,566 31.6 37 74 111Ismalia 2,345 35.8 80 51 131Giza 2,123 41.0 57 73 129Beni-Suef 1,663 64.7 37 43 79Fayoum 1,581 47.6 37 40 77Menia 1,554 67.0 44 43 87Assiut 1,519 64.9 53 37 91Suhag 1,729 50.8 50 44 94Qena 1,768 53.6 35 42 78Aswan 1,680 46.6 92 93 185Red Sea .. 51.9 .. .. ..New Valley .. 41.4 .. .. ..Matrouh .. 40.2 .. .. ..North Sinai .. 64.8 .. .. ..South Sinai .. 119.7 .. .. ..
Egypt 2,176 42.5 LE 56.8 LE 55.6 LE 112.4
Source: GDP per capita and IMR from National Institute of Planning (1995).
Table A9: Distribution of public health expenditures by gender and age group(LE per capita)
Demographic group MOH HIO(General)
HIO(Students)
OtherMinistry
Total
Female 25.1 7.9 5.0 12.5 50.4Male 23.5 12.8 6.0 18.4 60.80-4 25.7 5.1 .. 9.0 39.95-15 18.8 .. 17.4 12.0 48.316-29 23.6 10.7 .. 14.6 48.930-39 33.7 18.4 .. 16.7 68.840-49 29.0 28.5 .. 22.2 79.650-59 37.7 23.7 .. 28.3 89.860-69 28.6 17.9 .. 26.5 72.970-98 37.6 17.8 .. 20.7 76.1
Average per capita 24.1 10.3 5.5 15.4 55.9Table A10: Distribution of public and private health expenditures by gender and age-

Distribution of health care resources in Egypt: Implications for Equity 39
group (LE per capita)
Demographic group Public Private Total
Female 50.4 76.5 126.9Male 60.8 66.4 127.20-4 39.9 53.2 93.05-15 48.3 30.2 78.516-29 48.9 50.6 99.530-39 68.8 88.5 157.340-49 79.6 133.8 213.450-59 89.8 169.7 259.560-69 72.9 193.5 266.470-98 76.1 150.2 226.4
Average per capita LE 55.9 LE 71.5 LE 127.4