Embed Size (px)
Citation preview
TH
E D
ISTR
IBU
TIO
N O
F SEA
BIR
DS A
ND
MA
RIN
E M
AM
MA
LS
IN T
HE
AT
LA
NT
IC FR
ON
TIE
R, N
OR
TH
AN
D W
EST
OF SC
OT
LA
ND
THE DISTRIBUTION OF SEABIRDSAND MARINE MAMMALS
IN THE ATLANTIC FRONTIER, NORTH AND WEST OF SCOTLAND
The Joint Nature Conservation Committee is the forum through which the three country nature conservation agencies – the Countryside Council for Wales (CCW), English Nature (EN), and Scottish Natural Heritage (SNH) – deliver their statutory responsibilities for Great Britain as a whole and internationally. Theseresponsibilities, known as the special functions, contribute to sustaining and enriching biological diversity, enhancing geological features and sustaining natural systems. The special functions are principally;
n to advise ministers on the development of policies for, or affecting nature conservation in Great Britain and internationally;
n to provide advice and knowledge to anyone on nature conservation issues affecting Great Britainand internationally;
n to establish common standards throughout Great Britain for the monitoring of nature conservation and for research into nature conservation and the analysis of the results;
n to commission or support research which the Committee deems relevant to the special functions.
Joint Nature Conservation Committee, Dunnet House, 7 Thistle Place, Aberdeen AB10 1UZTel: 01224 655704 Fax: 01224 621488
Joint Nature Conservation Committee, Monkstone House, City Road, Peterborough PE1 1JYTel: 01733 562 626 Fax: 01733 555 948 Website: http://www.jncc.gov.uk©JNCC 1999 ISBN 1 86107 5057
COVER PHOTOGRAPHSLong-finned pilot whale Globicephala melaena, Peter Hope Jones/JNCCGannet Morus bassanus, Andy Webb/JNCC
Designed by H. Scott (Pica Design, Aberdeen)
The distribution of seabirds and marine mammals in the Atlantic Frontier, north and west of Scotland
The distribution ofseabirds and marine mammals
in the Atlantic Frontier,north and west of Scotland.
Claire M. Pollock, Roderick Mavor,Caroline R. Weir, Ailsa Reid,
Richard W. White, Mark L. Tasker,Andy Webb, & James B. Reid
Seabirds & CetaceansJoint Nature Conservation Committee
Dunnet House, 7 Thistle PlaceAberdeen AB10 1UZ
Scotland
ISBN 1 86107 5057
© JNCC 2000

The distribution of seabirds and marine mammals in the Atlantic Frontier, north and west of Scotland
3
The distribution of seabirds and marine mammals in the Atlantic Frontier, north and west of Scotland
ContentsSummary . . . . . . . . . . . . . . . . . . . . . . . . . . . . . . . . . . . . . . . . . . . . . . . . . 5
1. Introduction . . . . . . . . . . . . . . . . . . . . . . . . . . . . . . . . . . . . . . . . . . . . . 71.1 Background . . . . . . . . . . . . . . . . . . . . . . . . . . . . . . . . . . . . . . . . . . . 71.2 Objectives . . . . . . . . . . . . . . . . . . . . . . . . . . . . . . . . . . . . . . . . . . . . 71.3 Previous work . . . . . . . . . . . . . . . . . . . . . . . . . . . . . . . . . . . . . . . . . . 7
1.3.1 Seabirds . . . . . . . . . . . . . . . . . . . . . . . . . . . . . . . . . . . . . . . . . 71.3.2 Cetaceans . . . . . . . . . . . . . . . . . . . . . . . . . . . . . . . . . . . . . . . . 81.3.3 Seals . . . . . . . . . . . . . . . . . . . . . . . . . . . . . . . . . . . . . . . . . . 8
2. The marine environment . . . . . . . . . . . . . . . . . . . . . . . . . . . . . . . . . . . . . . . 112.1 Physical environment and oceanographic features . . . . . . . . . . . . . . . . . . . . . . . . . . 11
2.1.1 Bathymetry . . . . . . . . . . . . . . . . . . . . . . . . . . . . . . . . . . . . . . . 112.1.2 Currents and water properties . . . . . . . . . . . . . . . . . . . . . . . . . . . . . . . 11
2.2 Seabird and marine mammal prey . . . . . . . . . . . . . . . . . . . . . . . . . . . . . . . . . 122.3 Fisheries north and west of Scotland . . . . . . . . . . . . . . . . . . . . . . . . . . . . . . . . 13
2.3.1 Fisheries and seabirds . . . . . . . . . . . . . . . . . . . . . . . . . . . . . . . . . . 13
3. Breeding populations of seabirds . . . . . . . . . . . . . . . . . . . . . . . . . . . . . . . . . . 15
4. Methods . . . . . . . . . . . . . . . . . . . . . . . . . . . . . . . . . . . . . . . . . . . . . . . 194.1 Study area . . . . . . . . . . . . . . . . . . . . . . . . . . . . . . . . . . . . . . . . . . . . 194.2 Seabird and marine mammal survey methods . . . . . . . . . . . . . . . . . . . . . . . . . . . . 20
4.2.1 Ship-based surveys . . . . . . . . . . . . . . . . . . . . . . . . . . . . . . . . . . . . 204.2.2 Aircraft surveys . . . . . . . . . . . . . . . . . . . . . . . . . . . . . . . . . . . . . 20
4.3 Data Analysis . . . . . . . . . . . . . . . . . . . . . . . . . . . . . . . . . . . . . . . . . . 204.3.1 Ship-based surveys . . . . . . . . . . . . . . . . . . . . . . . . . . . . . . . . . . . . 204.3.2 Aircraft surveys . . . . . . . . . . . . . . . . . . . . . . . . . . . . . . . . . . . . . 204.3.3 Correction factors . . . . . . . . . . . . . . . . . . . . . . . . . . . . . . . . . . . . 204.3.4 Data presentation . . . . . . . . . . . . . . . . . . . . . . . . . . . . . . . . . . . . . 214.3.5 Variation within and limitations of survey data . . . . . . . . . . . . . . . . . . . . . . . 21
4.4 Survey Coverage . . . . . . . . . . . . . . . . . . . . . . . . . . . . . . . . . . . . . . . . . 22
5. Seabird distribution at sea . . . . . . . . . . . . . . . . . . . . . . . . . . . . . . . . . . . . . . 315.1 Red-throated diver . . . . . . . . . . . . . . . . . . . . . . . . . . . . . . . . . . . . . . . . 335.2 Great northern diver . . . . . . . . . . . . . . . . . . . . . . . . . . . . . . . . . . . . . . . 345.3 Fulmar . . . . . . . . . . . . . . . . . . . . . . . . . . . . . . . . . . . . . . . . . . . . . 345.4 Great shearwater . . . . . . . . . . . . . . . . . . . . . . . . . . . . . . . . . . . . . . . . . 365.5 Sooty shearwater . . . . . . . . . . . . . . . . . . . . . . . . . . . . . . . . . . . . . . . . . 365.6 Manx shearwater . . . . . . . . . . . . . . . . . . . . . . . . . . . . . . . . . . . . . . . . . 365.7 European storm-petrel . . . . . . . . . . . . . . . . . . . . . . . . . . . . . . . . . . . . . . . 385.8 Leach’s storm-petrel . . . . . . . . . . . . . . . . . . . . . . . . . . . . . . . . . . . . . . . . 395.9 Gannet . . . . . . . . . . . . . . . . . . . . . . . . . . . . . . . . . . . . . . . . . . . . . . 405.10 Cormorant . . . . . . . . . . . . . . . . . . . . . . . . . . . . . . . . . . . . . . . . . . . . 415.11 Shag . . . . . . . . . . . . . . . . . . . . . . . . . . . . . . . . . . . . . . . . . . . . . . 415.12 Eider . . . . . . . . . . . . . . . . . . . . . . . . . . . . . . . . . . . . . . . . . . . . . . 425.13 Long-tailed duck . . . . . . . . . . . . . . . . . . . . . . . . . . . . . . . . . . . . . . . . . 425.14 Pomarine skua . . . . . . . . . . . . . . . . . . . . . . . . . . . . . . . . . . . . . . . . . . 425.15 Arctic skua . . . . . . . . . . . . . . . . . . . . . . . . . . . . . . . . . . . . . . . . . . . . 435.16 Long-tailed skua . . . . . . . . . . . . . . . . . . . . . . . . . . . . . . . . . . . . . . . . . 445.17 Great skua . . . . . . . . . . . . . . . . . . . . . . . . . . . . . . . . . . . . . . . . . . . . 455.18 Black-headed gull . . . . . . . . . . . . . . . . . . . . . . . . . . . . . . . . . . . . . . . . 465.19 Common gull . . . . . . . . . . . . . . . . . . . . . . . . . . . . . . . . . . . . . . . . . . 475.20 Lesser black-backed gull . . . . . . . . . . . . . . . . . . . . . . . . . . . . . . . . . . . . . . 475.21 Herring gull . . . . . . . . . . . . . . . . . . . . . . . . . . . . . . . . . . . . . . . . . . . 475.22 Iceland gull . . . . . . . . . . . . . . . . . . . . . . . . . . . . . . . . . . . . . . . . . . . 495.23 Glaucous gull . . . . . . . . . . . . . . . . . . . . . . . . . . . . . . . . . . . . . . . . . . 495.24 Great black-backed gull . . . . . . . . . . . . . . . . . . . . . . . . . . . . . . . . . . . . . . 495.25 Kittiwake . . . . . . . . . . . . . . . . . . . . . . . . . . . . . . . . . . . . . . . . . . . . 505.26 Common tern . . . . . . . . . . . . . . . . . . . . . . . . . . . . . . . . . . . . . . . . . . 525.27 Arctic tern . . . . . . . . . . . . . . . . . . . . . . . . . . . . . . . . . . . . . . . . . . . . 525.28 Common guillemot . . . . . . . . . . . . . . . . . . . . . . . . . . . . . . . . . . . . . . . . 535.29 Razorbill . . . . . . . . . . . . . . . . . . . . . . . . . . . . . . . . . . . . . . . . . . . . . 545.30 Black guillemot . . . . . . . . . . . . . . . . . . . . . . . . . . . . . . . . . . . . . . . . . 565.31 Little auk . . . . . . . . . . . . . . . . . . . . . . . . . . . . . . . . . . . . . . . . . . . . 575.32 Puffin . . . . . . . . . . . . . . . . . . . . . . . . . . . . . . . . . . . . . . . . . . . . . . 57
4
The distribution of seabirds and marine mammals in the Atlantic Frontier, north and west of Scotland
5.33 Rare species . . . . . . . . . . . . . . . . . . . . . . . . . . . . . . . . . . . . . . . . . . . 595.33.1 Black-throated diver . . . . . . . . . . . . . . . . . . . . . . . . . . . . . . . . . . . 595.33.2 Great crested grebe . . . . . . . . . . . . . . . . . . . . . . . . . . . . . . . . . . . 595.33.3 Soft-plumaged petrel sp. . . . . . . . . . . . . . . . . . . . . . . . . . . . . . . . . . 595.33.4 Cory’s shearwater . . . . . . . . . . . . . . . . . . . . . . . . . . . . . . . . . . . . 595.33.5 Mediterranean shearwater . . . . . . . . . . . . . . . . . . . . . . . . . . . . . . . . . 595.33.6 Wilson’s storm-petrel . . . . . . . . . . . . . . . . . . . . . . . . . . . . . . . . . . . 595.33.7 Common scoter . . . . . . . . . . . . . . . . . . . . . . . . . . . . . . . . . . . . . 605.33.8 Velvet scoter . . . . . . . . . . . . . . . . . . . . . . . . . . . . . . . . . . . . . . . 605.33.9 Red-breasted merganser . . . . . . . . . . . . . . . . . . . . . . . . . . . . . . . . . . 605.33.10 Red-necked phalarope . . . . . . . . . . . . . . . . . . . . . . . . . . . . . . . . . . 605.33.11 Grey phalarope . . . . . . . . . . . . . . . . . . . . . . . . . . . . . . . . . . . . . . 605.33.12 Little gull . . . . . . . . . . . . . . . . . . . . . . . . . . . . . . . . . . . . . . . . 605.33.13 Sabine’s gull . . . . . . . . . . . . . . . . . . . . . . . . . . . . . . . . . . . . . . . 605.33.14 Sandwich tern . . . . . . . . . . . . . . . . . . . . . . . . . . . . . . . . . . . . . . 605.33.15 Little tern . . . . . . . . . . . . . . . . . . . . . . . . . . . . . . . . . . . . . . . . 605.33.16 Brünnich’s guillemot . . . . . . . . . . . . . . . . . . . . . . . . . . . . . . . . . . . 60
6. Cetacean distribution . . . . . . . . . . . . . . . . . . . . . . . . . . . . . . . . . . . . . . . . . 616.1 Fin whale . . . . . . . . . . . . . . . . . . . . . . . . . . . . . . . . . . . . . . . . . . . . 616.2 Sei whale . . . . . . . . . . . . . . . . . . . . . . . . . . . . . . . . . . . . . . . . . . . . 616.3 Minke whale . . . . . . . . . . . . . . . . . . . . . . . . . . . . . . . . . . . . . . . . . . . 626.4 Humpback whale . . . . . . . . . . . . . . . . . . . . . . . . . . . . . . . . . . . . . . . . . 626.5 Sperm whale . . . . . . . . . . . . . . . . . . . . . . . . . . . . . . . . . . . . . . . . . . . 626.6 Unidentified beaked whales . . . . . . . . . . . . . . . . . . . . . . . . . . . . . . . . . . . . 646.7 Northern bottlenose whale . . . . . . . . . . . . . . . . . . . . . . . . . . . . . . . . . . . . . 646.8 Sowerby’s beaked whale . . . . . . . . . . . . . . . . . . . . . . . . . . . . . . . . . . . . . . 646.9 Killer whale . . . . . . . . . . . . . . . . . . . . . . . . . . . . . . . . . . . . . . . . . . . 646.10 Long-finned pilot whale . . . . . . . . . . . . . . . . . . . . . . . . . . . . . . . . . . . . . . 656.11 Atlantic white-sided dolphin . . . . . . . . . . . . . . . . . . . . . . . . . . . . . . . . . . . . 666.12 White-beaked dolphin . . . . . . . . . . . . . . . . . . . . . . . . . . . . . . . . . . . . . . . 666.13 Risso’s dolphin . . . . . . . . . . . . . . . . . . . . . . . . . . . . . . . . . . . . . . . . . . 676.14 Bottlenose dolphin . . . . . . . . . . . . . . . . . . . . . . . . . . . . . . . . . . . . . . . . 686.15 Common dolphin . . . . . . . . . . . . . . . . . . . . . . . . . . . . . . . . . . . . . . . . . 686.16 Harbour porpoise . . . . . . . . . . . . . . . . . . . . . . . . . . . . . . . . . . . . . . . . . 69
7. Pinniped distribution . . . . . . . . . . . . . . . . . . . . . . . . . . . . . . . . . . . . . . . . . 717.1 Common (Harbour) seal . . . . . . . . . . . . . . . . . . . . . . . . . . . . . . . . . . . . . . 717.2 Grey seal . . . . . . . . . . . . . . . . . . . . . . . . . . . . . . . . . . . . . . . . . . . . 727.3 Hooded seal . . . . . . . . . . . . . . . . . . . . . . . . . . . . . . . . . . . . . . . . . . . 72
8. Discussion . . . . . . . . . . . . . . . . . . . . . . . . . . . . . . . . . . . . . . . . . . . . . . 758.1 Survey coverage . . . . . . . . . . . . . . . . . . . . . . . . . . . . . . . . . . . . . . . . . 758.2 Seabird distribution: Atlantic Frontier and continental shelf . . . . . . . . . . . . . . . . . . . . . . 75
8.2.1 Importance of Atlantic Frontier for seabirds . . . . . . . . . . . . . . . . . . . . . . . . . 758.2.2 Importance of study area shelf waters for seabirds . . . . . . . . . . . . . . . . . . . . . . 76
8.3 Marine mammal distribution . . . . . . . . . . . . . . . . . . . . . . . . . . . . . . . . . . . . 768.3.1 Importance of Atlantic Frontier for marine mammals . . . . . . . . . . . . . . . . . . . . 778.3.2 Importance of Scottish shelf waters for marine mammals . . . . . . . . . . . . . . . . . . 77
8.4 The threat of surface and noise pollution to seabirds and marine mammals in the Atlantic Frontier . . . . 78
Acknowledgements . . . . . . . . . . . . . . . . . . . . . . . . . . . . . . . . . . . . . . . . . . . . 81
References . . . . . . . . . . . . . . . . . . . . . . . . . . . . . . . . . . . . . . . . . . . . . . . . 83
Appendix I. Scientific names of seabirds, cetaceans, pinnipeds and fish mentioned in the text . . . . . . . . . . 91
Appendix II. Survey coverage (km2) obtained in licenced rectangles located in the Atlantic Frontier . . . . . . . . 91(June 1979-March 1999)
5
The distribution of seabirds and marine mammals in the Atlantic Frontier, north and west of Scotland
Summaryn Surveys were conducted in waters north and west of Scotland, with emphasis on the deep waters of the continental
slope where licences have been awarded for oil and gas exploration.
n All data from surveys between 1979 to 1999 were used to compile this report.
n The main objective was to gain information on seabird and cetacean dispersion patterns along the continental slope, particularly in the offshore blocks licensed in the 17 th and earlier rounds.
n A secondary objective was to census several important seabird colonies nearest the licensed areas. The results are dealt with in detail elsewhere.
n Twenty-three species of seabirds breed in the study area, 21 in internationally important numbers.
Seabird dispersionn A total of 48 seabird species was recorded.
n Twenty-one species associated with fishing vessels, although only fulmar, European storm-petrel, gannet, great skua, herring gull, lesser black-backed gull, great black-backed gull and kittiwake did so in any number.
n Eight species were present all year round; in order of decreasing abundance these were fulmar, gannet, herring gull, great black-backed gull, kittiwake, common guillemot, razorbill and puffin.
n Manx shearwaters, European storm-petrels, Leach’s storm-petrels, Arctic skuas, great skuas, lesser black-backed gulls and Arctic terns were summer visitors to the area.
n Iceland gull, glaucous gull and little auk were winter visitors.
n Great and sooty shearwaters, and Pomarine and long-tailed skuas were uncommon migrants.
n Fulmars concentrated along the continental slope in late winter (January to April). High numbers remained hereduring the breeding season although they were also abundant over the shelf at this time. Generally lower densities were recorded over the slope between August and October and low numbers were recorded everywhere in November and December.
n Great shearwaters were recorded along the continental slope with peak numbers in August.
n Sooty shearwaters were widespread at low density in the study area between July and October.
n Manx shearwaters were mostly recorded between March and October. Highest densities recorded were in shelf waters west of Scotland between June and August. The species was widespread at low density in deep waters at this time.
n European storm-petrels were abundant in the study area between June and August. Highest densities were recorded in deep waters north-west of Scotland in August.
n Leach’s storm-petrels were predominantly recorded in deep water (>200 m) with highest densities in August.
n Gannets were widespread throughout the year. Numbers were highest in summer as this species is a partial migrant. Gannets were concentrated north and west of the Western Isles.
n Pomarine skuas were observed in all areas, mainly during spring and autumn passage.
n Low numbers of Arctic skuas were recorded in the study area.
n Long-tailed skuas, also recorded on passage, exhibited a more pelagic distribution pattern.
n Great skuas were widespread at low density during the summer months.
n Lesser black-backed gulls were widespread in the study area between April and August and there were areas ofhigh density along the continental slope. Most birds migrate south during winter.
n The herring gull was primarily a coastal species, but low densities occurred along the continental slopeduring the winter.
n Iceland gulls were observed in small numbers in the study area between November and March.
n Glaucous gulls were a scarce but regular visitor. Most were recorded in the Faroe-Shetland Channel and along theedge of the Rockall Trough.
n Great black-backed gulls were widespread at low density throughout the year. Highest numbers were recorded around Shetland and along the continental slope in late winter (January to April).
6
The distribution of seabirds and marine mammals in the Atlantic Frontier, north and west of Scotland
n The kittiwake was the most abundant gull species recorded. High densities were recorded over the shelf throughoutthe year. Low densities were recorded offshore except during late winter when high concentrations were present along the continental slope.
n Arctic terns were recorded in the study area between May and October. Low densities of birds were recorded indeep water.
n Common guillemots were primarily a shelf species but were recorded at low densities in deep waters (>200 m) throughout the year. High densities were found inshore in late summer as birds gather to moult.
n Razorbills were mostly recorded over the shelf and were thinly distributed in deeper waters. As with commonguillemots, this species flocks inshore when moulting.
n Little auks were widespread north of Scotland between September and December, but were mainly seen in shelfwaters thereafter.
n Puffins were widespread except in late winter when they disperse out of the area. Highest densities were recordedin shelf waters in June and July.
n Red-throated diver, great northern diver, cormorant, shag, common eider, long-tailed duck, black-headed gull, common gull, common tern and black guillemot were predominately recorded inshore and were rarely recorded offshore.
n Sixteen species of seabird were recorded on less than 20 occasions; black-throated diver, great crested grebe,soft plumaged petrel, Cory’s and Mediterranean shearwaters, Wilson’s storm-petrel, common and velvet scoters,red-breasted merganser, red-necked and grey phalaropes, little and Sabine’s gulls, Sandwich and little terns,and Brünnich’s guillemot.
Cetaceansn Fifteen species of cetacean were recorded.
n Fin, sei and humpback whales were recorded in small numbers mainly in the Faroe-Shetland Channel.
n Minke whales were the most numerous baleen whale recorded and were mostly seen inshore during the summer.
n Sperm whales were encountered in all months except for February and March and mainly in waters deeper than 1,000 m.
n Unidentified beaked whales thought to be of the genus Mesoplodon were recorded in deep waters particularly around the 1,000 m isobath. A single animal was positively identified as a Sowerby’s beaked whale.
n Northern bottlenose whales were infrequently seen in deep waters.
n Killer whales were recorded in all but two months, mostly in the Faroe-Shetland Channel.
n Long-finned pilot whales were the second most abundant cetacean recorded. Most sightings were in waters deeperthan 200 m.
n Atlantic white-sided dolphin was the most numerous cetacean, and was found mainly along the shelf edge and inwaters deeper than 1,000 m.
n White-beaked dolphins were almost entirely confined to shelf waters where they were the most abundantspecies recorded.
n Risso’s dolphins were widely distributed in shelf waters, particularly around the Western Isles.
n Bottlenose dolphins were generally uncommon.
n Common dolphins are at the northern extremity of their range and were recorded mainly offshore.
n Harbour porpoise was the most frequently sighted cetacean and was widely distributed inshore.
Pinnipedsn Three species of seal were recorded. These were common (harbour), grey and hooded seals.
n Common seals were mostly recorded inshore with few records offshore.
n Grey seals were the most numerous seal recorded. They were frequently seen offshore but rarely beyond the 200 m depth contour.
n Hooded seals were rare with only six records. All were in deep water (>200 m depth).
7
The distribution of seabirds and marine mammals in the Atlantic Frontier, north and west of Scotland
The Seabirds at Sea Team (SAST) of the Joint NatureConservation Committee (JNCC) has been studying thedistribution and abundance of seabirds and marinemammals in the waters around Britain since 1979. Duringthe 1970s, with the development of the offshore North Seaoil industry, there was concern over the lack of availabledata on seabird dispersion at sea. Funding from the UnitedKingdom government and the oil and gas industry resultedin the establishment of SAST, and enabled surveys tocommence in the North Sea. These surveys havecontinued in British and Irish waters, and along withsimilar data collected by other European countries, havebeen incorporated into the European Seabirds at Sea(ESAS) database. This database contains over 1.5 millionseabird and over 13,000 cetacean records, and providesinformation on distribution and abundance throughout theyear. Atlases are produced that depict seabird distributionand abundance (e.g. NERC 1998; Pollock et al. 1997;Stone et al. 1995a; Webb et al. 1990), and vulnerability ofseabirds to surface pollution (e.g. Carter et al. 1993;NERC 1998; Tasker et al. 1990; Webb et al. 1995).
During the 16 th UK offshore oil licensing round of 1994and 1995, licences were awarded by the Department ofTrade and Industry for oil and gas exploration in thepoorly known, deep waters of the continental slope andbeyond to the north and west of Scotland, the “AtlanticFrontier”. In 1997 further licences were issued in the 17 th
round. One of the licensing conditions was thatinformation be presented by the licensee on theimportance of the area for seabirds and marine mammalsprior to exploration in the licence blocks, to fulfilEnvironmental Impact Assessments and guide oil spillcontingency plans. As a result, individual companies andthe Atlantic Margin Group (AMG) directly funded somededicated seabird and cetacean surveys of the area in 1997and early 1998. A consortium of oil and gas industrycompanies, via the Atlantic Frontier EnvironmentNetwork (AFEN), funded surveys in the region fromMarch 1998, and surveys continued until March 1999.This report utilises data collected during this period, andfrom previous SAST and ESAS surveys (1979-1999), toexamine the distribution and abundance of seabirds andmarine mammals in the Atlantic Frontier.
1. Introduction1.1 Background
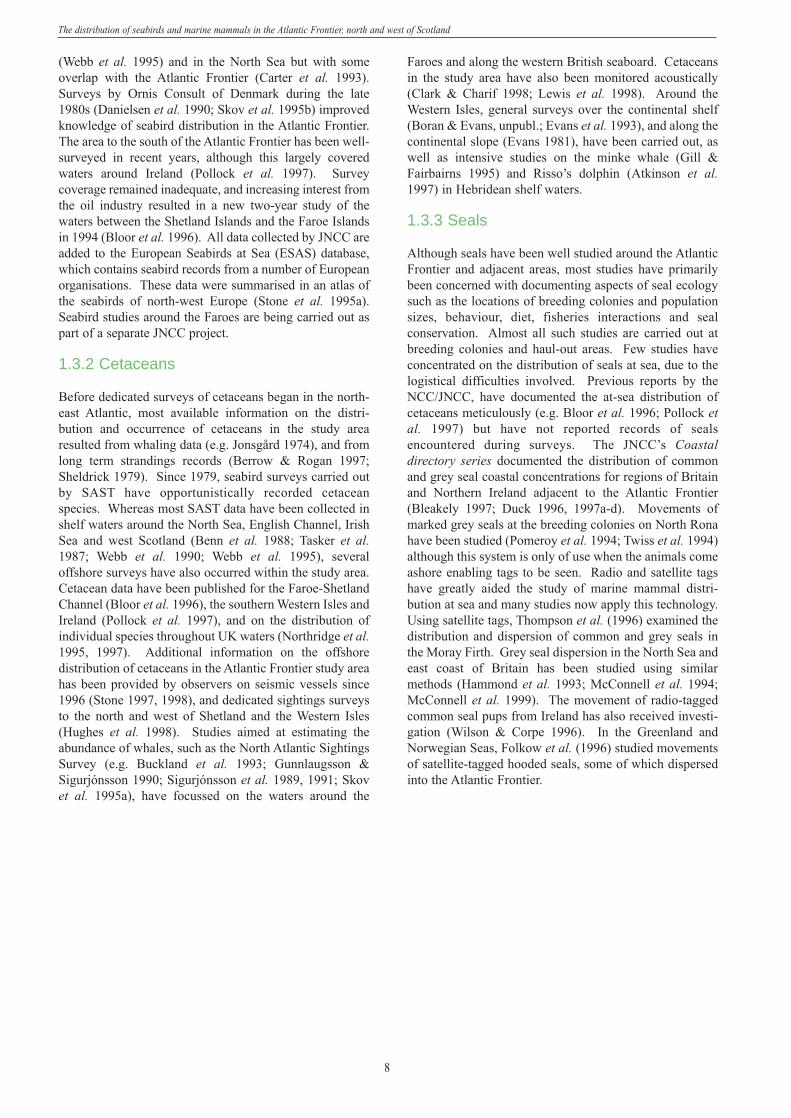
Places named within the study area and referred to in thetext are illustrated in Figure 1.The scientific and English names of the species mentionedin this report are listed in Appendix I.
1.3.1 Seabirds
Prior to 1997, much survey coverage of the AtlanticFrontier was achieved, mainly as part of other projects.Early pioneering work by Nicholson (1928), Jesperson(1929) and Rankin and Duffey (1948) covered only a smallproportion of the study area, as did later research (e.g.Butcher et al. 1968; Sage 1968). In 1979 the NatureConservancy Council (NCC) Seabirds at Sea Team begansystematic survey work in the North Sea (e.g. Blake et al.1984) with later extensions of this programme covering
other parts of the North Atlantic around Britain. In the1980s, there was interest from the oil industry in licensedareas in the North Rockall Trough Basin. At that time,there was limited information available for the area anddata were confined to the summer months. In 1986 a year-round survey of seabird distribution began in the watersnorth and west of Scotland (Benn et al. 1988). This wasfollowed by a survey of moulting auks in the area (Burtonet al. 1987), and a study of the feeding distribution andbreeding biology of seabirds around the colonies of NorthRona and Sula Sgeir (Benn et al. 1987, 1989) and St. Kilda(Leaper et al. 1988). Further data on seabird distributionnorth and west of Scotland were collected as part of aproject to survey waters west of Britain (Webb et al. 1990).Later research identified concentrations of seabirdsvulnerable to surface pollution south and west of Britain
1.3 Previous work
1.2 ObjectivesThe main aims of the project were:
n to gain information on seabird and marine mammal dispersion patterns along the continental slope,particularly in the offshore blocks licensed in the17 th and earlier offshore rounds; and
n to census several important seabird colonies on islands nearest the licensed areas.
This report presents seasonal distribution patterns of allseabirds and marine mammals encountered. Results fromthe colony censuses are summarised, but will be detailedelsewhere.
8
The distribution of seabirds and marine mammals in the Atlantic Frontier, north and west of Scotland
(Webb et al. 1995) and in the North Sea but with someoverlap with the Atlantic Frontier (Carter et al. 1993).Surveys by Ornis Consult of Denmark during the late1980s (Danielsen et al. 1990; Skov et al. 1995b) improvedknowledge of seabird distribution in the Atlantic Frontier.The area to the south of the Atlantic Frontier has been well-surveyed in recent years, although this largely coveredwaters around Ireland (Pollock et al. 1997). Surveycoverage remained inadequate, and increasing interest fromthe oil industry resulted in a new two-year study of thewaters between the Shetland Islands and the Faroe Islandsin 1994 (Bloor et al. 1996). All data collected by JNCC areadded to the European Seabirds at Sea (ESAS) database,which contains seabird records from a number of Europeanorganisations. These data were summarised in an atlas ofthe seabirds of north-west Europe (Stone et al. 1995a).Seabird studies around the Faroes are being carried out aspart of a separate JNCC project.
1.3.2 Cetaceans
Before dedicated surveys of cetaceans began in the north-east Atlantic, most available information on the distri-bution and occurrence of cetaceans in the study arearesulted from whaling data (e.g. Jonsgård 1974), and fromlong term strandings records (Berrow & Rogan 1997;Sheldrick 1979). Since 1979, seabird surveys carried outby SAST have opportunistically recorded cetaceanspecies. Whereas most SAST data have been collected inshelf waters around the North Sea, English Channel, IrishSea and west Scotland (Benn et al. 1988; Tasker et al.1987; Webb et al. 1990; Webb et al. 1995), severaloffshore surveys have also occurred within the study area.Cetacean data have been published for the Faroe-ShetlandChannel (Bloor et al. 1996), the southern Western Isles andIreland (Pollock et al. 1997), and on the distribution ofindividual species throughout UK waters (Northridge et al.1995, 1997). Additional information on the offshoredistribution of cetaceans in the Atlantic Frontier study areahas been provided by observers on seismic vessels since1996 (Stone 1997, 1998), and dedicated sightings surveysto the north and west of Shetland and the Western Isles(Hughes et al. 1998). Studies aimed at estimating theabundance of whales, such as the North Atlantic SightingsSurvey (e.g. Buckland et al. 1993; Gunnlaugsson &Sigurjónsson 1990; Sigurjónsson et al. 1989, 1991; Skovet al. 1995a), have focussed on the waters around the
Faroes and along the western British seaboard. Cetaceansin the study area have also been monitored acoustically(Clark & Charif 1998; Lewis et al. 1998). Around theWestern Isles, general surveys over the continental shelf(Boran & Evans, unpubl.; Evans et al. 1993), and along thecontinental slope (Evans 1981), have been carried out, aswell as intensive studies on the minke whale (Gill &Fairbairns 1995) and Risso’s dolphin (Atkinson et al.1997) in Hebridean shelf waters.
1.3.3 Seals
Although seals have been well studied around the AtlanticFrontier and adjacent areas, most studies have primarilybeen concerned with documenting aspects of seal ecologysuch as the locations of breeding colonies and populationsizes, behaviour, diet, fisheries interactions and sealconservation. Almost all such studies are carried out atbreeding colonies and haul-out areas. Few studies haveconcentrated on the distribution of seals at sea, due to thelogistical difficulties involved. Previous reports by theNCC/JNCC, have documented the at-sea distribution ofcetaceans meticulously (e.g. Bloor et al. 1996; Pollock etal. 1997) but have not reported records of sealsencountered during surveys. The JNCC’s Coastaldirectory series documented the distribution of commonand grey seal coastal concentrations for regions of Britainand Northern Ireland adjacent to the Atlantic Frontier(Bleakely 1997; Duck 1996, 1997a-d). Movements ofmarked grey seals at the breeding colonies on North Ronahave been studied (Pomeroy et al. 1994; Twiss et al. 1994)although this system is only of use when the animals comeashore enabling tags to be seen. Radio and satellite tagshave greatly aided the study of marine mammal distri-bution at sea and many studies now apply this technology.Using satellite tags, Thompson et al. (1996) examined thedistribution and dispersion of common and grey seals inthe Moray Firth. Grey seal dispersion in the North Sea andeast coast of Britain has been studied using similarmethods (Hammond et al. 1993; McConnell et al. 1994;McConnell et al. 1999). The movement of radio-taggedcommon seal pups from Ireland has also received investi-gation (Wilson & Corpe 1996). In the Greenland andNorwegian Seas, Folkow et al. (1996) studied movementsof satellite-tagged hooded seals, some of which dispersedinto the Atlantic Frontier.
9
The distribution of seabirds and marine mammals in the Atlantic Frontier, north and west of Scotland
61oN
59oN
58oN
57oN
56oN
60oN
62oN
05oW 02oE01oE0o01oW02oW06oW 03oW07oW08oW09oW10oW11oW12oW 04oW
NorwegianSea
Shetland
Fair IsleChannel
FaroeIslands
YmirRidge
Wyville-Thompson Ridge
FaroeBank
Lous
y B
ank
RosemaryBank
Rockall T
rough
Anton DohrnSeamount
The
Min
ch
WesternIsles
Sea ofHebrides Scotland
Orkney
Faro
e-She
tland
Cha
nnel
Pentland Firth
2
1
5
6
14
16
15
12
8
13
410
7
3
11
9
Faroe-BankChannel
Firthof Clyde
NorthernIreland
FairIsle
Bill Bailey'sBank
Scapa Flow
Figure 1. The study area showing place names and bathymetry (see Figure 3 for further named places)
Bathymetry: short dash (200 m isobath); long dash (1,000 m isobath)
1 Unst
2 Lerwick
3 Butt of Lewis
4 Stornoway
5 Lewis
6 North Uist
7 South Uist
8 Barra
9 Caithness
10 Summer Isles
11 Sutherland
12 Isle of Skye
13 Mull
14 Islay
15 Arran
16 Mull of Kintyre
10
The distribution of seabirds and marine mammals in the Atlantic Frontier, north and west of Scotland
61oN
59oN
58oN
57oN
56oN
60oN
62oN
05oW 02oE01oE0o01oW02oW06oW 03oW07oW08oW09oW10oW11oW12oW 04oW
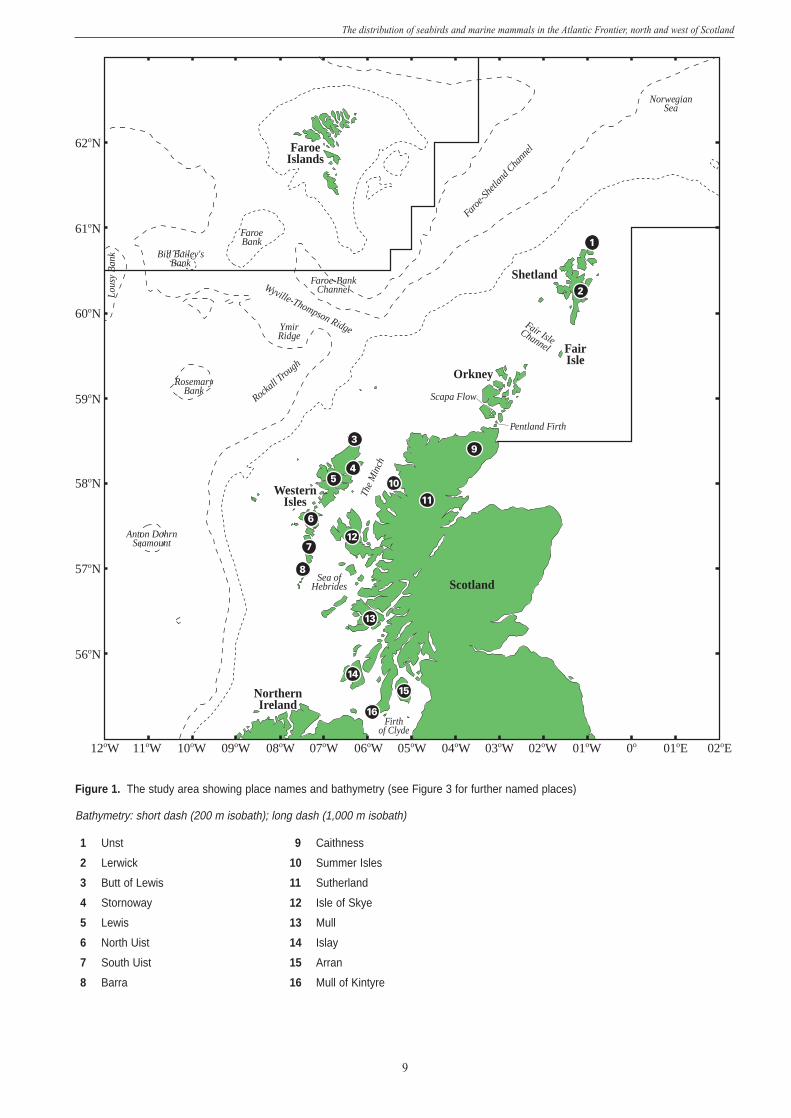
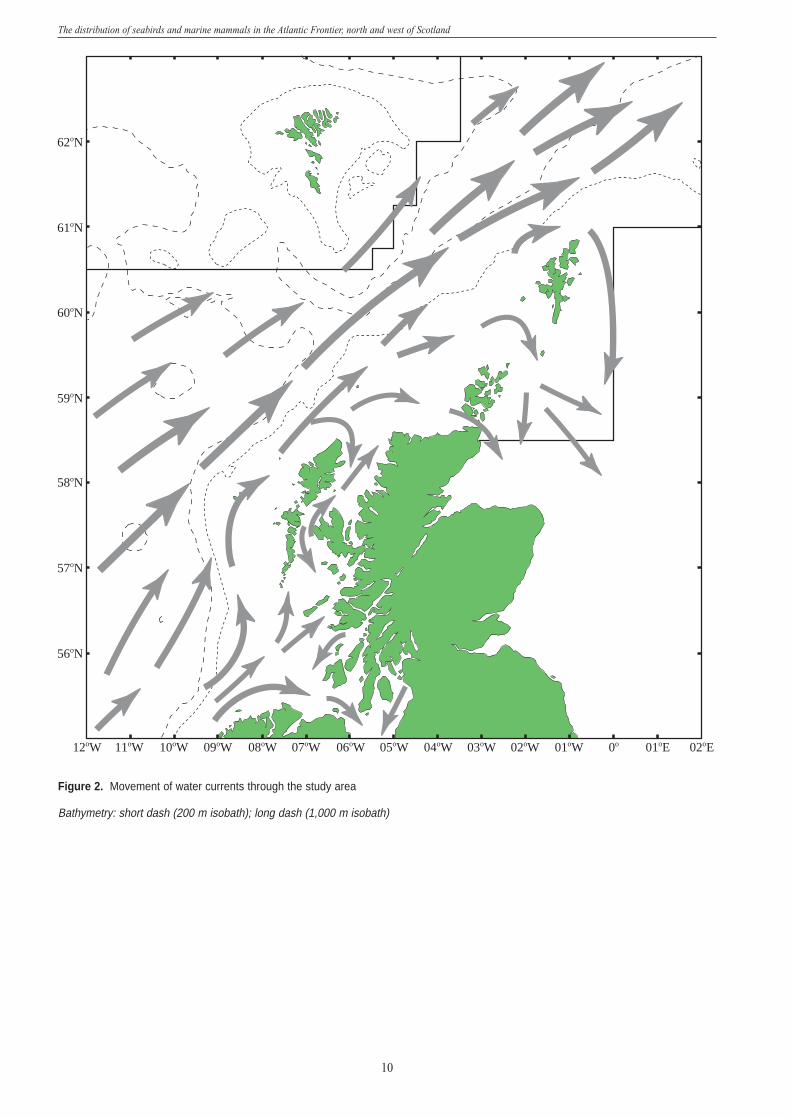
Figure 2. Movement of water currents through the study area
Bathymetry: short dash (200 m isobath); long dash (1,000 m isobath)
11
The distribution of seabirds and marine mammals in the Atlantic Frontier, north and west of Scotland
2. The marine environment
2.1 Physical environment and oceanographic features
The ocean is a highly heterogeneous environment, withboth large- and small-scale spatial patterns inoceanography (Hunt & Schneider 1987). Changes inphysical and biological features of the ocean environmentinfluence the distribution and abundance of marineorganisms. Physical processes such as ocean circulatorypatterns may have large-scale influences on the dispersionof marine organisms, but important small-scale features,such as eddies, also have an affect. Oceanographicfeatures vary on a temporal scale, with seasonal formationof fronts and annual fluctuations in water temperature,salinity and primary productivity (Dooley et al. 1984;Ellett & Blindheim 1992; le Fèvre 1986; Tait 1957).
The distribution of seabirds and marine mammals is patchyrather than even, and is generally related to that of theirprey species. Both seabirds and marine mammals feed on
zooplankton and fish, and their distribution may be relatedto movement or abundance of fish stocks (e.g. Evans 1990)or regions of high productivity such as upwelling or fronts(Begg & Reid 1997; Kenney & Winn 1987). Theavailability of fisheries waste may also have an effect onthe distribution of some seabirds (Camphuysen et al. 1993,1995). The occurrence of marine mammals and seabirds isrelated to oceanographic features such as watertemperature, salinity and depth (Harrison et al. 1994;Selzer & Payne 1988), but their primary influence is indetermining the distribution of prey.
As the distribution and abundance of seabirds and marinemammals is largely governed by oceanographic features, itis important to describe the topography and marineprocesses occurring in the study area.
The study area (Figure 1) includes waters adjacent to themainland coasts of north and west Scotland and aroundseveral island groups: the Western Isles, and the Orkneyand Shetland Islands. The currents of the North AtlanticOcean are the main influence on the west coast ofScotland, the Western Isles and the Orkney and ShetlandIslands. The east coasts of Shetland and Orkney arebordered by the North Sea, but retain a North Atlanticinfluence from currents passing through the NorwegianTrench. The area contains two distinct oceanographiczones: generally shallow waters (<200 m deep) of thecontinental shelf, and deep oceanic waters (>500 m depth).The continental slope between these regions provides anarea of increased production, as nutrients are brought tothe surface by turbulent upwelling (e.g. Atkinson &Targett 1983; Brown 1988a).
2.1.1 Bathymetry
The waters to the north and west of Scotland are underlainby varied seabed topography in a series of ridges andchannels (Figure 1). The continental slope runs south-west to north-east, with water of over 1,000 m depthforming a large proportion of the study area. Two deepwater troughs dominate the region: the Faroe-ShetlandChannel (>1,000 m) lying between the Faroe and ShetlandIslands, and the Rockall Trough (>2,000 m) off thewestern shelf edge. Separating these two troughs are theWyville-Thomson Ridge and the Ymir Ridge at 60ºN.Two seamounts, the Rosemary Bank (<500 m) and theAnton Dohrn Seamount (<1,000 m) provide areas of highseabed relief in the Rockall Trough.
The continental shelf break lies in close proximity to theNorthern and Western Isles, approaching to approximately50 km north of Shetland and 65 km north-west of the
Western Isles. The steepness of the slope varies: the 200m and 1,000 m isobaths are separated by approximately 65horizontal km to the north of Shetland, but occur within 13km of each other west of Barra.
2.1.2 Currents and water properties
Complex seabed topography results in a series of surface anddeep water currents within the study area (Figure 2). In theupper water column a northward flow of the Gulf Streamcombines with cooler water over the continental slope andcontinues northwards through the Rockall Trough. Thecurrent veers north-eastward between the Rockall Bank andthe Anton Dohrn Seamount and moves through the Faroe-Shetland Channel into the Norwegian Sea (Tait 1957). Tothe north of, and below the level of, the Wyville-ThomsonRidge (c. 550 m) lies a body of cold, dense Norwegian Seawater. In the Faroe-Shetland Channel this water mass has anet south-westerly flow but is prevented from entering theAtlantic by the Wyville-Thomson Ridge, though overflowevents do cause some exchange (Ellett & Roberts 1973).Another Atlantic current flows west of the Faroe Bank andFaroe Islands and mixes with Arctic Icelandic water to thenorth of the Faroes (Tait 1957). This Modified Atlanticcurrent flows as an anticyclonic gyre around the FaroeIslands (Dooley & Meincke 1981) and may veer southwardsalong the east coast of the Faroes, or recirculate in a cyclonicmanner back into the Norwegian Sea (Aken & Eisma 1987).
In addition, a current flows northwards along the Europeancontinental break, which becomes narrower and fastertowards the north-west Scottish slope, before turning north-eastward parallel to the Atlantic Current. This SlopeCurrent mixes with the Atlantic Current, and an offshootknown as the East Shetland Atlantic Inflow movessouthward along the east coast of Shetland (Turrell 1992).
12
The distribution of seabirds and marine mammals in the Atlantic Frontier, north and west of Scotland
Water from the Atlantic also flows through the innerScottish islands, moving northwards from the south coast ofIreland, through the Irish Sea into the southern Minch. Hereit divides into two branches, one travelling northwardsthrough the Minch and the other up the west coast of theWestern Isles (Ellett & Edwards 1983). This coastal currentmixes with the slope current around Rona, turning eastwardalong the 100 m isobath. As the mainly wind-driven FairIsle Current (Dooley 1974), it moves between Fair Isle andOrkney before turning south-eastwards and flowing into theNorth Sea (Turrell et al. 1990).
Water temperature and salinity in the study area are veryvariable, with large-scale changes occurring between yearsin hydrographic conditions (Dooley et al. 1984). Thewarm water flowing from the Atlantic through the Faroe-Shetland Channel normally has a salinity in excess of35.25‰ (Dooley et al. 1984). Water temperature in the
Rockall Trough ranges from 9.5ºC to 14.5ºC (Ellett &MacDougall 1983). In the Faroe-Shetland Channel,several water masses are present with varyinghydrographic properties: warm, saline north Atlantic watermoving north-eastward is met by colder less saline waterflowing from the north. In the coastal waters of the Minch,freshwater input from rivers results in a lower salinity(Ellett & Edwards 1983). The waters to the south-west ofShetland and in the Fair Isle Current also have a salinity ofless than 35.0‰ indicating coastal water (Aken & Eisma1987; Turrell et al. 1990). Over the Scottish continentalshelf, variation in water depth and tidal influences resultsin changes in the structure of the water column. Wherewell-mixed water meets thermally stratified water, frontalsystems may occur (Pingree & Griffiths 1978). Shelf-break fronts also occur along the shelf edge, where waterdepth abruptly lessens and current speed alters.
Zooplankton are the principal food source for severalspecies of fish (Bainbridge & Forsyth 1972; Bainbridge etal. 1978), seabirds and cetaceans. Some seabird species,such as the little auk and Leach’s storm-petrel, feeddirectly on zooplankton, and concentrations of these birdsmay occur over upwellings where surface zooplanktonbiomass is greatest (Brown 1988a, b). The small-scaledistribution of planktonic prey may determine the distri-bution of seabirds within the broader boundaries set byoceanographic and hydrographic features (Hunt &Schneider 1987; McClatchie et al. 1989). The prey-predator relationship between zooplankton and fish mayalso indirectly affect the distribution and abundance ofpiscivorous seabirds and marine mammals (Evans 1990;Springer et al. 1987).
The primary foods of most seabirds are densely schooling,small, lipid-rich pelagic fishes, crustaceans andcephalopods that occur in the upper- to mid-water column(Hunt et al. 1996). As a result their distributions arelargely correlated with fish availability during both thebreeding (Crawford & Shelton 1978; Springer et al. 1986)and non-breeding seasons (Jensen et al. 1994). The distri-butions of fish are in turn governed by the constraints oftheir environment. Shoals congregate around suitablespawning, nursery or feeding areas which may coincidewith areas rich in zooplankton such as eddies and fronts(Atkinson & Targett 1983; Hainey & McGillivary 1985;Schneider 1990).
The species of fish consumed is likely to be controlled byseveral factors including availability and size (Jensen et al.1994). The foraging behaviour of seabirds further limitsthe prey available to them. Ashmole (1971) identified sixcategories of feeding method used by seabirds includingunderwater swimming, plunging, surface feeding, feedingwhen flying and piracy. Pursuit divers, such as the auks,are able to dive deeper than all other seabirds and as aresult feed on clupeids, gadoids and other demersal fish(Blake 1983, 1984; Harris 1970). Gannets, which plunge
dive from a height above the water, and Manx shearwaters,which may surface plunge, concentrate on pelagic fish thatshoal close to the surface e.g. mackerel Scomber scrombusand sprat Sprattus sprattus (Brooke 1990; Wanless 1984).Fulmars and European and Leach’s storm-petrelsgenerally surface feed on small fish, cephalopods andcrustaceans (Prince & Morgan 1987). Piracy is employedas a feeding method especially by skuas and opportunis-tically by the larger gulls (Furness 1987a).
Most seabirds show seasonal variation in diet. During thebreeding season, sandeels Ammodytes spp. and clupeids(e.g. sprat and herring) are important prey for manyspecies in the north-east Atlantic including auks (e.g.Blake et al. 1985; Wright & Bailey 1991), terns (e.g.Monaghan & Uttley 1991), kittiwakes (e.g. Hamer et al.1993), Arctic skuas (e.g. Furness 1990) and shags (e.g.Harris & Riddiford 1989; Harris & Wanless 1991). Theirdistribution at sea can be positively correlated withsandeel density (Camphuysen 1990; Furness 1990;Wright & Bailey 1991). Partial or complete breedingfailure may occur if sandeel stocks are low (Uttley et al.1989). Although much information exists on the diet ofseabirds during the breeding season there is a lack ofinformation on diet away from the coast and in winter(Jensen et al. 1994). In the North Sea and west ofScotland, common guillemots were found to feed more onclupeids and gadoids during the winter (Blake et al. 1985;Halley et al. 1995).
Baleen whales typically feed on zooplankton, but in theNorthern Hemisphere many species may also eat fish andsquid depending on the season (Sigurjónsson 1995).Minke whales feed inshore during the summer monthsmainly on fish such as gadoids and clupeids (Haug et al.1995). The diet of toothed cetaceans (Odontoceti) consistsmainly of fish and squid. Harbour porpoises feed ondemersal fish such as herring Clupea harengus and havebeen found associated in areas of known seasonal concen-trations of spawning herring (Evans 1990). In Scottish
2.2 Seabird and marine mammal prey
13
The distribution of seabirds and marine mammals in the Atlantic Frontier, north and west of Scotland
2.3 Fisheries north and west of Scotland
waters, harbour porpoises were found to have fed on avariety of fish including sandeels, whiting Merlangiusmerlangus, haddock Melanogrammus aeglifinus, poor codTrisopterus minutus, Norway pout T. esmarkii, pollackPollachius pollachius and gobies Gobius spp. (Martin1995). Sandeels are important during the summeralthough gadoids (eg. haddock, whiting, pollack, Norwaypout) become increasingly more important during theautumn and winter when sandeels are unavailable (Santoset al. 1995). White-beaked dolphins also feed predomi-nantly on gadoids (Santos et al. 1995). Risso’s dolphinsand long-finned pilot whales feed mostly on squid,
although in Faroese waters blue whiting Micromesistiuspoutassou can be an important prey species for long-finned pilot whales during certain times of year, especiallywhen squid are scarce (Hoydal & Lastein 1993).
Seabirds and cetaceans often associate with each otherwhen feeding (Evans 1982; Skov et al. 1991). Gannets arefrequently observed circling over feeding commondolphins and minke whales are often seen with Manxshearwaters (e.g. Evans 1982; Evans et al. 1993).Cetaceans may drive fish to the surface while feeding,making them more accessible to seabirds.
The fishing grounds of the Atlantic Frontier are lessimportant than those of the North Sea (Lee & Ramster1981). Most fishing activity occurs over the shelf andshelf edge with little activity in deeper water. Shallowerinshore waters around Shetland, Orkney and the WesternIsles are important fishing areas for pelagic species. Themost important pelagic species for fisheries in the AtlanticFrontier are herring, mackerel and blue whiting (Anon1991). Although herring is widely distributed in the NorthAtlantic this fishery has been in decline since the latter halfof the 1970s (Jakobsson 1985). Now most herring arecaught to the north-west of Shetland and to the north ofCape Wrath as far as the shelf break. Since the decline ofthe herring fishery, fishing for mackerel has become moresignificant. Most mackerel fishing is carried out betweenNovember and February when the western stock ofmackerel is present in the study area (Saville 1985).Nearly all are caught to the north of Cape Wrath out to theshelf break.
Compared with pelagic fisheries there is less demersalfishing in the area (Anon 1993), most occurring betweenShetland and Lewis along the north-west continental shelf.Demersal species caught include cod Gadus morhua,haddock, saithe P. virens, Norway pout and whiting (Anon1991). All are widely distributed in the shelf areas of theAtlantic Frontier. Sprats and sandeels are fished in theshallow shelf waters, especially around Shetland and theWestern Isles, though the main catching season for eachdiffers. The former is largely fished during the winterwhereas sandeels are caught during the summer months.
A commercial fishery for sandeels in Shetland began in1974 (Monaghan 1992) and peaked in the 1980s with over52,000 tonnes being landed in 1982 (Avery 1991). TheShetland sandeel fishery relied largely on catches of 0-group fish (post-larval fish in their first year of life), andfollowing the peak catch in 1982, reduced recruitment tothe sandeel population lead to a decreasing spawning stock.The subsequent fall in landings led to voluntary restrictionson catches of 0-group fish by fishermen during 1988, andthe fishery was closed completely in 1991 (Reeves 1994).Improving levels of recruitment in sandeel stocks resultedin the fishery being re-opened in 1995 on a three year trialbasis, with tight restrictions imposed. An annual quota of3,000 tonnes was set and boat size was limited to less than
18 m. A close season was also implemented, beginning atthe end of June (Johnston 1999).
Blue whiting are fished over the shelf-edge during thesummer as post-spawning shoals migrate through theShetland-Faroe Channel to feeding areas in the NorwegianSea (Hansen & Jakupsstovu 1992). Other species fished inthe Faroe-Shetland Channel include Greenland halibutReinhardtius hippoglossoides, greater silver smeltArgentina silus, ling Molva molva and blue ling M.dypterygia, torsk Brosme brosme, hake Merlucciusmerluccius and various redfish Sebastes spp. (Anon 1992).These species are mostly fished by vessels from Norway,Iceland, Germany, France and the Faroes. To the west ofScotland grenadiers (Macrourids) have also been targetedsince the beginning of the deep-sea fishery in 1989, mainlyby vessels from France, Russia and eastern Europe (Anon1992; Biseau 1996).
Shrimp Nephrops spp. fishing is concentrated in the Minchand off the west coast of Scotland (Coull et al. 1998).Cephalopods represent an increasingly important fisheryresource in European waters (Pierce et al. 1996). SquidLoligo spp. are caught in the northern North Sea and westof Scotland, mostly as by-catch from demersal trawling,although landings have declined since the late 1980s(Pierce et al. 1996).
2.3.1 Fisheries and seabirds
Interactions between seabirds and fisheries are diverse andoften complex. Fisheries may affect seabirds beneficiallyby providing discards, or adversely by competing for preyitems or causing death by entanglement in fishing gear.Often the key prey of seabirds are also the target ofindustrial fisheries e.g. sandeels. As a consequence, someseabirds are in potential competition with fisheries and atrisk if the stocks are depleted. Years of low breedingsuccess of kittiwakes have been correlated with years ofhigh sandeel landings (Harris & Wanless 1997). A wreckof auks on the North Sea coasts of Scotland and Englandwas thought to have been caused by a combination ofadverse weather and starvation due to changing patterns insprat abundance (Blake 1984); fisheries surveys in the areahad shown a decline in sprat stocks over the previous fiveyears. Seabirds, notably auks, may be drowned in fishing
14
The distribution of seabirds and marine mammals in the Atlantic Frontier, north and west of Scotland
nets (Bibby 1972; Mead 1974), or caught on longlines, aproblem that especially affects Procellariformes. Seabirdmortality due to longline fishing activity, and itssubsequent effects on seabird populations, has been welldocumented for the Southern Hemisphere (Brothers 1991;Gales et al. 1998; de la Mare & Kerry 1994) but hasreceived little attention in the North Atlantic.
Fishing activities benefit seabirds in providing an easilyexploitable food source. In the North Sea discards fromthe fishing industry constitute an important part of the dietof many seabirds, especially during the winter months(Camphuysen et al. 1993; Camphuysen et al. 1995). It isestimated that the average discard from a demersaltrawler’s catch amounts to 27% by volume (Hudson1986), and that approximately 945,600 tonnes of discardsare available annually (Garthe et al. 1996; ICES 1996).During the non-breeding season 28% of all scavenging
seabirds in the region are associated with fishing vessels atany one time (Camphuysen et al. 1993). Within the north-east Atlantic, 32 species of seabird are known to scavengearound fishing vessels although many do so onlyoccasionally (Camphuysen et al. 1993). Regularscavengers obtaining a large proportion of their food fromdiscards include fulmar, great black-backed gull andkittiwake. Herring gull, great skua, gannet, and lesserblack-backed gull also commonly scavenge behind fishingvessels in the North Sea (Camphuysen et al. 1995).Clearly, discards may have a significant influence onseabird distribution. However, studies on the distributionand scavenging habits of fulmars in the North Sea indicatethis species is most abundant where the supply of fisherywaste is comparatively low, and that oceanographicfeatures such as regions of thermally stratified water ofrelatively high salinity may better predict their seasonaldistribution (Camphuysen & Garthe 1997).
15
The distribution of seabirds and marine mammals in the Atlantic Frontier, north and west of Scotland
3. Breeding populations of seabirds
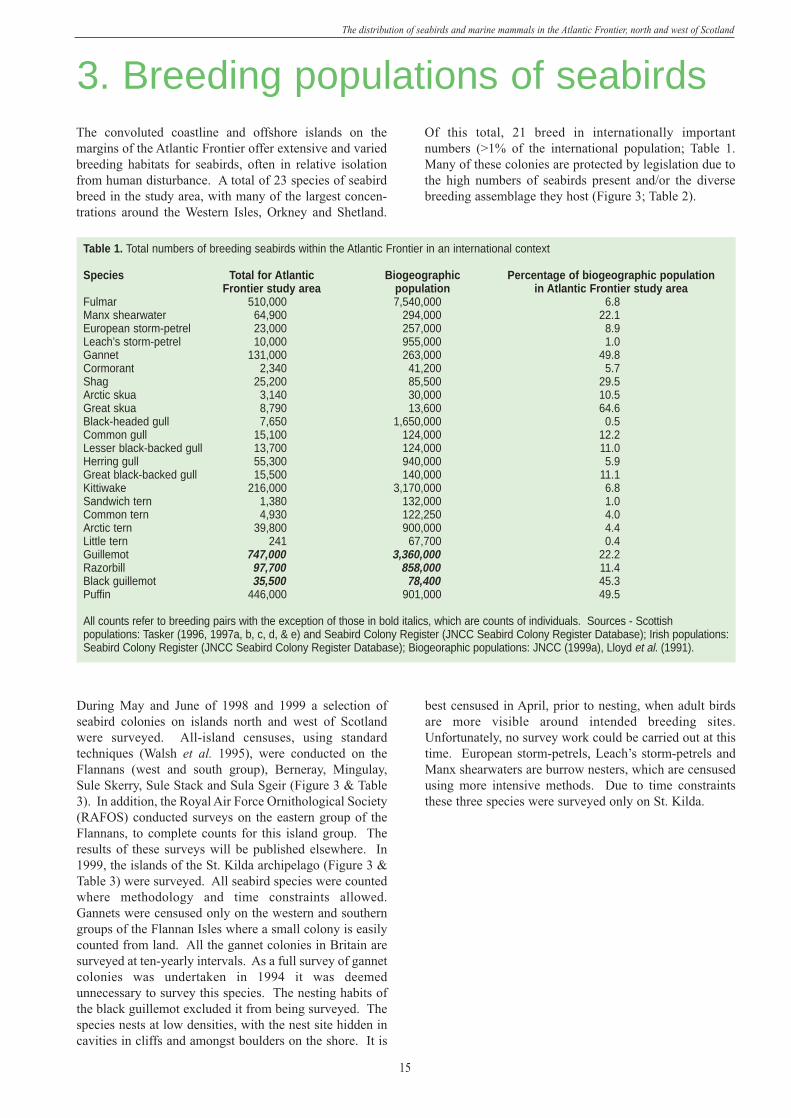
Table 1. Total numbers of breeding seabirds within the Atlantic Frontier in an international context
Species Total for Atlantic Biogeographic Percentage of biogeographic populationFrontier study area population in Atlantic Frontier study area
Fulmar 510,000 7,540,000 6.8Manx shearwater 64,900 294,000 22.1European storm-petrel 23,000 257,000 8.9Leach’s storm-petrel 10,000 955,000 1.0Gannet 131,000 263,000 49.8Cormorant 2,340 41,200 5.7Shag 25,200 85,500 29.5Arctic skua 3,140 30,000 10.5Great skua 8,790 13,600 64.6Black-headed gull 7,650 1,650,000 0.5Common gull 15,100 124,000 12.2Lesser black-backed gull 13,700 124,000 11.0Herring gull 55,300 940,000 5.9Great black-backed gull 15,500 140,000 11.1Kittiwake 216,000 3,170,000 6.8Sandwich tern 1,380 132,000 1.0Common tern 4,930 122,250 4.0Arctic tern 39,800 900,000 4.4Little tern 241 67,700 0.4Guillemot 747,000 3,360,000 22.2Razorbill 97,700 858,000 11.4Black guillemot 35,500 78,400 45.3Puffin 446,000 901,000 49.5
All counts refer to breeding pairs with the exception of those in bold italics, which are counts of individuals. Sources - Scottishpopulations: Tasker (1996, 1997a, b, c, d, & e) and Seabird Colony Register (JNCC Seabird Colony Register Database); Irish populations:Seabird Colony Register (JNCC Seabird Colony Register Database); Biogeoraphic populations: JNCC (1999a), Lloyd et al. (1991).
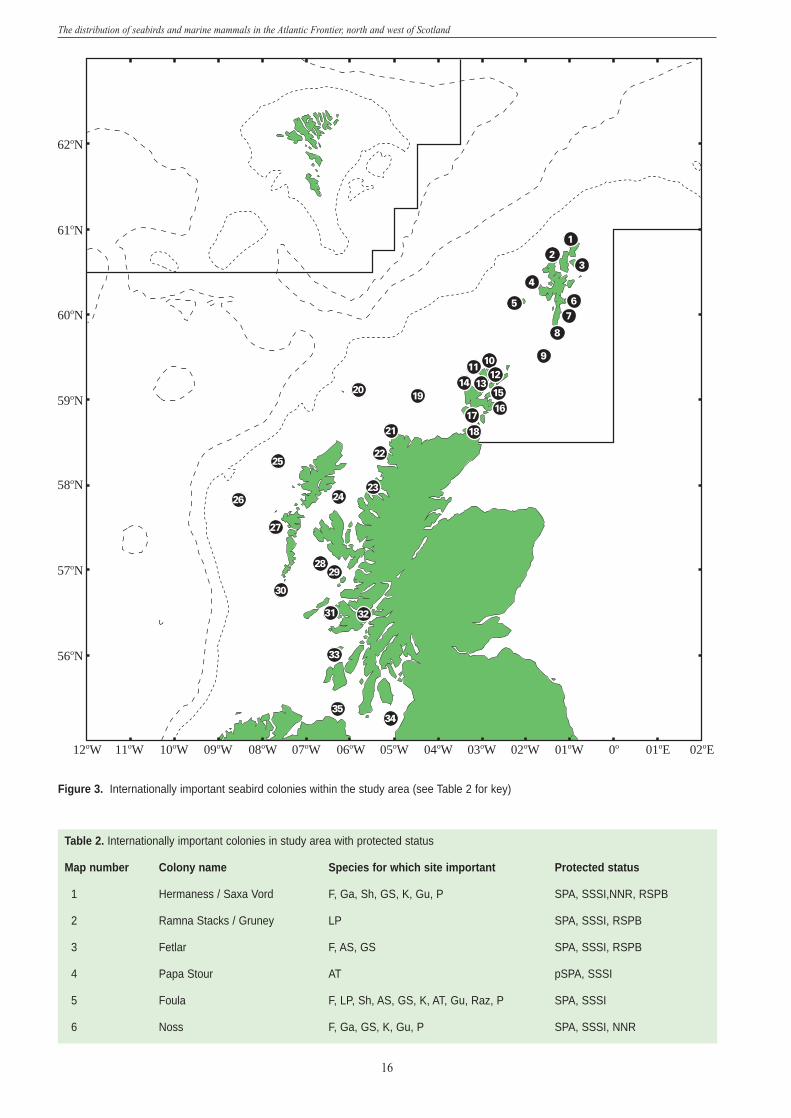
The convoluted coastline and offshore islands on themargins of the Atlantic Frontier offer extensive and variedbreeding habitats for seabirds, often in relative isolationfrom human disturbance. A total of 23 species of seabirdbreed in the study area, with many of the largest concen-trations around the Western Isles, Orkney and Shetland.
Of this total, 21 breed in internationally importantnumbers (>1% of the international population; Table 1.Many of these colonies are protected by legislation due tothe high numbers of seabirds present and/or the diversebreeding assemblage they host (Figure 3; Table 2).
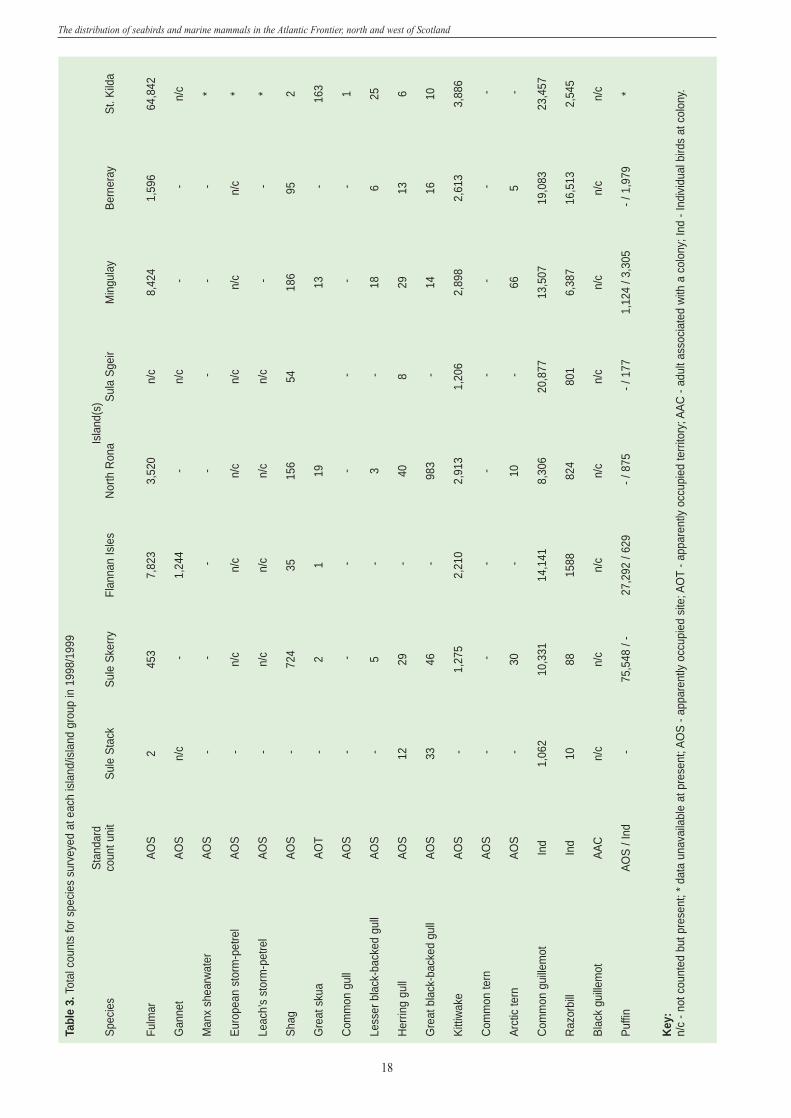
During May and June of 1998 and 1999 a selection ofseabird colonies on islands north and west of Scotlandwere surveyed. All-island censuses, using standardtechniques (Walsh et al. 1995), were conducted on theFlannans (west and south group), Berneray, Mingulay,Sule Skerry, Sule Stack and Sula Sgeir (Figure 3 & Table3). In addition, the Royal Air Force Ornithological Society(RAFOS) conducted surveys on the eastern group of theFlannans, to complete counts for this island group. Theresults of these surveys will be published elsewhere. In1999, the islands of the St. Kilda archipelago (Figure 3 &Table 3) were surveyed. All seabird species were countedwhere methodology and time constraints allowed.Gannets were censused only on the western and southerngroups of the Flannan Isles where a small colony is easilycounted from land. All the gannet colonies in Britain aresurveyed at ten-yearly intervals. As a full survey of gannetcolonies was undertaken in 1994 it was deemedunnecessary to survey this species. The nesting habits ofthe black guillemot excluded it from being surveyed. Thespecies nests at low densities, with the nest site hidden incavities in cliffs and amongst boulders on the shore. It is
best censused in April, prior to nesting, when adult birdsare more visible around intended breeding sites.Unfortunately, no survey work could be carried out at thistime. European storm-petrels, Leach’s storm-petrels andManx shearwaters are burrow nesters, which are censusedusing more intensive methods. Due to time constraintsthese three species were surveyed only on St. Kilda.
61oN
59oN
58oN
57oN
56oN
60oN
62oN
05oW 02oE01oE0o01oW02oW06oW 03oW07oW08oW09oW10oW11oW12oW 04oW
21
5 6
4
20
7
3
19
10
8
911
121314
1516
17
1821
22
2324
25
26
27
2829
30
31 32
33
3435
16
The distribution of seabirds and marine mammals in the Atlantic Frontier, north and west of Scotland
Figure 3. Internationally important seabird colonies within the study area (see Table 2 for key)
Table 2. Internationally important colonies in study area with protected status
Map number Colony name Species for which site important Protected status
1 Hermaness / Saxa Vord F, Ga, Sh, GS, K, Gu, P SPA, SSSI,NNR, RSPB
2 Ramna Stacks / Gruney LP SPA, SSSI, RSPB
3 Fetlar F, AS, GS SPA, SSSI, RSPB
4 Papa Stour AT pSPA, SSSI
5 Foula F, LP, Sh, AS, GS, K, AT, Gu, Raz, P SPA, SSSI
6 Noss F, Ga, GS, K, Gu, P SPA, SSSI, NNR
17
The distribution of seabirds and marine mammals in the Atlantic Frontier, north and west of Scotland
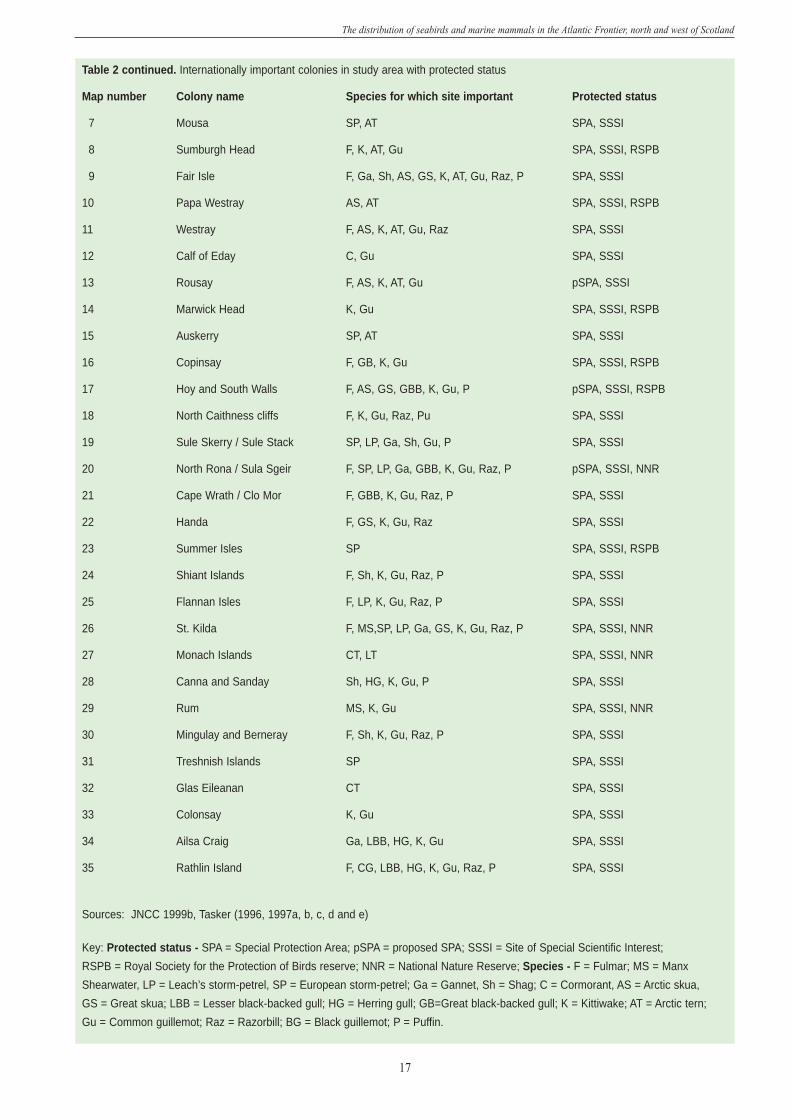
Table 2 continued. Internationally important colonies in study area with protected status
Map number Colony name Species for which site important Protected status
7 Mousa SP, AT SPA, SSSI
8 Sumburgh Head F, K, AT, Gu SPA, SSSI, RSPB
9 Fair Isle F, Ga, Sh, AS, GS, K, AT, Gu, Raz, P SPA, SSSI
10 Papa Westray AS, AT SPA, SSSI, RSPB
11 Westray F, AS, K, AT, Gu, Raz SPA, SSSI
12 Calf of Eday C, Gu SPA, SSSI
13 Rousay F, AS, K, AT, Gu pSPA, SSSI
14 Marwick Head K, Gu SPA, SSSI, RSPB
15 Auskerry SP, AT SPA, SSSI
16 Copinsay F, GB, K, Gu SPA, SSSI, RSPB
17 Hoy and South Walls F, AS, GS, GBB, K, Gu, P pSPA, SSSI, RSPB
18 North Caithness cliffs F, K, Gu, Raz, Pu SPA, SSSI
19 Sule Skerry / Sule Stack SP, LP, Ga, Sh, Gu, P SPA, SSSI
20 North Rona / Sula Sgeir F, SP, LP, Ga, GBB, K, Gu, Raz, P pSPA, SSSI, NNR
21 Cape Wrath / Clo Mor F, GBB, K, Gu, Raz, P SPA, SSSI
22 Handa F, GS, K, Gu, Raz SPA, SSSI
23 Summer Isles SP SPA, SSSI, RSPB
24 Shiant Islands F, Sh, K, Gu, Raz, P SPA, SSSI
25 Flannan Isles F, LP, K, Gu, Raz, P SPA, SSSI
26 St. Kilda F, MS,SP, LP, Ga, GS, K, Gu, Raz, P SPA, SSSI, NNR
27 Monach Islands CT, LT SPA, SSSI, NNR
28 Canna and Sanday Sh, HG, K, Gu, P SPA, SSSI
29 Rum MS, K, Gu SPA, SSSI, NNR
30 Mingulay and Berneray F, Sh, K, Gu, Raz, P SPA, SSSI
31 Treshnish Islands SP SPA, SSSI
32 Glas Eileanan CT SPA, SSSI
33 Colonsay K, Gu SPA, SSSI
34 Ailsa Craig Ga, LBB, HG, K, Gu SPA, SSSI
35 Rathlin Island F, CG, LBB, HG, K, Gu, Raz, P SPA, SSSI
Sources: JNCC 1999b, Tasker (1996, 1997a, b, c, d and e)
Key: Protected status - SPA = Special Protection Area; pSPA = proposed SPA; SSSI = Site of Special Scientific Interest;
RSPB = Royal Society for the Protection of Birds reserve; NNR = National Nature Reserve; Species - F = Fulmar; MS = Manx
Shearwater, LP = Leach’s storm-petrel, SP = European storm-petrel; Ga = Gannet, Sh = Shag; C = Cormorant, AS = Arctic skua,
GS = Great skua; LBB = Lesser black-backed gull; HG = Herring gull; GB=Great black-backed gull; K = Kittiwake; AT = Arctic tern;
Gu = Common guillemot; Raz = Razorbill; BG = Black guillemot; P = Puffin.
18
The distribution of seabirds and marine mammals in the Atlantic Frontier, north and west of Scotland
Tabl
e 3.
Tota
l cou
nts
for s
peci
es s
urve
yed
at e
ach
isla
nd/is
land
gro
up in
199
8/19
99
Sta
ndar
dIs
land
(s)
Spe
cies
coun
t uni
tS
ule
Sta
ckS
ule
Ske
rry
Flan
nan
Isle
sN
orth
Ron
aS
ula
Sge
irM
ingu
lay
Ber
nera
yS
t. K
ilda
Fulm
arA
OS
245
37,
823
3,52
0n/
c8,
424
1,59
664
,842
Gan
net
AO
Sn/
c-
1,24
4-
n/c
- -
n/c
Man
x sh
earw
ater
AO
S-
- -
--
- -
*
Eur
opea
n st
orm
-pet
rel
AO
S-
n/c
n/c
n/c
n/c
n/c
n/c
*
Leac
h’s
stor
m-p
etre
lA
OS
- n/
cn/
cn/
cn/
c-
- *
Sha
gA
OS
- 72
435
156
5418
695
2
Gre
at s
kua
AO
T-
21
1913
- 16
3
Com
mon
gul
lA
OS
- -
- -
- -
- 1
Less
er b
lack
-bac
ked
gull
AO
S-
5-
3-
186
25
Her
ring
gull
AO
S12
29-
408
2913
6
Gre
at b
lack
-bac
ked
gull
AO
S33
46-
983
- 14
1610
Kitt
iwak
eA
OS
- 1,
275
2,21
02,
913
1,20
62,
898
2,61
33,
886
Com
mon
tern
AO
S-
- -
--
- -
-
Arc
tic te
rnA
OS
- 30
- 10
- 66
5-
Com
mon
gui
llem
otIn
d1,
062
10,3
3114
,141
8,30
620
,877
13,5
0719
,083
23,4
57
Raz
orbi
llIn
d10
8815
8882
480
16,
387
16,5
132,
545
Bla
ck g
uille
mot
AA
Cn/
cn/
cn/
cn/
cn/
cn/
cn/
cn/
c
Puf
finA
OS
/ In
d-
75,5
48 /
- 27
,292
/ 62
9 - /
875
- / 1
771,
124
/ 3,3
05- /
1,9
79*
Key
:n/
c - n
ot c
ount
ed b
ut p
rese
nt; *
dat
a un
avai
labl
e at
pre
sent
; AO
S -
appa
rent
ly o
ccup
ied
site
; AO
T- a
ppar
ently
occ
upie
d te
rrito
ry; A
AC
- ad
ult a
ssoc
iate
d w
ith a
col
ony;
Ind
- Ind
ivid
ual b
irds
at c
olon
y.
19
The distribution of seabirds and marine mammals in the Atlantic Frontier, north and west of Scotland
4. Methods4.1 Study Area
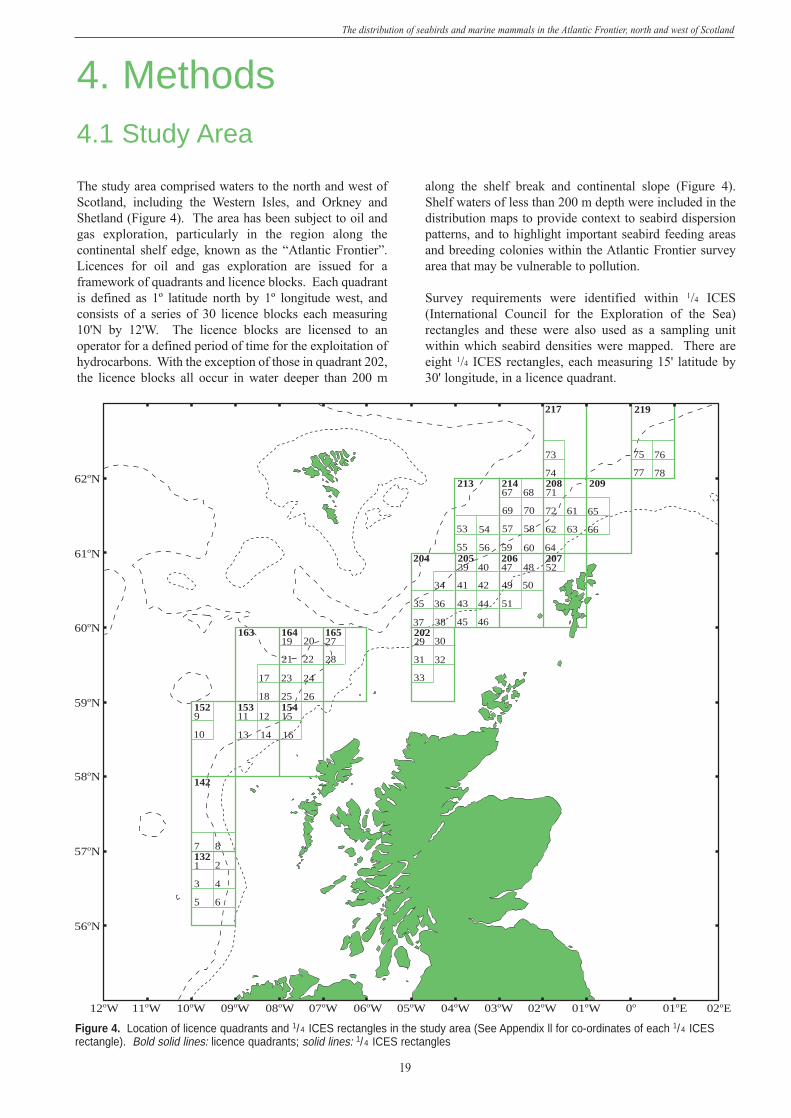
The study area comprised waters to the north and west ofScotland, including the Western Isles, and Orkney andShetland (Figure 4). The area has been subject to oil andgas exploration, particularly in the region along thecontinental shelf edge, known as the “Atlantic Frontier”.Licences for oil and gas exploration are issued for aframework of quadrants and licence blocks. Each quadrantis defined as 1º latitude north by 1º longitude west, andconsists of a series of 30 licence blocks each measuring10'N by 12'W. The licence blocks are licensed to anoperator for a defined period of time for the exploitation ofhydrocarbons. With the exception of those in quadrant 202,the licence blocks all occur in water deeper than 200 m
along the shelf break and continental slope (Figure 4).Shelf waters of less than 200 m depth were included in thedistribution maps to provide context to seabird dispersionpatterns, and to highlight important seabird feeding areasand breeding colonies within the Atlantic Frontier surveyarea that may be vulnerable to pollution.
Survey requirements were identified within 1/4 ICES(International Council for the Exploration of the Sea)rectangles and these were also used as a sampling unitwithin which seabird densities were mapped. There areeight 1/4 ICES rectangles, each measuring 15' latitude by30' longitude, in a licence quadrant.
217
36
21467
213 20871
209
20539
204 20647
20752
20229
16419
163 16527
15311
1529
15415
142
7
282221
242317
262518
161413
12
10
20
8
2
43
65
1321
73
74
75
77
76
78
61
63
65
66
70
58
72
62
69
5753
55
54
56 59 60 64
68
4840
4241
43 44
5049
51
34
35
46453837
30
31 32
33
219
61oN
59oN
58oN
57oN
56oN
60oN
62oN
05oW 02oE01oE0o01oW02oW06oW 03oW07oW08oW09oW10oW11oW12oW 04oW
Figure 4. Location of licence quadrants and 1/ 4 ICES rectangles in the study area (See Appendix ll for co-ordinates of each 1/ 4 ICESrectangle). Bold solid lines: licence quadrants; solid lines: 1/ 4 ICES rectangles
20
The distribution of seabirds and marine mammals in the Atlantic Frontier, north and west of Scotland
4.3 Data AnalysisAll data in the ESAS database for the Atlantic Frontierstudy area were used in the analysis. Data collectionmethods between ESAS members vary slightly, such asthe number of observers and use of binoculars fordetecting birds, but all data have been considered together.
4.3.1 Ship-based surveys
Observations of seabirds and marine mammals madeduring ship-based surveys were primarily recorded usingpaper forms. The data were subsequently coded andentered onto computer for analysis. Coded data werechecked manually by an independent person. During thepreparation of data for map production, data were groupedto obtain a total number of birds for each 10 min period ofthe survey. These totals were used to calculate densitiesand prepare sightings and abundance maps. Whencalculating seabird densities only the number of birdswithin 300 m of the ship’s track, either on the water orflying ‘in snapshot’, were used.
4.3.2 Aircraft surveys
Observations made during aircraft surveys were initiallyrecorded into a tape recorder, and were later transcribed to
paper recording forms. Data were coded, entered ontocomputer database and subsequently calculated as numberof birds seen per one minute survey period.
4.3.3 Correction factors
Correction factors were applied to birds on the water toaccount for variations in detectability at differentdistances from the ship’s trackline (Table 4). Asmentioned, birds on the water were recorded in one offour distance bands (A= <50 m, B= 51 m-100m, C= 101-200 m, D= 201-300 m). Correction factors werecalculated using the following formula:
(nA + nB) x 3(nA + nB + nC + nD)
where nA, nB, nC and nD equal the number of birdsrecorded on the water in the respective transect bands(Tasker et al. 1987). Two correction factors werecalculated depending on transect width (200 or 300 m).
Only data from the study area and not the entire ESASdatabase were used to calculate correction factors.Correction factors were not calculated for uncommonspecies (those with a sample of less than 1,000 birds
4.2 Seabird and marine mammal survey methods4.2.1 Ship-based surveys
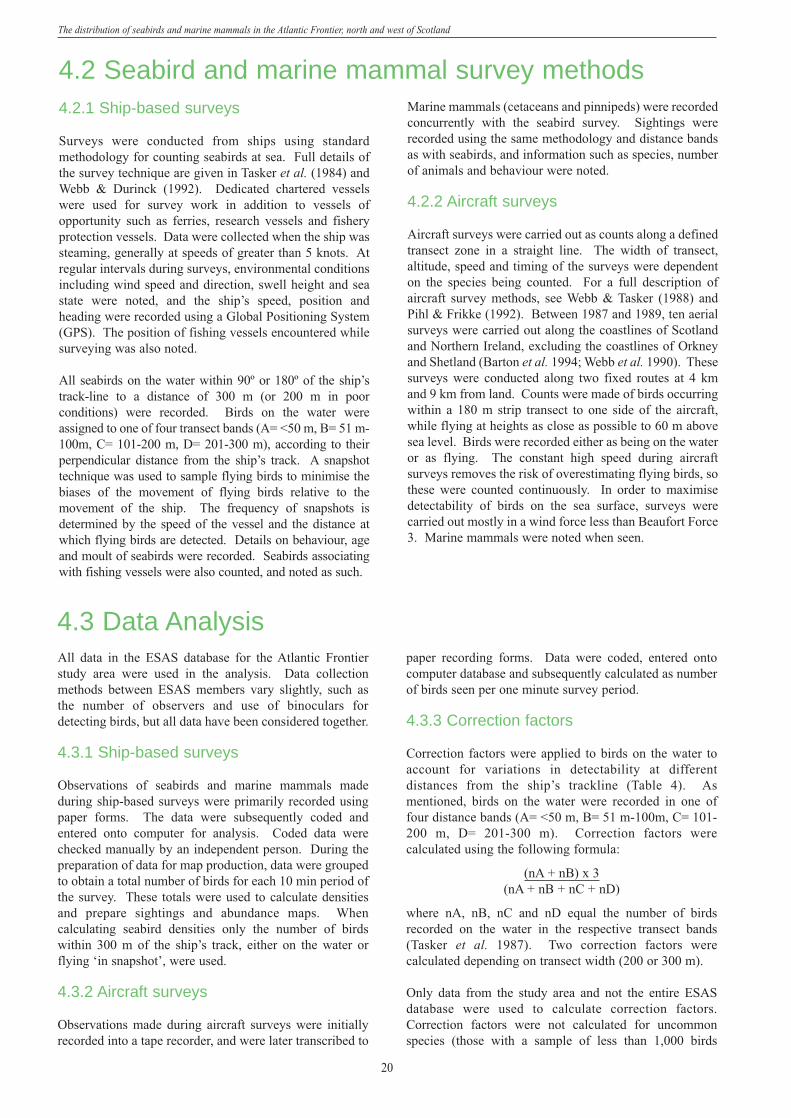
Surveys were conducted from ships using standardmethodology for counting seabirds at sea. Full details ofthe survey technique are given in Tasker et al. (1984) andWebb & Durinck (1992). Dedicated chartered vesselswere used for survey work in addition to vessels ofopportunity such as ferries, research vessels and fisheryprotection vessels. Data were collected when the ship wassteaming, generally at speeds of greater than 5 knots. Atregular intervals during surveys, environmental conditionsincluding wind speed and direction, swell height and seastate were noted, and the ship’s speed, position andheading were recorded using a Global Positioning System(GPS). The position of fishing vessels encountered whilesurveying was also noted.
All seabirds on the water within 90º or 180º of the ship’strack-line to a distance of 300 m (or 200 m in poorconditions) were recorded. Birds on the water wereassigned to one of four transect bands (A= <50 m, B= 51 m-100m, C= 101-200 m, D= 201-300 m), according to theirperpendicular distance from the ship’s track. A snapshottechnique was used to sample flying birds to minimise thebiases of the movement of flying birds relative to themovement of the ship. The frequency of snapshots isdetermined by the speed of the vessel and the distance atwhich flying birds are detected. Details on behaviour, ageand moult of seabirds were recorded. Seabirds associatingwith fishing vessels were also counted, and noted as such.
Marine mammals (cetaceans and pinnipeds) were recordedconcurrently with the seabird survey. Sightings wererecorded using the same methodology and distance bandsas with seabirds, and information such as species, numberof animals and behaviour were noted.
4.2.2 Aircraft surveys
Aircraft surveys were carried out as counts along a definedtransect zone in a straight line. The width of transect,altitude, speed and timing of the surveys were dependenton the species being counted. For a full description ofaircraft survey methods, see Webb & Tasker (1988) andPihl & Frikke (1992). Between 1987 and 1989, ten aerialsurveys were carried out along the coastlines of Scotlandand Northern Ireland, excluding the coastlines of Orkneyand Shetland (Barton et al. 1994; Webb et al. 1990). Thesesurveys were conducted along two fixed routes at 4 kmand 9 km from land. Counts were made of birds occurringwithin a 180 m strip transect to one side of the aircraft,while flying at heights as close as possible to 60 m abovesea level. Birds were recorded either as being on the wateror as flying. The constant high speed during aircraftsurveys removes the risk of overestimating flying birds, sothese were counted continuously. In order to maximisedetectability of birds on the sea surface, surveys werecarried out mostly in a wind force less than Beaufort Force3. Marine mammals were noted when seen.
21
The distribution of seabirds and marine mammals in the Atlantic Frontier, north and west of Scotland
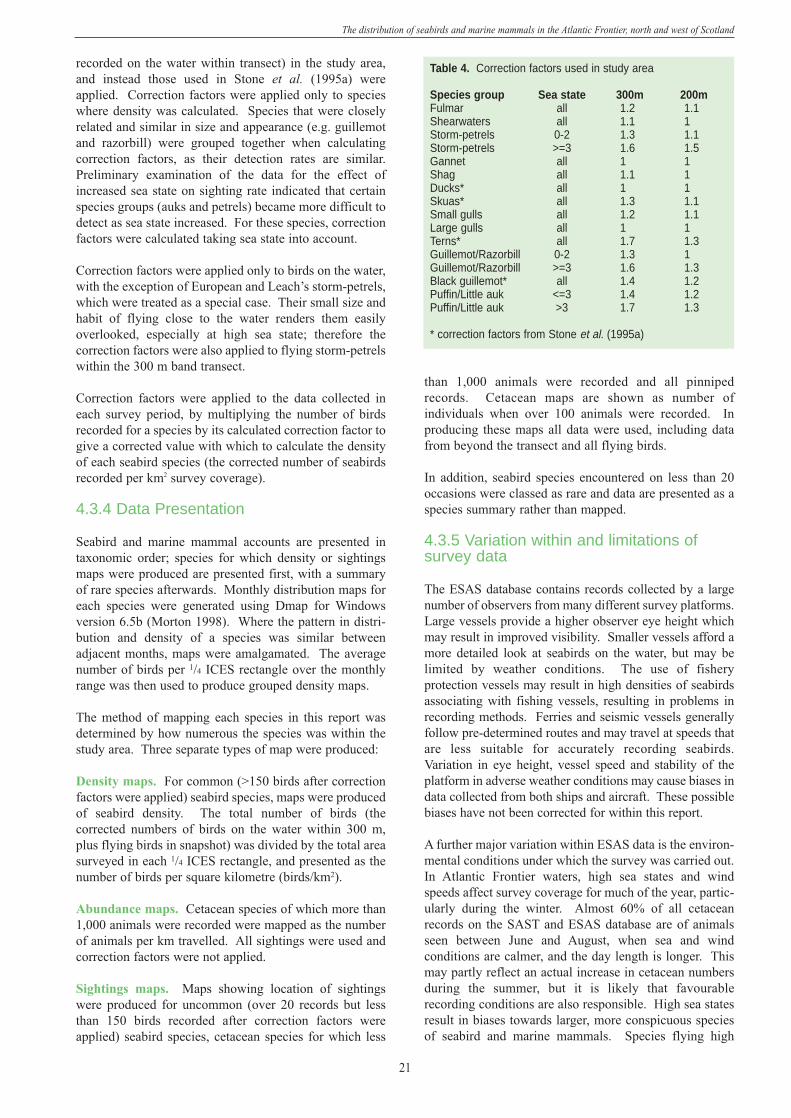
Table 4. Correction factors used in study area
Species group Sea state 300m 200mFulmar all 1.2 1.1Shearwaters all 1.1 1Storm-petrels 0-2 1.3 1.1Storm-petrels >=3 1.6 1.5Gannet all 1 1Shag all 1.1 1Ducks* all 1 1Skuas* all 1.3 1.1Small gulls all 1.2 1.1Large gulls all 1 1Terns* all 1.7 1.3Guillemot/Razorbill 0-2 1.3 1Guillemot/Razorbill >=3 1.6 1.3Black guillemot* all 1.4 1.2Puffin/Little auk <=3 1.4 1.2Puffin/Little auk >3 1.7 1.3
* correction factors from Stone et al. (1995a)
recorded on the water within transect) in the study area,and instead those used in Stone et al. (1995a) wereapplied. Correction factors were applied only to specieswhere density was calculated. Species that were closelyrelated and similar in size and appearance (e.g. guillemotand razorbill) were grouped together when calculatingcorrection factors, as their detection rates are similar.Preliminary examination of the data for the effect ofincreased sea state on sighting rate indicated that certainspecies groups (auks and petrels) became more difficult todetect as sea state increased. For these species, correctionfactors were calculated taking sea state into account.
Correction factors were applied only to birds on the water,with the exception of European and Leach’s storm-petrels,which were treated as a special case. Their small size andhabit of flying close to the water renders them easilyoverlooked, especially at high sea state; therefore thecorrection factors were also applied to flying storm-petrelswithin the 300 m band transect.
Correction factors were applied to the data collected ineach survey period, by multiplying the number of birdsrecorded for a species by its calculated correction factor togive a corrected value with which to calculate the densityof each seabird species (the corrected number of seabirdsrecorded per km2 survey coverage).
4.3.4 Data Presentation
Seabird and marine mammal accounts are presented intaxonomic order; species for which density or sightingsmaps were produced are presented first, with a summaryof rare species afterwards. Monthly distribution maps foreach species were generated using Dmap for Windowsversion 6.5b (Morton 1998). Where the pattern in distri-bution and density of a species was similar betweenadjacent months, maps were amalgamated. The averagenumber of birds per 1/4 ICES rectangle over the monthlyrange was then used to produce grouped density maps.
The method of mapping each species in this report wasdetermined by how numerous the species was within thestudy area. Three separate types of map were produced:
Density maps. For common (>150 birds after correctionfactors were applied) seabird species, maps were producedof seabird density. The total number of birds (thecorrected numbers of birds on the water within 300 m,plus flying birds in snapshot) was divided by the total areasurveyed in each 1/4 ICES rectangle, and presented as thenumber of birds per square kilometre (birds/km2).
Abundance maps. Cetacean species of which more than1,000 animals were recorded were mapped as the numberof animals per km travelled. All sightings were used andcorrection factors were not applied.
Sightings maps. Maps showing location of sightingswere produced for uncommon (over 20 records but lessthan 150 birds recorded after correction factors wereapplied) seabird species, cetacean species for which less
than 1,000 animals were recorded and all pinnipedrecords. Cetacean maps are shown as number ofindividuals when over 100 animals were recorded. Inproducing these maps all data were used, including datafrom beyond the transect and all flying birds.
In addition, seabird species encountered on less than 20occasions were classed as rare and data are presented as aspecies summary rather than mapped.
4.3.5 Variation within and limitations ofsurvey data
The ESAS database contains records collected by a largenumber of observers from many different survey platforms.Large vessels provide a higher observer eye height whichmay result in improved visibility. Smaller vessels afford amore detailed look at seabirds on the water, but may belimited by weather conditions. The use of fisheryprotection vessels may result in high densities of seabirdsassociating with fishing vessels, resulting in problems inrecording methods. Ferries and seismic vessels generallyfollow pre-determined routes and may travel at speeds thatare less suitable for accurately recording seabirds.Variation in eye height, vessel speed and stability of theplatform in adverse weather conditions may cause biases indata collected from both ships and aircraft. These possiblebiases have not been corrected for within this report.
A further major variation within ESAS data is the environ-mental conditions under which the survey was carried out.In Atlantic Frontier waters, high sea states and windspeeds affect survey coverage for much of the year, partic-ularly during the winter. Almost 60% of all cetaceanrecords on the SAST and ESAS database are of animalsseen between June and August, when sea and windconditions are calmer, and the day length is longer. Thismay partly reflect an actual increase in cetacean numbersduring the summer, but it is likely that favourablerecording conditions are also responsible. High sea statesresult in biases towards larger, more conspicuous speciesof seabird and marine mammals. Species flying high
22
The distribution of seabirds and marine mammals in the Atlantic Frontier, north and west of Scotland
4.4 Survey Coverage
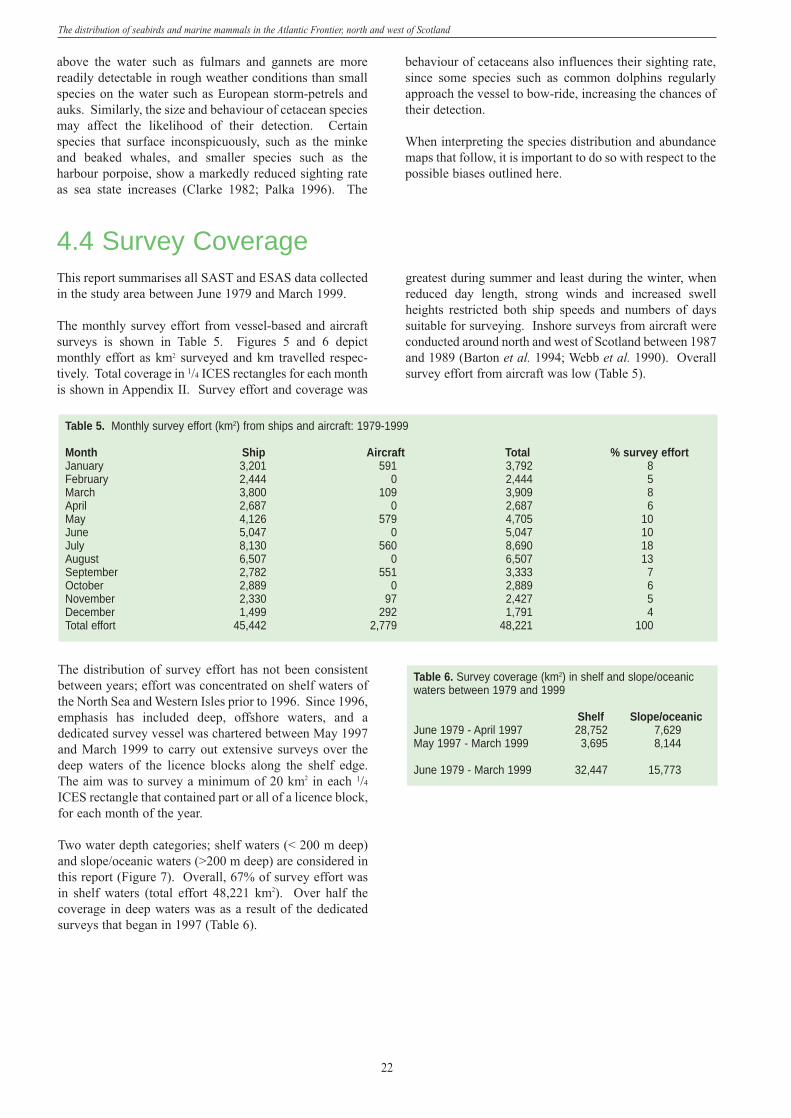
Table 5. Monthly survey effort (km2) from ships and aircraft: 1979-1999
Month Ship Aircraft Total % survey effortJanuary 3,201 591 3,792 8February 2,444 0 2,444 5March 3,800 109 3,909 8April 2,687 0 2,687 6May 4,126 579 4,705 10June 5,047 0 5,047 10July 8,130 560 8,690 18August 6,507 0 6,507 13September 2,782 551 3,333 7October 2,889 0 2,889 6November 2,330 97 2,427 5December 1,499 292 1,791 4Total effort 45,442 2,779 48,221 100
above the water such as fulmars and gannets are morereadily detectable in rough weather conditions than smallspecies on the water such as European storm-petrels andauks. Similarly, the size and behaviour of cetacean speciesmay affect the likelihood of their detection. Certainspecies that surface inconspicuously, such as the minkeand beaked whales, and smaller species such as theharbour porpoise, show a markedly reduced sighting rateas sea state increases (Clarke 1982; Palka 1996). The
behaviour of cetaceans also influences their sighting rate,since some species such as common dolphins regularlyapproach the vessel to bow-ride, increasing the chances oftheir detection.
When interpreting the species distribution and abundancemaps that follow, it is important to do so with respect to thepossible biases outlined here.
This report summarises all SAST and ESAS data collectedin the study area between June 1979 and March 1999.
The monthly survey effort from vessel-based and aircraftsurveys is shown in Table 5. Figures 5 and 6 depictmonthly effort as km2 surveyed and km travelled respec-tively. Total coverage in 1/4 ICES rectangles for each monthis shown in Appendix II. Survey effort and coverage was
greatest during summer and least during the winter, whenreduced day length, strong winds and increased swellheights restricted both ship speeds and numbers of dayssuitable for surveying. Inshore surveys from aircraft wereconducted around north and west of Scotland between 1987and 1989 (Barton et al. 1994; Webb et al. 1990). Overallsurvey effort from aircraft was low (Table 5).
The distribution of survey effort has not been consistentbetween years; effort was concentrated on shelf waters ofthe North Sea and Western Isles prior to 1996. Since 1996,emphasis has included deep, offshore waters, and adedicated survey vessel was chartered between May 1997and March 1999 to carry out extensive surveys over thedeep waters of the licence blocks along the shelf edge.The aim was to survey a minimum of 20 km2 in each 1/4
ICES rectangle that contained part or all of a licence block,for each month of the year.
Two water depth categories; shelf waters (< 200 m deep)and slope/oceanic waters (>200 m deep) are considered inthis report (Figure 7). Overall, 67% of survey effort wasin shelf waters (total effort 48,221 km2). Over half thecoverage in deep waters was as a result of the dedicatedsurveys that began in 1997 (Table 6).
Table 6. Survey coverage (km2) in shelf and slope/oceanicwaters between 1979 and 1999
Shelf Slope/oceanicJune 1979 - April 1997 28,752 7,629May 1997 - March 1999 3,695 8,144
June 1979 - March 1999 32,447 15,773
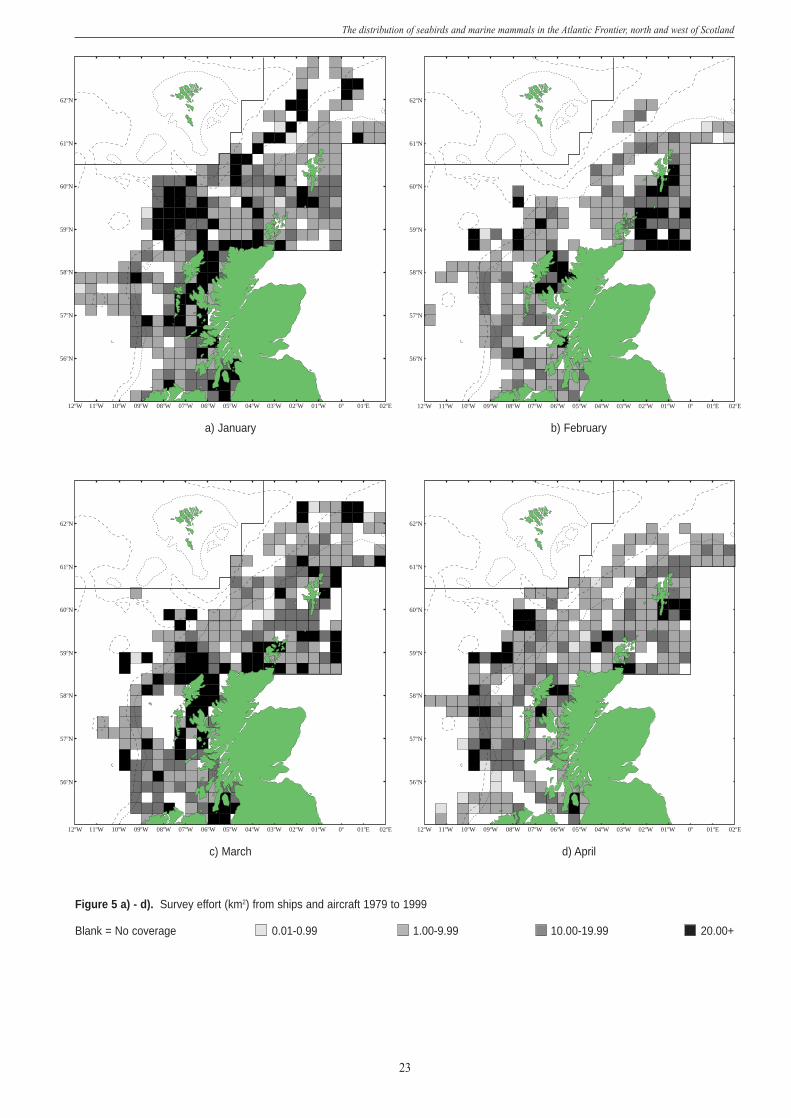
23
The distribution of seabirds and marine mammals in the Atlantic Frontier, north and west of Scotland
61oN
59oN
58oN
57oN
56oN
60oN
62oN
05oW 02oE01oE0o01oW02oW06oW 03oW07oW08oW09oW10oW11oW12oW 04oW
61oN
59oN
58oN
57oN
56oN
60oN
62oN
05oW 02oE01oE0o01oW02oW06oW 03oW07oW08oW09oW10oW11oW12oW 04oW
61oN
59oN
58oN
57oN
56oN
60oN
62oN
05oW 02oE01oE0o01oW02oW06oW 03oW07oW08oW09oW10oW11oW12oW 04oW
61oN
59oN
58oN
57oN
56oN
60oN
62oN
05oW 02oE01oE0o01oW02oW06oW 03oW07oW08oW09oW10oW11oW12oW 04oW
a) January b) February
c) March d) April
Figure 5 a) - d). Survey effort (km2) from ships and aircraft 1979 to 1999
Blank = No coverage 0.01-0.99 1.00-9.99 10.00-19.99 20.00+
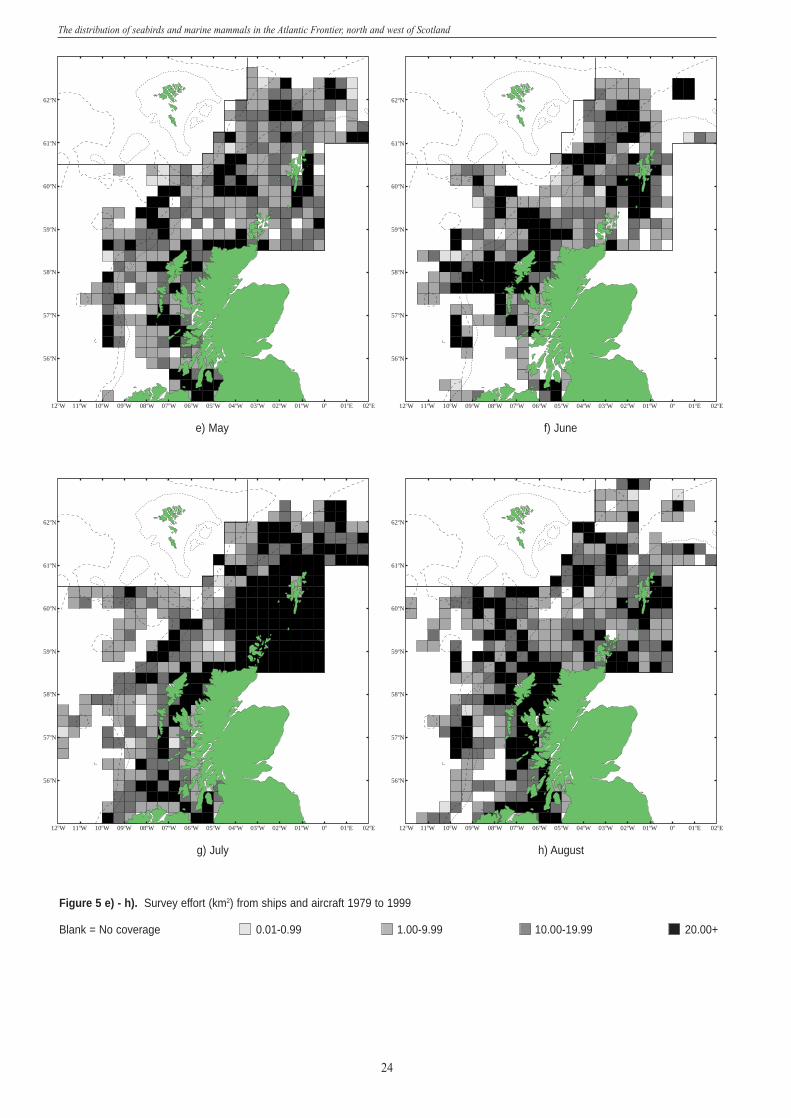
Figure 5 e) - h). Survey effort (km2) from ships and aircraft 1979 to 1999
Blank = No coverage 0.01-0.99 1.00-9.99 10.00-19.99 20.00+
24
The distribution of seabirds and marine mammals in the Atlantic Frontier, north and west of Scotland
61oN
59oN
58oN
57oN
56oN
60oN
62oN
05oW 02oE01oE0o01oW02oW06oW 03oW07oW08oW09oW10oW11oW12oW 04oW
61oN
59oN
58oN
57oN
56oN
60oN
62oN
05oW 02oE01oE0o01oW02oW06oW 03oW07oW08oW09oW10oW11oW12oW 04oW
61oN
59oN
58oN
57oN
56oN
60oN
62oN
05oW 02oE01oE0o01oW02oW06oW 03oW07oW08oW09oW10oW11oW12oW 04oW
61oN
59oN
58oN
57oN
56oN
60oN
62oN
05oW 02oE01oE0o01oW02oW06oW 03oW07oW08oW09oW10oW11oW12oW 04oW
e) May f) June
g) July h) August
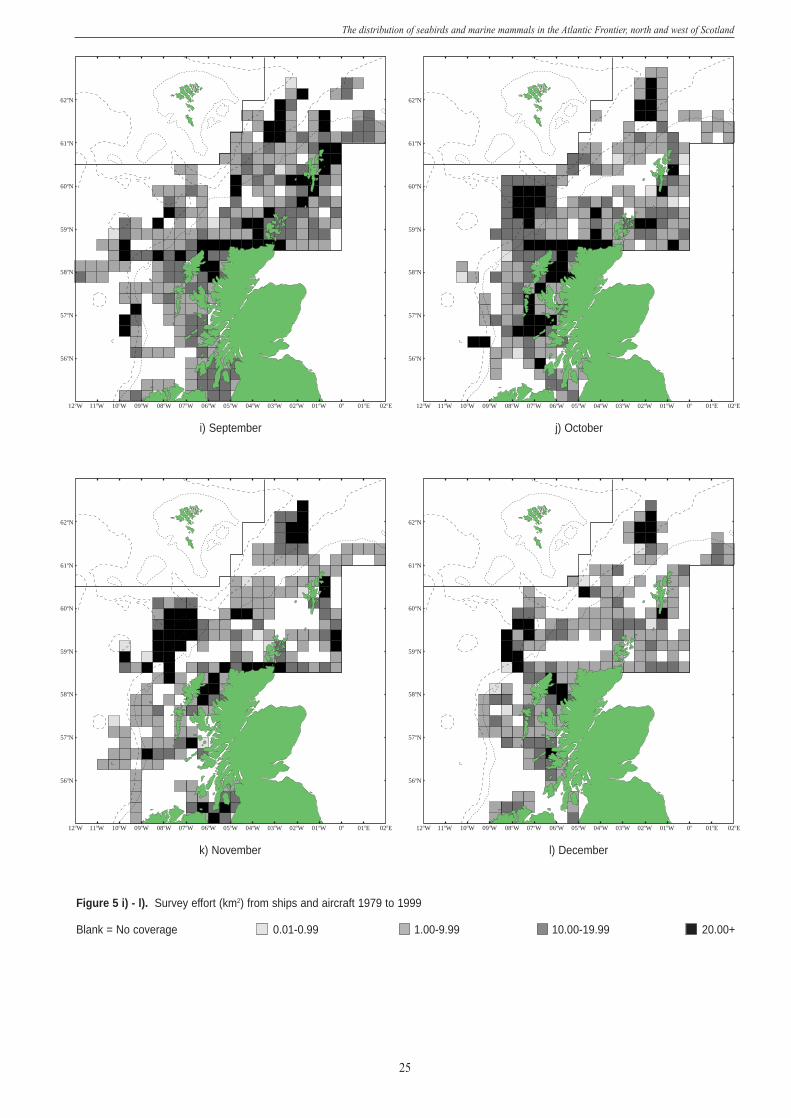
Figure 5 i) - l). Survey effort (km2) from ships and aircraft 1979 to 1999
Blank = No coverage 0.01-0.99 1.00-9.99 10.00-19.99 20.00+
25
The distribution of seabirds and marine mammals in the Atlantic Frontier, north and west of Scotland
61oN
59oN
58oN
57oN
56oN
60oN
62oN
05oW 02oE01oE0o01oW02oW06oW 03oW07oW08oW09oW10oW11oW12oW 04oW
61oN
59oN
58oN
57oN
56oN
60oN
62oN
05oW 02oE01oE0o01oW02oW06oW 03oW07oW08oW09oW10oW11oW12oW 04oW
61oN
59oN
58oN
57oN
56oN
60oN
62oN
05oW 02oE01oE0o01oW02oW06oW 03oW07oW08oW09oW10oW11oW12oW 04oW
61oN
59oN
58oN
57oN
56oN
60oN
62oN
05oW 02oE01oE0o01oW02oW06oW 03oW07oW08oW09oW10oW11oW12oW 04oW
i) September j) October
k) November l) December
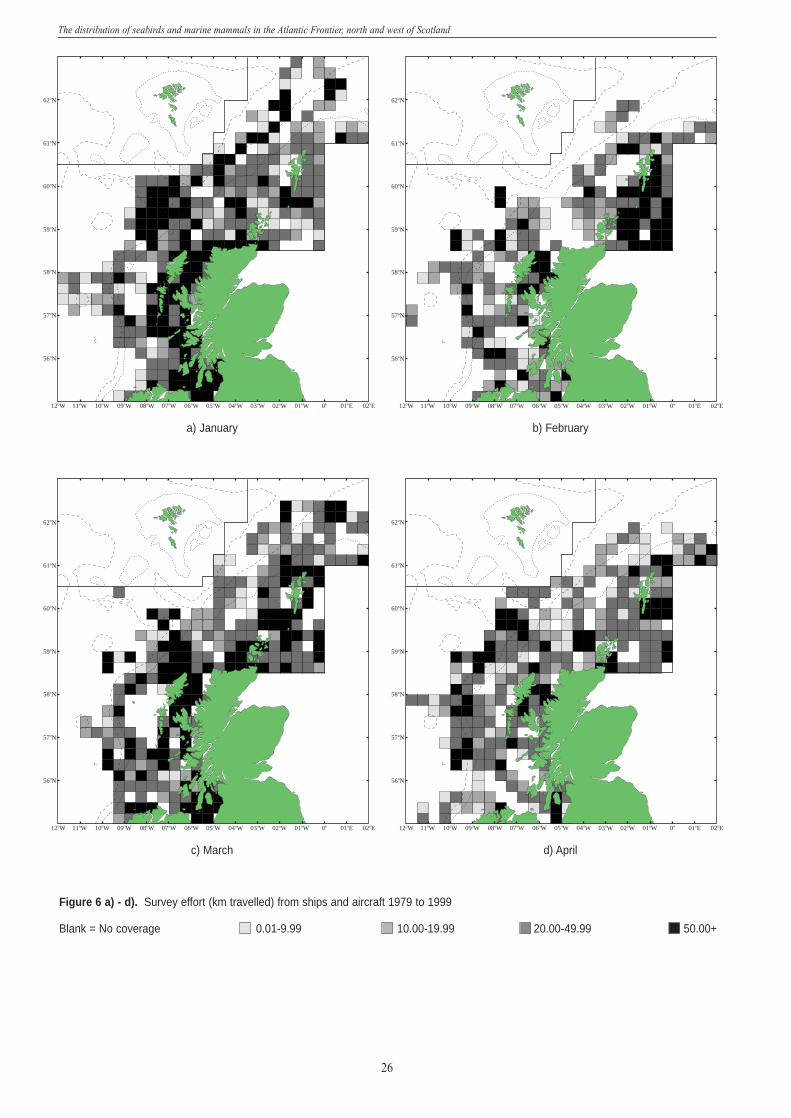
Figure 6 a) - d). Survey effort (km travelled) from ships and aircraft 1979 to 1999
Blank = No coverage 0.01-9.99 10.00-19.99 20.00-49.99 50.00+
26
The distribution of seabirds and marine mammals in the Atlantic Frontier, north and west of Scotland
61oN
59oN
58oN
57oN
56oN
60oN
62oN
05oW 02oE01oE0o01oW02oW06oW 03oW07oW08oW09oW10oW11oW12oW 04oW
61oN
59oN
58oN
57oN
56oN
60oN
62oN
05oW 02oE01oE0o01oW02oW06oW 03oW07oW08oW09oW10oW11oW12oW 04oW
61oN
59oN
58oN
57oN
56oN
60oN
62oN
05oW 02oE01oE0o01oW02oW06oW 03oW07oW08oW09oW10oW11oW12oW 04oW
61oN
59oN
58oN
57oN
56oN
60oN
62oN
05oW 02oE01oE0o01oW02oW06oW 03oW07oW08oW09oW10oW11oW12oW 04oW
a) January b) February
c) March d) April
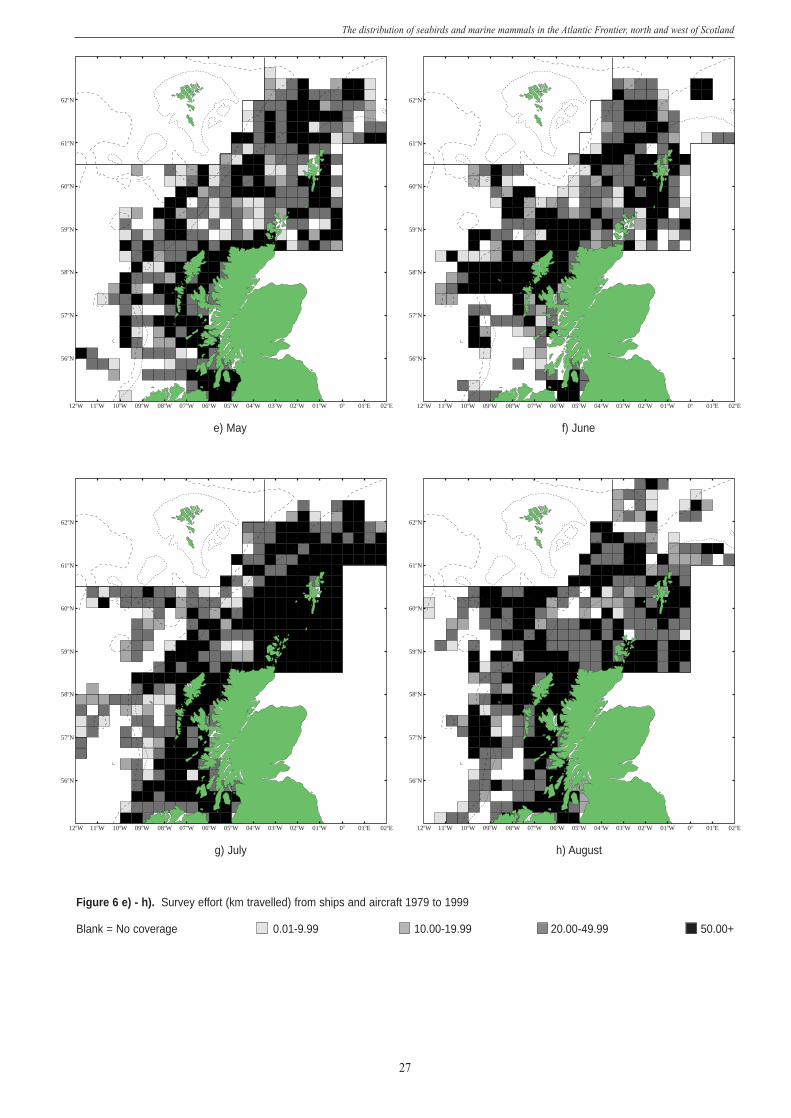
Figure 6 e) - h). Survey effort (km travelled) from ships and aircraft 1979 to 1999
Blank = No coverage 0.01-9.99 10.00-19.99 20.00-49.99 50.00+
27
The distribution of seabirds and marine mammals in the Atlantic Frontier, north and west of Scotland
61oN
59oN
58oN
57oN
56oN
60oN
62oN
05oW 02oE01oE0o01oW02oW06oW 03oW07oW08oW09oW10oW11oW12oW 04oW
61oN
59oN
58oN
57oN
56oN
60oN
62oN
05oW 02oE01oE0o01oW02oW06oW 03oW07oW08oW09oW10oW11oW12oW 04oW
61oN
59oN
58oN
57oN
56oN
60oN
62oN
05oW 02oE01oE0o01oW02oW06oW 03oW07oW08oW09oW10oW11oW12oW 04oW
61oN
59oN
58oN
57oN
56oN
60oN
62oN
05oW 02oE01oE0o01oW02oW06oW 03oW07oW08oW09oW10oW11oW12oW 04oW
e) May f) June
g) July h) August
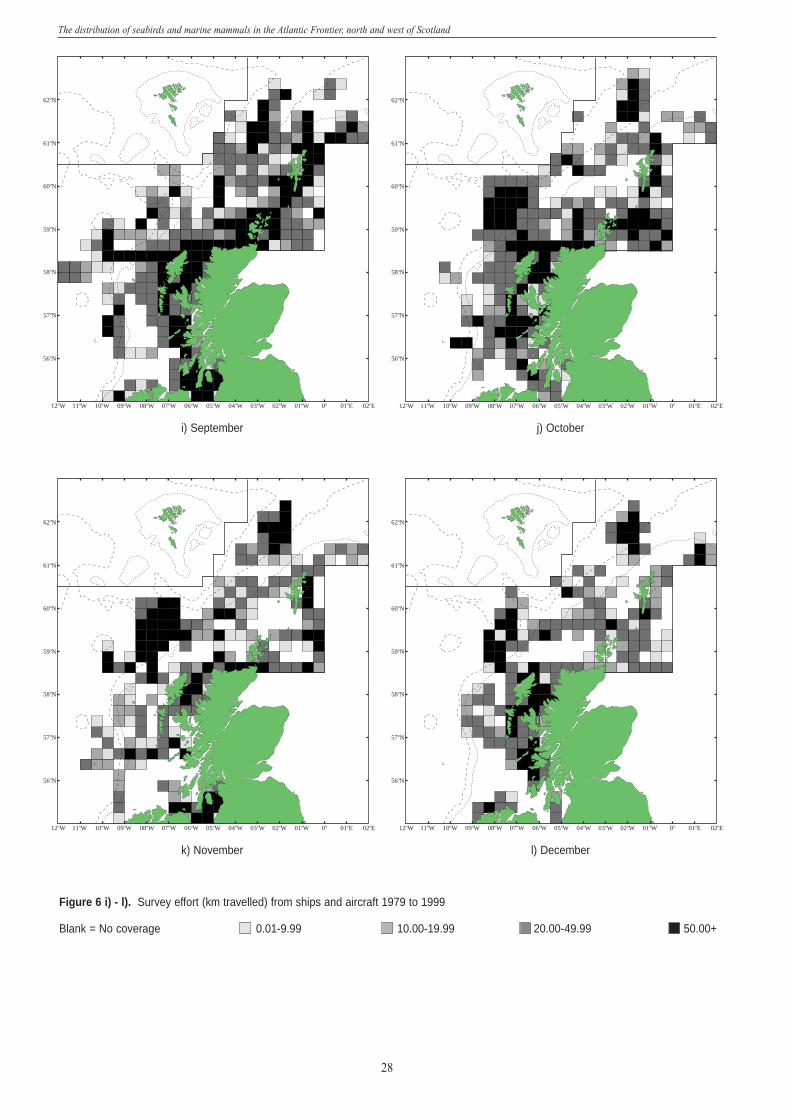
Figure 6 i) - l). Survey effort (km travelled) from ships and aircraft 1979 to 1999
Blank = No coverage 0.01-9.99 10.00-19.99 20.00-49.99 50.00+
28
The distribution of seabirds and marine mammals in the Atlantic Frontier, north and west of Scotland
61oN
59oN
58oN
57oN
56oN
60oN
62oN
05oW 02oE01oE0o01oW02oW06oW 03oW07oW08oW09oW10oW11oW12oW 04oW
61oN
59oN
58oN
57oN
56oN
60oN
62oN
05oW 02oE01oE0o01oW02oW06oW 03oW07oW08oW09oW10oW11oW12oW 04oW
61oN
59oN
58oN
57oN
56oN
60oN
62oN
05oW 02oE01oE0o01oW02oW06oW 03oW07oW08oW09oW10oW11oW12oW 04oW
61oN
59oN
58oN
57oN
56oN
60oN
62oN
05oW 02oE01oE0o01oW02oW06oW 03oW07oW08oW09oW10oW11oW12oW 04oW
i) September j) October
k) November l) December
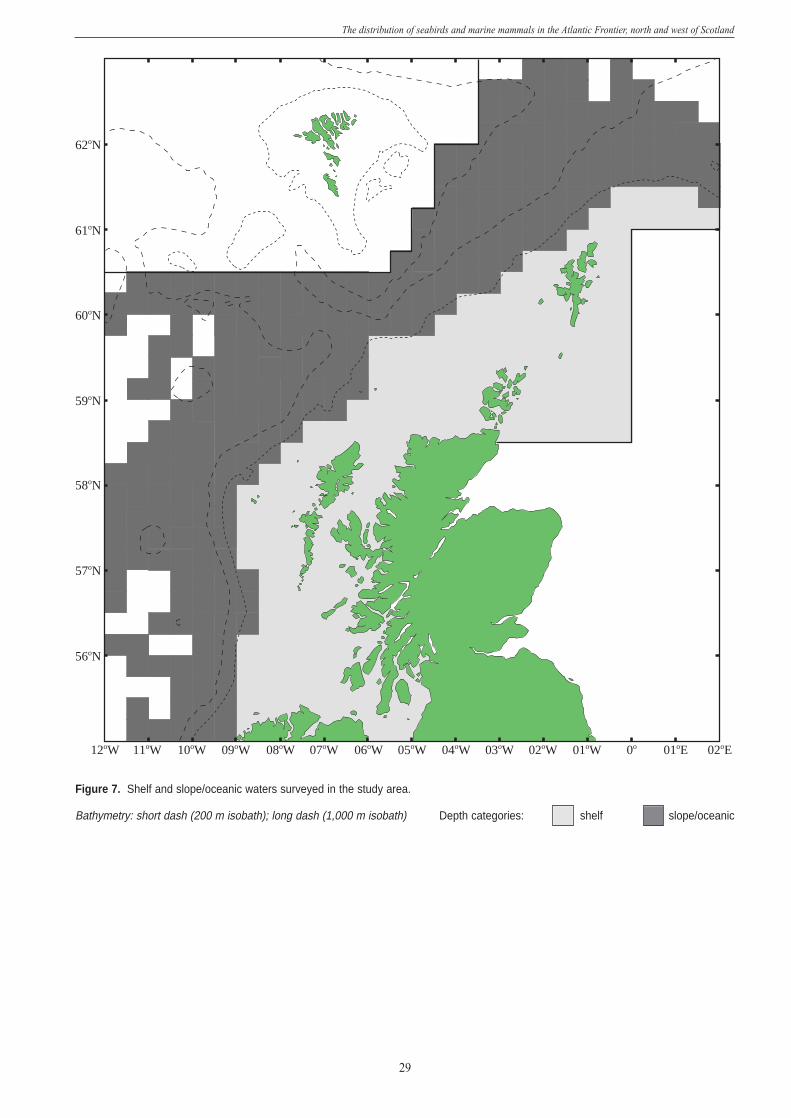
29
The distribution of seabirds and marine mammals in the Atlantic Frontier, north and west of Scotland
61oN
59oN
58oN
57oN
56oN
60oN
62oN
05oW 02oE01oE0o01oW02oW06oW 03oW07oW08oW09oW10oW11oW12oW 04oW
Figure 7. Shelf and slope/oceanic waters surveyed in the study area.
Bathymetry: short dash (200 m isobath); long dash (1,000 m isobath) Depth categories: shelf slope/oceanic