Embed Size (px)
Citation preview

This file is part of the following reference:
Jayasinghe, Nandana Chana (2012) The distribution of
wind loads and vulnerability of metal clad roofing
structures in contemporary Australian houses. PhD thesis,
James Cook University.
Access to this file is available from:
http://researchonline.jcu.edu.au/39226/
The author has certified to JCU that they have made a reasonable effort to gain
permission and acknowledge the owner of any third party copyright material
included in this document. If you believe that this is not the case, please contact
[email protected] and quote
http://researchonline.jcu.edu.au/39226/
ResearchOnline@JCU
The Distribution of Wind Loads and Vulnerability of Metal Clad Roofing
Structures in Contemporary Australian Houses
Thesis submitted by
Nandana Chana JAYASINGHE BSc (Hons)
in January 2012
For the degree of Doctor of Philosophy
in School of Engineering and Physical Sciences
James Cook University
Townsville

Page 2 of 202
Statement of access
I, the undersigned, the author of this thesis, understand that James Cook University will make it
available for use within the University Library and via the Australian Digital thesis network for
use elsewhere.
I understand that as an unpublished work a thesis has significant protection under the Copyright
act and I do not wish to place restriction on access to this work.
........................................ ..........................................
Nandana Chana Jayasinghe Date

Page 3 of 202
Statement of sources
I declare that this thesis is my work and has not been submitted for another degree or diploma at
any university or other institution of tertiary education. Information derived from published or
unpublished work of others has been acknowledged in the text and a list of references is given.
........................................ ..........................................
Nandana Chana Jayasinghe Date

Page 4 of 202
Statement on the contribution of others
Grants: This research was mainly supported by Cyclone Testing Station (CTS) at James Cook
University, Townsville and additional funding was received from the School of Engineering
and Physical Sciences, James Cook University (JCU), Townsville.
Supervision: A/Prof. J.D Ginger (JCU) principal supervisor for this research. Other supervision
was provided by Dr. D.J Henderson (JCU) and Prof. G.R Walker (JCU).
Editorial Assistance: The editorial assistance for this thesis was provided by A/Prof. J.D
Ginger, Dr. D.J Henderson and Prof. G.R Walker from James Cook University, Townsville.
Software: Mr. Martin Wehner from Geosciences Australia provided the software, VAWS and
did additional coding whenever necessary to incorporate output results from this study.

Page 5 of 202
Acknowledgements
First and foremost, I would like to express my sincere gratitude to my Principal supervisor
A/Prof. John Ginger for his excellent guidance, technical expertise and continuous support
throughout this research. I also thank my Co-Supervisors Dr. David Henderson and Prof.
George Walker for their guidance and valuable inputs to this work. I am grateful to these
supervisors for the education, direction, encouragement and examples they have provided.
The research was supported by Cyclone Testing Station (JCU) and School of Engineering and
Physical Sciences (JCU). This support is gratefully acknowledged.
I also would like to thank staff and the technicians of Cyclone Testing Station for their support,
assistance and advice. Specially, I would like to thank Mr. Stu Peterson for his support for
setting up and assisting with conducting the structural tests.
I gratefully acknowledge the engineering workshop technician, Mr. Curt Arrowsmith for his
support on constructing the wind tunnel model and Mr. Peter Kim for assisting me on doing the
wind tunnel experiments.
Finally, I would like to thank my friends and family for their steady support and
encouragement. I‘m especially grateful to my wife, Susanthi, for helping me and keeping my
life in proper perspective and balance.

Page 6 of 202
Abstract
Windstorms cause most of the damage to houses, worldwide. The roof is subjected to the
largest wind loads and is usually the most vulnerable part of the house. However, data on the
transfer of wind loads within the roof structure is scarce. Such data is required for the
application of structural reliability analysis and for development of building codes. The
fluctuating nature and variable distribution of wind loads, combined with the change from linear
to non-linear structural behaviour as the loads increase, can pose challenges for calculating
structural response. This is also required for developing the performance based design of
structures and for understanding wind load transfer within the roof structure and the effect of
progressive failure on the sharing and redistribution of loads. Most vulnerability models do not
accurately incorporate the structural behaviour of the houses during windstorms, which may
produce unreliable estimates of damage. These vulnerability models have mainly focused on the
wind loads acting on the connection tributary area and the strength of the connections.
This research study analysed the transmission of wind loads within a commonly used roof
structural system of contemporary houses obtained from a survey in the cyclonic region of
Australia. The distribution of wind pressure on the roof of such a typical house was determined
using a wind tunnel model. The wind loads on selected roof fixings were further analysed to
obtain the wind load data in terms of probabilistic parameters. The strength capacities of the
roofing connection were also determined in terms of probabilistic parameters using available
test data. The structural response of a roof was studied by testing sub-assemblies of the roof
applying point and line loads and measuring the reactions at batten-to-truss connections and the
deflections at selected locations in a range of conditions and damage states to simulated loads.
The results were also compared with analytical solutions. The variation of reactions with
increasing load was discussed in terms of a reaction coefficient. The coefficients were assessed
for loads in the linear and non-linear states of roofing components/connections. The study
integrated the wind loading and structural information on transfer of wind load effects through
the structure to determine the loads and vulnerability of batten-to-truss connections. These

Page 7 of 202
outputs were compared with the results obtained from conventional methods for calculating
load on connections and vulnerability assessments.
The study found that loads on the batten-to-truss connection of these contemporary houses are
influenced by the flexibility of the battens and cladding, and the directional stiffness
characteristics of the cladding, as is the redistribution of batten-to-truss connection loads
following failure of the cladding fastener and batten-to-truss connections. As a result estimates
based on application of pressures to connection tributary area, which is the normal design
practice, can lead to underestimation of the connection loads. The study shows that a larger
tributary area should be considered to obtain the batten-to-truss connection loads on these
structural systems. Furthermore, the study shows that estimates of the vulnerability of a batten-
to-truss connection based on the incorporation of load distribution effects in the reliability
analysis are greater than those obtained from the methods used in current practice. Hence, the
study suggests that load sharing effects must be incorporated when determining the
vulnerability of connections. The vulnerability estimates on cladding fixings and truss-to-wall
connections were also determined and the results show that the cladding fixings are the most
vulnerable and then batten-to-truss connections and truss-to-wall connections respectively.
A main outcome of the thesis is the establishment of an improved procedure for analysing the
variation of the connection loads with time taking account of the spatial and temporal variation
in wind pressures and the structural response characteristics of the roof system, which is a
necessary first step in the assessment of their vulnerability. These outcomes make a significant
contribution to understanding the wind loading distribution and developing vulnerability
functions for houses to windstorms. The results can also be used to assess the system reliability
for a well defined limit state and hence can contribute significantly to performance based
evaluation of masonry block houses in cyclonic regions. The results could also be used as a
basis to study adaptation measures and for the development of software models for assessing
building vulnerability to windstorms.
Page 8 of 202
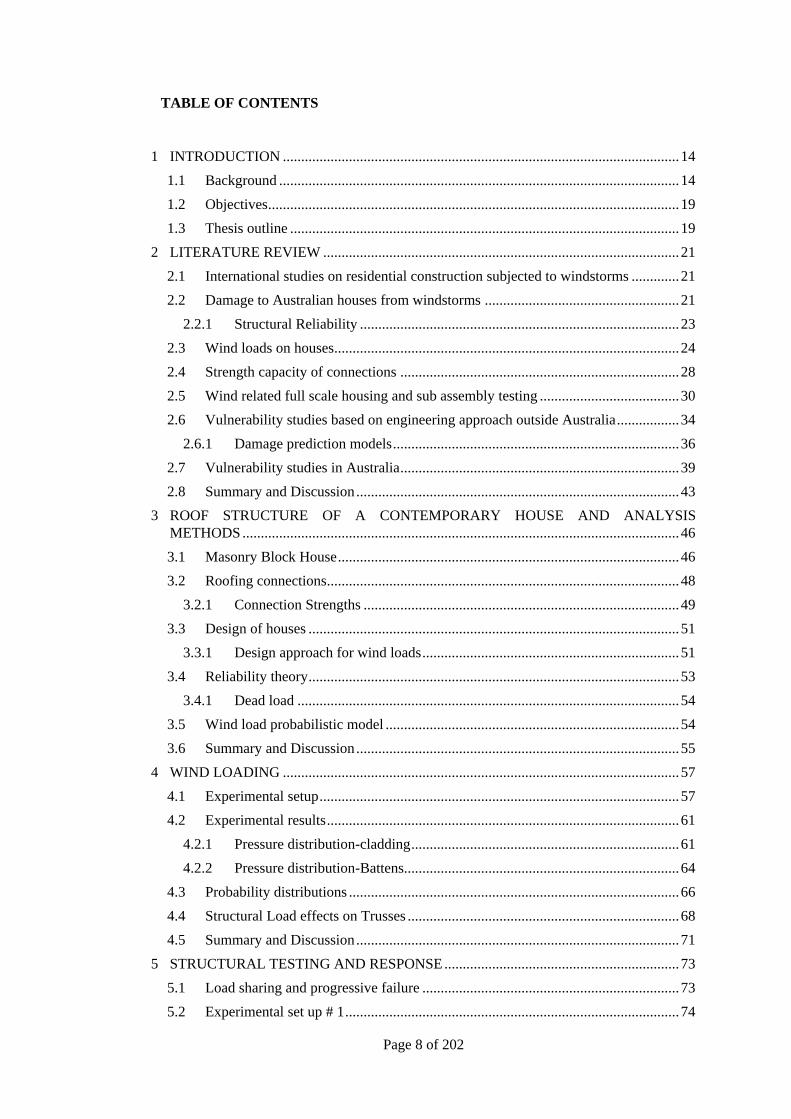
TABLE OF CONTENTS
1 INTRODUCTION ............................................................................................................ 14
1.1 Background ............................................................................................................. 14
1.2 Objectives ................................................................................................................ 19
1.3 Thesis outline .......................................................................................................... 19
2 LITERATURE REVIEW ................................................................................................. 21
2.1 International studies on residential construction subjected to windstorms ............. 21
2.2 Damage to Australian houses from windstorms ..................................................... 21
2.2.1 Structural Reliability ....................................................................................... 23
2.3 Wind loads on houses.............................................................................................. 24
2.4 Strength capacity of connections ............................................................................ 28
2.5 Wind related full scale housing and sub assembly testing ...................................... 30
2.6 Vulnerability studies based on engineering approach outside Australia ................. 34
2.6.1 Damage prediction models .............................................................................. 36
2.7 Vulnerability studies in Australia ............................................................................ 39
2.8 Summary and Discussion ........................................................................................ 43
3 ROOF STRUCTURE OF A CONTEMPORARY HOUSE AND ANALYSIS
METHODS ....................................................................................................................... 46
3.1 Masonry Block House ............................................................................................. 46
3.2 Roofing connections ................................................................................................ 48
3.2.1 Connection Strengths ...................................................................................... 49
3.3 Design of houses ..................................................................................................... 51
3.3.1 Design approach for wind loads ...................................................................... 51
3.4 Reliability theory ..................................................................................................... 53
3.4.1 Dead load ........................................................................................................ 54
3.5 Wind load probabilistic model ................................................................................ 54
3.6 Summary and Discussion ........................................................................................ 55
4 WIND LOADING ............................................................................................................ 57
4.1 Experimental setup .................................................................................................. 57
4.2 Experimental results ................................................................................................ 61
4.2.1 Pressure distribution-cladding ......................................................................... 61
4.2.2 Pressure distribution-Battens........................................................................... 64
4.3 Probability distributions .......................................................................................... 66
4.4 Structural Load effects on Trusses .......................................................................... 68
4.5 Summary and Discussion ........................................................................................ 71
5 STRUCTURAL TESTING AND RESPONSE ................................................................ 73
5.1 Load sharing and progressive failure ...................................................................... 73
5.2 Experimental set up # 1 ........................................................................................... 74

Page 9 of 202
5.2.1 Test procedure ................................................................................................. 76
5.2.2 Elastic range tests ............................................................................................ 77
5.2.3 Loading until failure ........................................................................................ 79
5.2.4 Analytical model ............................................................................................. 80
5.2.5 Results and Discussion .................................................................................... 80
5.3 Experimental test set up # 2 .................................................................................... 94
5.3.1 Results and Discussions for Test Set up #2 ..................................................... 96
5.4 Summary and Discussion ...................................................................................... 114
6 VULNERABILITY OF THE ROOF SYSTEM ............................................................. 116
6.1 Load distribution on Roof system ......................................................................... 116
6.2 The effect of cladding fastener failure .................................................................. 126
6.3 The effect of batten-to-truss connection failure .................................................... 127
6.4 Reliability Analysis ............................................................................................... 128
6.5 Summary and Discussion ...................................................................................... 138
7 CONCLUSIONS AND RECOMMENDATIONS ......................................................... 140
7.1 Conclusions ........................................................................................................... 140
7.2 Recommendations ................................................................................................. 144
8 REFERENCES ............................................................................................................... 147
APPENDIX A ...................................................................................................................... 154
APPENDIX B- Test Matrix ................................................................................................. 158
APPENDIX C ...................................................................................................................... 187
APPENDIX D- Vulnerability and Adaptation to Wind Simulation (VAWS) ..................... 195
Page 10 of 202
LIST OF FIGURES
Figure 1.1: Damaged house from Brisbane thunderstorm (Leitch et al. (2010)) ........................ 14
Figure 1.2: Building damage in Cyclone Larry (Henderson et al. (2006)) ................................. 14
Figure 1.3: Completed Masonry Block house ............................................................................. 16
Figure 1.4: Schematic diagram of a Masonry Block House ....................................................... 17
Figure 2.1: Change in Lateral response with addition of elements ............................................. 31
Figure 2.2: Test house at UWO (Morrison and Kopp (2009)) .................................................... 33
Figure 2.3: 1/3 scale model building (Mensah et al. (2011)) ...................................................... 34
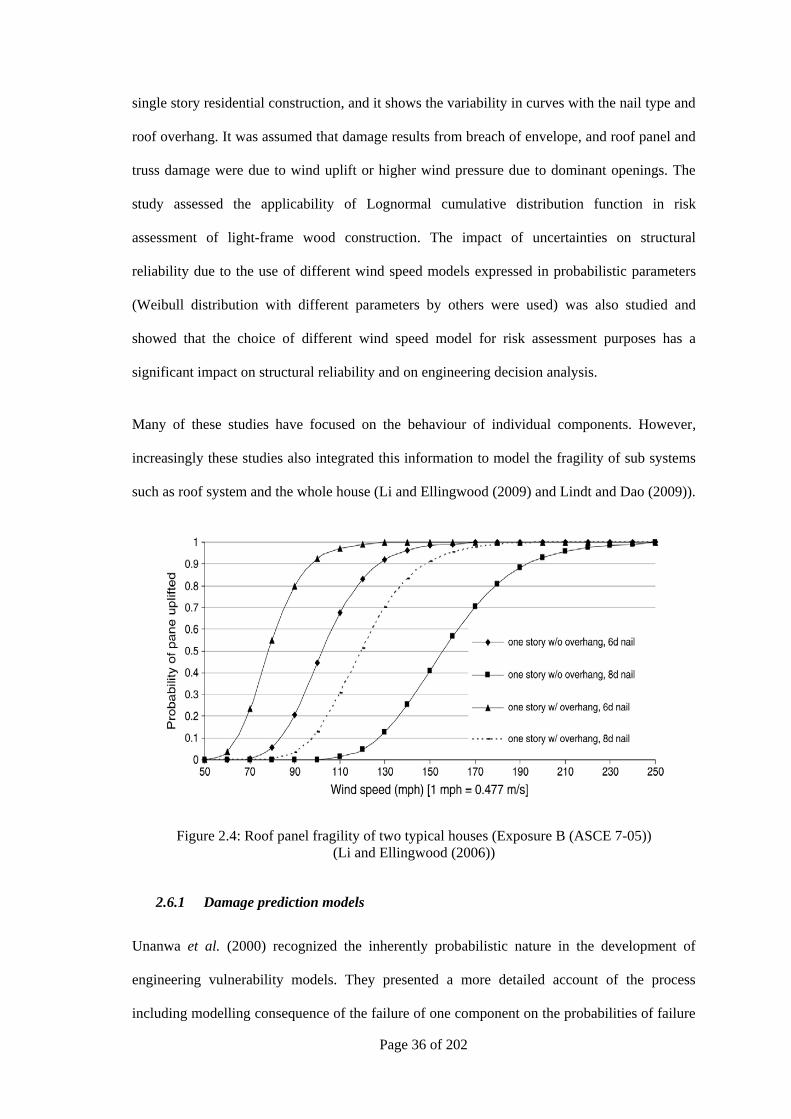
Figure 2.4: Roof panel fragility of two typical houses (Exposure B(ASCE 7-05)) .................... 36
Figure 2.5: Vulnerability curves for masonry buildings in central Florida (Pinelli et al. (2008))
..................................................................................................................................... 38
Figure 2.6: Components of the vulnerability for a masonry medium strength structure (Pinelli et
al. (2008)) .................................................................................................................... 38
Figure 2.7: Reference curves for heuristic ranking process by expert group engaged through
workshop activity, N and C classification according to AS 4055(2006) (Geoscience
Australia (2007)) .......................................................................................................... 41
Figure 2.8: Estimated probability of failure of components in the modelled houses (Henderson
and Ginger (2007)) ...................................................................................................... 42
Figure 3.1: Masonry Block house under construction (Hip roof shape) ..................................... 47
Figure 3.2: Battens and trusses in Masonry block house ............................................................ 48
Figure 3.3: Truss-to-wall connection .......................................................................................... 49
Figure 3.4: Batten-to-truss connection ........................................................................................ 49
Figure 3.5: Roof cladding-to-batten connections ........................................................................ 49
Figure 4.1: Mean velocity profile ................................................................................................ 57
Figure 4.2: Turbulence intensity profile ...................................................................................... 58
Figure 4.3: Pressure tap layout .................................................................................................... 59
Figure 4.4: 10m x 19.8m x 2.7m gable end low rise house with 22.5°roof pitch ....................... 60
Figure 4.5: 1/50 scale model of the 10m x 19.8m x 2.7m house in the wind tunnel................... 60
Figure 4.6: Pressure coefficients vs wind direction – P (cladding) ............................................. 63
Figure 4.7: Pressure coefficients vs wind direction - Q (cladding) ............................................. 63
Figure 4.8: Pressure coefficients vs wind direction - T (cladding) ............................................. 64
Figure 4.9: Pressure coefficients ( ) vs wind direction – Batten-to-truss connection B2 ........ 65
Figure 4.10: Pressure coefficients ( ) vs wind direction – Batten-to-truss connection B7 ...... 65
Figure 4.11: Pressure coefficients ( ) vs wind direction – Batten-to-truss connection F5 ....... 66
Figure 4.12: Schematic diagram of roof truss showing batten to truss connection patches and
truss to wall reaction forces ......................................................................................... 68
Page 11 of 202
Figure 4.13: V1 and V2 vs wind approach angles -Truss B ..................................................... 70
Figure 4.14: V1 and V2 vs wind approach angles -Truss F ...................................................... 70
Figure 4.15: V1 and V2 vs wind approach angles -Truss L ..................................................... 71
Figure 5.1: Schematic diagram of the test set up #1 (all dimensions are in mm) ....................... 75
Figure 5.2: Test set up #1 before fixing the cladding .................................................................. 75
Figure 5.3: Batten-to-truss connection with load cell ................................................................. 76
Figure 5.4: Dummy load cell ...................................................................................................... 76
Figure 5.5: Test set up with cladding fixed ................................................................................. 76
Figure 5.6: Load application to the bottom surface of cladding with a foam mould and jack .... 77
Figure 5.7: Load application to batten and deflection measurement .......................................... 78
Figure 5.8: Line loads applied along a line over spacing between trusses .................................. 79
Figure 5.9: SPACEGASS 3D model of the test setup #1 ............................................................ 80
Figure 5.10: Reaction coefficient at b2, R1(C b2, R1) for point load on batten b2 ........................ 82
Figure 5.11: Deflection of batten b2 for load at (b2, 2) .............................................................. 82
Figure 5.12: Reaction coefficient, C b2, R1, for point load on batten b2 ....................................... 83
Figure 5.13: The effect of cladding on reaction coefficient, C b2, R1 ............................................ 84
Figure 5.14: Reaction coefficient, Cb2, R2 with point loads along W, X and Y ............................ 86
Figure 5.15: C b2, R2 for point load on X on Panels P6 and P10 ................................................... 87
Figure 5.16: Reaction coefficients for loading at centre of Panel 6 until failure of fasteners ..... 89
Figure 5.17: Application of point load showing a cladding fastener failure (pulling out of
batten) .......................................................................................................................... 90
Figure 5.18: Plastic deformation of cladding around fasteners ................................................... 91
Figure 5.19: Deflections at selected positions with the applied load along line X of P10 .......... 91
Figure 5.20: Reaction coefficient for a line load on P13 along line X ........................................ 92
Figure 5.21: Line load on P13, X until failure of cladding fasteners .......................................... 93
Figure 5.22: Deflection with the applied load on P13 along line X ............................................ 94
Figure 5.23: Schematic diagram of the Test Set up #2 ............................................................... 95
Figure 5.24: Schematic diagram of the connections studied ..................................................... 100
Figure 5.25: Reaction coefficients of adjacent connections when b2, R2 Failed ..................... 102
Figure 5.26: Reaction coefficients on connections for equal loads applied on P1, P2, P4 and P5
................................................................................................................................... 102
Figure 5.27: Reaction coefficients on connections when b2, R2 failed for equal loads applied on
P1, P2, P4 and P5 ....................................................................................................... 103
Figure 5.28: Batten-to-Truss connection with one screw connection removed ........................ 104
Figure 5.29: Reaction coefficients for a partial failure of the connection b2, R2 for equal loads
applied on P1, P2, P4 and P5 ..................................................................................... 105
Figure 5.30: A connection with loose screws ........................................................................... 106

Page 12 of 202
Figure 5.31: Applied load on batten-to-truss connection .......................................................... 108
Figure 5.32: Reaction coefficients for total applied load on (b2, R2) ....................................... 109
Figure 5.33: Deflection measurement ....................................................................................... 110
Figure 5.34: The applied load vs deflection at (b2, R2) ............................................................ 110
Figure 5.35: Plastic deformation of a batten-to-truss connection ............................................. 111
Figure 5.36: Applied load vs Deflection on connection (b2, R2) ............................................. 111
Figure 5.37: Failure of the connection (b2, R2) ........................................................................ 112
Figure 5.38: Variation of reaction coefficients with the applied load ....................................... 113
Figure 5.39: Variation of deflections with the applied load ...................................................... 113
Figure 6.1: Schematic Diagram of connections considered ...................................................... 117
Figure 6.2: Conventional method #1-Tributary area for connection B7 ................................... 118
Figure 6.3: Conventional method #2-Tributary area for connection B7 ................................... 119
Figure 6.4: Proposed method - Tributary area for connection B7............................................. 119
Figure 6.5: Variation of at B7 with the wind approach direction ..................................... 122
Figure 6.6: for undamaged system for θ =150° ................................................................ 123
Figure 6.7: Pressure distribution around B7-Proposed method ................................................ 124
Figure 6.8: Pressure distribution around B7-Conventional Method #1 .................................... 124
Figure 6.9: Pressure distribution around B7-Conventional Method #2 .................................... 124
Figure 6.10: for undamaged system for θ =90° ................................................................ 125
Figure 6.11: Failure of a cladding fastener ............................................................................... 126
Figure 6.12: Load distribution-Undamaged system .................................................................. 128
Figure 6.13: Load distribution-B7 failed .................................................................................. 128
Figure 6.14: Vulnerability of batten connections for θ=150° in TC 2.5 ................................... 130
Figure 6.15: Vulnerability of batten truss connections for θ=150° in TC 2.5 ........................... 130
Figure 6.16: Vulnerability of batten connections for θ=150° in TC 2.5 ................................... 132
Figure 6.17: Vulnerability of batten truss connections for θ=150° in TC 2.5 ........................... 132
Figure 6.18: Probability of batten-to-truss connection failure vs wind speed following the
failure of B7 in TC 2.5- internal pressure coefficient- 0 ........................................... 133
Figure 6.19: The effect of factors in Eqn 3.14 on batten-to-truss connection vulnerability for
θ=150° in TC 2.5- internal pressure coefficient- +0.7 ............................................... 135
Figure 6.20: Typical contemporary house (i.e. Figure 4.4) ....................................................... 136
Figure 6.21: Probability of failure vs Basic Wind speed- Cladding connections for house in TC
2.5- internal pressure coefficient- +0.7 ...................................................................... 137
Figure 6.22: Probability of failure vs Basic Wind speed-Truss-to-wall connections for house in
TC 2.5- internal pressure coefficient- +0.7 ................................................................ 137

Page 13 of 202
LIST OF TABLES
Table 3.1: Characteristics of Masonry block Houses .................................................................. 47
Table 3.2: Connection Capacity Statistics .................................................................................. 50
Table 4.1: The probabilistic distribution of peak pressure ( on cladding fixings at P, Q
and T regions .......................................................................................................... 67
Table 5.1: Comparison of reaction coefficients from line loads with point loads ...................... 88
Table 5.2: Reaction coefficients of selected connections for load applied at P1 to P9 ............... 96
Table 5.3: Deflection at selected panels for line load application on panels .............................. 97
Table 5.4: Comparison of reaction coefficients for line loads applied in test set up #1 and #2 .. 98
Table 5.5: Comparison of deflections in Test set up #1 and #2 .................................................. 99
Table 5.6: Reaction coefficients for removing both screws in selected connections ................ 100
Table 5.7: Reaction coefficients for removing screw ‗I‘ of selected connections .................... 105
Table 5.8: Reaction coefficients for loosening both screws on selected connections ............... 107
Table 6.1: for θ =150°- Undamaged roof using load distribution effects ......................... 121
Table 6.2: for θ =150°- Undamaged roof using conventional method #1 ......................... 122
Table 6.3: for θ =150°- Undamaged roof using conventional method #2 ......................... 122
Table 6.4: for θ =150°- Cladding fastener failure (between B7 and C7) .......................... 127
Table 6.5: for θ =150°- Batten-to-truss connection B7 failed ........................................... 128
Table 6.6: Statistical parameters for normalized values ........................................................... 134

Page 14 of 202
1 INTRODUCTION
1.1 Background
Residential housing is the largest single asset for many people, and overall forms a very large
proportion of the social investment in the community. These houses need to be protected
against hazards with the potential to cause large scale disasters. Windstorms are generally
recognized as the natural hazard that causes most of the damage to buildings in Australia.
Windstorms can broadly be classified according to their meteorological parameters as, tropical
cyclones, thunderstorms, tornados and gales. Thunderstorms and tornados are short-lived local
events with their influence affecting distances of tens of kilometres. Cyclones generally impact
coastal regions in the tropics, and can extend hundreds of kilometres, therefore having the
potential to cause widespread damage. Windstorms such as Cyclone Tracy (Walker (1975)),
Cyclone Winifred (Reardon et al. (1986)), Cyclone Larry (Henderson et al. (2006)), Cyclone
Yasi (Boughton et al. (2011)) and Brisbane Thunderstorm (Leitch et al. (2010)) have caused
significant damage to the structures in Australia. Figures 1.1 and 1.2 show damaged houses
from such events. There has been a significant reduction in the level of damage to houses in
recent times due to the improvements in design and construction of domestic/residential houses
(Boughton et al. (2011)).
Figure 1.1: Damaged house from Brisbane
thunderstorm (Leitch et al. (2010))
Figure 1.2: Building damage in Cyclone
Larry (Henderson et al. (2006))

Page 15 of 202
However, increasing concentration of population and the potential effects of climate change on
the frequency and magnitude of windstorms may result in an increased risk to housing. If the
nature of the disaster risks is to be fully understood and cost effective measures taken to
mitigate them, it is important to have a better understanding of the structural response of houses
to wind loading.
Full scale and wind tunnel model studies on houses reveal that the roof is subjected to large
wind loads and post-damage surveys show that the roofing components are the most vulnerable
part of a house to windstorms. Damage surveys (Walker (1975)) and full scale test data from
the Cyclone Testing Station (Boughton and Reardon (1982, 1983, 1984)) have shown that the
typical modes of roofing failure of houses to wind loading are associated with the strength
capacity of the joints between components being exceeded. There are a range of house types in
Australia with differences in size, shape, potential openings in envelope, cladding, roof shape
and pitch, method of construction, structural system and age. The resistance of a house structure
to wind loading depends on the effect of these features on the wind loads experienced and the
strength of its components and connections. The roof of these houses consists of roof cladding,
battens and roof trusses/rafters. The roof cladding is usually metal sheeting or roof tiles that are
fixed to timber or metal ―top hat‖ battens. The trusses or rafters are usually timber in residential
construction.
The assessment of the vulnerability of these houses to windstorms requires knowledge of the
loads and component strength and uncertainties associated with load actions and building
response. The vulnerability in this research is defined as the susceptibility of structural failure to
wind loads, and failure is defined as the state where the structure is unable to resist the applied
load. These uncertainties are due to the variability of factors that are inherent to wind loads and
component resistance, and inadequate knowledge resulting in incorrect assumptions and
analysis methods. These uncertainties can be accounted for, when analysing a structural system
by specifying the load action and building response in probabilistic terms. An important

Page 16 of 202
component of this process is to obtain an accurate representation of the wind load transmitted
through the structure of a house.
Contemporary houses in cyclonic regions of Australia are typically built on a concrete slab on
ground with masonry block walls, timber roof trusses, metal top hat battens and corrugated
metal roof claddings. These houses have predominantly either gable or hip roofs or a
combination of these. Figure 1.3 shows a masonry block house with a metal clad gable end roof
and Figure 1.4 shows a schematic diagram of a typical masonry block house.
The approach wind flow generates spatially and temporally varying pressure on the roof. These
loads depend on the approach wind direction and also the terrain and topographic features.
There have been many studies of wind pressures on roofs covering a large range of roof types,
of which the studies by Holmes (1981), Reardon and Holmes (1981) and Meecham et al. (1991)
are typical examples. The design wind loads on the roof given in Standards (AS/NZS 1170.2
(2011), ASCE 7-10 (2010)) are generally based on a conservative interpretation of results from
such studies and are dependent on the geometry of the building. The spatial and temporal
variation of wind load and the transfer of these loads to the roof structure must be determined in
order to assess their vulnerability.
Figure 1.3: Completed Masonry Block house

Page 17 of 202
Figure 1.4: Schematic diagram of a Masonry Block House
Wind loads acting on the roof cladding are transferred via the supporting structure and the walls
to the foundation. The roof cladding-to-batten connection, batten-to-truss connection, and truss-
to-wall connection, are the critical parts of the load transfer path in these houses. The
vulnerability assessment of these houses depends on the strength of these connections. Houses
are complex structures with many load sharing components, making it difficult to quantify the
resistance of each component especially as the availability of full scale data is limited. The
loads applied to a house are shared by the structural and non-structural elements in a complex
manner. Increasing wind speeds will result in progressive failures and possible changes to the
load sharing and reactions in connections. Full scale testing provides a means of assessing the
loading response and also determining the coefficients or factors for the load effects of interest.
Full scale tests on complete houses, such as those by Boughton and Reardon (1982, 1983, 1984)
provide quantitative data on the load sharing and interdependency between components and
connections with increasing load. However, such studies have focused on the cumulative

Page 18 of 202
performance of the structure and did not measure the reactions/loads of individual connections
which are needed to determine the load redistribution and progressive failure. Therefore, more
detailed descriptions of structural components and connections including their behaviour with
increasing wind loads and quantitative analysis of load distributions are required in order to
predict the overall response of roofing components during wind events. This is also required for
developing performance based design of structures.
The vulnerability of houses to wind loads can be studied using the reliability method that is
incorporated in design standards for structural design (Walker (2011)). Henderson and Ginger
(2007) studied the vulnerability of high-set 1960‘s house with low pitch gable roof built in
Northern Australia to wind speeds experienced in tropical cyclones by using reliability
concepts. Studies by Rosowsky and Ellingwood (2002), Ellingwood et al. (2004), Pinelli et al.
(2004), Lee and Rosowsky (2005), and Li and Ellingwood (2006) have assessed the
vulnerability of residential construction in the US to wind loading using reliability methods and
probability techniques. Engineering vulnerability models estimate the damage caused by wind
loads of varying intensity by applying structural engineering techniques and statistical methods.
The reliability theories incorporating probability theories and Monte Carlo simulation
techniques are incorporated in these engineering models to assess the vulnerability.
However, most of the vulnerability models do not accurately incorporate the structural response
of the house during windstorms, and hence may produce unreliable estimates of the damage.
Typically these studies have focused on the wind load acting on the local tributary area and the
strength of the connections. The determination of the vulnerability of roofs to wind loads
requires a combination of the distribution of wind loads on a common roof structure, the
connection strengths and the response of the actual roof structure to loads including load
sharing and redistribution that results from progressive failure under wind loads. Such data
inputs to the engineering models form an important part in determining the building
vulnerability.

Page 19 of 202
1.2 Objectives
The main objective of this thesis is to determine the transmission of wind loads through roofing
components, including the effect of local failures, and the impact on the overall structural
performance of the roof system. Specifically, the distribution of applied loads and associated
structural response of a batten-to-truss connection from contemporary houses built in cyclonic
region of Australia is investigated.
These objectives are met by;
I. Determining a common roof system and the structural components used in
contemporary houses built in cyclonic region of Australia and their strengths.
II. Deriving the spatial and temporal variation of wind loads acting on the roof of a
common contemporary house as a function of wind direction.
III. Studying the effect of load sharing and interdependency between components and
progressive failure by conducting a series of tests on selected subassemblies of the roof
system, and using structural analysis.
IV. Determining the load distribution on selected connections using measured wind loading
distributions and structural response, and then comparing the results with conventional
methods of analysis.
V. Using reliability methods to estimate failure of roofing components under wind loads
and assessing the vulnerability of components on various regions of the roof.
1.3 Thesis outline
Chapter 2 reviews work carried out around the world in this research area and identifies the
methods for gaining required information. The damage to houses from windstorms, wind load

Page 20 of 202
on low rise houses and studies on vulnerability of houses to windstorms are discussed. The
damage prediction models currently being used and developed and full scale house /sub
assembly tests associated with low rise construction are also described.
Chapter 3 describes the structural system including roofing components and connections of a
common masonry block house based on a survey, and presents the capacities of the roof
connections in terms of probabilistic parameters. The current design practices associated with
the design of residential construction to wind loads and the theories used in this study to assess
the vulnerability of roofing connections to windstorms are also discussed.
Chapter 4 presents the wind loads over the roof of the common masonry block house obtained
from a wind tunnel model study. The distribution of the wind loads and variability of these
loads in probabilistic terms over selected part of the roof with the wind approach direction, are
also presented.
Chapter 5 presents a series of tests on full scale roof subassembly systems subjected to a range
of loads and comparisons with analytical results. The progressive failure, load sharing and
interdependency between components with increasing load are also studied.
Chapter 6 combines the wind load measured on the wind tunnel model and the full scale roof
structure response to determine the distribution of load in the roof system of contemporary
houses. Vulnerability curves are derived for roofing connections on selected parts using the
reliability method and probability theories. The load-response results are also incorporated in
the analysis.
Chapter 7 summarizes the main findings and conclusions. It also contains the discussion on
results, their significance, limitations, possible ways of generating the results for more
widespread application, and suggestions for future research.

Page 21 of 202
2 LITERATURE REVIEW
Windstorms are responsible for most of the damage to houses from natural hazards, in many
parts of the world. However, studies on the transmission of wind load within the roof required
for quantifying the damage have been limited. Such studies provide a means of quantifying the
performance of a type of house, linking it to reliability methods applied in building codes and
standards. This Chapter reviews the research carried out around the world in this area and
identifies methods for gaining required information.
2.1 International studies on residential construction subjected to windstorms
Windstorms such as Hurricane Hugo, Andrew, Iniki and Opal caused damages to the residential
houses constructed in the US resulting in significant insurance payouts. Pielke and Pielke
(1997) described that the vulnerability of society to windstorm is assessed as a combination of
incidence (intensity and frequency of events) and societal exposure (people, preparedness and
properties). Improving building resilience to these events reduces society‘s vulnerability.
Empirical and engineering based vulnerability models have been developed in the US to assess
the damage to the buildings and to improve the construction of residential houses. As described
by Walker (2011), engineering based models require a large amount of detailed statistical
information on the structural behaviour of buildings at component, sub-system, and whole of
building level. There have been major advances in this area during last decade. The studies by
Unanwa et al. (2000), Pinelli et al. (2004), Vickery et al. (2006b), Ellingwood et al. (2004), and
Li and Ellingwood (2006) are some of these studies and the details are discussed later in this
Chapter. The outcomes and methodologies used in these studies are important for developing
vulnerability models for Australian housing.
2.2 Damage to Australian houses from windstorms
The report by Geoscience Australia (2007) provides an overview of the damage sustained by
residential structures from natural hazards in Australia. The report indicates that windstorms

Page 22 of 202
cause most of the damage. These events can result in major disruptions to communities,
significant insurance payouts and loss of lives. Tropical cyclones Althea and Tracy impacted the
Northern Australian towns of Townsville in 1971 and Darwin in 1974, respectively. Tropical
Cyclone Tracy caused significant damage to domestic housing as detailed by Walker (1975) and
Leicester and Reardon (1976). A major factor in the wide-spread damage was the loss of
roofing materials which led to a significant loss of strength in many houses, leading to collapse
and the production of a large amount of wind borne debris, causing further damage to the
buildings. The roof cladding fixings in these houses proved to be inadequate with fatigue under
fluctuating wind loads causing a reduction in strength. A major consequence of these events was
the implementation of a nationwide requirement for housing to be structurally designed to the
same codes and standards as larger buildings. The zoning of cyclone regions, fatigue failure of
cladding fastener systems and increased internal pressure for housing design were the most
radical impacts from cyclone Tracy on building regulations, as described by Walker (2010).
This was a revolutionary change as the previous improvements in design had been based on
correcting the observed weaknesses of components/connections.
Evidence of the resulting improvements to housing design standards and codes in Australia is
found from the comparatively better performance of newer construction in recent windstorms,
such as Cyclone Larry (Henderson et al. (2006)), Cyclone Ului (Henderson et al. (2010)),
Cyclone Yasi (Boughton et al. (2011)) and Brisbane Thunderstorm (Leitch et al. (2010)). These
reports show that most of the damage occurred to houses built before the new standards were
introduced (pre-1980‘s houses). Contemporary housing performed considerably better than
older housing, reflecting marked improvement of construction detailing and better structural
condition, and satisfactory performance of relevant standards (AS/NZS 1170.2 (2011) and AS
4055 (2006)). In some cases, houses that did not have appropriate fixings to account for higher
wind speed caused by topography on or near hill-tops had significant damage. Overall,
contemporary houses performed well by resisting the wind loads (for wind speeds that were less
than the regions‘ design wind speed). Generally, these new buildings had damages mainly to

Page 23 of 202
roller doors and attachments such as guttering and fascias which have not been designed to meet
requirements given in the codes. Where structural failures were observed on contemporary
houses, they were associated with poor construction practice or application of incorrect site
classification (i.e. low design wind speed). Breaches in the building envelope (from failed doors
or windows, or debris impact) exacerbated the potential for failure from the resulting high
internal pressure. Corrosion or rot of connections and framing elements initiated failures.
2.2.1 Structural Reliability
Structural reliability forms the basis of many current design codes and standards (AS/NZS
1170.0 (2002), AS/NZS 1170.1 (2002), AS/NZS 1170.2 (2011) and ASCE 7-10 (2010)). As
described by many researchers such as Thoft-Christensen and Baker (1982), Melchers (1987)
and others, structural reliability theory is concerned with the rational treatment of uncertainties
in structural engineering and methods for assessing the safety and serviceability of structures.
Uncertainties that exist in most areas of civil and structural engineering should be taken into
account so that rational decisions can be made. These methods are applied to determine the
reliability against extreme events such as collapse or fracture and also the breaching of any
structural engineering requirement which the structure is expected to satisfy. The basic
reliability theory used is discussed in Chapter 3, where the loads and the capacities of structural
components in contemporary houses are given in probabilistic terms.
Current structural design codes and standards are based on concepts of limit state design, with
safety checks based on structural reliability theory. These reliability concepts were applied by
Galambos et al. (1982), Ellingwood et al. (1982), Leicester et al. (1985), Holmes (1985), and
Pham (1985) for developing structural design standards to a limit state format (AS/NZS 1170.0
(2002), AS/NZS 1170.1 (2002), AS/NZS 1170.2 (2011) and ASCE 7-10 (2010)). The concept
of a reliability index (or safety index) was used in the assessment of structural design codes.
These studies defined the reliability index as a measure of evaluating uncertainty, performance
and reliability of a building system subjected to loads. The studies also showed that the basic

Page 24 of 202
framework for probability based design is provided by reliability theory and the probability of
failure and the reliability index can be evaluated when the probability distribution of the loads
and resistances are known. Melchers (1985) and Tang and Melchers (1985) discussed the
applicability of reliability theory and Monte Carlo simulation techniques for obtaining the
reliability of large structural systems. Pham et al. (1983) and Holmes (1985) described a
probabilistic model for wind loads to enable reliability indices to be computed for structural
design. These approaches and the concepts have been used by others to assess the vulnerability
of residential constructions to wind events.
2.3 Wind loads on houses
Low rise structures fall within the layer of aerodynamic roughness on the earth‘s surface. Here,
turbulence intensities are high and the highest loading on the surface of a low rise building are
generally the suctions on the roof, where many structural failures initiate. In the early 1970‘s,
the Building Research Establishment of the United Kingdom carried out full scale
measurements of wind pressures and forces on two storey houses at Aylesbury. Eaton and
Mayne (1975) described an extensive full scale experiment on several two storied houses. The
principal contribution to wind engineering came from this project where extensive pressure
measurements were made from an isolated experimental building with a variable pitch roof.
Subsequently, comparative wind tunnel experiments were conducted in many laboratories (i.e.
Holmes and Best (1977), Holmes (1983), Sill et al. (1989) and Sill et al. (1992)) on 1:50 and
1:100 scale models of the Aylesbury house. Holmes (1983) found some good agreements in the
full scale and model scale results, but also identified deficiencies in the full scale experiments.
These comparisons also found variations in pressure coefficients measured across the
laboratories.
Following the Aylesbury study, full scale experiments have been conducted at Silsoe in the UK
(Richardson et al. (1990)) and the Texas Tech in the US (Levitan et al. (1991)). Richardson
and Surry (1991, 1992, 1994), Richardson and Blackmore (1995) and Richards and Hoxey

Page 25 of 202
(2008) compared the results of full scale measurements of the Silsoe Building with wind tunnel
model results and presented conclusions similar to those from the Aylesbury tests. They also
found that areas of high negative pressure tended to be underestimated in wind tunnel
measurements, as in the previous studies. A significant amount of data on the Texas Tech
building has also been obtained and a range of analysis has been carried out by Levitan et al.
(1991), Mehta et al. (1992), and Letchford et al. (1993). Wind tunnel simulations on this
building have also been carried at many laboratories worldwide by Surry (1991), Cochran and
Cermak (1992), Tieleman et al. (1996), Xu and Reardon (1996) and Ho et al. (2005). These
studies also found that most pressure coefficients measured on the models were in close
agreement with full scale pressure coefficients, but the largest negative peak coefficients at the
roof edge and roof corners were under-estimated by the wind tunnel tests, as in the Aylesbury
study. These studies have contributed to improvements in the wind tunnel simulation
techniques, and data specified in revised codes and standards.
Wind pressures acting on the roofs of houses are dependent on their geometry and the approach
wind direction. The wind pressure acting on the range of roofs given in the standards are based
on many of wind tunnel model studies carried out on low rise building with hip and gable roofs
having a range of slopes (Holmes (1981), Reardon and Holmes (1981), Meecham et al. (1991),
Xu and Reardon (1998) and Ginger and Holmes (2005)). Meecham et al. (1991) showed that
the hip roof house experiences smaller peak cladding loads compared to a gable roof of similar
dimensions. Damage investigations also confirmed that hip roofs perform better than gable
roofs. However, the wind resistance of roofs should be analysed based on the relationship
between the pressure distribution and the underlying structural framing, implying that roof
shape alone is not responsible for the performance (Meecham et al. (1991)). In addition, the
spatial distribution of the pressures relative to the structural framing should be taken in to
account. There is a large spatial and temporal variability of pressures, especially near windward
roof corners, where the most severe wind loading and damage normally occurs. These large
suction pressures are generated by the formation of conical vortices (Holmes (2007)). Several

Page 26 of 202
studies have been carried out to assess the variation of wind loads on roof corners (Mehta et al.
(1992) and Lin and Surry (1998)) and the influence of roof eaves (over hang) on the
characteristics of pressures (Robertson (1991)).
Ho et al. (1990, 1991, 1992) investigated the effect of surrounding buildings on the wind loads
on a low rise building and found that the results are considerably different from those predicted
from isolated building tests and the coefficient of variation of the larger loads were 0.6 to 0.7.
Furthermore, they suggested that the wind load specifications should be determined based on a
reliability approach considering such a variation in wind loads. Case and Isyumov (1998)
showed that a suburban exposure generates lower wind loads than those experienced in the open
country exposure as suggested by others (Holmes and Best (1979) and Ho et al. (1992)).This
reduction was most apparent on wall loads and roof suctions, with the reductions in local
suctions may be up to 30%. Vickery et al. (2011) also conducted a range of wind tunnel
experiments for hip and gable end roof buildings covering a wide range of roof slopes in open
and suburban terrain conditions and compared the results with the pressure coefficient values
given wind loading standard in the US, ASCE 7-10 (2010). They showed the changes in
pressure coefficients in different areas of the roofs from open terrain to suburban terrain, and
found that ASCE-7-10 generally underestimates the magnitude of the negative roof pressures
acting on components and cladding.
Codes and standards such as AS/NZS 1170.2 (2011) give the design wind loads on parts of a
building as a nominal peak design pressure based on a quasi-static pressure coefficient. The
variability of the peak pressure should be taken into account, when assessing the vulnerability
of components. Previous studies by Pham et al. (1983) and Holmes (1985) have investigated the
probability distribution of wind pressure on buildings. They obtained the probabilistic
descriptions of the normalized wind loading parameters through assumptions and wind tunnel
studies. The wind loading parameters were treated as random variables with probability
distributions and the product of these parameters was assumed to have a lognormal distribution.

Page 27 of 202
Li et al. (1999) also found that a Lognormal distribution compared favourably against Gumbel
and Weibull. Sadek and Simiu (2002) showed that the distribution of peaks can be represented
by the Extreme Value Type I (Gumbel) distribution. Holmes and Cochran (2003) used several
thousand extreme pressure coefficients from repeated time history samples from a wall tap and
a roof tap on a model of the Texas Tech University Test Building to determine the appropriate
probability distributions for the data. They found that the Generalized Extreme Value (GEV)
distribution with a small positive shape factor fits the data well. The GEV distribution is
described as Type I, Type II or Type III distribution depending on the value of the shape factor
(i.e. shape factor = 0, Type I, shape factor > 0, Type II and shape factor < 0, Type III). Cope et
al. (2005) also fitted several probability distribution functions for different regions on the roof
under different wind directions and found that the negatively skewed Type I distribution is the
best fit for most of the cases considered. Li et al. (2009) studied a similar type of full scale
building and found that the Type III Extreme Value Distribution matched the data measured on
a roof corner. Kasperski and Hoxey (2008) also found that Type III distribution can be fitted to
the full scale test data on walls of 6m × 6m × 6m cube Silsoe building. Ben Ayed et al. (2011)
carried out a probabilistic approach to analyse pressure and wind load distribution on the roof of
full scale house. It was shown that the pressure coefficient time series follows a three parameter
Gamma distribution while the peak pressure follows a two parameter Gumbel distribution.
Structural wind load effects can be determined by incorporating influence coefficients with the
wind loads on the tributary area of interest, as shown by Henderson (2010) and Jayasinghe and
Ginger (2011). Holmes and Best (1981) described a method for estimating overall structural
loads which takes into account the correlation of pressures on a building using a covariance
matrix method. The covariance data was used to calculate structural loads such as total uplift,
drag and overturning moment. Ginger et al. (2000) also used the covariance integration method
to calculate structural load effects on roofing components of a gable end house. The design (or
peak) load effects of interest (i.e. roof hold down force) can also be statistically analysed for a
reliability assessment. Furthermore, wind loads are applied on a tributary area with the

Page 28 of 202
corresponding influence effect to determine the design load effects (uplift on cladding fastener,
batten-truss connection, and truss to wall connection). Kasperski and Niemann (1992) also
described a methodology called LRC (Load-Response-Correlation) to estimate the wind load
distribution in linear and non-linear structural behaviour.
Damage investigations such as those by Walker (1975), Henderson et al. (2006), Boughton et
al. (2011) and Leitch et al. (2010) have shown that large internal pressures arising from
dominant openings contributes to large load effects and damage to houses. Several studies have
been carried out on this subject to determine the internal pressure characteristics on the
buildings with differences in volumes, sizes of the dominant openings etc (Liu and Saathoff
(1981), Vickery (1986), Holmes (1979), Ginger et al. (1997), Ginger et al. (2008) and Ginger et
al. (2010)). Design internal pressure data given in standards such as AS/NZS 1170.2 (2011) are
based on results from similar studies.
2.4 Strength capacity of connections
In addition to the wind loads on the roof, dead loads (i.e. self weight) and the strength (i.e.
capacity) of connections need to be determined for a full reliability analysis. The dead loads are
usually based on material weights. Typically, the mean to nominal dead load ratio of 1.05 with
a COV of 0.10 based on the assumed weight of the roof system and other roofing materials has
been specified by Ellingwood et al. (1982), Galambos et al. (1982), Holmes (1985), Pham
(1985) and Rosowsky and Cheng (1999a,b). The assumed probability distribution function in
US studies (Ellingwood et al. (1982), Galambos et al. (1982) and Rosowsky and Cheng
(1999a,b)) was Normal while Lognormal distributions were assumed in the Australian studies
(Holmes (1985), Pham (1985) and Leicester et al. (1985)).
As described by Rosowsky and Cheng (1999a, b) the capacities of connections in light-frame
wood construction in the US were found from engineering approaches such as individual nail
capacity tests as well as non-engineering approaches (damage investigations and experience).

Page 29 of 202
These statistics on connection capacities have been used by Rosowsky and Cheng (1999a,b),
Ellingwood et al. (2004), Lee and Rosowsky (2005), and Li and Ellingwood (2006) for fragility
assessment of light-frame wood construction. They used the Normal probability distribution for
roofing component strength characteristics. Vickery et al. (2006b) used the Lognormal
distribution for sheathing panel behaviour and the Normal distribution for strap and toe nail
uplift resistance in truss-to-wall connections in their study. Shanmugam et al. (2009) derived
probabilistic descriptions of the capacity of connections for light-frame wood construction in
the US. They derived uplift capacities for roof-to-wall connection and sheathing units from field
and laboratory tests and found that the Lognormal distribution is the best fit from statistical
analysis to model uplift capacities of the nail connection types considered. Lognormal
distributions were used by Holmes (2007) and Henderson and Ginger (2007) in Australian
studies to describe the probabilistic characteristics of the connection strengths in older houses.
The capacities of a range of components and connections of contemporary houses in Australia
have been tested by Cyclone Testing Station (CTS). The CTS data-base contains the capacity of
connections for new and old types of constructions subjected to static and cyclic tests based on
several test regimes. The major component damage during Cyclone Tracy was caused by low
cycle fatigue cracking of the cladding under the fixings which resulted in extensive loss of light
gauge roof cladding (Walker (1975)). Consequently, research by Mahendran (1989, 1995),
Jancauskas et al. (1994), Xu (1995a,b) and Henderson (2010) have demonstrated through
extensive test programs that the interaction of the cladding and fixing is a crucial part of the
cladding‘s fatigue response to the applied loading. These studies have shown that the fatigue
strength of cladding connections is less than the static capacities. Similarly, the fatigue strength
of the top hat battens is also less than the static capacities as shown by Fowler (2003). The
strength capacity of truss-to-wall connections on contemporary houses has also been studied by
Cummins (2002).

Page 30 of 202
2.5 Wind related full scale housing and sub assembly testing
The assessment of vulnerability (i.e. structural failure of connections/components) of a house
type to wind loads requires on understanding of the load sharing and structural interdependency
between components. The Cyclone Testing Station at James Cook University, Townsville has
carried out studies on a range of full scale house types and tests on sub-assemblies of houses.
Boughton and Reardon (1982) tested a forty year old house by applying simulated wind load in
both uplift and horizontal directions in a total of 8 tests and measuring approximately 200
deflection readings. They were able to draw conclusions from this work on both the feasibility
of testing full scale houses, and the mechanisms they used to resist wind loads. Those tests were
valuable for evaluating analysis methods and were also used as a reference point for checking
test results. However, the small amount of data collected limited the conclusions that could be
drawn from those tests.
In order to rectify that problem, an instrumentation system was built to enable direct recording
of response data on a digital computer. Boughton and Reardon (1983, 1984) showed the
importance of testing a complete house to simulated winds by testing a new high set house
designed for 42m/s, built according to the standard. Their analysis identified the load transfer
and load sharing between elements, and pinpointed the areas of weakness or excessive strength.
They applied uplift loads on the roof and determined the capacities and failure modes of the
connections subjected to progressively increasing static and cyclic loading. These studies and
many other studies such as those by Reardon (1986, 1990) and Reardon and Mahendran (1988)
have pointed out the importance of the interactions between subassemblies of houses, the effect
of boundary conditions, contribution of the non-structural components, and load-sharing
mechanisms. Reardon and Henderson (1996) and Reardon (1996) have also demonstrated the
strengths and weaknesses in conventional house construction in respect of wind forces and
found that non-structural lining materials provide significant racking strength and stiffness as
shown in Figure 2.1. The strength of the house was determined from combined racking and
uplift loading and it was shown that the strength and stiffness of the house was increased with

Page 31 of 202
the addition of various structural and non-structural components as shown in Figure 2.1. The
behaviour of the individual components in the whole structure was highlighted in these studies.
These studies have also shown that the behaviour and the failure modes of the components in
the whole structure are different from isolated testing of the components. Thus, the studies
indicated that the isolated component test results and their interpretations should be validated
with full scale tests.
Figure 2.1: Change in Lateral response with addition of elements
(Reardon and Henderson (1996))
Henderson (2010) carried out roofing subassembly tests to determine Australian metal clad
roofing response to wind loading. The study found that the peak pressure measurement on a
single pressure tap satisfactorily represents the load on a roof cladding fixing. It was also
confirmed that the cladding fixing load is equal to the pressure on the tap multiplied by the
tributary area of the fixing. Further, the study conducted tests for several cyclic and static tests
and found that the cladding fastener response follows the applied load spectrum with minor

Page 32 of 202
change to stiffness until failure, and then the load is transferred to adjoining fixings. These tests
showed that static tests satisfactorily represent loading on fasteners from the wind load
fluctuations. Furthermore, the spatial variations of wind loads can be captured by conducting a
series of point load tests (i.e. application of point load on the pressure tap locations).
Realistic structural testing of building and building components can be conducted using
Pressure Load Actuators (PLAs) developed at the University of Western Ontario. The roof of a
full scale two story house built (as shown in Figure 2.2) to the Ontario building code was tested
using 58 PLAs to examine the performance of the toe nailed roof-to-wall connection (Morrison
and Kopp (2009)). Toe nail connection is the most common type of primary roof-to-wall
connection of residential houses in the US and Canada. The loadings for the test were obtained
from a wind tunnel study conducted on a 1:50 scale model of the test house. Furthermore, the
toe nail connections were found to fail on the leeward side of the roof first. Hill et al. (2009)
described the structural behaviour of wood roof sheathing panels subjected to realistic wind
loading in order to determine whether dynamically tested panels respond in a similar manner to
statically tested panels. It was found that dynamic loading of wood roof sheathing panels causes
a reduction in capacity. Henderson (2010) studied the performance of roof cladding fastener
connections used in Australian housing using similar real time pressure loading system and
found similar results. Morrison and Kopp (2011) also obtained the uplift capacity of toe-nailed
connection under realistic wind induced pressures. Morrison et al. (2011), Henderson et al.
(2011) and Kopp et al. (2011) described the response of truss-to-wall toe nail connections in hip
and gable roofs subjected to realistic wind loading. They determined the influence functions of
toe nail connections from the application of patch loads (i.e area loads). These studies also have
shown that the load is transferred to the adjacent connections with the progressively increasing
failure of truss-to-wall connections.

Page 33 of 202
Figure 2.2: Test house at UWO (Morrison and Kopp (2009))
Datin and Prevatt (2007) experimentally determined the load transfer functions for a scaled
wood frame gable roof residential structure with wind tunnel derived pressure coefficients to
determine uplift reactions at roof to wall connections. A roof section was constructed at one
third scale trusses with load cells at roof-to-wall connection. The roof sheathing was modelled
with oak strips scaled to the appropriate flexural stiffness to provide scaled load transfer
between trusses. Eighteen loading points per truss were used to develop the influence surface.
Time histories of the wind pressure coefficients obtained from a wind tunnel were converted to
wind pressures and combined with the influence functions developed to generate wind load
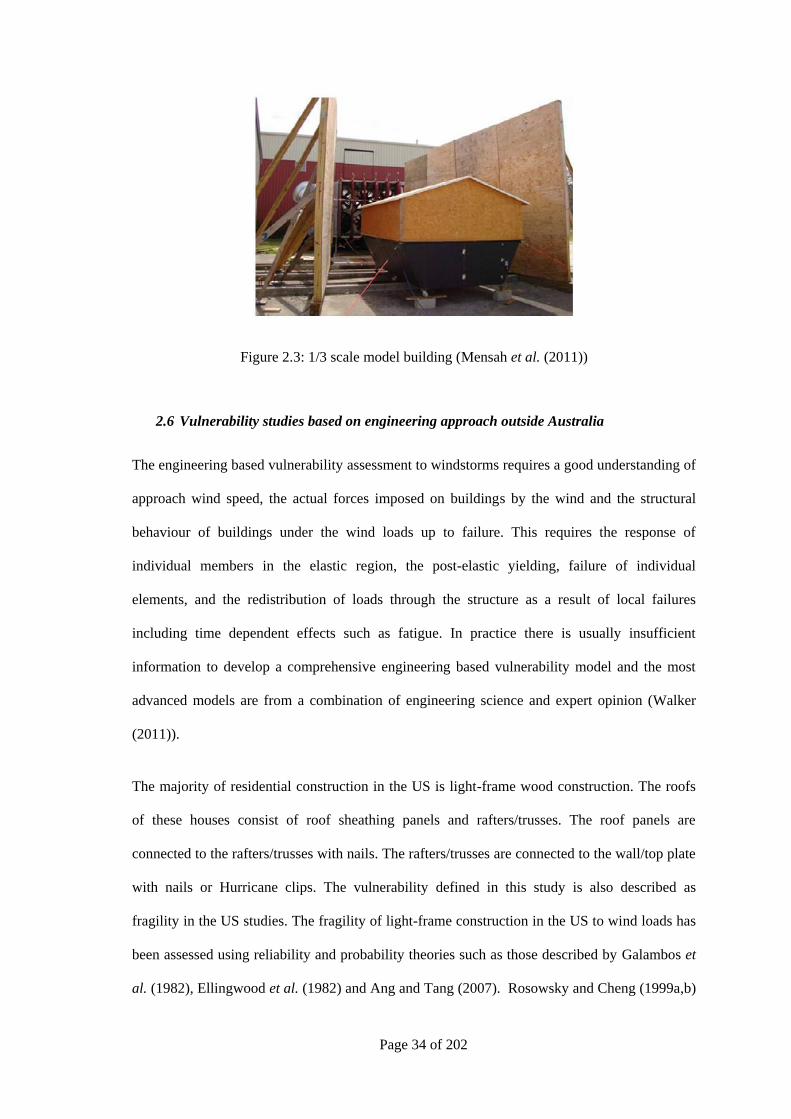
time histories for the truss-to-wall connections. Mensah et al. (2011) and Datin et al. (2011)
derived influence functions normal to the roof on a 1/3 scale light frame wood structure shown
in Figure 2.3, which was then subjected to a wind flow, while the surface pressures and
structural reactions at roof-to-wall and wall-to-foundation connections were simultaneously
recorded. They investigated the applicability of the database assisted design methodology which
utilizes influence functions and wind load time histories to predict structural reactions of light
framed wood structures subjected to fluctuating wind pressures. However, the scaled model
used for these studies cannot be used to predict the non-linear behaviour and the progressive
failure modes of the structural components.
Page 34 of 202
Figure 2.3: 1/3 scale model building (Mensah et al. (2011))
2.6 Vulnerability studies based on engineering approach outside Australia
The engineering based vulnerability assessment to windstorms requires a good understanding of
approach wind speed, the actual forces imposed on buildings by the wind and the structural
behaviour of buildings under the wind loads up to failure. This requires the response of
individual members in the elastic region, the post-elastic yielding, failure of individual
elements, and the redistribution of loads through the structure as a result of local failures
including time dependent effects such as fatigue. In practice there is usually insufficient
information to develop a comprehensive engineering based vulnerability model and the most
advanced models are from a combination of engineering science and expert opinion (Walker
(2011)).
The majority of residential construction in the US is light-frame wood construction. The roofs
of these houses consist of roof sheathing panels and rafters/trusses. The roof panels are
connected to the rafters/trusses with nails. The rafters/trusses are connected to the wall/top plate
with nails or Hurricane clips. The vulnerability defined in this study is also described as
fragility in the US studies. The fragility of light-frame construction in the US to wind loads has
been assessed using reliability and probability theories such as those described by Galambos et
al. (1982), Ellingwood et al. (1982) and Ang and Tang (2007). Rosowsky and Cheng (1999a,b)
Page 35 of 202
studied the reliability of roof system components of these houses subjected to high wind uplift
loads. They selected three base-line structures and wind load statistics were determined using
the historical wind speed records of three coastal regions. The statistics for other parameters in
the wind load equation were obtained from a Delphi investigation by Ellingwood and Tekie
(1999). A Lognormal distribution was assumed for wind loads in their reliability analysis. The
statistical descriptions of strength were obtained from a combination of experimental and
analytical investigations conducted previously. The results of the study identified a relatively
small number of connections that dominate the modes of failure of these house types. It was
determined that the critical sheathing panels were located at the edges of the roof, and critical
roof-to-wall connections were located near the gable end.
Rosowsky and Ellingwood (2002) described an overview of the concepts of performance based
design applied to residential construction and efforts taken to develop usable fragility (i.e.
vulnerability) models and system reliability tools for assessing probable response in light-frame
housing. A major driving force for this has been a move towards the development of
performance based design of structures. Lee and Rosowsky (2005) presented a fragility
assessment for roof sheathing in light-frame constructions built in high wind regions. The
fragility curves show the probability of failure of a particular component or system with
increasing wind speed. They developed a fragility model for individual and complete roof
sheathing uplift using available fastener strength data, wind load statistics, and a code based
approach for evaluating pressures. In this approach, they investigated five simple base-line
structures with different wind directionality profiles, geographic locations, nail types and
enclosure conditions using reliability concepts and probability theories. Ellingwood et al.
(2004) also developed fragility curves for sheathing and truss-to-wall connections in light-frame
wood construction subjected to wind hazards using similar theories. Li and Ellingwood (2006)
proposed a probabilistic framework to evaluate reliability of low rise houses to wind hazards.
Similar to previous studies, the fragility models were developed for the housing components.
Figure 2.4 shows the fragility curves obtained for roof sheathing panels for different nails in
Page 36 of 202
single story residential construction, and it shows the variability in curves with the nail type and
roof overhang. It was assumed that damage results from breach of envelope, and roof panel and
truss damage were due to wind uplift or higher wind pressure due to dominant openings. The
study assessed the applicability of Lognormal cumulative distribution function in risk
assessment of light-frame wood construction. The impact of uncertainties on structural
reliability due to the use of different wind speed models expressed in probabilistic parameters
(Weibull distribution with different parameters by others were used) was also studied and
showed that the choice of different wind speed model for risk assessment purposes has a
significant impact on structural reliability and on engineering decision analysis.
Many of these studies have focused on the behaviour of individual components. However,
increasingly these studies also integrated this information to model the fragility of sub systems
such as roof system and the whole house (Li and Ellingwood (2009) and Lindt and Dao (2009)).
Figure 2.4: Roof panel fragility of two typical houses (Exposure B (ASCE 7-05))
(Li and Ellingwood (2006))
2.6.1 Damage prediction models
Unanwa et al. (2000) recognized the inherently probabilistic nature in the development of
engineering vulnerability models. They presented a more detailed account of the process
including modelling consequence of the failure of one component on the probabilities of failure
Page 37 of 202
of other components. They outlined in considerable detail a framework for establishing a fully
probabilistic engineering based vulnerability model for a building using fault trees to link all the
possible modes of failure and interaction with each other, which they then applied to different
classes of the buildings to obtain the damage to each class as a function of wind speed. This
study incorporated a relatively large amount of expert engineering judgment especially in
relation to the consequent failure of one component on the probabilities of failure of other
components.
Pinelli et al. (2004) described a probabilistic framework for developing a practical probabilistic
model for estimating damage from hurricane winds for residential structures in Florida, USA.
Their study essentially followed the basic approach outlined by Unanwa et al. (2000) but
describing it differently in terms of intersecting Venn diagrams to explain the interaction
between the different modes of failure utilizing information on statistical characteristic of wind
loads and structural behaviour. Their framework assured that all significant and possible types
of wind damage scenarios were accounted and interaction between various types of damages
were included in the calculations. They also described that the probabilistic input data should be
based on laboratory studies, post damage surveys, insurance claims data, engineering analyses,
and Monte Carlo simulation methods. The prediction model focused on various types of
residential construction most common in Florida. The model also incorporated the uncertainties
in loss calculations, based on uncertainties in the estimation of probability matrices, hurricane
wind speeds, structural behaviour, component properties and costs, and building population.
Later, the model was expanded to several commercial, residential and medium-rise buildings
(Pita et al. (2009)). As described by Pinelli et al. (2008), the loss prediction model considered
exterior damage (such as openings, roof cover, roof sheathing, walls and roof to wall
connections), interior and utility damage and contents damage. The assessment of hurricane
induced internal damage to low-rise buildings was also discussed by Pita et al. (2011). The
combined results of external, internal and contents damages produced a set of probabilities of
various level of overall damage ratio (expressed as a % of replacement cost) for a series of

Page 38 of 202
prescribed peak 3s gust wind speeds. Figure 2.5 shows a set of vulnerability curves for weak,
medium, and strong populations of masonry homes in central Florida and Figure 2.6 shows the
contribution of different components of building damage to its vulnerability. Figure 2.6 shows
that the interior and utility damages are also large contributors to the building vulnerability. The
loss prediction model was validated and calibrated against the insurance claim data. A summary
of the main components of the Florida public hurricane loss evaluation model is described by
Hamid et al. (2010).
Figure 2.5: Vulnerability curves for masonry buildings in central Florida (Pinelli et al. (2008))
Figure 2.6: Components of the vulnerability for a masonry medium strength structure (Pinelli et
al. (2008))

Page 39 of 202
Vickery et al. (2006a) developed the HAZUS-MH hurricane model using wind engineering
principles to enable detailed estimates of possible damage and loss to buildings and their
contents due to windstorms. This hurricane hazard model was an improved version of the model
developed by Vickery et al. (2000), and had undergone further validation studies. The wind
hazard model provides the necessary inputs to estimate wind induced damage and loss, as
described by Vickery et al. (2006b). Their model embodies most of the relationships described
in previous studies. The damage to residential buildings was defined in four stages: minor,
moderate, severe and destruction, and the failure probabilities were discussed with the
increasing wind speed. The loss model estimates the costs associated with repairing the
damaged building, replacing damaged contents, and estimating the costs associated with
inability to occupy and use the damaged building. The vulnerability curves were developed in
terms of variation of loss ratio (building and content loss divided by building and content value)
with increasing wind speed. Their model has been validated through comparisons of modelled
and actual insurance losses associated with hurricanes.
2.7 Vulnerability studies in Australia
A review of the current state of vulnerability modelling by Walker (2011), describes the
evolution of techniques since the 1970‘s and the present state of capabilities. Most of the
models used in the insurance industry are empirical models, based on fitting curves to data on
damage, in the form of damage loss ratio versus the wind speed. The most common way of
expressing the damage, damage loss ratio, is defined as the ratio of the damage repair cost to the
replacement cost of the property. The most extensive development of empirical vulnerability
models has been in the US by utilizing relatively large amount of data from losses from
windstorms. However, the direct application of models developed in the US to other counties is
unreliable due to the lack of data on local losses, the use of different forms of construction and
different regulatory conditions. In general, buildings are classified according to classes which
may include age, type of building, the form of structure and type of material, with separate

Page 40 of 202
models for each. This approach was used by Walker (1995) to produce empirical damage
curves that are used for estimating the damage and loss for pre-1980 and post-1980 houses built
in cyclone regions of Australia. For a chosen wind speed, these models simulate the pattern of
wind damage, in terms of the cost of repairing or replacing the damaged building. Empirical
models are modified based as much on expert opinion as statistical analysis to accommodate
significant changes that are made to house construction standards or when data is not available.
A typical approach is to assume the shape of vulnerability curves for buildings of similar types,
and validate these using available loss data or engineering judgment. As damage data at the
higher wind speeds is often unavailable, considerable amount of expert opinion is needed to
generate these curves. Henderson and Harper (2003) and Stewart (2003) produced vulnerability
curves for a range of house types in cyclone regions of Queensland using similar methods and
empirical approaches.
Following a series of discussions, Geoscience Australia (2007) produced vulnerability curves
for a range of house types in Australia. They facilitated a series of wind vulnerability expert
workshops to consolidate available information. The Australian residential building stock was
categorized based on the wind region, the building age, and the building envelope materials. An
expert group was engaged in a relative ranking exercise using the reference vulnerability curves
in Figure 2.7. The overall ranking of vulnerability was expressed as a relative positioning to the
curves in Figure 2.7. In order to be used reliably, these models based on expert opinion need to
be validated with reliable data.

Page 41 of 202
Figure 2.7: Reference curves for heuristic ranking process by expert group engaged through
workshop activity, N and C classification according to AS 4055(2006) (Geoscience Australia
(2007))
Compared to studies done in the US, limited work has been carried out on housing vulnerability
in Australia using the engineering approach. Thus, only a few studies have been carried out
using statistical descriptions of capacity of roofing components (based on test data) and wind
loads considering the load transfer and interdependency between structural and non-structural
components for Australian conditions. Henderson and Ginger (2007) studied the vulnerability
of a high-set 1960‘s house with low pitch gable roof built in the northern part of Australia to
wind speeds experienced in tropical cyclones by using reliability concepts. They assessed a
common house which is of rectangular plan, timber-framed, elevated on piers about 2m high.
The roofing is metal sheeting on a low or flat pitch roof. The metal cladding is screw fixed to
the timber battens which are connected to the timber rafters with nails. The rafters are
connected to the wall plate with skew nails. In these houses threaded steel rods tied down the
top plate to the base of the houses at about 3m spacing around the perimeter. The vulnerability
of each connection type was determined by using reliability methods incorporating probability
theory and reliability concepts described by Holmes (1985), Leicester et al. (1985), Pham
(1985), Pham et al. (1983), Melchers (1985), and Tang and Melchers (1985). The study
estimated the likely failure mode and percentage of failure for a representative proportion of
houses with increasing wind speed. The wind load and the component connection strengths
were treated as random variables with Lognormal distributions. It considered the

Page 42 of 202
interdependency between the structural components in the house, when estimating the types and
percentages of the overall failures in the population of these houses. The load sharing between
components were based on very limited testing and damage investigation results. The
progressively increasing percentage of houses being subjected to high internal pressures
resulting from damage to the envelope was considered. Figure 2.8 shows the typical
vulnerability curves obtained from their study for different parts of the house with increasing
wind speed. Results from their study also compared favourably with levels of damage and
related modes of failure for high set houses observed in post cyclone damage surveys.
Figure 2.8: Estimated probability of failure of components in the modelled houses (Henderson
and Ginger (2007))
Geoscience Australia in collaboration with Cyclone Testing Station and JDH Consulting, have
commenced developing a software tool, called VAWS, to quantitatively model vulnerability of
residential buildings to severe wind in Australia. Wehner et al. (2010b) described the software
package and presented typical results. The software package is used to specify a type of house
with values for component/connection strengths, external and internal pressure coefficients,
shielding coefficients, wind speed profile, building orientation, debris damage parameters, and
component weights sampled from pre-determined probability distributions. Then, for successive
gust wind speed increments, it calculates the forces in all nominated connections and identifies

Page 43 of 202
the connections that have failed and translates it into a damage scenario which is cost to
calculate a damage index (expressed as the total repair cost) for that wind speed. The software
package has been developed to model the damage to roof sheeting, roof battens, roof structure,
wall cladding, damage from windborne debris and damage from water ingress. The model has
been validated for a single house type: a timber frame high-set, fibro clad house type in
residential building structures in the 1960‘s and early 1970‘s cyclone regions of Queensland to
Darwin, as analysed by Henderson and Ginger (2007). It was implied that future work involved
extending the scope of the tool to include damage to wall structure as well as calibrating results
against damage observed during post-storm surveys.
2.8 Summary and Discussion
Recent damage investigations have shown that the structural system of contemporary houses
generally performs satisfactorily in windstorms approaching the design wind speed. However,
shortcomings in some aspects of design and construction mean that there is still an increased
risk to contemporary housing from windstorms. The increasing population in cyclonic areas and
the uncertainty regarding the potential effects of climate change on the frequency and
magnitude of windstorm has increased this risk.
If the nature of the disaster risks is to be fully understood and cost effective measures taken to
mitigate them, a better understanding of the structural response of contemporary houses to
windstorm is required. Studying the response of the roof structure (i.e. the most vulnerable part
of the house) to wind loading will provide data for assessing house performance in a windstorm.
The response of the roof is dependent on the transfer of load from cladding to batten to truss to
wall, the redistribution of load with progressive failure and the interdependency of structural
elements, with increasing wind speed.
Most studies on reliability were primarily focused on individual component behaviours and
consequence of their failure. The overall vulnerability of a house type is concerned with the

Page 44 of 202
behaviour of whole house structural system including progressive damage with increasing loads.
It is about the integration of the response of many components acting together as a structural
system. The assessment of reliability for a complex structural system (such as the roof of a
house) has to consider the interaction of all the structural components and members of the
system. Furthermore, the number of possible failure modes can be quite large. These issues
should be addressed by studying the load sharing and interdependency between components.
In order to develop vulnerability models for contemporary houses, it is essential to have
knowledge of the variability and uncertainties of load actions and building response. The
statistical parameters of connection strengths can account for the uncertainty and variability
associated with loads. The structural system and the connections in the contemporary houses in
Australia are different from previous studies on older Australian houses and other overseas
studies. Most of those studies have used Normal and Lognormal distributions to describe the
strength data. The probabilistic descriptions of connection strengths based on cyclic and static
test data of are required to accurately assess the performance of houses of a selected type.
Furthermore, accurate representation of load transfer among these connections is also
significant.
Full scale and wind tunnel studies of low rise buildings have shown that the approach wind flow
generates spatially and temporally varying pressure on roofs, and these loads are dependent on
the approach wind direction and also the terrain and topographic features. A boundary layer
wind tunnel test is the most effective means of obtaining appropriate pressure or force
coefficients for use in wind loading standards. Standards such as AS/NZS 1170.2 (2011)
provide a nominal design wind load on a structure and the direct use of such values in
vulnerability assessment is a conservative interpretation. Several previous studies have
determined the wind load acting on a range of house types, but studies on the area averaged
pressure acting on individual components/connections over different areas of the roofs in
probabilistic terms are scarce. Therefore, it is necessary to obtain the probabilistic descriptions
of the wind pressure acting on connections in different areas of the roof in order to determine

Page 45 of 202
vulnerability of its components and connections. The structural components of the buildings
should be clearly identified and the wind loads acting on these elements needs to be determined.
A dedicated wind tunnel model test on this type of house is carried out to provide an accurate
representation of the wind loads.
Research on the structural response to wind loading has been focused on improving design
procedures and design codes. Full scale and sub-assembly tests conducted by the Australian and
international researchers have produced data on the overall response of houses to wind loads.
However, there is limited test data available to describe the load sharing, progressive failure and
resulting interdependency between components in contemporary Australian houses. A series of
tests on a specimen roofing sub-assembly is carried out covering a range of scenarios to
produce data that can be used in structural vulnerability models. The results from experiments
can be used in combination with analytical results obtained from structural analysis models for
assessing the structural response to a range of loads. Linear and non-linear behaviour of
structural components are studied in order to predict the behaviour of housing components
subjected to windstorms.
The vulnerability assessment of houses in Australia to windstorms has mostly been based on
empirical approach and expert opinion. Only limited studies have been carried out on actual
probabilistic nature of the damage to the housing from wind which is needed if a reliability
performance based approach to design is to be developed. Some of the vulnerability models
described use the codified values which may be conservative interpretations, for determining
the load actions of the buildings. The use of these values can provide unreliable vulnerability
estimates of houses or housing components. Furthermore, current vulnerability models do not
satisfactorily account for load sharing, load distribution and progressive failure in house
components. Physical tests carried out on a structural system provide data required for
calibrating and validating the vulnerability models. Statistical descriptions of wind loading and
component strength can be combined with sub-assembly test data to improve vulnerability
models.

Page 46 of 202
3 ROOF STRUCTURE OF A CONTEMPORARY HOUSE AND ANALYSIS
METHODS
This chapter presents the structural system, roofing components and connections of a common
masonry block house, based on a survey of housing in a cyclonic region of Australia.
Furthermore, the capacities of roofing connections are presented in terms of probabilistic
parameters. This chapter also describes theories and methods used in this thesis to calculate
nominal design wind loads and to assess vulnerability of roofing connections.
3.1 Masonry Block House
A survey was carried out by a team from CTS including the author in cyclonic region of North
Queensland in Australia, to obtain the structural characteristics of contemporary houses under
construction. The features such as size, shape, cladding, roof shape and pitch, method of
construction, type of connections and structural system were surveyed on approximately 100
houses. In addition, certified drawings of houses submitted to the local authorities were also
reviewed. More than 90% of the houses surveyed were of masonry block type. A typical house
of this type is constructed on a concrete slab on ground with masonry block walls filled with
concrete and continuous reinforcement at regular intervals from the bond beam at the top of the
wall to the slab. These houses have either gable or hip roof shape or a combination of these.
This study focuses on the gable shape roof, as they experience larger wind loads and post
disaster surveys reveal that they are more vulnerable to damage in windstorms.
Figure 3.1 shows a masonry block house under construction (i.e. a house with a hip roof shape)
and Table 3.1 provides a summary of the survey data in statistical terms. Based on the survey
data, a single story gable end 10m × 19.8m × 2.7m low rise house with 0.6m roof overhang and
22.5° pitch represents a common contemporary house.
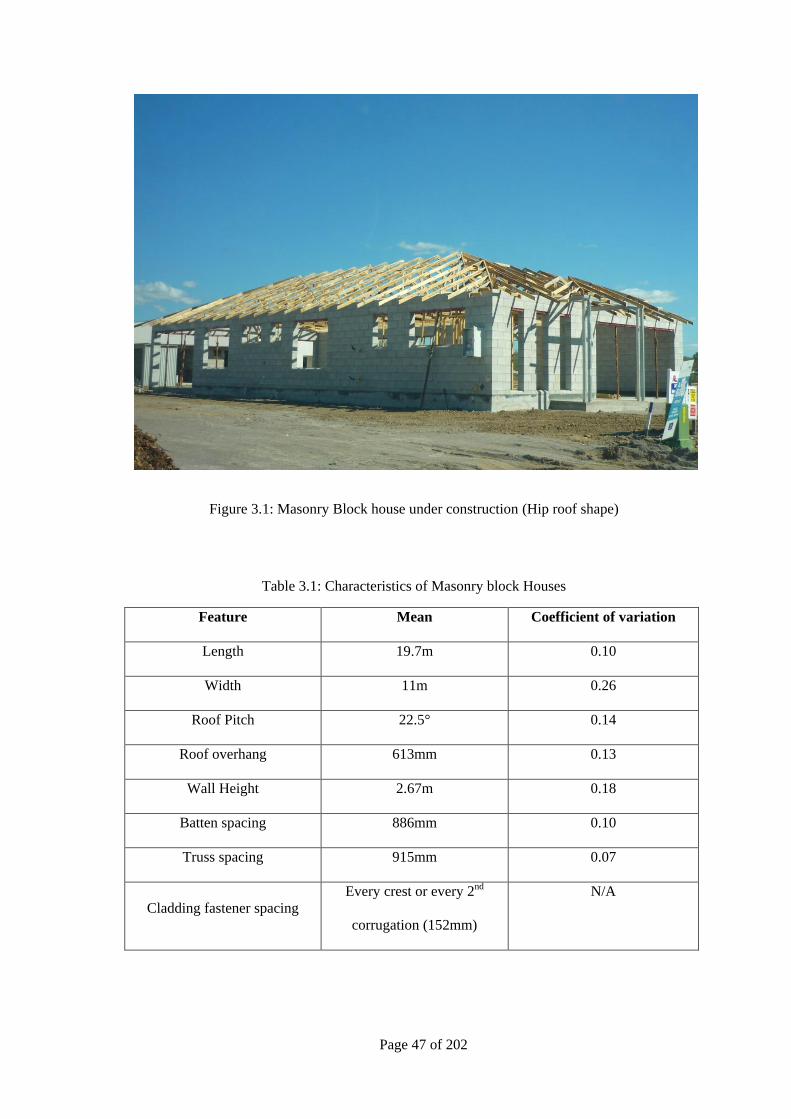
Page 47 of 202
Figure 3.1: Masonry Block house under construction (Hip roof shape)
Table 3.1: Characteristics of Masonry block Houses
Feature Mean Coefficient of variation
Length 19.7m 0.10
Width 11m 0.26
Roof Pitch 22.5° 0.14
Roof overhang 613mm 0.13
Wall Height 2.67m 0.18
Batten spacing 886mm 0.10
Truss spacing 915mm 0.07
Cladding fastener spacing
Every crest or every 2nd
corrugation (152mm)
N/A

Page 48 of 202
3.2 Roofing connections
The roof structure of masonry block house consists of timber trusses and top hat battens clad
with metal roof sheeting. The trusses and battens are spaced nominally 900mm apart with an
overhang of 600mm to fit the house dimensions. Figure 3.2 shows a schematic of the trusses
and battens in a masonry block house. The timber trusses are manufactured from machine grade
pine (MGP12) 90mm × 35mm components joined with toothed truss connector metal plates and
connected to the bond beam at the top of the wall with a metal cleat bolted to the truss, as
shown in Figure 3.3. In some cases, straps or angle brackets are also used to connect the truss to
the wall instead of cleats. Top hat battens, (40mm × 40mm), manufactured from G550 steel
with a base metal thickness (BMT) of 0.75mm are fixed to the top chord of these trusses with
two Type-17 screws (No14-10 × 25mm), as shown in Figure 3.4. The metal roof cladding is
usually corrugated profile with a base metal thickness of 0.42mm and is attached to the battens
using Type-17 cladding fasteners (No14-10 × 50mm) without cyclone washers, as shown in
Figure 3.5. The spacing of the cladding fasteners is every second crest of the corrugations
(152mm) but sometimes different spacings are used in the edges and middle of the roof. Ceiling
sheeting (usually plasterboard) is fixed directly to the trusses or to metal ceiling battens
connected to the bottom chord of trusses.
Figure 3.2: Battens and trusses in Masonry block house

Page 49 of 202
Figure 3.3: Truss-to-wall connection
Figure 3.4: Batten-to-truss connection
Figure 3.5: Roof cladding-to-batten connections
3.2.1 Connection Strengths
The variability of strength of components and connections in houses are associated with
differences in design, materials, construction practices and workmanship. This variability that
exists even in connections that are designed to the same specifications and other uncertainties
are represented in the probabilistic models. This study analyses the responses and failure of
Roof cladding fastener
Batten-to-truss connection
Truss-to-wall/bond beam connection
Cladding
fasteners
Type 17
Screws

Page 50 of 202
The Cyclone Testing Station (CTS) has compiled a database of strength capacities for a range
of connection types, based on experiments, structural analysis and damage investigations. The
capacities of these connections are derived from static and a range of cyclic test regimes by
considering the full scale behaviour of roof systems. This database was used to obtain the
statistical properties for the capacity of each connection. The particular probability distribution
function (PDF) for each connection type was defined from fitting the available data with
various distribution types (i.e. Normal, Lognormal, Rayleigh, Gamma and Weibull) and using
the Anderson-Darling (A-D) goodness-of-fit test. The A-D test is particularly useful when the
tails of a distribution is important (Ang and Tang (2007)). The values of the capacities are
normalized by the design value of each connection, ϕRN. Where ϕ is the capacity reduction
factor (ϕ=0.8 was used in this study) and RN is the nominal capacity of the connection. The
design values were obtained from codes and product manuals. Table 3.2 shows the statistical
descriptions of the capacity for each connection.
Table 3.2: Connection Capacity Statistics
Connection Mean(R/ϕRN) COV PDF
Roof cladding-to-batten connection 1.22 0.15 Lognormal
Batten–to-truss Connection 1.30 0.30 Lognormal
Truss-to-wall connection 1.40 0.30 Lognormal
The Lognormal distribution was found to be the best fit for all three connection strengths. It
satisfied all the considered levels of significance (1%, 2%, 5%, 10% and 20%) for the cladding-
to-batten connection (p-value 0.55). The batten-to-truss connection was most strongly a
Lognormal distribution with p-value 0.995 (the higher the p-value the stronger the assumed
distribution becomes) and truss-to-wall connection gave a p-value of 0.58 with satisfying all the
confidence levels.

Page 51 of 202
3.3 Design of houses
Structural design of houses is required in order to protect building occupants against injury or
loss of life. Therefore, the main objective of current codes (BCA (2011)) and standards is to
prevent building failures, leading to loss of life during extreme events. Over the past years,
performance based design has been acknowledged as a rational approach in the design of
structures, and is gradually becoming accepted around the world. In Australia, AS/NZS 1170.0
(2002), AS/NZS 1170.1 (2002), AS/NZS 1170.2 (2011) and AS 4055 (2006) are mainly used
for deriving dead, live and wind load actions. AS/NZS 1170.0 (2002) stipulates combinations of
loads including wind actions to be applied on structural system components that are checked
against their design strength. Failure occurs when the combined load exceeds the component‘s
strength. The limit state design takes a more rational approach to structural safety by defining
partial load factors for each type of loading and separate resistance factor for the resistance.
The typical design relationship is given by
(3.1)
Where - Factored structural load effect given by the adverse combination of loads, R-
Structural resistance, and - Capacity reduction factor
The ultimate design relationship for the wind load effects on roofing connections is given by
Equation 3.2.
(3.2)
Where D- Dead load, W- Wind load, - Dead load factor, -Wind load factor
3.3.1 Design approach for wind loads
The wind load standard AS/NZS 1170.0 (2002) used in Australia is based on the limit state
design approach introduced in the 1980‘s. AS/NZS 1170.2 (2011) provides data for calculating
the design wind speeds related to the return period, for the class of structure specified in BCA,

Page 52 of 202
for cyclonic and non-cyclonic regions. The wind loads for housing standard AS 4055 (2006) is
based on AS/NZS 1170.2 and uses a 500yr return period wind speed for ultimate limit state
design. The 10 m height gust wind speed (VR) as defined in AS/NZS 1170.2 (2011), for a
1:500yr probability in cyclonic region C and D is 69m/s and 88m/s, respectively. These wind
speeds have a specified nominal probability of exceedance of about 10% in 50 yrs. In most
cyclone and non-cyclone regions, the determination of wind loads for housing is carried out
using the standard on wind loading for residential housing, AS 4055 (2006).
Wind loads for the design of cladding fixings on buildings can be calculated from pressures
derived from nominal shape factors or pressure coefficients, provided in Standards such as
AS/NZS 1170.2 (2011). The design pressures are calculated from Equation 3.3, where ρ is the
density of air, is the design gust wind speed at mid-roof height given in Equation 3.4 and
is the aerodynamic shape factor. Quasi-steady, external pressure coefficients, , and
internal pressure coefficients, , combined with factors for area-averaging, , surface-
combinations, , permeable cladding, , and local-pressure effects, , are used to
determine values for external and internal pressures as shown in Equations 3.5 and 3.6.
(3.3)
(3.4)
(3.5)
(3.6)
Where, – Regional gust wind speed at 10m height in Terrain Category 2 for a specified
return period, - wind directional multiplier, – terrain /height multiplier, - shielding
multiplier, and - topographic multiplier
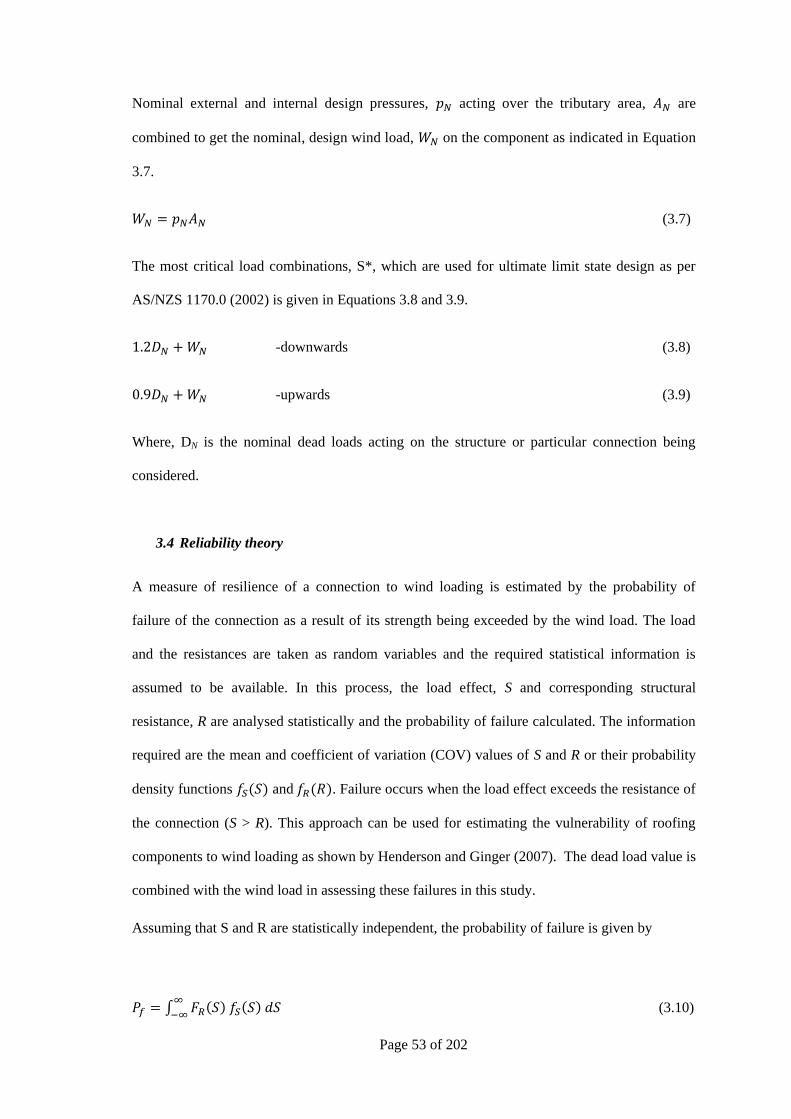
Page 53 of 202
Nominal external and internal design pressures, acting over the tributary area, are
combined to get the nominal, design wind load, on the component as indicated in Equation
3.7.
(3.7)
The most critical load combinations, S*, which are used for ultimate limit state design as per
AS/NZS 1170.0 (2002) is given in Equations 3.8 and 3.9.
-downwards (3.8)
-upwards (3.9)
Where, DN is the nominal dead loads acting on the structure or particular connection being
considered.
3.4 Reliability theory
A measure of resilience of a connection to wind loading is estimated by the probability of
failure of the connection as a result of its strength being exceeded by the wind load. The load
and the resistances are taken as random variables and the required statistical information is
assumed to be available. In this process, the load effect, S and corresponding structural
resistance, R are analysed statistically and the probability of failure calculated. The information
required are the mean and coefficient of variation (COV) values of S and R or their probability
density functions and . Failure occurs when the load effect exceeds the resistance of
the connection (S > R). This approach can be used for estimating the vulnerability of roofing
components to wind loading as shown by Henderson and Ginger (2007). The dead load value is
combined with the wind load in assessing these failures in this study.
Assuming that S and R are statistically independent, the probability of failure is given by
(3.10)
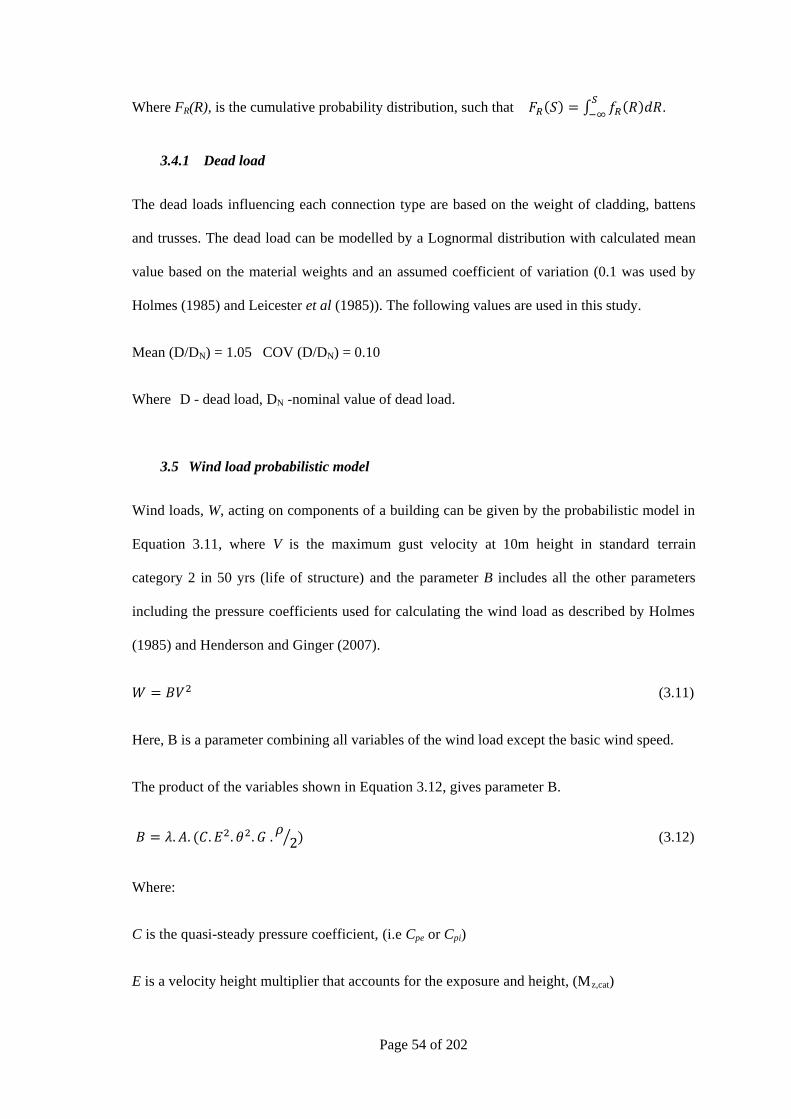
Page 54 of 202
Where FR(R), is the cumulative probability distribution, such that
.
3.4.1 Dead load
The dead loads influencing each connection type are based on the weight of cladding, battens
and trusses. The dead load can be modelled by a Lognormal distribution with calculated mean
value based on the material weights and an assumed coefficient of variation (0.1 was used by
Holmes (1985) and Leicester et al (1985)). The following values are used in this study.
Mean (D/DN) = 1.05 COV (D/DN) = 0.10
Where D - dead load, DN -nominal value of dead load.
3.5 Wind load probabilistic model
Wind loads, W, acting on components of a building can be given by the probabilistic model in
Equation 3.11, where V is the maximum gust velocity at 10m height in standard terrain
category 2 in 50 yrs (life of structure) and the parameter B includes all the other parameters
including the pressure coefficients used for calculating the wind load as described by Holmes
(1985) and Henderson and Ginger (2007).
(3.11)
Here, B is a parameter combining all variables of the wind load except the basic wind speed.
The product of the variables shown in Equation 3.12, gives parameter B.
(3.12)
Where:
C is the quasi-steady pressure coefficient, (i.e Cpe or Cpi)
E is a velocity height multiplier that accounts for the exposure and height, (Mz,cat)

Page 55 of 202
θ is a factor for wind directionality effects (Md)
G is a factor that accounts for gusting effects and is related to Ka and Kl,
ρ is the density of air,
A is the tributary area, and
λ is a factor to account for modelling inaccuracies and uncertainties in analysis methods
(unknowns)
The nominal design load is made up of nominal values of all the above parameters together with
the wind speed as shown in Equation 3.13. This probabilistic relationship can be presented in
non dimensional form of Equation 3.14.
(3.13)
(3.14)
Where,
Each of normalized terms in the brackets is treated as random variables with probability
distributions, mean, and coefficient of variation obtained from analysing available data. The
estimation of the values of mean and coefficient of variation is a difficult procedure. It requires
statistical data which in many cases is virtually nonexistent. However, these can be estimated
from survey data, Delphi analysis and wind tunnel model studies. In cases when this data does
not exist, assumptions are made.
3.6 Summary and Discussion
The study identified the structural system, roofing components and connections of a common
masonry block house, based on a survey of housing in the cyclonic region of Australia. The
capacities of roofing connections (i.e. cladding fastener connection, batten-to-truss connection

Page 56 of 202
and truss-to-wall connection) were obtained from available test data, and were found to be
greater than the capacities specified in codes and product manuals. The strength capacities used
in this study account for the fatigue strength of the connections determined according to the
current test standards (i.e. Low-High-Low (L-H-L) test regime etc). It was also found that the
uplift capacity of these connections can be described by Lognormal distribution.
This study focuses on commonly used connections related to these structural systems. The
structural systems of contemporary Australian house roofs are made up of timber and steel
materials with variability in engineering material properties. In addition, these structural
systems are designed and fabricated with a range of connections and fastener details, and
varying construction quality and code enforcement from building to building. Thus, the
variability of the connection strength changes with these factors and should be considered to
assess the vulnerability of these houses in more generalized manner. In order to achieve this, the
strength capacity of these connections with different fixing types should be determined
considering the full scale behaviour of the structure such as those used in this study. The
laboratory conditions under which individual roof connections are tested may also significantly
influence the resulting statistical parameters and probability distributions. This can be a major
source of uncertainty for vulnerability assessments. The individual connection tests can be
useful for specifying the connection design values which are usually conservative
determinations.

Page 57 of 202
4 WIND LOADING
This Chapter presents the wind load acting over the roof of the common masonry block house
obtained from a wind tunnel model study. Furthermore, the variability of these loads and the
probabilistic descriptions of wind loads over the connections on the roof are presented. These
results are also compared with the loads obtained using AS/NZS 1170.2 (2011).
4.1 Experimental setup
Wind tunnel model studies were carried out in the 2.0m high 2.5m wide 22.0m long boundary
layer wind tunnel at the School of Engineering and Physical Sciences, James Cook University.
The approach atmospheric boundary layer was simulated at a length scale of 1/50 over a fetch
by using a 250mm high trip board at the upstream end followed by an array of blocks on the
tunnel floor. Figures 4.1 and 4.2 show that the mean velocity (referenced to mean velocity at
25m) and turbulence intensity profiles measured fall between terrain category 2 and 3 profiles at
mid roof height as per AS/NZS1170.2 (2011), confirming the profiles obtained by Ginger et al.
(2000).
Figure 4.1: Mean velocity profile
0
10
20
30
40
50
0 0.5 1 1.5
Full
scal
e e
leva
tio
n(m
)
U/U25m
TC3
Measured
TC2

Page 58 of 202
Figure 4.2: Turbulence intensity profile
The level of detail that can be incorporated in a wind tunnel model depends on the scale of
model and its size. In case of the low rise house studied here, a model of 1/50 satisfactorily
accommodates essential details such as the eaves, overhang etc. The information required for
design is the peak loads acting over the tributary area of interest. This is a significant factor
affecting to the structural behaviour.
A gable end 10m × 19.8m × 2.7m low rise house with 0.6m roof overhang and 22.5° pitch was
constructed at a length scale of 1/50. The batten and truss layout and the pressure tap locations
are shown in the Figure 4.3 (The isometric view is also shown in Appendix A). The battens
spaced at 877mm in general areas and 650mm on eave and the roof trusses spaced at 900mm
apart are identified from A to W. The wind pressures were measured on the pressure taps shown
in Figures 4.3. Each roof truss tributary area was divided in to sixteen patches identified as
1...16 as shown in Figure 4.4. These patches are the typical batten-to-truss connection tributary
areas that are named as B1...B16 for truss B, C1...C16 for truss C etc. The wind loads on
tributary areas representing cladding fixings in regions; P, Q, R, S, T shown in Figure 4.4, are
0
5
10
15
20
0 0.1 0.2 0.3 0.4 0.5
Full
scal
e e
leva
tio
n (
m)
Turbulance intensity
TC3
Measured
TC2
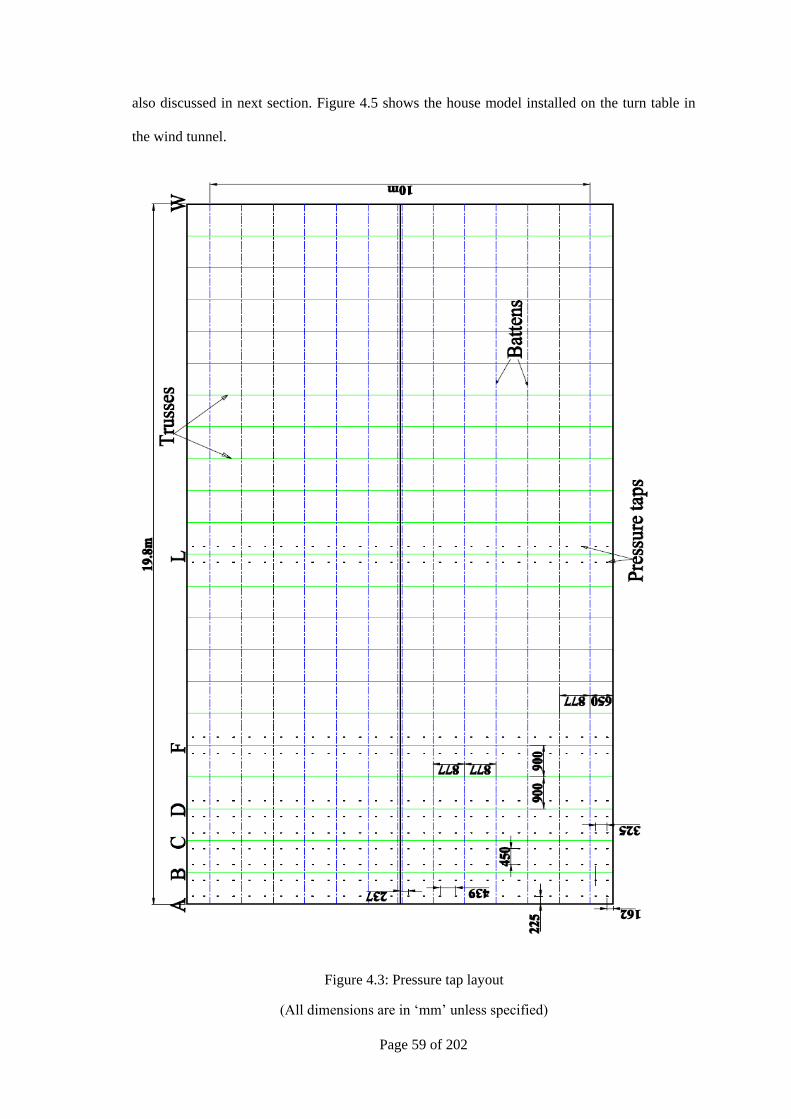
Page 59 of 202
also discussed in next section. Figure 4.5 shows the house model installed on the turn table in
the wind tunnel.
Figure 4.3: Pressure tap layout
(All dimensions are in ‗mm‘ unless specified)

Page 60 of 202
Figure 4.4: 10m x 19.8m x 2.7m gable end low rise house with 22.5°roof pitch
Figure 4.5: 1/50 scale model of the 10m x 19.8m x 2.7m house in the wind tunnel
External pressures were obtained for approach wind directions θ = 0° to 360° in steps of 15°.
Pressure taps on each patch were connected to a transducer using a tubing system via a pressure
measurement system and pressures on 62 taps were measured simultaneously. The fluctuating
θ θ =0°
Page 61 of 202
pressures were cut off at 625Hz and sampled at 1250 Hz for 30 seconds, and presented as
pressure coefficients (
). For a length scale ratio of 1/50 and velocity ratio
of 2/5, this results in an equivalent full scale observation time of 10 minutes and a time scale of
1/20. These pressure coefficients were statistically analysed to obtain mean ( , maximum
( and minimum ( pressure coefficients in a single run;
Where,
is the mean dynamic pressure at mid roof height h. Five runs were conducted for
each angle to obtain repeat sets of pressure coefficients.
Henderson (2010) found that the wind pressure on series of cladding fixings can be represented
by a single pressure tap. Therefore, the loads on cladding fixings in regions P, Q, R, S and T
were obtained using the individual taps in each region. The loads on batten fixings were
obtained by averaging simultaneous pressures acting on the group of taps representing each
batten-to-truss connection tributary area. However, the load transmitted to the batten-to-truss
connection is dependent on the cladding and structural support system including their
directional stiffness properties. Therefore, this area averaged pressure may not give a
satisfactory representation of the wind loads acting on the batten-to-truss connection. This is
determined in Chapter 6 combining structural tests results in Chapter 5 with the wind loads.
4.2 Experimental results
4.2.1 Pressure distribution-cladding
The variation of external pressure coefficients and for all five runs on taps
representative of cladding fixings with the wind approach direction (θ), for regions P, Q and T
are shown in Figures 4.6, 4.7 and 4.8. The variation of external pressure coefficients for R and S
are also shown in Appendix A. Wind loading standards typically provide design pressure
Page 62 of 202
coefficients for wind directions perpendicular and parallel to the ridge. The nominal peak
pressure coefficients ( ) derived from Section 5 of AS/NZS1170.2 (2011) is
= ×
× , where
is the external pressure coefficient, is the local pressure factor and
is the velocity gust factor which was taken as 1.875 in this study as per AS/NZS 1170.2
(1989). Here, and are gust wind speed and mean wind speed respectively at mid roof
height. These values for each region are also shown in Figures 4.6, 4.7 and 4.8 for wind
approach directions 0°, 90°, 180° and 270°. It should be noted that there are 20 values of
pressure in each region for each wind approach direction based on the number of repeat runs
(five) and number of pressure taps in each area (four).
These Figures show that there was a large variability in wind load at each wind approach
direction and the largest suctions were expected in region P for wind approach directions 135°
to 150°. The design of cladding fastener fixings are based on largest load stipulated in AS/NZS
1170.2. As shown in the Figures, the largest code design values occur at wind approach
direction 90° in region Q. Figure 4.6 shows that the peak pressures obtained for region P
exceeded the design values stipulated in AS/NZS 1170.2 (2011) for wind approach directions
120° to 150°. Hence, the design values underestimated the design of cladding fixing on region
P. Compared to P and Q regions, R, S and T regions have lower suctions. Thus, the roof
cladding at roof corners experience larger wind loads compared to those at middle regions and
cladding fixings in region P are more prone to failure.
These peak and mean values were in close agreement with values and patterns obtained from
the previous wind tunnel model studies such as those by Holmes and Best (1977), Reardon and
Holmes (1981), Meecham et al. (1991), and Lin and Surry (1998). However, there were some
differences due to variations in the experimental set up in those studies (i.e. Changes to the
basic dimensions of the houses such as roof pitch, height etc).
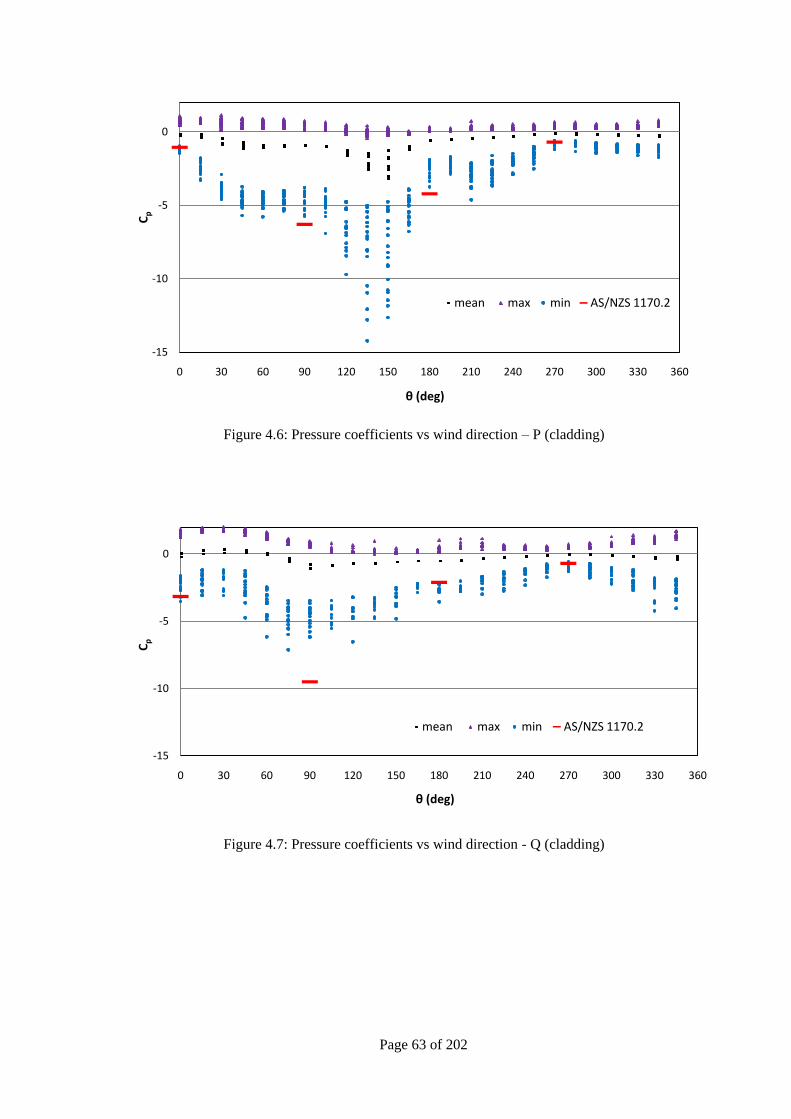
Page 63 of 202
Figure 4.6: Pressure coefficients vs wind direction – P (cladding)
Figure 4.7: Pressure coefficients vs wind direction - Q (cladding)
-15
-10
-5
0
0 30 60 90 120 150 180 210 240 270 300 330 360
Cp
θ (deg)
mean max min AS/NZS 1170.2
-15
-10
-5
0
0 30 60 90 120 150 180 210 240 270 300 330 360
Cp
θ (deg)
mean max min AS/NZS 1170.2
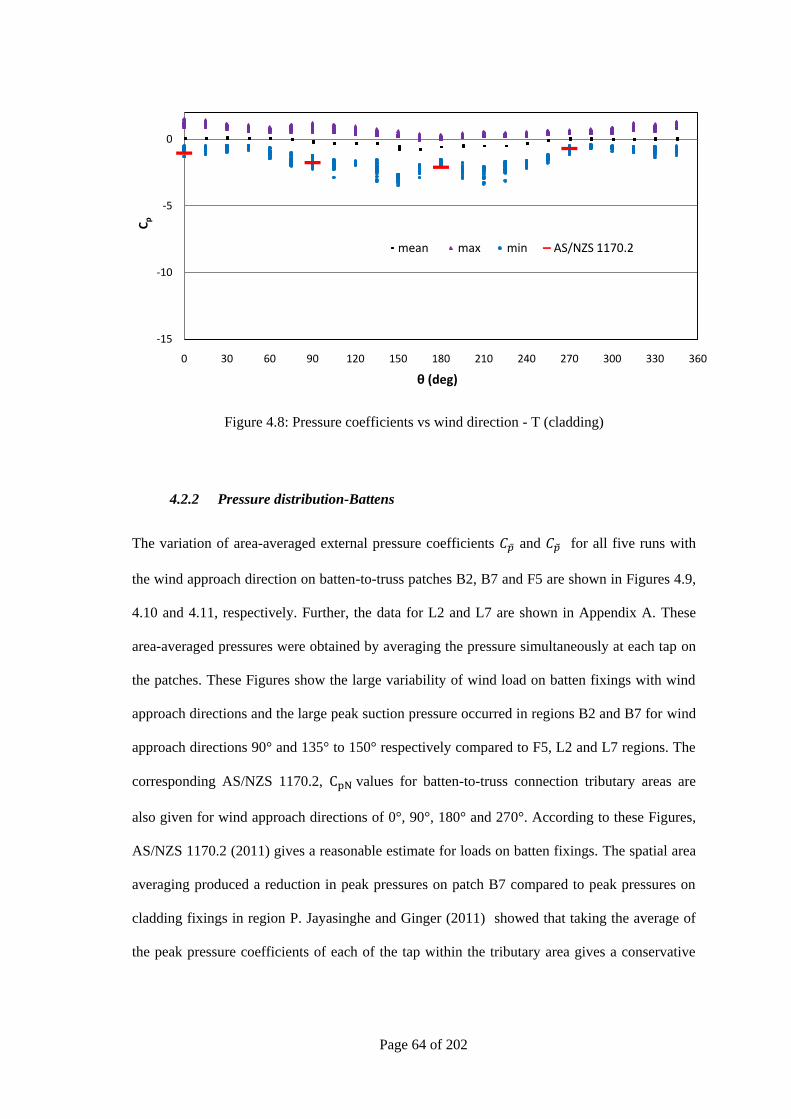
Page 64 of 202
Figure 4.8: Pressure coefficients vs wind direction - T (cladding)
4.2.2 Pressure distribution-Battens
The variation of area-averaged external pressure coefficients and for all five runs with
the wind approach direction on batten-to-truss patches B2, B7 and F5 are shown in Figures 4.9,
4.10 and 4.11, respectively. Further, the data for L2 and L7 are shown in Appendix A. These
area-averaged pressures were obtained by averaging the pressure simultaneously at each tap on
the patches. These Figures show the large variability of wind load on batten fixings with wind
approach directions and the large peak suction pressure occurred in regions B2 and B7 for wind
approach directions 90° and 135° to 150° respectively compared to F5, L2 and L7 regions. The
corresponding AS/NZS 1170.2, values for batten-to-truss connection tributary areas are
also given for wind approach directions of 0°, 90°, 180° and 270°. According to these Figures,
AS/NZS 1170.2 (2011) gives a reasonable estimate for loads on batten fixings. The spatial area
averaging produced a reduction in peak pressures on patch B7 compared to peak pressures on
cladding fixings in region P. Jayasinghe and Ginger (2011) showed that taking the average of
the peak pressure coefficients of each of the tap within the tributary area gives a conservative
-15
-10
-5
0
0 30 60 90 120 150 180 210 240 270 300 330 360
Cp
θ (deg)
mean max min AS/NZS 1170.2

Page 65 of 202
(i.e larger) peak area-averaged pressure, but with a similar trend. These values were higher than
the simultaneous peak pressure measurements obtained.
Figure 4.9: Pressure coefficients ( ) vs wind direction – Batten-to-truss connection B2
Figure 4.10: Pressure coefficients ( ) vs wind direction – Batten-to-truss connection B7
-6
-5
-4
-3
-2
-1
0
1
0 45 90 135 180 225 270 315 360
Cp
θ(deg)
Min AS/NZS 1170.2 Mean
-6
-5
-4
-3
-2
-1
0
1
0 30 60 90 120 150 180 210 240 270 300 330 360
Cp
θ(deg)
Min AS/NZS1170.2 Mean

Page 66 of 202
Figure 4.11: Pressure coefficients ( ) vs wind direction – Batten-to-truss connection F5
4.3 Probability distributions
The peak pressure on cladding fixing tributary area in each region is represented as normalized
pressure coefficients ( for each wind approach direction. The variation in peak
pressure coefficient is described in statistical terms by fitting the data to several standard
probability distribution functions (PDF) including Normal (N), Lognormal (LN), Rayleigh
(RE), Gamma (GM), Weibull (WB) and Generalized Extreme Value (GEV). These distributions
accommodate the skewness of the data set (i.e. Gaussian or non-Gaussian). The distributions
have several shapes with negative or positive skewness other than the normal distribution. The
application of an appropriate distribution is important in order to sample wind load data
satisfactorily. The assumed distribution was statistically verified by goodness-of-fit tests. The
Kolmogorov-Smirnov (K-S) test was applied to determine the appropriate PDF. K-S test
heavily favours the mean region of distributions where the probability weight is largest and is
less sensitive to the tail regions. The Anderson-Darling test was also performed to determine
whether the PDF was conservative in the tail regions.
Table 4.1 gives the probabilistic distributions of peak pressure coefficient for cladding fixings
in P, Q and T regions for selected wind approach directions. The detailed probabilistic
-6
-5
-4
-3
-2
-1
0
1
0 30 60 90 120 150 180 210 240 270 300 330 360
Cp
θ(deg)
Min AS/NZS1170.2 Mean

Page 67 of 202
descriptions for P, Q, R, S and T regions for each 15° interval are presented in Appendix A.
However, the sample size of 20 values was used for this analysis and the best fit from the
selected distributions are shown. The values are presented in normalized manner in order to
identify the areas and wind directions exceeding the nominal values (i.e. the values greater than
1). The nominal pressure coefficients ( ) were obtained from external pressure values given
in AS/NZS 1170.2 for wind approach directions 0°, 90°, 180° and 270°. In order to normalize
pressures on the roof, the highest value from θ + 45° wind approaching sector was used.
For example, to normalize the wind pressure coefficients at 45° the larger value from 0° and 90°
given in AS/NZS1170.2 (2011) was selected (90° had the larger value). Similarly for 135°, the
value given in AS/NZS1170.2 for 90° was used (the higher value from 90° and 180°).
Table 4.1: The probabilistic distribution of peak pressure ( on cladding fixings at P, Q
and T regions
Approach
angle(θ°)
Region P Region Q Region T
Mean COV PDF Mean COV PDF Mean COV PDF
0 1.16 0.11 GM 1.08 0.25 GEV 0.74 0.29 GEV
45 0.73 0.10 GEV 0.40 0.36 GEV 0.33 0.16 GEV
90 0.74 0.13 GEV 0.75 0.18 GEV 0.95 0.17 GM
135 1.25 0.36 GEV 0.62 0.13 WB 1.07 0.19 WB
180 0.60 0.21 GEV 1.23 0.17 LN 0.81 0.08 GEV
225 0.66 0.22 GEV 0.92 0.24 GEV 0.99 0.17 GEV
270 1.15 0.21 N 1.34 0.26 WB 1.06 0.24 WB
315 1.01 0.13 WB 0.94 0.24 WB 1.06 0.17 GEV
Note: - GM - Gamma Distribution
GEV - Generalized Extreme Value Distribution
N - Normal Distribution
WB - Weibull Distribution
LN - Lognormal Distribution
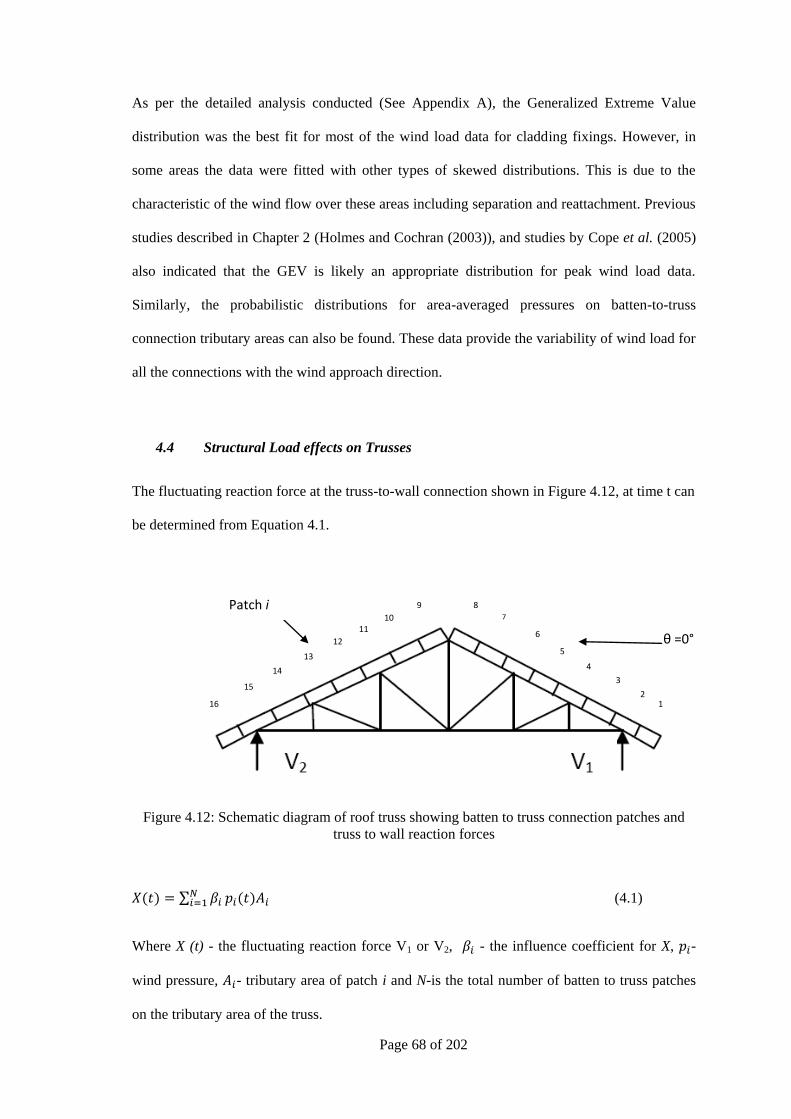
Page 68 of 202
As per the detailed analysis conducted (See Appendix A), the Generalized Extreme Value
distribution was the best fit for most of the wind load data for cladding fixings. However, in
some areas the data were fitted with other types of skewed distributions. This is due to the
characteristic of the wind flow over these areas including separation and reattachment. Previous
studies described in Chapter 2 (Holmes and Cochran (2003)), and studies by Cope et al. (2005)
also indicated that the GEV is likely an appropriate distribution for peak wind load data.
Similarly, the probabilistic distributions for area-averaged pressures on batten-to-truss
connection tributary areas can also be found. These data provide the variability of wind load for
all the connections with the wind approach direction.
4.4 Structural Load effects on Trusses
The fluctuating reaction force at the truss-to-wall connection shown in Figure 4.12, at time t can
be determined from Equation 4.1.
Figure 4.12: Schematic diagram of roof truss showing batten to truss connection patches and
truss to wall reaction forces
(4.1)
Where X (t) - the fluctuating reaction force V1 or V2, - the influence coefficient for X, -
wind pressure, - tributary area of patch i and N-is the total number of batten to truss patches
on the tributary area of the truss.
Patch i
θ =0°
9
10 11
12
13
14
15
16 1 2
3
4
5
6
7
8

Page 69 of 202
The influence coefficients for truss reaction forces V1 and V2 shown in Figure 4.12 were found
by applying an inward unit load at each batten-to-truss connection. The structural analysis
package SPACEGASS version 10.81b was used for obtaining the reactions. These vertical
reaction forces were presented in coefficient form, CX (t), as shown in Equation 4.2,
where, -pressure coefficient at panel i, and -Total tributary area of the truss (i.e.
Spacing of the trusses multiplied by the total chord length of the truss).
=
(4.2)
The pressures measured simultaneously on the N patches of the truss for each approach wind
direction were analysed to obtain X (t) from which the peak value of was determined.
Figures 4.13, 4.14 and 4.15 show the variation of the peak (i.e. minimum) reaction coefficients
V1 and V2 for all five runs with the wind approach direction, θ for trusses B, F and L
respectively and the design values obtained from AS/NZS 1170.2. The Figures show that the
reaction coefficients had a large variability with the wind approach direction. Truss B had a
larger load compared to truss F and L and the largest peak reaction coefficients on truss B
occurred for θ = 90°. Trusses F and L generally had similar loads with the wind approach
direction and the largest loads occurred for θ = 30° to -30°. These Figures also show that the
reaction force V2 was larger than the reaction force V1. Therefore, the reactions at leeward side
of the trusses had larger loads compared to the windward side. However, V1 and V2 had
approximately equal loads for wind approach directions 90° and -90° as expected. The reaction
coefficients obtained from AS/NZS 1170.2 underestimated the reaction at V2 for θ = 0° but
accommodated that for θ= 90° on truss B. Hence, AS/NZS 1170.2 gave a reasonable estimate
for design wind loads on truss-to-wall connections. The trusses towards the gable end of the
houses had larger wind loads compare to middle region.

Page 70 of 202
Probabilistic descriptions for truss reaction forces also can be found by using the method used
in Section 4.3. The corresponding nominal (XN) values can be obtained from AS/NZS 1170.2
(2011). The outcomes of this Chapter have been summarized by Jayasinghe and Ginger (2011).
Figure 4.13: V1 and V2 vs wind approach angles -Truss B
Figure 4.14: V1 and V2 vs wind approach angles -Truss F
-1.6
-1.4
-1.2
-1
-0.8
-0.6
-0.4
-0.2
0
-90 -75 -60 -45 -30 -15 0 15 30 45 60 75 90
θ (deg)
Cx
V₁
V₂
AS/NZS1170.2 V₁
AS/NZS 1170.2 V₂
-1.6
-1.4
-1.2
-1
-0.8
-0.6
-0.4
-0.2
0
-90 -75 -60 -45 -30 -15 0 15 30 45 60 75 90
θ(deg)
Cx
V₁
V₂
AS/NZS1170.2 V₁
AS/NZS 1170.2 V₂

Page 71 of 202
Figure 4.15: V1 and V2 vs wind approach angles -Truss L
4.5 Summary and Discussion
The study determined the wind load acting on the roofing connections and compared the results
with the loads obtained from AS/NZS 1170.2 (2011). The probabilistic descriptions of wind
loads over the cladding fixings on the roof were determined in terms of normalized values with
the wind approach direction. These parameters can be used to determine the load action on a
house with the wind approach direction.
In this chapter conventional wind engineering practice was used to detail the area-averaged
patch load on a tributary area to calculate the load effects on batten-to-truss connection and
truss-to-wall connection. However, the load effects will be dependent on the structural system
response (tests in Chapter 5) and the spatial and temporal wind loads which may generate
different loads.
-1.6
-1.4
-1.2
-1
-0.8
-0.6
-0.4
-0.2
0
-90 -75 -60 -45 -30 -15 0 15 30 45 60 75 90
θ(deg)
Cx
V₁
V₂
AS/NZS1170.2 V₁
AS/NZS 1170.2 V₂

Page 72 of 202
The wind load data were obtained on an isolated house in a suburban environment and hence it
was only simulating a situation where the houses are widely spaced in all directions. In practice
most houses located in urban areas will be shielded to differing degrees by neighbouring houses
that will provide reduced loads (Ho et al. (1991)). In addition, houses will also have variation
in dimensions including roof shape, roof angle, width, length and height etc.
All these factors will result in a population of houses experience wind loads that will
significantly vary compare to the data obtained. The use of normalized parameters may account
for these variations to some extent. The wind loading standard AS/NZS 1170.2 (2011) specifies
pressure coefficients based on those dimensions and roof slope. When these dimensions are
changed in the range observed from the survey data, the corresponding code value is also
changed. Therefore, the variations in peak pressure for a range of houses with the
population of contemporary houses may be similar. This parameter is likely to increase the
variability of , which can be accounted for by the coefficient of variation. However, this
should be confirmed with some rigorous testing on other geometries and using the results of
previous studies. The wind load data on connections is usually obtained based on mean value,
coefficient of variation and probability distribution function in vulnerability assessments.
Therefore, the output results from this wind tunnel study can be used for obtaining the wind
loads on roofing connections in a population of masonry block houses.

Page 73 of 202
5 STRUCTURAL TESTING AND RESPONSE
The structural response of the roof of a house is dependent on the spatial and temporal variation
of loads, load sharing and interdependency between components. The response changes with
increasing wind speed, as the structural components and connections deteriorate from being
elastic (linear) to plastic (non-linear) and progressive failures take place. Such an analysis
requires an understanding of load sharing, possible modes of failure, and redistribution of loads
as the loads increase. This Chapter presents a series of tests on roof subassembly systems
subjected to a range of loads and comparisons with analytical data. The list of tests conducted is
presented in Appendix B.
5.1 Load sharing and progressive failure
The loads applied on a house are shared by the structural elements and non-structural elements
in a complex manner. Full scale testing provides a means of estimating load sharing and
determining the coefficients or factors for the load effects of interest (i.e. batten-to-truss
connection load). Increasing wind speed results in progressive failures and possible changes to
the load sharing and load redistribution. As described in Chapter 2, tests conducted on full scale
houses and building subassemblies provide an overview of these effects. However, those studies
generally considered cumulative effects and the structural systems used were different from
contemporary houses built in cyclonic region of Australia.
Test data on load sharing, progressive failure and interdependency between components of
contemporary houses is scarce, thus limiting the ability to estimate load effects and assess their
structural response. In order to address this lack of data, the behaviour of roofing connections of
contemporary houses was studied by conducting a series of roofing subassembly tests. The sub
assembly tests are designed with appropriate boundary conditions based on engineering
decisions to accommodate the roofing system response. The results from these experiments
were also compared with structural analysis, and then used as a basis to predict the response of
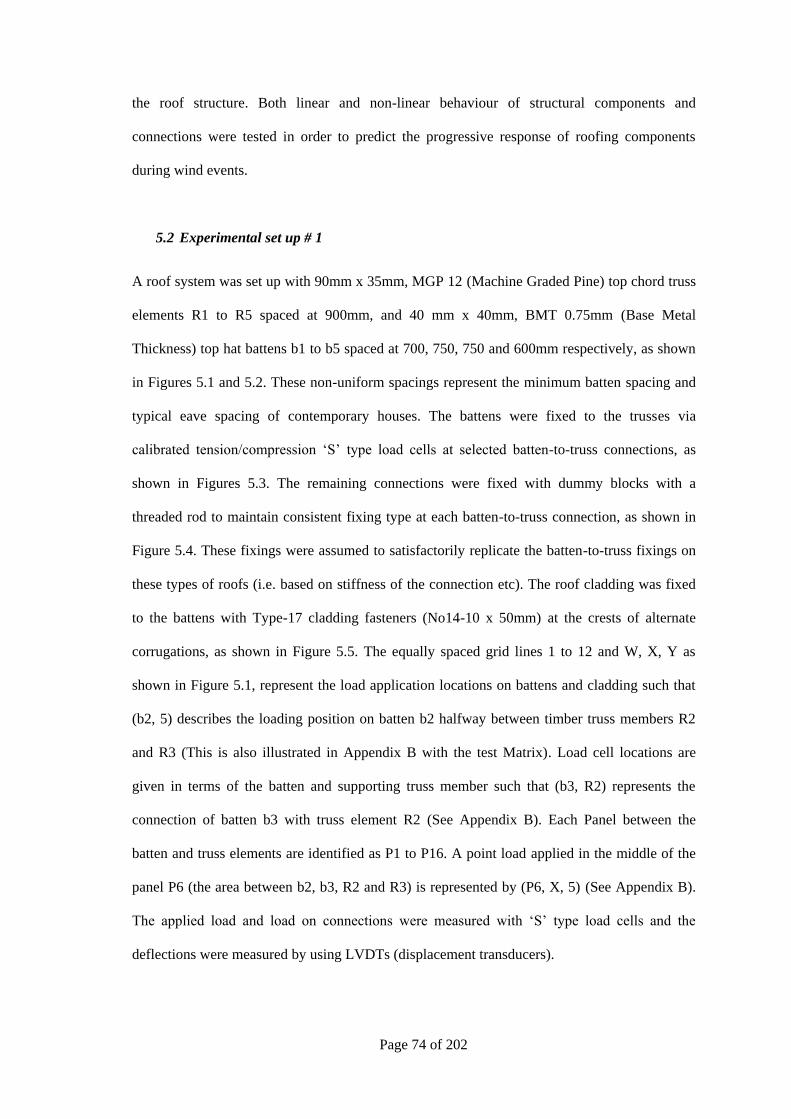
Page 74 of 202
the roof structure. Both linear and non-linear behaviour of structural components and
connections were tested in order to predict the progressive response of roofing components
during wind events.
5.2 Experimental set up # 1
A roof system was set up with 90mm x 35mm, MGP 12 (Machine Graded Pine) top chord truss
elements R1 to R5 spaced at 900mm, and 40 mm x 40mm, BMT 0.75mm (Base Metal
Thickness) top hat battens b1 to b5 spaced at 700, 750, 750 and 600mm respectively, as shown
in Figures 5.1 and 5.2. These non-uniform spacings represent the minimum batten spacing and
typical eave spacing of contemporary houses. The battens were fixed to the trusses via
calibrated tension/compression ‗S‘ type load cells at selected batten-to-truss connections, as
shown in Figures 5.3. The remaining connections were fixed with dummy blocks with a
threaded rod to maintain consistent fixing type at each batten-to-truss connection, as shown in
Figure 5.4. These fixings were assumed to satisfactorily replicate the batten-to-truss fixings on
these types of roofs (i.e. based on stiffness of the connection etc). The roof cladding was fixed
to the battens with Type-17 cladding fasteners (No14-10 x 50mm) at the crests of alternate
corrugations, as shown in Figure 5.5. The equally spaced grid lines 1 to 12 and W, X, Y as
shown in Figure 5.1, represent the load application locations on battens and cladding such that
(b2, 5) describes the loading position on batten b2 halfway between timber truss members R2
and R3 (This is also illustrated in Appendix B with the test Matrix). Load cell locations are
given in terms of the batten and supporting truss member such that (b3, R2) represents the
connection of batten b3 with truss element R2 (See Appendix B). Each Panel between the
batten and truss elements are identified as P1 to P16. A point load applied in the middle of the
panel P6 (the area between b2, b3, R2 and R3) is represented by (P6, X, 5) (See Appendix B).
The applied load and load on connections were measured with ‗S‘ type load cells and the
deflections were measured by using LVDTs (displacement transducers).

Page 75 of 202
Figure 5.1: Schematic diagram of the test set up #1 (all dimensions are in mm)
Figure 5.2: Test set up #1 before fixing the cladding
Top hat battens
Truss top chords
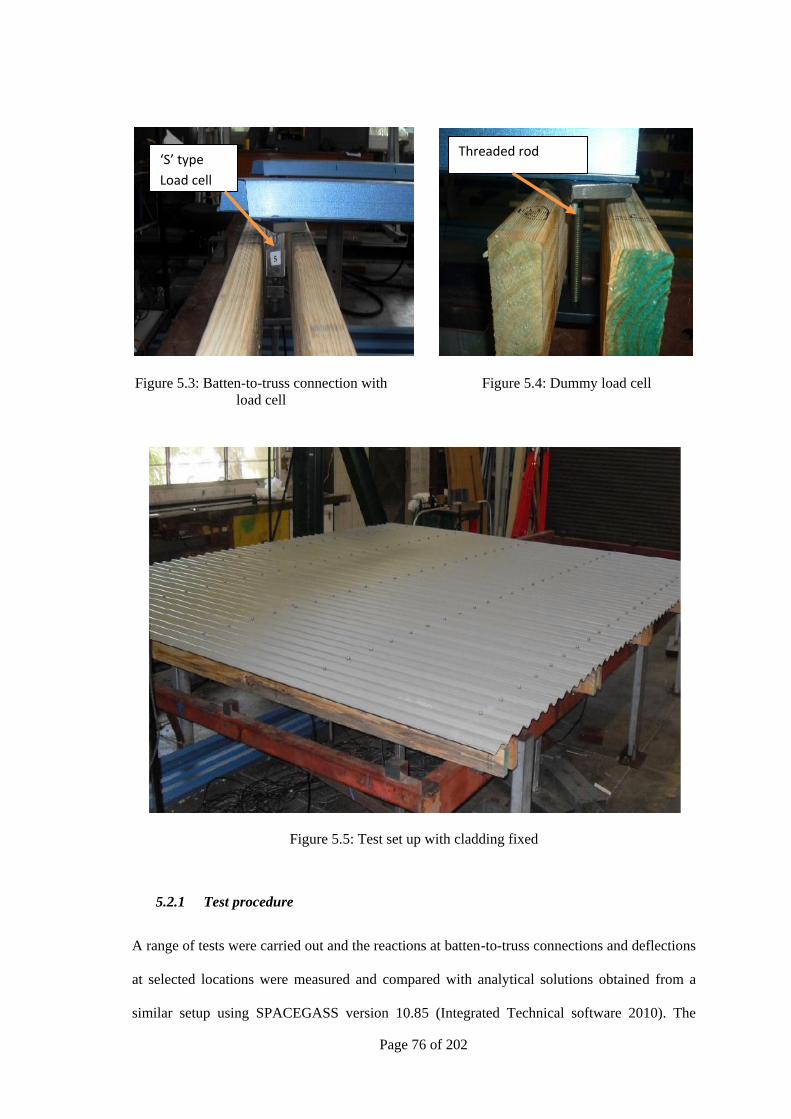
Page 76 of 202
Figure 5.3: Batten-to-truss connection with
load cell
Figure 5.4: Dummy load cell
Figure 5.5: Test set up with cladding fixed
5.2.1 Test procedure
A range of tests were carried out and the reactions at batten-to-truss connections and deflections
at selected locations were measured and compared with analytical solutions obtained from a
similar setup using SPACEGASS version 10.85 (Integrated Technical software 2010). The
Threaded rod ‘S’ type
Load cell

Page 77 of 202
reaction coefficients (C) were obtained by dividing the load at each batten-to-truss connection
with the applied load. The general procedure was to apply an uplift point load or a line load at
selected locations on battens or roof cladding, and measure the loads at instrumented batten-to-
truss connections. The load was applied from the bottom of the test setup using a jack. Timber
blocks and foam moulds were shaped to match the profiles of the battens or the cladding at the
locations of load application. Figure 5.6 shows a foam mould and the jack used for applying the
point loads on cladding. Signal conditioning and data acquisition was carried out using
LabVIEW software (version 8.5).
Figure 5.6: Load application to the bottom surface of cladding with a foam mould and jack
5.2.2 Elastic range tests
Point loads
The first series of tests were carried out prior to installing the cladding, with only the battens
connected to the truss elements. A series of point loads were applied along the battens and
reactions and deflections were measured, as shown in Figure 5.7. The applied load was
measured with an ‗S‘ type load cell and the deflections were measured by using LVDTs
(displacement transducers). Following this, the cladding was installed and loads applied at the
Form
mould
‘S’ type
load cell
Jack

Page 78 of 202
same points on the battens, in order to assess the effect of cladding on load
sharing and transfer.
These tests were followed by the application of point loads at a range of positions on the
cladding, to assess the load distribution from the cladding. During this stage, some selected
cladding fasteners were removed to study the load transfer and sharing when these connections
failed. Steadily increasing load to a maximum of 1kN was applied during this stage, where the
structure was in the elastic range (linear region). The overall tests carried out are shown in
Appendix B (Test Matrix).
Figure 5.7: Load application to batten and deflection measurement
Line loads
The point load tests were followed by line loads increasing up to 5kN per panel (i.e. 5.56 kN/m)
applied on the cladding. The load application length was exactly the panel length (900mm) and
the load was applied along W, X or Y lines in each panel. Following this, two adjacent panels
along the battens (i.e for an example P1 and P5), were loaded simultaneously in each W, X or Y
Timber mould
LVDT
Load cell measuring
the applied load Jack

Page 79 of 202
lines with up to 5kN in each panel. In each case, the reactions at batten-to-truss connections
were measured. Figure 5.8 shows the test arrangement for line loads. The overall tests carried
out for line loads are also shown in Appendix B (Test Matrix).
Figure 5.8: Line loads applied along a line over spacing between trusses
5.2.3 Loading until failure
In order to compare the reaction coefficients (the load at each batten-to-truss connection divided
by the total applied load to obtain the reaction coefficient at each connection) in the linear and
non-linear ranges, point loads were applied until failure of a cladding fastener and then the
cladding was further loaded to observe how the load was distributed while approaching the next
failure. Panels P1 and P6 were selected for this purpose and point load applied at positions (P1,
X, 1) and (P6, X, 5) until failure. Similarly, line loads were also applied using a hydraulic jack
at (P10, X) and (P13, X), until failure.
Foam mould
LVDT
‘S’ type Load cell
(applied load)
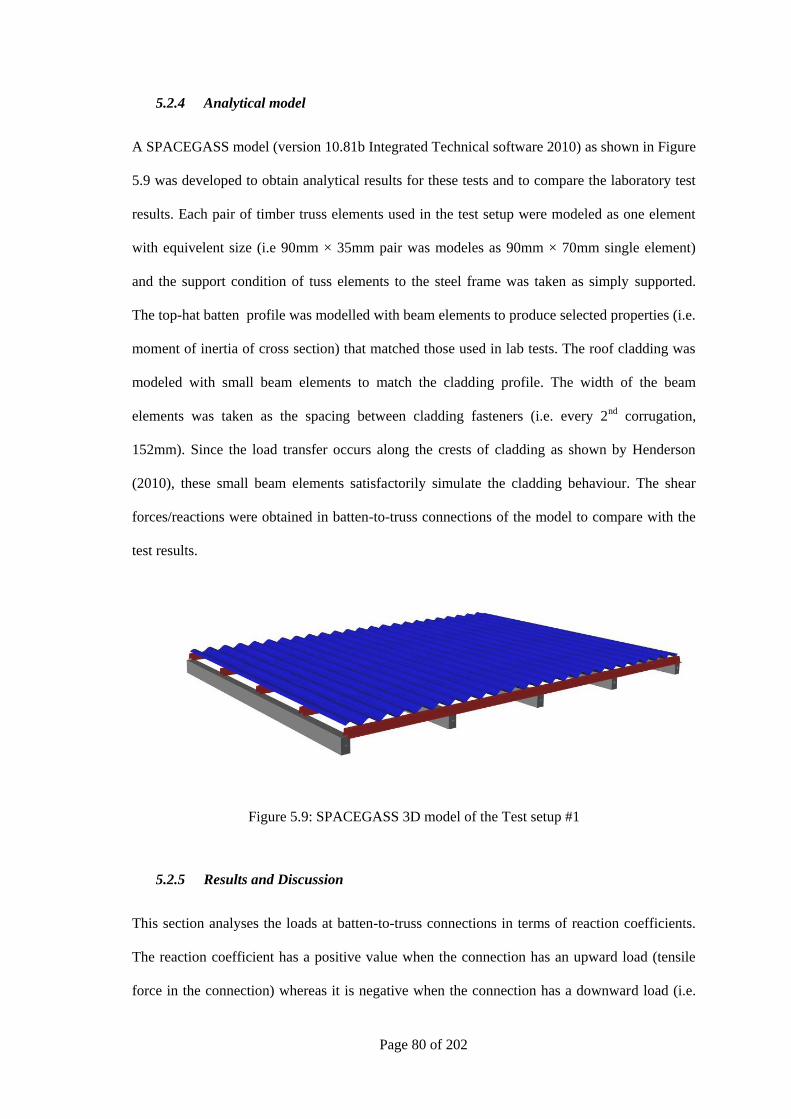
Page 80 of 202
5.2.4 Analytical model
A SPACEGASS model (version 10.81b Integrated Technical software 2010) as shown in Figure
5.9 was developed to obtain analytical results for these tests and to compare the laboratory test
results. Each pair of timber truss elements used in the test setup were modeled as one element
with equivelent size (i.e 90mm × 35mm pair was modeles as 90mm × 70mm single element)
and the support condition of tuss elements to the steel frame was taken as simply supported.
The top-hat batten profile was modelled with beam elements to produce selected properties (i.e.
moment of inertia of cross section) that matched those used in lab tests. The roof cladding was
modeled with small beam elements to match the cladding profile. The width of the beam
elements was taken as the spacing between cladding fasteners (i.e. every 2nd corrugation,
152mm). Since the load transfer occurs along the crests of cladding as shown by Henderson
(2010), these small beam elements satisfactorily simulate the cladding behaviour. The shear
forces/reactions were obtained in batten-to-truss connections of the model to compare with the
test results.
Figure 5.9: SPACEGASS 3D model of the Test setup #1
5.2.5 Results and Discussion
This section analyses the loads at batten-to-truss connections in terms of reaction coefficients.
The reaction coefficient has a positive value when the connection has an upward load (tensile
force in the connection) whereas it is negative when the connection has a downward load (i.e.

Page 81 of 202
compressive force in the connection). The reaction coefficients and deflections for various load
application states are compared with analytical solutions.
5.2.5.1 Point loads on batten (cladding not installed) - Elastic range
Figure 5.10 shows the variation of reaction coefficient at b2, R1 (Cb2, R1), when the load was
applied along the batten b2 and the comparison with analytical results. There were some
differences between analytical and measured values but both results followed the same trends
supporting structural engineering principles. When the load was applied to the first span, the
connection had a positive reaction coefficient (i.e. a tensile force in the connection) and the
analytical values were closer to the measured values, while for the second span it was negative
(i.e. compression) and there was a significant difference between analytical and measured
values for some locations suggesting the batten is more flexible than that modelled. However,
the reaction coefficients values were less than 0.06 in the negative region. There was a
negligible load on the connection (b2, R1) when the load application was more than two spans
away. The load was not applied exactly on the measurement point due to access restrictions.
Similar results were obtained for Cb2, R2 and Cb2, R3 for point loads on batten b2, as shown in
Appendix B. However, measured and analytical values for Cb2, R2 had a maximum of 10%
difference in some locations when the load was applied in the adjacent spans. Furthermore,
simultaneous load measurements were taken at batten-to-truss connections of adjacent battens
b1 and b3 for load application on batten b2. It was found that a very small load is transferred to
the adjacent battens when the load is applied close to the truss elements without the cladding
attached. This occurs by load transfer through truss elements, but can be considered to be
negligible, as the values were close to zero.

Page 82 of 202
Figure 5.10: Reaction coefficient at b2, R1(C b2, R1) for point load on batten b2
The Figure 5.11 shows the deflection of different points for the application of load in the middle
of the first span (i.e. point (b2, 2)). As shown, the measured values followed a similar trend with
analytical values. However, the measured values were larger than the analytical values when the
load was applied close to the measured point, and vice-versa. The deflections along b2 for the
applied load at other positions are shown in Appendix B. These Figures indicated that the
maximum measured deflections were always greater than the analytical calculated deflections
in the locations expecting peak deflections with the maximum difference of 1mm confirming
that the batten is more flexible than modelled.
Figure 5.11: Deflection of batten b2 for load at (b2, 2)
-0.2
0.0
0.2
0.4
0.6
0.8
1.0
0 0.9 1.8 2.7 3.6
C b
2,R
1
Distance from b2,R1 along the batten b2 to the loading position(m)
Experimental
Analytical
0.0
0.5
1.0
1.5
2.0
2.5
3.0
3.5
0 0.9 1.8 2.7 3.6
De
fle
ctio
n (
mm
)
Distance from b2, R1 along the batten b2 to the loading position(m)
Analytical Experimental

Page 83 of 202
At this stage, each batten-to-truss connection was disconnected one at a time to represent the
failure of a connection and the load was applied along that batten before fixing the cladding.
Figure 5.12 compares the reaction coefficient Cb2, R1 when the batten-to-truss connections at (b2,
R2) and (b2, R3) were alternatively removed. As shown in Figure 5.12, the reaction coefficient,
Cb2, R1, increased for (b2, R2) removed case when the load was applied on the first two spans,
but returned close to the values for the undamaged intact case when the load was applied on
spans three and four. When the batten-to-truss connection (b2, R3) was removed, Cb2, R1 values
were closer to the intact case in the first span and the negative reaction coefficient (i.e
compressive load on the connection) was higher than the intact case values in the second and
third spans. The variation of Cb2, R2, Cb2, R3, Cb2, R4, and Cb2, R5 with alternate removal of batten
truss connections at (b2, R2) and (b2, R3), are shown in Appendix B.
These Figures show the reaction coefficients tend to have greater magnitudes (either positive or
negative values) than values for the undamaged intact case when the load was applied adjacent
to the spans of the removed connection. When the load was applied to the other spans, the
reaction coefficients were approximately equal to the intact case values. The overall results
showed that the reactions coefficients were increased at batten-to-truss connections adjacent to
the removed connection.
Figure 5.12: Reaction coefficient, C b2, R1, for point load on batten b2
-0.20
0.00
0.20
0.40
0.60
0.80
1.00
0 0.9 1.8 2.7 3.6
Cb
2,R
1
Distance from b2, R1 along the batten b2 to the loading position (m)
Intact
Only b2,R3 Removed
Only b2,R2 Removed
b2, R3b2, R2
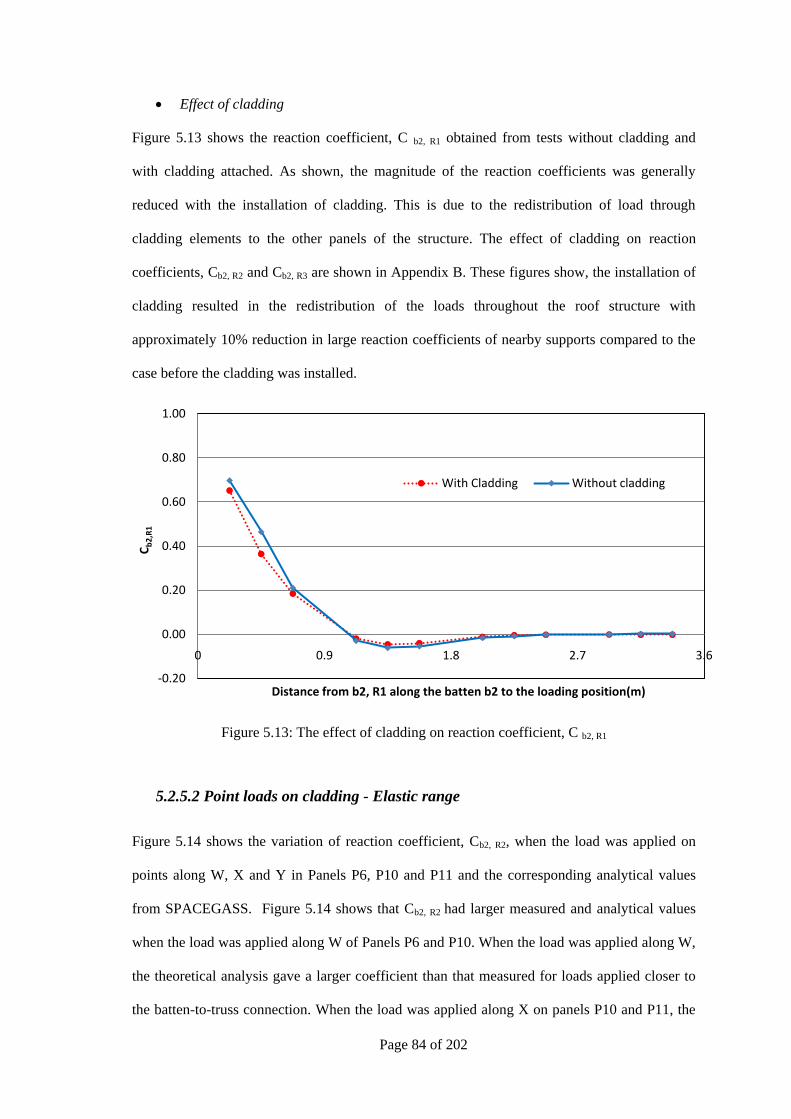
Page 84 of 202
Effect of cladding
Figure 5.13 shows the reaction coefficient, C b2, R1 obtained from tests without cladding and
with cladding attached. As shown, the magnitude of the reaction coefficients was generally
reduced with the installation of cladding. This is due to the redistribution of load through
cladding elements to the other panels of the structure. The effect of cladding on reaction
coefficients, Cb2, R2 and Cb2, R3 are shown in Appendix B. These figures show, the installation of
cladding resulted in the redistribution of the loads throughout the roof structure with
approximately 10% reduction in large reaction coefficients of nearby supports compared to the
case before the cladding was installed.
Figure 5.13: The effect of cladding on reaction coefficient, C b2, R1
5.2.5.2 Point loads on cladding - Elastic range
Figure 5.14 shows the variation of reaction coefficient, Cb2, R2, when the load was applied on
points along W, X and Y in Panels P6, P10 and P11 and the corresponding analytical values
from SPACEGASS. Figure 5.14 shows that Cb2, R2 had larger measured and analytical values
when the load was applied along W of Panels P6 and P10. When the load was applied along W,
the theoretical analysis gave a larger coefficient than that measured for loads applied closer to
the batten-to-truss connection. When the load was applied along X on panels P10 and P11, the
-0.20
0.00
0.20
0.40
0.60
0.80
1.00
0 0.9 1.8 2.7 3.6
Cb
2,R
1
Distance from b2, R1 along the batten b2 to the loading position(m)
With Cladding Without cladding
Page 85 of 202
analytical and experimental values were in close agreement whereas that along Y showed the
analytical values were lower than the experimental values. Furthermore, Figure 5.14 shows that
the load application at any position of panels P10 and P11 had little effect on Cb2, R2. It should
be noted that the load application along line Y which is outside the conventional tributary area
of half panel width of the batten b2, has a significant effect on the connection (b2, R2) as shown
in the Figure 5.14.
The variation of reaction coefficients for all the other batten-to-truss connections at Panels P6
and P10 also behaved in a similar manner, as shown in Appendix B. These Figures show that
significant amount of the loads were resisted at the batten-to-truss connections nearest to the
panels on which the load was applied. The reaction coefficients obtained from the analytical
method were generally lower than the experimental data when the load was applied away from
the measured point. However, the analytical values were larger than the measured values, when
the load application was near the measurement point of interest and close to the measured value
when the applied load was halfway between battens. Thus, the analytical method generally
underestimates the load transfer when the load is applied away from the measured point of
interest.
These differences could be due to many reasons. A sensitivity analysis showed that the main
reason is due to the modelling inaccuracies. The roof cladding was modelled with small beam
elements and the connections (i.e. cladding fastener and batten-to-truss connections) were taken
as rigid connections in the analytical model. The results of the previous section showed that the
batten is more flexible than that modelled. The model was further analysed by changing the
assumed values of the Moment of Inertia (I) and the Young‘s modulus (E) of the battens and the
analysis showed that the results are more sensitive to E than I. However, the analytical
deflection values were closer to the measured experiment values, when E and I were close to
half of the original values. This indicates that the deficiencies are not due to the modelled
batten but the batten-to-truss connections. Therefore, the cladding fixings and the batten-to-
truss connection fixings should be modelled with accurate support condition (not as rigid
connections) in order to obtain accurate results. The current version of SPACE GASS cannot be

Page 86 of 202
used for modelling this. Similarly, there can be unavoidable experimental factors that can cause
some of these anomalies.
Figure 5.14: Reaction coefficient, Cb2, R2 with point loads along W, X and Y
Cladding fasteners removed
Tests were conducted by alternatively removing a cladding fastener at locations (b1, 5), (b2, 5)
and (b3, R3) and applying the loads same as before. Figure 5.15 shows the variation of reaction
coefficient, Cb2, R2 when the load was on Panels P6 and P10 along line X. As shown in Figure
5.15, removing fasteners at (b3, R3) or (b1, 5) had small effect on the Cb2, R2. Removing (b2, 5)
caused a reduction in Cb2, R2 when the applied load was close to (b2, 5). The largest reduction
occurs when the load was at the crest of the removed connection (i.e. b2, 5). Thus, the load on
the cladding was transferred primarily via this crest to either side of fasteners at battens b1 and
b3.
-0.1
0
0.1
0.2
0.3
0.4
0.5
0.6
0.7
0 0.9 1.8 2.7 3.6
Cb
2, R
2
Distance from truss element R1 to positions of load application on Panels P6, P10 and P11(m)
P6, P10, W
P6, P10, X
P6, P10, Y
P11, X
P6, P10, W (analytical)
P6, P10, X(analytical)
P6, P10, Y(analytical)
P11, X(analytical)

Page 87 of 202
The variation of reaction coefficients Cb2, R3, Cb2, R4, Cb3, R2, Cb3, R3, and Cb3, R4 when cladding
fasteners at (b1, 5), (b2, 5) and (b3, R3) were alternatively removed, are shown in Appendix B.
These results showed that the load was transferred to either side of the batten, when the applied
load was near to the crest of the removed fastener. The greatest change occurred when the load
was applied to the crest from which the fastener was removed confirming that the applied loads
are transferred along the crests (Henderson and Ginger (2011)).
Figure 5.15: C b2, R2 for point load on X on Panels P6 and P10
5.2.5.3 Line loads - Elastic range
Reaction coefficients at batten-to-truss connections were measured with line loads applied
along a range of lines on panels. These reaction coefficients were compared with those derived
by superposing point loads applied along the same line. Table 5.1 shows the comparison done
for point loads and line loads along X on Panels P6 and P10. As shown in the Table 5.1, the
reaction coefficients for line loads produce the same values as the superposed point loads with a
largest difference of 0.03 for applied load along X in panels P6 and P10. Furthermore, when the
line load was applied on both panels together (i.e. P6, P10, X), the largest difference was 0.02
in comparison with superimposed point loads of both panels. These results indicate that the
reaction coefficients at batten-to-truss connections (b2, R2), (b2, R3), (b2, R4), (b3, R2), (b3,
-0.1
0
0.1
0.2
0.3
0.4
0.5
0 0.9 1.8 2.7 3.6
Cb
2, R
2
Distance along b2 from truss element R1 to the loading position (m)
Intact
only b3,R3 removed
only b2, 5 removed
only b1,5 removed

Page 88 of 202
R3), and (b3, R4) obtained from superposing a series of discrete point loads on a line were
similar to that form a line load. Further analysis of reaction coefficients showed that
superposition of line loads in two adjacent panels were in agreement with the application of line
loads in these two panels simultaneously, having a largest difference of 0.02 in reaction
coefficients. Thus, the load transfer to the battens from the cladding is similar when a series of
point loads are applied along a line and a line load is applied along the same line. However, this
methodology is applicable only when the system is behaving linearly in terms of material
behaviour and the deformations. If there are any significant nonlinearities (i.e. deformation), the
superposition of series of point load instead of a line load may not be applicable.
Table 5.1: Comparison of reaction coefficients from line loads with point loads
Location Load type
Reaction Coefficients
Cb2, R2 Cb2, R3 Cb2, R4 Cb3, R2 Cb3, R3 Cb3, R4
P6,X Point loads 0.29 0.27 0.01 0.26 0.25 0.02
P6,X Line loads 0.32 0.25 0.02 0.25 0.25 0.02
P10,X Point loads 0.00 0.25 0.28 0.01 0.24 0.30
P10,X Line loads 0.02 0.25 0.27 0.01 0.27 0.29
P6,P10,X Point loads 0.15 0.26 0.14 0.13 0.24 0.16
P6,P10,X Line loads 0.16 0.24 0.16 0.15 0.26 0.14
A point load can be applied to study the individual cladding fastener connection influence on
the reaction coefficients of batten-to-truss connections while a line load can be used to study the
influence of a series of cladding fasteners on the batten-to-truss connections. The frequencies of
wind load fluctuations are lower than the natural frequency of the roof system of low rise
buildings, hence, the temporal variation in dynamic loads is satisfactorily represented by static
tests, as shown by Henderson (2010). The spatial variation can be captured by using the
reaction coefficients of a series of point load tests. The application of a line load represents the
average spatial wind load acting on cladding panels.

Page 89 of 202
5.2.5.4 Loading until Failure
Figure 5.16 shows the variation of reaction coefficients with increasing load until failure, when
a point load was applied in the middle of Panel P6. Stage 0 to 1 refers to the increasing load
until first failure of a cladding fastener. Stage 1 to 2 refers to the continued loading at the same
location until another fastener failure occurs. As shown in the Figure 5.16, the reaction
coefficients decrease with the increasing load, as some of the load was distributed to adjoining
panels. During the test, the cladding fastener at (b2, 5) failed first and the reaction coefficients
at (b2, R2) and (b2, R3) decreased significantly transferring the loads to (b1, R2), (b1, R3), (b3,
R2) and (b3, R3). At this stage, the applied load to the cladding dropped to some extent due to
the reduction in stiffness of the roof system. Further loading resulted in failure of fastener at
(b3, 5) transferring loads to the batten-to-truss connections at (b1, R2), (b1, R3), (b4, R2) and
(b4, R3). The results in Figure 5.16 indicate that the loads are transferred to the adjoining panels
as the plastic deformation takes place around the cladding fasteners. This is due to the reduction
in stiffness of the system around cladding fasteners. Figure 5.17 shows how the cladding
fasteners failed for the point load application, during these tests. It also shows that the load in
the cladding may also be transferred by membrane forces as the corrugations have buckled
significantly reducing their bending strength.
Figure 5.16: Reaction coefficients for loading at centre of Panel 6 until failure of fasteners
0.00
0.05
0.10
0.15
0.20
0.25
0.30
0.35
0.40
0 1 2
Cb
2, R
2, C
b2
, R3
, Cb
3, R
2, C
b3
, R3
load application stage
b2,R2
b2,R3
b3,R2
b3,R3

Page 90 of 202
Figure 5.17: Application of point load showing a cladding fastener failure (pulling out of
batten)
Similarly, line loads were also applied on selected Panels until failure of cladding fasteners. For
these tests, Panels P10 and P13 were selected. The line load on Panel P10 along line X was
progressively increased up to 9.5kN (Capacity of the load cell is 10kN). The reaction
coefficients at C b2, R3, C b2, R4, C b3, R3, and C b3, R4 remained essentially unchanged with the
increasing load. However, the plastic deformation of cladding was observed around fasteners as
shown in Figure 5.18. At this stage, the maximum deflection in the middle of the panel was
60mm as shown in the Figure 5.19. The deflection in the middle of the panel (P10, X, 8) and the
end (R4, X) increased linearly with increasing load up to 6.5kN, and then became non linear
increasing at a progressively faster rate with plastic deformation of cladding. However, the
deflections at positions (b2, 8), (b3, 8) and (P14, X, 11) were linear throughout the test as
shown in the Figure 5.19.
Fastener failure
Load application

Page 91 of 202
Figure 5.18: Plastic deformation of cladding around fasteners
Figure 5.19: Deflections at selected positions with the applied load along line X of P10
0
10
20
30
40
50
60
70
0 2 4 6 8 10
De
fle
ctio
n (
mm
)
Applied Load (kN)
b2, 8
R4, X
P10, X, 8
b3, 8
P14, X, 11

Page 92 of 202
Figure 5.20 shows the variation of reaction coefficients for line load application until failure of
Panel 13. Stage 0-1 refers to the load application before the cladding fastener connection failure
and Stage 1-2 refers to that following the failure of fasteners. Similar to the point load test, the
majority of the applied load was taken by the batten-to-truss connections in P13. Being a corner
panel, P13 had a lower capacity than P10, as it was connected to other panels on two sides only
and hence it was only able to transfer load from two sides (majority of the load was transferred
essentially to one side through the crests of cladding). During this test several fasteners started
withdrawing from the batten b1and b2 of Panel, P13, as shown in Figure 5.21. Furthermore,
rotation of battens was also observed (shown in Figure 5.21). When the fasteners started failing,
the loads were transferred to Panel, P14, increasing the downward loads (i.e. negative reaction
coefficients) of C b3, R4 and C b3, R5 as shown in the Figure 5.20. Thus, the results show that the
load transfer occurs via a range of crests of roof cladding to the next panels (i.e. P14).
Therefore, the response on the connections due to line load application on Panels P10 and P13
until failure, behaved in a similar manner to that obtained from point loads (i.e. the loads were
transferred to the adjacent panels).
Figure 5.20: Reaction coefficient for a line load on P13 along line X
-0.20
-0.10
0.00
0.10
0.20
0.30
0.40
0.50
0 1 2
Re
acti
on
Co
eff
icie
nt
Load application stage
b2, R3
b2, R4
b3, R5
b1, R4
b3, R3
b2, R5
b1, R5
b3, R4
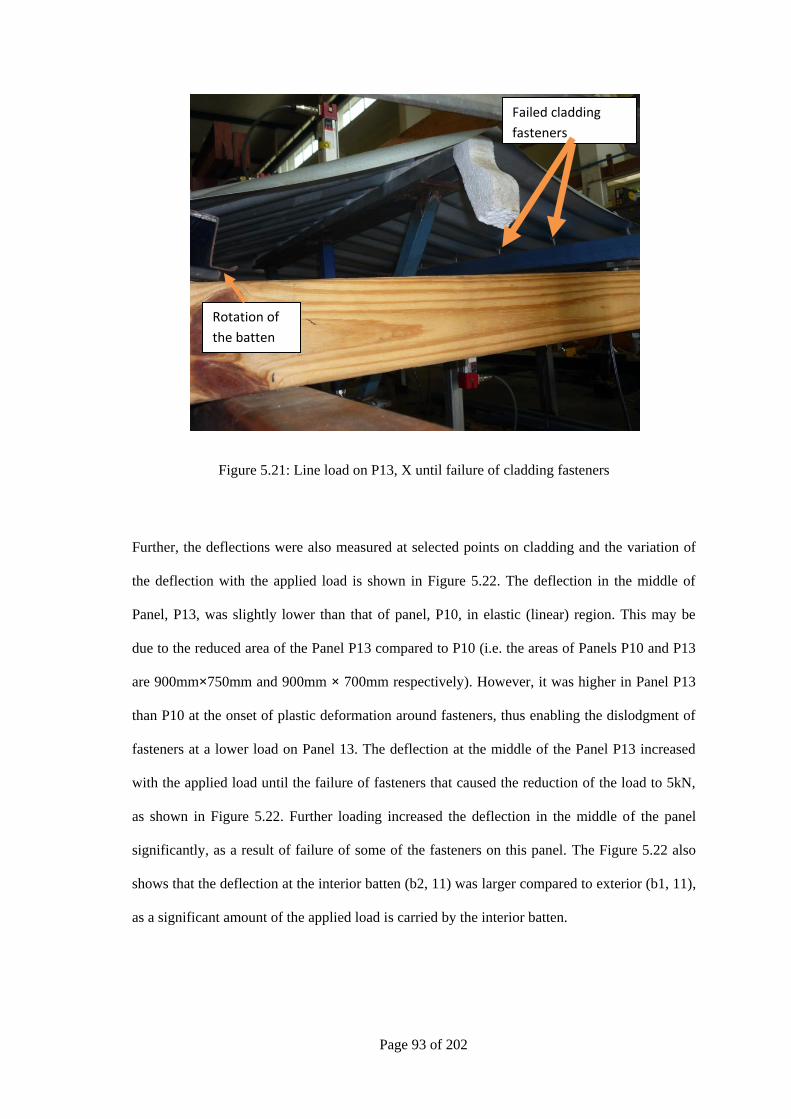
Page 93 of 202
Figure 5.21: Line load on P13, X until failure of cladding fasteners
Further, the deflections were also measured at selected points on cladding and the variation of
the deflection with the applied load is shown in Figure 5.22. The deflection in the middle of
Panel, P13, was slightly lower than that of panel, P10, in elastic (linear) region. This may be
due to the reduced area of the Panel P13 compared to P10 (i.e. the areas of Panels P10 and P13
are 900mm×750mm and 900mm × 700mm respectively). However, it was higher in Panel P13
than P10 at the onset of plastic deformation around fasteners, thus enabling the dislodgment of
fasteners at a lower load on Panel 13. The deflection at the middle of the Panel P13 increased
with the applied load until the failure of fasteners that caused the reduction of the load to 5kN,
as shown in Figure 5.22. Further loading increased the deflection in the middle of the panel
significantly, as a result of failure of some of the fasteners on this panel. The Figure 5.22 also
shows that the deflection at the interior batten (b2, 11) was larger compared to exterior (b1, 11),
as a significant amount of the applied load is carried by the interior batten.
Failed cladding
fasteners
Rotation of
the batten

Page 94 of 202
Figure 5.22: Deflection with the applied load on P13 along line X
5.3 Experimental test set up # 2
In the test set up #2, a roof frame was installed with batten spacings of 900mm as shown in
Figure 5.23, closely representing the general batten spacing of new house construction. The
Test set up #1 gave the variation of reaction coefficients for an average batten spacing of
750mm and the Test set up #2 can be used to obtain the reaction coefficients for batten spacing
of 900mm. These values can be used to predict the reaction coefficients for a range of spacing
between 750mm and 900mm. Thus, the effect of spacing on the reaction coefficients can be
studied in order to predict the batten-to-truss connection behaviour for a population of houses.
Test set up #1 focused on the effect of cladding fastener failures on batten-to-truss connection
response. The main objective of the Test set up #2 was to focus on the changes in reaction
coefficients with batten-to-truss connection failures, when the roof cladding was attached to the
battens.
0
10
20
30
40
50
60
70
80
90
100
0 1 2 3 4 5 6 7 8
De
fle
ctio
n (
mm
)
Applied load (kN)
b1,11
P13, X, 11
b2, 11

Page 95 of 202
Figure 5.23 shows the battens identified as b1 to b4, truss elements identified as R1 to R5 and
12 panels named from P1 to P12 in Test set up #2. The load cells were installed on selected
positions and the dummy load cells were installed at other connections. Furthermore, symmetry
of the structural subassembly and associated connections allowed the system to be assessed by
testing Panels P1, P2, P4 and P5. In addition, repeat tests enabled the collection of additional
data. The load application procedure was also the same as that for Test set up #1. Thus, the load
was applied from underneath of the roof set up (along grid X of each panel and on selected
batten-to-truss connections) and the deflections were also measured from top and bottom (along
grids X, 1, 2, 3, 4 and on battens) of the roofing elements wherever necessary. The list of tests
carried out in this study is also shown in Appendix B.
Figure 5.23: Schematic diagram of the Test Set up #2
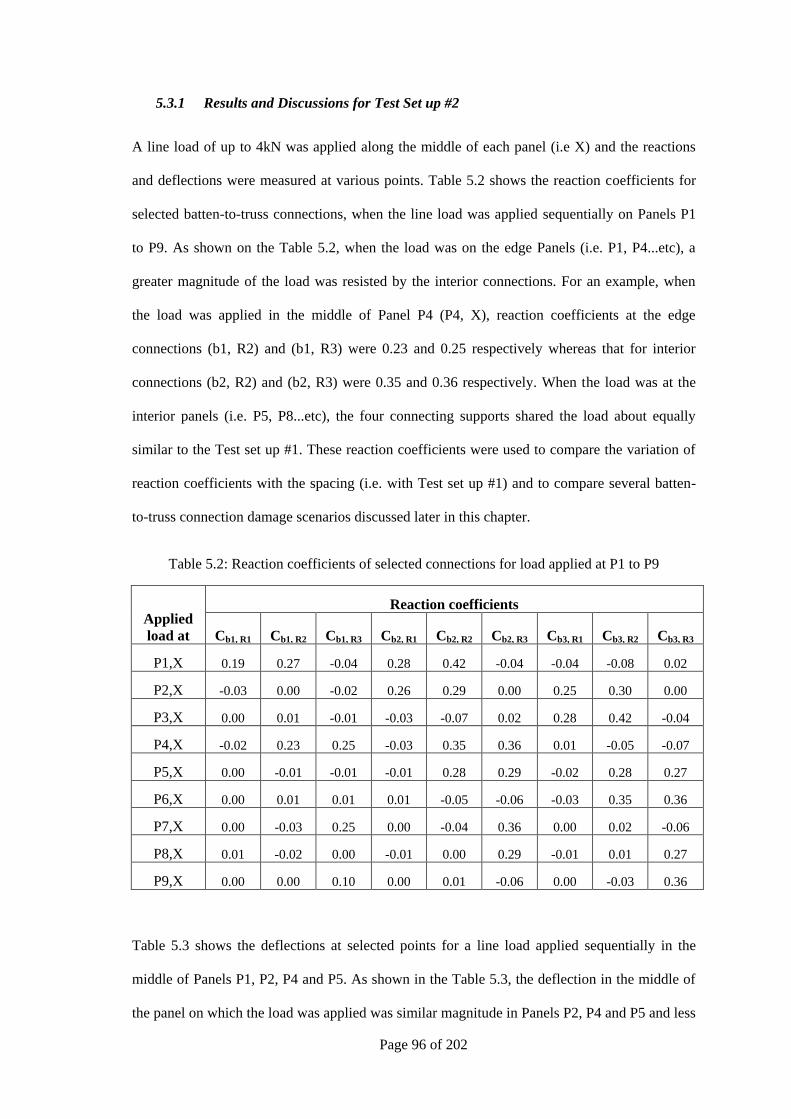
Page 96 of 202
5.3.1 Results and Discussions for Test Set up #2
A line load of up to 4kN was applied along the middle of each panel (i.e X) and the reactions
and deflections were measured at various points. Table 5.2 shows the reaction coefficients for
selected batten-to-truss connections, when the line load was applied sequentially on Panels P1
to P9. As shown on the Table 5.2, when the load was on the edge Panels (i.e. P1, P4...etc), a
greater magnitude of the load was resisted by the interior connections. For an example, when
the load was applied in the middle of Panel P4 (P4, X), reaction coefficients at the edge
connections (b1, R2) and (b1, R3) were 0.23 and 0.25 respectively whereas that for interior
connections (b2, R2) and (b2, R3) were 0.35 and 0.36 respectively. When the load was at the
interior panels (i.e. P5, P8...etc), the four connecting supports shared the load about equally
similar to the Test set up #1. These reaction coefficients were used to compare the variation of
reaction coefficients with the spacing (i.e. with Test set up #1) and to compare several batten-
to-truss connection damage scenarios discussed later in this chapter.
Table 5.2: Reaction coefficients of selected connections for load applied at P1 to P9
Applied
load at
Reaction coefficients
Cb1, R1 Cb1, R2 Cb1, R3 Cb2, R1 Cb2, R2 Cb2, R3 Cb3, R1 Cb3, R2 Cb3, R3
P1,X 0.19 0.27 -0.04 0.28 0.42 -0.04 -0.04 -0.08 0.02
P2,X -0.03 0.00 -0.02 0.26 0.29 0.00 0.25 0.30 0.00
P3,X 0.00 0.01 -0.01 -0.03 -0.07 0.02 0.28 0.42 -0.04
P4,X -0.02 0.23 0.25 -0.03 0.35 0.36 0.01 -0.05 -0.07
P5,X 0.00 -0.01 -0.01 -0.01 0.28 0.29 -0.02 0.28 0.27
P6,X 0.00 0.01 0.01 0.01 -0.05 -0.06 -0.03 0.35 0.36
P7,X 0.00 -0.03 0.25 0.00 -0.04 0.36 0.00 0.02 -0.06
P8,X 0.01 -0.02 0.00 -0.01 0.00 0.29 -0.01 0.01 0.27
P9,X 0.00 0.00 0.10 0.00 0.01 -0.06 0.00 -0.03 0.36
Table 5.3 shows the deflections at selected points for a line load applied sequentially in the
middle of Panels P1, P2, P4 and P5. As shown in the Table 5.3, the deflection in the middle of
the panel on which the load was applied was similar magnitude in Panels P2, P4 and P5 and less

Page 97 of 202
in Panel P1. The adjoining panels had lower deflection values and the deflections in the interior
battens were larger compared to the batten at the edge similar to Test set up #1. For example
when the load was applied at P1, the deflection was larger in the batten b2 than b1. Further, the
deflections on the first internal batten were larger when the load was applied on a interior panel
compared to that in an edge panel (i.e. the deflection at batten b2 was larger when the load was
applied in Panel P5 than that in Panel P4). These values were also used to compare the
deflections for several failure scenarios discussed later in this Chapter.
Table 5.3: Deflection at selected panels for line load application on panels
Loading Location P1,X P2,X P4,X P5,X
Applied load (kN) 3.5 4.0 3.9 4.06
Deflections(mm)
P1,X,1 15.6 -0.2 -0.0
P2,X,1 -0.1 20.7 1.9
P4,X,2 0.1 19.3 -0.1
P5,X,2 2.0 0.0 19.8
P7,X,3 -0.3
P8,X,3 2.1
b1,1 2.5
b1,2 2.3
b1,3 -0.4
b2,1 4.8 7.7
b2,2 4.9 7.7
b2,3 0.2 1.8
b3,1 7.8
b3,2 7.8
b3,3 1.9
5.3.1.1 Comparison of reaction coefficients and deflections with the Test set up #1
Table 5.4 presents the reaction coefficients in selected batten-truss connections obtained from
Test set up #1 and #2. When the load was applied at Panel P1, the reaction coefficient at batten-
to-truss connection (b2, R2) in Test set up #2 was 0.07 greater than that in Test set up #1. The
majority of the load at a corner panel was carried by the interior connection. When the spacing
increases the load carried by the interior batten is larger and hence the connection (b2, R2) has a
larger reaction coefficient. The reaction coefficients of other connections varied by up to 0.02.

Page 98 of 202
When the load was applied at (P2, X), the reaction coefficient at (b3, R2) in Test set up #2 was
0.05 greater than that for Test set up #1. This is due to the distribution of load to the other
panels in Test set up #1which had an additional row of panels compared to the Test set up #2.
Panel P5 of Test set up #1 and P4 of Test set up #2 were compared as shown in the Table 5.4
and the comparison showed a maximum difference of 0.04 for the reaction coefficients.
Similarly, P6 and P5 of Test set ups #1 and #2 respectively had a maximum difference of 0.04
in reaction coefficients. Therefore, the results indicate that the variation in reaction coefficients
was not significant with the spacing in most of the connections except for some locations which
had a maximum of 20% variation (i.e reaction coefficient at (b2, R2) changed from 0.35 to
0.42). These results can be used to predict the reaction coefficients on batten-to-truss
connections spaced from 750mm to 900mm. It should be noted that the accuracy error in each
load cell is 0.09% of its total capacity and that for each LVDT is 0.02% of its total range. The
resolutions in load and deflection measurements are found to be 0.305N and 0.0015mm
respectively. Thus, the system is satisfactorily accurate.
Table 5.4: Comparison of reaction coefficients for line loads applied in test set up #1 and #2
Location
Test
set
up
Reaction coefficients
Cb1, R1 Cb1, R2 Cb1, R3 Cb2, R1 Cb2, R2 Cb2, R3 Cb3, R1 Cb3, R2 Cb3, R3
P1,X #1 0.20 0.25 -0.03 0.28 0.35 -0.02 -0.02 -0.06 0.02
P1,X #2 0.19 0.27 -0.04 0.28 0.42 -0.04 -0.04 -0.08 0.02
P2,X #1 - - 0.00 0.26 0.32 0.00 - 0.25 0.01
P2,X #2 -0.03 0.00 -0.02 0.26 0.29 0.00 0.25 0.30 0.00
P5,X #1 - - 0.27 -0.02 0.31 0.32 - -0.04 -0.06
P4,X #2 -0.02 0.23 0.25 -0.03 0.35 0.36 0.01 -0.05 -0.07
P6,X #1 0.00 -0.03 -0.01 -0.01 0.28 0.25 0.00 0.27 0.26
P5,X #2 0.00 -0.01 -0.01 -0.01 0.28 0.29 -0.02 0.28 0.27
Further, the deflections measured on selected parts were also compared for Test set ups #1 and
#2. Table 5.5 shows the comparison of deflections on two selected panels located at the edge
and the middle of the Test set ups #1 and #2. The deflections were measured at representative
locations in each set up for the same load application. The positions where the deflections were
measured in each test set up are indicated in Table 5.5 showing the test set up number in the

Page 99 of 202
bracket following the measured location. The results indicate that the deflections in the middle
of the panels were larger in Test set up #2 compared to the setup #1. This is due to the larger
spacing of battens in Test set up #2. However, the difference in deflections of the adjacent
battens to the panels where the load was applied was not significant.
Table 5.5: Comparison of deflections in Test set up #1 and #2
Loading location P1,X P1,X P6,X P5,X
Test set up #1 #2 #1 #2
Applied load(kN) 3.52 3.52 4.06 4.06
Deflection(mm)
b1,2 (#1) & b1,1 (#2) 2.82 2.52
b2,2 (#1)& b2,1 (#2) 5.43 4.84
P1, X,1 (#1& #2) 11.08 15.60
b2,5 (#1)& b2,2 (#2)
8.10 7.66
b3,5 (#1)& b3,2 (#2)
8.40 7.82
P6,X,5 (#1)& P5,X,2 (#2)
16.25 19.78
5.3.1.2 Batten Failure
Test setup #2 also studied the failure of batten-to-truss connection and the resulting load
transfer. First, the load distribution and the deflections were obtained for failure of four
connections circled as shown in the Figure 5.24. The failure of each connection was assessed
followed by reinstalling the connection before failing the next connection. In each connection,
the screw towards the roof edge was named as screw ―E‖ and the internal screw was named as
screw ―I‖. The screws at each connection were removed or loosened separately or together and
the load was applied in the middle of adjacent panels of the connection. Removal of both
screws in a connection represents the failure of a connection. Fowler (2003) observed that the
batten-to-truss connection failure occurred after a partial failure (i.e. failure of one leg of the top
hat batten). Thus, removing one screw represents the partial failure of a connection. Sometimes
these connection screws can be loosened when it is subjected to a wind event or poor
workmanship. In order to represent this behaviour, one or both screws were loosened at a time
and the reaction coefficients and deflections were obtained by applying load on the adjacent
panels.

Page 100 of 202
Figure 5.24: Schematic diagram of the connections studied
5.3.1.3 Both screws removed
Table 5.6 shows the variation of reaction coefficients, when both screws ‗I‘ and ‗E‘ were
removed on a connection and the load was applied on the adjacent panels. These reaction
coefficients were compared with the values without failure given in Table 5.2.
Table 5.6: Reaction coefficients for removing both screws in selected connections
Connection
removed
Load
Applied
at
Reaction coefficients
Cb1, R1 Cb1, R2 Cb1, R3 Cb2, R1 Cb2, R2 Cb2, R3 Cb3, R1 Cb3, R2 Cb3, R3
b1,R2 P1,X 0.30 0.00 0.17 0.30 0.41 0.00 -0.04 -0.12 0.03
b1,R2 P4,X 0.06 0.00 0.40 -0.01 0.37 0.39 0.01 -0.09 -0.06
b1,R3 P4,X -0.05 0.36 0.00 -0.03 0.37 0.35 0.00 -0.05 -0.10
b2,R2 P1,X 0.22 0.27 0.01 0.39 0.00 0.15 -0.05 0.09 -0.02
b2,R2 P2,X -0.02 0.01 0.01 0.34 0.00 0.12 0.28 0.39 -0.03
b2,R2 P4,X -0.01 0.26 0.23 0.04 0.00 0.54 0.01 0.09 -0.11
b2,R2 P5,X 0.01 0.00 0.02 0.05 0.00 0.40 -0.01 0.43 0.25
b2,R3 P4,X -0.03 0.30 0.17 -0.07 0.54 0.00 0.01 -0.09 0.07

Page 101 of 202
When the connection (b1, R2) was removed and the load was applied at (P1, X), the reaction
coefficient at (b1, R1), Cb1, R1, increased from 0.19 to 0.30 and Cb1, R3 increased from -0.04 to
0.17. However, there was not a significant change in Cb2, R1 and Cb2, R2. This indicates that a
significant amount of load is distributed to the adjacent batten connections. However, when the
load was applied to (P4, X), there was a small increase in Cb2, R2 and Cb2, R3 0.02 and 0.03
respectively in addition to the adjacent batten connections. As shown in the Table 5.2 and 5.6,
when the screws of the connection (b2, R2) were removed, the reaction coefficients at (b2, R1)
increased from 0.28 to 0.39 and the coefficient at (b2, R3) increased from –0.04 to 0.15 for
applied load at (P1, X). Further, the reaction coefficient at (b3, R2) increased from -0.08 to 0.09
indicating the load transfers through cladding. When the load was applied at (P2, X), the
reaction coefficients changed in the similar manner as that for (P1, X). However, when the load
was applied at (P4, X) and (P5, X), a greater magnitude of load was resisted by the connection
(b2, R3) than (b2, R1) and part of the load was transferred to the connection (b3, R2) via the
roof cladding. When the connection (b2, R3) was removed, Cb2, R2, Cb2, R4 and Cb3, R3 increased in
a similar manner.
These results indicate that a significant amount of load is redistributed to the connections next
to the failed connection either via the batten or the crests of the cladding. However, the reaction
coefficients of connections at the edge do not change significantly due to the failure of middle
connections. Figure 5.25 shows the changes to the reaction coefficients, when the connection
(b2, R2) failed and equal loads were applied to the middle of Panels P1, P2, P4 and P5
simultaneously (this is for connection (b1, R2) also shown in Table B.9 of Appendix B). These
values were obtained by superposing the reaction coefficients of connections for the loads
applied separately at each panel. The reaction coefficients before the failure of connection (b2,
R2) are shown within the brackets for each connection. This is also illustrated graphically in
Figures 5.26 and 5.27 respectively for before and after failure of the connection (b2, R2)
respectively.
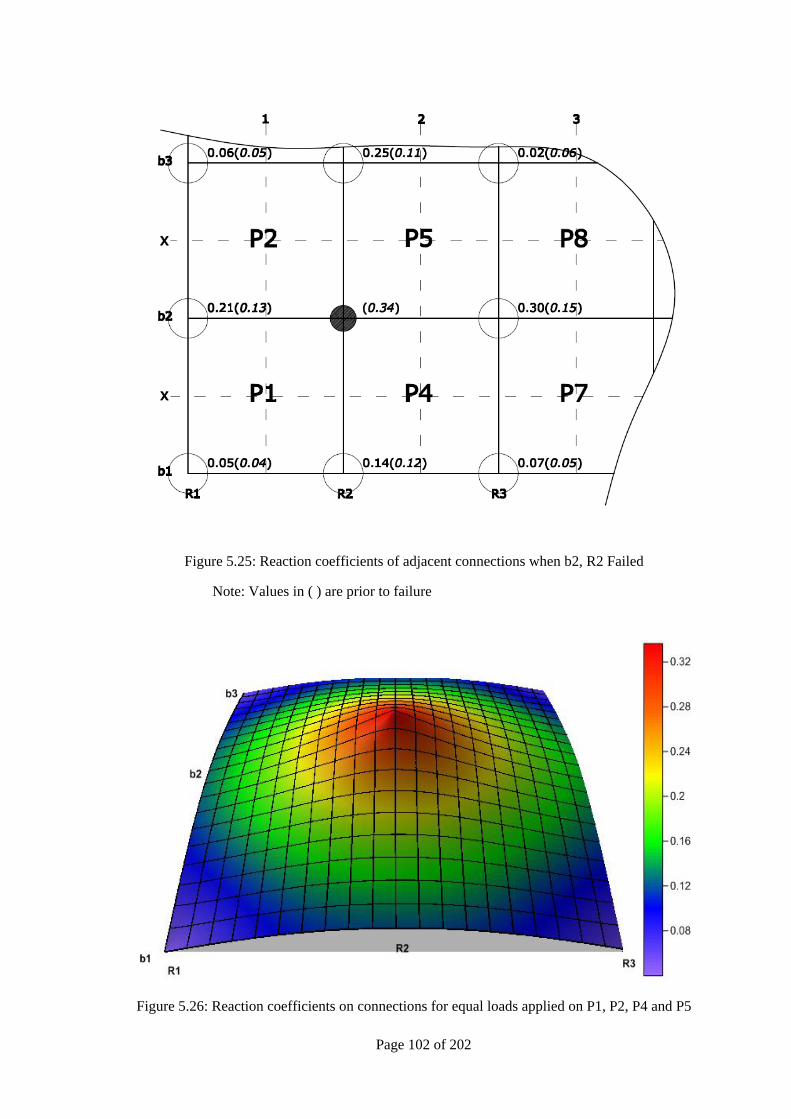
Page 102 of 202
Figure 5.25: Reaction coefficients of adjacent connections when b2, R2 Failed
Note: Values in ( ) are prior to failure
Figure 5.26: Reaction coefficients on connections for equal loads applied on P1, P2, P4 and P5
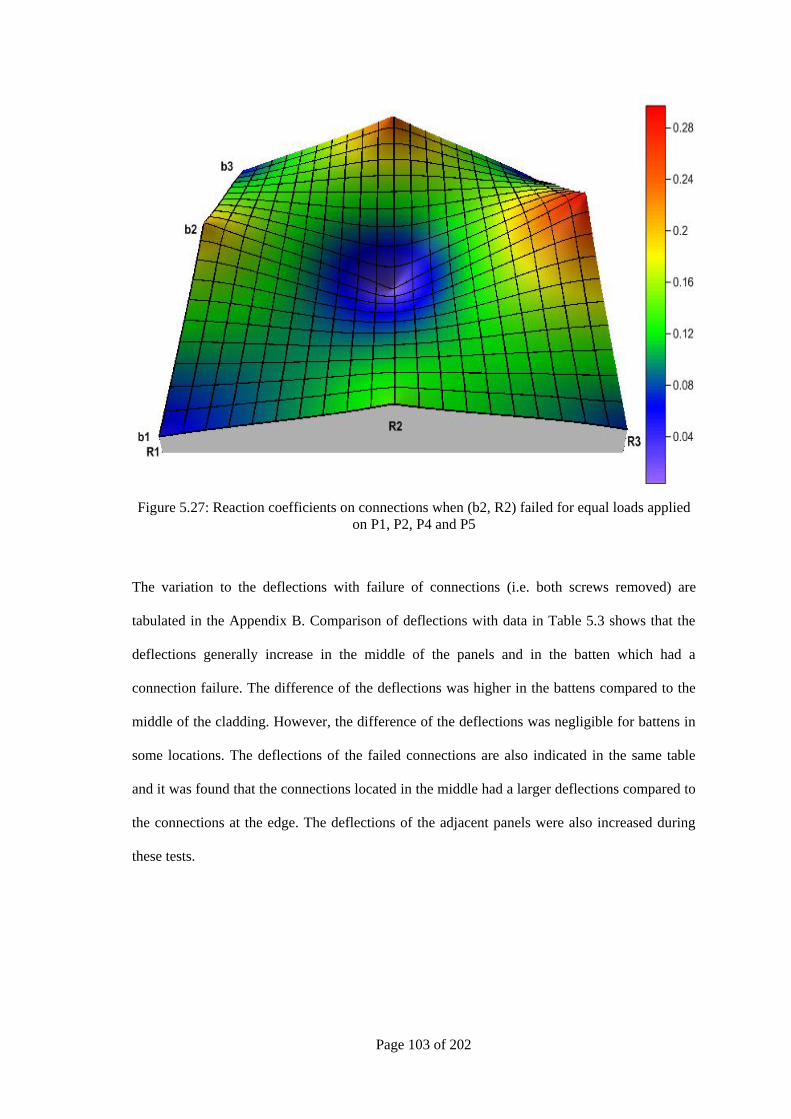
Page 103 of 202
Figure 5.27: Reaction coefficients on connections when (b2, R2) failed for equal loads applied
on P1, P2, P4 and P5
The variation to the deflections with failure of connections (i.e. both screws removed) are
tabulated in the Appendix B. Comparison of deflections with data in Table 5.3 shows that the
deflections generally increase in the middle of the panels and in the batten which had a
connection failure. The difference of the deflections was higher in the battens compared to the
middle of the cladding. However, the difference of the deflections was negligible for battens in
some locations. The deflections of the failed connections are also indicated in the same table
and it was found that the connections located in the middle had a larger deflections compared to
the connections at the edge. The deflections of the adjacent panels were also increased during
these tests.

Page 104 of 202
5.3.1.4 Screw ‘E’ or ‘I’ removed
Figure 5.28: Batten-to-Truss connection with one screw connection removed
The changes to reaction coefficients were obtained when screw ‗E‘ or ‗I‘ was removed on
selected connections as shown in the Figure 5.28. Table 5.7 shows the variation of reaction
coefficients for selected connections when the screw ‗I‘ was removed (the same for screw ‗E‘ is
also shown in Appendix B). These values were compared with the undamaged intact case given
in the Table 5.2. Generally, the reaction coefficients vary in a similar manner for both cases
with some minor variations. When the inner screw was removed from (b1, R2) the reaction
coefficients on the connection from which the screw was removed, dropped from 0.27 to 0.19
and the reaction coefficients of the adjacent connections of the loaded panel increased (i.e.Cb1, R1
increased from 0.19 to 0.22 and Cb1, R3 increased from 0.24 to 0.29 when the applied load was at
(P1, X) and (P4, X) respectively). When the screw ‗I‘ was removed in connection (b2, R2), the
reaction coefficient CB2, R2 dropped from 0.42 to 0.29, 0.29 to 0.23, 0.34 to 0.27 and 0.28 to
0.21 for the load applied at P1, P2, P4 and P5 respectively, increasing the reaction coefficient
at the adjacent connection in each panel on which the load was applied. The reaction
coefficients in the connections for similar load applications at adjacent panels simultaneously
are also shown in the Table B.9 of Appendix B and Figure 5.29 shows that for connection (b2,
R2) (This can be compared with the Figure 5.26). These results indicated that the load
transferred in a similar manner when a single screw was removed at a connection to that when
both screws were removed (Note that the values were different in both cases). The reaction

Page 105 of 202
coefficient of the connection from which the screw was removed, was reduced to some extent
(i.e. up to a maximum of 31%) distributing a fraction of the carried the load to the adjacent
connections. Thus, when only one screw is removed, the connection is still able to carry the
load but the connection has a lower strength capacity.
Table 5.7: Reaction coefficients for removing screw ‗I‘ of selected connections
Connection
Locati
on
Reaction coefficients
Cb1, R1 Cb1, R2 Cb1, R3 Cb2, R1 Cb2, R2 Cb2, R3 Cb3, R1 Cb3, R2 Cb3, R3
b1,R2 P1,X 0.22 0.19 0.01 0.30 0.41 -0.03 -0.04 -0.09 0.02
P4,X 0.00 0.17 0.29 -0.02 0.35 0.37 0.01 -0.07 -0.07
b1,R3 P4,X -0.03 0.26 0.18 -0.03 0.38 0.35 0.01 -0.06 -0.07
P7,X 0.00 0.00 0.21 0.00 -0.03 0.37 0.00 0.02 -0.07
b2,R2 P1,X 0.21 0.26 -0.02 0.32 0.29 0.00 -0.04 -0.03 0.01
P2,X -0.03 0.00 -0.01 0.28 0.23 0.03 0.24 0.33 -0.01
P4,X -0.02 0.27 0.19 -0.01 0.27 0.39 0.01 -0.01 -0.08
P5,X 0.00 -0.01 -0.01 0.00 0.21 0.28 -0.01 0.33 0.27
b2,R3 P4,X -0.03 0.27 0.18 -0.04 0.41 0.24 0.01 -0.06 -0.02
P5,X -0.01 -0.01 -0.01 -0.02 0.32 0.17 -0.01 0.29 0.31
P7,X -0.01 0.01 0.20 -0.01 0.02 0.26 0.00 0.01 -0.01
P8,X 0.00 -0.01 0.00 -0.02 0.04 0.22 -0.01 0.00 0.30
Figure 5.29: Reaction coefficients for a partial failure of the connection b2, R2 for equal loads
applied on P1, P2, P4 and P5

Page 106 of 202
The detailed deflection values for screw ‗E‘ and ‗I‘ failures are also shown in the Appendix B
and the values behaved in a similar manner for both cases. The results indicated that the
difference of the deflections in the middle of the panels where the load was applied was not
significant with the values given for intact case (Table 5.3). However, the deflections were
increased in the battens where the connection was failed. Further, the deflections at the
connections were generally less than that for both screws removed condition.
5.3.1.5 Screws loosened
Both screws at a batten-to- truss connection were loosened as shown in Figure 5.30 to simulate
partial screw withdrawal of a connection. Table 5.8 presents the reaction coefficients when the
connections at selected locations were loosened. When the screws at connection (b2, R2) were
loosened, the reaction coefficient at (b2, R2) reduced from 0.42 to 0.21 for load applied at (P1,
X) increasing Cb2, R1 from 0.28 to 0.35 and Cb2, R3 from -0.04 to 0.06. The results indicated that
the reaction coefficient of the loosened connection drops to a certain level (It can be more than
50%) distributing fraction of the load to the adjacent connections in a similar manner to that of
a failed connection.
Figure 5.30: A connection with loose screws
Gap to simulate partially
withdrawn screw

Page 107 of 202
Table 5.8: Reaction coefficients for loosening both screws on selected connections
Loose
screw
Connection
Applied
Load at
Reaction coefficients
Cb1, R1 Cb1, R2 Cb1, R3 Cb2, R1 Cb2, R2 Cb2, R3 Cb3, R1 Cb3, R2 Cb3, R3
b1,R2 P1,X 0.23 0.19 0.03 0.29 0.40 -0.03 -0.04 -0.09 0.02
P4,X 0.01 0.16 0.30 -0.02 0.35 0.36 0.01 -0.07 -0.06
b1,R3 P4,X -0.03 0.30 0.14 -0.03 0.36 0.35 0.01 -0.05 -0.08
P7,X -0.01 0.03 0.17 0.00 -0.02 0.37 -0.01 0.02 -0.07
b2,R2 P1,X 0.21 0.25 -0.01 0.35 0.21 0.06 -0.04 0.00 0.00
P2,X -0.03 0.01 -0.01 0.29 0.17 0.06 0.26 0.34 -0.01
P4,X -0.02 0.25 0.19 0.01 0.21 0.44 0.01 0.01 -0.09
P5,X 0.00 -0.01 0.00 0.01 0.16 0.31 -0.01 0.35 0.25
b2,R3 P4,X -0.03 0.26 0.18 -0.04 0.41 0.26 0.01 -0.07 -0.03
P5,X -0.01 0.00 -0.01 -0.03 0.34 0.14 -0.01 0.28 0.31
Similarly, when the screws ‗E‘ or ‗I‘ were loosened, the reaction coefficients were higher in the
connections than that for the screw ‗E‘ or ‗I‖ were fully removed condition. The values for
reaction coefficients are shown in the Appendix B. The maximum difference in reaction
coefficients was 0.05. Thus, the reaction coefficient of the connection from which the screw
‗E‘ loosened was less than the intact values and greater than the fully removed condition. The
reaction coefficients in the connections for similar load applications at adjacent panels
simultaneously are shown in the Table B.9 of Appendix B.
The deflections were also recorded at this stage and are shown in the Appendix B for all three
cases. The deflection results showed that there was not significant variation in the difference
with the intact values but in some cases variations were observed in the middle of the panels
where the load was applied for both screws removed case. Similar to previous tests, the
deflections on the battens from which the screws were loosened had a larger deflection
compared to the intact case values in Table 5.3. The deflections measured for single screw
loosened cases were similar to fully removed condition except for some variations.

Page 108 of 202
5.3.1.6 Loading until failure of batten-truss connections
The load was applied to the batten on either side of the support using a ‗U‘ shaped steel frame
as shown in the Figure 5.31. In order to simulate the screw washer of the batten fastener, the 12
gauge screw washers were used in each connection. These washers correctly represented the
batten fastener screw washer (Fowler (2003)).
Figure 5.31: Applied load on batten-truss connection
First, the load was applied to the batten-to-truss connection (b2, R2) and the loads were
measured at selected connections. The loading was stopped when the applied load was at 9.8kN
since the capacity of load cell is 10kN. At this stage, there was not any apparent failure of the
connection. However, plastic deformation of batten at the connection (b2, R2) was observed.
There was not any significant variation of reaction coefficients at this stage with the applied
load. Figure 5.32 shows the distribution of reaction coefficients at the adjacent connections for
the total applied load. As shown, the total applied load was not taken by the connection (b2, R2)
and a considerable amount of load was shared by the adjacent connections.
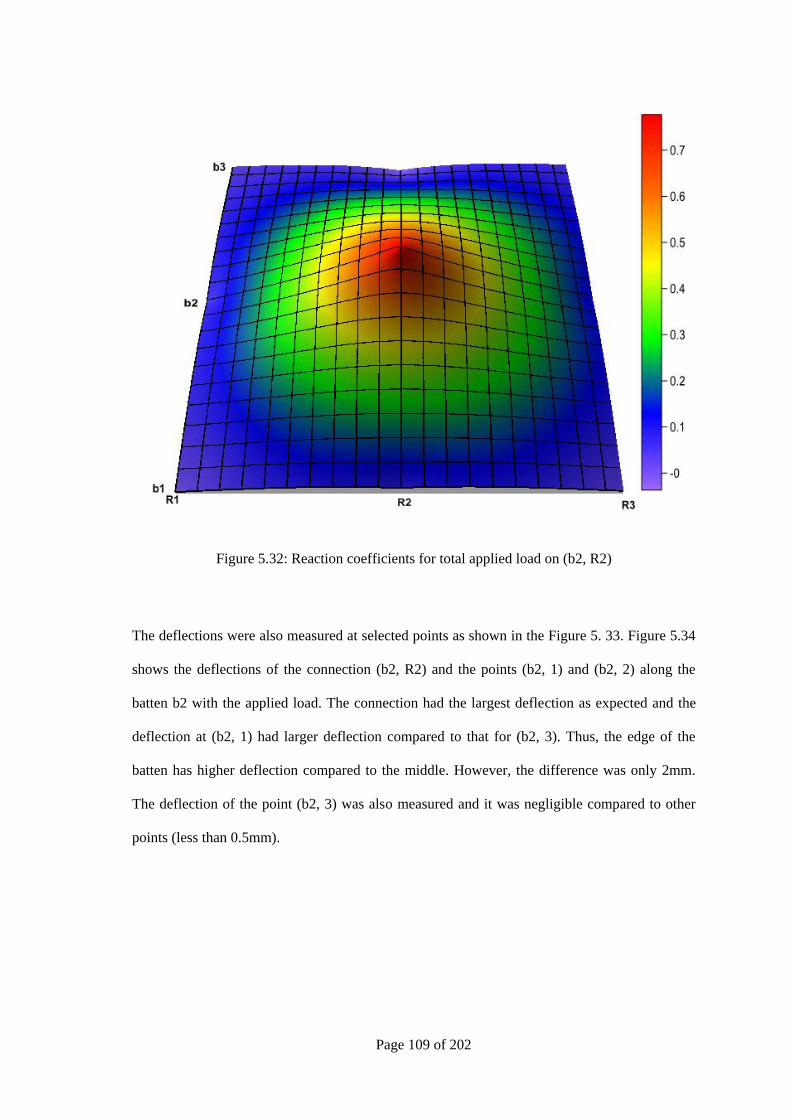
Page 109 of 202
Figure 5.32: Reaction coefficients for total applied load on (b2, R2)
The deflections were also measured at selected points as shown in the Figure 5. 33. Figure 5.34
shows the deflections of the connection (b2, R2) and the points (b2, 1) and (b2, 2) along the
batten b2 with the applied load. The connection had the largest deflection as expected and the
deflection at (b2, 1) had larger deflection compared to that for (b2, 3). Thus, the edge of the
batten has higher deflection compared to the middle. However, the difference was only 2mm.
The deflection of the point (b2, 3) was also measured and it was negligible compared to other
points (less than 0.5mm).
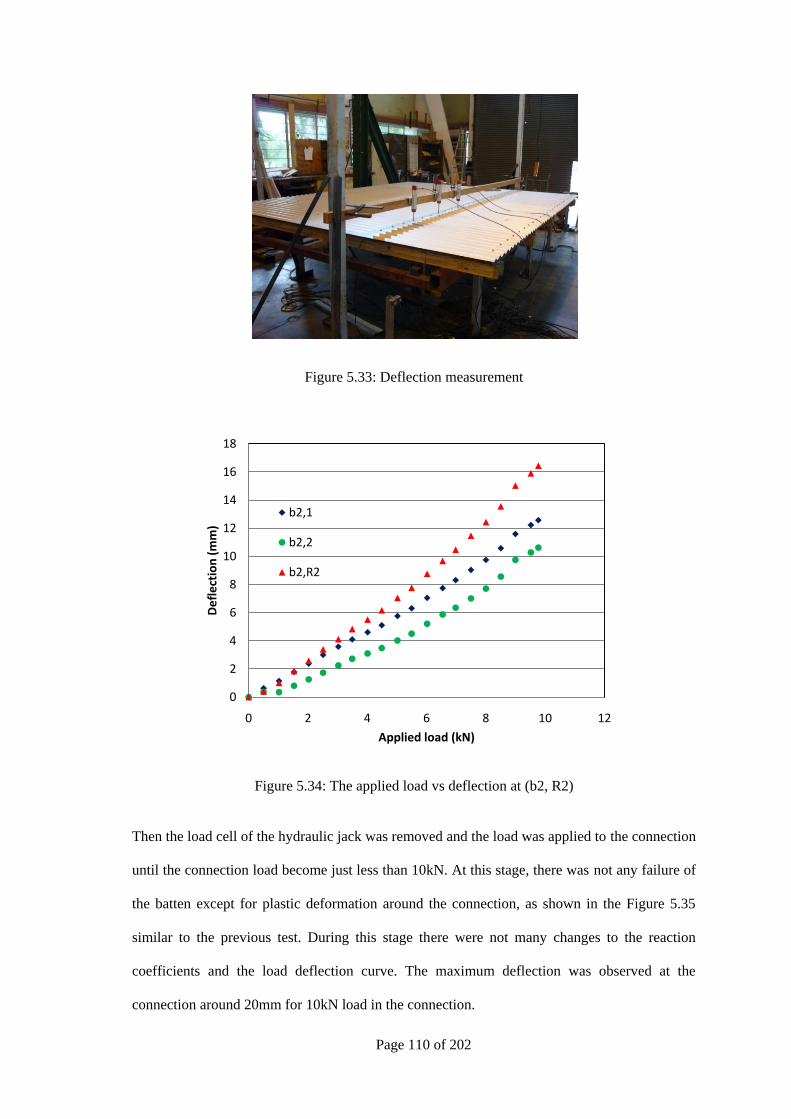
Page 110 of 202
Figure 5.33: Deflection measurement
Figure 5.34: The applied load vs deflection at (b2, R2)
Then the load cell of the hydraulic jack was removed and the load was applied to the connection
until the connection load become just less than 10kN. At this stage, there was not any failure of
the batten except for plastic deformation around the connection, as shown in the Figure 5.35
similar to the previous test. During this stage there were not many changes to the reaction
coefficients and the load deflection curve. The maximum deflection was observed at the
connection around 20mm for 10kN load in the connection.
0
2
4
6
8
10
12
14
16
18
0 2 4 6 8 10 12
De
fle
ctio
n (
mm
)
Applied load (kN)
b2,1
b2,2
b2,R2

Page 111 of 202
Figure 5.35: Plastic deformation of a batten-to-truss connection
Then the screw ‗E‘ of batten-truss connection (b2, R2) was removed and loaded until failure.
Figure 5.36 shows the variation of deflection at selected points with the load on the connection
(b2, R2). The batten-to-truss connection (b2, R2) failed around the screw ‗I‘ as shown in Figure
5.37 for the load at connection 5.2kN. The failure mode of the batten was cutting out a semi
circular shape around the washer and angling out towards the edge of the batten.
Figure 5.36: Applied load vs Deflection on connection (b2, R2)
0
5
10
15
20
25
0 1 2 3 4 5 6
De
fle
ctio
n (
mm
)
Load at the connection b2, R2 (kN)
b2,1
b2,2
b2,R2

Page 112 of 202
Figure 5.37: Failure of the connection (b2, R2)
Similarly, the connection (b3, R3) was loaded until failure (this connection is equivalent to (b2,
R3) due to the symmetry). The load was increased to 9.9kN and the connection did not fail as
was the case with connection (b2, R2). The variation of the deflections at selected points with
the applied load is shown in Appendix B. Then, the screw ‗E‘ (the screw towards connection
(b4, R3)) of batten-to-truss connection (b3, R3) was removed and loaded until failure. Figure
5.38 shows the variation of reaction coefficients at selected points with the load application
stages. Stage 0-1 refers to the reaction coefficients before the total failure of the connection. As
shown in the Figure 5.38, the majority of the applied load was taken by the connection (b3, R3)
as expected and the rest of the load was shared by the connections (b3, R2), (b3, R4) and (b4,
R3). At stage one, the connection (b3, R3) failed but the batten was still connected to the
connection. The load at (b3, R3) dropped significantly from 5.15kN to 2.1kN and at the same
time the load was taken by (b3, R2), (b3, R4) and (b2, R3) connections as shown in the Figure
5.38. Then, the connection was further loaded (stage 1-2) and the batten was entirely removed
from the connection at stage 2. The reaction coefficients at (b3, R2), (b3, R4) and (b2, R3)
connections further increased during this stage. The reaction coefficient at (b4, R3) was
consistent throughout the whole process having a small increase at each stage. Thus, the
interior connections carried the majority of the load. The failure mode of the batten was cutting
out a semi circular shape around the washer and angling out towards the edge of the batten. A

Page 113 of 202
similar failure mode was observed by Fowler (2003) for cyclic tests on top hat battens. The
variation of the deflection at selected points with the total applied load is also shown in the
Figure 5.39.
Figure 5.38: Variation of reaction coefficients with the applied load
Figure 5.39: Variation of deflections with the applied load
-0.1
0
0.1
0.2
0.3
0.4
0.5
0.6
0.7
Re
acti
on
co
eff
icie
nts
Load application stage
b2R3
b3R2
b3R3
b4R3
b3R4
0
5
10
15
20
25
30
35
0 2 4 6 8 10
De
fle
ctio
n(m
m)
Applied Load(kN)
b3,2
b3R3
b3,3
1 2 3

Page 114 of 202
These results showed that the connection (b2, R2) had larger reaction coefficient than the
connection (b3, R3) which can be taken as a connection in the middle area of a roof (i.e When
the load applied to (b2, R2) the reaction coefficient was 0.79 and that for connection (b3, R3)
was 0.75). This is due to the distribution of load in the middle connection (b3, R3). Thus, the
first internal batten-to-truss connection subjected to failure first, when the applied load is equal
on the total roofing panels.
5.4 Summary and Discussion
A series of tests on roof subassembly systems subjected to a range of loads were presented. The
reaction coefficients at batten-to-truss connections and deflections were measured and analysed.
The distribution of loads among the batten-to-truss connections was determined for various
scenarios in the linear response region. The deflections of the cladding and battens were also
obtained. The results of these tests were compared with structural analysis for a linear elastic
system and were found to agree well, with some differences (especially when the load is applied
to the claddings). The repeat tests carried out to measure loads and deflections were in close
agreement. The accuracy error in each load cell is 0.09% of its total capacity and that for each
LVDT is 0.02% of its total range. The resolutions in load and deflection measurements are
found to be 0.305N and 0.0015mm respectively. Therefore, the experimental errors due to the
load and deflection measurements were assumed to be negligible in this study. The reaction
coefficients were obtained for point loads and line loads applied to the undamaged system and
for several damage scenarios of failed cladding fasteners and failed batten-to-truss connections.
The effect of cladding fastener failure and batten-to-truss connection failures with the
increasing load (from linear to non-linear region of components/connection) on the batten-to-
truss connections were studied. Furthermore, the redistribution of load and the changes to the
deflections in cladding and battens were also determined. The results show that the load acting
outside the conventional tributary area has a significant effect on the batten-to-truss connection
loads, indicating that the area of the adjoining panels should be considered in order to obtain the

Page 115 of 202
load effect on batten-to-truss connections. The outcomes of this chapter (i.e. the reaction
coefficients) are used in Chapter 6, for determining the wind load distribution on batten-to-truss
connections. The results can be used to describe the performance of contemporary houses built
in cyclonic region of Australia.
The failure of roofing connections (i.e. cladding fixings and batten-to-truss connections) usually
occur due to fatigue producing characteristics of wind loads (i.e. cycles of loading of various
amplitudes). The failure of these connections is caused by a combination of number of load
cycles and their magnitude. Henderson (2010) showed that the cladding fixing respond in a
quasi-steady manner to the applied wind loads, and that static load can be used to satisfactorily
measure the response of the roofing to wind loads. Hence, the tests carried out can accurately
represent the response of the roof structure to wind loads during different stages of loading up
to failure.
The analytical study conducted in this chapter was basically carried out to confirm that the
experimental set up follows the structural engineering principals and also to compare the
experimental results. The results of this chapter such as distribution of loads and load-deflection
curves are important for carrying out linear/ non-linear analysis of the roofing system. The
boundary conditions used in these test setups can be incorporated in the structural engineering
software and the analysis can be performed for the total structure being considered. Such an
analysis can be used for predicting the loads on connections for various scenarios.

Page 116 of 202
6 VULNERABILITY OF THE ROOF SYSTEM
The wind loads measured on the wind tunnel model and presented in Chapter 4 are combined
with the roof structure response given in Chapter 5 to determine the distribution of load in the
roof system of contemporary houses. These results are also compared with the data obtained
from conventional methods. A method for developing vulnerability curves for cladding
fastener, batten-to-truss and truss-to-wall connections on selected parts of the roof using the
reliability method and probability theories are also presented.
6.1 Load distribution on Roof system
The wind load acting on structural components vary with the wind approach direction. The
complex and fluctuating nature of wind loads can pose significant challenges for structural
design and the assessment of structural vulnerability. As shown in the literature review, the
wind load effects on the roof components are influenced by the spatial distribution of wind
pressure and underlying structural system. Thus, the behaviour of load action and structural
response should be taken in to account when determining the load distribution among the
components and assessing their vulnerabilities.
The peak loads on the batten-to-truss connections on the part of the roof experiencing large
loads were studied. The structural system of the common contemporary house was discussed in
previous chapters and the segment comprising batten-to-truss connections A5 to A8, B5 to B8,
C5 to C8 and D5 to D8 of trusses, A, B, C and D shown in Figure 6.1 (i.e. from Figure 4.3 in
Chapter 4) was analysed for loading from a range of wind directions. The distribution of
pressures and the peak loads on these batten-to-truss connections were determined for each
wind direction. It should be noted that the connection loads presented in this chapter are based
on the instantaneous wind pressure measurements on the pressure taps in this region.

Page 117 of 202
Figure 6.1: Schematic Diagram of connections considered
Figures 6.2, 6.3 and 6.4 show the plan view of the selected connections on trusses A, B, C and
D and the pressure tap locations. As shown in these figures (and also Figure 4.3 of Chapter 3),
each panel consists of four pressure taps. The shaded area on Figures 6.2 and 6.3 shows the
typical tributary areas conventionally used for calculating design loads on batten-to-truss
connections or assessing their vulnerability. In these figures the tributary areas for connection
B7 is shown for each case. The area defined for the conventional method #2 (i.e. Tributary area
of half panel width either side of the batten b2) is basically considered for the purlin/batten
design, as specified in product manuals (Stramit (2000)). The load on each connection of the
beam is obtained by analysing the load acting on overall tributary area along the total batten.
The area specified in Figure 6.3 affects connection B7, and the tributary areas related to other
connections (i.e. C7, B6, A7...etc) were also taken in a similar manner.
900m
m
900m
m
900m
m
650m
m
877m
m
877m
m
877m
m
877m
m
877m
m
877m
m
θ =0°
A1
A2
A3
A4
A5
A6
A7
A8
B1
B2
B3
B4
B5
B6
B7
B8
C1 C2
C3
C4
C5
C6
C7
C8
D1
D2
D3
D4
D5
D6
D7
D8
θ =90°
θ =180°

Page 118 of 202
However, the structural testing results from Chapter 5 indicated that the wind loads on shaded
area shown in Figure 6.4 has a significant effect on connection B7. Based on test data from
Chapter 5, the loads on the other connections (i.e. C7, B6, A7...etc) were also considered using
the panels in a similar manner. Thus, the area of the adjoining panels of each connection was
considered for each connection. For example, the tributary areas for connections B8 and B6 are
also shown in Appendix C (Figures C1 and C2). This section compares the peak instantaneous
load acting on these connections from each method.
Figure 6.2: Conventional method #1-Tributary area for connection B7
Note: o - Pressure taps
The values shown next to the pressure taps are reaction coefficients

Page 119 of 202
Figure 6.3: Conventional method #2-Tributary area for connection B7
Note: o - Pressure taps
The values shown next to the pressure taps are reaction coefficients
Figure 6.4: Proposed method – Tributary area for connection B7
Note: o - Pressure taps
The values shown next to the pressure taps are reaction coefficients

Page 120 of 202
The load at a given batten-to-truss connection ( is given by
(6.1)
Where
-Reaction coefficient for load applied at pressure tap location, i
- Tributary area for pressure tap, i - Pressure coefficient at pressure tap, i at time t.
N- Number of pressure taps affecting on the connection being considered
For the conventional method #1, the reaction coefficient β was taken as 1.0, as shown in Figure
6.2 for connection B7. For conventional method #2, the reaction coefficients, were obtained by
analysing the load along each batten using structural analysis, are also shown in Figure 6.3. For
the proposed method, the reaction coefficient in linear elastic region on each batten-truss
connection for loads applied at each panel measured from Test set up #1 and #2 in Chapter 5
were used to obtain the load distribution among the batten-truss connections. The reaction
coefficients only for connection B7 are shown in Figure 6.4 and the reaction coefficients for
other connections were also obtained (i.e. considered a large tributary area for each connection).
The conventional methods #1 and #2, and the proposed method with the load distribution effect
were analysed and compared for spatially varying wind pressure for several wind approach
directions. The peak load (i.e. ) of each connection was obtained combining reaction
coefficients with the simultaneous measurement of wind pressure on each pressure tap (i.e.
using Equation 6.1) for each wind approach direction.
The batten-to-truss connection load acting normal to the connection is represented in coefficient
form as shown in Equation 6.2. Where, is the nominal area related to batten-to-truss
connections in contemporary houses and it was taken as 0.81m2 for all the connections (This
was done to present the results in non-dimensional coefficient form).
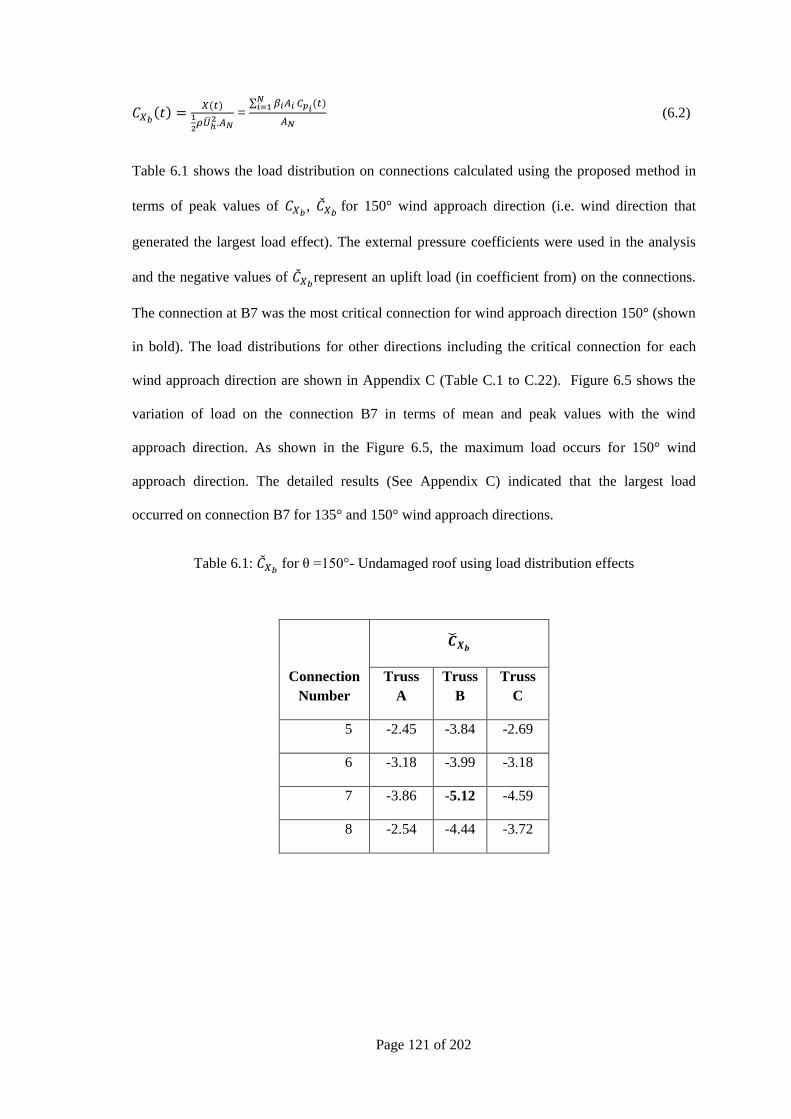
Page 121 of 202
=
(6.2)
Table 6.1 shows the load distribution on connections calculated using the proposed method in
terms of peak values of ,
for 150° wind approach direction (i.e. wind direction that
generated the largest load effect). The external pressure coefficients were used in the analysis
and the negative values of represent an uplift load (in coefficient from) on the connections.
The connection at B7 was the most critical connection for wind approach direction 150° (shown
in bold). The load distributions for other directions including the critical connection for each
wind approach direction are shown in Appendix C (Table C.1 to C.22). Figure 6.5 shows the
variation of load on the connection B7 in terms of mean and peak values with the wind
approach direction. As shown in the Figure 6.5, the maximum load occurs for 150° wind
approach direction. The detailed results (See Appendix C) indicated that the largest load
occurred on connection B7 for 135° and 150° wind approach directions.
Table 6.1: for θ =150°- Undamaged roof using load distribution effects
Connection
Number
Truss
A
Truss
B
Truss
C
5 -2.45 -3.84 -2.69
6 -3.18 -3.99 -3.18
7 -3.86 -5.12 -4.59
8 -2.54 -4.44 -3.72

Page 122 of 202
Figure 6.5: Variation of at B7 with the wind approach direction
Tables 6.2 and 6.3 shows the loads on connection for 150° wind approach direction obtained
using the conventional methods #1 and #2. The critical connection was identified as B8 for both
methods and the load on connections obtained using both methods were close to each other.
These values were also determined by using instantaneous pressure of each time step of wind
pressure recordings (i.e. not from the maximum recorded pressure at each pressure tap).
Table 6.2: for θ =150°- Undamaged
roof using conventional method #1
Connection
Number
Truss
A
Truss
B
Truss
C
5 -2.09 -3.54 -2.35
6 -2.92 -3.58 -2.74
7 -4.13 -3.65 -3.92
8 -2.78 -4.38 -3.46
Table 6.3: for θ =150°- Undamaged
roof using conventional method #2
Connection
Number
Truss
A
Truss
B
Truss
C
5 -2.02 -3.28 -2.29
6 -2.56 -3.38 -2.67
7 -3.52 -3.75 -3.76
8 -2.51 -4.01 -3.34
However, comparison of these loads on connections with the values obtained from the proposed
method with load distribution effect shows a significant difference for some connections, as
-6
-5
-4
-3
-2
-1
0
0 30 60 90 120 150 180 210 240 270 300 330 360
Cxb
θ°
Mean Peak

Page 123 of 202
shown in Figure 6.6 (The values on the Tables 6.1, 6.2 and 6.3 related to each connection
are incorporated in Figure 6.6). For example, the for B7 using methods #1 and #2 were 3.65
(Red) and 3.75 (pink) respectively and that obtained using the load distribution effects was 5.12
(Black), as shown in the Figure 6.6. Therefore, the use of conventional method #1 and #2 can
significantly underestimate the loads on some connections for the same wind direction.
Figure 6.6: for undamaged system for θ =150°
Black -Proposed method
Red -Conventional method #1
Pink -Conventional method #2
The reason for this significant difference is due to the occurrence of large correlated negative
pressure outside the conventional tributary area and the flexibility of the batten contributing to
the distribution of loads via the reaction coefficients. Figures 6.7, 6.8 and 6.9 show the

Page 124 of 202
instantaneous pressure distribution (in pressure coefficients) obtained from wind tunnel study
around the connection B7 for each method, when it experienced the peak load at 150° wind
approach direction. It should be noted that the peak load for each method occurred at different
instances in the time signals. The conventional tributary areas are shown in doted lines in
Figures 6.8 and 6.9. It should be noted that the colour scale is different for each Figure. As
discussed in Chapter 2, the large suctions occur in roof corner due to the formation of edge
vortices. Figure 6.7 shows the formations of classic vortices in the corner of the roof.
Figure 6.7: Pressure distribution around B7-Proposed method
Figure 6.8: Pressure distribution around
B7-Conventional Method #1
Figure 6.9: Pressure distribution around
B7-Conventional Method #2

Page 125 of 202
Similarly, Figure 6.10 shows the load distributions for 90° wind approach direction from the
three methods. The most critical connection for this wind approach direction is B7 for each
method. The comparison shows that some values obtained from conventional methods #1 and
#2 significantly underestimate the load on some connections. These differences could be
mainly due to the flexibility of battens of contemporary houses. However, a stiffer roof system
may not have such a large discrepancy. Henderson (2010) showed that the load on a cladding
fixing is given by the pressure acting on the conventional tributary area (i.e. conventional
method #1). However, this study shows that approach is not applicable for calculating the load
on batten-to-truss connections on contemporary houses. Thus, the tributary area defined in
Figure 6.4 should be considered in order to obtain the load on batten-to-truss connections.
Figure 6.10: for undamaged system for θ =90°
Black -Proposed method, Red -Conventional method #1, Pink -Conventional method #2

Page 126 of 202
6.2 The effect of cladding fastener failure
As shown in Chapter 5, the failure of cladding fastener redistributes the loads along the
corrugations of cladding to the adjacent panels. It was also found that the greatest effect on load
transfer occurs when the load is applied on the crest of the failed connection during the
structural testing in Chapter 5. These reaction coefficients from point load tests were combined
with the pressure in each tap to obtain the redistribution of loads to batten-to-truss connections,
assuming a cladding fastener failure between B7 and C7, as shown in Figure 6.11. Thus, the
failed fastener was in the same line with the pressure taps leading to the greatest effect on
batten-to-truss connections.
Figure 6.11: Failure of a cladding fastener
Table 6.4 shows the redistribution of loads when the cladding fastener failed for 150° wind
approach direction combining instantaneous wind pressure with the results of load
redistributions from Chapter 5. The batten-to-truss connection, B8, was the most critical
connection when this cladding fastener failed. The results indicate that the loads on B7 and C7
were reduced to some extent (load on connection B7 dropped from 5.12 to 4.49) increasing the

Page 127 of 202
loads on B6 and B8 transferring the load through the crests of the claddings. The loads on C6
and C8 were also slightly increased. Thus, the failure of a cladding fastener (during a wind
event or from a previous wind event or poor workmanship) redistributes some of the loads to
the batten-to-truss connections of the adjacent battens, increasing their probability of failure.
However, it reduces the failure probability of the batten-to-truss connections of the batten from
which the cladding fastener failed due to the lower load carried.
Table 6.4: for θ =150°- Cladding fastener failure (between B7 and C7)
Connection
Number
Truss
A
Truss
B
Truss
C
5 -2.45 -3.84 -2.69
6 -3.18 -4.44 -3.30
7 -3.86 -4.49 -4.35
8 -2.54 -4.70 -3.85
6.3 The effect of batten-to-truss connection failure
Similarly, the load redistribution was obtained for a batten-to-truss connection failure. Since the
connection B7 experienced the largest load, it was assumed to fail in this analysis. Table 6.5
shows the distribution of loads, when the connection B7 failed indicating the connection C7
was the next critical connection and then connections B6 and A7, respectively. The results are
also shown in graphical manner in Figures 6.12 and 6.13 for undamaged and damaged system
respectively. These results indicate that the failure of batten-to-truss connection has a
significant effect on the adjacent connections as the load experienced by the connection it
transferred to the adjacent connections.

Page 128 of 202
Table 6. 5: for θ =150°- Batten-to-truss connection B7 failed
Connection
Number
Truss
A
Truss
B
Truss
C
5 -1.98 -3.11 -2.18
6 -2.57 -4.27 -2.58
7 -4.13 -5.38
8 -2.06 -3.69 -3.01
Figure 6.12: Load distribution-Undamaged
system
Figure 6.13: Load distribution-B7 failed
6.4 Reliability Analysis
The load distribution discussed in the previous section was obtained by applying deterministic
values for patch loads and building response results. The development of vulnerability models
require these parameters to be analysed in a probabilistic manner.
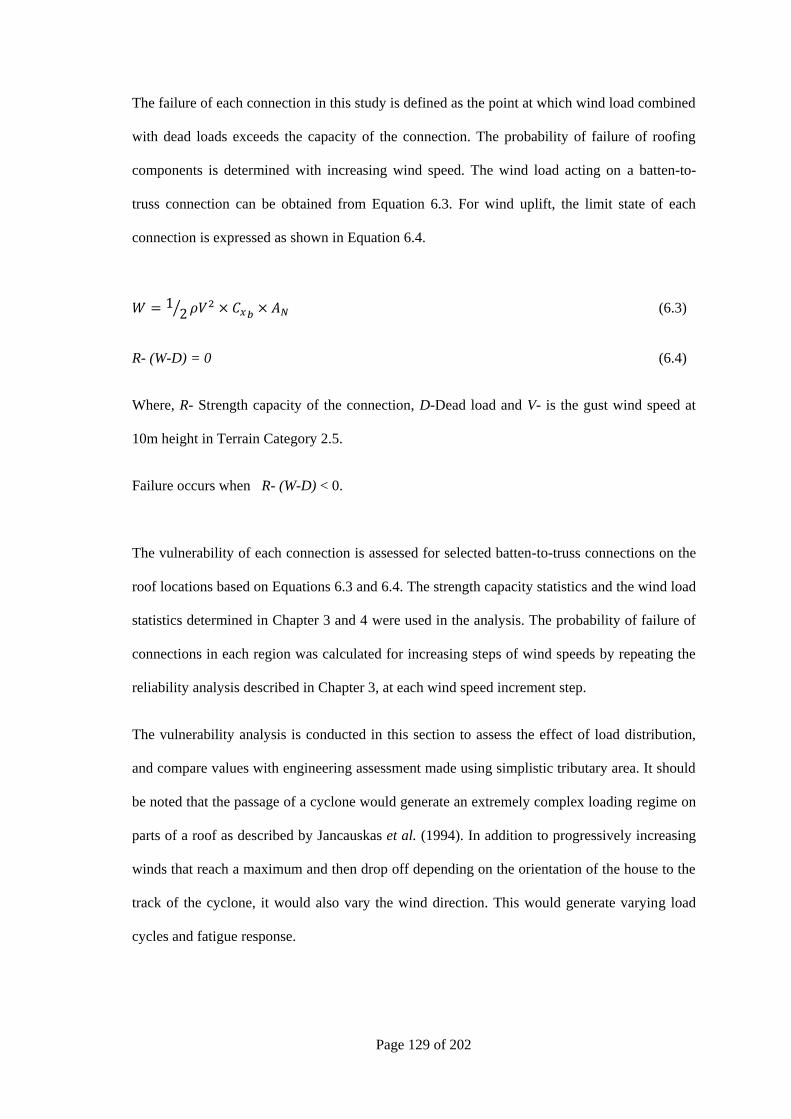
Page 129 of 202
The failure of each connection in this study is defined as the point at which wind load combined
with dead loads exceeds the capacity of the connection. The probability of failure of roofing
components is determined with increasing wind speed. The wind load acting on a batten-to-
truss connection can be obtained from Equation 6.3. For wind uplift, the limit state of each
connection is expressed as shown in Equation 6.4.
(6.3)
R- (W-D) = 0 (6.4)
Where, R- Strength capacity of the connection, D-Dead load and V- is the gust wind speed at
10m height in Terrain Category 2.5.
Failure occurs when R- (W-D) < 0.
The vulnerability of each connection is assessed for selected batten-to-truss connections on the
roof locations based on Equations 6.3 and 6.4. The strength capacity statistics and the wind load
statistics determined in Chapter 3 and 4 were used in the analysis. The probability of failure of
connections in each region was calculated for increasing steps of wind speeds by repeating the
reliability analysis described in Chapter 3, at each wind speed increment step.
The vulnerability analysis is conducted in this section to assess the effect of load distribution,
and compare values with engineering assessment made using simplistic tributary area. It should
be noted that the passage of a cyclone would generate an extremely complex loading regime on
parts of a roof as described by Jancauskas et al. (1994). In addition to progressively increasing
winds that reach a maximum and then drop off depending on the orientation of the house to the
track of the cyclone, it would also vary the wind direction. This would generate varying load
cycles and fatigue response.

Page 130 of 202
Figure 6.14 shows the probability of failure of batten-truss connections B6, B7, B8, A7 and C7
by incorporating the load distribution effects described in Chapter 5 for 150° wind approach
direction. Figure 6.15 shows the curves obtained using the conventional method #1 for the same
connections. These figures give the probability of failure of each connection type with the
approach gust wind speed at 10m height in Terrain Category 2.5. The comparison of the
vulnerability of connections in Figures 6.14 and 6.15 show an increase in vulnerability due to
the proposed method with load distribution effects (The vulnerability of connection B7
increased from 0% to 2% at 75m/s). Similar to the connection load distribution, the connection
B7 was the most vulnerable connection from the proposed methodology and that from the
conventional method #1 was B8. However, this analysis did not consider the internal pressure
acting on connections (i.e. internal pressure coefficient is assumed to be zero) and assumed that
cladding fasteners have not failed.
Figure 6.14: Vulnerability of batten
connections for θ=150° in TC 2.5
-with load distribution method
Figure 6.15: Vulnerability of batten truss
connections for θ=150° in TC 2.5
-Conventional method #1
0.00
0.02
0.04
0.06
0.08
0.10
0.12
0.14
0.16
40 50 60 70 80 90
Pro
bab
ility
of
failu
re
Wind speed (m/s)
B7
B6
B8
A7
C7
0.00
0.02
0.04
0.06
0.08
0.10
0.12
0.14
0.16
40 50 60 70 80 90
Pro
bab
ility
of
failu
re
Wind speed (m/s)
B8
B7
B6
A7
C7

Page 131 of 202
Failure of a door or a window can create a dominant opening in contemporary houses leading to
a significant increase in internal pressure. Failure of ceiling elements or the ceiling access
manholes will transmit these high internal pressures to the roof cladding and as a result the wind
loads on roofing components are increased. The house subjected to internal pressure
coefficients 0.2, 0.4 and 0.7 were determined in this study. The maximum internal pressure
coefficient specified in AS/NZS 1170.2 (2011) is 0.7. The internal pressure coefficient was the
same for each wind speed step in this analysis. Figures 6.16 and 6.17 show the vulnerability of
the batten-to-truss connections using the largest internal pressure coefficient (i.e. 0.7) for load
distribution method and conventional method #1 respectively for 150° wind approach direction.
These figures show that when internal pressures are included, connection B7 is still the most
vulnerable using the load distribution method, but the connection C7 is the most vulnerable
using conventional method #1. At a wind speed of 75m/s, the probability of failure of
connection B7 has increased up to 25% as shown in the Figure 6.16 and that from the
conventional method #1 has increased up to 6%. The figures for 0.2 and 0.4 internal pressure
coefficients are also shown in Appendix C. Thus, the conventional method #1 significantly
underestimates the vulnerability of some connections. Hence, the load distribution effects must
be incorporated when determining the vulnerability of these connections. However, these
curves are based on the wind direction giving the largest loads and assuming that cladding
fasteners have not failed.
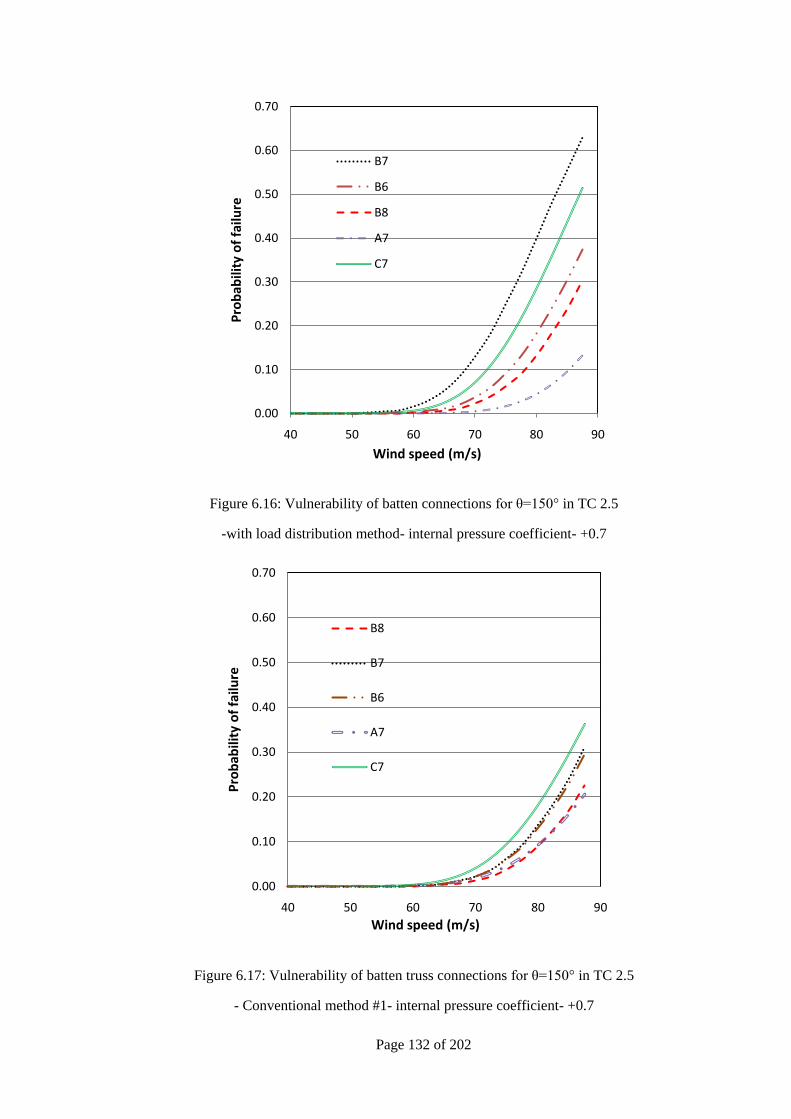
Page 132 of 202
Figure 6.16: Vulnerability of batten connections for θ=150° in TC 2.5
-with load distribution method- internal pressure coefficient- +0.7
Figure 6.17: Vulnerability of batten truss connections for θ=150° in TC 2.5
- Conventional method #1- internal pressure coefficient- +0.7
0.00
0.10
0.20
0.30
0.40
0.50
0.60
0.70
40 50 60 70 80 90
Pro
bab
ility
of
failu
re
Wind speed (m/s)
B7
B6
B8
A7
C7
0.00
0.10
0.20
0.30
0.40
0.50
0.60
0.70
40 50 60 70 80 90
Pro
bab
ility
of
failu
re
Wind speed (m/s)
B8
B7
B6
A7
C7

Page 133 of 202
With failed batten-truss connection B7
Figure 6.18 shows the probability of failure for connections B6, B8, A7 and C7 in the roof with
a failed connection B7, for 150° wind approach direction based on the load distribution method.
The results reflect the data in Table 6.5 which shows the connection C7 becomes more
vulnerable. For example, the probability of failure of C7 increases from 1% (from Figure 6.14)
to 11% at 75m/s. This analysis assumed that the internal pressure coefficient was zero.
Figure 6.18: Probability of batten-truss connection failure vs wind speed following the failure of
B7 in TC 2.5- internal pressure coefficient- 0
The effect of other parameters
The application of this test data for a population of houses that are located in the community
requires consideration of the parameters defined in Equation 3.14 and the directional variability
of wind pressure during a cyclone (Jancauskas et al. (1994)). Such an analysis will also need to
account for variation in house geometry, terrain, topography and shielding in addition to the
variation in batten and truss layouts and fixings.
0.00
0.10
0.20
0.30
0.40
0.50
0.60
0.70
40 50 60 70 80 90
Pro
bab
ility
of
failu
re
Wind speed (m/s)
B6
B8
A7
C7

Page 134 of 202
Each of normalized terms in the brackets in Equation 3.14 was treated as random variables with
probability distributions (Lognormal distribution was used), mean values, and coefficient of
variation obtained from analysing available data. This study incorporated the values used by
previous studies such as those by Henderson and Ginger (2007) for the parameters shown in
Table 6.6. The values for the connections were obtained from the wind tunnel model
study for this analysis.
Table 6.6: Statistical parameters for normalized values
Factor Mean Value COV
1 0
1 0.10
0.95 0.10
0.95 0.10
0.95 0.10
1 0.02
Furthermore, the percentage of houses subjected to higher internal pressure as a result of
dominant opening in the envelope was taken to increase from 0% to a maximum of 90% for
approach gust wind speed of 40m/s to 80m/s. These values were based on limited survey results
and expert opinion. The internal pressure coefficient of 0.7 was applied. Figure 6.19 shows the
vulnerability of batten-to-truss connections incorporating above factors for 150°wind approach
direction. The analysis used the load distribution effects including the factors in the Table 6.6.
The vulnerability of the connections generally reduced compared to the curves obtained in
Figure 6.16 due to the effect of other factors (the vulnerability of the connection B7 drops from
25% to 11% at 75 m/s). Thus, these factors have a significant impact on the connection

Page 135 of 202
vulnerability and should be used for assessing the overall vulnerability of the houses. It should
be noted that this analysis assumed that cladding fasteners have not failed.
Figure 6.19: The effect of factors in Eqn 3.14 on batten-to-truss connection vulnerability for
θ=150° in TC 2.5- internal pressure coefficient- +0.7
Vulnerability of cladding and truss to wall connections
Similarly, the vulnerability of cladding fastener connections and truss-to-wall connections in
selected regions of the roof for different wind approach direction was estimated. The cladding
fixings in regions P, Q, R, S and T as shown in Figure 6.20 (i.e. Figure 4.4) were analysed. In
this case, the wind loads acting on the tributary area for cladding fasteners was to be supported
by the relevant connection (i.e. Reaction coefficient was taken as one), as shown by Henderson
(2010). The truss-to-wall connections on truss B, F and L shown in Figure 6.20 were also
analysed using the wind load data described in Chapter 4. These analyses were conducted
assuming that the related other connections have not failed. For example, the vulnerability for
cladding failures was determined assuming that no failures in batten-to-truss connections and
0.00
0.10
0.20
0.30
0.40
0.50
0.60
0.70
40 50 60 70 80 90
Pro
bab
ility
of
failu
re
Wind speed (m/s)
B7
B6
B8
A7
C7

Page 136 of 202
truss-to-wall connections. Figures 6.21 and 6.22 show the vulnerability of cladding fastener
connections and truss-to-wall connections respectively, over selected regions of the roofs for
the wind approach direction generating the largest load effect (i.e. worst direction indicated for
each region in each Figure). These figures also give the probability of failure of each connection
type with the approach gust wind speed at 10m height in Terrain Category 2.5 and the analysis
used incorporated the effect of other factors. Figure 6.21 shows that the cladding fixings are
more vulnerable in regions P and Q.
Figure 6.22 shows that truss B near the gable end was the most vulnerable and the trusses at
middle regions of the roof were less vulnerable. This analysis incorporated the internal pressure
coefficient of 0.7. The vulnerability without the internal pressure and without the effect of other
parameters is also shown in Appendix C for these connections. The Figures 6.19, 6.21 and 6.22
indicate that the cladding fixing is the most vulnerable followed by batten-to-truss connection
and then the truss-to-wall connection.
Figure 6.20: Typical contemporary house (i.e. Figure 4.4)
θ =0° θ

Page 137 of 202
Figure 6.21: Probability of failure vs Basic Wind speed- Cladding connections for house in TC
2.5- internal pressure coefficient- +0.7
Figure 6.22: Probability of failure vs Basic Wind speed-Truss-to-wall connections for house in
TC 2.5- internal pressure coefficient- +0.7
0.00
0.10
0.20
0.30
0.40
0.50
0.60
0.70
40 50 60 70 80 90
Pro
bab
ility
of
failu
re
Wind speed (m/s)
P(θ=150°)
Q(θ=75°)
R(θ=330°)
S(θ=150°)
T(θ=150°)
0.00
0.10
0.20
0.30
0.40
0.50
0.60
0.70
40 50 60 70 80 90
Pro
bab
ility
of
failu
re
Wind speed (m/s)
B(θ=90°)
F(θ=30°)
L(θ=45°)

Page 138 of 202
6.5 Summary and Discussion
The study compared the load distributions on batten-to-truss connections and found that the use
of conventional methods underestimate the wind loads on batten-to-truss connections. As
discussed in Chapter 2, most studies use the conventional tributary area for design and
vulnerability/fragility analysis of structural components of houses. These studies do not
satisfactorily incorporate the load distribution effects, and hence may under estimate the
vulnerability of these connections to windstorms. This chapter shows that the application of
current simplistic tributary area approach in association with instantaneous wind pressure is
unreliable. However, the structural systems used in other studies were different to the structural
system used in this study. Therefore, the approach used in this study should be employed with
other structural systems to determine the effects of the load distribution when assessing their
vulnerability.
The procedure that is proposed in this study is that, the reaction coefficients related to the
response of each connection type in a structural system should be determined for the
undamaged system and then for several damage scenarios. This would enable the tributary area
related to each connection type in a structural system to be identified. Then, the connection load
should be assessed combining the reaction coefficients and the associated tributary area with the
wind pressure considering the variation of wind pressures both spatially and timewise. This
proposed procedure is applicable for any structural system to determine reliable loads on
connection.
Following this procedure, the vulnerability assessment can be undertaken using reliability and
probability theories incorporating Monte Carlo Simulation methods. This study did not
incorporate Monte Carlo simulation techniques to account for the consequent failures of other
connections (only reliability theory and probability theories considered for a single connection
type failure). This study determined the vulnerability of each connection type assuming the
other connections do not fail. In reality failure of one connection negates the failure of
Page 139 of 202
dependent connections. However, the procedure described is applicable to a wide range of
systems and geometries for assessing the building vulnerability.
This study also analysed the vulnerability of connections for deterministic values of internal
pressure (internal pressure coefficients of 0.2, 0.4 and 0.7). It also used assumptions for the
internal pressure with increasing wind speed based on limited survey results and expert opinion.
However, the more accurate internal pressure values should be incorporated with increasing
wind speed as it has a significant effect on the failure of the connections.
The vulnerability obtained for cladding fixings here appear to be over-estimating the damage,
since recent windstorms such as Cyclone Yasi (Boughton et al. (2011) did not indicate such
significant failures for wind events less than the design wind speed. Henderson (2010) showed
that cladding systems designed in cyclone region to cyclic test regime (L-H-L) are able to
withstand significantly large loads in simulated design cyclone suctions. These systems have a
significantly larger strength than that specified by design, because of the cyclone L-H-L
strength requirements for cladding fixings. Therefore, the analysis may over-estimate the
vulnerability of the cladding fixings. Furthermore, this analysis was carried out for the worst
direction with large internal pressures. It might have not occurred in actual conditions due to the
directional variability of wind pressure during a cyclone, as described by Jancauskas et al.
(1994). The region of gable end towards the ridge (i.e. Region P) might have had additional
strength due to the ridge capping of the houses and hence the failure might have not occurred
during these windstorms.
The use of normalized parameters in the analysis method reduces the variability that occurs due
to the house dimensions, shielding, topography and terrain category etc. The uncertainties can
also be accounted with the use of probabilistic parameters in the analysis. However, these
parameters should be validated with further research. In order to obtain reliable vulnerability
curves, it is necessary to consider the probabilistic nature of the load action and response of the
housing components.

Page 140 of 202
7 CONCLUSIONS AND RECOMMENDATIONS
7.1 Conclusions
This study determined the transmission of wind loads through roofing components, including
the effect of local failures, and the impact on the overall structural performance of the roof
system. Specifically the distribution of applied loads and associated structural response of a
batten-to-truss connection from contemporary houses built in cyclonic region of Australia was
investigated and its application to design and vulnerability was determined. This was achieved
by obtaining; a common structural system, the spatial and temporal variation of wind loads
acting on the roofing connections from a wind tunnel study, and the effect of load sharing and
interdependency between components and progressive failure by conducting a series of tests on
selected sub-assemblies of the roof system.
The main conclusion drawn from this study is that loads on the batten-to-truss connections are
strongly influenced by the behaviour of the entire structural system and the wind pressure
distribution on roof. The study showed that load transferred to batten-to-truss connections are
influenced by the flexibility of the battens and cladding used in the roof, and the directional
stiffness characteristics of the cladding. The redistribution of batten-to-truss connection loads
following failure of connections also depends on these properties. Furthermore, these
connection loads are dependent on the instantaneous distributions of the wind pressure (i.e.
spatial correlation of pressures) on the cladding panels supported by these fixings. As a result,
estimates based on the application of wind pressures to the conventional connection tributary
area, which is normal design practice, can be unreliable and can lead to underestimation of
connection loads. The study showed that a larger tributary area should be considered to obtain
the batten-to-truss connection loads on these structural systems. Furthermore, the study also
showed that consideration of the wind pressure distribution and the load transfer is important
for the assessment of the vulnerability of the type of roof system investigated.

Page 141 of 202
A primary outcome of the thesis is the establishment of an improved procedure for analysing
the variation of the connection loads with time, taking account of the spatial and temporal
variation in wind pressures and the structural response characteristics of the roof system, which
is a necessary first step in the assessment of their vulnerability.
The study established a useful tool for establishing the fatigue loads on the connections which
would be the next step required in the development of the relationship between vulnerability
and wind speed. The procedure proposed in this study can be used for evaluating the tributary
area and the associated reaction coefficients for other roof geometries and structural systems, in
order to carry out the connection design and to assess their vulnerability. The outcomes from
this study can be used for roof systems similar to that used in this study.
Other conclusions are as follows:
The uplift load on a connection is dependent on the characteristics of the fluctuating
wind load on the area of influence. The study shows that the batten-to-truss
connection load is affected by loads acting outside the conventional tributary area. It
also shows that the majority of the load on a panel is distributed among the batten-to-
truss connections supporting the loaded panel. The failure or partial failure of a
batten-to-truss connection redistributes the majority of load to the adjoining batten-to-
truss connections either via battens or crests of the cladding. Further, the reaction
coefficients of the batten-to-truss connections in the linear and non-linear response of
cladding are not the same, but the difference is not significant. These results indicate
the extent of load distribution and redistribution that should be incorporated in
structural analysis and vulnerability assessments of these types of structural systems.
The subassembly tests also show that;

Page 142 of 202
The strength capacity of the cladding panels in corner regions (i.e. Panels near
eave and ridge) is less than the panels in the inner regions, causing failure of
fasteners or batten-to-truss connections at a lower load in the corner panels due
to their reduced capability to share the load.
The deflection on the cladding increases linearly with increasing load and then
becomes non-linear increasing the deflection at a progressively faster rate with
the onset of plastic deformation of cladding. When the cladding fastener failure
occurs, the deflection of the cladding increases significantly. Thus, failure of a
batten-to-truss connection generally increases the deflections and hence reduces
the stiffness of the roof.
The variation in reaction coefficient was not significant with the spacing of the
battens in most of the connections except for some locations which had a
maximum of 20% variation (i.e. reaction coefficient of the interior connection
of corner panel). Thus, the results obtained can be used to describe the load
distribution of batten-to-truss connections for a range of masonry block houses
with typical batten and truss spacings.
The partial failure of a batten-to-truss connection (i.e. removal of one screw)
indicated that the reaction coefficient of the connection is reduced to some
extent (i.e. up to a maximum of 31%) and transfers the loads to the adjoining
connections. Thus, it is still able to carry the load but the connection has a
lower strength capacity.
The variability of uplift capacity of the cladding fastener connections, batten-to-truss
connection and truss-to-wall connection of common contemporary houses in cyclonic
regions of Australia, were well fitted by a Lognormal probability distribution which can
be used to assess the reliability of the roof system.

Page 143 of 202
The wind tunnel study also showed that for the house geometry studied, which is
typical of current housing construction in North Queensland;
The largest cladding and batten connections loads occurred for wind approach
directions 120°-150° and that for truss-to-wall connection was 90° confirming
results obtained from previous studies.
AS/NZS 1170.2 (2011) underestimates the external pressures on cladding
fixings at roof corners towards the ridge at a gable end.
The Generalized Extreme Value distribution with a negative shape parameter
(Type III distribution) gives the best fit for wind loads on cladding fixings for
most of the wind approach directions.
The vulnerability analysis showed that for the house geometry and roof construction
studied;
The internal batten-to-truss connection of the corner panel towards the ridge
experienced the largest load for 150° wind approach direction due to a
combination of wind load action and structural response.
The cladding fasteners are the most vulnerable to wind loads followed by the
batten-to-truss connections and then the truss-to-wall connections. In particular,
the cladding fixings and the internal batten-to-truss connection in the roof
corner towards the ridge is the most vulnerable. The first internal truss near the
gable end was the most vulnerable while trusses in middle regions of the roof
were less vulnerable to wind loads.
These outcomes make a significant contribution to the aim of understanding the wind load
distribution and developing vulnerability functions for houses.

Page 144 of 202
7.2 Recommendations
This study developed a general procedure and produced useful data for design and for
developing an engineering-based vulnerability model by considering the probabilistic nature of
load actions and building response of cladding fasteners and batten-to-truss connections. The
study recommends that the simplistic approach of applying wind pressure to a conventional
tributary area is unreliable for metal clad roof systems supported by metal battens. The
structural flexibility and temporal and spatial variability of pressures need to be taken into
account to determine the loads on connections.
Furthermore, the study also recommends using the type of procedure proposed in this study for
evaluating the characteristics of the connection loads. Thus, the reaction coefficients related to
the response of each connection type in a structural system should be determined for the
undamaged system and for several damage scenarios. This would enable the tributary area
related to each connection type of a structural system to be identified. Then, the connection load
should be assessed combining the reaction coefficients and the associated tributary area with the
wind pressure considering the variation of wind pressures both spatially and temporally.
However, any approach for developing reliable vulnerability and wind speed relationships for
roof systems needs to take the influence of fatigue into account since the relationship
between fatigue strength and wind speed is highly non-linear and very dependent on the actual
nature and duration of the load fluctuations. As the wind speed and direction changes in a
cyclone (i.e. Jancauskas et al. (1994)), a specific area on a roof will experience the wind
pressure from different directions (For example, as the wind speed increases during a cyclone,
the direction can change from say 200° at time =0hr, to 150° when the wind speed is the highest
at time =2.5hr, and then to 100° at time = 5hr when the wind has dropped off again).
Consequently, the wind load data described in this study cannot be used directly for
vulnerability analysis for cyclone winds, although it would be relevant for thunderstorm winds.
However, the procedure developed in this study could be used for developing the temporal

Page 145 of 202
variation of loadings on a connection during the passage of a cyclone which is needed as input
for any study of vulnerability incorporating fatigue. Therefore, further studies with this focus
are recommended. Furthermore, this procedure can be applied to Database-Assisted Design
(DAD) process described by Whalen et al. (2002).
These studies also can be extended to analyse the response of truss-to-wall connections to
obtain reaction coefficients, deflections, etc, for various damage scenarios. Furthermore,
components such as ceiling and cornices should be incorporated in any future test setups. The
failure of individual elements and the redistribution of loads through the structure as a result of
local failures including time dependant effect such as fatigue could be incorporated. This will
lead to a better understanding of the overall structural behaviour under wind loads. The results,
such as distribution of loads and load-deflection curves are important to carry out linear/ non-
linear analysis of the roofing system. The boundary conditions used in these test set ups can be
incorporated in structural engineering software and the analysis can be performed for the total
structure being considered. These results should be validated through tests on a complete full
scale house.
The analysis conducted in this study for assessing the vulnerability did not use Monte Carlo
simulation methods. Therefore, it is recommended to use Monte Carlo simulation techniques for
future studies. The data obtained and the methodologies used in this study provide information
for the development of more accurate software models for assessing building vulnerability. An
example of a preliminary version of such a product, VAWS is discussed in the Appendix D.
This software incorporates structural behaviour using structural analysis and uses conventional
tributary areas for obtaining the load on connections. Therefore, the output results will need to
be calculated to account for the load distribution effect. However, the methodology used in the
software and the techniques such as reliability and probability methods incorporating Monte
Carlo simulation are very important for extending the studies for obtaining an overall
vulnerability of contemporary house. The use of such techniques is necessary in engineering

Page 146 of 202
vulnerability models to determine more reliable vulnerability assessments. The outcomes of this
study make a significant contribution to the ultimate objective of developing vulnerability
functions for contemporary houses.
Finally, this research can be expanded to incorporate the response of other residential
construction to wind events considering the large variety of structural systems of buildings,
shapes and sizes etc through better understanding of approach wind speed including analysis of
uncertainties in structural system behaviour, loading, damage and cost for loss estimation and
decision making. Such models require a considerable amount of investment in research and
development.

Page 147 of 202
8 REFERENCES
Ang, A. H.-S. and Tang, W. H. (2007). Probability Concepts in Engineering: Empasis on
Applications in Civil and Environmental Engineering, John Willy & Sons,inc.
ASCE 7-10 (2010). Minimum Design Loads for Buildings and Other Structures
BCA (2011). Building Code of Australia, ABCB, Canberra.
Ben Ayed, S., Aponte-Bermudez, L. D., Hajj, M. R., Tieleman, H. W., Gurley, K. R. and
Reinhold, T. A. (2011). "Analysis of hurricane wind loads on low-rise structures."
Engineering Structures In Press, Corrected Proof.
Boughton, G. N., Henderson, D. J., Ginger, J. D., Holmes, J. D., Walker, G. R., Leitch, C.,
Somerville, L. R., Frye, U., Jayasinghe, N. C. and Kim, P. (2011). "Tropical Cyclone
Yasi Structural Damage to Buildings." TR 57.
Boughton, G. N. and Reardon, G. F. (1982). Simulated Wind Tests On a House, Cyclone
Testing Station, James Cook University, Townsville.TR 14.
Boughton, G. N. and Reardon, G. F. (1983). Testing a High Set House Designed for 42m/s
Winds, Cyclone Testing Station, James Cook University, Townsville.TR 19.
Boughton, G. N. and Reardon, G. F. (1984). Simulated Wind Load Tests on the Tongan
Hurricane House, Cyclone Testing Station, James Cook University, Townsville.TR 23.
Case, P. C. and Isyumov, N. (1998). "Wind loads on low buildings with 4 : 12 gable roofs in
open country and suburban exposures." Journal of Wind Engineering and Industrial
Aerodynamics 77-78: 107-118.
Cochran, L. S. and Cermak, J. E. (1992). "Full- and model-scale cladding pressures on the
Texas Tech University experimental building." Journal of Wind Engineering and
Industrial Aerodynamics 43(1-3): 1589-1600.
Cope, A. D., Gurley, K. R., Gioffre, M. and Reinhold, T. A. (2005). "Low-rise gable roof wind
loads: Characterization and stochastic simulation." Journal of Wind Engineering and
Industrial Aerodynamics 93(9): 719-738.
Cummins, W. (2002). Bond beam truss hold down connections. BSc Thesis, James Cook
University, Townsville.
Datin, P. L. and Prevatt, D. O. (2007). Wind uplift reactions at roof to wall connections of wood
framed gable roof assembly. 12th International Conference on Wind Engineering,
Cairns, Australia.
Datin, P. L., Prevatt, D. O. and Cook, R. A. (2011). Wind load design using ASCE 7 Main
Wind Force Resisting System in Light Frame Wood Construction. 13th International
Conference on Wind Engineering, Amsterdam, Netherlands.
Eaton, K. J. and Mayne, J. R. (1975). "The measurement of wind pressures on two-storey
houses at Aylesbury." Journal of Wind Engineering and Industrial Aerodynamics 1: 67-
109.
Ellingwood, B. R., MacGregor, J. G., Galambos, T. V. and Cornell, C. A. (1982). "Probability-
Based Load Criteria:Load Factors and Load Combinations." Journal of Structural
Division ASCE 108(5): 978-997.
Ellingwood, B. R., Rosowsky, D. V., Li, Y. and Kim, J. H. (2004). "Fragility Assessment of
Light-Frame Wood Construction Subjected to Wind and Earthquake Hazards." Journal
of Structural Engineering 130(12): 1921-1930.
Ellingwood, B. R. and Tekie, P. B. (1999). "Wind Load Statistics for Probability-Based
Structural Design." Journal of Structural Engineering 125(4): 453-463.

Page 148 of 202
Fowler, R. (2003). Fatigue damage to metal bettens subjected to simulated wind loads. BE
Thesis, James Cook University,Townsville.
Galambos, T. V., Ellingwood, B. R., MacGregor, J. G. and Cornell, C. A. (1982). "Probability-
Based Load Criteria: Assessment of Current Design Practice." Journal of Structural
Division ASCE 108(5): 959-977
Geoscience Australia (2007). Natural Hazards in Australia - Identifying risk analysis
requirements, by Geoscience Australia, DOTARS, Bureau of Meteorology and CSIRO.
Ginger, J. D. and Holmes, J. D. (2005). "Design wind loads on gable-ended low-rise buildings
with moderate and steep roof slopes." Australian Journal of Structural Engineering
6(2): 89-102.
Ginger, J. D., Holmes, J. D. and Kim, P. Y. (2010). "Variation of Internal Pressure with
Varying Sizes of Dominant Openings and Volumes." Journal of Stuctural Engineering
136(10): 1319-1326.
Ginger, J. D., Holmes, J. D. and Kopp, G. A. (2008). "Effect of building volume and opening
size on fluctuating internal pressure." Wind & Structures 11: 361-376.
Ginger, J. D., Mehta, K. C. and Yeatts, B. B. (1997). "Internal pressures in a low-rise full-scale
building." Journal of Wind Engineering and Industrial Aerodynamics 72: 163-174.
Ginger, J. D., Reardon, G. F. and Whitbread, B. J. (2000). "Wind load effects and equivalent
pressures on low-rise house roofs." Engineering Structures 22(6): 638-646.
Hamid, S., Golam Kibria, B. M., Gulati, S., Powell, M., Annane, B., Cocke, S., Pinelli, J.-P.,
Gurley, K. and Chen, S.-C. (2010). "Predicting losses of residential structures in the
state of Florida by the public hurricane loss evaluation model." Statistical Methodology
7(5): 552-573.
Henderson, D. J. (2010). Response of pierced fixed metal roof cladding to fluctuating wind
loads. PhD Thesis, James Cook University, Townsville.
Henderson, D. J. and Ginger, J. D. (2007). "Vulnerability model of an Australian high-set house
subjected to cyclonic loading." Wind & Structures 10(3): 269-285.
Henderson, D. J. and Ginger, J. D. (2011). "Response of pierced fixed corrugated steel roofing
systems subjected to wind loads." Engineering Structures 33(12): 3290-3298.
Henderson, D. J., Ginger, J. D., Leitch, C., Boughton, G. and Falck, D. (2006). Tropical
Cyclone Larry – Damage to buildings in the Innisfail area, Cyclone Testing Station,
James Cook University, Townsville.TR51.
Henderson, D. J. and Harper, B. (2003). Detailed Modeling of the Vulnerability of Domestic
Housing to Tropical Cyclone winds Proc. 11th AMOS International conference on
storms and disaster mitigation, Brisbane, Australia.
Henderson, D. J., Leitch, C., Frye, U., Ginger, J. D., Kim, P. and Jayasinghe, N. C. (2010).
Investigation of Housing and Sheds in Procerpine, Midge point, and Airlie Beach,
Following Tropical Cyclone Ului, Cyclone Testing Station, James Cook University,
Townsville.TR 56.
Henderson, D. J., Morrison, M. J. and Kopp, G. A. (2011). Spatially and temporary varying
wind loads applied to a full-scale, timber-framed, hip roof. 13th International
Conference on Wind Engineering, Amsterdam, Netherlands.
Hill, K., Datin, P., Prevatt, D. O., Gurley, K. R. and Kopp, G. A. (2009). A Case for
Standardized Dynamic Wind Uplift Pressure Test for Wood Roof Structural Systems.
11th Amaricas Conference on Wind Engineering, San Juan, Puerto Rico.

Page 149 of 202
Ho, T. C. E., Surry, D. and Davenport, A. G. (1990). "The variability of low building wind
loads due to surrounding obstructions." Journal of Wind Engineering and Industrial
Aerodynamics 36(Part 1): 161-170.
Ho, T. C. E., Surry, D. and Davenport, A. G. (1991). "Variability of low building wind loads
due to surroundings." Journal of Wind Engineering and Industrial Aerodynamics 38(2-
3): 297-310.
Ho, T. C. E., Surry, D. and Davenport, A. G. (1992). "Low building wind load variability with
application to codes." Journal of Wind Engineering and Industrial Aerodynamics 43(1-
3): 1787-1798.
Ho, T. C. E., Surry, D., Morrish, D. and Kopp, G. A. (2005). "The UWO contribution to the
NIST aerodynamic database for wind loads on low buildings: Part 1. Archiving format
and basic aerodynamic data." Journal of Wind Engineering and Industrial
Aerodynamics 93(1): 1-30.
Holmes, J. D. (1979). Mean and fluctuating internal pressures induced by wind. Proc. 5th Int.
Conf. on Wind Engineering, Colorado, USA.
Holmes, J. D. (1981). Wind Pressures on Houses with High Pitched Roofs. Wind Engineering
reports 4/81, James Cook University, Townsville.
Holmes, J. D. (1983). Comparative Studies of Wind Pressures on a Low-rise Building. Eighth
Australian Fluid Mechanics Conference University of New Castle, N.S.W.
Holmes, J. D. (1985). "Wind loads and limit states design." Civ.Eng.Trans, IE Aust CE27: 21-
25.
Holmes, J. D. (2007). Wind Loading of Strucures, Spon Press, London, UK.
Holmes, J. D. and Best, R. J. (1977). Wind Tunnel Measurement of Mean Pressures on House
Model and Comparision with Full Scale Data 6th Australasian Hydraulics and Fluid
Mechanics Conference, Adilaide, Australia.
Holmes, J. D. and Best, R. J. (1979). A wind Tunnel Study of Wind Pressures on grouped
tropical houses. Wind Engineering Report 5/79, James Cook University, Townsville.
Holmes, J. D. and Best, R. J. (1981). "An approach to the determination of wind load effects on
low-rise buildings." Journal of Wind Engineering and Industrial Aerodynamics 7(3):
273-287.
Holmes, J. D. and Cochran, L. S. (2003). "Probability distributions of extreme pressure
coefficients." Journal of Wind Engineering and Industrial Aerodynamics 91(7): 893-
901.
Holmes, J. D., Wehner, M., Sandland, C. and Edwards, M. (2010 ). Modelling damage to
residential buildings from wind-borne debris-Part 1.Methodology. 14th Australasian
Wind Engineering Workshop, Geosciences Australia, Canberra.
Jancauskas, E. D., Mahendran, M. and Walker, G. R. (1994). "Computer simulation of the
fatigue behaviour of roof cladding during the passage of a tropical cyclone." Journal of
Wind Engineering and Industrial Aerodynamics 51(2): 215-227.
Jayasinghe, N. C. and Ginger, J. D. (2011). "Vulnerability of Roofing Components to Wind
Loads." Wind & Structures 14(4): 321-335.
Kasperski, M. and Hoxey, R. (2008). "Extreme-value analysis for observed peak pressures on
the Silsoe cube." Journal of Wind Engineering and Industrial Aerodynamics 96(6-7):
994-1002.
Kasperski, M. and Niemann, H. J. (1992). "The L.R.C. (load-response-correlation} - Method A
General Method of Estimating Unfavourable Wind Load Distributions for Linear and
Page 150 of 202
Non-linear Structural Behaviour." Journal of Wind Engineering and Industrial
Aerodynamics 41-44: 1753-1763.
Kopp, G. A., Morrison, M. J. and Henderson, D. J. (2011). Full-scale testing of low-rise
building using realistically simulated wind loads. 13th International Conference on
Wind Engineering, Amsterdam, Netherlands.
Lee, K. H. and Rosowsky, D. V. (2005). "Fragility assessment for roof sheathing failure in high
wind regions." Engineering Structures 27(6): 857-868.
Leicester, R. H., Pham, L. and Kleeman, P. W. (1985). "Use of reliability concepts in the
conversion of codes to limit state design." Civ.Eng.Trans CE27: 1-7.
Leicester, R. H. and Reardon, G. F. (1976). A Statistical Analysis of the Structural Damage by
Cyclone Tracy, The institution of Engineers Australia.
Leitch, C., Ginger, J. D., Harper, B., Kim, P., Jayasinghe, N. C. and Somerville, L. R. (2010).
"Performance of Housing in Brisbane Following Storms on 16 November 2008."
Australian Journal of Stuctural Engineering Vol 11(No 1).
Letchford, C. W., Iverson, R. E. and McDonald, J. R. (1993). "The application of the Quasi-
steady Theory to full scale measurements on the Texas Tech building." Journal of Wind
Engineering and Industrial Aerodynamics 48(1): 111-132.
Levitan, M. L., Mehta, K. C., Vann, W. P. and Holmes, J. D. (1991). "Field measurements of
pressures on the Texas tech building." Journal of Wind Engineering and Industrial
Aerodynamics 38(2-3): 227-234.
Li, Q. S., Calderone, I. and Melbourne, W. H. (1999). "Probabilistic characteristics of pressure
fluctuations in separated and reattaching flows for various free-stream turbulence."
Journal of Wind Engineering and Industrial Aerodynamics 82(1-3): 125-145.
Li, Q. S., Hu, S. Y., Da, Y. M. and Li, Z. N. (2009). Extreme-value analysis for field measured
peak pressure coefficients on a low-rise building. 7th Asia-Pacific conference on wind
engineering, Taipei, Taiwan.
Li, Y. and Ellingwood, B. R. (2006). "Hurricane damage to residential construction in the US:
Importance of uncertainty modeling in risk assessment." Engineering Structures 28(7):
1009-1018.
Li, Y. and Ellingwood, B. R. (2009). "Framework for Multihazard Risk Assessment and
Mitigation for Wood-Frame " Journal of Stuctural Engineering 135(2): 159-168.
Lin, J. X. and Surry, D. (1998). "The variation of peak loads with tributary area near corners on
flat low building roofs." Journal of Wind Engineering and Industrial Aerodynamics 77-
78: 185-196.
Lindt, J. W. v. d. and Dao, T. N. (2009). "Performance-Based Wind Engineering for Wood-
Frame Buildings." Journal of Stuctural Engineering 135(2): 169-177.
Liu, H. and Saathoff, P. J. (1981). "Building Internal Pressure:Sudden Change." Journal of
Engineering Mechanics Division 107(EM2): 309-321.
Mahendran, M. (1989). Fatigue behaviour of corrugated roofing under cyclic wind loading,
Cyclone Testing Station, James Cook University, Townsville,TR 35.
Mahendran, M. (1995). "Towards an appropriate fatigue loading sequence for roof claddings in
cyclone prone areas." Engineering Structures 17(7): 476-484.
Meecham, D., Surry, D. and Davenport, A. G. (1991). "The magnitude and distribution of wind-
induced pressures on hip and gable roofs." Journal of Wind Engineering and Industrial
Aerodynamics 38(2-3): 257-272.
Page 151 of 202
Mehta, K. C., Levitan, M. L., Iverson, R. E. and McDonald, J. R. (1992). "Roof corner
pressures measured in the field on a low building." Journal of Wind Engineering and
Industrial Aerodynamics 41(1-3): 181-192.
Melchers, R. E. (1985). "Reliability Calculation for Structures." Civ.Eng.Trans CE27: 124-129.
Melchers, R. E. (1987). Structural Reliability Analysis and Predictions, Ellis Horwood Ltd,
England.
Mensah, A. F., Datin, P. L., Prevatt, D. O., Gupta, R. and van de Lindt, J. W. (2011).
"Database-assisted design methodology to predict wind-induced structural behavior of a
light-framed wood building." Engineering Structures 33(2): 674-684.
Morrison, M. J., Henderson, D. J. and Kopp, G. A. (2011). Response of a Wood-Frame Gable
Roof, Under Realistic Fluctuation Wind Loads. 13th International Conference on Wind
Engineering, Amsterdam, Netherlands.
Morrison, M. J. and Kopp, G. A. (2009). Application of Realistic Wind Loads to the Roof of a
Full-scale, Wood-Frame House. 11th Amaricas Conference on Wind Engineering, San
Juan, Puerto Rico.
Morrison, M. J. and Kopp, G. A. (2011). "Performance of toe-nail connections under realistic
wind loading." Engineering Structures 33(1): 69-76.
Pham, L. (1985). "Load Combinations and Probabilistic Load Models for Limit State Codes."
Civ. Eng. Trans CE27: 62-67.
Pham, L., Holmes, J. D. and Leicester, R. H. (1983). "Safety indices for wind loading in
Australia." Journal of Wind Engineering and Industrial Aerodynamics 14(1-3): 3-14.
Pielke, R. A., Jr and Pielke, R. A., Sr (1997). Hurricanes: Their Nature and Impacts on Society,
John Wiley and Sons, U.K.
Pinelli, J.-P., Simiu, E., Gurley, K., Subramanian, C., Zhang, L., Cope, A., Filliben, J. J. and
Hamid, S. (2004). "Hurricane Damage Prediction Model for Residential Structures."
Journal of Structural Engineering 130(11): 1685-1691.
Pinelli, J. P., Gurley, K. R., Subramanian, C. S., Hamid, S. S. and Pita, G. L. (2008).
"Validation of a probabilistic model for hurricane insurance loss projections in Florida."
Reliability Engineering & System Safety 93(12): 1896-1905.
Pita, G. L., Pinelli, J. P., Cocke, S., Gurley, K., Weekes, J. and Mitrani-Reiser, J. (2011).
Assessment of hurricane-induced internal damage to low-rise buildings in the Florida
Hurricane Loss Model. 13th International Conference of Wind Engineering,
Amsterdam, Netherlands.
Pita, G. L., Pinelli, J. P., Gurley, K. R., Subramanian, C. S. and Hamid, S. S. (2009).
Vulnerability of low-rise commercial-residential buildings in the Florida Public
Hurricane Loss Model. 11th Amaricas Conference on Wind Engineering, San Juan,
Puerto Rico.
Reardon, G. F. (1986). Simulated Cyclone Wind Loading of a Brick Veneer House, Cyclone
Testing Station, James Cook University, Townsville,TR 28.
Reardon, G. F. (1990). Simulated Cyclone Wind Loading of a Nu-Steel House, Cyclone Testing
Station, James Cook University, Townsville,TR 36.
Reardon, G. F. (1996). Simulated Wind Load Testing of Full size Houses. Joint IStructE/City
University International Seminar, City University, London.
Reardon, G. F. and Henderson, D. J. (1996). Simulated Wind Loading of a Two storey Test
house. International Wood Engineering Conference, New Orleans, Louisiana, USA.

Page 152 of 202
Reardon, G. F. and Holmes, J. D. (1981). Wind Tunnel Research on Low Rise Buildings,
Cyclone Testing Station, James Cook University, Townsville,TR 11.
Reardon, G. F. and Mahendran, M. (1988). Simulated Cyclone Wind Loading of a Melbourne
style Brick Veneer House, Cyclone Testing Station, James Cook University,
Townsville,TR 34.
Reardon, G. F., Walker, G. R. and Jancauskas, E. D. (1986). Effects of Cyclone Winifred on
Buildings TR27, Cyclone Testing Station. James Cook University, Townsville.
Richards, P. J. and Hoxey, R. P. (2008). "Wind loads on the roof of a 6 m cube." Journal of
Wind Engineering and Industrial Aerodynamics 96(6-7): 984-993.
Richardson, G. M. and Blackmore, P. A. (1995). "The silsoe structures building: Comparison of
1 : 100 model-scale data with full-scale data." Journal of Wind Engineering and
Industrial Aerodynamics 57(2-3): 191-201.
Richardson, G. M., Robertson, A. P., Hoxey, R. P. and Surry, D. (1990). "Full-scale and model
investigations of pressures on an industrial/agricultural building." Journal of Wind
Engineering and Industrial Aerodynamics 36(Part 2): 1053-1062.
Richardson, G. M. and Surry, D. (1991). "Comparisons of wind-tunnel and full-scale surface
pressure measurements on low-rise pitched-roof buildings." Journal of Wind
Engineering and Industrial Aerodynamics 38(2-3): 249-256.
Richardson, G. M. and Surry, D. (1992). "The Silsoe Building: a comparison of pressure
coefficients and spectra at model and full-scale." Journal of Wind Engineering and
Industrial Aerodynamics 43(1-3): 1653-1664.
Richardson, G. M. and Surry, D. (1994). "The Silsoe structures building: Comparison between
full-scale and wind-tunnel data." Journal of Wind Engineering and Industrial
Aerodynamics 51(2): 157-176.
Robertson, A. P. (1991). "Effect of eaves detail on wind pressures over an industrial building."
Journal of Wind Engineering and Industrial Aerodynamics 38(2-3): 325-333.
Rosowsky, D. V. and Cheng, N. (1999a). "Reliability of Light-Frame Roofs in High-Wind
Regions. I: Wind Loads." Journal of Structural Engineering 125(7): 725-733.
Rosowsky, D. V. and Cheng, N. (1999b). "Reliability of Light-Frame Roofs in High-Wind
Regions. II: Reliability Analysis." Journal of Structural Engineering 125(7): 734-739.
Rosowsky, D. V. and Ellingwood, B. R. (2002). "Performance-Based Engineering of Wood
Frame Housing: Fragility Analysis Methodology." Journal of Structural Engineering
128(1): 32-38.
Sadek, F. and Simiu, E. (2002). "Peak Non-Gaussian Wind Effects for Database-Assisted Low-
Rise Building Design." Journal of Engineering Mechanics 128(5): 530-539.
Shanmugam, B., Nielson, B. G. and Prevatt, D. O. (2009). "Statistical and analytical models for
roof components in existing light-framed wood structures." Engineering Structures
31(11): 2607-2616.
Sill, B. L., Cook, N. J. and Blackmore, P. A. (1989). "IAWE Aylesbury Comparative
Experiment -- Preliminary results of wind tunnel comparisons." Journal of Wind
Engineering and Industrial Aerodynamics 32(3): 285-302.
Sill, B. L., Cook, N. J. and Fang, C. (1992). "The Aylesbury Comparative Experiment: A final
report." Journal of Wind Engineering and Industrial Aerodynamics 43(1-3): 1553-1564.
Standards Australia. (2006). ―AS 4055 Wind Load for Housing.‖ Standard Australia, Sydney,
NSW.

Page 153 of 202
Standards Australia. (2002). ―AS/NZS 1170.0. Strauctral Design Actions Part 0: General
Principles.‖ Standard Australia, Sydney, NSW.
Standards Australia. (2002). ―AS/NZS 1170.1. Structural Design Actions Part 1:Permanent,
imposed and other actions.‖ Standard Australia, Sydney, NSW.
Standards Australia. (1989). ―AS/NZS 1170.2 . Structural Design Action Part 2:Wind Action.‖
Standard Australia, Sydney, NSW.
Standards Australia. (2011). ―AS/NZS 1170.2 (2011). Structural Design Action Part 2:Wind
Action.‖ Standard Australia, Sydney, NSW.
Stewart, M. G. (2003). "Cyclone damage and temporal changes to building vulnerability and
economic risks for residential construction." Journal of Wind Engineering and
Industrial Aerodynamics 91(5): 671-691.
Stramit (2000). Stramit perlins: Design member moment capacities, Stramit Building Products,
Sydney.
Surry, D. (1991). "Pressure measurements on the Texas tech building: Wind tunnel
measurements and comparisons with full scale." Journal of Wind Engineering and
Industrial Aerodynamics 38(2-3): 235-247.
Tang, L. K. and Melchers, R. E. (1985). "Reliability of Large Structural Systems."
Civ.Eng.Trans CE27(124-129).
Thoft-Christensen, P. and Baker, M. J. (1982). Structural Reliability Theory and Its
Applications, Springer-Verlag, New York.
Tieleman, H. W., Surry, D. and Mehta, K. C. (1996). "Full/model-scale comparison of surface
pressures on the Texas Tech experimental building." Journal of Wind Engineering and
Industrial Aerodynamics 61(1): 1-23.
Unanwa, C. O., McDonald, J. R., Mehta, K. C. and Smith, D. A. (2000). "The development of
wind damage bands for buildings." Journal of Wind Engineering and Industrial
Aerodynamics 84(1): 119-149.
Vickery, B. J. (1986). "Gust-Factors for Internal Pressure in Low rise Buildings." Journal of
Wind Engineering and Industrial Aerodynamics: 259-271.
Vickery, P. J., Kopp, G. A. and Tewisdale, L. A. (2011). Component and cladding wind
pressures on hip and gable roofs: Comparisons to the US wind loading provisions. 13th
International Conference on Wind Engineering, Amsterdam, Netherlands.
Vickery, P. J., Lin, J., Skerlj, P. F., Twisdale, J. L. A. and Huang, K. (2006a). "HAZUS-MH
Hurricane Model Methodology. I: Hurricane Hazard, Terrain, and Wind Load
Modeling." Natural Hazards Review 7(2): 82-93.
Vickery, P. J., Skerlj, P. F., Lin, J., Twisdale, J. L. A., Young, M. A. and Lavelle, F. M.
(2006b). "HAZUS-MH Hurricane Model Methodology. II: Damage and Loss
Estimation." Natural Hazards Review 7(2): 94-103.
Vickery, P. J., Skerlj, P. F., Steckley, A. C. and Twisdale, L. A. (2000). "Hurricane Wind Field
Model for Use in Hurricane Simulations." Journal of Structural Engineering 126(10):
1203-1221.
Walker, G. R. (1975). Report on Cyclone Tracy-Effect on buildings- Dec 1974, Australian Dept
of Housing and Construction
Walker, G. R. (1995). Wind Vulnerability curves for Queensland houses, Alexander Howden
Reinsuarance Brokers (Australia) Ltd.,Sydney.
Walker, G. R. (2010). "A review of the impact of cyclone Tracy on building regulations and
insuarance." Australian Meteorological and oceanographic Journal 60: 199-206.

Page 154 of 202
Walker, G. R. (2011). "Modelling the vulnerability of buildings to wind — a review." Canadian
Journal of Civil Engineering 38(8): 1031-1039.
Wehner, M., Sandland, C., Holmes, J. D., Henderson, D. J. and Edwards, M. (2010 ). Modelling
damage to residential buildings from wind-borne debris-Part 2.Implimentation. 14th
Australasian Wind Engineering Workshop, Geosciences Australia, Canberra.
Wehner, M., Sandland, C., Holmes, J. D., Kim, P., Jayasinghe, N. C. and Edwards, M. (2010b).
Development of a software tool for quantitative assessment of the vulnerability of
Australian residential building stock to severe wind. 14th Australasian Wind
Engineering Workshop, Geosciences Australia, Canberra.
Whalen, M. T., Sadek, F. and Simiu, E. (2002). "Database-assisted design for wind: basic
concepts and software development." Journal of Wind Engineering and Industrial
Aerodynamics 90: 1349-1368.
Xu, Y. L. (1995a). "Determination of Wind-Induced Fatigue Loading on Roof Cladding."
Journal of Engineering Mechanics 121(9): 956-963.
Xu, Y. L. (1995b). "Fatigue Performance of Screw-Fastened Light-Gauge-Steel Roofing
Sheets." Journal of Structural Engineering 121(3): 389-398.
Xu, Y. L. and Reardon, G. F. (1996). Full scale and Model scale Wind Pressure and Fatigue
Loading on the Texas Tech University Building, Cyclone Testing Station, James Ciik
University, Townsville,TR 42.
Xu, Y. L. and Reardon, G. F. (1998). "Variations of wind pressure on hip roofs with roof pitch."
Journal of Wind Engineering and Industrial Aerodynamics 73(3): 267-284.

Page 155 of 202
APPENDIX A
Pressure Distribution-Cladding
Figure A.1: Pressure coefficients vs wind direction - R (cladding)
Figure A.2: Pressure coefficients vs wind direction - S (cladding)
-15
-10
-5
0
0 30 60 90 120 150 180 210 240 270 300 330 360
Cp
θ (deg)
mean max min AS/NZS 1170.2
-15
-10
-5
0
0 30 60 90 120 150 180 210 240 270 300 330 360
Cp
θ (deg)
mean max min AS/NZS 1170.2

Page 156 of 202
Pressure Distribution-Battens
Figure A.3: Pressure coefficients ( ) vs wind direction – Batten to truss connection L2
Figure A.4: Pressure coefficients ( ) vs wind direction – Batten to truss connection L7
-7
-6
-5
-4
-3
-2
-1
0
1
0 30 60 90 120 150 180 210 240 270 300 330 360
Cp
θ(deg)
Min AS/NZS 1170.2 Mean
-7
-6
-5
-4
-3
-2
-1
0
1
0 30 60 90 120 150 180 210 240 270 300 330 360
Cp
θ(deg)
Min AS/NZS 1170.2 Mean

Page 157 of 202
Table A.1: Probabilistic description of wind load for cladding fixing regions
(θ°)
Region P Region Q Region T Region R Region S
Mean COV PDF Mean COV PDF Mean COV PDF Mean COV PDF Mean COV PDF
0 -1.16 -0.11 GM -1.08 -0.25 GEV -0.74 -0.29 GEV -1.18 -0.23 GEV -0.90 -0.12 GEV
15 -2.28 -0.19 GEV -1.00 -0.31 GEV -0.66 -0.24 GEV -1.23 -0.23 GEV -1.12 -0.19 RL
30 -3.68 -0.11 LN -0.87 -0.35 GEV -0.62 -0.22 GEV -1.28 -0.20 GEV -1.21 -0.19 GEV
45 -0.73 -0.10 GEV -0.40 -0.36 GEV -0.33 -0.16 GEV -1.06 -0.23 GEV -1.23 -0.17 GEV
60 -0.74 -0.10 GEV -0.60 -0.27 GEV -0.58 -0.22 WB -1.76 -0.24 GEV -1.10 -0.13 GEV
75 -0.73 -0.09 GEV -0.77 -0.20 GEV -0.91 -0.17 GEV -1.31 -0.29 GEV -0.91 -0.19 GEV
90 -0.74 -0.13 GEV -0.75 -0.18 GEV -0.95 -0.17 GM -1.16 -0.24 GEV -1.23 -0.18 WB
105 -0.78 -0.13 WB -0.71 -0.15 GEV -1.10 -0.15 WB -1.05 -0.18 GEV -1.88 -0.14 GEV
120 -1.01 -0.22 GEV -0.70 -0.22 WB -1.02 -0.04 GM -0.92 -0.18 WB -2.22 -0.07 GEV
135 -1.25 -0.36 GEV -0.62 -0.13 WB -1.07 -0.19 WB -0.80 -0.21 WB -0.64 -0.10 GEV
150 -1.92 -0.31 GEV -1.63 -0.20 LN -1.39 -0.08 GEV -0.99 -0.15 GEV -0.78 -0.17 GEV
165 -1.22 -0.16 GEV -1.14 -0.08 WB -1.08 -0.10 GM -1.02 -0.15 GEV -0.71 -0.12 WB
180 -0.60 -0.21 GEV -1.23 -0.17 LN -0.81 -0.08 GEV -1.04 -0.12 GEV -0.43 -0.15 GEV
195 -0.53 -0.15 GEV -1.20 -0.09 N -1.13 -0.12 N -1.07 -0.16 WB -0.55 -0.23 GEV
210 -0.70 -0.22 GEV -1.01 -0.21 GEV -1.16 -0.16 GEV -1.01 -0.17 WB -0.70 -0.11 WB
225 -0.66 -0.22 GEV -0.92 -0.24 GEV -0.99 -0.17 GEV -0.89 -0.17 GEV -0.69 -0.12 GEV
240 -2.99 -0.18 WB -2.08 -0.27 WB -2.70 -0.08 GM -1.12 -0.19 GM -2.56 -0.08 N
255 -2.11 -0.28 GEV -1.62 -0.25 WB -1.94 -0.12 GEV -1.13 -0.28 WB -2.07 -0.10 GEV
270 -1.15 -0.21 N -1.34 -0.26 WB -1.06 -0.24 WB -1.23 -0.19 GEV -1.43 -0.14 N
285 -1.17 -0.20 GEV -1.71 -0.30 GEV -0.78 -0.14 GEV -1.95 -0.37 GEV -1.08 -0.24 GEV
300 -1.49 -0.19 GEV -2.09 -0.29 GEV -0.90 -0.13 WB -1.99 -0.33 WB -1.18 -0.17 GEV
315 -1.01 -0.13 WB -0.94 -0.24 WB -1.06 -0.17 GEV -1.25 -0.17 GEV -1.25 -0.14 GEV
330 -1.11 -0.16 GEV -1.26 -0.30 GEV -1.15 -0.28 GEV -1.31 -0.19 GEV -1.15 -0.14 GEV
345 -1.15 -0.18 WB -1.24 -0.24 GEV -0.38 -0.20 GEV -1.23 -0.25 GEV -0.94 -0.16 GEV

Page 158 of 202
Figure A.5: Isometric view of the pressure tap locations

Page 159 of 202
APPENDIX B- Test Matrix
Figure B.1: Terminology for load application and load cell locations in the Test set up #1

Page 160 of 202
Table B.1: Test setup #1- Point load on batten-Linear region
Location Scenario
b2,1 Without cladding
b2,2 Without cladding
b2,3 Without cladding
b2,4 Without cladding
b2,5 Without cladding
b2,6 Without cladding
b2,7 Without cladding
b2,8 Without cladding
b2,9 Without cladding
b2,10 Without cladding
b2,11 Without cladding
b2,12 Without cladding
b3,1 Without cladding
b3,2 Without cladding
b3,3 Without cladding
b3,4 Without cladding
b3,5 Without cladding
b3,6 Without cladding
b3,7 Without cladding
b3,8 Without cladding
b3,9 Without cladding
b2,1 Without cladding-only b2,R2 removed
b2,2 Without cladding-only b2,R2 removed
b2,3 Without cladding-only b2,R2 removed
b2,4 Without cladding-only b2,R2 removed
b2,5 Without cladding-only b2,R2 removed
b2,6 Without cladding-only b2,R2 removed
b2,7 Without cladding-only b2,R2 removed
b2,8 Without cladding-only b2,R2 removed
b2,9 Without cladding-only b2,R2 removed
b2,10 Without cladding-only b2,R2 removed
b2,11 Without cladding-only b2,R2 removed
b2,12 Without cladding-only b2,R2 removed
b2,1 Without cladding-only b2,R3 removed
b2,2 Without cladding-only b2,R3 removed
b2,3 Without cladding-only b2,R3 removed
b2,4 Without cladding-only b2,R3 removed
b2,5 Without cladding-only b2,R3 removed
b2,6 Without cladding-only b2,R3 removed
b2,1 With cladding
b2,2 With cladding
b2,3 With cladding
b2,4 With cladding
b2,5 With cladding
b2,6 With cladding
b3,1 With cladding
b3,2 With cladding
b3,3 With cladding
b3,4 With cladding
b3,5 With cladding
b3,6 With cladding

Page 161 of 202
Table B.2: Test setup #1- Point load on cladding-Linear region
Location Scenario
P6,W,4F Undamaged system
P6,W,4N Undamaged system
P6,X,4F Undamaged system
P6,X,4N Undamaged system
P6,Y,4F Undamaged system
P6,Y,4N Undamaged system
P6,W,5F Undamaged system
P6,W,5N Undamaged system
P6,X,5F Undamaged system
P6,X,5N Undamaged system
P6,Y,5F Undamaged system
P6,Y,5N Undamaged system
P6,W,6F Undamaged system
P6,W,6N Undamaged system
P6,X,6F Undamaged system
P6,X,6N Undamaged system
P6,Y,6F Undamaged system
P6,Y,6N Undamaged system
P10,W,7F Undamaged system
P10,W,7N Undamaged system
P10,X,7F Undamaged system
P10,X,7N Undamaged system
P10,Y,7F Undamaged system
P10,Y,7N Undamaged system
P10,W,8F Undamaged system
P10,W,8N Undamaged system
P10,X,8F Undamaged system
P10,X,8N Undamaged system
P10,Y,8F Undamaged system
P10,Y,8N Undamaged system
P10,W,9F Undamaged system
P10,W,9N Undamaged system
P10,X,9F Undamaged system
P10,X,9N Undamaged system
P10,Y,9F Undamaged system
P10,Y,9N Undamaged system
P11,X,7F Undamaged system
P11,X,7N Undamaged system
P11,X,8F Undamaged system
P11,X,8N Undamaged system
P11,X,9F Undamaged system
P11,X,9N Undamaged system

Page 162 of 202
Table B.3: Test setup #1- Point load on cladding-Linear region
Location Scenario
P6,X,4F Fastener at b3,R3 only removed
P6,X,4N Fastener at b3,R3 only removed
P6,X,5F Fastener at b3,R3 only removed
P6,X,5N Fastener at b3,R3 only removed
P6,X,6F Fastener at b3,R3 only removed
P6,X,6F Fastener at b3,R3 only removed
P10,X,7F Fastener at b3,R3 only removed
P10,X,7N Fastener at b3,R3 only removed
P10,X,8F Fastener at b3,R3 only removed
P10,X,8N Fastener at b3,R3 only removed
P10,X,9F Fastener at b3,R3 only removed
P10,X,9N Fastener at b3,R3 only removed
P11,X,7F Fastener at b3,R3 only removed
P11,X,7N Fastener at b3,R3 only removed
P11,X,8F Fastener at b3,R3 only removed
P11,X,8N Fastener at b3,R3 only removed
P11,X,9F Fastener at b3,R3 only removed
P11,X,9N Fastener at b3,R3 only removed
P6,X,4F Fastener at b2,5 only removed
P6,X,4N Fastener at b2,5 only removed
P6,X,5F Fastener at b2,5 only removed
P6,X,5N Fastener at b2,5 only removed
P6,X,6F Fastener at b2,5 only removed
P6,X,6F Fastener at b2,5 only removed
P10,X,7F Fastener at b2,5 only removed
P10,X,7N Fastener at b2,5 only removed
P10,X,8F Fastener at b2,5 only removed
P10,X,8N Fastener at b2,5 only removed
P10,X,9F Fastener at b2,5 only removed
P10,X,9N Fastener at b2,5 only removed
P6,X,4F Fastener at b1,5 only removed
P6,X,4N Fastener at b1,5 only removed
P6,X,5F Fastener at b1,5 only removed
P6,X,5N Fastener at b1,5 only removed
P6,X,6F Fastener at b1,5 only removed
P6,X,6F Fastener at b1,5 only removed
P10,X,7F Fastener at b1,5 only removed
P10,X,7N Fastener at b1,5 only removed
P10,X,8F Fastener at b1,5 only removed
P10,X,8N Fastener at b1,5 only removed
P10,X,9F Fastener at b1,5 only removed
P10,X,9N Fastener at b1,5 only removed

Page 163 of 202
Table B.4: Test setup #1- Point load on cladding
Location Scenario
P1,X,2 Linear region
P1,X,2 Non linear region
P1,W,2 Linear region
P1,W,2 Non linear region
P1,Y,2 Linear region
P1,Y,2 Non linear region
P1,Y,3 Linear region
P1,Y,3 Non linear region
P1,X,3 Linear region
P1,X,3 Non linear region
P1,W,3 Linear region
P1,W,3 Non linear region
P1,X,1 Linear region
P1,X,1 Non linear region
P1,Y,1 Linear region
P1,Y,1 Non linear region
P2,X,2 Linear region
P2,X,2 Non linear region
P2,W,2 Linear region
P2,W,2 Non linear region
P2,Y,3 Linear region
P2,Y,3 Non linear region
P2,X,3 Linear region
P2,X,3 Non linear region
P2,X,1 Linear region
P2,X,1 Non linear region
P2,Y,1 Linear region
P2,Y,1 Non linear region
P3,X,2 Linear region
P3,X,2 Non linear region
P3,X,3 Linear region
P3,X,3 Non linear region
P3,X,1 Linear region
P3,X,1 Non linear region

Page 164 of 202
Table B.5: Test setup #1- Line load on cladding
Location Scenario
P1,W Undamaged system
P5,W Undamaged system
P1,P5,W Undamaged system
P9,P13,W Undamaged system
P1,X Undamaged system
P5,X Undamaged system
P1,P5,X Undamaged system
P9,X Undamaged system
P13,X Undamaged system
P9,P13,X Undamaged system
P1,Y Undamaged system
P5,Y Undamaged system
P1,P5,Y Undamaged system
P9,P13,Y Undamaged system
P2,W Undamaged system
P6,W Undamaged system
P2,P6,W Undamaged system
P10,W Undamaged system
P14,W Undamaged system
P10,P14,W Undamaged system
P2,X Undamaged system
P6,X Undamaged system
P2,P6,X Undamaged system
P10,X Undamaged system
P14,X Undamaged system
P10,P14,X Undamaged system
P2,Y Undamaged system
P6,Y Undamaged system
P2,P6,Y Undamaged system
P10,Y Undamaged system
P10,P14,Y Undamaged system
P3,W Undamaged system
P7,W Undamaged system
P3,P7,W Undamaged system
P11,W Undamaged system
P15,W Undamaged system
P11,P15,W Undamaged system
P3,X Undamaged system
P7,X Undamaged system
P3,P7,X Undamaged system
P11,X Undamaged system
P15,X Undamaged system
P11,P15,X Undamaged system
P3,Y Undamaged system
P7,Y Undamaged system
P3,P7,Y Undamaged system
P11,Y Undamaged system
P15,Y Undamaged system
P11,P15,Y Undamaged system
P5,P9,W Undamaged system
P5,P9,X Undamaged system
P5,P9,Y Undamaged system
P6,P10,W Undamaged system
P6,P10,X Undamaged system
P6,P10,Y Undamaged system
P7,P11,W Undamaged system
P7,P11,X Undamaged system
P7,P11,Y Undamaged system

Page 165 of 202
Table B.6: Test setup #1- Failure of cladding fasteners-non linear region
Location Scenario
P6,X,5 Point load until failure
P1,X,1 Point load until failure
P10,X Line load until failure
P13,X Line load until failure
Table B.7: Test setup #2-Line load
Location Scenario
P1, X Undamaged system
P2, X Undamaged system
P3, X Undamaged system
P4, X Undamaged system
P5, X Undamaged system
P6, X Undamaged system
P7, X Undamaged system
P8, X Undamaged system
P9, X Undamaged system
P1,X B1, R2 Both screws removed
P4,X B1, R2 Both screws removed
P4,X B1, R3 Both screws removed
P7,X B1, R3 Both screws removed
P1,X B2, R2 Both screws removed
P2,X B2, R2 Both screws removed
P4,X B2, R2 Both screws removed
P5,X B2, R2 Both screws removed
P4,X B3, R3 Both screws removed
P5,X B3, R3 Both screws removed
P7,X B3, R3 Both screws removed
P8,X B3, R3 Both screws removed
P1,X B1, R2 Both screws 'E' removed
P4,X B1, R2 Both screws 'E' removed
P4,X B1, R3 Both screws 'E' removed
P7,X B1, R3 Both screws 'E' removed
P1,X B2, R2 Both screws 'E' removed
P2,X B2, R2 Both screws 'E' removed
P4,X B2, R2 Both screws 'E' removed
P5,X B2, R2 Both screws 'E' removed
P4,X B3, R3 Both screws 'E' removed
P5,X B3, R3 Both screws 'E' removed
P7,X B3, R3 Both screws 'E' removed
P8,X B3, R3 Both screws 'E' removed
P1,X B1, R2 Both screws 'I' removed
P4,X B1, R2 Both screws 'I' removed
P4,X B1, R3 Both screws 'I' removed
P7,X B1, R3 Both screws 'I' removed
P1,X B2, R2 Both screws 'I' removed
P2,X B2, R2 Both screws 'I' removed
P4,X B2, R2 Both screws 'I' removed
P5,X B2, R2 Both screws 'I' removed
P4,X B3, R3 Both screws 'I' removed
P5,X B3, R3 Both screws 'I' removed
P7,X B3, R3 Both screws 'I' removed
P8,X B3, R3 Both screws 'I' removed

Page 166 of 202
Table B.8: Test setup #2-line load and point load
Location Scenario
P1,X B1, R2 Both screws loosened
P4,X B1, R2 Both screws loosened
P4,X B1, R3 Both screws loosened
P7,X B1, R3 Both screws loosened
P1,X B2, R2 Both screws loosened
P2,X B2, R2 Both screws loosened
P4,X B2, R2 Both screws loosened
P5,X B2, R2 Both screws loosened
P4,X B3, R3 Both screws loosened
P5,X B3, R3 Both screws loosened
P7,X B3, R3 Both screws loosened
P8,X B3, R3 Both screws loosened
P1,X B1, R2 screw 'E' loosened
P4,X B1, R2 screw 'E' loosened
P4,X B1, R3 screw 'E' loosened
P7,X B1, R3 screw 'E' loosened
P1,X B2, R2 screw 'E' loosened
P2,X B2, R2 screw 'E' loosened
P4,X B2, R2 screw 'E' loosened
P5,X B2, R2 screw 'E' loosened
P4,X B3, R3 screw 'E' loosened
P5,X B3, R3 screw 'E' loosened
P7,X B3, R3 screw 'E' loosened
P8,X B3, R3 screw 'E' loosened
P1,X B1, R2 screw 'I' loosened
P4,X B1, R2 screw 'I' loosened
P4,X B1, R3 screw 'I' loosened
P7,X B1, R3 screw 'I' loosened
P1,X B2, R2 screw 'I' loosened
P2,X B2, R2 screw 'I' loosened
P4,X B2, R2 screw 'I' loosened
P5,X B2, R2 screw 'I' loosened
P4,X B3, R3 screw 'I' loosened
P5,X B3, R3 screw 'I' loosened
P7,X B3, R3 screw 'I' loosened
P8,X B3, R3 screw 'I' loosened
b2, R2 Loading until failure
b3, R3 Loading until failure
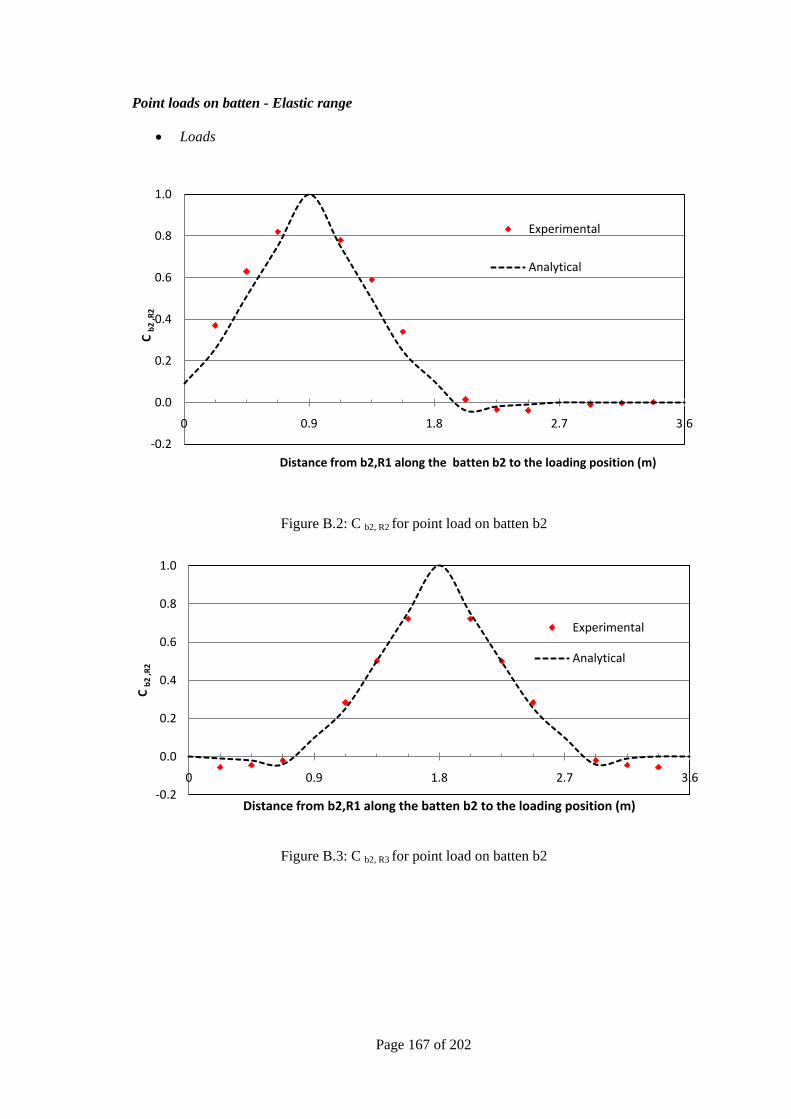
Page 167 of 202
Point loads on batten - Elastic range
Loads
Figure B.2: C b2, R2 for point load on batten b2
Figure B.3: C b2, R3 for point load on batten b2
-0.2
0.0
0.2
0.4
0.6
0.8
1.0
0 0.9 1.8 2.7 3.6
C b
2 ,R
2
Distance from b2,R1 along the batten b2 to the loading position (m)
Experimental
Analytical
-0.2
0.0
0.2
0.4
0.6
0.8
1.0
0 0.9 1.8 2.7 3.6
C b
2 ,R
2
Distance from b2,R1 along the batten b2 to the loading position (m)
Experimental
Analytical
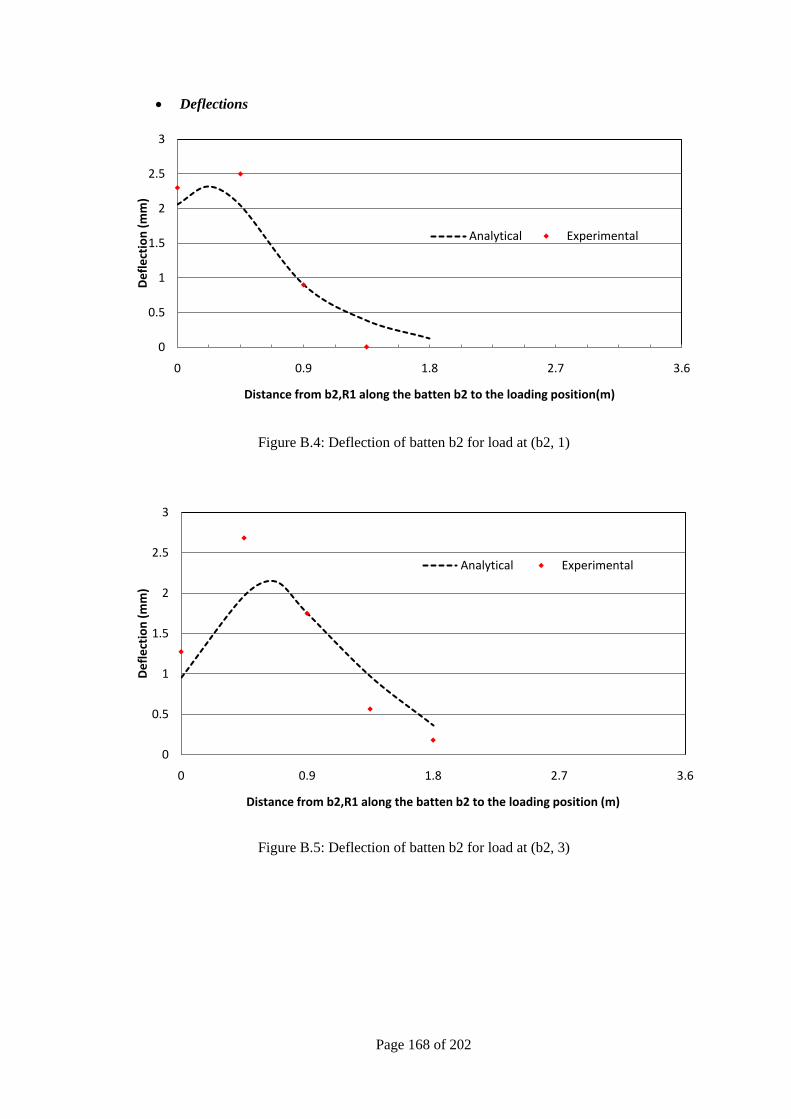
Page 168 of 202
Deflections
Figure B.4: Deflection of batten b2 for load at (b2, 1)
Figure B.5: Deflection of batten b2 for load at (b2, 3)
0
0.5
1
1.5
2
2.5
3
0 0.9 1.8 2.7 3.6
De
fle
ctio
n (
mm
)
Distance from b2,R1 along the batten b2 to the loading position(m)
Analytical Experimental
0
0.5
1
1.5
2
2.5
3
0 0.9 1.8 2.7 3.6
De
fle
ctio
n (
mm
)
Distance from b2,R1 along the batten b2 to the loading position (m)
Analytical Experimental

Page 169 of 202
Figure B.6: Deflection of batten b2 for load at (b2, 4)
Figure B.7: Deflection of batten b2 for load at (b2, 5)
0
0.5
1
1.5
2
2.5
0 0.9 1.8 2.7 3.6
De
fle
ctio
n (
mm
)
Distance from b2,R1 along the batten b2 to the loading position(m)
Analytical Experimental
0
0.5
1
1.5
2
2.5
3
0 0.9 1.8 2.7 3.6
De
fle
ctio
n (
mm
)
Distance from b2,R1 along the batten b2 to the loading position (m)
Analytical Experimental

Page 170 of 202
Figure B.8: Deflection of batten b2 for load at (b2, 6)
Batten failure without cladding
Figure B.9: C b2, R2 for point load on batten b2
0
0.5
1
1.5
2
2.5
3
0 0.9 1.8 2.7 3.6
De
fle
ctio
n (
mm
)
Distance from b2, R1 along the batten b2 to the loading position(m)
Analytical Experimental
-0.20
0.00
0.20
0.40
0.60
0.80
1.00
0 0.9 1.8 2.7 3.6
Cb
2,R
2
Distance from b2,R1 along the batten b2 to the loading position (m)
Intact
Only b2,R3 Removed
Only b2,R2 Removed

Page 171 of 202
Figure B.10: C b2, R3 for point load on batten B2
Figure B.11: C b2, R4 for point load on batten b2
-0.20
0.00
0.20
0.40
0.60
0.80
1.00
0 0.9 1.8 2.7 3.6
Cb
2,R
3
Distance from b2,R1 along the batten b2 to the loading position (m)
Intact
Only b2,R3 Removed
Only b2,R2 Removed
-0.2
0.0
0.2
0.4
0.6
0.8
1.0
0 0.9 1.8 2.7 3.6
Cb
2, R
4
Distance from b2,R1 along the batten b2 to the loading position (m)
Intact
Only b2,R3 Removed
Only b2,R2 Removed

Page 172 of 202
Figure B.12: C b2, R5 for point load on batten b2
Effect of cladding on battens
Figure B.13: The effect of cladding on C b2, R2
-0.2
0.0
0.2
0.4
0.6
0.8
1.0
0 0.9 1.8 2.7 3.6
Cb
2, R
5
Distance from b2,R1 along the batten b2 to the loading position (m)
Intact
only b2,R3 Removed
Only b2,R2 Removed
-0.20
0.00
0.20
0.40
0.60
0.80
1.00
0 0.9 1.8 2.7 3.6
Cb
2,R
2
Distance from b2,R1 along the batten b2 to the loading position(m)
With Cladding
Without cladding

Page 173 of 202
Figure B.14: The effect of cladding on C b2, R3
Load on cladding
Figure B.15: Cb2, R3 point load on W, X, Y
-0.20
0.00
0.20
0.40
0.60
0.80
1.00
0 0.9 1.8 2.7 3.6
Cb
2,R
3
Distance from b2,R1 along the batten b2 to the loading position (m)
With Cladding
Without cladding
-0.2
0
0.2
0.4
0.6
0.8
0 0.9 1.8 2.7 3.6
Cb
2, R
3
Distance from truss element R1 to the loading position (m)
P6, P10, W
P6, P10, X
P6, P10, Y
P6, P10, Y(Analytical)P11, X
P11, X(Analytical)P6, P10, W (Analytical)P6, P10, X(Analytical)

Page 174 of 202
Figure B.16: Cb2, R4 point load on W, X, Y
Figure B.17: Cb3, R2 point load on W, X, Y
-0.2
0
0.2
0.4
0.6
0.8
0 0.9 1.8 2.7 3.6
Cb
2, R
4
Distance from truss element R1 to the loading position (m)
P6, P10, W
P6, P10, X
P6, P10, Y
P11, X
P6, P10, W (Analytical)
P6, P10, X(Analytical)
P6, P10, Y(Analytical)
P11, X(Analytical)
-0.2
0
0.2
0.4
0.6
0.8
0 0.9 1.8 2.7 3.6
Cb
3, R
2
Distance from truss element R1 to the loading position (m)
P6, P10, W
P6, P10, X
P6, P10, Y
P11, X
P6, P10, W (Analytical)
P6, P10, X(Analytical)
P6, P10, Y(Analytical)
P11, X(Analytical)

Page 175 of 202
Figure B.18: Cb3, R3 point load on W, X, Y
Figure B.19: Cb3, R4 point load on W, X, Y
0
0.2
0.4
0.6
0.8
0 0.9 1.8 2.7 3.6
Cb
3, R
3
Distance from truss element R1 to the loading position (m)
P6, P10, W (Analytical)
P6, P10, X(Analytical)
P6, P10, Y(Analytical)
P11, X(Analytical)
P6, P10, W
P6, P10, X
P6, P10, Y
P11, X
-0.2
0
0.2
0.4
0.6
0.8
0 0.9 1.8 2.7 3.6
Cb
3, R
4
Distance from truss element R1 to the loading position (m)
P6, P10, W
P6, P10, X
P6, P10, Y
P11, X
P11, X(analytical)
P6, P10, W (analytical)
P6, P10, X(analytical)
P6, P10, Y(analytical)
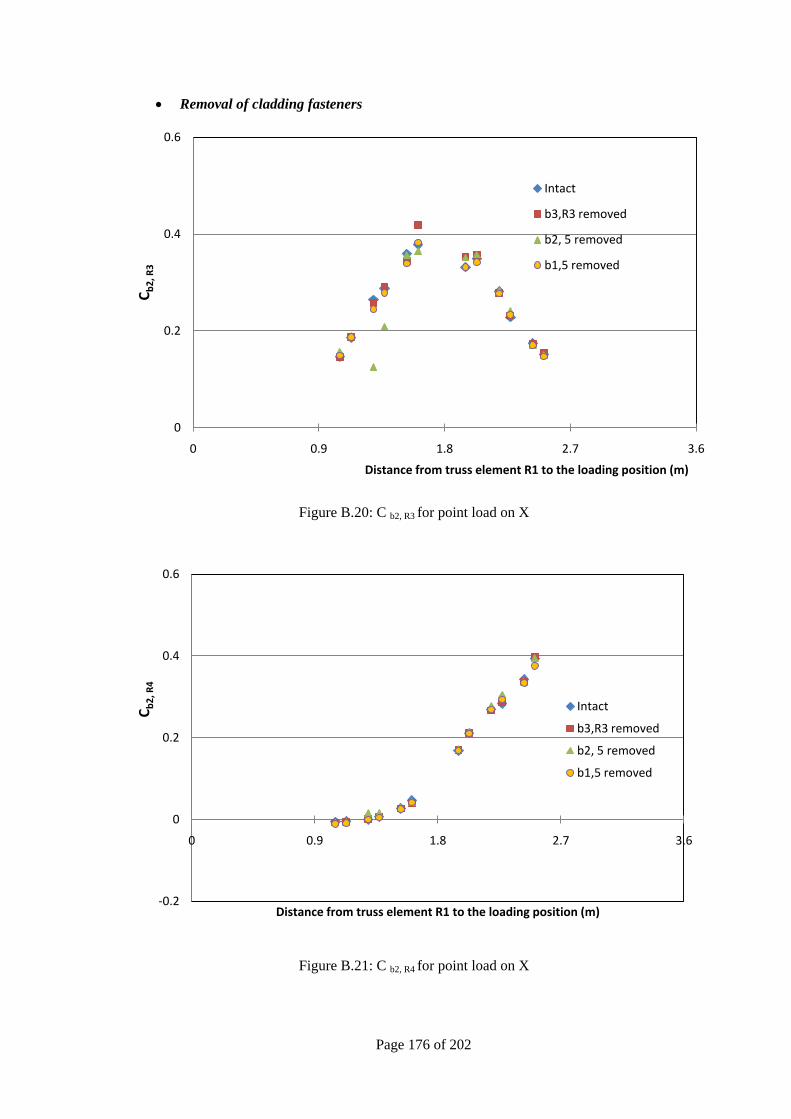
Page 176 of 202
Removal of cladding fasteners
Figure B.20: C b2, R3 for point load on X
Figure B.21: C b2, R4 for point load on X
0
0.2
0.4
0.6
0 0.9 1.8 2.7 3.6
Cb
2, R
3
Distance from truss element R1 to the loading position (m)
Intact
b3,R3 removed
b2, 5 removed
b1,5 removed
-0.2
0
0.2
0.4
0.6
0 0.9 1.8 2.7 3.6
Cb
2, R
4
Distance from truss element R1 to the loading position (m)
Intact
b3,R3 removed
b2, 5 removed
b1,5 removed

Page 177 of 202
Figure B.22: C b3, R2 for point load on X
Figure B.23: C b3, R3 for point load on X
-0.2
0
0.2
0.4
0.6
0 0.9 1.8 2.7 3.6
Cb
3, R
2
Distance from truss element R1 to the loading position (m)
Intact
b3,R3 removed
b2, 5 removed
b1,5 removed
-0.2
0
0.2
0.4
0.6
0 0.9 1.8 2.7 3.6
Cb
3, R
3
Distance from truss element R1 to the loading position (m)
Intact
b3,R3 removed
b2, 5 removed
b1,5 removed

Page 178 of 202
Figure B.24: C b3, R4 for point load on X
-0.2
0
0.2
0.4
0.6
0 0.9 1.8 2.7 3.6
Cb
3, R
4
Distance from truss element R1 to the loading position (m)
Intact
b3,R3 removed
b2, 5 removed
b1,5 removed

Page 179 of 202
Table B.9: Variation of reaction coefficient for unit load application at adjacent panels
simultaneously
Location Condition
Reaction coefficients Cb1,
R1
Cb1,
R2
Cb1,
R3
Cb2,
R1
Cb2,
R2
Cb2,
R3
Cb3,
R1
Cb3,
R2
Cb3,
R3
b1,R2
No failure 0.09 0.25 0.11 0.13 0.39 0.16 -0.02 -0.07 -0.03
Both screw
removed 0.18 0.00 0.29 0.15 0.39 0.20 -0.02 -0.11 -0.02
Screw 'E'
removed 0.10 0.19 0.16 0.13 0.39 0.17 -0.02 -0.08 -0.03
Screw 'I'
removed 0.11 0.18 0.15 0.14 0.38 0.17 -0.02 -0.08 -0.03
Both screws
loosened 0.12 0.18 0.17 0.14 0.38 0.17 -0.02 -0.08 -0.02
screw 'E'
loosened 0.11 0.21 0.15 0.14 0.37 0.17 -0.02 -0.08 -0.02
screw 'I'
loosened 0.11 0.20 0.14 0.14 0.38 0.17 -0.02 -0.08 -0.03
b2,R2
No failure 0.04 0.12 0.05 0.13 0.34 0.15 0.05 0.11 0.06
Both screw
removed 0.05 0.14 0.07 0.21 0.00 0.30 0.06 0.25 0.02
Screw 'I'
removed 0.04 0.13 0.04 0.15 0.25 0.18 0.06 0.15 0.05
Screw 'E'
removed 0.04 0.13 0.04 0.15 0.25 0.18 0.05 0.16 0.05
Both screws
loosened 0.04 0.13 0.04 0.17 0.19 0.22 0.06 0.18 0.04
screw 'E'
loosened 0.04 0.13 0.04 0.15 0.28 0.18 0.06 0.14 0.05
screw 'I'
loosened 0.04 0.12 0.03 0.15 0.28 0.17 0.05 0.14 0.05

Page 180 of 202
Table B.10: Reaction coefficients for removing screw ‗E‘ of selected connections
Conne
ction
Locati
on
Reaction coefficients
Cb1, R1 Cb1, R2 Cb1, R3 Cb2, R1 Cb2, R2 Cb2, R3 Cb3, R1 Cb3, R2 Cb3, R3
b1,R3 P4,X -0.02 0.26 0.21 -0.03 0.35 0.35 0.01 -0.05 -0.08
P7,X 0.00 -0.01 0.22 0.00 -0.03 0.37 -0.01 0.02 -0.07
b2,R2 P1,X 0.21 0.27 -0.02 0.33 0.29 0.01 -0.05 -0.04 0.01
P2,X -0.03 0.01 -0.01 0.29 0.21 0.03 0.28 0.32 -0.01
P4,X -0.02 0.26 0.20 -0.01 0.27 0.40 0.01 -0.02 -0.08
P5,X 0.00 -0.01 0.00 0.00 0.22 0.29 -0.01 0.33 0.26
Table B.11: Reaction coefficients for loosening screw ‗E‘ on selected connections
Connection Location
Reaction coefficients
Cb1,
R1
Cb1,
R2
Cb1,
R3
Cb2,
R1
Cb2,
R2
Cb2,
R3
Cb3,
R1
Cb3,
R2
Cb3,
R3
b1,R2 P1,X 0.22 0.22 0.01 0.29 0.39 -0.03 -0.04 -0.09 0.02
P4,X 0.00 0.19 0.28 -0.02 0.34 0.36 0.01 -0.07 -0.06
b1,R3 P4,X -0.02 0.26 0.21 -0.03 0.35 0.35 0.01 -0.06 -0.07
b2,R2 P1,X 0.19 0.25 -0.02 0.32 0.34 0.00 -0.04 -0.05 0.01
P2,X -0.03 0.00 -0.01 0.28 0.22 0.03 0.26 0.32 -0.01
P4,X -0.02 0.26 0.18 -0.01 0.31 0.39 0.01 -0.03 -0.08
P5,X 0.00
-
0.01 -0.01 0.00 0.23 0.28 -0.01 0.32 0.26
b2,R3 P4,X -0.03 0.26 0.18 -0.03 0.39 0.31 0.01 -0.06 -0.05
P5,X -0.01
-
0.01 -0.01 -0.02 0.30 0.23 -0.01 0.29 0.28

Page 181 of 202
Table B.12: Reaction coefficients for loosening screw ‗I‘ on selected connections
Connection Location
Reaction coefficients
Cb1,
R1
Cb1,
R2
Cb1,
R3
Cb2,
R1
Cb2,
R2
Cb2,
R3
Cb3,
R1
Cb3,
R2
Cb3,
R3
b1,R2 P1,X 0.22 0.19 0.01 0.30 0.41 -0.03 -0.04 -0.09 0.02
P4,X 0.00 0.20 0.27 -0.02 0.35 0.36 0.01 -0.06 -0.07
b1,R3 P4,X -0.02 0.25 0.19 -0.03 0.36 0.37 0.01 -0.05 -0.07
P7,X 0.00 -0.01 0.21 0.00 -0.03 0.36 0.00 0.02 -0.06
b2,R2 P1,X 0.19 0.25 -0.02 0.32 0.34 0.00 -0.04 -0.05 0.01
P2,X -0.03 0.00 -0.02 0.28 0.24 0.02 0.26 0.32 -0.01
P4,X -0.02 0.25 0.18 -0.02 0.31 0.37 0.01 -0.03 -0.07
P5,X 0.00 -0.01 -0.01 0.00 0.24 0.27 -0.01 0.33 0.26
Figure B.25: Variation of the deflection with the applied load at (b3, R3)
0.00
5.00
10.00
15.00
20.00
25.00
0 2 4 6 8 10 12
De
fle
ctio
n (
mm
)
Applied load(kN)
b3,2
b3,R3
b3,3

Page 182 of 202
Table B.13: The deflections for both Screws removed case
Connection Location
Applied
load(kN)
Deflections(mm)
Connection P1,X,1 P2,X,1 P4,X,2 P5,X,2 P7,X,3 P8,X,3 b1,1 b1,2 b1,3 b2,1 b2,2 b2,3 b3,1 b3,2 b3,3
b1,R2 P1,X 3.25 5.50 17.97 9.38 4.78
P4,X 3.96 8.26 2.72 18.53 6.39 5.26
b1,R3 P4,X 4.05 7.87 19.73 7.25 5.34
P7,X 3.97 8.17 1.92 23.22 4.93 0.45
b2,R2 P1,X 3.39 13.43 20.72 2.84 2.86 11.92
P2,X 3.91 13.20 20.76 3.99 12.99 7.30
P4,X 3.98 11.99 3.84 22.20 4.26 11.93
P5,X 3.83 7.94 8.45 25.92 7.53 3.86
b3,R3 P4,X 3.98 11.03 -0.60 23.12 0.00 11.50
P7,X 4.03 12.69 4.53 27.01 3.72 12.11
P8,X 4.05 14.04 4.82 24.98 13.71 8.00

Page 183 of 202
Table B.14: The deflections for screw ‗E‘ removed case
Connection Location
Applied
load(kN)
Deflections(mm)
Connection P1,X,1 P2,X,1 P4,X,2 P5,X,2 P7,X,3 P8,X,3 b1,1 b1,2 b1,3 b2,1 b2,2 b2,3 b3,1 b3,2 b3,3
b1,R2 P1,X 4.11 0.48 15.05 0.20 3.19 4.38
P4,X 3.88 2.91 0.00 16.75 0.66 5.15
b1,R3 P4,X 4.00 2.64 18.50 0.12 3.66 5.10
P7,X 4.07 3.73 -0.09 22.40 0.27 0.36
b2,R2 P1,X 3.50 5.41 17.16 0.21 2.42 6.15
P2,X 4.03 7.22 20.70 1.87 9.29 7.72
P4,X 4.15 4.49 1.02 20.56 4.03 7.08
P5,X 4.14 6.66 1.29 20.89 9.70 8.02
b2,R3 P4,X 4.50 4.39 21.60 1.38 3.47 7.39
P5,X 4.47 6.39 2.21 21.67 9.65 8.30
P7,X 3.94 5.33 1.17 23.32 3.17 7.48
P8,X 4.22 8.30 1.86 22.06 10.65 8.15

Page 184 of 202
Table B.15: The deflections for Inner screw ‗I‘ removed case
Connection Location
Applied
load(kN)
Deflections(mm)
Connection P1,X,1 P2,X,1 P4,X,2 P5,X,2 P7,X,3 P8,X,3 b1,1 b1,2 b1,3 b2,1 b2,2 b2,3 b3,1 b3,2 b3,3
b1,R2 P1,X 3.31 1.36 16.60 0.14 3.34 4.58
P4,X 4.07 3.51 0.80 18.60 1.70 4.97
b1,R3 P4,X 4.01 1.94 17.94 0.04 3.25 5.31
P7,X 3.93 1.54 0.06 20.64 0.64 0.12
b2,R2 P1,X 3.43 5.50 17.84 0.01 2.40 6.08
P2,X 3.92 7.72 20.37 2.73 9.22 7.52
P4,X 4.16 4.70 20.31 3.20 7.43
P5,X 4.11 6.04 2.90 20.40 9.55 7.91
b2,R3 P4,X 4.00 4.42 19.41 1.26 3.68 6.82
P5,X 4.00 6.26 20.57 2.75 9.69 7.74
P7,X 4.04 5.59 1.78 23.70 3.46 7.86
P8,X 4.13 8.55 2.68 22.37 10.72 8.00

Page 185 of 202
Table B.16: The deflections for both screws half loosened case
Connection Location
Applied
load(kN)
Deflections(mm)
Connection P1,X,1 P2,X,1 P4,X,2 P5,X,2 P7,X,3 b1,1 b1,2 b2,1 b2,2 b3,1 b3,2
b1,R2 P1,X 3.83 3.57 19.32 0.68 4.75 5.24
P4,X 4.00 4.60 0.50 18.59 4.48 4.74
b1,R3 P4,X 4.22 3.28 -0.12 19.84 4.75 4.94
P7,X 4.24 4.23 0.55 26.14 1.77 0.29
b2,R2 P1,X 3.19 7.07 17.23 7.48
P2,X 4.03 8.84 20.95 10.05 7.32
P4,X 4.06 6.31 20.17 2.93 8.61
P5,X 4.08 8.12 20.19 10.20 7.63
b2,R3 P4,X 4.16 9.23 16.83 3.00 8.12 10.78
P5,X 4.06 7.95 20.19 10.58 7.70

Page 186 of 202
Table B.17: The deflections for screw ―E‖ loosened case
Connection Location
Applied
load(kN)
Deflections(mm)
Connection P1,X,1 P2,X,1 P4,X,2 P5,X,2 P7,X,3 P8,X,3 b1,1 b1,2 b2,1 b2,2 b3,1 b3,2
b1,R2 P1,X 4.11 3.82 20.45 0.48 4.45 5.60
P4,X 4.07 4.64 0.21 18.46 3.65 4.80
b1,R3 P4,X 4.06 2.23 -0.01 19.67 3.51 5.00
P7,X
b2,R2 P1,X 3.44 5.81 17.37 6.33
P2,X 4.06 8.50 21.21 9.04 7.34
P4,X 4.19 4.01 19.69 2.88 6.60
P5,X 4.48 6.91 21.56 9.90 8.34
b2,R3 P4,X 4.24 4.10 19.99 0.80 3.22 6.35
P5,X 4.14 6.69 20.81 2.07 9.29 7.99
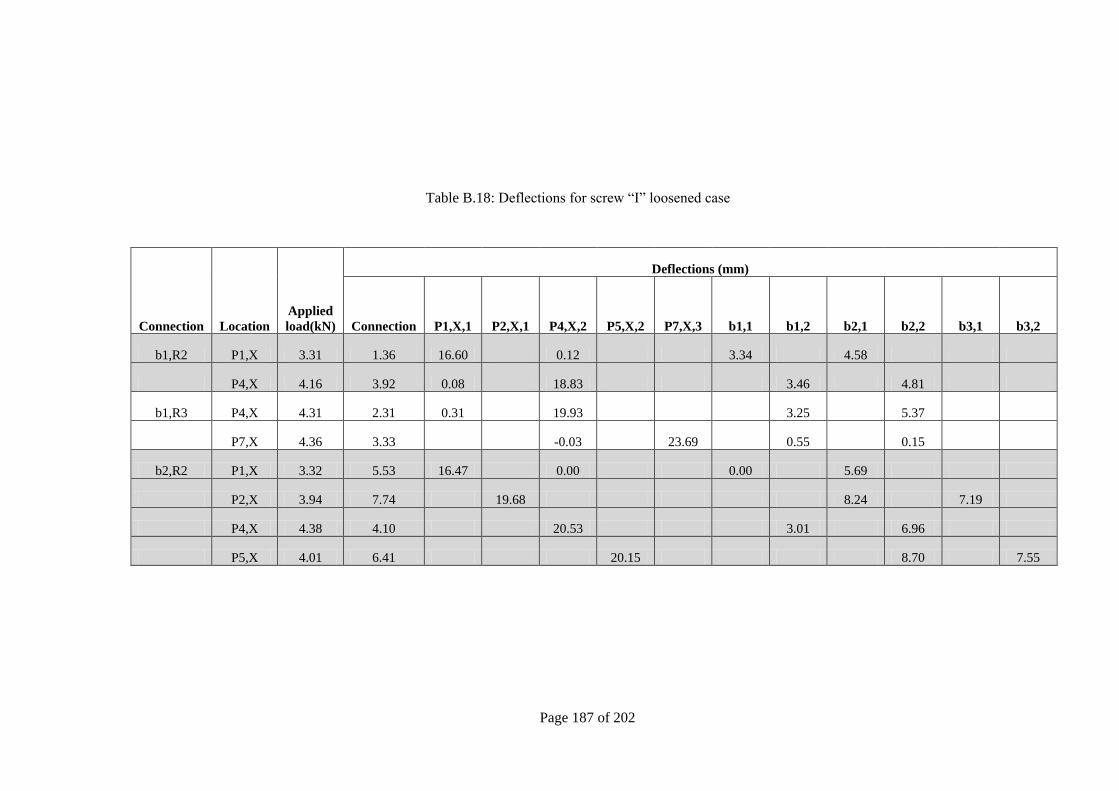
Page 187 of 202
Table B.18: Deflections for screw ―I‖ loosened case
Connection Location
Applied
load(kN)
Deflections (mm)
Connection P1,X,1 P2,X,1 P4,X,2 P5,X,2 P7,X,3 b1,1 b1,2 b2,1 b2,2 b3,1 b3,2
b1,R2 P1,X 3.31 1.36 16.60 0.12 3.34 4.58
P4,X 4.16 3.92 0.08 18.83 3.46 4.81
b1,R3 P4,X 4.31 2.31 0.31 19.93 3.25 5.37
P7,X 4.36 3.33 -0.03 23.69 0.55 0.15
b2,R2 P1,X 3.32 5.53 16.47 0.00 0.00 5.69
P2,X 3.94 7.74 19.68 8.24 7.19
P4,X 4.38 4.10 20.53 3.01 6.96
P5,X 4.01 6.41 20.15 8.70 7.55

Page 188 of 202
APPENDIX C
Figure C.1: Tributary area for connection B8-Proposed method
Figure C.2: Tributary area for connection B6-Proposed method

Page 189 of 202
Table C.1: for θ =0°- Undamaged roof
Connection
Number
Values
Truss
A
Truss
B
Truss
C
5 -0.73 -1.02 -0.85
6 -0.74 -1.04 -0.89
7 -0.72 -1.27 -1.06
8 -0.43 -0.87 -0.83
Table C.2: for θ =15°- Undamaged roof
Connection
Number
Values
Truss
A
Truss
B
Truss
C
5 -0.82 -0.93 -0.77
6 -0.95 -1.12 -0.83
7 -1.07 -1.69 -1.11
8 -0.76 -1.25 -1.01
Table C.3: for θ =30°- Undamaged roof
Connection
Number
Values
Truss
A
Truss
B
Truss
C
5 -1.29 -1.82 -0.92
6 -1.40 -2.13 -1.15
7 -1.57 -2.91 -1.63
8 -1.23 -2.11 -1.55
Table C.4: for θ =45°- Undamaged roof
Connection
Number
Values
Truss
A
Truss
B
Truss
C
5 -1.74 -3.10 -1.75
6 -1.75 -3.13 -2.22
7 -1.80 -3.48 -2.59
8 -1.31 -2.34 -1.93
Table C.5: for θ =60°- Undamaged roof
Connection
Number
Values
Truss
A
Truss
B
Truss
C
5 -2.05 -3.60 -3.09
6 -2.13 -3.41 -2.98
7 -2.22 -3.89 -3.09
8 -1.41 -2.49 -1.99
Table C.6: for θ =75°- Undamaged roof
Connection
Number
Values
Truss
A
Truss
B
Truss
C
5 -2.08 -3.52 -3.18
6 -2.15 -3.43 -3.05
7 -2.03 -3.93 -3.22
8 -1.24 -2.49 -2.04

Page 190 of 202
Table C.7: for θ =105°- Undamaged
roof
Connection
Number
Values
Truss
A
Truss
B
Trus
s C
5 -1.90 -3.40 -3.01
6 -1.90 -3.45 -3.02
7 -1.98 -4.09 -3.26
8 -1.40 -2.77 -2.45
Table C.8: for θ =120°- Undamaged
roof
Connection
Number
Values
Truss
A
Truss
B
Truss
C
5 -1.99 -3.33 -2.88
6 -2.21 -3.64 -2.92
7 -2.77 -4.52 -3.46
8 -2.03 -3.73 -3.05
Table C.9: for θ =135°- Undamaged
roof
Connection
Number
Values
Truss
A
Truss
B
Truss
C
5 -2.06 -3.52 -2.90
6 -2.74 -3.99 -2.92
7 -3.37 -4.91 -4.41
8 -2.39 -4.45 -3.82
Table C.10: for θ =165°- Undamaged
roof
Connection
Number
Values
Truss
A
Truss
B
Truss
C
5 -1.51 -2.54 -2.32
6 -1.84 -2.95 -2.77
7 -2.19 -3.74 -3.19
8 -1.43 -2.66 -2.23
Table C.11: for θ =180°- Undamaged
roof
Connection
Number
Values
Truss
A
Truss
B
Truss
C
5 -0.93 -1.74 -1.75
6 -1.01 -1.84 -1.77
7 -1.02 -2.17 -1.92
8 -0.67 -1.41 -1.25
Table C.12: for θ =195°- Undamaged
roof
Connection
Number
Values
Truss
A
Truss
B
Truss
C
5 -0.55 -1.06 -0.98
6 -0.53 -1.04 -1.02
7 -0.51 -1.08 -0.99
8 -0.31 -0.71 -0.65

Page 191 of 202
Table C.13: for θ =210°- Undamaged
roof
Connection
Number
Values
Truss
A
Truss
B
Truss
C
5 -0.58 -1.11 -1.13
6 -0.56 -1.03 -1.17
7 -0.54 -1.26 -1.26
8 -0.35 -0.89 -0.80
Table C.14: for θ =225°- Undamaged
roof
Connection
Number
Values
Truss
A
Truss
B
Truss
C
5 -0.49 -0.95 -1.04
6 -0.51 -1.08 -1.16
7 -0.44 -1.29 -1.22
8 -0.34 -0.88 -0.77
Table C.15: for θ =240°- Undamaged
roof
Connection
Number
Values
Truss
A
Truss
B
Truss
C
5 -0.38 -0.77 -0.84
6 -0.39 -0.76 -0.80
7 -0.36 -0.86 -0.86
8 -0.25 -0.60 -0.60
Table C.16: for θ =255°- Undamaged
roof
Connection
Number
Values
Truss
A
Truss
B
Truss
C
5 -0.26 -0.55 -0.60
6 -0.26 -0.53 -0.58
7 -0.27 -0.63 -0.66
8 -0.18 -0.46 -0.52
Table C.17: for θ =270°- Undamaged
roof
Connection
Number
Values
Truss
A
Truss
B
Truss
C
5 -0.21 -0.42 -0.44
6 -0.21 -0.39 -0.41
7 -0.21 -0.47 -0.48
8 -0.13 -0.34 -0.37
Table C.18: for θ =285°- Undamaged
roof
Connection
Number
Values
Truss
A
Truss
B
Truss
C
5 -0.20 -0.37 -0.39
6 -0.21 -0.39 -0.36
7 -0.21 -0.43 -0.39
8 -0.14 -0.29 -0.29

Page 192 of 202
Table C.19: for θ =300°- Undamaged
roof
Connection
Number
Values
Truss
A
Truss
B
Truss
C
5 -0.24 -0.44 -0.40
6 -0.23 -0.43 -0.43
7 -0.24 -0.52 -0.49
8 -0.15 -0.35 -0.37
Table C.20: for θ =315°- Undamaged
roof
Connection
Number
Values
Truss
A
Truss
B
Truss
C
5 -0.24 -0.44 -0.46
6 -0.25 -0.47 -0.48
7 -0.27 -0.60 -0.55
8 -0.17 -0.43 -0.42
Table C.21: for θ =330°- Undamaged
roof
Connection
Number
Values
Truss
A
Truss
B
Truss
C
5 -0.24 -0.43 -0.42
6 -0.24 -0.43 -0.44
7 -0.26 -0.54 -0.53
8 -0.17 -0.40 -0.42
Table C.22: for θ =345°- Undamaged
roof
Connection
Number
Values
Truss
A
Truss
B
Truss
C
5 -0.31 -0.48 -0.47
6 -0.32 -0.49 -0.49
7 -0.30 -0.58 -0.55
8 -0.19 -0.41 -0.42

Page 193 of 202
Internal pressure coefficient - +0.2
Figure C.3: Vulnerability of batten connections for θ=150° in TC 2.5
-with load distribution method
Figure C.4: Vulnerability of batten truss connections for θ=150° in TC 2.5-Conventional
method #1
0.00
0.10
0.20
0.30
0.40
0.50
0.60
0.70
40 50 60 70 80 90
Pro
bab
ility
of
failu
re
Wind speed (m/s)
B7
B6
B8
A7
C7
0.00
0.10
0.20
0.30
0.40
0.50
0.60
0.70
40 50 60 70 80 90
Pro
bab
ility
of
failu
re
Wind speed (m/s)
B8
B7
B6
A7
C7

Page 194 of 202
Internal pressure coefficient - +0.4
Figure C.5: Vulnerability of batten connections for θ=150° in TC 2.5-with load distribution
method
Figure C.6: Vulnerability of batten truss connections for θ=150° in TC 2.5-Conventional
method #1
0.00
0.10
0.20
0.30
0.40
0.50
0.60
0.70
40 50 60 70 80 90
Pro
bab
ility
of
failu
re
Wind speed (m/s)
B7
B6
B8
A7
C7
0.00
0.10
0.20
0.30
0.40
0.50
0.60
0.70
40 50 60 70 80 90
Pro
bab
ility
of
failu
re
Wind speed (m/s)
B8
B7
B6
A7
C7

Page 195 of 202
No internal pressure
Figure C.7: Probability of failure vs Basic Wind speed- Cladding connections for house in TC
2.5
Figure C.8: Probability of failure vs Basic Wind speed-Truss to wall connections for house in
TC 2.5
-0.10
0.00
0.10
0.20
0.30
0.40
0.50
0.60
0.70
35
37
.5 40
42
.5 45
47
.5 50
52
.5 55
57
.5 60
62
.5 65
67
.5 70
72
.5 75
77
.5 80
82
.5 85
87
.5
Pro
bab
ility
of
failu
re
Wind speed (m/s)
P(θ=150°)
Q(θ=75°)
R(θ=330°)
S(θ=150°)
T(θ=150°)
-0.10
0.00
0.10
0.20
0.30
0.40
0.50
0.60
0.70
40
42
.5 45
47
.5 50
52
.5 55
57
.5 60
62
.5 65
67
.5 70
72
.5 75
77
.5 80
82
.5 85
87
.5
Pro
bab
ility
of
failu
re
Wind speed (m/s)
B(θ=90°)
F(θ=30°)
L(θ=45°)

Page 196 of 202
APPENDIX D- Vulnerability and Adaptation to Wind Simulation (VAWS)
Geosciences Australia in collaboration with Cyclone Testing Station and JDH Consulting has
produced an alpha version of software (VAWS) to estimate the vulnerability of a range of house
types. The author of this thesis was also involved in this project to provide engineering inputs.
VAWS assesses the vulnerability of buildings by using reliability theory incorporating Monte
Carlo Simulation. This section demonstrates the application of data obtained in this study to
VAWS for obtaining an overall vulnerability curve for a masonry block house.
The details of the roof of a masonry block house were input to VAWS, as this research focuses
only on roof damage. As described in Chapter 3, the roof has dimensions 10m x 19.8m with
roof pitch and overhang 22.5° and 0.6m respectively. The batten spacing was taken as 650mm
and 877mm in the roof eve and other areas respectively and the truss spacing was taken as
900mm. Figure D.1 shows the truss and batten layout of the structure having 23 trusses
identified as A to W and 16 battens. Each truss tributary area was divided in to 16 panels
according to batten-truss connection tributary area. These Panels were identified as A1 to A16,
B1 to B16, ..... W1 to W16 to represent the roof.
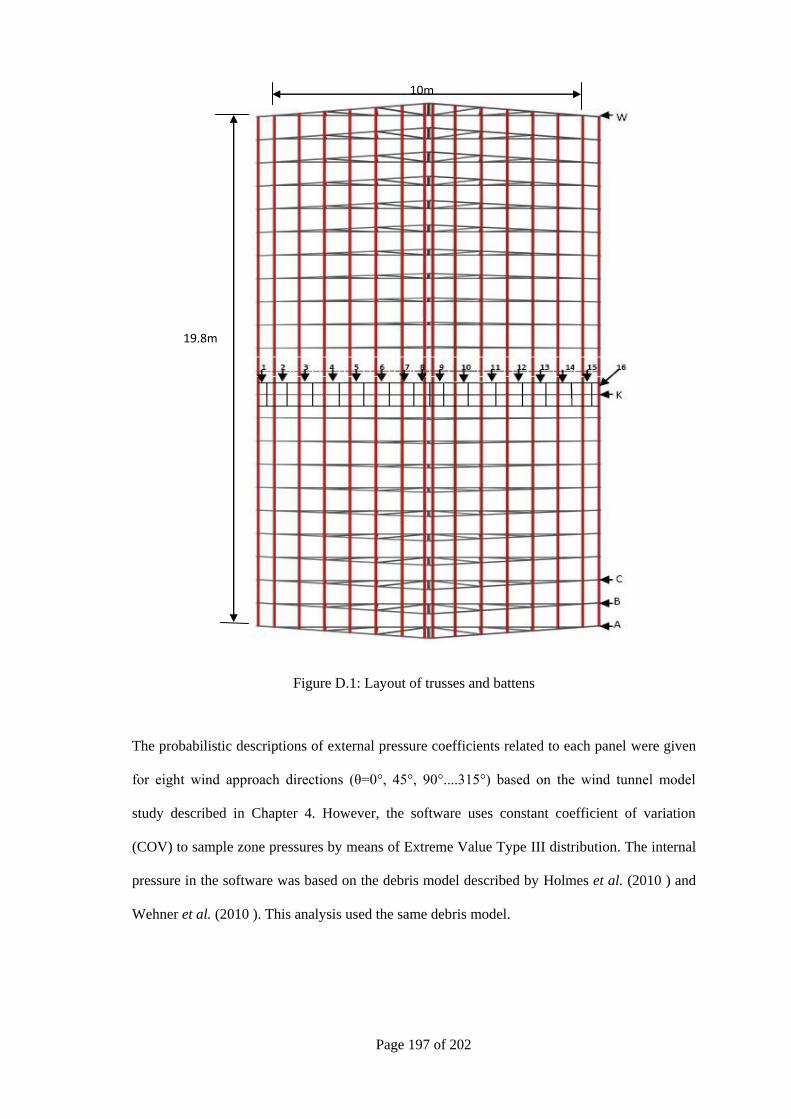
Page 197 of 202
Figure D.1: Layout of trusses and battens
The probabilistic descriptions of external pressure coefficients related to each panel were given
for eight wind approach directions (θ=0°, 45°, 90°....315°) based on the wind tunnel model
study described in Chapter 4. However, the software uses constant coefficient of variation
(COV) to sample zone pressures by means of Extreme Value Type III distribution. The internal
pressure in the software was based on the debris model described by Holmes et al. (2010 ) and
Wehner et al. (2010 ). This analysis used the same debris model.
10m
19.8m

Page 198 of 202
The strength data related to each patch was input for the three connection types in terms of
means and COVs. The number of cladding fasteners in each patch was obtained according to
the survey data and the strength data was given accordingly. The software randomly generates
strength data of the connections. As described in previous chapters, the progressive failure with
increasing wind speed depends on the load-sharing and structural inter-dependency and
strengths of the components. For example, the failure of one of the connections in a house can
prevent the occurrence of a dependent connection failing or alternatively accelerate another
failure mode. These effects have been incorporated in VAWS based on test data, damage
investigation reports and expert opinions.
Structural/ component response
The response of components and connections that contribute to the specified failures with
increasing wind speed, were considered in terms of reaction coefficients (i.e. linear region) for
load effects of interest, x by Equation D.1.
Eq.(D.1)
where,
x – Load effect at each wind speed step
i – Patch identifier
N-Total number of Patches influencing the load effect of interest
pi – pressure on patch i
Ai – Tributary area of patch i
Pi – Load on patch i
βi – Reaction coefficient (i.e. Value of load effect due to unit load applied on Patch i )
The load effects cases considered were:
1. Force on roof cladding fastener
2. Force on batten-truss connection
i
N
i
iii
N
i
i PApx
11
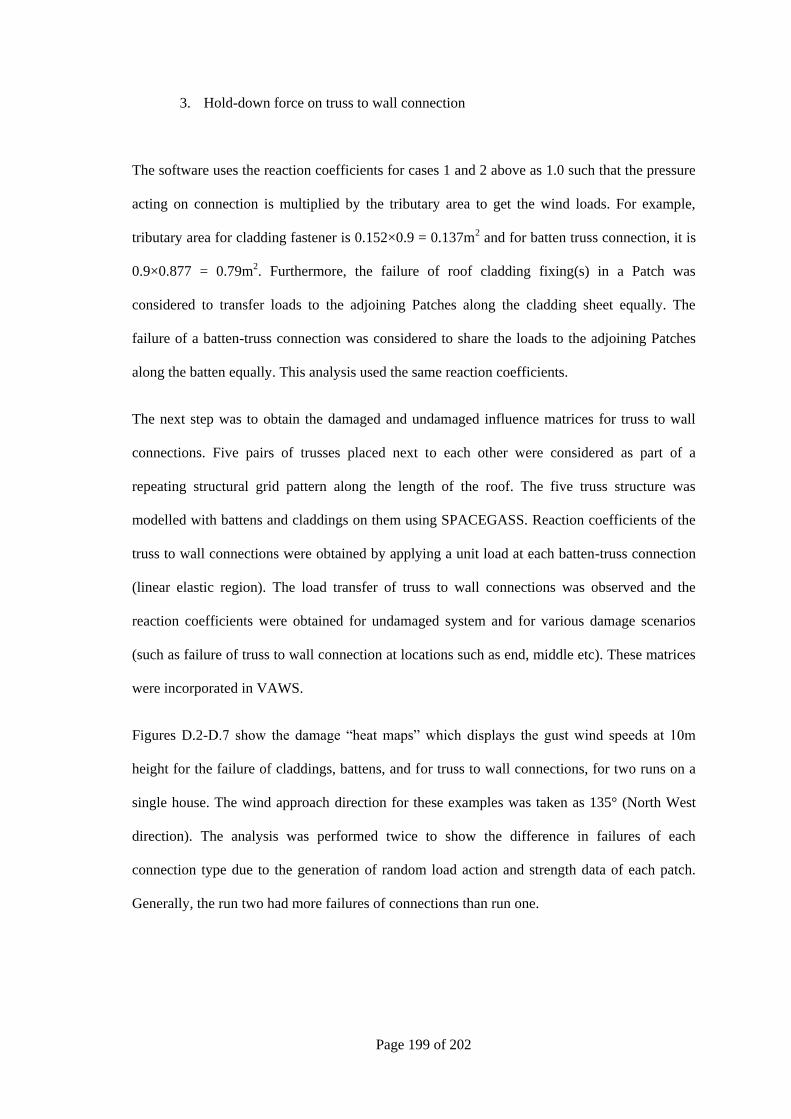
Page 199 of 202
3. Hold-down force on truss to wall connection
The software uses the reaction coefficients for cases 1 and 2 above as 1.0 such that the pressure
acting on connection is multiplied by the tributary area to get the wind loads. For example,
tributary area for cladding fastener is 0.152×0.9 = 0.137m2 and for batten truss connection, it is
0.9×0.877 = 0.79m2. Furthermore, the failure of roof cladding fixing(s) in a Patch was
considered to transfer loads to the adjoining Patches along the cladding sheet equally. The
failure of a batten-truss connection was considered to share the loads to the adjoining Patches
along the batten equally. This analysis used the same reaction coefficients.
The next step was to obtain the damaged and undamaged influence matrices for truss to wall
connections. Five pairs of trusses placed next to each other were considered as part of a
repeating structural grid pattern along the length of the roof. The five truss structure was
modelled with battens and claddings on them using SPACEGASS. Reaction coefficients of the
truss to wall connections were obtained by applying a unit load at each batten-truss connection
(linear elastic region). The load transfer of truss to wall connections was observed and the
reaction coefficients were obtained for undamaged system and for various damage scenarios
(such as failure of truss to wall connection at locations such as end, middle etc). These matrices
were incorporated in VAWS.
Figures D.2-D.7 show the damage ―heat maps‖ which displays the gust wind speeds at 10m
height for the failure of claddings, battens, and for truss to wall connections, for two runs on a
single house. The wind approach direction for these examples was taken as 135° (North West
direction). The analysis was performed twice to show the difference in failures of each
connection type due to the generation of random load action and strength data of each patch.
Generally, the run two had more failures of connections than run one.
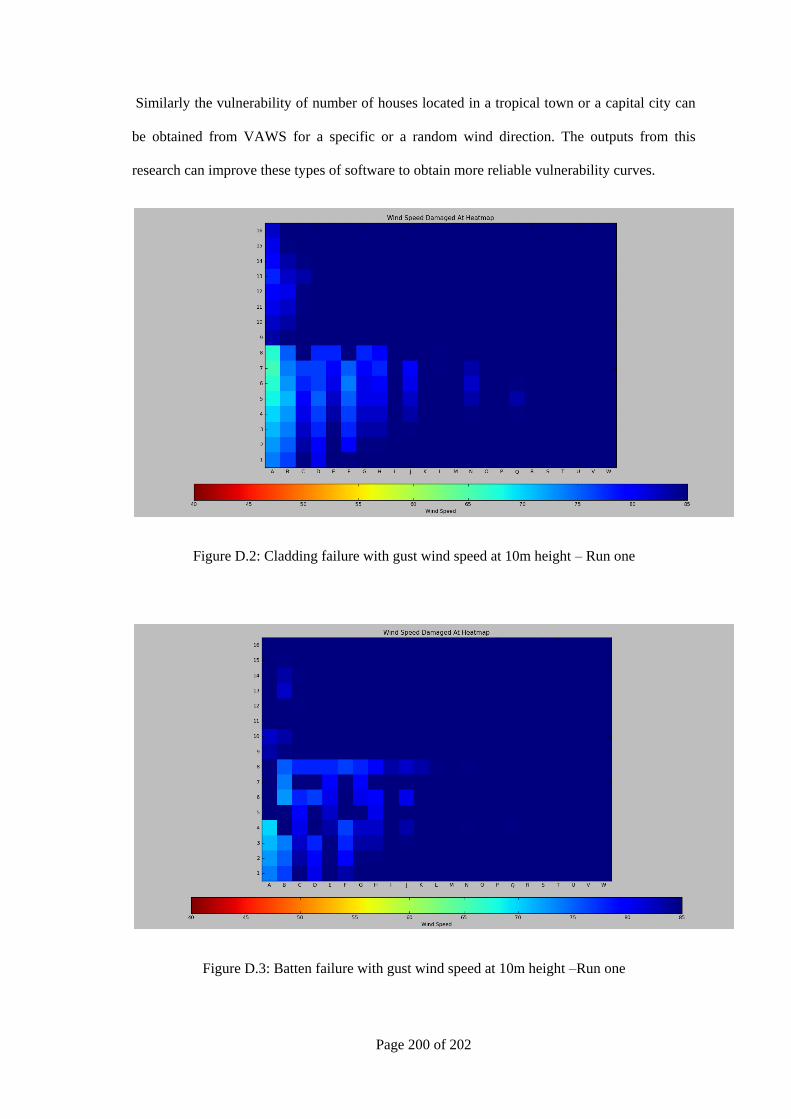
Page 200 of 202
Similarly the vulnerability of number of houses located in a tropical town or a capital city can
be obtained from VAWS for a specific or a random wind direction. The outputs from this
research can improve these types of software to obtain more reliable vulnerability curves.
Figure D.2: Cladding failure with gust wind speed at 10m height – Run one
Figure D.3: Batten failure with gust wind speed at 10m height –Run one

Page 201 of 202
Figure D.4: Truss to wall connection failure with gust wind speed at 10m height -Run one
Figure D.5: Cladding failure with gust wind speed at 10m height - Run two

Page 202 of 202
Figure D.6: Batten failure with gust wind speed at 10m height - Run two
Figure D.7: Truss to wall connection failure with gust wind speed at 10m height - Run two