Embed Size (px)
Citation preview

The Diversity and Ecology of Spiders in Coffee Agroecosystems in the Soconusco Region, Chiapas,
Mexico
by
Linda Esmeralda Rivera Marín
A dissertation submitted in partial fulfillment of the requirements for the degree of
Doctor of Philosophy (Natural Resources and Environment)
in The University of Michigan 2013
Doctoral Committee: Professor Ivette Perfecto, Chair Professor Mark Hunter Professor Stacy Philpott, University of California, Santa Cruz Professor John Vandermeer

ii
DEDICATION
To Esmeralda Marín González, entrepreneur woman and valiant mother that has fought many struggles. Te quiero mamá.

iii
ACKNOWLEDGMENTS
A lot of people helped me through my PhD endeavors and I am very thankful to them.
The inspiration for my PhD came from field experiences, interactions with farmers and
agroecological readings. Thus, I am grateful to my doctoral committee for its academic
advice and for writing many of the papers that inspired me. I would like to thank Ivette
Perfecto and John Vandermeer, who read many drafts of my papers, gave comments on
them and also wrote letters of recommendation. I would also like to thank Stacy Philpott,
who was my unofficial co-chair. Thanks Stacy for always having time for chatting,
exchanging ideas and commenting on my papers and for bringing good spirits when I was
down. Finally, I would also like to thank Mark Hunter. Mark was a key part of my
committee since he brought a different perspective to my dissertation. Thanks Mark, your
sharp insights have been very valuable in my education.
The communication and help that I got from my labmates substantially enriched
my time at the University. I am most grateful to the members of the ivettelab and
vandylab, but particularly to Douglas Jackson for all the time he spent helping me learn
how to code; and to Dave Allen, who always had time for meeting with me and
answering all my questions. In addition, the collaboration and exchange of ideas with
Dave Gonthier and Aaron Iverson were very rich and fun. I also had the fortune of

iv
collaborating with Hsunyi Hsieh, Carolina Simao, Chatura Vaidya and Sonali Devarajan,
wonderful women and scientists, who always gave me helpful comments on my work.
My PhD was also enriched from the collaborations I established with other
researchers. So I would like to thank my collaborators that helped me through several
phases of my research. Guillermo Ibarra-Núñez from El Colegio de la Frontera Sur in
Mexico and Mike Draney from the University of Wisconsin in Green Bay opened up
their labs to me and helped me with the identification of spiders. Aldo de la Mora was
also very helpful in my research and kindly shared field information that helped me to
further develop Chapter 1. I am also very grateful to the undergraduates that closely
collaborated with me. Comments from Stephen Tryban, Rachel Gingerich, Zach Hajian-
Forooshani and Sonali Devarajan were always an excellent input for my research and for
my teaching skills. I am very thankful to Dave Childers at the University of Michigan
Center for Statistical Consultation and Research. Finally, I would also like to thank Jane
Remfert for proofreading many of my drafts.
I would also like to thank my friends who always were very positive and shared
with me their kitchens, cuisines, music and souls. Maria Whittaker offered me her cozy
home in North Campus and delicious chicken soup. Theresa Ong and Kevin Li and their
wonderful Chinese cuisine were always a warm gift. I would also like to thank Hsunyi
Hsieh, Iracenir do Santos, Jane Remfert and Chatura Vaidya, wonderful women who
always had very good vibes and cheer that kept me smiling even in the most cold winters
or rainy seasons. Also, I could not forget the Veggie Dinner Club for such good meals.

v
Conversations and listening to music was always wonderful with Zach Hajian-
Forooshani. I would also like to thank Ann Larimore for her kindness and support. Ann,
the support that you gave me (exchanging Spanish lessons for part of the apartment rent)
was a very nice way of having a wonderful place. Gracias Ann. Finally, I also would like
to thank my friends in Mexico, who always kept their doors open to my flash visits.
Thanks to Ana, Isabel, Faviola and Dabit for sharing with me their casas, caprichos and
guaridas. I am indebted to Braulio Chilel, Cristian Pérez Velázquez and Gabriel
Domínguez for the field assistance they provided me over four field seasons and also for
their friendship and support when I had a bad fall in the field in August of 2012.
I am also very obliged to my funding sources that made my time at the University
possible. Initial funding for my PhD studies came through a 3-year scholarship (185699)
from CONACYT, the National Council of Science and Technology in Mexico.
Additional funding came through Graduate Student Instructor Positions, Tuition
Fellowships from the School of Natural Resources and Environment (SNRE) and
Rackham Graduate School. Likewise, my field research was funded by CONACYT,
SNRE, Rackham Graduate School and the Center for the Education of Women and in a
minor part by NSF grants granted to S. Philpott and I. Perfecto. The writing part of my
dissertation was supported through three sources. In the fall of 2012, I was the recipient
of a One Term Dissertation Fellowship awarded by the Rackham Graduate School; in the
winter of 2013 I received funds provided by the School of Natural Resources and
Environment and a 35 % appointment through I. Perfecto, whereas in the spring-summer
term I was supported by the School of Natural Resources and Environment and my own

vi
personal funds. I owe many thanks to the staff of the Office of Academic Programs in
SNRE and particularly to Diana Woodworth and Sondra Auerbach, who were key
elements in allocating funding to my education. I would also like to thank Darlene Ray-
Johnson from the Rackham Graduate School and Jacqueline Bowman from the Center for
the Education of Women for their kind support.
Since my mom got badly ill when visiting me for my doctoral defense, the very
last part of my dissertation writing took place in Mexico. So I am very grateful to the
people who helped us to go back to Mexico and also to the people who were very
supportive in that confuse period of time. Thanks to you all!

vii
PREFACE
Agriculture and pasturelands cover up 40% of the Earth’s terrestrial surface
(Foley et al. 2005) and depending on their agricultural management these systems
support biodiversity and function as connectors among forest fragments scattered across
landscapes (Vandermeer and Carvajal 2001, Perfecto et al. 2009). In addition, the
biodiversity found in agricultural fields may provide ecosystem services such as
biological control and pollination (Power 2010). Thus in order to set meaningful
biodiversity conservation agendas that encompass forest fragments and their surrounding
agricultural matrix as well to ensure sustainable food systems, we need to understand
how local agricultural management and landscape factors affect the biodiversity found in
agroecosystems. The goal of this dissertation is to understand how local and landscape
variables influence biodiversity in coffee agroecosystems. More specifically, I aim to
understand the patterns of richness, abundance and composition of spiders, a diverse and
abundant predatory taxon in agroecosystems to local and landscape factors in a coffee
landscape in the Soconusco, Chiapas, Mexico. Indeed, I ask how the patterns of richness,
abundance and composition of spiders change across a gradient of agricultural
management in the Soconusco, as well to determine the influence of aggressive ants and
distance to forest on spider diversity.

viii
Over the last 20 years we have learned that the agricultural management of
agroecosystems influences their suitability as habitat for biodiversity (Donald et al. 2001,
Tscharntke et al. 2005, Donald et al. 2006, Tscharntke et al. 2012). Agroecosystems
under intensified management (pesticide use, monoculture implementation and intensive
pruning) have significantly less species richness (Perfecto et al.1996, Donald et al. 2001,
Donald et al. 2006, Philpott et al. 2008, Lin and Perfecto 2012). In addition to the
influence of management, biodiversity within agricultural fields is also affected by
keystone species, including ants (Risch and Carrol 1982, Stadler and Dixon 2005,
Styrsky et al. 2010, Vandermeer et al. 2010). Finally, landscape factors, such as distance
from the agricultural plot to the nearest forest fragment, can also affect biodiversity
patterns in agricultural fields.
In the tropics, agroforestry systems play a crucial role in biodiversity conservation
as well in supporting farmers’ livelihoods (Clough et al. 2010, Lin and Perfecto 2012).
Coffee agroforestry systems are based on the combination of growing coffee (Coffea
arabiga L) plants under the shade of trees that were purposely left standing or were
planted for providing timber, fire wood and non-wood products such as fruits and fiber
(Moguel and Toledo 1999). Coffee agroforestry systems are found over a variety of
agricultural management ranging from complex coffee systems with a diverse array of
trees and high canopy cover values to coffee plantations with predominance of a single
tree genus and sparse shade (Moguel and Toledo 1999). In Mexico the intensification of
coffee agroforestry systems started in the 1970’s when the IMCAFE, a Mexican
extension agency, heavily promoted the use of the tree genus Inga in coffee systems as a
magic bullet that would solve many problems associated with coffee cultivation
ix
(Romero-Alvarado et al. 2002). Although, the IMCAFE was dissolved in 1989, the
intensification of coffee agroecosystems is still underway and continues to be propelled
by a variety of economic and cultural factors. The negative effects of coffee
intensification on biodiversity have been reported for a variety of taxa including ants,
beetles, birds, and epiphytes (see reviews by Perfecto et al. 1996, Philpott et al. 2008 and
Lin and Perfecto 2012). However, there is an empty space in the literature regarding the
effect of coffee intensification on spiders, a key predatory group. Indeed, spiders are
abundant generalist predators in natural ecosystems and agroecosystems (Coddington and
Levi 1991, Schmitz 1997, Schmidt et al. 2003, Schmitz 2005), however, few studies
about spider ecology have taken place in coffee agroecosystems (Vandermeer et al. 2002,
Pinkus Rendón et al. 2006).
Furthermore, most of the biodiversity studies in coffee agroecosystems have
explored the effects of local management on the diversity of a specific taxon, but have
not explored interactions with other taxa (e.g. ants). Finally, most of these studies have
been focused on the local effects of management but very few examine landscape factors
such as distance to forest. Thus in my dissertation I attempt to fill the gap that exists in
the understanding of how spider communities are associated with local factors such as
coffee intensification and aggressive ants and with landscape factors such as distance to
the forest.
Tropical regions are characterized by a strong seasonality reflected in the amount
of pluvial precipitation that defines the dry and rainy seasons (Wolda 1988). Thus any
positive effect that complex agroforestry coffee systems have on spider diversity may be
better reflected in the dry season because coffee systems with high shade canopy cover

x
have higher humidity. In chapter 1, I explore how the local management and distance to
forest influence ground spider diversity in a coffee landscape in both dry and rainy
seasons. In 2011, I sampled ground dwelling spiders in 37 sites scattered in a coffee
landscape in the Soconusco, Chiapas, Mexico; 27 sites were distributed in coffee farms
and 10 sites in forest fragments. I characterized these sites by taking vegetation
characteristics and canopy cover and gathering distance to the nearest forest fragment
using a Geographic Information System. My expectations were that: 1) spider diversity
would linearly and positively respond to the increase of canopy cover, 2) the positive
effect of high shade coffee would be higher over the dry season, the harshest season in
the tropics and 3) spider diversity in the coffee plots would be negatively and linearly
affected by distance to the nearest forest fragment. Results showed that local ground
dwelling spider richness and abundance differed significantly across seasons.
Furthermore, results showed that local ground dwelling spider richness and local
abundance did not respond positively to coffee management. Instead local spider richness
and abundance tended to be higher in the low shade coffee agroecosystems. Nonetheless,
in terms of accumulated spider richness the results are more intriguing. Indeed, results
showed that in the dry season the high shade coffee systems harbored higher richness
than any other system. On the contrary, in the rainy season the accumulated spider
richness was higher in the low shade system than in the two other systems. Results on
orthopteran abundance recorded for the rainy season showed that orthopterans were more
abundant in the low shade system, thus suggesting that prey availability could have
driven the high accumulated and local spider richness in the low shade systems in the
rainy season. In addition, the response of spider species composition to management also

xi
changed across seasons. Species composition showed its maximum dissimilarity in the
dry season and across forests. Results also showed that the response of spider diversity to
distance to forest was season dependent. No relationship between distance to forest and
spider diversity was found for the dry season, but a mild effect of distance to forest on
spider abundance was found in the rainy season. In this chapter I also document the
unexpected large correlation of spider richness and abundance with the slope of the
terrain.
Although predators, spiders are affected by the structure of the vegetation at a
local/microhabitat scale since spiders rely on plant structure for attaching webs, hiding
from predators and for nesting places. In addition, the negative effect of ants on
arthropods in natural ecosystems and agroecosystems has been reported elsewhere and in
coffee agroecosystems previous studies have suggested that the aggressive ants Azteca
instabilis have a negative impact on the spiders found in the coffee layer (see
Vandermeer et al 2002). In chapter 2, I address the spider diversity found in the trunks of
shade trees in relation to tree characteristics, the presence of the aggressive ants A.
instabilis, canopy cover and distance to forest. In 2012, I set up nineteen one-hectare
plots across a range of coffee management and measured vegetation characteristics in
each of them. In addition, I gathered distance to the forest by using a Geographic
Information System. In each one-hectare plot, I selected two pairs of trees, in one pair the
trees belonged to the Inga genus whereas in the other pair the trees belonged to another
genus. Furthermore, within each pair, one of the trees had an active A. instabilis nest,
whereas the other tree did not have one. My expectations were that local spider richness,
abundance and biomass found in the trunks of shade trees would decrease in the presence
xii
of A. instabilis and in trees with straight trunks. Results show that local spider richness,
abundance and biomass responded positively to tree characteristics and to the presence of
A. instabilis ants. However, the response of spider abundance and biomass was driven by
Ischothele digititata and Azilia guatemalensis, the two most abundant spider species; the
exclusion of these species from the dataset made the response to vanish. Results indicate
that these spiders prey upon the workers and queens of A. instabilis. In addition, a
composition analysis showed that the species composition was not strongly affected by
the presence of the A. instabilis ants. No effects of canopy cover or distance to the forest
were found.
Across a variety of systems ranging from tropical agroforestry systems to
temperate grasslands a growing literature has reported positive correlations between
spiders and ants. In chapter 3, I address the effect of the aggressive ants Azteca instabilis
on the spider diversity found in coffee plants in two contrasting coffee agroecosystems.
Results showed that local spider richness and abundance were higher in the most
intensified coffee agroecosystem and that A. instabilis ants have a positive effect on the
spider richness and abundance. Species composition did not change significantly in the
presence of the A. instabilis ants; nonetheless, three spider species were significantly
more abundant in the presence of the ants. In addition, in order to explore potential
mechanisms that would explain the high local spider richness and abundance in the
presence of A. instabilis ants I quantified potential prey for spiders in the presence and
absence of A. instabilis by carrying out visual counts of the insects found in the coffee
plants as well by using sticky traps. I found that overall more insects were found in the

xiii
presence of A. instabilis ants, thus suggesting that high levels of potential prey resources
might be driving the richness and abundance of spiders.
In chapter 4, I explore the influence of coffee plant attributes and the presence of
the aggressive ants A. instabilis on the abundance and spatial distribution of Pocobletus
sp. nova, the most abundant spider species found in the presence of A. instabilis in coffee
bushes. I address Pocobletus spatial distribution in relation to A. instabilis as well the
relationships among Pocobletus abundance, coffee branchiness, and A. instabilis presence
by setting up four plots, three 20 x 20 m and one 25 x 20 m plots and sampling
Pocobletus and their predators in each coffee plant found inside these plots. In addition, I
measured potential prey abundance by collecting insects in the presence and absence of
A. instabilis with sticky traps. Results show that the spatial distribution of Pocobletus is
positively associated with the presence of A. instabilis, however, it also suggests that
other variables in addition to the presence of A. instabilis influence the spatial distribution
of Pocobletus. Indeed, Pocobletus abundance was better explained by the presence of two
ant species (A. instabilis and Pheidole synanthropica) and by coffee branchiness. Results
also show that the abundance of spider predators of Pocobletus sp. decreased in the
presence of A. instabilis and that the number of potential prey for Pocobletus increased in
the presence of the ants. Potential mechanisms underlying the association between
Pocobletus sp. and A. instabilis are higher resource abundance and enemy free space.
In my dissertation research I aim to document how changes in coffee management
affect spiders inhabiting the ground, coffee and tree trunk strata as well to document the
response of spiders inhabiting the ground and tree trunk layers to distance to the nearest
forest fragment, a critical landscape factor. In addition, I document the ecological

xiv
interactions between the aggressive ant, A. instabilis, and spiders found in the coffee and
the tree trunk layer; these interactions range from predation to the creation of enemy free
space for the spiders. It is my hope that this research will contribute to a better
understanding of biodiversity in agricultural landscapes and the factors that influence this
agrobiodiversity.

xv
TABLE OF CONTENTS DEDICATION …………………………………………………………………………...ii ACKNOWLEDGMENTS ………………………………………………………………iii PREFACE ………………………………………………………………………………vii LIST OF TABLES .…………………………………………………………………….xvi LIST OF FIGURES ..…………………………………………………………………xviii ABSTRACT ...…………………………………………………………………………..xx CHAPTER 1. RESPONSE OF GROUND SPIDERS TO LOCAL AND LANDSCAPE FACTORS IN A COFFEE LANDSCAPE ……………………………..1 CHAPTER 2. SPIDERS RESPOND TO TREE CHARACTERISTICS AND AGGRESSIVE ANTS IN A COFFEE LANDSCAPE …………………………..39 CHAPTER 3. SPIDER DIVERSITY IN COFFEE AGROECOSYSTEMS: THE INFLUENCE OF AGRICULTURAL INTENSIFICATION AND AGGRESSIVE ANTS ………………………………………………………………….67 CHAPTER 4. A POSITIVE ASSOCIATION BETWEEN ANTS AND SPIDERS AND POTENTIAL MECHANISMS DRIVING THE PATTERN ……….103 CHAPTER 5. CONCLUSION ...………………………………………………………131

xvi
LIST OF TABLES Table 1.1. Habitat characteristics in 2011 for both dry and rainy seasons in forest and coffee sites in a coffee landscape in Southern Mexico. ..…………………29 Table 1.2. Potential drivers of spider richness in a coffee landscape over the dry and rainy seasons of 2011. …..…………………………………………….30 Table 1.3. Potential drivers of spider abundance in a coffee landscape over the dry and rainy season of 2011. ………………………………………………….31 Table 2.1. Associations between spider richness and tree characteristics, percent of canopy cover, distance to forest, elevation and the presence of Azteca instabilis ants. …………………………………...59 Table 2.2. Associations between spider abundance and tree characteristics, percent of canopy cover, distance to forest, elevation and the presence of Azteca instabilis ants. …………………………………...60 Table 2.3. Associations between spider biomass and tree characteristics, percent of canopy cover, distance to forest, elevation and the presence of Azteca instabilis ants. …………………………………...61 Table 3.1. Results of generalized linear mixed models testing the effect of Azteca instabilis and agricultural intensification on spider richness and abundance in 2008. ………………………………………………...95 Table 3.2. Results of best-fitted generalized linear mixed model for testing the effects of Azteca instabilis, spider removal and number of branches on spider richness and abundance per coffee plants in 2009. …………………………………………………………………………..96 Table 3.3. Results of best fitted generalized linear mixed models for testing the effects of Azteca instabilis in 2008 and 2009 and spider removal in 2009 on specific spiders found in coffee plants. …………………….97 Table 4.1. Observed and random weighted mean distances (m) of Pocobletus to the nearest coffee plant/tree patrolled by Azteca instabilis and P. synanthropica in the summer of 2010. ……………………………...123
xvii
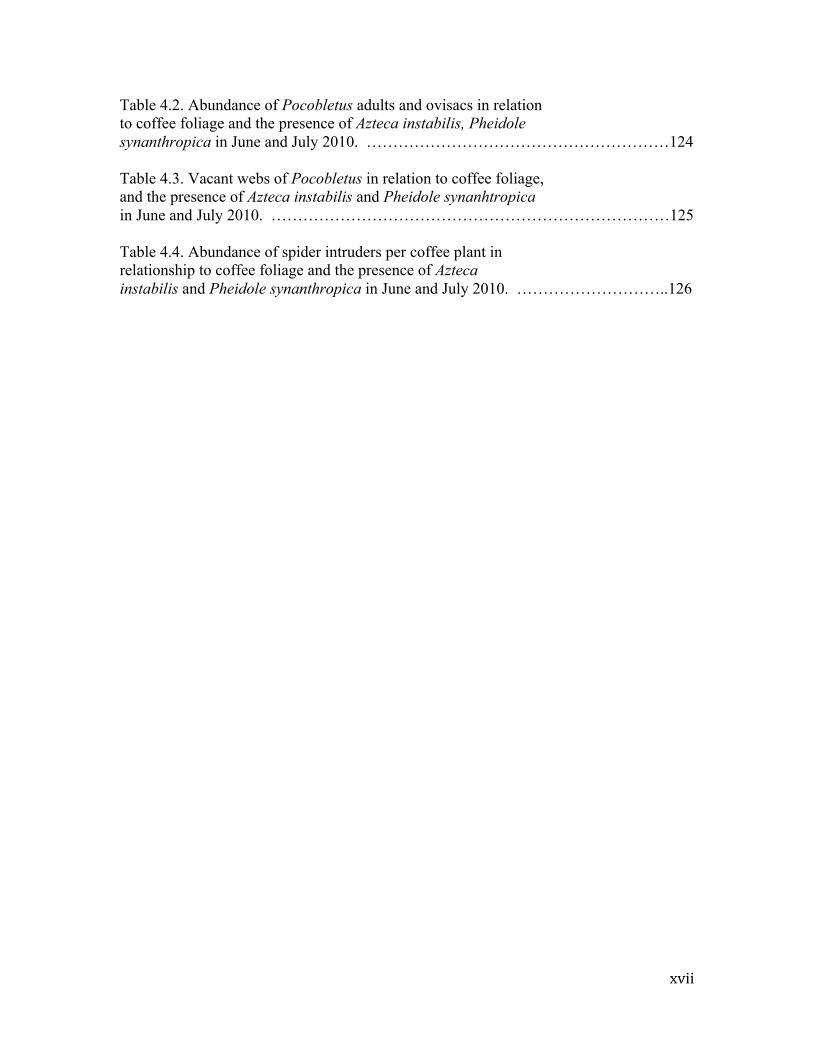
Table 4.2. Abundance of Pocobletus adults and ovisacs in relation to coffee foliage and the presence of Azteca instabilis, Pheidole synanthropica in June and July 2010. …………………………………………………124 Table 4.3. Vacant webs of Pocobletus in relation to coffee foliage, and the presence of Azteca instabilis and Pheidole synanhtropica in June and July 2010. …………………………………………………………………125 Table 4.4. Abundance of spider intruders per coffee plant in relationship to coffee foliage and the presence of Azteca instabilis and Pheidole synanthropica in June and July 2010. ………………………..126

xviii
LIST OF FIGURES Figure 1.1. Coffee landscape in the Soconusco region, Chiapas, Mexico. Dots represent sampled sites. ………………………………………………….24 Figure 1.2. Coffee sites separated in high-shade (dark brown) and low-shade (yellow) according to the PCA based on tree richness, tree density, canopy cover and proportion of Inga trees (axis 1) and canopy cover (axis 2). ………………………………………………..25 Figure 1.3. Individual based rarefaction curves for high-shade, low-shade and forest habitats in both the dry and rainy seasons. ……………………...26 Figure 1. 4. Average spider richness and abundance in high- shade coffee (H), low-shade coffee (L) and forest (F) sites in both dry (a) and rainy (b) seasons. C stands for both high and low shade-coffee sites pooled together. …………………...............................................27 Figure 1.5. Non-metric multidimensional scaling plots for the ground spider community found in the coffee landscape over the dry (a) and rainy (b) seasons. ………………….........................................................28 Figure 2.1. Differences in tree characteristics between Inga and non-Inga trees. ………………….....................................................................................56 Figure 2.2. Spider richness, abundance and biomass found in Inga and non-Inga trees. ………………….....................................................................57 Figure 2.3. Non-metric multidimensional scaling plots showing spider species composition between trees with an Azteca instabilis nest and trees without it for 2011(a) and 2012 (b). …………………………..58 Figure 3.1. Rarefaction curves (Mao Tau) and Chao1 estimates for spider richness in a diverse shade coffee agroecosystem (DS) and a monospecific shade monoculture (MS) in the Soconusco region,Chiapas, Mexico. The lines show 95% confidence intervals around the expected richness (Mao Tau) for coffee agroecosystems with the same colored symbol. …………………………………….90

xix
Figure 3.2. Individual Rarefaction curves (Mao Tau) and Chao1 estimates for spider species richness in the presence/absence of Azteca instabilis ants in 2008 and 2009. The lines show 95% Confidence intervals around the expected richness (Mao Tau) for A. instabilis presence with the same colored symbol. .…………………………………91 Figure 3.3. Rank abundance of spider species in the presence and absence of Azteca instabilis in 2008 (right) and 2009 (left). Dotted arrows indicate the affected species. ……………………………………………92 Figure 3.4. Non-metric multidimensional scaling plot showing the similarity in species composition in the presence and absence of Azteca instabilis in 2009. The overlapping polygons indicate the degree of similarity. …………………………..............................................93 Figure 3.5. Mean insect abundance per plant (± SE) in the absence and presence of Azteca instabilis ants in 2009. a = visual counts data, b= sticky traps data. ……………………….................................94 Figure 4.1. Spatial distribution of the abundance of Pocobletus sp. adults in the presence of A. instabilis and P. synanthropica in three 20 x 20 m plots and one 20x 25 m plot in a coffee farm in Southern Mexico. a) June, b) July. ……………………………………………………121 Figure 4.2. Insect abundance per coffee plant (mean ± SE) in the presence and absence of Azteca instabilis in 2009 (a) and 2010 (b) and mean insect abundance per Pocobletus sp. web collected in plants patrolled and not patrolled by the ants (c). ……………………………………122

xx
ABSTRACT
Agricultural landscapes are globally distributed and can function as refuges for
biodiversity. My research focuses on elucidating the factors that influence predators and
their ecological interactions in agricultural landscapes. I studied patterns of richness and
abundance of a predator group, spiders, to understand its response to local factors
(agricultural management, presence of aggressive ants) and landscape factors (distance to
forest) in a coffee landscape composed of forest remnants (6%) and coffee farms (94%).
First, I examined the patterns of ground dwelling spider diversity associated with
coffee management intensification as well as the response of spider diversity to canopy
cover, slope of the terrain, litter biomass, and distance to forest. Findings show that local
spider richness and abundance were generally higher in simplified agroecosystems.
Distance to forest had a mild correlation with spider abundance; in contrast local spider
richness and abundance had a strong negative correlation with slope.
Second, I examined the response of tree-trunk dwelling spider diversity and
biomass to Azteca instabilis ants, tree characteristics, canopy cover and distance to forest.
Results show that local spider richness was positively correlated with tree diameter,
whereas spider abundance and biomass were positively correlated with tree diameter, and
A. instabilis.

xxi
Third, I examined spiders in coffee plants and their response to A. instabilis in
contrasting coffee agroecosystems. Results show that spider richness and abundance were
higher in the intensified sites and in the presence of A. instabilis. Potential mechanisms
for the spider-ant association were prey availability and protection against predators.
Fourth, I examined the abundance of the most abundant spider genus in coffee
plants, Pocobletus, in relation to coffee branchiness and ants presence. Results show that
Pocobletus is positively associated with coffee branchiness and the presence of A.
instabilis and P. synanthropica ants. Evidence suggested that the positive association
Pocobletus-ants was due to prey abundance and enemy-free space.
In sum, ground and coffee dwelling spiders were locally more diverse and
abundant in the intensified agroecosystems, whereas tree-trunk dwelling spiders were
more sensitive to coffee intensification. Spiders were positively associated with
aggressive ants. Distance to forest was not an important predictor of spider diversity.

1
CHAPTER 1
RESPONSE OF GROUND SPIDERS TO LOCAL AND LANDSCAPE FACTORS IN A COFFEE LANDSCAPE
Abstract
Biodiversity and agriculture provide ecosystem services to humanity. However,
agriculture has been considered as one of the main factors driving the current biodiversity
loss. In order to secure the provisioning of ecosystem services detailed analyses of the
relationship between biodiversity and agriculture are required. We studied ground spider
diversity in a 52 km2 coffee landscape in Southern Mexico, and asked the following
questions. Does coffee management affect ground spider diversity? What are the factors
that influence ground spider diversity in a coffee landscape? Does ground spider diversity
respond to different variables in different seasons? Over the dry and rainy seasons of
2011 we sampled ground spiders with pitfall traps in thirty-seven 20 x 20 m sites
distributed in coffee plantations (27 sites) and forest fragments (10 sites). Using Principal
Component Analysis we analyzed the variation in coffee sites based on tree species
richness, tree density, canopy cover and proportion of Inga trees. In addition, for each 20
x 20 m site we measured leaf litter variables, invertebrate dry biomass, slope of the
terrain, elevation and distance to the nearest forest. Data were analyzed with general and
2
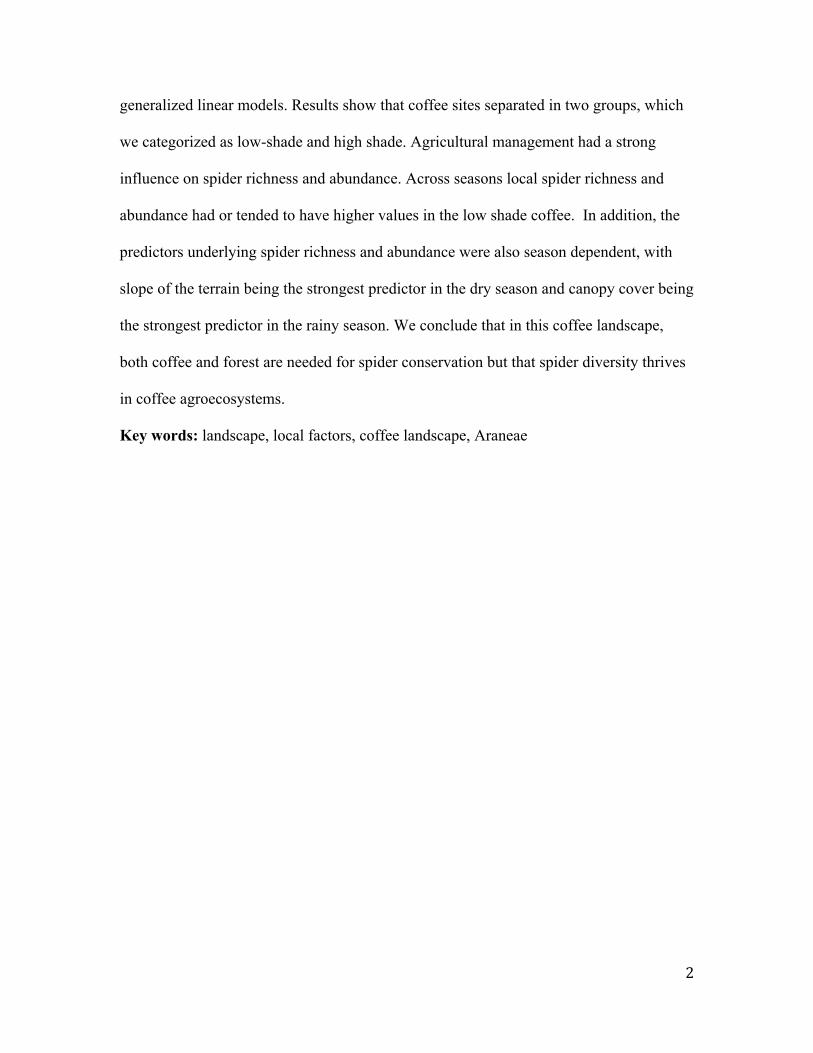
generalized linear models. Results show that coffee sites separated in two groups, which
we categorized as low-shade and high shade. Agricultural management had a strong
influence on spider richness and abundance. Across seasons local spider richness and
abundance had or tended to have higher values in the low shade coffee. In addition, the
predictors underlying spider richness and abundance were also season dependent, with
slope of the terrain being the strongest predictor in the dry season and canopy cover being
the strongest predictor in the rainy season. We conclude that in this coffee landscape,
both coffee and forest are needed for spider conservation but that spider diversity thrives
in coffee agroecosystems.
Key words: landscape, local factors, coffee landscape, Araneae
3
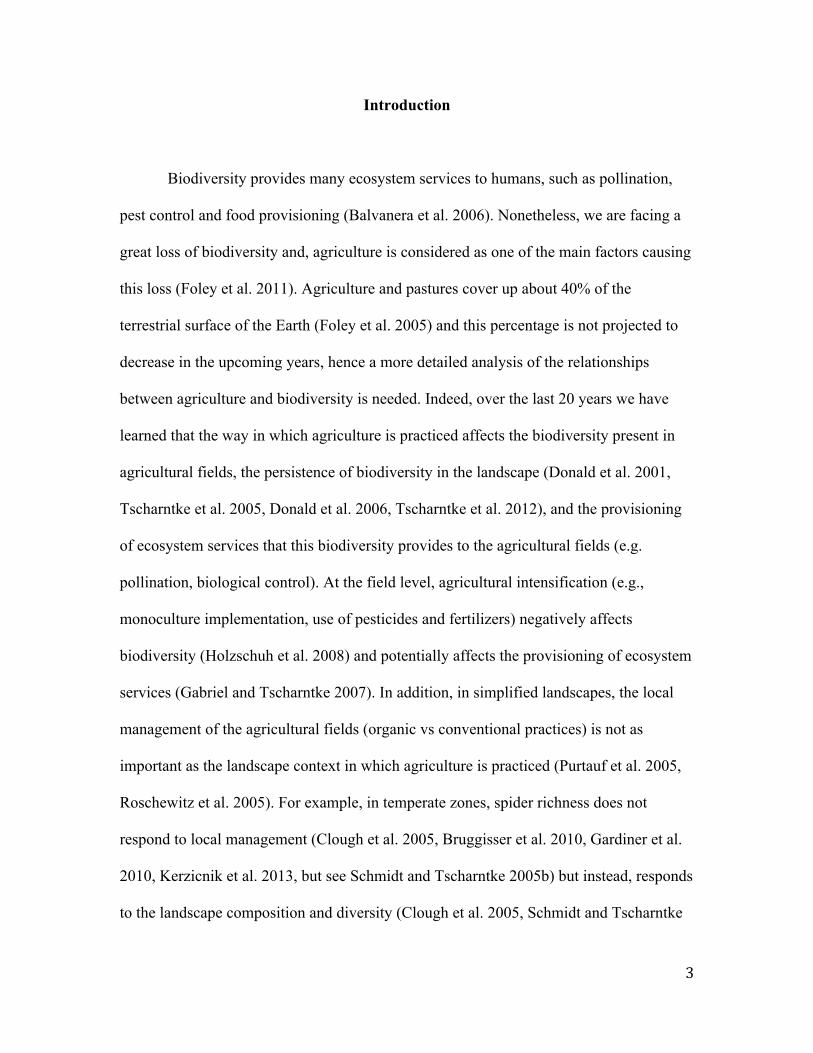
Introduction
Biodiversity provides many ecosystem services to humans, such as pollination,
pest control and food provisioning (Balvanera et al. 2006). Nonetheless, we are facing a
great loss of biodiversity and, agriculture is considered as one of the main factors causing
this loss (Foley et al. 2011). Agriculture and pastures cover up about 40% of the
terrestrial surface of the Earth (Foley et al. 2005) and this percentage is not projected to
decrease in the upcoming years, hence a more detailed analysis of the relationships
between agriculture and biodiversity is needed. Indeed, over the last 20 years we have
learned that the way in which agriculture is practiced affects the biodiversity present in
agricultural fields, the persistence of biodiversity in the landscape (Donald et al. 2001,
Tscharntke et al. 2005, Donald et al. 2006, Tscharntke et al. 2012), and the provisioning
of ecosystem services that this biodiversity provides to the agricultural fields (e.g.
pollination, biological control). At the field level, agricultural intensification (e.g.,
monoculture implementation, use of pesticides and fertilizers) negatively affects
biodiversity (Holzschuh et al. 2008) and potentially affects the provisioning of ecosystem
services (Gabriel and Tscharntke 2007). In addition, in simplified landscapes, the local
management of the agricultural fields (organic vs conventional practices) is not as
important as the landscape context in which agriculture is practiced (Purtauf et al. 2005,
Roschewitz et al. 2005). For example, in temperate zones, spider richness does not
respond to local management (Clough et al. 2005, Bruggisser et al. 2010, Gardiner et al.
2010, Kerzicnik et al. 2013, but see Schmidt and Tscharntke 2005b) but instead, responds
to the landscape composition and diversity (Clough et al. 2005, Schmidt and Tscharntke

4
2005a, b, Oberg et al. 2007, Schmidt-Entling and Dobeli 2009, Gardiner et al. 2010).
Thus the effects of agricultural intensification need to be addressed at several scales,
including local, landscape and regional scales (Tscharntke et al. 2005, Clough et al.
2007a, Clough et al. 2007b, Tscharntke et al. 2012). Most of the studies analyzing the
landscape and local effects of agriculture on biodiversity and ecosystem services have
been carried out in temperate zones of the United States and Europe (Tscharntke et al.
2007, Gardiner et al. 2010, Woltz et al. 2012) and little is known about how these factors
play out in tropical regions (but see Stenchly et al. 2011, Avelino et al. 2012, Stenchly et
al. 2012).
Coffee agroecosystems are found in mountainous and in flat zones of the
Neotropics and they play an extremely important role in biodiversity conservation in that
region (reviewed by Perfecto et al. 1996, Moguel and Toledo 1999, Lin and Perfecto
2012). As with many agricultural systems, coffee agroecosystems cover a full range of
management practices. The most complex coffee agroecosystems are agroforestry
systems that have high shade tree canopy cover and richness and tend toward organic
management, whereas the most simplified systems are coffee monocultures without
shade trees. However, in most areas, especially those that are found in mountainous
regions with rugged topography, the most intensive systems have a low percent of canopy
cover and few species of trees, most of them in a single genus (Moguel and Toledo
1999). An extensive literature on biodiversity in coffee farms indicates that coffee
systems with high shade cover and tree diversity support higher species richness of
associated (or wild) biodiversity than coffee systems that are structurally less diverse (Lin
and Perfecto 2012). However, spiders seem to be an exception to what has been found for

5
other taxa. Studies examining spider diversity on coffee plants have found that
accumulated spider richness does not differ between the most and least intensified
systems (Marin and Perfecto 2013), but that local spider abundance is higher in the most
intensified coffee plantations (Pinkus-Rendon et al. 2006a, Marín and Perfecto 2013a).
Here we examine the effect of local coffee management, local habitat variables
(leaf litter biomass, invertebrate biomass and percent of canopy cover), and one critical
landscape factor (distance to the forest) on the abundance and richness of ground spiders
in a coffee landscape composed of coffee farms under several management categories
and small forest fragments. We studied spiders because they are a very diverse predatory
taxon (Coddington and Levi 1991) whose role in controlling insect populations (Schmitz
et al. 1997, Schmidt et al. 2003) and, even affecting community structure (Schmitz 2008)
has been reported for both natural ecosystems and agroecosystems (Schmidt et al. 2003).
Specifically, we asked the following questions: 1) Are spider richness, abundance and
composition affected by coffee management? 2) How do local and landscape factors
influence ground spider richness and abundance in a coffee landscape? and 3) Does
spider richness and abundance respond to different variables in different seasons?
Material and Methods
Study Area
The study took place in the Soconusco region of the state of Chiapas, Mexico, a
coffee growing region characterized by rugged terrain covered by coffee farms and
scattered forest fragments. The coffee landscape studied here covers an area of 52 km2
(coordinates 15.202 N, 92.383 W [NW corner] and 15.144 N, 92.297 W [SE corner], fig.

6
1.1) (Philpott et al. 2008) and is characterized by large coffee farms (~300 ha) that cover
94% of the landscape and small remnants of evergreen tropical forest (6%) (Philpott et
al. 2008, De la Mora et al. 2013). The study area covers an altitudinal gradient ranging
from 800 to 1450 meters above sea level, and has two well-defined seasons; a dry season
from November to April and a rainy season from mid-late May to October. In this
landscape thirty-seven 20 x 20 m sites were established in forest remnants (10 sites) and
in coffee plantations (27 sites) that varied in their management (De la Mora et al. 2013).
Site characterization
Coffee management. For every 20 x 20 m site we collected data on percent canopy
cover, tree species richness, tree density and proportion of Inga trees (except Inga
laurina, a species more often found in the forest). We decided to include the proportion
of Inga trees in the analysis as a measure of intensification because after its introduction
in the 1980’s, the intensive and extensive use of Inga trees has became a hallmark of
simplified coffee farms (Romero-Alvarado et al. 2002). We used these data in a Principal
Component Analysis to separate the coffee sites into high shade and low shade habitats
(Table 1). Data were collected once in the dry season and once in the rainy season of
2011. Although most of the coffee sites we sampled were previously classified for
another study (De la Mora et al. 2013), due to changes in agricultural management in
some farms we replaced some sites and updated the management variables of the coffee
sites in the dry season (Table 1). We collected leaf samples from the tree species found in
the forest sites in April 2011, which we identified and deposited at the Herbarium of El
Colegio de la Frontera Sur (San Cristóbal and Tapachula). We identified the tree species
found in the coffee sites in the field. We measured canopy cover with a concave

7
densitometer at 0, 5 and 10 m from the center of the site at each of the four cardinal
directions (N, S, W, E). In forest sites we measured the canopy cover in July 2011,
whereas in coffee sites canopy cover was measured twice, once in March 2011 (dry
season) and once in July 2011 (rainy season).
Local variables. In addition to the coffee management variables, for each site we
measured a set of local variables, the distance to the nearest forest fragment and two
environmental variables (elevation and slope). The local variables measured per site were
leaf litter depth, leaf litter dry biomass, percent of soil covered by leaf litter, twigs and
woody debris (rainy season only), invertebrate dry biomass and orthopteran abundance
(rainy season only). We took forty leaf litter depth measurements per site as follows. In
each 20 by 20 m site we set up two 20 m transects, transect 1 was set up in a North-South
direction and transect 2 was set up in a West-East direction. Then starting at the
intersection of both transects (the center of each site) we took leaf litter depth
measurements with a flat ruler every meter, for a total of 10 measurements in each
cardinal direction and 40 measurements in each site. To estimate leaf litter biomass, we
haphazardly threw a 25 x 25 cm2 square five times within each 20 x 20 m site then
collected all leaf litter contained inside the 25 x 25 cm2 square, labeled the sample and
dried the leaf litter at 70 °C for 5-6 days. We assessed ground cover in the rainy season,
by sampling 20 haphazardly selected 25 x 25 cm2 quadrats in each of the 20 x 20 m sites.
Within each quadrat we measured the percent of soil covered by leaf litter, twigs and
woody debris. As a surrogate for invertebrate biomass we assessed invertebrate dry
biomass of all arthropods (minus spiders and ants) collected with pitfall traps (see spider
sampling below). Arthropods were dried at 60 °C for three days and then weighed.
8
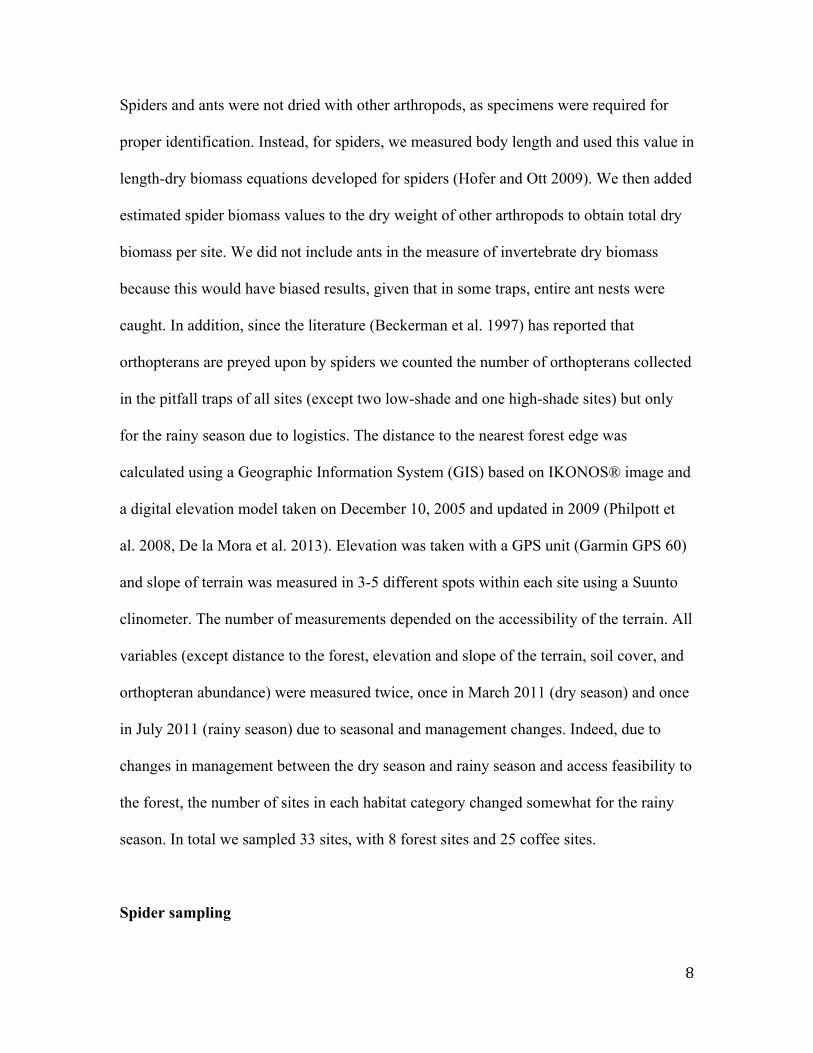
Spiders and ants were not dried with other arthropods, as specimens were required for
proper identification. Instead, for spiders, we measured body length and used this value in
length-dry biomass equations developed for spiders (Hofer and Ott 2009). We then added
estimated spider biomass values to the dry weight of other arthropods to obtain total dry
biomass per site. We did not include ants in the measure of invertebrate dry biomass
because this would have biased results, given that in some traps, entire ant nests were
caught. In addition, since the literature (Beckerman et al. 1997) has reported that
orthopterans are preyed upon by spiders we counted the number of orthopterans collected
in the pitfall traps of all sites (except two low-shade and one high-shade sites) but only
for the rainy season due to logistics. The distance to the nearest forest edge was
calculated using a Geographic Information System (GIS) based on IKONOS® image and
a digital elevation model taken on December 10, 2005 and updated in 2009 (Philpott et
al. 2008, De la Mora et al. 2013). Elevation was taken with a GPS unit (Garmin GPS 60)
and slope of terrain was measured in 3-5 different spots within each site using a Suunto
clinometer. The number of measurements depended on the accessibility of the terrain. All
variables (except distance to the forest, elevation and slope of the terrain, soil cover, and
orthopteran abundance) were measured twice, once in March 2011 (dry season) and once
in July 2011 (rainy season) due to seasonal and management changes. Indeed, due to
changes in management between the dry season and rainy season and access feasibility to
the forest, the number of sites in each habitat category changed somewhat for the rainy
season. In total we sampled 33 sites, with 8 forest sites and 25 coffee sites.
Spider sampling

9
We sampled spiders by placing five pitfall traps (diameter = 7cm, height = 5 cm) within
1m2 at the center of each site. Traps were filled with 125 ml of a soapy solution of 25%
propylene glycol (a non toxic preservative) and buried into the ground with their rim at
the level of the ground. We set up traps between 7 a.m. to 1 p.m. and left them open for 5
days. At the end of the fifth day we collected and transported the traps to the laboratory
and placed all collected specimens in 95% ethanol. We identified spiders to family by
following the spiders of North America (Ubick et al. 2005) and to species and
morphospecies following selected literature (Platnick 2013). Voucher specimens were
deposited in the Arachnological Collection at El Colegio de la Frontera Sur in Tapachula
and at the Department of Natural and Applied Sciences at the University of Wisconsin
Green Bay.
Statistical Analyses
Habitat characteristics
We analyzed the variation in management variables in the coffee sites with
Principal Component Analysis. More specifically, in the Principal Component Analysis
we included percent canopy cover, tree density, tree richness and proportion of Inga
trees. In addition, we tested differences among forest and coffee habitats with respect to
percent canopy cover, tree density, tree richness, proportion of Inga trees, leaf litter
depth, dry leaf litter biomass, invertebrate dry biomass and orthopteran abundance with
univariate analysis of variance followed with Tukey HSD tests. When variables were not
normally distributed they were square root transformed.
Coffee management and spider diversity

10
Richness and abundance. To test whether total species richness was significantly
different among the three habitats (forest, high shade and low shade), we constructed
individual-based rarefaction curves and their respective standard deviations with R
software following Gotelli and Ellison (2012). To evaluate whether spider diversity
differed in forest, high-shade coffee, and low-shade coffee, we compared mean spider
richness and abundance with analysis of variance and subsequent Tukey HSD tests. In
addition, we compared mean spider richness and abundance in forest and coffee sites
with t tests. We tested for normality in the distribution of the errors with qqnorm plots.
When errors were not normally distributed, we applied the square root transformation.
Guilds. We calculated the change in guild composition across seasons and
habitats by sorting spiders into four guild categories (cursorial hunters, web builders,
kleptoparasites, and sit and wait hunters) and calculating their percentages in each habitat
and season. Following Ubick et al. (2005) and field observations we included as cursorial
hunters those spiders that do not build a web but that rather actively pursue prey; web
builders, those spiders that rely on weaving a web for catching prey; kleptoparasites,
those spiders that invade webs of other spiders for obtaining food; and as sit and wait
hunters, those spiders with limited movement —such as trap door spiders.
Dominant families and species composition. We identified the dominant
families and their richness and abundance in forest and coffee sites for each season and
we compared mean spider richness and abundance in forest and coffee sites with t tests
and Wilcoxon tests when normality criteria where not met even after transforming the
variable. We analyzed the change in species composition across habitats using Non-
metric multidimensional scaling (NMDS), a technique widely used for comparing

11
changes in species composition across habitats (Winfree et al. 2008, Borcard et al. 2011,
Hogg and Daane 2013). This technique creates a species composition distance matrix
between sites based on a similarity index, which measures how close are two points in
regards to species composition. Then sites are ranked according to their differences and
ranked differences are considered for evaluating the similarity between sites through an
iterative processes. We used the Bray-Curtis similarity index. To assess the significance
of the difference in species composition among high shade, low shade and forest habitats
we used Analysis of Similarities (ANOSIM), which provides an R-value. R values close
to 1 mean that habitats are greatly dissimilar whereas values close to 0 mean that habitats
are very similar.
Effect of the local and landscape variables on spider diversity
In order to elucidate which factors have the strongest association with ground
spider richness and abundance, we used general linear models and generalized linear
models.
In all cases, spider abundance or spider richness were the response variables and the local
and landscape variables were the predictor variables. We tested the error distribution of
the response variables by using Cook’s distance. When errors were normally distributed,
we analyzed data with a general linear model in the mode of a multiple linear regression.
When errors were not normally distributed we used generalized linear models with a
negative binomial distribution for count data (Faraway 2006). We applied backward
model selection and variables were retained based on their probability value. We
calculated correlation among predictor variables using variance inflation factors (vif) and
variables that had a value greater than 2.6 were discarded from the model. We chose

12
between different models by using AIC values. All analyses were carried out with R
software (R Core Team 2012) using the packages carr, lmtest, MASS, vegan.
Results
Site characteristics
The Principal Component Analysis (PCA) using percent canopy cover, tree
species richness, tree density and proportion of Inga showed that coffee sites separated
into two groups (Fig. 1.2a & b). In the dry season, PCA axis 1 explained 64 % of the
variance and was positively correlated with tree species richness, tree density and canopy
cover and negatively correlated with the proportion of Inga trees; PCA axis 2 explained
18% of the variance and was positively related to canopy cover (Fig. 1.2a). Based on
those results we classified sites into high-shade (H: with high percent canopy cover, low
proportion of Inga and high tree species richness and density) and low shade (L: with low
percent canopy cover, high proportion of Inga and low tree species richness and density),
thus during the dry season the PCA resulted in 14 low-shade sites, and 13 high-shade
sites. Three sites had high tree richness but had very low canopy cover in the dry season,
thus we decided to place them in the low-shade category. In the rainy season PCA axis 1
explained 65 % of the variance and was negatively correlated with tree species richness,
tree density and canopy cover and positively correlated with the proportion of Inga trees;
PCA axis 2 explained 15% of the variance and was positively related to canopy cover and
proportion of Inga trees (Fig. 1.2b). During the wet season due to changes in
management the number of coffee sites decreased thus the PCA resulted in 14 low-shade
sites and 11 high-shade sites. Classifications were corroborated with analysis of variance

13
that tested for differences in management variables among the three habitat types. Across
both seasons, forest sites, high-shade coffee and low-shade coffee habitats differed in
percent canopy cover, tree species richness and tree density (Table 1.1). In addition, high-
shade and low-shade coffee sites differed in the proportion of Inga tress, with the high
shade sites having significantly lower proportion of Inga trees (Table 1.1).
Local variables differed with habitat type and with season. In the dry season, leaf
litter depth was higher in forest than in high- or low-shade coffee (Table 1.1). However,
no differences were found among the three habitats in the mean leaf litter dry biomass.
In the rainy season, percent soil covered by leaf litter and wood debris was lower in forest
than in coffee sites (Table 1.1). Invertebrate dry biomass was marginally lower in the
low-shade sites than in the high-shade and forest sites in the dry season, but no
differences were identified in the rainy season. Orthopteran abundance differed with
habitat in the rainy season with higher abundance in the low-shade coffee sites. Due to
the way in which sites were classified in the two seasons, distance to forest differed for
high- and low-shade sites in the dry season with high-shade sites closer to forest than
low-shade sites. Elevation did not differ with habitat, but slope of the terrain was steeper
in forests compared with coffee sites (Table 1.1).
Coffee management and spider diversity
Overall, we collected 1299 spiders belonging to 25 families, 56 genera, and 88
species or morphospecies. A large fraction (50%) of species was composed of singletons
(39%) and doubletons (11%). The most diverse families were Theridiidae (24% of
species) and Linyphiidae (18%), whereas the most abundant families were Linyphiidae
(38.5%), Lycosidae (20%) and Corinnidae (13%). The species overlap between the dry

14
and rainy season was 43 %. In the dry season we collected 678 individuals and 59 species
or morphospecies distributed among 40 genera and 17 families. In the rainy season we
collected 621 individuals, 23 families, 51 genera, and 68 species or morphospecies.
Richness. According to individual-based rarefaction curves, total species richness
differed with habitat in the dry season, with the high shade habitat harboring more spider
species than the low shade habitat. Nonetheless, the species accumulation curve for the
forest does not plateau indicating that more sampling was required. In the rainy season,
individual based rarefaction curves showed that low-shade habitats had more species than
high-shade coffee and forest habitat (Fig. 1.3b). However, once again the rarefaction
curve for the forest habitat does not plateau, suggesting that the forest sampling was
incomplete.
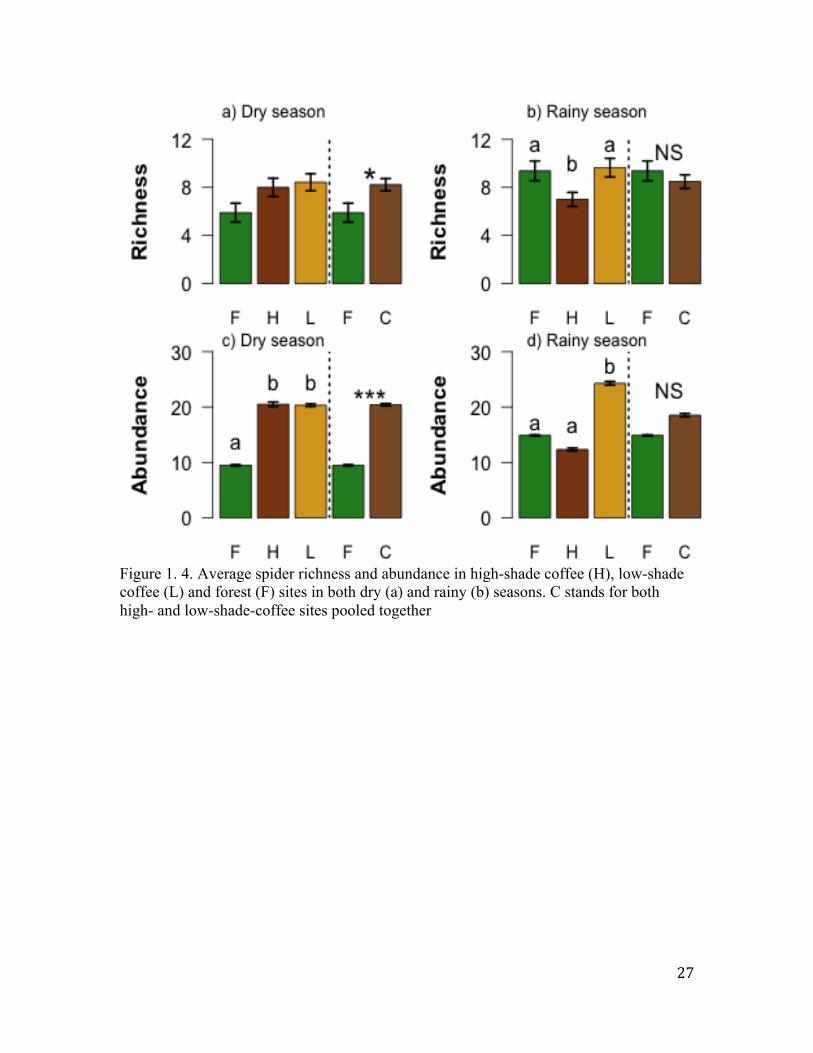
Local mean spider richness per site was lower in the forest sites (5.90 species)
than in either coffee habitat (H = 8 species and L = 8.42 species), but this difference was
not statistically significant (Fig. 1.4a; F-statistic = 2.92, p = 0.067, d. f. =2, 35). However,
when the two coffee habitats were pooled together this difference became significant
(Fig. 1.4a; coffee = 8.22 species; forest = 5.9 species; t-test = 2.49, p = 0.002, d. f. =
17.21). In contrast to the dry season, mean richness did not differ in forest (9.24 ± 0 .051)
and pooled coffee sites (8.26 ± 0.05) (t-test = -1.01. p = 0.3, Fig.1.4b,d. f. = 14.64).
However, the average species richness per site was significantly higher in forest (9.24 ±
0.051) and low-shade (9.44 ± 0.06) coffee than in the high-shade coffee (6.88 ± 0.041)
(Fig. 1.4b, F-statistic = 4.059, p = 0.027 d. f. = 2, 23).

15
Abundance. In the dry season, local mean spider abundance per site was
significantly lower in the forest sites (9.49 individuals) than in either coffee habitat (H =
20.5 individuals and L = 20.33 individuals), (Fig. 1.4c; F-statistic = 7.98, p = 0.001).
Furthermore, when the two coffee habitats were pooled together this difference was still
significant (Fig. 1.4c; forest = 9.49 individuals, coffee = 20.4 individuals, t-test = 5.22, p
<0.0001). In the rainy season, mean abundance was significantly higher in the low-shade
coffee (24.29 individuals ± 0.33) than in the high shade (12.34 individuals ± 0.25) or
forest (14.89 individuals ± 0.095) sites (F-statistic = 7.81, p=0.001). However, when the
two coffee habitats were pooled together this difference disappeared (Fig. 1.4d; coffee =
18.53 individuals; forest = 14.89 individuals; t-test = 1.45, p = 0.16, Fig. 1.4d).
Guilds. In the dry season, guild composition across species was relatively even
with 52% classified as cursorial hunters and 48% classified as web builders; we did not
find kleptoparasite or sit and wait spiders in the dry season. Spider abundance, however,
was strongly biased towards web builders (64.3% of individuals) with lower abundance
of cursorial hunters (35.7% of individuals). Abundance of guilds was very biased
regarding habitat type. Fifty percent of all hunter spiders were recorded in the low-shade
coffee habitat, 38% were recorded in the high-shade coffee habitats and 12% were
recorded in the forest habitats. Web builders did not show strong preference for low-
shade habitats (40%), high-shade habitats (44%), or forest habitats (16%). The most
abundant species was Walckenaeria crocea (Linyphiidae), a web builder spider that
represented 20% of all individuals collected, followed by Meioneta sp. 1 (Linyphiidae), a
web builder that represented 15% of all individuals. Thus, just two species added up to
35% of the total abundance.

16
In the rainy season, guild composition across species was strongly biased towards
web builders (59.2% of species) with only 33.3% of the species in the cursorial hunter
guild, 4.4% kleptoparasites and 2.9% sit and wait predators. However, in term of
individuals, the most abundant guild was cursorial hunters (57.3% of individuals),
followed by web builders (40.9%), sit and wait predators (1.28%) and kleptoparasites
(0.48%). Abundance of guilds was very biased regarding habitat type. Fifty-nine percent
of all hunter spiders were recorded in the low-shade coffee habitat, 24% were recorded in
the high-shade coffee habitats and 17% were recorded in the forest habitats. Likewise,
web builders showed a strong preference for low-shade habitats (57%), high-shade
habitats (22%), or forest habitats (21%). The two most abundant species in the rainy
season were Pirata pagicola (Lycosidae), a cursorial spider that represented 20% of the
individuals collected, followed by Walckenaeria crocea (Linyphiidae) a web builder
spider (10%).
Dominant families. In the dry season, the most species rich families were
Linyphiidae (22% of species) and Theridiidae (20%). Interestingly these two families
showed an opposing pattern, with 75% of the Theridiidae species recorded in the forest
sites, (15% of the total spider richness recorded in the landscape over the dry season) and
only 35% of the species found in the coffee sites whereas 92% of the Linyphiidae species
were found in the coffee sites and only 35% were found in the forest sites. Indeed there
was a significant difference between the average number of Theridiidae species in the
forest (1. 30 ± 0.40) and the coffee sites (0.44 ± 0.13) (W = 82.5, p = 0.044). On the other
hand, Linyphiidae species richness was higher in coffee (3.0 ± 0.21) than in forest (1.8 ±

17
0.25) (W=216, p = 0.004). Regarding abundance, Linyphiidae represented 49% of the
total spider abundance in the landscape followed by Corinnidae (13%) and Lycosidae
(11%). In the rainy season, the two most species rich families were Theridiidae (25% of
species) and Linyphiidae (22%). In contrast to the dry season, the number of Theridiidae
species did not differ in forest and coffee sites (W = 97.5, p = 0.93). Likewise,
Linyphiidae richness did not differ between forest and coffee sites (W=78.5, p=0.37).
The most abundant families were Lycosidae (28% of individuals) and Linyphiidae (27%).
Species composition. In the dry season, species composition between forest, high
and low-shade coffee sites was very similar (R = 0.17, p = 0.01). However, the NMDS
plot (Fig. 1.5a) shows that the forests sites tended to be more distinct from coffee sites,
and also that high-shade coffee sites tended to be more similar to forest than to low-shade
coffee sites. In the rainy season, species composition did not differ between forest, high-
shade, or low-shade coffee sites (Fig. 1.5b, R = 0.099, p = 0. 04). Indeed, the NMDS plot
(Fig. 1.5b) shows that the overlap among the tree habitat types is even larger for the rainy
season.
Local and landscape influence on spider richness and abundance.
In the dry season, spider richness in the coffee landscape was correlated only with
slope (ß =-0.13, p<0.0001, R2 = 0. 20, Table 1.2). Spider richness decreased by 0.13 units
per degree of slope of the terrain. Spider abundance in the coffee landscape in the dry
season was negatively correlated with slope (p<0.0001) and leaf litter biomass (p = 0.03)
(Table 1.3).

18
In the rainy season, spider richness was negatively associated with canopy cover
and marginally with distance to the forest fragment (Table 1.2). Species richness
decreased by 0.57% for each unit increment in the percent of canopy cover.
In the dry season, spider abundance was negatively associated with the slope of
the terrain (4.45 % decrease in abundance for each degree) and with leaf litter dry
biomass (0.69 % decrease in abundance by each gr) (Table 1.3). However, the exclusion
of Walckenaeria crocea from the dataset changed the response of spider abundance, in
this case spider abundance was negatively associated with the slope of terrain (4.4%
percent of change) but not with the leaf litter dry biomass (p<0.0001), suggesting that
only the abundance of Walckenaeria crocea was negatively associated with leaf litter dry
biomass.
In the rainy season, spider abundance was negatively correlated with canopy
cover, distance to the forest and positively correlated with elevation (Table 1.3). Spider
abundance decreased by 1.28% per percentage increment in canopy cover. Likewise
spider abundance decreased by 0.06% per meter increment in distance to the forest;
whereas spider abundance increased by 0.13% per meter increment in elevation (Table
1.3). The exclusion of Pirata pagicola, the most abundant species in the dry season, did
not change the previous pattern. In other words, other members of the spider community
were associated with the same factors as this common species.
Discussion
In this study we found that the pattern of accumulated spider richness changes
across seasons, with the high shade habitat harboring more species in the dry season but
less species over the rainy season. In contrast, we also found that the pattern of local
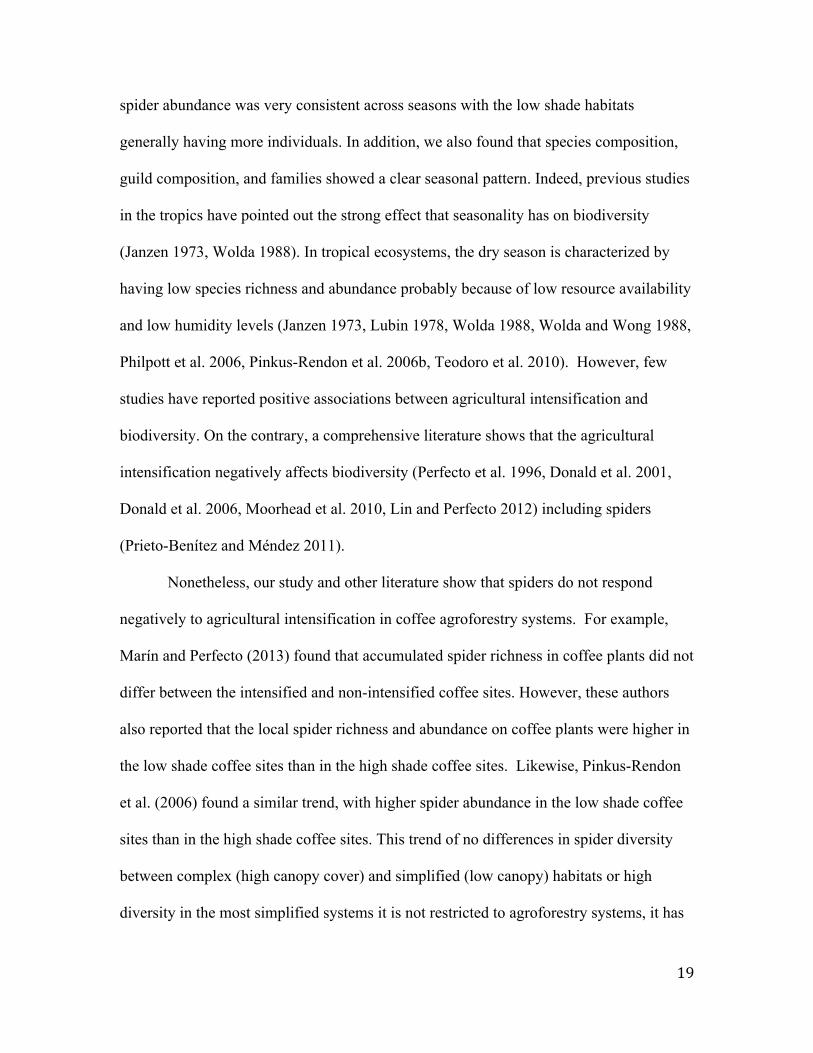
19
spider abundance was very consistent across seasons with the low shade habitats
generally having more individuals. In addition, we also found that species composition,
guild composition, and families showed a clear seasonal pattern. Indeed, previous studies
in the tropics have pointed out the strong effect that seasonality has on biodiversity
(Janzen 1973, Wolda 1988). In tropical ecosystems, the dry season is characterized by
having low species richness and abundance probably because of low resource availability
and low humidity levels (Janzen 1973, Lubin 1978, Wolda 1988, Wolda and Wong 1988,
Philpott et al. 2006, Pinkus-Rendon et al. 2006b, Teodoro et al. 2010). However, few
studies have reported positive associations between agricultural intensification and
biodiversity. On the contrary, a comprehensive literature shows that the agricultural
intensification negatively affects biodiversity (Perfecto et al. 1996, Donald et al. 2001,
Donald et al. 2006, Moorhead et al. 2010, Lin and Perfecto 2012) including spiders
(Prieto-Benítez and Méndez 2011).
Nonetheless, our study and other literature show that spiders do not respond
negatively to agricultural intensification in coffee agroforestry systems. For example,
Marín and Perfecto (2013) found that accumulated spider richness in coffee plants did not
differ between the intensified and non-intensified coffee sites. However, these authors
also reported that the local spider richness and abundance on coffee plants were higher in
the low shade coffee sites than in the high shade coffee sites. Likewise, Pinkus-Rendon
et al. (2006) found a similar trend, with higher spider abundance in the low shade coffee
sites than in the high shade coffee sites. This trend of no differences in spider diversity
between complex (high canopy cover) and simplified (low canopy) habitats or high
diversity in the most simplified systems it is not restricted to agroforestry systems, it has
20
been also reported in natural ecosystems. For example, Hurd and Fagan (1992) reported
that cursorial spiders preferred herbaceous habitats rather than forested habitats probably
because herbaceous habitats had more prey availability. Furthermore, spider diversity
may not vary along a successional habitat gradient (Mallis and Hurd 2005, Pinkus-
Rendon et al. 2006b). This suggests that ground spiders may prefer more open habitats
either due to higher prey availability (Hurd and Fagan 1992) or that they show no
preferences among habitats (Mallis and Hurd 2005). Light backgrounds allow better
conspecific recognition in hunter spiders (lycosids) (Uetz et al. 2011), thus it is possible
that light backgrounds such as those recorded in the low-shade coffee may have
contributed the pattern. Finally, another factor that may have contributed to the response
of spiders to local intensification is dispersal. Spiders are well known for their dispersal
capabilities thorough ballooning and walking (Bell et al. 2005, Gardiner et al. 2010).
Spiders rely on wind conditions and warmer temperatures to balloon, however, they do
not have control of where they will arrive (Bell et al. 2005). Thus, it seems plausible that
spiders may have more success landing in sites with low canopy cover than in sites with
high canopy cover.
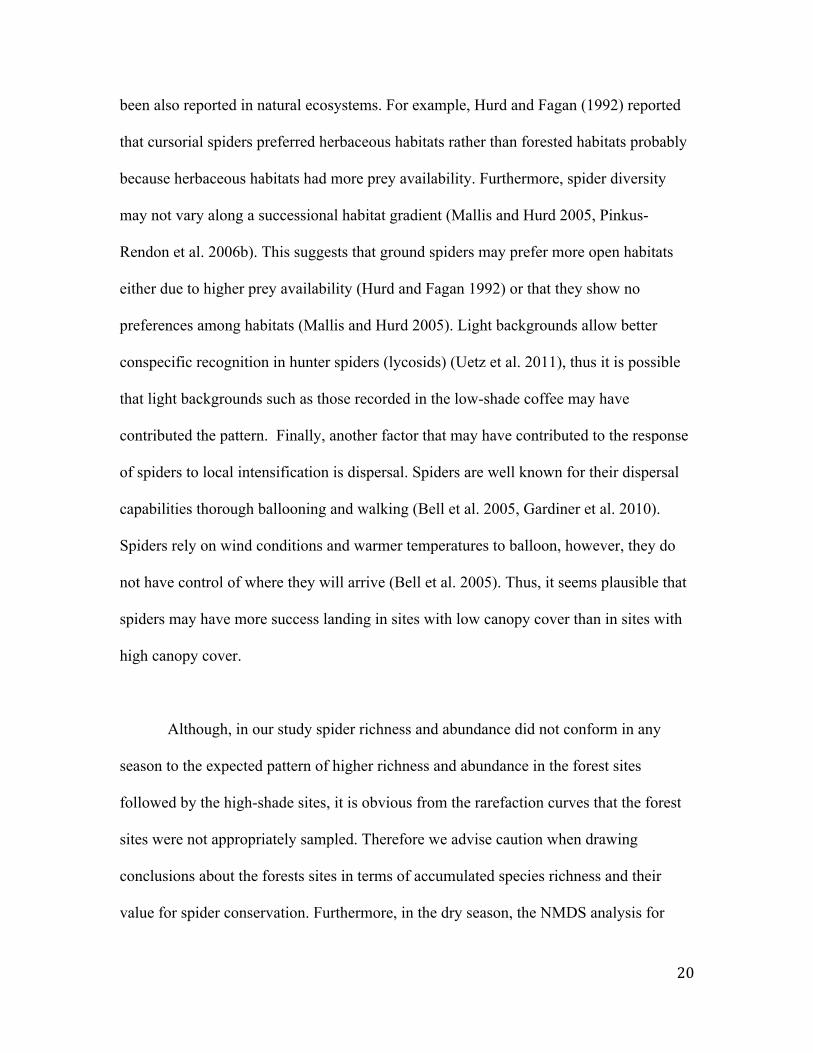
Although, in our study spider richness and abundance did not conform in any
season to the expected pattern of higher richness and abundance in the forest sites
followed by the high-shade sites, it is obvious from the rarefaction curves that the forest
sites were not appropriately sampled. Therefore we advise caution when drawing
conclusions about the forests sites in terms of accumulated species richness and their
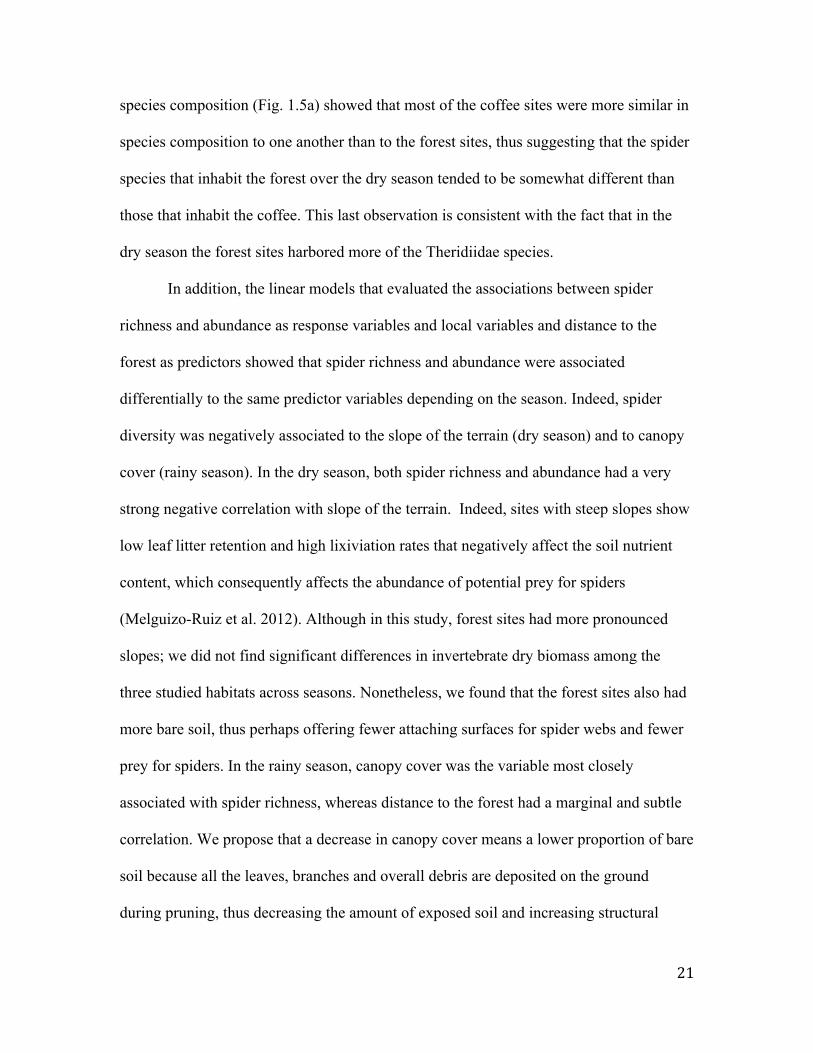
value for spider conservation. Furthermore, in the dry season, the NMDS analysis for
21
species composition (Fig. 1.5a) showed that most of the coffee sites were more similar in
species composition to one another than to the forest sites, thus suggesting that the spider
species that inhabit the forest over the dry season tended to be somewhat different than
those that inhabit the coffee. This last observation is consistent with the fact that in the
dry season the forest sites harbored more of the Theridiidae species.
In addition, the linear models that evaluated the associations between spider
richness and abundance as response variables and local variables and distance to the
forest as predictors showed that spider richness and abundance were associated
differentially to the same predictor variables depending on the season. Indeed, spider
diversity was negatively associated to the slope of the terrain (dry season) and to canopy
cover (rainy season). In the dry season, both spider richness and abundance had a very
strong negative correlation with slope of the terrain. Indeed, sites with steep slopes show
low leaf litter retention and high lixiviation rates that negatively affect the soil nutrient
content, which consequently affects the abundance of potential prey for spiders
(Melguizo-Ruiz et al. 2012). Although in this study, forest sites had more pronounced
slopes; we did not find significant differences in invertebrate dry biomass among the
three studied habitats across seasons. Nonetheless, we found that the forest sites also had
more bare soil, thus perhaps offering fewer attaching surfaces for spider webs and fewer
prey for spiders. In the rainy season, canopy cover was the variable most closely
associated with spider richness, whereas distance to the forest had a marginal and subtle
correlation. We propose that a decrease in canopy cover means a lower proportion of bare
soil because all the leaves, branches and overall debris are deposited on the ground
during pruning, thus decreasing the amount of exposed soil and increasing structural
22
complexity. Leaf litter and woody debris create structural complexity that provides sites
for web attachment as well hiding places for cursorial predators thus decreasing
intraguild predation in spiders and other predators (Bultman and Uetz 1982, Finke and
Denno 2002, 2006, Castro and Wise 2009). Although a decrease in canopy cover also
could be interpreted as fewer trees and therefore less biomass deposition on the ground,
Inga trees, which were more abundant in low-shade coffee sites, have been reported as
excellent contributors of biomass to the ground (Szott et al. 1994). Furthermore, some
lycosids prefer habitats that receive plenty of sunlight (Uetz et al. 2011), so spiders can
perceive their conspecifics and start courtship. Notably, across seasons most of the
hunters, many of them lycosids, were more abundant in low-shade coffee habitats. Thus
is possible that the decrease in bare soil due to the deposition of leaves, branches and
debris via pruning combined with open canopies favored spider diversity.
Similar to other studies with other organisms (Perfecto and Vandermeer 2002,
Klein 2009, Moorhead et al. 2010), we found that spider abundance was negatively
associated with distance to the nearest forest. However, this association was only present
in the rainy season and was quite weak. Our results also show that coffee plantations have
a diverse spider community and that over the dry season their species composition tends
to be different from the forest sites. Remarkably, over the rainy season, the subtle
separation in species composition between forest and coffee sites disappeared, thus
suggesting that at this time of the year spider species are moving more between the forest
and coffee plantations probably because of the greater species pool present in the rainy
season.

23
The effect of elevation on species richness has been studied extensively because
both productivity and species richness tend to decline with elevation (Rahbek 2005).
However, the relationship between elevation and abundance has been studied less often.
Consistent with our results two other studies in the tropics have found that spider
abundance increases with elevation (Russellsmith and Stork 1994, Stenchly et al. 2011).
Stenchly et al. (2011) reported that the abundance of spider webs in cacao trees increased
with elevation. Likewise, Russellsmith and Stork (1994) found that arboreal spider
density went up as elevation increased. It is possible that these results are due in part to
the relatively short elevational range covered by these studies (Russellsmith and Stork [0-
1350 masl], Stenchly et al. [400-950 masl], this study [800-1450 masl]).
In conclusion, we found that the pattern of accumulated spider richness across
habitat changed over seasons, thus suggesting that spiders tended to favor the high shade
coffee sites in the dry season, but not in the rainy season. Simultaneously, mean local
spider richness and abundance are or tend to be higher in the low-shade coffee than in the
two other habitats. A final caution must be added; although local spider richness and
abundance tended to be higher in the low shade system, these are not the most intensive
of all sun coffee management regimes. We suggest that it is the strategy of keeping trees
in the coffee plantations and pruning them constantly that may support this increase in
spider diversity

24
Figure 1.1. Coffee landscape in the Soconusco region, in Chiapas, Mexico. Dots represent sampled sites

25
Figure 1.2. Coffee sites separated in low-shade (yellow) and high-shade (dark brown according to the PCA based on tree richness, tree density, canopy cover and proportion of Inga trees (axis 1) and canopy cover (axis 2)

26
Figure 1.3. Individual based rarefaction curves for high-shade, low-shade and forest habitats in both the dry and rainy seasons
27
Figure 1. 4. Average spider richness and abundance in high-shade coffee (H), low-shade coffee (L) and forest (F) sites in both dry (a) and rainy (b) seasons. C stands for both high- and low-shade-coffee sites pooled together

28
Figure 1.5. Non-metric multidimensional scaling plots for the ground spider community found in the coffee landscape over the dry (a) and rainy (b) seasons

29
Table 1.1. Habitat characteristics in 2011 for both dry and rainy seasons in forest and coffee sites in a coffee landscape in Southern Mexico
* GLM with negative binomial distribution does not provide an F statistic
Forest High L ow F/t P shade shade statistic value
Management variablesCanopy cover (%) dry season 96.45a ± 1.42 77.04b ± 3.11 41.37c ± 3.91 72.15 <0.0001
Canopy cover (%) rainy season 95.83a ± 1.83 74.97b ± 2.91 31.16c ± 4.81 68.52 <0.0001
Tree species dry season 21.5a ± 1.61 6.073b ± 0.52 4.42b ± 0.71 73.86 <0.0001
Tree species rainy season 20.7a ± 1.95 6.90b ± 0.65 3.85c ± 0.44 77.15 <0.0001
Tree density dry season 46a ± 2.97 13.69b ± 1.49 8.21c ± 0.85 112 <0.0001
Tree density rainy season 45.75a ±3.89 14.82b ± 1.66 8.43c ± 0.94 80.3 <0.0001
Proportion of Inga trees dry season 0.47a ±0.04 0.65b ± 0.07 2.05 0.051
Proportion of Inga trees rainy season 0.46a ±0.04 0.69b ± 0.07 3.18 0.04
Local variablesLeaf litter depth (cm) dry season 4.91a ± 0.38 4.04b ± 0.29 3.26b ± 0.28 5.83 0.006
Leaf litter depth (cm) rainy season 3.67 ± 0.41 4.05 ± 0.40 4.17 ± 0.29 0.22 0.66
Leaf litter dry biomass (gr) dry season 59.33 ± 5.42 52.5 ± 4.73 46.49 ± 2.94 2.13 0.13
Leaf litter dry biomass (gr) rainy season 41.19 ± 4.40 37.85 ± 3.49 45.30 ±5.87 0.53 0.6
Soil cover (%) rainy season 75.59a ± 4.74 87.18b ± 2.85 88.41b ± 2.99 3.81 0.03
Invertebrate dry biomass (gr/m2) dry season 0.31 ± 0.04 0.351 ± 0.04 0.23 ± 0.03 2.62 0.08
Invertebrate dry biomass (gr/m2) rainy season 0.37 ± 0.13 0.32 ± 0.04 0.44 ± 0.07 0.69 0.51
Orthopteran abundance rainy season 28.87a ± 1.28 33.7a ± 0.8 66.09b ± 6.1 * 0.02
Landscape variableDistance to forest (m) dry season 294.8a ± 67.6 604.14b ± 75.4 -3.05 0.005
Distance to forest (m) rainy season 387.8 ±90.1 488.21 ± 68.2 0.88 0.385
Environmental variablesElevation (masl) dry season 1005 ± 64.7 944.5 ± 39.3 983.4 ± 37.3 0.42 0.66
Elevation (masl) rainy season 1049 ± 76.1 904.2 ± 25.7 1004 ± 42.7 2.3 0.12
Slope of the terrain (°) dry season 30.31a ± 2.5 18.70b ± 2.6 15.99b ± 1.7 9.9 <0.0001
Slope of the terrain (°) rainy season 28.80a ± 2.8 15.7b ± 2.7 16.51b ± 1.7 8.6 0.001

30
Table 1.2. Potential drivers of spider richness in a coffee landscape during the dry and rainy seasons of 2011
Season Variable Estimate Standard error P-value R2 % change
DryIntercept 10.24 0.97 <0.0001 0.20Slope (O) -0.13 0.042 0.005
RainyIntercept 2.65 0.210 <0.0001Canopy cover (%) -0.0057 0.0024 0.017 0.57Distance to forest (m) -0.00046 0.0002 0.069

31
Table 1.3. Potential drivers of spider abundance in a coffee landscape during the dry and rainy season of 2011
Season Variable Estimate Standard error P-value % of change
DryIntercept 4.11 0.176 < 0.0001Slope (O) -0.05 0.005 < 0.0001 -4.45leaf litter biomass (gr) -0.01 0.003 0.03 -0.69
RainyIntercept 2.21 0.42 < 0.0001Canopy cover (%) -0.013 0.0026 < 0.0001 -1.28Elevation (m) 0.0013 0.0004 < 0.0001 0.13Distance to forest (m) -0.0006 0.0003 0.028 * -0.06

32
Acknowledgements
B. Chilel and C. Pérez Velázquez provided invaluable field assistance. We thank
the owners of Fincas Irlanda, Hamburgo, San Francisco, Genova, Rancho Alegre,
Chiripa, Maravillas, Santa Anita and San Enrique for allowing us to conduct research in
their properties. M. Hunter, I. Perfecto and J. Vandermeer read previous drafts of this
manuscript and provided helpful insights. M. Draney provided help with Linyphiidae
identification; D. Childers provided statistical advice, M. Martínez Icó identified tree
species; J. Rojas and E. Chamé provided invaluable logistic help. L. Marín was funded by
scholarship 185699 granted by the National Council of Science and Technology
(CONACYT) in Mexico, the School of Natural Resources and Environment and the
Rackham Graduate School both at the University of Michigan. Additional funds were
provided by an NSF DEB-1020096 granted to S. Philpott and SNRE funds granted to I.
Perfecto

33
References Avelino, J., A. Romero-Gurdian, H. F. Cruz-Cuellar, and F. A. J. Declerck. 2012.
Landscape context and scale differentially impact coffee leaf rust, coffee berry borer, and coffee root-knot nematodes. Ecological Applications 22:584-596.
Balvanera, P., A. B. Pfisterer, N. Buchmann, J. S. He, T. Nakashizuka, D. Raffaelli, and B. Schmid. 2006. Quantifying the evidence for biodiversity effects on ecosystem functioning and services. Ecology Letters 9:1146-1156.
Beckerman, A. P., M. Uriarte, and O. J. Schmitz. 1997. Experimental evidence for a behavior-mediated trophic cascade in a terrestrial food chain. Proceedings of the National Academy of Sciences of the United States of America 94:10735-10738.
Bell, J. R., D. A. Bohan, E. M. Shaw, and G. S. Weyman. 2005. Ballooning dispersal using silk: world fauna, phylogenies, genetics and models. Bulletin of Entomological Research 95:69-114.
Borcard, D., F. Gillet, P. Legendre, and SpringerLink. 2011. Numerical Ecology with R. Springer Science+Business Media, LLC, New York, NY.
Bruggisser, O. T., M. H. Schmidt-Entling, and S. Bacher. 2010. Effects of vineyard management on biodiversity at three trophic levels. Biological Conservation 143:1521-1528.
Bultman, T. L. and G. W. Uetz. 1982. Abundance and community structure of forest floor spiders following litter manipulation. Oecologia 55:34-41.
Castro, A. and D. H. Wise. 2009. Influence of fine woody debris on spider diversity and community structure in forest leaf litter. Biodiversity and Conservation 18:3705-3731.
Clough, Y., A. Holzschuh, D. Gabriel, T. Purtauf, D. Kleijn, A. Kruess, I. Steffan-Dewenter, and T. Tscharntke. 2007a. Alpha and beta diversity of arthropods and plants in organically and conventionally managed wheat fields. Journal of Applied Ecology 44:804-812.
Clough, Y., A. Kruess, D. Kleijn, and T. Tscharntke. 2005. Spider diversity in cereal fields: comparing factors at local, landscape and regional scales. Journal of Biogeography 32:2007-2014.
Clough, Y., A. Kruess, and T. Tscharntke. 2007b. Organic versus conventional arable farming systems: Functional grouping helps understand staphylinid response. Agriculture Ecosystems & Environment 118:285-290.
Coddington, J. A. and H. W. Levi. 1991. Systematics and evolution of spiders (araneae). Annual Review of Ecology and Systematics 22:565-592.
De la Mora, A., C. Murnen, and S. Phillpott. 2013. Local and landscape drivers of biodiversity of four groups of ants in coffee landscapes. Biodiversity and Conservation.

34
Donald, P. F., R. E. Green, and M. F. Heath. 2001. Agricultural intensification and the collapse of Europe's farmland bird populations. Proceedings of the Royal Society B-Biological Sciences 268:25-29.
Donald, P. F., F. J. Sanderson, I. J. Burfield, and F. P. J. van Bommel. 2006. Further evidence of continent-wide impacts of agricultural intensification on European farmland birds, 1990-2000. Agriculture Ecosystems & Environment 116:189-196.
Faraway, J. J. 2006. Extending the linear model with R: generalized linear, mixed effects and nonparametric regression models. Chapman & Hall/CRC, Boca Raton.
Finke, D. L. and R. F. Denno. 2002. Intraguild predation diminished in complex-structured vegetation: Implications for prey suppression. Ecology 83:643-652.
Finke, D. L. and R. F. Denno. 2006. Spatial refuge from intraguild predation: implications for prey suppression and trophic cascades. Oecologia 149:265-275.
Foley, J. A., N. Ramankutty, K. A. Brauman, E. S. Cassidy, J. S. Gerber, M. Johnston, N. D. Mueller, C. O'Connell, D. K. Ray, P. C. West, C. Balzer, E. M. Bennett, S. R. Carpenter, J. Hill, C. Monfreda, S. Polasky, J. Rockstrom, J. Sheehan, S. Siebert, D. Tilman, and D. P. M. Zaks. 2011. Solutions for a cultivated planet. Nature 478:337-342.
Gabriel, D. and T. Tscharntke. 2007. Insect pollinated plants benefit from organic farming. Agriculture Ecosystems & Environment 118:43-48.
Gardiner, M. M., D. A. Landis, C. Gratton, N. Schmidt, M. O'Neal, E. Mueller, J. Chacon, and G. E. Heimpel. 2010. Landscape composition influences the activity density of Carabidae and Arachnida in soybean fields. Biological Control 55:11-19.
Gotelli, N. J. and A. M. Ellison. 2012. A primer of ecological statistics. 2nd Edition edition. Sinauer Associates., Sunderland, Massachusetts, USA.
Hofer, H. and R. Ott. 2009. Estimating biomass of Neotropical spiders and other arachnids (Araneae, Opiliones, Pseudoscorpiones, Ricinulei) by mass-length regressions. Journal of Arachnology 37:160-169.
Hogg, B. N. and K. M. Daane. 2013. Contrasting landscape effects on species diversity and invasion success within a predator community. Diversity and Distributions 19:281-293.
Holzschuh, A., I. Steffan-Dewenter, and T. Tscharntke. 2008. Agricultural landscapes with organic crops support higher pollinator diversity. Oikos 117:354-361.
Hurd, L. E. and W. F. Fagan. 1992. Cursorial spiders and succession - age or habitat structure. Oecologia 92:215-221.
Janzen, D. H. 1973. Sweep samples of tropical foliage insects - effects of seasons, vegetation types, elevation, time of day, and insularity. Ecology 54:687-708.
Kerzicnik, L. M., F. B. Peairs, P. E. Cushing, M. L. Draney, and S. C. Merrill. 2013. Spider Fauna of Semiarid Eastern Colorado Agroecosystems: Diversity, Abundance, and Effects of Crop Intensification. Environmental Entomology 42:131-142.

35
Klein, A. M. 2009. Nearby rainforest promotes coffee pollination by increasing spatio-temporal stability in bee species richness. Forest Ecology and Management 258:1838-1845.
Lin, B. B. and I. Perfecto. 2012. Coffee agroforestry systems and the benefits of biodiversity for farmers.in S. J.A., G. A.A., and C. F. Estades, editors. Biodiversity conservation in agroforestry landscapes:challenges and opportunities. Universidad de Chile Press (Editorial Universitaria). Santiago, Chile.
Lubin, Y. D. 1978. Seasonal abundance and diversity of web-building spiders in relation to habitat structure on Barro-Colorado-island, Panama. Journal of Arachnology 6:31-51.
Mallis, R. E. and L. E. Hurd. 2005. Diversity among ground-dwelling spider assemblages: Habitat generalists and specialists. Journal of Arachnology 33:101-109.
Marín, L. and I. Perfecto. 2013. Spider diversity in coffee agroecosystems: The influence of agricultural intensification and aggressive ants. Environmental Entomology. 42: 204-213.
Melguizo-Ruiz, N., O. Verdeny-Vilalta, M. A. Arnedo, and J. Moya-Larano. 2012. Potential drivers of spatial structure of leaf-litter food webs in south-western European beech forests. Pedobiologia 55:311-319.
Moguel, P. and V. M. Toledo. 1999. Biodiversity conservation in traditional coffee systems of Mexico. Conservation Biology 13:11-21.
Moorhead, L. C., S. M. Philpott, and P. Bichier. 2010. Epiphyte biodiversity in the coffee agricultural matrix: Canopy stratification and distance from forest fragments. Conservation Biology 24:737-746.
Oberg, S., B. Ekbom, and R. Bommarco. 2007. Influence of habitat type and surrounding landscape on spider diversity in Swedish agroecosystems. Agriculture Ecosystems & Environment 122:211-219.
Perfecto, I., R. A. Rice, R. Greenberg, and M. E. VanderVoort. 1996. Shade coffee: A disappearing refuge for biodiversity. Bioscience 46:598-608.
Perfecto, I. and J. Vandermeer. 2002. Quality of agroecological matrix in a tropical montane landscape: Ants in coffee plantations in southern Mexico. Conservation Biology 16:174-182.
Philpott, S. M., B. B. Lin, S. Jha, and S. J. Brines. 2008. A multi-scale assessment of hurricane impacts on agricultural landscapes based on land use and topographic features. Agriculture Ecosystems & Environment 128:12-20.
Philpott, S. M., I. Perfecto, and J. Vandermeer. 2006. Effects of management intensity and season on arboreal ant diversity and abundance in coffee agroecosystems. Biodiversity and Conservation 15:139-155.

36
Pinkus-Rendon, M. A., G. Ibarra-Núñez, V. Parra-Tabla, and Y. Hénaut. 2006a. Spider diversity in coffee plantations with different management in Southeast Mexico. The Journal of Arachnology 34:104-112.
Pinkus-Rendon, M. A., J. L. Leon-Cortes, and G. Ibarra-Nunez. 2006b. Spider diversity in a tropical habitat gradient in Chiapas, Mexico. Diversity and Distributions 12:61-69.
Platnick, N. I. 2013. The world spider catalog, version 13.5. http://research.amnh.org/iz/spiders/catalog. DOI: 10.5531/db.iz.0001. American Museum of Natural History.
Purtauf, T., I. Roschewitz, J. Dauber, C. Thies, T. Tscharntke, and V. Wolters. 2005. Landscape context of organic and conventional farms: Influences on carabid beetle diversity. Agriculture Ecosystems & Environment 108:165-174.
Rahbek, C. 2005. The role of spatial scale and the perception of large-scale species-richness patterns. Ecology Letters 8:224-239.
Romero-Alvarado, Y., L. Soto-Pinto, L. Garcia-Barrios, and J. F. Barrera-Gaytan. 2002. Coffee yields and soil nutrients under the shades of Inga sp vs. multiple species in Chiapas, Mexico. Agroforestry Systems 54:215-224.
Roschewitz, I., D. Gabriel, T. Tscharntke, and C. Thies. 2005. The effects of landscape complexity on arable weed species diversity in organic and conventional farming. Journal of Applied Ecology 42:873-882.
Russellsmith, A. and N. E. Stork. 1994. Abundance and diversity of spiders from the canopy of tropical rain-forests with particular reference to Sulawesi, Indonesia. Journal of Tropical Ecology 10:545-558.
Schmidt, M. H., A. Lauer, T. Purtauf, C. Thies, M. Schaefer, and T. Tscharntke. 2003. Relative importance of predators and parasitoids for cereal aphid control. Proceedings of the Royal Society B-Biological Sciences 270:1905-1909.
Schmidt, M. H. and T. Tscharntke. 2005a. Landscape context of sheetweb spider (Araneae : Linyphiidae) abundance in cereal fields. Journal of Biogeography 32:467-473.
Schmidt, M. H. and T. Tscharntke. 2005b. The role of perennial habitats for Central European farmland spiders. Agriculture Ecosystems & Environment 105:235-242.
Schmidt-Entling, M. H. and J. Dobeli. 2009. Sown wildflower areas to enhance spiders in arable fields. Agriculture Ecosystems & Environment 133:19-22.
Schmitz, O. J. 2008. Effects of predator hunting mode on grassland ecosystem function. Science 319:952-954.
Schmitz, O. J., A. P. Beckerman, and K. M. Obrien. 1997. Behaviorally mediated trophic cascades: Effects of predation risk on food web interactions. Ecology 78:1388-1399.
Stenchly, K., Y. Clough, D. Buchori, and T. Tscharntke. 2011. Spider web guilds in cacao agroforestry - comparing tree, plot and landscape-scale management. Diversity and Distributions 17:748-756.

37
Stenchly, K., Y. Clough, and T. Tscharntke. 2012. Spider species richness in cocoa agroforestry systems, comparing vertical strata, local management and distance to forest. Agriculture Ecosystems & Environment 149:189-194.
Szott, L. T., C. A. Palm, and C. B. Davey. 1994. Biomass and litter accumulation under managed and natural tropical fallows. Forest Ecology and Management 67:177-190.
Team, R. C. 2012. R: A language and environment for statistical computing. R Foundation for Statistical Computing, Vienna, Austria.
Teodoro, A. V., L. Sousa-Souto, A. M. Klein, and T. Tscharntke. 2010. Seasonal Contrasts in the Response of Coffee Ants to Agroforestry Shade-Tree Management. Environmental Entomology 39:1744-1750.
Tscharntke, T., R. Bommarco, Y. Clough, T. O. Crist, D. Kleijn, T. A. Rand, J. M. Tylianakis, S. van Nouhuys, and S. Vidal. 2007. Conservation biological control and enemy diversity on a landscape scale. Biological Control 43:294-309.
Tscharntke, T., A. M. Klein, A. Kruess, I. Steffan-Dewenter, and C. Thies. 2005. Landscape perspectives on agricultural intensification and biodiversity - ecosystem service management. Ecology Letters 8:857-874.
Tscharntke, T., J. M. Tylianakis, T. A. Rand, R. K. Didham, L. Fahrig, P. Batary, J. Bengtsson, Y. Clough, T. O. Crist, C. F. Dormann, R. M. Ewers, J. Frund, R. D. Holt, A. Holzschuh, A. M. Klein, D. Kleijn, C. Kremen, D. A. Landis, W. Laurance, D. Lindenmayer, C. Scherber, N. Sodhi, I. Steffan-Dewenter, C. Thies, W. H. van der Putten, and C. Westphal. 2012. Landscape moderation of biodiversity patterns and processes - eight hypotheses. Biological Reviews 87:661-685.
Ubick, D., P. Paquin, P. E. Cushing, V. D. Roth, N. Dupérré, and S. American Arachnological. 2005. Spiders of North America: an identification mannual. American Arachnological Society, [United States].
Uetz, G. W., D. L. Clark, J. A. Roberts, and M. Rector. 2011. Effect of visual background complexity and light level on the detection of visual signals of male Schizocosa ocreata wolf spiders by female conspecifics. Behavioral Ecology and Sociobiology 65:753-761.
Winfree, R., N. M. Williams, H. Gaines, J. S. Ascher, and C. Kremen. 2008. Wild bee pollinators provide the majority of crop visitation across land-use gradients in New Jersey and Pennsylvania, USA. Journal of Applied Ecology 45:793-802.
Wolda, H. 1988. Insect seasonality - why. Annual Review of Ecology and Systematics 19:1-18.
Wolda, H. and M. Wong. 1988. Tropical insect diversity and seasonality - sweep-samples vs light-traps. Proceedings of the Koninklijke Nederlandse Akademie Van Wetenschappen Series C-Biological and Medical Sciences 91:203-216.

38
Woltz, J. M., R. Isaacs, and D. A. Landis. 2012. Landscape structure and habitat management differentially influence insect natural enemies in an agricultural landscape. Agriculture Ecosystems & Environment 152:40-49.

39
CHAPTER 2
SPIDERS RESPOND TO TREE CHARACTERISTICS AND AGGRESSIVE ANTS IN A COFFEE LANDSCAPE
Abstract
Spiders are a diverse predatory taxon in agroecosystems. However, knowledge
about how local management and distance to forest influence spider diversity in tropical
agroecosystems is limited. Intensification in coffee agroecosystems includes the
elimination of a diverse canopy and its substitution with Inga trees, which tend to have
smaller tree diameters and straight trunks with few indentations. Thus Inga trees may
offer fewer nesting sites for web building spiders and also less hiding spaces for hunting
spiders. Here we ask the following questions. What are the relationships between tree
characteristics and the spider diversity associated with the trunks of shade trees? Do
aggressive ants influence the spider community and biomass? Does the species richness
and abundance of spiders vary with percent of canopy cover and distance to forest? In a
coffee landscape in Southern Mexico we studied spider richness, abundance and biomass
associated with trunks of shade trees with and without the aggressive ants Azteca
instabilis in 2011 and 2012. We first located trees that had an A. instabilis nest in the
trunk and then paired them with another tree from the same species with no A. instabilis

40
nest. For each tree, we counted the number of concavities (defined as the number of
indentations and spaces between buttresses) found in the trunk, measured the diameter at
breast height, and recorded tree identity. Results show that local spider richness,
abundance and biomass were positively correlated with the number of concavities and
tree diameter. In addition, spider abundance and biomass were higher in the presence of
A. instabilis. Furthermore, Inga trees had significantly fewer concavities and smaller
diameters at breast height than did non- Inga trees and supported significantly lower local
spider richness, abundance, and biomass. Spiders showed no relationships with canopy
cover, and distance to forest. Results show that Inga trees, a key component of coffee
agricultural intensification, do not support a diverse spider community probably because
these trees are smaller than other shade trees. This study suggests that diverse agroforests,
with their consequent diversity in tree characteristics would positively affect the spider
community by including variation in tree characteristics and size.
Key words: tree trunk spiders, landscape, local factors.

41
Introduction
Spiders are an abundant and species rich taxon of generalist predators that can
affect herbivore populations and ecosystem function in natural ecosystems (Schmitz
2008, Hawlena et al. 2012) and agroecosystems (Wise et al. 1999, Schmidt et al. 2003).
Because herbivore population control is a key ecosystem service in agroecosystems, it is
important to know how agricultural management influences the distribution, richness and
abundance of one of the most diverse predatory groups in agroecosystems (Denys and
Tscharntke 2002, Merfield et al. 2004, Teodoro et al. 2011).
Studies on the influence of agricultural management on spider diversity are
contradictory. Some studies show that spider diversity is negatively affected by
management intensification (Bisseleua et al. 2013) whereas others show that spiders are
not negatively affected (Chen et al. 2011). For example, in agroforestry systems, where
the percent of canopy cover or shade tree density is a handy tool for measuring
intensification, some studies have reported that spider richness decreased in the most
intensified systems (i.e. less canopy cover) whereas other have reported the opposite.
Stenchly et al. (2011) found that local spider webs in cacao trees increased with shade
tree density (see also Stenchly et al. 2012), whereas Pinkus-Rendon et al. (2006a) and
Marin and Perfecto (2013) reported that local spider richness and abundance increased in
the most intensive system (i.e. less percent of shade canopy cover).
Other studies have found significant correlations between spiders and other
predators in the agroecosystems, specifically aggressive arboreal ants. Stenchly et al.
(2011) reported that the abundance of spider webs on cacao trees increased with the

42
presence of Philidris ants and Marin and Perfecto (2013) found that local spider richness
and abundance in coffee plants in coffee agroecosystems from Southern Mexico
increased in the presence of the arboreal ant Azteca instabilis.
Most studies in agroforestry systems have focused upon spiders in the crop
(coffee or cacao) layer and the leaf-litter layer, but none has explored the tree component
of the agroforestry system, although this is an important component to examine because
intensification of agroforestry systems usually involves a reduction in tree species
richness and density. For example, in coffee agroforestry systems the trend is to increase
the proportion of Inga trees at the expense of other shade tree species (Romero-Alvarado
et al. 2002). Furthermore, our field observations in the Soconusco region suggested that
Inga trees have smaller tree diameter and straight trunks with fewer concavities (number
of indentations and spaces between buttresses) than other trees, thus suggesting that
potentially Inga trees offer fewer nesting and hiding sites for web building and hunting
spiders respectively.
Here we ask the following questions. What are the relationships between tree
characteristics and spider diversity? Do A. instabilis ants influence the spider community
and biomass associated with the trunks of shade trees? Does local species richness or
abundance vary with percent of canopy cover, distance to the nearest forest fragment, or
elevation? We predict that local spider richness; abundance and biomass increase with
diameter at breast height and number of concavities on the trunk because trees with a
complex trunk structure and larger diameters may offer more nesting and hiding sites.
Although other studies have reported a positive association between spiders and ants in
agroforestry systems, we predict that spiders would be negatively associated with A.

43
instabilis ants. We expect a negative association because these aggressive ants build their
nests on the trunks of the trees and in close proximity with trunk dwelling spiders, thus
the ants might chase away the spiders. We also predict that spider richness and
abundance increases with increases in canopy cover, an indirect indicator of tree density
and richness, to which tree trunk dwelling spiders must be sensitive. Finally, we predict
that spider richness and abundance is negatively related with distance to the forest.
Material and Methods
Study site
Our study took place in a coffee landscape located in the Soconusco region in the
Southern state of Chiapas, Mexico. This coffee landscape covers a surface of 62 km2
(coordinates 15.202 N, 92.383 W [NW corner], 15.144 N, 92.297 W [SE corner]) of
which 94 % are covered by large coffee farms (~300 ha) and only 6 % is covered by
small remnants of evergreen tropical forest (Philpott et al. 2008). This landscape shows a
marked seasonality characterized by a dry season from December through May and a
rainy season from May to November. The studied landscape covers an elevation gradient
that ranges from 672 to 1189 meters above sea level and receives ca. 4500 mm annual
precipitation. The distance to the nearest forest fragment ranged from 68 to 996 m.
Tree and plot characteristics
In 2011 we carried out a preliminary study and sampled spiders from sixteen pairs
of shade trees for a total of thirty-two shade trees distributed in three coffee farms. We
first located trees that had an A. instabilis nest in the trunk and then paired this tree with
another tree from the same species located at least 6 m away and with no A. instabilis
nest. In total we sampled 8 shade tree species with Alchornea latifolia being represented

44
in 4 tree pairs, Syzygium jambos in 3 tree pairs, Cordia sp, Ocotea sp., and Inga
rodrigueziana in 2 tree pairs each, and Cedrella odorata, Zanthozylum sp., and Inga
micheliana in 1 tree pair each. In 2011, the distance between trees belonging to same pair
was between 6m and 30 m, whereas the distance between trees with A. instabilis nests
was approximately 50 m.
In 2012, we sampled 19 one-hectare circular plots spatially distributed in the
landscape and selected 35 pairs of trees, with and without A. instabilis nests, for a total of
70 trees. Eighteen of the tree pairs belonged to the genus Inga, the most common tree
planted in coffee farms in Mexico, and 17 were non-Inga pairs. We sampled 3 Inga
species, with I. rodrigueziana in 12 tree pairs, I. paterna in 5 tree pairs and I. micheliana
in 1 tree pair. The non-Inga species were distributed in 7 species. S. jambos was in 4 tree
pairs, Tabebuia aurea and Yucca guatemalensis were in 3 tree pairs each; Alchornea
latifolia and Ficus sp.were in 2 tree pairs each; and Ocotea sp. and Persea sp. were in 1
tree pair each. We identified active nests of A. instabilis by hitting trees with a stick and
eliciting the swarming behavior of the ants. All but three of the one-hectare circular plots
contained two pairs of trees, an Inga pair and a non-Inga pair. Three plots contained only
one pair of threes. In 2012 the distance between trees belonging to same pair was
between 10-15 m and the distance between trees with A. instabilis was approximately 25
m.
In both years for each sampled tree we recorded its species, diameter at breast
height (cm) and number of concavities (including indentations and the space between tree
buttresses) in the trunk starting at 0 m and ending at 2.5 m above ground. In 2012, for
each 1-ha plot we measured percent of canopy cover at three points established 15 m
45
away from the center of the plot and at 0º, 120º and 240º. At each point, canopy cover
readings were taken in the four cardinal directions with a hand held densiometer. In
addition, for each plot we measured the distance to the nearest forest edge using a
Geographic Information System (GIS) (Philpott et al. 2008). Elevation was taken with a
GPS unit (Garmin GPS 60).
Spider sampling
In 2011, we sampled the tree trunks in search of spiders and their webs from zero
up to 2.5 meters height. Spider individuals were collected by hand except the individuals
of Ischnothele digitata, which we were able to identify in the field. Individuals of I.
digitata (adult average body size ~ 14 mm) although concealed inside of their webs,
have whitish funnel webs that are easy to count and identify in the field (Coyle 1995); we
collected a few specimens and their webs to verify identity and thereafter counted webs.
Whenever possible, we ensured that I. digitata webs were occupied by disturbing the
spider with one aluminum wire that was inserted into the funnel web. Spider collection
was conducted from July 25 to July 30 and from August 8 to 9.
In 2012, we modified our sampling method because we suspected that the visual
sampling of trees in 2011 could have biased our results by omitting the very small
spiders, which represent the majority of spider individuals. We initially decided to sample
all trees using a beating sheet and a paintbrush. We swept the trunk with the paintbrush
and falling spiders were collected in the beating sheet. However, samples from the trees
with A. instabilis returned primarily ants and some spiders that were damaged. Therefore,
we decided to discard these samples and modify the sampling method. Trees without an
A. instabilis nest were sampled using the paintbrush and beating sheet. For trees with an
46
A. instabilis nest, we collected spiders by carefully looking in crevices and bark
irregularities and hand collected the spiders. Before and during collections we carried out
field observations on the spiders found in the presence/absence of A. instabilis and in
some selected cases we collected their webs. Although this difference in methods could
have affected our results, we think that instead it allowed us to get a good grasp of the
interactions that take place in the tree trunks since in order to try to make both methods
comparable we spent a good amount of time sampling the both trees with and without A.
instabilis.
We preserved all spiders in 95% alcohol and identified all spiders to family using
The spiders from North America (Ubick et al. 2005) and to species and morphospecies
following selected literature (Platnick 2013). Voucher specimens were deposited in the
Arachnological Collection at El Colegio de la Frontera Sur in Tapachula. For each
collected spider we measured its body length in mm and estimated dry biomass (mg)
using the body length-dry biomass equations reported elsewhere for spiders (Hofer and
Ott 2009). In the case of I. digitata and Azilia guatemalensis for which we did not collect
all individuals, we used the modal body length (I. digitata = 5 mm) and average body
length (A. guatemalensis = 3.8 mm) obtained from 10 individuals collected for
identification. For I. digitata, we used the modal instead of the average body length
because two collected adults biased the average value. Both the modal and average values
were smaller than the values reported in the literature (Coyle 1995, Alvarez-Padilla 2008)
and thus our biomass estimates are conservative.
Data analysis
47
To evaluate whether tree characteristics (diameter at the breast height and number
of concavities) varied between Inga and non-Inga trees we used t-tests. More specifically,
we tested differences in diameter at breast height and number of concavities on the trunk
on each shade tree between the Inga and the non-Inga trees. To evaluate whether spider
richness, abundance and biomass varied with tree characteristics, presence of A.
instabilis, percent of canopy cover, and distance to the forest we analyzed data with
generalized linear models. The response variables were spider richness, spider abundance
(or its surrogate, webs, in the case of the whitish funnel web), and spider biomass and the
predictor variables were number of concavities in the trunk of the sampled tree, diameter
at breast height (cm), elevation (m), presence/absence of A. instabilis, percent of canopy
cover (only for 2012) and distance to the nearest forest fragment (only for 2012). For
both years we tested differences in the average spider body length in the presence and
absence of A. instabilis with t-tests.
We checked the distribution of the residuals of the response variables by two
means. First we plotted the standardized residuals vs. the leverage. Secondly, we used the
Cook’s distance as a mean for identifying any influential points, with a cutoff value of
0.5. Error distribution for richness data was normal and therefore we used multiple linear
regressions. However, residual distribution of abundance and biomass data were not
normally distributed, therefore we used a generalized linear model with a negative
binomial distribution for abundance data, whereas for biomass we used two types of
transformations. For 2011, we used the Box-Cox transformation and for 2012 we used
the natural logarithm. We applied different transformations to the biomass data because
the same transformation did not normalize it across years.

48
Finally, for analyzing whether the spider community associated with tree trunks
differed with the presence of A. instabilis we used non-metric multidimensional scaling
(NMDS) followed by Analysis of Similarities (ANOSIM). NMDS is a technique widely
used for comparing species composition across habitats/conditions (Winfree et al. 2008,
Borcard et al. 2011, Hogg and Daane 2013). This technique creates a species composition
distance matrix between sites based on a similarity index (in this case the Bray-Curtis
similarity index), which measures how close two points are in regards to species
composition. Then sites are ranked among them according to their differences and these
ranked differences are considered for evaluating the similarity between sites through
iterative processes. Whereas ANOSIM is a test that assess the significance of the
difference in species composition between habitats/conditions. ANOSIM provides an R-
value that indicates the degree of similarity; values close to 1 indicate low similarity
among habitats/conditions whereas low values of R indicate high similarity. All analyses
were carried out with R software (R Core Team 2012) using the packages MASS and
Vegan.
Results
Tree characteristics
Tree characteristics were significantly different between Inga and non-Inga trees. Non-
Inga trees had more concavities in the trunk (19.53 ± 0.56) than Inga trees (6.79 ± 0.33)
(t-test = -6.42, p < 0.0001, Fig. 2.1a). Likewise non-Inga trees had larger diameter at
breast height (66 ± 3.26) than Inga trees (39.99 ±2.73) (t-test = -4.83, p < 0.0001, Fig.
2.1b). Furthermore, spider richness, abundance and biomass were significantly higher in
the non-Inga trees than in the Inga trees (Fig. 2.2).

49
Spider diversity
Overall, considering both years we had 1786 abundance records (1216 individuals and
570 I. digitata funnel webs) distributed across 74 spider species associated with the
trunks of the shade trees in coffee farms. In 2011 we had 673 abundance records (490
individuals and 183 I. digitata funnel webs) across 40 species whereas in 2012 we had
1113 records (726 individuals and 387 I. digitata funnel webs) across 64 species. Over
the two years the most abundant species were Ischnothele digitata (570 webs, 33 % of all
individuals/webs), Azilia guatemalensis (305 individuals, 17 %), Tidarren sp. (106
individuals, 6 %), Philoponella saginella (73 individuals, 4 %) and Mysmenopsis palpalis
(73 individuals, 4%).
Spider richness
In 2011, spider richness on the trunks of the shade trees was positively correlated with the
number of concavities on the tree trunks and negatively related to elevation (Table 2.1).
In 2012, spider richness was positively related to the number of concavities but not to any
other variable. In both years the relationship between spider richness and A. instabilis
was marginally significant but in different directions. While in 2011 spider species
richness showed a trend toward a positive association with A. instabilis, in 2012 the trend
was toward a negative association.
Spider abundance
In 2011, spider abundance was strongly and positively associated with the presence of an
A. instabilis nest on the shade trees as well to the number of concavities, but negatively
related to elevation (Table 2.2). With the presence of an A. instabilis nest on the trunk of
a shade tree, spider abundance was 74%, higher than in the absence of a nest. Spider

50
abundance increased by 7.87% with each concavity in the trunks. In 2012, spider
abundance was again strongly positively related to the presence of an A. instabilis nest in
the trunk of shade trees, as well to the number of concavities and tree diameter at breast
height. With the presence of an A. instabilis nest on the trunk of a shade tree, spider
abundance was 54% higher than in the absence of a nest. Spider abundance increased by
3.05% with each concavity in the trunks and by 1.5% with each cm in the diameter at
breast height (Table 2.2). However, the exclusion of I. digitata and A. guatemalensis, the
two most abundant spiders changed the previous pattern. In 2011 the exclusion of I.
digitata and A. guatemalensis from the data set eliminated the positive correlation of
spider abundance and A. instabilis (Table 2.2), whereas in 2012, the exclusion of I.
digitata made the correlation to vanish.
Spider biomass
In 2011 and 2012, spider biomass was positively related to the presence of an A.
instabilis nest on the shade trees and to the number of concavities on the trunks (Table
2.3). As with spider abundance, the positive relationship between spider biomass and A.
instabilis was strongly dependent upon I. digitata and A. guatemalensis. In both years,
when only other species of spiders were considered, the effect of A. instabilis disappeared
(Table 2.3).
Species composition and body length in relation to A. instabilis
Species composition varied across trees that had an A. instabilis nest and those
that did not have a nest. For 2011, the NMDS plot and the R ANOSIM value show that
the spider assemblage were significantly different in those trees that had an A. instabilis
nest and those that did not have one (R = 0.53, p = 0.001, Fig. 2.3a). For 2012, the two

51
assemblages were more similar but still showed some level of segregation (R =0.24, p =
0.001, Fig. 2.3b).
In 2011, average body length (mm) did not vary significantly between spiders
collected in the presence of A. instabilis (5.59) and its absence (5.18) (t-test = -0.38, p =
0.7). However, in 2012, average body length (mm) was significantly higher for spiders
collected in the presence of A. instabilis (3.5 ± 0.13) than in its absence (2.57 ± 0.15) (t-
test = -4.53, p < 0.0001).
Discussion
Our study shows that in coffee agroforestry systems, the species richness of
spiders found on the trunk of shade trees increases with the number of concavities found
on those trees. In addition, we found that spider abundance and biomass are positively
associated with tree characteristics, such as the number of concavities and diameter at
breast height, and to the presence of A. instabilis ants. Surprisingly, spider richness,
abundance and biomass were unrelated to canopy cover or distance to forest.
Tree trunks are a poorly explored section of trees in both natural ecosystems
(Michel et al. 2011) and agroecosystems, and this is the first study to examine the spiders
that inhabit the trunks of trees in tropical agroforestry systems. The result that tree
concavities can contribute to spider richness, abundance and biomass (Fig. 2.2) is an
important one because it suggest that tree characteristics, and not just tree density, are
important for maintaining a diverse and abundant tree spider assemblage in forestry and
agroforestry systems (Bisseleua et al. 2013). Indeed, a well-established literature has
reported that spiders are sensitive to plant structure (Wise 1993, de Souza and Martins

52
2005, Sanders et al. 2008, Pearson 2009, Podgaiski et al. 2013), and our results indicate
that larger trees with more concavities harbored more species richness, abundance and
biomass, probably because trees with these characteristics offer a more complex surface
upon which spiders may attach their webs, find prey or hide.
Our expectations about a potential negative effect of A. instabilis on spider
richness did not hold. Over the two years of study, we found no significant relationship
between local spider richness and A. instabilis. This result differs to that which we found
in the coffee layer, where local spider richness and abundance increased in the presence
of A. instabilis. Probably, this is because trees with A. instabilis were dominated by just a
few species. In regards to A. instabilis and spider abundance and biomass, our
expectations did not hold either. Rather, we found a dramatic increase in spider
abundance and biomass in the presence of A. instabilis in both years. This result suggests
that these ants are a key element for spiders associated with the trunks of shade trees.
The relationships between A. instabilis and spider abundance and biomass seem to
be driven by I. digitata and A. guatemalensis as statistical relationships were eliminated
when one or both of these species were removed from the dataset (Table 2.2). A possible
explanation for the higher abundance of these two spider species in the presence of A.
instabilis ants is that these spiders significantly prey upon the ants. Ischnothele digita is a
subsocial funnel web builder that likes to build its web in crevices, such as road banks but
also on the trunks on trees (Coyle 1995). Coyle (1995) also reported that I. digitata preys
mainly upon ants and beetles, which we corroborated in field observations and by
inspecting some webs (online supplementary materials Video 1). In our study site, we
found I. digitata almost exclusively on tree trunks that have A. instabilis nests, and

53
infrequently in road banks. Azilia guatemalensis was the second most abundant spider on
the trunks of shade trees and was also strongly associated with A. instabilis. A.
guatemalensis (adult average body size 6 mm) builds horizontal orb webs in trees
(Alvarez-Padilla 2008). A. guatemalensis was also found on trees without A. instabilis,
but at lower numbers. However, most of the times that we found A. guatemalensis in
trees without A. instabilis, there were other ants nesting on the trunks, such as
Crematogaster, suggesting that A. guatemalensis has a preference for tree trunks with
ants.
Spider assemblages in the presence of A. instabilis were not dramatically different
from those in its absence. Nonetheless, there were statistical differences between the
spider communities in both years of study (Figure 2.3). Even more, for 2012, the year for
which we have the most complete set of spiders the NMDS plot suggest that trees that did
not have an A. instabilis nest showed a more diverse spider community than trees with A.
instabilis. Indeed, most of the A. instabilis points clutter among them and seem to be a
subset of the trees without A. instabilis, except some points that reach far to the right. We
think that these points are in part due to presence of some spiders, such as A.
guatemalensis, that although reached high abundances in the presence of A. instabilis,
they were also found in the absence of A. instabilis, probably because in those trees other
ants were present.
We found no relationships between canopy cover or distance to forest, and spider
richness, abundance and biomass; however we found a negative relationship between the
response variables and elevation. Previous studies in the same coffee landscape have
shown that the local richness and abundance of ground and coffee dwelling spider was

54
higher in low shade coffee systems. We suggest that these differences in spider response
to canopy cover are probably because the tree trunk spiders studied here depend strongly
on trees, so a decrease in shade, which is related to tree density, would be
disadvantageous. Distance to the nearest forest fragment ranged from 68 to 996 m but
was unrelated to spider community structure. Although some studies have reported a
negative relationship between distance to the forest and richness and abundance of a
variety of taxa (Klein et al. 2003, Baldissera et al. 2004, Klein 2009), the available
information for spiders seems to suggest that in agroforestry systems distance to the
forest it is not an important variable. For example, Stenchly et al. (2012) found that spider
diversity in cacao agroforests did not vary with distance to nearest forest (see also
Stenchly et al. 2011). Likewise Marín et al. (Chapter 1) did not find a correlation between
distance to forest and the ground dwelling spider diversity in coffee agroforests over the
dry season. Nonetheless, Baldissera et al. (2004) reported a very strong effect of distance
to the forest on spiders at distances as short as 50m in a pasture system. Although, more
studies are needed in order to clearly elucidate the role of distance to the forest on spider
communities, the available literature suggest that in agroforests, that have relatively high
matrix quality compared to pasture systems, distance to forest might not be a very
significant predictor of spider diversity.
The relationship between elevation and spider diversity changed across years. In
2011, we found a negative relationship between elevation and spider richness and
abundance, whereas neither relationship was significant in 2012. We suggest that this
difference is because in 2011 we found fewer species, and for those spiders elevation was
a key factor.

55
Overall, this study shows that in coffee agroforests, local tree trunk spider
richness, abundance and biomass are positively associated with tree diameter, number of
concavities on the trunk, and the presence of A. instabilis ants and negatively associated
with Inga trees. These results suggest that in order to keep a diverse community of
spiders associated with the shade trees the conservation of diverse agroforestry systems,
which tend to have larger trees and fewer Inga individuals, is required.
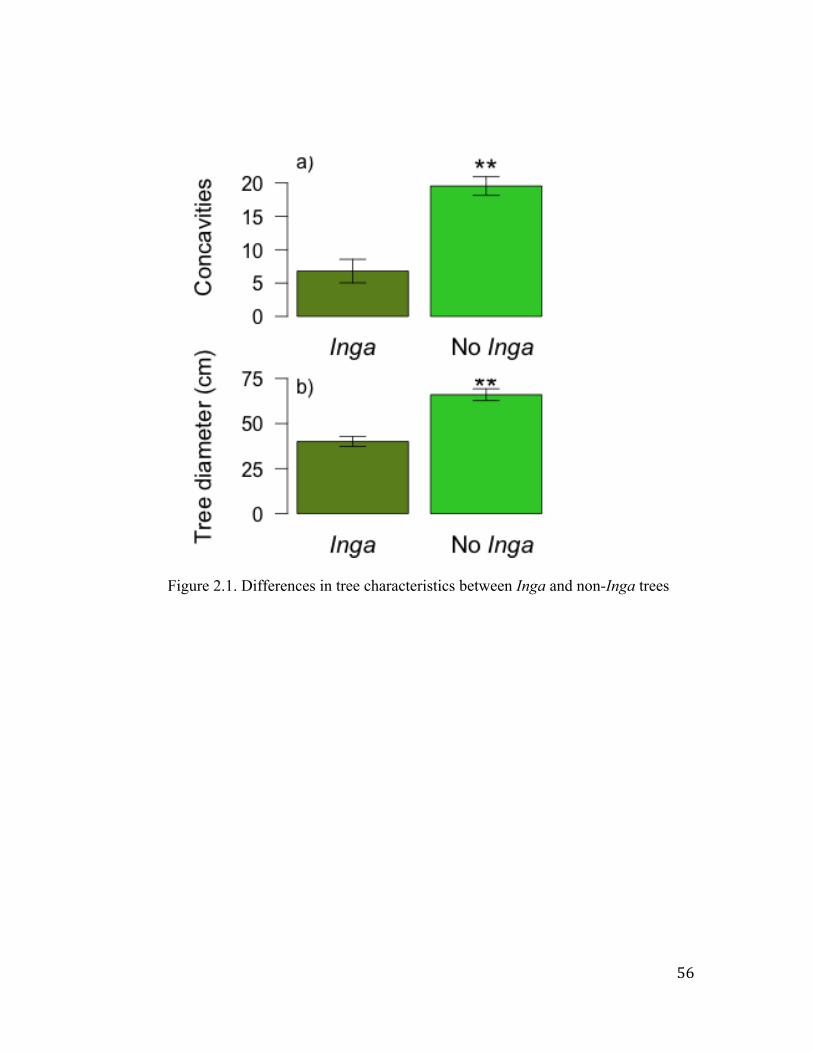
56
Figure 2.1. Differences in tree characteristics between Inga and non-Inga trees

57
Figure 2.2. Spider richness, abundance and biomass found in Inga and non-Inga trees
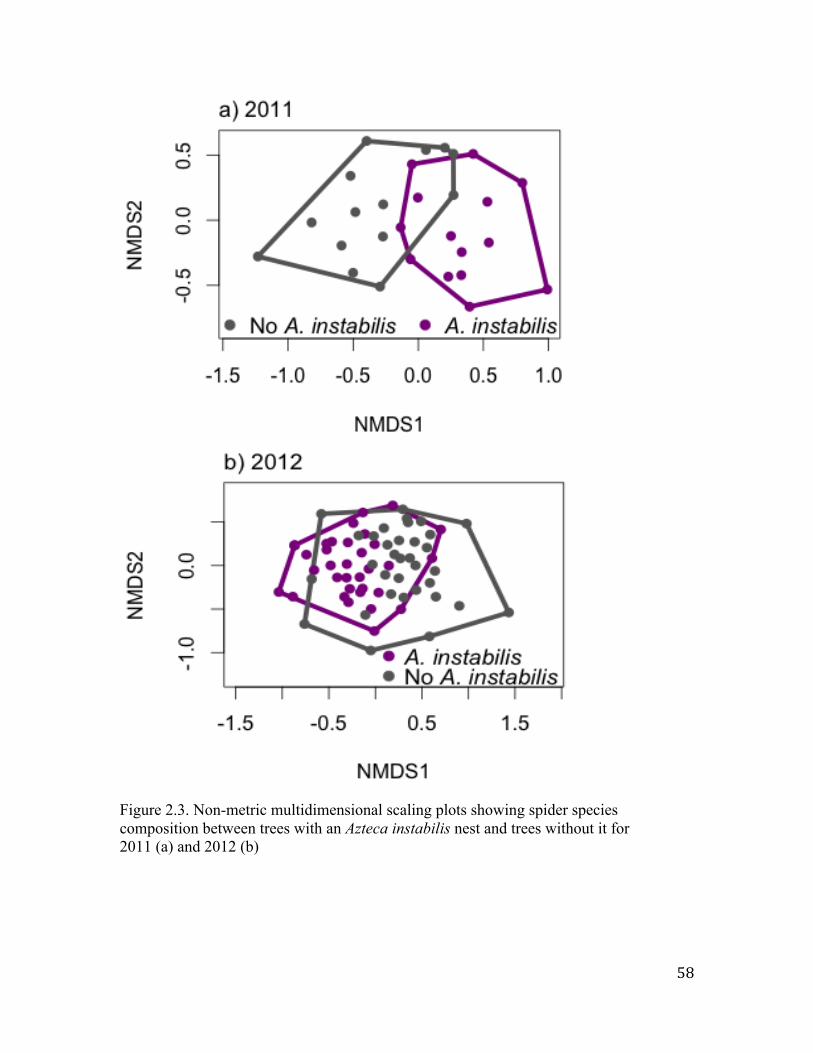
58
Figure 2.3. Non-metric multidimensional scaling plots showing spider species composition between trees with an Azteca instabilis nest and trees without it for 2011 (a) and 2012 (b)

59
Table 2.1. Associations between spider richness and tree characteristics, percent of canopy cover, distance to forest, elevation and the presence of Azteca instabilis ants
Year Variable Estimate Std. Error t-value P-value R2 Fstatistic
2011Intercept 16.03 4.448 3.60 0.001 0.572 9.03A. instabilis 1.71 0.865 1.98 0.058 .Number of concavities 0.16 0.072 2.26 0.032 *Diameter at the breast height (cm) -0.0104 0.021 -0.50 0.621Elevation (m) -0.0150 0.004 -3.68 0.001 *
2012Intercept 4.37 3.02 1.45 0.15 0.23 3.09A. instabilis -1.14 0.65 -1.75 0.08 .Diameter at the breast height (cm) 0.020 0.015 1.35 0.18Number of concavities 0.072 0.033 2.18 0.03 *Elevation (m) -0.002 0.003 -0.70 0.49Distance to forest (m) 0.002 0.002 1.23 0.22Canopy cover (%) 0.002 0.015 0.15 0.88
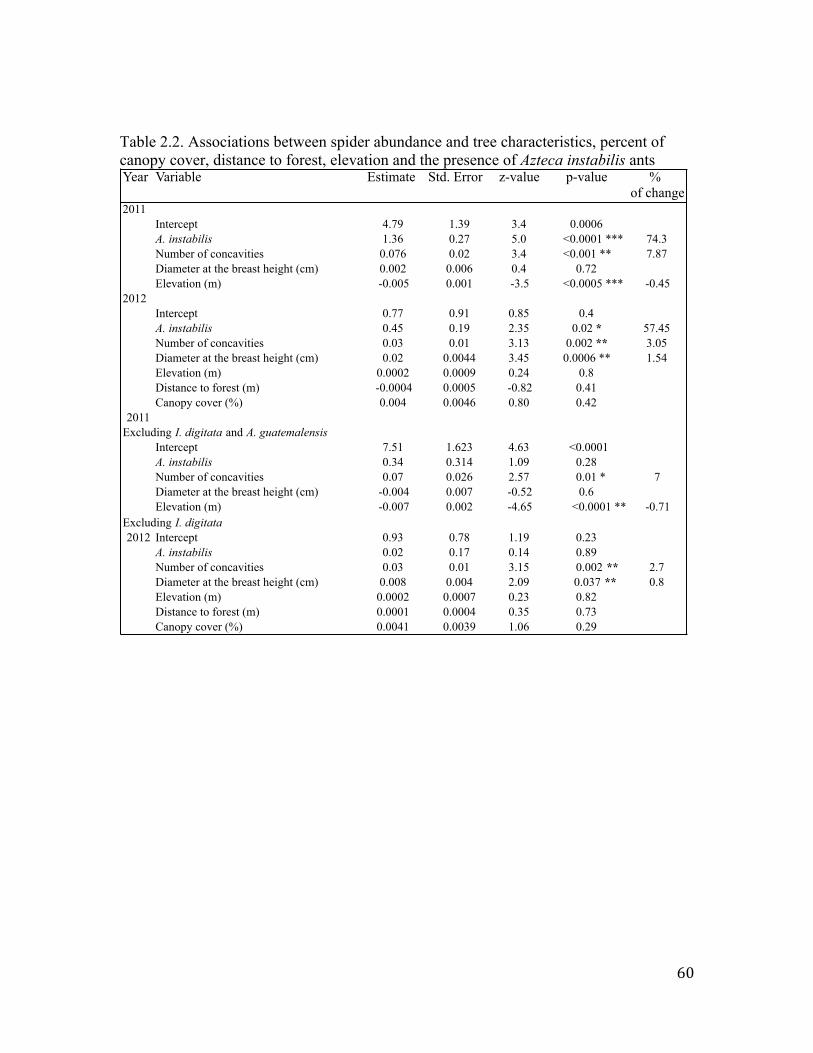
60
Table 2.2. Associations between spider abundance and tree characteristics, percent of canopy cover, distance to forest, elevation and the presence of Azteca instabilis ants
Year Variable Estimate Std. Error z-value p-value % of change
2011Intercept 4.79 1.39 3.4 0.0006A. instabilis 1.36 0.27 5.0 <0.0001 *** 74.3Number of concavities 0.076 0.02 3.4 <0.001 ** 7.87Diameter at the breast height (cm) 0.002 0.006 0.4 0.72Elevation (m) -0.005 0.001 -3.5 <0.0005 *** -0.45
2012Intercept 0.77 0.91 0.85 0.4A. instabilis 0.45 0.19 2.35 0.02 * 57.45Number of concavities 0.03 0.01 3.13 0.002 ** 3.05Diameter at the breast height (cm) 0.02 0.0044 3.45 0.0006 ** 1.54Elevation (m) 0.0002 0.0009 0.24 0.8Distance to forest (m) -0.0004 0.0005 -0.82 0.41Canopy cover (%) 0.004 0.0046 0.80 0.42
2011Excluding I. digitata and A. guatemalensis
Intercept 7.51 1.623 4.63 <0.0001A. instabilis 0.34 0.314 1.09 0.28Number of concavities 0.07 0.026 2.57 0.01 * 7Diameter at the breast height (cm) -0.004 0.007 -0.52 0.6Elevation (m) -0.007 0.002 -4.65 <0.0001 *** -0.71
Excluding I. digitata2012 Intercept 0.93 0.78 1.19 0.23
A. instabilis 0.02 0.17 0.14 0.89Number of concavities 0.03 0.01 3.15 0.002 ** 2.7Diameter at the breast height (cm) 0.008 0.004 2.09 0.037 ** 0.8Elevation (m) 0.0002 0.0007 0.23 0.82Distance to forest (m) 0.0001 0.0004 0.35 0.73Canopy cover (%) 0.0041 0.0039 1.06 0.29

61
Table 2.3. Associations between spider biomass and tree characteristics, percent of canopy cover, distance to forest, elevation and the presence of Azteca instabilis ants
Year Variable Estimate Std. Error t-value P-value R2 F
2011 Intercept 10.65 4.27 2.49 0.019 * 0.57 9.1A. instabilis 3.19 0.83 3.84 0.0007 ***Number of concavities 0.177 0.069 2.57 0.016 * Diameter at the breast height (cm) 0.011 0.020 0.57 0.57Elevation (m) -0.006 0.004 -1.52 0.14
2012Intercept 1.06 1.53 0.69 0.49 0.46 8.92A. instabilis 1.39 0.33 4.23 < 0.0001***Number of concavities 0.056 0.017 3.30 0.002 **Diameter at the breast height (cm) 0.012 0.0077 1.57 0.12Distance to forest (m) -0.0005 0.0008 -0.64 0.52Elevation (m) -0.0011 0.0015 -0.74 0.46Canopy cover (%) -0.0026 0.0078 -0.34 0.73
Excluding I. digitata and A. guatemalensis2011
Intercept 16.30 3.57 4.6 <0.0001 0.43 5.12A. instabilis -0.26 0.69 -0.4 0.7Number of concavities 0.085 0.06 1.5 0.15Diameter at the breast height (cm) -0.006 0.02 -0.4 0.7Elevation (m) -0.011 0.003 -3.3 0.003 *
2012Intercept 1.03 2.09 0.49 0.62 0.16 2.13A. instabilis 0.06 0.45 0.13 0.90Number of concavities 0.055 0.024 2.34 0.023 *Diameter at the breast height (cm) 0.006 0.011 0.57 0.57Distance to forest (m) -0.0004 0.0010 -0.37 0.71Elevation (m) -0.001 0.002 -0.60 0.55Canopy cover (%) 0.003 0.011 0.26 0.80

62
Acknowledgements
B. Chilel and C. Pérez Velázquez provided invaluable field assistance. We thank
the owners of Fincas Irlanda, Hamburgo, San Francisco, Genova, Rancho Alegre,
Chiripa, Maravillas, Santa Anita and San Enrique for allowing us to conduct research in
their properties. M.Hunter, S.Philpott and I. Perfecto provided insightful comments to
previous drafts. D. Childers provided statistical advice, J. Rojas and E. Chamé provided
invaluable logistic help. L. Marín was funded by scholarship 185699 granted by the
National Council of Science and Technology (CONACYT) in Mexico, the School of
Natural Resources and Environment and the Rackham Graduate School both at the
University of Michigan. Additional funds were provided by an NSF DEB-1020096
granted to S. Philpott and SNRE funds granted to I. Perfecto.
63
References
Alvarez-Padilla, F. 2008. Higher level systematics of the spider family Tetragnathidae and revision of the genus Metabus (Araneae). Ph.D. The George Washington University.
Balvanera, P., A. B. Pfisterer, N. Buchmann, J. S. He, T. Nakashizuka, D. Raffaelli, and B. Schmid. 2006. Quantifying the evidence for biodiversity effects on ecosystem functioning and services. Ecology Letters 9:1146-1156.
Bisseleua, H. B. D., D. Fotio, Yede, A. D. Missoup, and S. Vidal. 2013. Shade Tree Diversity, Cocoa Pest Damage, Yield Compensating Inputs and Farmers' Net Returns in West Africa. Plos One 8.
Borcard, D., F. Gillet, P. Legendre, and SpringerLink. 2011. Numerical Ecology with R. Springer Science+Business Media, LLC, New York, NY.
Chen, L. L., M. S. You, and S. B. Chen. 2011. Effects of cover crops on spider communities in tea plantations. Biological Control 59:326-335.
Coyle, F. A. 1995. A revision of the funnelweb mygalomorph spider subfamily Ischnothelinae (Araneae, Dipluridae). Bulletin of the American Museum of Natural History 226:1-133.
de Souza, A. U. T. and R. P. Martins. 2005. Foliage density of branches and distribution of plant-dwelling spiders. Biotropica 37:416-420.
Denys, C. and T. Tscharntke. 2002. Plant-insect communities and predator-prey ratios in field margin strips, adjacent crop fields, and fallows. Oecologia 130:315-324.
Hawlena, D., M. S. Strickland, M. A. Bradford, and O. J. Schmitz. 2012. Fear of Predation Slows Plant-Litter Decomposition. Science 336:1434-1438.
Hofer, H. and R. Ott. 2009. Estimating biomass of Neotropical spiders and other arachnids (Araneae, Opiliones, Pseudoscorpiones, Ricinulei) by mass-length regressions. Journal of Arachnology 37:160-169.
Hogg, B. N. and K. M. Daane. 2013. Contrasting landscape effects on species diversity and invasion success within a predator community. Diversity and Distributions 19:281-293.
Hurd, L. E. and W. F. Fagan. 1992. Cursorial spiders and succession - age or habitat structure. Oecologia 92:215-221.
Janzen, D. H. 1973. Sweep samples of tropical foliage insects - effects of seasons, vegetation types, elevation, time of day, and insularity. Ecology 54:687-708.
Klein, A. M. 2009. Nearby rainforest promotes coffee pollination by increasing spatio-temporal stability in bee species richness. Forest Ecology and Management 258:1838-1845.
Klein, A. M., I. Steffan-Dewenter, and T. Tscharntke. 2003. Pollination of Coffea canephora in relation to local and regional agroforestry management. Journal of Applied Ecology 40:837-845.

64
Lin, B. B. and I. Perfecto. 2012. Coffee agroforestry systems and the benefits of biodiversity for farmers.in S. J.A., G. A.A., and C. F. Estades, editors. Biodiversity conservation in agroforestry landscapes:challenges and opportunities. Universidad de Chile Press (Editorial Universitaria). Santiago, Chile.
Lubin, Y. D. 1978. Seasonal abundance and diversity of web-building spiders in relation to habitat structure on Barro-Colorado-island, Panama. Journal of Arachnology 6:31-51.
Mallis, R. E. and L. E. Hurd. 2005. Diversity among ground-dwelling spider assemblages: Habitat generalists and specialists. Journal of Arachnology 33:101-109.
Marin, L. and I. Perfecto. 2013. Spider Diversity in Coffee Agroecosystems: The Influence of Agricultural Intensification and Aggressive Ants. Environmental Entomology 42:204-213.
Merfield, C. N., S. D. Wratten, and S. Navntoft. 2004. Video analysis of predation by polyphagous invertebrate predators in the laboratory and field. Biological Control 29:5-13.
Michel, A. K., S. Winter, and A. Linde. 2011. The effect of tree dimension on the diversity of bark microhabitat structures and bark use in Douglas-fir (Pseudotsuga menziesii var. menziesii). Canadian Journal of Forest Research-Revue Canadienne De Recherche Forestiere 41:300-308.
Moguel, P. and V. M. Toledo. 1999. Biodiversity conservation in traditional coffee systems of Mexico. Conservation Biology 13:11-21.
Moorhead, L. C., S. M. Philpott, and P. Bichier. 2010. Epiphyte Biodiversity in the Coffee Agricultural Matrix: Canopy Stratification and Distance from Forest Fragments. Conservation Biology 24:737-746.
Oberg, S., B. Ekbom, and R. Bommarco. 2007. Influence of habitat type and surrounding landscape on spider diversity in Swedish agroecosystems. Agriculture Ecosystems & Environment 122:211-219.
Pearson, D. E. 2009. Invasive plant architecture alters trophic interactions by changing predator abundance and behavior. Oecologia 159:549-558.
Perfecto, I., R. A. Rice, R. Greenberg, and M. E. VanderVoort. 1996. Shade coffee: A disappearing refuge for biodiversity. Bioscience 46:598-608.
Perfecto, I. and J. Vandermeer. 2002. Quality of agroecological matrix in a tropical montane landscape: Ants in coffee plantations in southern Mexico. Conservation Biology 16:174-182.
Philpott, S. M., B. B. Lin, S. Jha, and S. J. Brines. 2008. A multi-scale assessment of hurricane impacts on agricultural landscapes based on land use and topographic features. Agriculture Ecosystems & Environment 128:12-20.

65
Philpott, S. M., I. Perfecto, and J. Vandermeer. 2006. Effects of management intensity and season on arboreal ant diversity and abundance in coffee agroecosystems. Biodiversity and Conservation 15:139-155.
Pinkus-Rendon, M. A., G. Ibarra-Núñez, V. Parra-Tabla, and Y. Hénaut. 2006a. Spider diversity in coffee plantations with different management in Southeast Mexico. The Journal of Arachnology 34:104-112.
Pinkus-Rendon, M. A., J. L. Leon-Cortes, and G. Ibarra-Nunez. 2006b. Spider diversity in a tropical habitat gradient in Chiapas, Mexico. Diversity and Distributions 12:61-69.
Platnick, N. I. 2013. The world spider catalog, version 13.5. http://research.amnh.org/iz/spiders/catalog. DOI: 10.5531/db.iz.0001. . American Museum of Natural History.
Podgaiski, L. R., F. Joner, S. Lavorel, M. Moretti, S. Ibanez, M. D. Mendonca, and V. D. Pillar. 2013. Spider Trait Assembly Patterns and Resilience under Fire-Induced Vegetation Change in South Brazilian Grasslands. Plos One 8.
Rahbek, C. 2005. The role of spatial scale and the perception of large-scale species-richness patterns. Ecology Letters 8:224-239.
Romero-Alvarado, Y., L. Soto-Pinto, L. Garcia-Barrios, and J. F. Barrera-Gaytan. 2002. Coffee yields and soil nutrients under the shades of Inga sp vs. multiple species in Chiapas, Mexico. Agroforestry Systems 54:215-224.
Sanders, D., H. Nickel, T. Grutzner, and C. Platner. 2008. Habitat structure mediates top-down effects of spiders and ants on herbivores. Basic and Applied Ecology 9:152-160.
Schmidt, M. H., A. Lauer, T. Purtauf, C. Thies, M. Schaefer, and T. Tscharntke. 2003. Relative importance of predators and parasitoids for cereal aphid control. Proceedings of the Royal Society B-Biological Sciences 270:1905-1909.
Schmitz, O. J. 2008. Effects of predator hunting mode on grassland ecosystem function. Science 319:952-954.
Schmitz, O. J., A. P. Beckerman, and K. M. Obrien. 1997. Behaviorally mediated trophic cascades: Effects of predation risk on food web interactions. Ecology 78:1388-1399.
Stenchly, K., Y. Clough, D. Buchori, and T. Tscharntke. 2011. Spider web guilds in cacao agroforestry - comparing tree, plot and landscape-scale management. Diversity and Distributions 17:748-756.
Stenchly, K., Y. Clough, and T. Tscharntke. 2012. Spider species richness in cocoa agroforestry systems, comparing vertical strata, local management and distance to forest. Agriculture Ecosystems & Environment 149:189-194.
Szott, L. T., C. A. Palm, and C. B. Davey. 1994. Biomass and litter accumulation under managed and natural tropical fallows. Forest Ecology and Management 67:177-190.

66
Team, R. C. 2012. R: A language and environment for statistical computing. R Foundation for Statistical Computing, Vienna, Austria.
Teodoro, A. V., A. Munoz, T. Tscharntke, A. M. Klein, and J. M. Tylianakis. 2011. Early succession arthropod community changes on experimental passion fruit plant patches along a land-use gradient in Ecuador. Agriculture Ecosystems & Environment 140:14-19.
Ubick, D., P. Paquin, P. E. Cushing, V. D. Roth, N. Dupérré, and S. American Arachnological. 2005. Spiders of North America: an identification mannual. American Arachnological Society, [United States].
Winfree, R., N. M. Williams, H. Gaines, J. S. Ascher, and C. Kremen. 2008. Wild bee pollinators provide the majority of crop visitation across land-use gradients in New Jersey and Pennsylvania, USA. Journal of Applied Ecology 45:793-802.
Wise, D. H., W. E. Snyder, P. Tuntibunpakul, and J. Halaj. 1999. Spiders in decomposition food webs of agroecosystems: Theory and evidence. Journal of Arachnology 27:363-370.

67
CHAPTER 3
SPIDER DIVERSITY IN COFFEE AGROECOSYSTEMS: THE INFLUENCE OF AGRICULTURAL INTENSIFICATION AND AGGRESSIVE ANTS
Abstract
Spiders are a very diverse group of invertebrate predators found in
agroecosystems and natural systems. However, spider distribution, abundance and
ultimately their ecological function in ecosystems can be influenced by abiotic and biotic
factors such as agricultural intensification and dominant ants. Here we explore the
influence of both agricultural intensification and the dominant arboreal ant Azteca
instabilis on the spider community in coffee agroecosystems in Southern Mexico.
In order to evaluate the influence of the arboreal ant Azteca instabilis on the
spider community inhabiting the coffee layer of coffee agroecosystems, spiders were
collected from coffee plants that were and were not patrolled by the ant in sites differing
in agricultural intensification. In 2008, generalized linear mixed models showed that
spider diversity was positively affected by agricultural intensification but not by the ant.
However, results suggested that some spider species were associated with A. instabilis.
Therefore, in 2009 we concentrated our research on the effect of A. instabilis on spider

68
diversity and composition. In 2009, generalized linear mixed models showed that spider
richness and abundance per plant were significantly higher in the presence of A.
instabilis. In addition, visual counts of insects and sticky trap data show that more prey
resources were present on plants patrolled by the ant. The positive effect of A. instabilis
on spiders seems to be caused by at least two mechanisms: high abundance of insects and
protection against predators.
Key words: Araneae, Formicidae, Azteca instabilis, predators.

69
Introduction
Agroecosystems with a low degree of intensification (high crop diversity, little
use of synthetic agrochemicals), can act as reservoirs for biodiversity (Perfecto et al.
1996, Matson et al. 1997, Donald et al. 2001, Perfecto and Vandermeer 2002, Perfecto et
al. 2003, Klein et al. 2008, Jha and Dick 2010). For example, coffee agroecosystems with
low levels of agricultural intensification have been shown to support higher species
richness of a variety of vertebrates, invertebrates and plants (Perfecto et al. 1996, Moguel
and Toledo 1999, Armbrecht and Perfecto 2003, Philpott et al. 2006, Moorhead et al.
2010). However, some evidence suggests that spiders seem not to be affected by the
intensification of agriculture. For example, Clough et al. (2005) reported that spider
diversity did not decreased in intensified cereal plots, whereas Pinkus et al. (2006)
showed that spider richness at the coffee layer was higher in more intensified coffee
ecosystems (low canopy cover). However, Pinkus et al. (2006) did not show species
accumulation curves, making it impossible to assess if this result was due to a sampling
effect. On the other hand, Stenchly et al. (2011b) reported that the abundance of webs in
cocoa trees increased as the number of shade trees per plot increased. This literature
suggests that spider diversity and abundance are not heavily influenced by the degree of
intensification of the agroecosystem.
Because of their sociality and recruitment capabilities, ants are thought to play a
central role in biological control in agroecosystems (Holldöbbler and Wilson 1990). For
example, in coffee production, Vandermeer and colleagues (2010) have elucidated the
complex ecological network that revolves around the mutualism between the arboreal ant

70
Azteca instabilis and the hemipteran, Coccus viridis (the green coffee scale) (Jha et al.
2012) and its effects on the biological control of herbivores that feed on coffee
(Vandermeer et al. 2008, Liere and Perfecto 2008, Vandermeer et al. 2010, Pardee and
Philpott 2011, Philpott et al. 2012). In coffee plantations, Azteca instabilis ants build
their nests in the shade trees and patrol nearby coffee plants where these ants tend the
green coffee scale and chase away other herbivores (Vandermeer et al. 2002, Vandermeer
et al. 2010).
Although A. instabilis is an evident biological control agent, it could also
negatively impact other predators, specifically spiders. Indeed, preliminary research on
spiders in coffee agroecosystems suggested some negative interactions between A.
instabilis and spiders (Vandermeer et al. 2002). The role of ants as intraguild predators
and spiders as intraguild prey has been well documented in other systems (Pętal and
Breymeyer 1969, Kajak et al. 1972, Kaplan and Eubanks 2005, Moya-Laraño and Wise
2007, Styrsky and Eubanks 2007, Sanders and Platner 2007, Sanders et al. 2011).
Alternatively, some spiders themselves are intraguild predators, preying directly on ants
(Gibb 2003).
On the other hand, A. instabilis could also facilitate some spider species by
protecting them from other predators or by increasing the amount of resources available
to spiders (Cushing 2012, Schuch et al. 2008). Indeed, there is evidence that some spiders
use ants as a protection from other predators (MacIver and Stonedahl 1993).
Furthermore, because A. instabilis forms a mutualism with C. viridis (Jha et al. 2012),
many other insects are attracted to this association (Vandermeer et al. 2010). If those
insects are prey for spiders, the mutualism could potentially increase spider abundance.
71
Indeed, other researchers have shown that some spiders do exploit rich resource areas
patrolled by dominant ants (see Meehan et al. 2010).
Here we investigate the effect of coffee intensification and the presence of A.
instabilis on species richness, abundance and species composition of the spider
assemblage in coffee agroecosystems of the Soconusco region in Chiapas, Mexico. We
expect to find that spider diversity does not change in the coffee layer across farm type,
as has been documented in previous studies. Based of the negative interactions between
ants and spiders reported in other studies (Pętal and Breymeyer 1969, Kajak et al. 1972,
Halaj et al. 1997, Lenoir 2003, Sanders and Platner 2007) and in particular within our
study system (Vandermeer et al. 2002), and based on the high aggressiveness of A.
instabilis, we expect to find lower spider richness in the presence of the ant. However,
given the presence of the mutualistic relationship between A. instabilis and C. viridis we
also hypothesize that the mutualism will results in higher insect abundance in the
presence of the ant and therefore higher abundance of some spider species.
Materials and Methods
Study Area
The research was conducted in the Soconusco region, located in the Sierra Madre
Mountains of Chiapas, Mexico during July 2008 and June-July 2009. The Soconusco is a
rugged region with pronounced slopes covered by coffee farms, which are characterized
by their large size (~300 ha) and management type. Most of the coffee farms found in
this region use trees for providing shade to coffee plants. However, the type of shade
(monospecific/diverse), pruning frequency and pesticide application (yes/no) define
whether or not farms are undergoing agricultural intensification. The research took place
72
in a large area of approximately 600 hectares that contain a variety of management types,
ranging from very low to very high shade. The area is divided into two large farms,
Irlanda and Hamburgo, located at 15° 11’ N, 92° 20’ W and 15 ° 10’ N, 92° 19’ W
respectively. Finca Irlanda is approximately 300 hectares and tends toward the
diversified farm with a complex canopy that provides shade to the coffee plants
(Vandermeer et al. 2008), while Finca Hamburgo generally contains a less diversified
canopy cover ranging more toward the intensified end of the spectrum (Moguel and
Toledo, 1999). The more intensive areas correspond to the monospecific shade (MS)
system and were characterized by high density of coffee plants and the scarce presence of
shade trees mostly in the genus Inga. The less intensive areas correspond to diverse shade
systems (DS) with lower density of coffee plants and higher density and diversity of
shade trees. Moorhead and colleagues (2010) in a study carried out in the same sites and
simultaneously to this study, reported that the DS sites had higher mean canopy cover
(72.75% versus 30.56%) and mean basal area (30.1 m2/ha versus 12.23 m2/ha) than the
MS sites. However, given the rather homogenous but contrasting management imposed
by the owners of each farm, all replicates in each type of management were spatially
contiguous, thus not allowing for true replication of the agricultural management factor.
Spider Sampling
Spiders were sampled in the coffee layer of these coffee agroecosystems in the
summers of 2008 and 2009. In 2008 we sampled spiders on coffee plants patrolled and
not patrolled by the arboreal ant A. instabilis. In coffee plantations, A. instabilis are
dominant ants that build their nest in shade trees and patrol nearby coffee plants for
tending scale insects (Vandermeer et al. 2008). Vandermeer et al. (2008), studying the

73
spatial distribution of A. instabilis in a 45 ha plot, reported that the spatial distribution of
this ant species showed a clustered pattern. Given that the spatial distribution of A.
instabilis nests was already known and mapped for one area of 45 ha, we used this
information for selecting nine A. instabilis nests that were of relatively easy access and
that had similar ant activity level. We only selected A. instabilis nests that were separated
from each other by a minimum of 30 m. In the field, we corroborated the presence of A.
instabilis by its swarming behavior, which was elicited by knocking each tree with a
stick. We also selected nine trees that did not have A. instabilis nests and that were at
least 20 meters apart from their paired A. instabilis nest.
Azteca instabilis usually forages and tends the green coffee scale on coffee bushes
close to the tree where its nest is located (Vandermeer et al. 2008). Therefore, we decided
to sample spiders in the nearest four coffee plants to the selected trees. We sampled the
spiders by examining the entire coffee plant branch by branch. In order to improve the
visualization of spider webs, at the beginning of each spider search we sprayed coffee
plants with water using a hand held sprayer, then collected spiders by hand. Each search
lasted approximately 15 minutes per coffee plant.
We collected spiders over the entire month of July alternating between DS and
MS farms and between plants with and without A. instabilis. By identifying independent
A. instabilis nests and by setting 30 m minimum distance among them, we ensured that
our sampling points were not correlated. All spiders were placed in 70% ethanol and
taken to the laboratory for future identification.
In 2009 we conducted the study only in the DS farm and we slightly modified
spider sampling. Spiders were sampled on two (instead of 4) coffee plants nearest to a

74
shade tree with and without A. instabilis via visual counts and collections. We selected
trees with and without A. instabilis nests taking care to avoid overlap with the trees used
in 2008. Initially 22 trees (11 with and 11 without A. instabilis) and their respective
coffee plants (22 with and 22 without A. instabilis) were selected, two weeks later 8 more
trees were added (4 with and 4 without A. instabilis) for a total of 15 trees and 30 coffee
plants with and 15 trees and 30 coffee plants without A. instabilis. Spiders were recorded
weekly for 6 weeks on the same coffee plants over the months of June and July of 2009
using the same method described above for the 2008 sampling, except that we removed
spiders from one of the two sampled plants on a weekly basis and left all spiders on the
other plant.
This spider removal took place because the two coffee plants sampled per tree
were used for another study on the effects of spiders on arthropods. Thus in each weekly
survey the identity of each species and its respective abundance was recorded for one of
the plants (control plants) whereas all spiders on the other plant were removed and
collected (removal plants) for future identification. Therefore, in the analyses carried out
we accounted for the potential spider removal effect on spider richness and abundance by
including the variable "spider removal" (yes/no). In addition, given that plant structure is
important for spider web attachment (Wise 1993, Sanders et al. 2008), in 2009 we
accounted for plant effects by counting the number of branches of each coffee plant.
Collected spiders were identified to family using the Spiders of North America
(Ubick et al. 2005) and when possible to species level using selected publications (see
Platnick 2009). Overall, all spiders were identified to family and morphospecies. Careful
75
observations were made in the field in order to correctly identify the males and females
belonging to the same morphospecies. Collected adult specimens were measured and
voucher specimens were deposited at the Arachnological Collection of El Colegio de la
Frontera Sur in Tapachula, Mexico.
Insect Abundance
To test the hypothesis that A. instabilis benefits some spiders by increasing the
amount of prey resources available to them, in 2009 we quantified insect abundance on
coffee plants with and without A. instabilis with visual counts and sticky traps. Visible
insects were counted at the beginning of June of 2009 on the initial 44 coffee plants in
which we sampled spiders. We counted all visible insects present in the coffee plants
except C. viridis. Insects were identified to order and in some cases to family. In order to
estimate insect abundance with sticky traps, at the end of June of 2009 we selected
twenty-two coffee plants, 11 patrolled and 11 not patrolled by A. instabilis, and one small
sticky trap (7 x 11 cm) was horizontally placed on each plant at an approximate height of
1 m above the ground. Each sticky trap was attached to its respective plant with two
small wires. Sticky traps were collected 48 hours later and insects were counted using a
dissecting microscope.
Data Analyses
Effect of A. instabilis and Agricultural Intensification on Spider Diversity
We analyzed the accumulation of spider species found in coffee plants with and
without A. instabilis and in the two agricultural management systems (MS and DS) with
rarefaction curves constructed using the program EstimateS (Colwell 2009). EstimateS
uses the function Mao Tau for generating the expected species richness; in addition, the

76
program also returns a variety of estimators that calculate the total species richness
estimated for a specific condition (Colwell 2009). More specifically, we used the 95%
confidence intervals generated around the expected species richness (i.e. Mao Tau) for
comparing the accumulated species richness between conditions (e.g. agricultural
systems and presence/absence of A. instabilis) (Colwell 2009). In addition, we compared
the estimated total species richness between conditions by using the Chao1 estimator and
its 95% confidence intervals calculated by Estimates.
In addition, for 2008 we evaluated the influence of A. instabilis presence and
agricultural intensification on the average spider richness and spider abundance per
coffee plant with generalized linear mixed models (GLMMs). We decided to use
GLMM’s because these models allow the incorporation of both fixed and random factors
as well working with response variables non-normally distributed. Random effects are
variables that are included in a model in order to account for the effect of natural
variation among subjects on the prediction of response variable (Kleinbaum et al. 2008).
Furthermore, the incorporation of random effects is recommended when data are
clustered either at one point in time or when data have been taken on the same individuals
over time (Kleinbaum et al. 2008, Faraway 2006).
In the models run for 2008 the response variable was either average spider
richness or average spider abundance per coffee plant, which was a function of the fixed
factors, presence/absence of A. instabilis and agricultural system (DS versus MS). In
addition, given that the sampled plants were grouped by shade tree we included the
variable tree as a random effect.

77
For 2009, we also used GLMMs for analyzing the effect of A. instabilis, spider
removal (yes/no), and number of branches on the average richness and spider abundance
per coffee plant. Thus, average spider species richness or spider abundance per coffee
plant was the response variable, whereas A. instabilis presence (yes/no), spider removal
(yes/no) and number of branches were the fixed effects, and coffee plant and shade tree
were the random effects. We considered coffee plant and shade tree as random effects
because over six weeks weekly abundance and richness data were taken on the same
coffee plants, which in turn were spatially related to one another as defined by the tree
close to which the coffee plants were sampled. For testing fixed effects in either year we
used the Wald Z test (the default method in R) and its corresponding Z value (Bolker et
al. 2005).
Species Composition
We compared spider species composition between agricultural systems (DS and
MS) and between the presence/absence of A.instabilis with non-metric multidimensional
scaling (NMDS) and one-way analysis of similarities (ANOSIM) using Past software
(Hammer et al. 2001). NMDS is an analysis that allows comparing a multivariate data set
(in this case spider species) under two or more conditions (e.g. monocultural shade vs.
diverse shade). The analysis is based on a similarity distance matrix, which in this case
was calculated with the Jaccard similarity index. ANOSIM, a non-parametric version of
ANOVA, estimates the dissimilarity among samples belonging to different conditions.
ANOSIM uses the R-value as indicator of similarity, a high R value (maximum = 1)
indicates high dissimilarity, whereas a low R value indicates low dissimilarity. In
78
addition, ANOSIM generates a p-value associated to each R value, which is the
probability that the similarity is or not significant.
Species associated with Azteca instabilis
In order to determine if specific spider species were related to the presence of A.
instabilis, we used rank abundance curves as an exploratory tool. Those species that
showed an increase or decrease in their abundance in the presence of A. instabilis were
chosen for further GLMMs analysis. We only included those species that had a total
abundance equal or higher than 29 for 2008 and 40 in 2009. For GLMMs carried out on
the 2008 data, the response variable used was the abundance of individual species
whereas A. instabilis presence (yes/no) was the fixed factor and tree was included as
random effect. For GLMMs carried out on the 2009 data, the response variable was the
abundance of individual species whereas A. instabilis presence (yes/no), spider removal
(yes/no) and number of branches were the fixed factors, and coffee plant and tree
accounted for the random effects.
Given that carrying out multiple individual tests could increase the probability of
wrongly rejecting the null hypothesis (spider abundance is the same in the
presence/absence of A. instabilis) we applied the Bonferroni correction (Kleinbaum et al.
2008), which is to say, divided the standard α value of 0.05 by the number of
comparisons carried out. In our case, the standard α value was divided by the number of
spider species that were tested for an A. instabilis effect. For 2008 the standard α value
(0.05) was divided by 6, thus the α corrected value was 0.008 whereas for 2009, the
standard α value was divided by 14 species and the α corrected value was 0.004. We
decided to divide by those species numbers rather than for the total number of species

79
reported each year, since in both years many singletons were recorded. Dividing by the
total number of species would have artificially lowered the cutoff α value since many
species were recorded just once.
In order to explore potential mechanisms for explaining spider- ant associations
we also carried out feeding trials between spiders and ants in the laboratory and
conducted extensive field observations. In the laboratory we allowed A. instabilis to
interact with the spider species that showed a positive association with the ant.
Interactions lasted 24 hours and took place in small plastic containers (500 ml) where we
put 10 ants and one spider; a small cotton ball dampened with water was added. In the
field we observed the behavior of spiders in the presence of A. instabilis.
Insect Abundance
To determine if there were differences in insect abundance in the
presence/absence of A. instabilis we used a generalized linear model. The response
variable was insect abundance per coffee plant and the explanatory variable was A.
instabilis presence/absence.
Statistical Software
We carried out all statistical analyses with the R software. None of the response
variables were normally distributed; therefore we used a Poisson distribution for all the
analyses run. GLMMs were carried out with the package lmer. The percent change
attributable to any predictor variable was obtained by taking the exponent of the
corresponding estimate provided by the model. Any value above 1 was taken as a percent

80
increment with respect to the intercept, any value below 1 was taken as the base for
calculating the decrease caused for that variable with respect to intercept. For each
hypothesis, at least two models were run; the default model only included a random
intercept. The mean values were obtained by using the transformation: mean values= ex,
where x is the estimate provided by the linear model. Models that best explained the data
were chosen using the AIC criterion (Faraway 2006).
Results
Overall, 91 spider morphospecies were recorded in the coffee agroecosystems. In
2008 and 2009 61 and 76 morphospecies were collected respectively. These species were
distributed in 20 families, 18 families in 2008 and 18 families in 2009.
Effect of Agricultural Intensification on Spider Richness and Abundance
Accumulated spider richness was unaffected by coffee intensification (Fig. 3.1).
Fifty-one species were present in the DS sites whereas 48 species were present in the MS
sites, but this difference was not statistically significant according to the 95% confidence
intervals (Fig. 3.1). Additionally, the estimator Chao1 did not show a significant
difference between the MS and DS systems (95% confidence intervals overlapped).
However, the GLMM analysis showed that average species richness per plant was
affected by coffee management system. Average spider richness decreased by 30 % in the
DS system, the least intensified agroecosystem, as compare to MS system (p=0.04,Table
3.1).
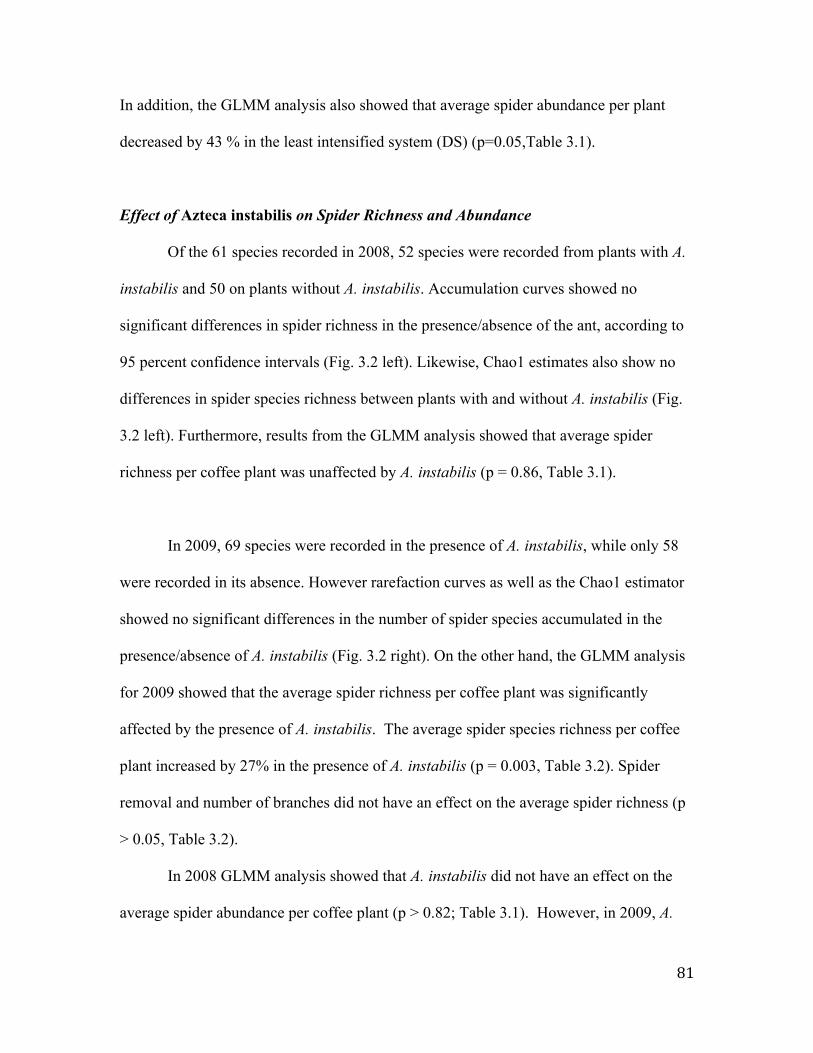
81
In addition, the GLMM analysis also showed that average spider abundance per plant
decreased by 43 % in the least intensified system (DS) (p=0.05,Table 3.1).
Effect of Azteca instabilis on Spider Richness and Abundance
Of the 61 species recorded in 2008, 52 species were recorded from plants with A.
instabilis and 50 on plants without A. instabilis. Accumulation curves showed no
significant differences in spider richness in the presence/absence of the ant, according to
95 percent confidence intervals (Fig. 3.2 left). Likewise, Chao1 estimates also show no
differences in spider species richness between plants with and without A. instabilis (Fig.
3.2 left). Furthermore, results from the GLMM analysis showed that average spider
richness per coffee plant was unaffected by A. instabilis (p = 0.86, Table 3.1).
In 2009, 69 species were recorded in the presence of A. instabilis, while only 58
were recorded in its absence. However rarefaction curves as well as the Chao1 estimator
showed no significant differences in the number of spider species accumulated in the
presence/absence of A. instabilis (Fig. 3.2 right). On the other hand, the GLMM analysis
for 2009 showed that the average spider richness per coffee plant was significantly
affected by the presence of A. instabilis. The average spider species richness per coffee
plant increased by 27% in the presence of A. instabilis (p = 0.003, Table 3.2). Spider
removal and number of branches did not have an effect on the average spider richness (p
> 0.05, Table 3.2).
In 2008 GLMM analysis showed that A. instabilis did not have an effect on the
average spider abundance per coffee plant (p > 0.82; Table 3.1). However, in 2009, A.

82
instabilis had a significant effect on spider abundance. On average, plants with A.
instabilis had 67% more spiders than plants without the ant (p = 0.004, Table 3.2). In
addition, spider removal but not the number of branches significantly affected spider
abundance (Table 3.2). Mean spider abundance decreased by 24% when spiders were
removed in comparison to those plants that did not suffer any removal (p=0.01, Table
3.2).
Spider species influenced by Azteca instabilis
In 2008, the relative abundance of several spider species, among them Pocobletus
sp. n. (a new linyphiid species), Myrmarachne panamensis, Anelosimus jucundus and
Sidusa sp., changed in the presence of A. instabilis (Fig. 3.3). However, a GLMM
showed that only the abundance of the salticid Sidusa sp. was significantly affected by
the presence of the ant. More specifically, the abundance of Sidusa sp. decreased by 76 %
when A. instabilis was present (p < 0.0001, Table 3.3).
In 2009, a rank abundance curve suggested that seven species were more
abundant in the presence of A. instabilis whereas one species was less abundant (Fig.
3.3). GLMMs corroborated that Pocobletus sp. n., Myrmarachne panamensis,
Lyssomanes spiralis, Dolichognatha pentagona, Cupennius salei and Trachelas sp. were
positively associated with A. instabilis whereas Sidusa sp. was negatively associated.
After the Bonferroni correction the influence of A. instabilis on spiders held for
Pocobletus sp. n., Myrmarachne panamensis, Sidusa sp., and Lyssomanes spiralis (Table
3.3). Pocobletus sp. n. abundance increased by 285%, M. panamensis by 1144% and L.

83
spiralis by 177% in plants patrolled by A. instabilis (Table 3.3). On the other hand,
Sidusa sp. decreased by 78% in plants patrolled by the ant (Table 3.3). Spider removal
did not change the abundance of most spider species except for Pocobletus sp. n.
(decreased by 81%), L. spiralis (increased by 91%) and Sidusa sp. (increased by 156%)
(Table 3.3). The number of branches in coffee plants did not have an effect on these
spiders, except on Lyssomanes spiralis therefore this variable was dropped from the
models.
Effects of agricultural intensification and Azteca instabilis on spider species
composition
Spider species composition between the DS system and the MS system was very
similar (R=0.097; p = 0.0001). The non-metric multidimensional scaling plot showed a
high overlap between DS and MS (plot not shown). Likewise, species composition in the
presence/absence of A. instabilis was similar in both 2008 and 2009, although a more
marked difference in species composition was present in 2009. In 2008, the R value was
0.036 (p = 0.002) indicating that species composition was very similar, whereas in 2009
the R value was 0.27 (p = 0.0001), indicating that the spider community composition
showed a greater degree of dissimilarity regarding the presence/absence of A. instabilis
(Fig. 3.4).
Insect Abundance
Average insect abundance per coffee plant estimated through visual counts was
higher in those plants with A. instabilis than in plants without A. instabilis (p < 0.001;
Fig. 3.5a). The orders Diptera, Coleoptera, Hemiptera and the family Blattodea, were the

84
most abundant taxa found on plants patrolled by the A. instabilis. Likewise, the results
from the sticky traps showed that average insect abundance per sticky trap was
significantly higher on plants with A. instabilis than on plants without A. instabilis (p =
0.001, Fig. 3.5b).
Discussion
Contrary to what has been found for other taxa at this locality (Armbrecht and
Perfecto 2003, Philpott et al. 2006, Moorhead et al. 2010), agricultural intensification did
not result in a reduced richness and abundance of spiders living within the coffee layer.
Spider species richness and abundance per coffee plant was lower on plants in the diverse
shade system (DS) as compared to the monospecific shade (MS) system (Table 3.1), thus
supporting Pinkus et al. (2006) findings. We think that this is partially due to the fact that
in the MS sites the canopy cover is significantly reduced (Moorhead et al. 2010) and
therefore it is possible that spiders were concentrated in the coffee layer, while in the
diverse coffee system spiders have access to a richer canopy thus decreasing the number
of spiders found in the coffee layer. Other studies have shown that spiders are vertically
structured with well-defined communities in the leaf litter and canopy layers, and an
intermediate layer that shows components of both strata (Stenchly et al. 2011a). It is thus
possible that the decrease in tree density in the MS could drive the arboreal spiders that
otherwise inhabit the shade tree canopy to the coffee layer. Indeed, preliminary results
(Marín unpublished) suggest that the spider community found in the canopy of the shade
trees in coffee plantations greatly overlap with the spider community found in the coffee
bushes.

85
For species richness we found a discrepancy between the results of the rarefaction
curves, which show no significant differences between the systems, and the GLMM
results, which do show significant differences. This discrepancy is likely due to high
abundance and high species overlap on a per plant basis in the MS. First, the abundance
of spiders was on average 43% lower on coffee plants within the DS agroecosystem as
compare to the MS agroecosystem (Table 3.1), thus increasing the chances of recording
more species in the MS. Second, a higher overlap of species on a per plant basis in the
MS system as compare to the DS means that while the average number of species per
plant in the more intensive system is higher than in the less intensive system, those
species tend to be more similar among plants within the more intensive system, yielding a
similar number of total accumulated species in both systems. It is likely that the
combination of these two factors resulted in significantly higher species richness per
plant in the MS but no significant differences in the total accumulated species richness
between the two farms.
Overall, our results support other studies that have reported that spider species
richness is not affected by agricultural intensification (Clough et al. 2005, Bruggisser et
al. 2010). However, further studies should include the entire spider assemblage, including
spiders within the tree canopy and the leaf litter layers to rule out the displacement of
spiders from layers that are reduced or non existent in the more intensive systems.
Our study showed a variable effect of A. instabilis on the spider community
depending on the year of the study. In 2008 we found no significant effect of A. instabilis
on spider species richness or abundance, while in 2009 we found higher richness and
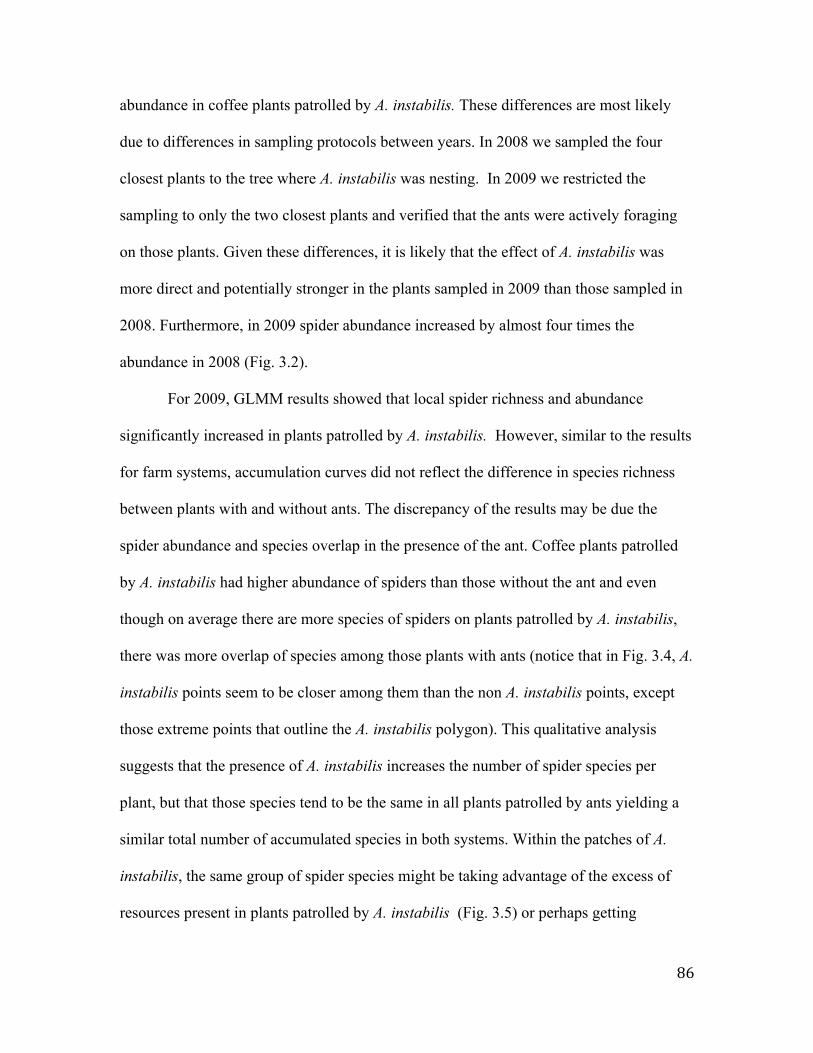
86
abundance in coffee plants patrolled by A. instabilis. These differences are most likely
due to differences in sampling protocols between years. In 2008 we sampled the four
closest plants to the tree where A. instabilis was nesting. In 2009 we restricted the
sampling to only the two closest plants and verified that the ants were actively foraging
on those plants. Given these differences, it is likely that the effect of A. instabilis was
more direct and potentially stronger in the plants sampled in 2009 than those sampled in
2008. Furthermore, in 2009 spider abundance increased by almost four times the
abundance in 2008 (Fig. 3.2).
For 2009, GLMM results showed that local spider richness and abundance
significantly increased in plants patrolled by A. instabilis. However, similar to the results
for farm systems, accumulation curves did not reflect the difference in species richness
between plants with and without ants. The discrepancy of the results may be due the
spider abundance and species overlap in the presence of the ant. Coffee plants patrolled
by A. instabilis had higher abundance of spiders than those without the ant and even
though on average there are more species of spiders on plants patrolled by A. instabilis,
there was more overlap of species among those plants with ants (notice that in Fig. 3.4, A.
instabilis points seem to be closer among them than the non A. instabilis points, except
those extreme points that outline the A. instabilis polygon). This qualitative analysis
suggests that the presence of A. instabilis increases the number of spider species per
plant, but that those species tend to be the same in all plants patrolled by ants yielding a
similar total number of accumulated species in both systems. Within the patches of A.
instabilis, the same group of spider species might be taking advantage of the excess of
resources present in plants patrolled by A. instabilis (Fig. 3.5) or perhaps getting
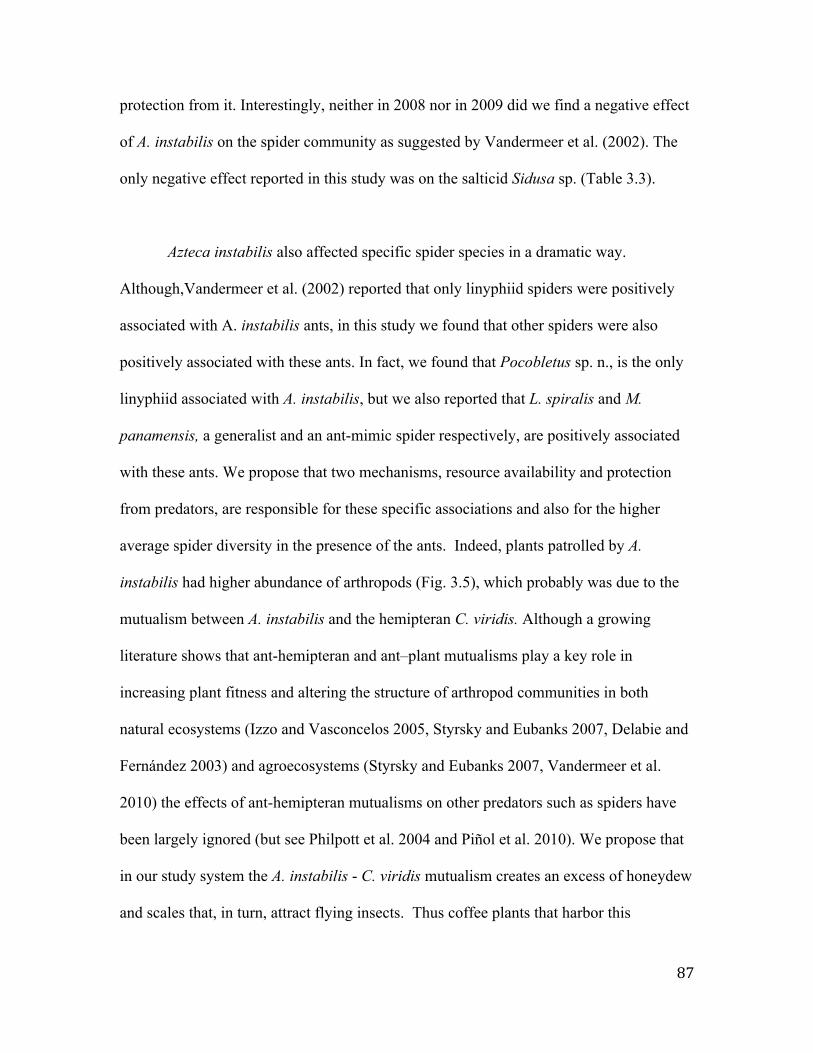
87
protection from it. Interestingly, neither in 2008 nor in 2009 did we find a negative effect
of A. instabilis on the spider community as suggested by Vandermeer et al. (2002). The
only negative effect reported in this study was on the salticid Sidusa sp. (Table 3.3).
Azteca instabilis also affected specific spider species in a dramatic way.
Although,Vandermeer et al. (2002) reported that only linyphiid spiders were positively
associated with A. instabilis ants, in this study we found that other spiders were also
positively associated with these ants. In fact, we found that Pocobletus sp. n., is the only
linyphiid associated with A. instabilis, but we also reported that L. spiralis and M.
panamensis, a generalist and an ant-mimic spider respectively, are positively associated
with these ants. We propose that two mechanisms, resource availability and protection
from predators, are responsible for these specific associations and also for the higher
average spider diversity in the presence of the ants. Indeed, plants patrolled by A.
instabilis had higher abundance of arthropods (Fig. 3.5), which probably was due to the
mutualism between A. instabilis and the hemipteran C. viridis. Although a growing
literature shows that ant-hemipteran and ant–plant mutualisms play a key role in
increasing plant fitness and altering the structure of arthropod communities in both
natural ecosystems (Izzo and Vasconcelos 2005, Styrsky and Eubanks 2007, Delabie and
Fernández 2003) and agroecosystems (Styrsky and Eubanks 2007, Vandermeer et al.
2010) the effects of ant-hemipteran mutualisms on other predators such as spiders have
been largely ignored (but see Philpott et al. 2004 and Piñol et al. 2010). We propose that
in our study system the A. instabilis - C. viridis mutualism creates an excess of honeydew
and scales that, in turn, attract flying insects. Thus coffee plants that harbor this
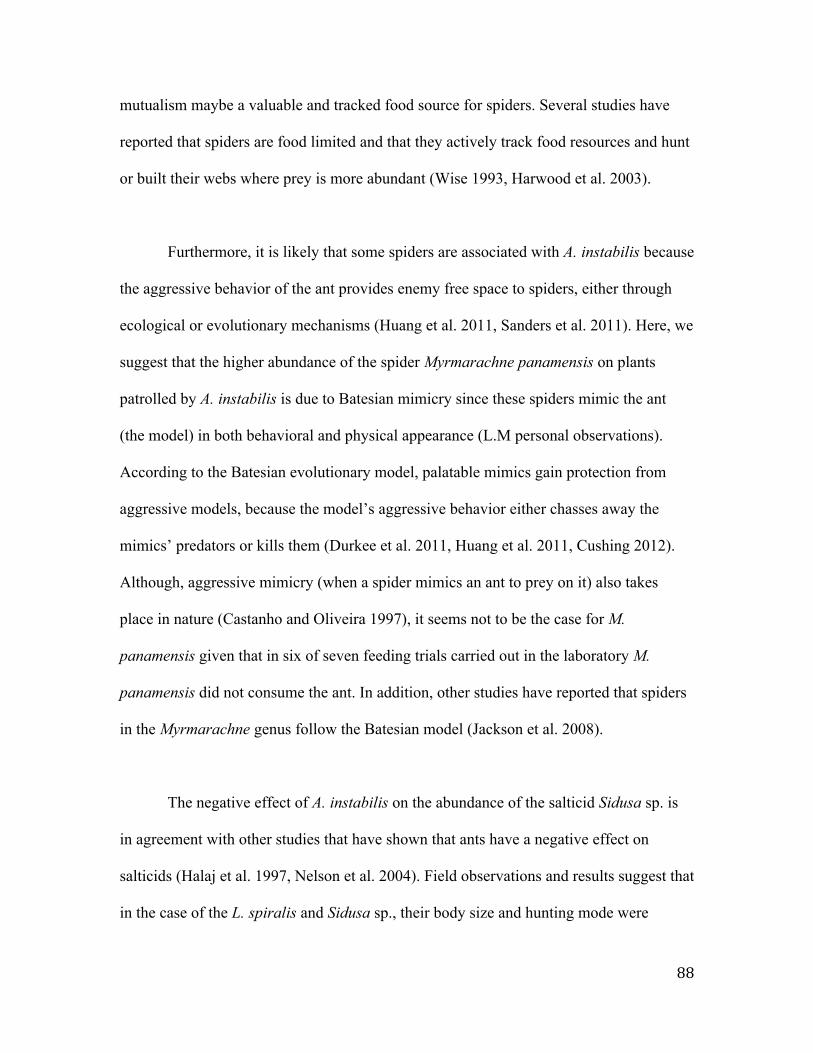
88
mutualism maybe a valuable and tracked food source for spiders. Several studies have
reported that spiders are food limited and that they actively track food resources and hunt
or built their webs where prey is more abundant (Wise 1993, Harwood et al. 2003).
Furthermore, it is likely that some spiders are associated with A. instabilis because
the aggressive behavior of the ant provides enemy free space to spiders, either through
ecological or evolutionary mechanisms (Huang et al. 2011, Sanders et al. 2011). Here, we
suggest that the higher abundance of the spider Myrmarachne panamensis on plants
patrolled by A. instabilis is due to Batesian mimicry since these spiders mimic the ant
(the model) in both behavioral and physical appearance (L.M personal observations).
According to the Batesian evolutionary model, palatable mimics gain protection from
aggressive models, because the model’s aggressive behavior either chasses away the
mimics’ predators or kills them (Durkee et al. 2011, Huang et al. 2011, Cushing 2012).
Although, aggressive mimicry (when a spider mimics an ant to prey on it) also takes
place in nature (Castanho and Oliveira 1997), it seems not to be the case for M.
panamensis given that in six of seven feeding trials carried out in the laboratory M.
panamensis did not consume the ant. In addition, other studies have reported that spiders
in the Myrmarachne genus follow the Batesian model (Jackson et al. 2008).
The negative effect of A. instabilis on the abundance of the salticid Sidusa sp. is
in agreement with other studies that have shown that ants have a negative effect on
salticids (Halaj et al. 1997, Nelson et al. 2004). Field observations and results suggest that
in the case of the L. spiralis and Sidusa sp., their body size and hunting mode were

89
influential in defining their interactions with A. instabilis. Studies have shown the critical
role that body size plays in intraguild predation and competition among predators; small
organisms have higher probabilities of being preyed upon or excluded by larger ones
(Wise 2006, Eichenberger et al. 2009, Huang et al. 2011). Given that the average body
length of Sidusa sp., is 2.8 mm and A. instabilis’ body length is 3.5 mm, it is possible that
Sidusa individuals may be more prone to attack and injury by the ants than the
individuals of L. spiralis, which are larger (6 mm). However, other spider species in this
study also have body sizes similar to Sidusa sp. and their abundances did not decreased in
the presence of the ant. Thus, other factors such as foraging mode may be involved in
defining whether or not ants negatively affect spiders. Indeed, active hunters are more
prone to intraguild predation than sit and wait predators (Denno and Fagan 2003,
Rosenheim et al. 2004). Thus, we suggest that the negative association between Sidusa
sp. and A. instabilis is due in part to the active hunting mode of Sidusa as well its small
body size.
In conclusion, our results provide evidence of the complexity of interactions
between spiders and ants in the coffee system, as well the effect of coffee intensification
on spider diversity. We document that coffee intensification does not affect the spider
community that hunts or builds webs in the coffee layer in a negative way. Furthermore
we show that A. instabilis ants increase the richness and abundance of spiders in coffee
plants that are very close to the main ant nest and that are actively patrolled by the ants.
Our results suggest that the positive association between ants and spiders may be caused
by at least two mechanisms, protection from predators and indirect effects on resource
availability.
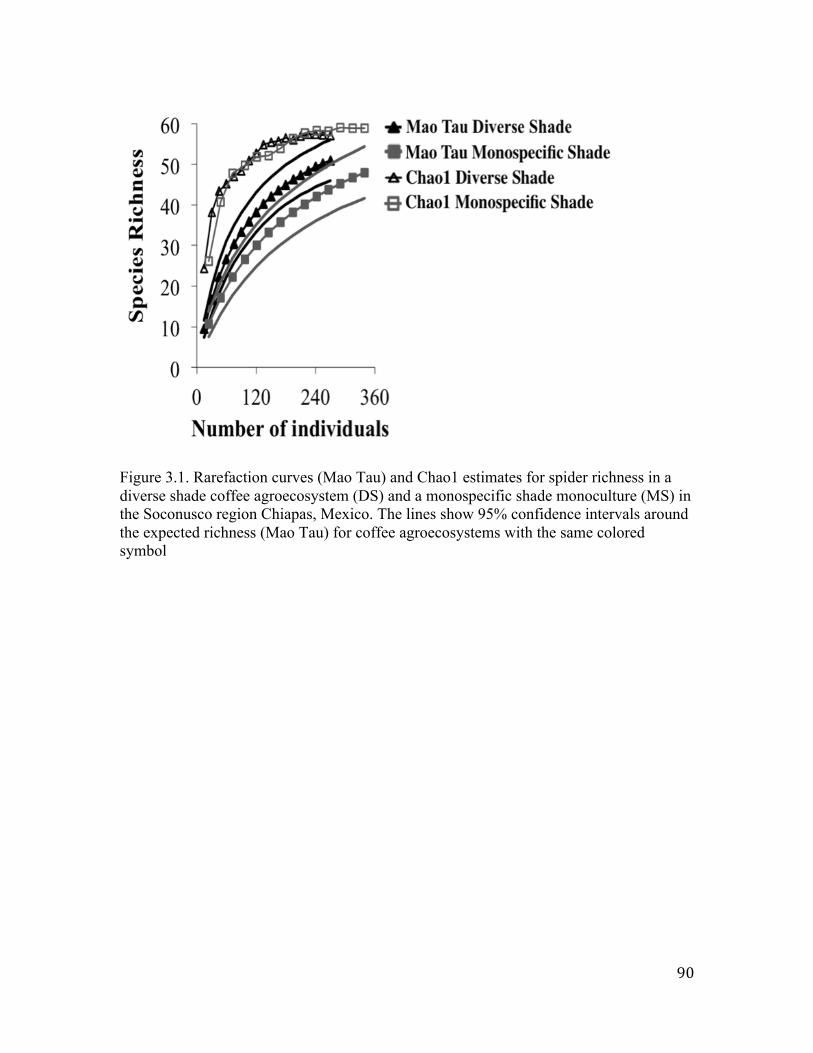
90
Figure 3.1. Rarefaction curves (Mao Tau) and Chao1 estimates for spider richness in a diverse shade coffee agroecosystem (DS) and a monospecific shade monoculture (MS) in the Soconusco region Chiapas, Mexico. The lines show 95% confidence intervals around the expected richness (Mao Tau) for coffee agroecosystems with the same colored symbol

91
Figure 3.2. Individual Rarefaction curves (Mao Tau) and Chao1 estimates for spider species richness in the presence/absence of Azteca instabilis ants in 2008 and 2009. The lines show 95% confidence intervals around the expected richness (Mao Tau) for A. instabilis presence with the same colored symbol

92
Figure 3.3. Rank abundance of spider species in the presence/absence of Azteca instabilis in 2008 (right) and 2009 (left). Dotted arrows indicate the affected species

93
Figure 3.4. Non-metric multidimensional scaling plot showing the similarity in species composition in the presence/absence of Azteca instabilis in 2009. The overlapping polygons indicate the degree of similarity

94
Figure 3.5. Mean insect abundance per plant (± SE) in the absence/presence of Azteca instabilis ants in 2009. a = visual counts data, b= sticky traps data

95
Table 3.1. Results of generalized linear mixed models testing the effect of Azteca instabilis and agricultural intensification on spider richness and abundance in 2008
Variable Fixed Estimate Standard Z p (Z) % of Random Variance Standardeffects error change effects error
Richness intercept 1.30 0.15 8.42 <0.0001 tree 0.18 0.42A. instabilis 0.03 0.17 0.17 0.86 3farm DS -0.37 0.17 -2.10 0.04 -30
Abundance intercept 1.66 0.18 9.34 <0.0001 tree 0.25 0.5A. instabilis 0.04 0.20 0.22 0.829 4farm DS -0.56 0.20 -2.79 0.005 -43
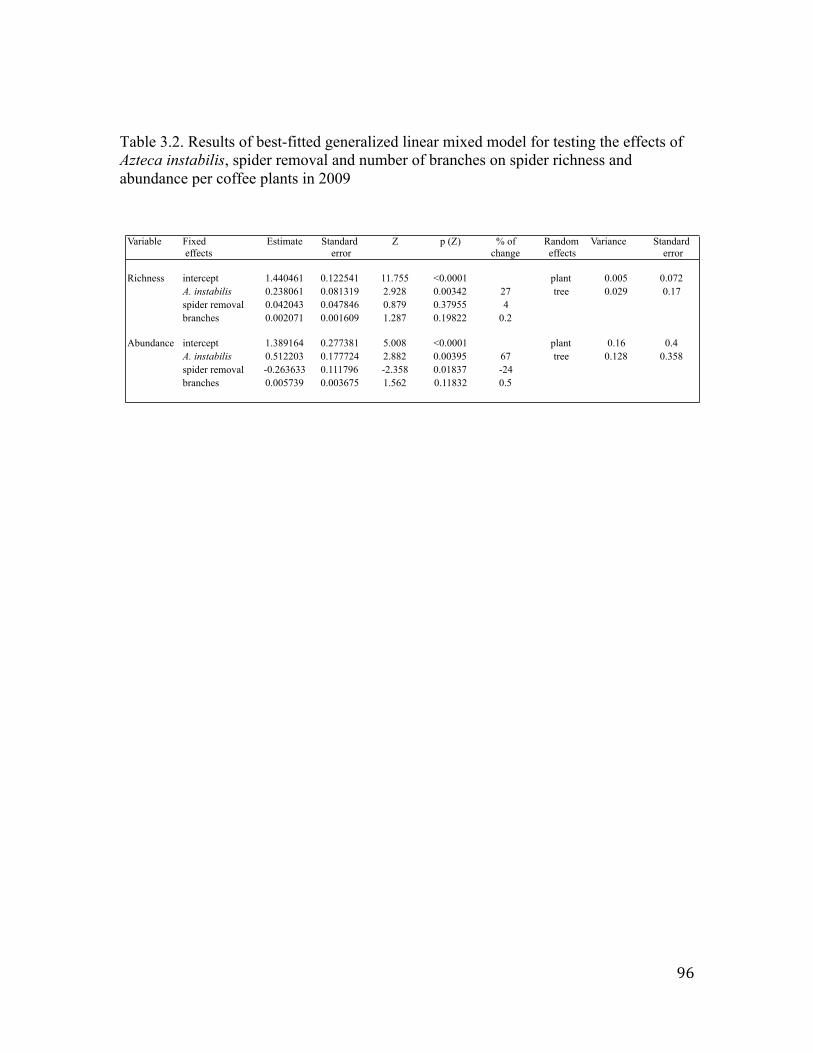
96
Table 3.2. Results of best-fitted generalized linear mixed model for testing the effects of Azteca instabilis, spider removal and number of branches on spider richness and abundance per coffee plants in 2009
Variable Fixed Estimate Standard Z p (Z) % of Random Variance Standard effects error change effects error
Richness intercept 1.440461 0.122541 11.755 <0.0001 plant 0.005 0.072A. instabilis 0.238061 0.081319 2.928 0.00342 27 tree 0.029 0.17spider removal 0.042043 0.047846 0.879 0.37955 4branches 0.002071 0.001609 1.287 0.19822 0.2
Abundance intercept 1.389164 0.277381 5.008 <0.0001 plant 0.16 0.4A. instabilis 0.512203 0.177724 2.882 0.00395 67 tree 0.128 0.358spider removal -0.263633 0.111796 -2.358 0.01837 -24branches 0.005739 0.003675 1.562 0.11832 0.5

97
Table 3.3. Results of best fitted generalized linear mixed models for testing the effects of Azteca instabilis in 2008 and 2009 and spider removal in 2009 on specific spiders found in coffee plants
Year Spider Fixed Estimate Standard Z p (Z) % of Random Variance Standardspecies effects error change effects error
2008 Sidusa sp. intercept -0.79 0.19 -4.26 <0.0001A. instabilis -1.42 0.42 -3.38 <0.0001 -76 tree <0.0001 <0.0001
2009 Pocobletus sp. n. intercept -0.14 0.34 -0.41 0.682 plant 1.40 1.18A. instabilis 1.35 0.42 3.21 0.001 285 tree 0.43 0.66removal -1.67 0.35 -4.81 <0.0001 -81
M. panamensis intercept -3.38 0.45 -7.47 <0.0001 plant 0.41 0.64A. instabilis 2.52 0.48 5.24 <0.0001 1144 tree 0.24 0.49removal -0.10 0.31 -0.34 0.736 -10
L. spiralis intercept -4.05 0.57 -7.07 <0.0001 plant 0.21 0.46A. instabilis 1.02 0.35 2.94 0.003 177 tree 0.14 0.38removal 0.65 0.28 2.32 0.020 91branches 0.02 0.01 2.70 0.007 1
Sidusa sp. intercept -0.81 0.26 -3.16 0.002 plant 0.21 0.46A. instabilis -1.51 0.35 -4.32 <0.0001 -78 tree 0.52 0.72removal 0.94 0.21 4.51 <0.0001 156

98
Acknowledgements
M. D. Hunter, J. H. Vandermeer, S. Philpott and an anonymous reviewer
provided valuable comments that greatly improved the manuscript. C. Velázquez-Pérez
and A. García-Ballinas provided field assistance. G. Hormiga and G. Ibarra- Núñez
identified Pocobletus sp. n. and salticids respectively. D. Childers provided statistical
help. J. Rojas, G. Ibarra-Núñez and E. Chamé provided logistic support. Finca Irlanda
and Finca Hamburgo allowed us to conduct this study in their farms. All species
collections were in compliance with current laws protecting biodiversity in Mexico. L.
Marín was funded by the National Council of Science and Technology in Mexico
(CONACYT; 185699), Rackham Graduate School and SNRE funds. Additional funds
were provided by an NSF grant to I. Perfecto and J. Vandermeer (DEB-0349388).
99
References
R: A language and environment for statistical computing. 2005. R Development Core Team. R Development Core Team, R Foundation for Statistical Computing, URL http://www.R-project.org, Vienna, Austria.
Armbrecht, I., and I. Perfecto. 2003. Litter-twig dwelling ant species richness and predation potential within a forest fragment and neighboring coffee plantations of contrasting habitat quality in Mexico. Agric. Ecosyst. Environ. 97:107-115.
Bolker, B., M. Brooks, C. J. Clark, S.W. Geange, J. R. Poulsen, M. H. Stevens, and J. S. S. White. 2005. Generalized linear mixed models: a practical guide for ecology and evolution. Trends Ecol. Evol. 24:127-135.
Bruggisser, O. T., M. H. Schmidt-Entling, and S. Bacher. 2010. Effects of vineyard management on biodiversity at three trophic levels. Biol. Conserv. 143:1521-1528.
Castanho, L., and P. Oliveira. 1997. Biology and behaviour of the neotropical ant-mimicking spider Aphantochilus rogersi (Araneae: Aphantochilidae): nesting, maternal care and ontogeny of ant-hunting techniques. J. Zool. 242:643-650.
Clough,Y., A. Kruess, A. Kleijn, and T. Tscharntke. 2005. Spider diversity in cereal fields: comparing factors at local, landscape and regional scales. J. Biogeogr. 32: 2007-2014.
Colwell, R. K. 2009.EstimateS: statistical estimation of species richness and shared species from samples.Version 7.5. User’s guide and application published at: http://purl.oclc.org/estimates. Accessed 2 April 2010.
Cushing, P. 2012. Spider-ant associations: an updated review of myrmecomorphy, myrmecophily, and myrmecophagy in spiders. Psyche. 1-23.
Delabie, J. H. C., and F. Fernández. 2003. Relaciones entre hormigas y homopteros (Hemiptera: Sternorrhyncha y Auchenorrhyncha), pp 184-197. In Fernández (Ed), Introducción a las hormigas de la region Neotropical. Instituto de Investigación de Recursos Biológicos Alexander von Humboldt, Bogotá, Colombia.
Denno, R., and W. Fagan. 2003. Might nitrogen limitation promote omnivory among carnivorous arthropods? Ecology. 84:2522-2531.
Donald, P., R. Green, and M. Heath. 2001. Agricultural intensification and the collapse of Europe's farmland bird populations. Proc. R. Soc. Lond. B Biol. Sci. 268:25-29.
Durkee, C. A., M. R. Weiss, and D.B. Uma. 2011. Ant mimicry lessens predation on a North American jumping spider by larger salticid spiders. Environ. Entomol. 40: 1223-1231.
Eichenberger, B., E. Siegenthaler, and M. H. Schmidt-Entling. 2009. Body size determines the outcome of competition for webs among alien and native sheetweb spiders (Araneae: Linyphiidae). Ecol. Entomol. 34:363-368.
Faraway, J. J. 2006. Extending the linear model with R. Chapman & Hall, Boca Raton, Florida, USA.

100
Gibb, H. 2003. Dominant meat ants affect only their specialist predator in an epigaeic arthropod community. Oecologia. 136:609-615.
Halaj, J., D. Ross, and A. Moldenke. 1997. Negative effects of ant foraging on spiders in Douglas-fir canopies. Oecologia. 109:313-322.
Hammer, Ø., D. A. T. Harper, and P. D. Ryan. 2001. PAST: Paleontological statistics software package for education and data analysis. Palaeontologia Electronica.
Harwood, J., K. Sunderland, and W. Symondson. 2003. Web-location by linyphiid spiders: prey-specific aggregation and foraging strategies. J. Anim. Ecol. 72:745-756.
Hölldobler B., and E. O. Wilson. 1990. The ants. Harvard University Press. Cambridge, Massachussets, USA.
Huang, J. N., R. C. Cheng, D. Q. Li, and I. M. Tso. 2011. Salticid predation as one potential driving force of ant mimicry in jumping spiders. Proc. R. Soc. Lond. B Biol. Sci. 278:1356-1364.
Jackson, R. R., X. J. Nelson, and K. Salm. 2008. The natural history of Myrmarachne melanotarsa, a social ant-mimicking jumping spider. N. Z. J. Zool. 35:225-235.
Jha, S., and C. W. Dick. 2010. Native bees mediate long-distance pollen dispersal in a shade coffee landscape mosaic. Proc. Natl. Acad. Sci. U. S. A. 107:13760-13764.
Jha, S., D. Allen., H. Liere., I. Perfecto, and J.H. Vandermeer. 2012. Mutualisms and population regulation: mechanism matters. PLoS ONE. 7:e43510.
Kaplan, I., and M. D. Eubanks. 2005. Aphids alter the community-wide impact of fire ants. Ecology.86:1640-1649.
Kajak, A., A. Breymeyer, J. Pêtal, and E. Olechowicz. 1972. The influence of ants on the meadow invertebrates. Ekologia Polska, 20:163-171.
Klein, A., S. A. Cunningham., M. Bos, and I. Steffan-Dewenter. 2008. Advances in pollination ecology from tropical plantation crops. Ecology. 89:935-943.
Kleinbaum, D.G., L. L. Kupper., A. Nizam, and K. E. Muller. 2008. Applied regression analysis and other multivariable methods. Thomson Cole-Brooks.Belmont, California, USA.
Lenoir, L. 2003. Response of the foraging behaviour of red wood ants (Formica rufa group) to exclusion from trees. Agricultural and Forest Entomology 5:183-189.
Liere, H., and I. Perfecto. 2008. Cheating on a mutualism: Indirect benefits of ant attendance to a coccidophagous coccinellid. Environ. Entomol. 37:143-149.
Matson, P. A., W. J. Parton., A. G. Power, and M. J. Swift. 1997. Agricultural intensification and ecosystem properties. Science. 227:504:509.
McIver, J., and G. Stonedahl. 1993. Myrmecomorphy: morphological and behavioral mimicry of ants. Annu. Rev. Entomol. 38:351-379.
Meehan, C. J., E. J. Olson., M. W. Reudink., T. K. Kyser, and R. L. Curry. 2009. Herbivory in a spider through exploitation of an ant-plant mutualism. Current Biology. 19:R892-R893.

101
Moguel, P., and V. Toledo. 1999. Biodiversity conservation in traditional coffee systems of Mexico. Conserv. Biol. 13:11-21.
Moorhead, L. C., S. M. Philpott, and P. Bichier. 2010. Epiphyte biodiversity in the coffee agricultural matrix: canopy stratification and distance from forest fragments. Conserv. Biol. 24:737-746.
Moya-Laraño, J., and D. H. Wise. 2007. Direct and indirect effects of ants on a forest-floor food web. Ecology. 88:1454-1465.
Nelson, X., R. Jackson., S. Pollard., G. Edwards, and A. Barrion. 2004. Predation by ants on jumping spiders (Araneae: Salticidae) in the Philippines. N. Z. J. Zool. 31:45-56.
Pardee, G., and S.M. Philpott. 2011.Cascading indirect effects in a coffee agroecosystem: effects of parasitic phorid flies on ants and the coffee berry borer in a high-shade and low-shade habitat. Environ. Entomol. 40:581-588.
Perfecto, I., R.A. Rice, R. Greenberg, and M.E. VanderVoort. 1996. Shade coffee: A disappearing refuge for biodiversity. Bioscience.46:598-608.
Perfecto, I., A. Mas., T. Dietsch, and J. Vandermeer. 2003. Conservation of biodiversity in coffee agroecosystems: a tri-taxa comparison in southern Mexico. Biodivers. Conserv. 12:1239-1252.
Perfecto, I., and J. Vandermeer. 2002. Quality of agroecological matrix in a tropical montane landscape: Ants in coffee plantations in southern Mexico. Conserv. Biol. 16:174-182.
Perfecto, I., and J. Vandermeer. 2010. The agroecological matrix as alternative to the land-sparing agriculture intensification model. Proc. Natl. Acad. Sci. U. S. A. 107:5786-5791.
Pętal J., and A. Breymeyer.1969. Reduction of wandering spiders by ants in a Stellario-
Deschampsietum Meadow. Bull. Acad. Pol. Sci.17:239-244.
Philpott, S. M., and I. Armbrecht. 2006. Biodiversity in tropical agroforests and the ecological role of ants and ant diversity in predatory function. Ecol. Entomol. 31:369-377.
Philpott, S., I. Perfecto, and J. Vandermeer. 2006. Effects of management intensity and season on arboreal ant diversity and abundance in coffee agroecosystems. Biodivers. Conserv. 15:139-155.
Philpott, S. M., I. Perfecto., J. Vandermeer, and S. Uno. 2009. Spatial scale and density dependence in a host parasitoid system: an arboreal ant, Azteca instabilis, and its Pseudacteon phorid parasitoid. Environ. Entomol. 38:790-796.
Philpott, S. M., G. Pardee, and D.J. Gonthier.2012. Cryptic biodiversity effects: importance of functional redundancy revealed through addition of food web complexity. Ecology. 93:992-1001.
Pinkus-Rendón, M. A., G. Ibarra-Núñez., V. Parra-Tabla., J. A. García-Ballinas, and Y. Henaut. 2006. Spider diversity in coffee plantations with different management in Southeast Mexico. J. Arachnol. 34:104-112.

102
Piñol, J., X. Espadaler., N. Cañellas., J. Martínez-Vilalta., J. Barrientos, and D. Sol. 2010. Ant versus bird exclusion effects on the arthropod assemblage of an organic citrus grove. Ecological Entomology, 35:367-376. doi:10.1111/j.1365-2311.2010.01190.x
Platnick, N. I. 2009. The world spider catalogue. American Museum of Natural History.
Rosenheim, J., T. Glik., R. Goeriz, and B. Ramert. 2004. Linking a predator's foraging behavior with its effects on herbivore population suppression. Ecology. 85:3362-3372.
Sanders, D., H. Nickel., T. Gruetzner, and C. Platner. 2008. Habitat structure mediates top-down effects of spiders and ants on herbivores. Basic Appl. Ecol. 9:152-160.
Sanders, D., M. Schaefer., C. Platner, and G. J. K. Griffiths. 2011. Intraguild interactions among generalist predator functional groups drive impact on herbivore and decomposer prey. Oikos. 120:418-426.
Sanders, D., and C. Platner. 2007. Intraguild interactions between spiders and ants and top-down control in a grassland food web. Oecologia.150:611-624.
Schuch, S., C. Platner, and D. Sanders. 2008. Potential positive effect of the ant species Lasius niger on linyphiid spiders. J. Appl. Entomol. 132:375-381.
Stenchly, K., Y. Clough, and T. Tscharntke. 2011.Spider species richness in cocoa agroforestry systems, comparing vertical strata, local management and distance to forest. Agric. Ecosyst. Environ.
Stenchly, K., Y. Clough., D. Buchori, and T. Tscharntke. 2011. Spider web guilds in cacao agroforestry. Comparing tree, plot and landscape-scale management. Diversity Distrib. 17: 748–756.
Styrsky, J. D., and M. D. Eubanks. 2007. Ecological consequences of interactions between ants and honeydew-producing insects. Proc. R. Soc. Lond. B Biol. Sci. 274:151-164.
Ubick, D., P. Paquin., P. E. Cushing, and V. Roth (eds). 2005. Spiders of North America: an identification manual. American Arachnological Society, Keene, New Hampshire, USA.
Vandermeer, J., I. Perfecto., G. Ibarra-Núñez, S. Phillpott, and A. García-Ballinas. 2002. Ants (Azteca sp.) as potential biological control agents in shade coffee production in Chiapas, Mexico. Agrofor. Syst. 56:271-276.
Vandermeer, J., I. Perfecto, and S. Philpott. 2010. Ecological complexity and pest control in organic coffee production: uncovering an autonomous ecosystem service. Bioscience. 60:527-537.
Vandermeer, J., I. Perfecto, and S. M. Philpott. 2008. Clusters of ant colonies and robust criticality in a tropical agroecosystem. Nature. 451:457.
Wise, D. 2006. Cannibalism, food limitation, intraspecific competition and the regulation of spider populations. Annu. Rev. Entomol. 51:441-465.
Wise, D. 1993. Spiders in ecological webs. Cambridge University Press. New York.
103
CHAPTER 4
A POSITIVE ASSOCIATION BETWEEN ANTS AND SPIDERS AND POTENTIAL MECHANISMS DRIVING THE PATTERN
Abstract
Biotic interactions play a central role in determining species distributions. Some
ants act as keystone species affecting the distribution of other species, including spiders.
In coffee plantations small linyphiids are significantly more abundant in coffee plants
patrolled by aggressive arboreal ants. Here we examine the abundance and spatial
distribution of small linyphiid, Pocobletus sp., in relation to the presence and spatial
distribution of aggressive ants and coffee plant foliage in coffee agroecosystems from
Southern Mexico. We also explore prey availability and enemy free space as potential
mechanisms underlying the association reported here. Results show that the spatial
distribution of Pocobletus in plots of 20 by 20 meters was associated positively with the
distribution of the dominant ants. Furthermore, Pocobletus sp. abundance was best
explained by the presence of the aggressive ants and coffee foliage. Insect abundance was
significantly higher in the presence of aggressive ants, both per individual coffee plant
and per spider web. The abundance of the predators of Pocobletus decreased in the

104
presence of ants. Thus, higher food resource availability and lower predation risk are two
possible mechanisms that may explain the positive association between dominant ants
and Pocobletus sp.
Key words: agroforests, enemy-free space, linyphiids, plant structure

105
Introduction
Both abiotic and biotic factors affect species abundance and distribution and
therefore the overall impact of organisms on ecosystems and agroecosystems. Indeed,
some organisms can have strong effects on the distribution of other species in the
ecosystem because they act as keystone species whose effects cascade to other trophic
levels (Paine 1966, Davic 2003, Vandermeer et al. 2010).
Ants play a central role in many terrestrial communities because they constitute a
large part of the animal biomass and are likely to interact with many other taxa (Risch
and Carroll 1982, Hölldobler and Wilson 1990, Stadler and Dixon 2005, Vandermeer et
al. 2010). In addition, the effects of ants in terrestrial communities can be amplified by
the mutualistic relationships that they establish either with hemipterans or plants (Izzo
and Vasconcelos 2005, Styrsky and Eubanks 2007, Zhang et al. 2012). These mutualistic
associations can directly and indirectly affect the abundance and presence of other trophic
levels, such as herbivores and predators (Styrsky and Eubanks 2007, Zhang et al. 2012)
and potentially transform the structure of communities. Furthermore, as predators, ants
have been shown to have strong effects on many other arthropod groups (Perfecto 1990,
1991, Halaj et al. 1997, Pinol et al. 2010). These top-down effects can also lead to
cascading effects that result in alternate increases and decreases in the abundances of
organisms in sequential trophic levels (Risch and Carroll 1982, Dyer and Letourneau
1999).
Intraguild predation, a negative interaction among generalist predators that are
also potential competitors, is very common in terrestrial communities (Polis et al. 1989,

106
Arim and Marquet 2004). Two ubiquitous generalist predators in terrestrial communities
are ants and spiders. These two groups comprise the most abundant terrestrial arthropods
and they feed on a wide array of other arthropods, including each other. Ants are eusocial
insects that for the most part forage in groups, and thus are able to attack and kill prey
items that are much larger than any individual worker (Hölldobler and Wilson 1990). For
this reason, ant-spider interactions are expected to be asymmetrical with ants having a
stronger negative effect on spiders than vice-versa. Although many studies that have
examined ecological interactions between ants and spiders have documented a negative
effect of ants on spiders (Buckley 1990, Halaj et al. 1997, Heikkinen 1999, James et al.
1999, Laakso and Setala 2000, Lenoir et al. 2003, Pinol et al. 2010, Sanders et al. 2011) a
few have also documented neutral (Philpott et al. 2004) and positive effects of ants on
spiders at population, and community levels (Cushing 1998, Vandermeer et al. 2002,
Moya-Larano and Wise 2007, Schuch et al. 2008, Sanders and van Veen 2011, Stenchly
et al. 2011) . The mechanisms responsible for these positive effects are ecosystem
engineering (Schuch et al. 2008, Sanders and van Veen 2011), predation (Moya-Larano
and Wise 2007), and protection against predators, this last as a result of evolutionary
processes (Durkee et al. 2011, Huang et al. 2011, Pekar and Jiros 2011) or ecological
interactions.
In coffee agroecosystems in Southern Mexico, Vandermeer et al (2010) reported
that the aggressive arboreal ants Azteca instabilis function as keystone species in coffee
production by regulating herbivores. A. instabilis also affects the ant community in coffee
plants by excluding ants from their nesting sites (Philpott 2010). However, A. instabilis
has a positive effect on the spider community that inhabits the coffee plants. Indeed,

107
Marín and Perfecto (2013b) reported that coffee plants patrolled by A. instabilis had
significantly higher spider richness and abundance. In addition, these authors reported
that three spider species, Pocobletus sp, Myrmarachne panamensis and Lyssomanes
spiralis, were significantly more abundant in the presence of A. instabilis. However,
Marín and Perfecto (2013b) did not investigate the contribution of plant attributes to
these specific ant-spider associations that took place in coffee plants. Nonetheless, in
order to get a better understanding about the ecology of spider-ant associations, plant
attributes should be considered since plants can affect spider abundance through altering
microhabitat conditions and by providing web attachment, hiding and nesting sites (Wise
1993, Langellotto and Denno 2004, de Souza and Martins 2005). In this paper we ask the
following questions: 1) Does the spatial distribution of Pocobletus sp. respond to A.
instabilis?, 2) What is the relative contribution of A. instabilis presence and coffee plant
structure on Pocobletus sp. abundance? and 3) What are the mechanisms underlying the
association between Pocobletus sp. and A. instabilis?
Given that a positive association between A. instabilis and Pocobletus sp. was
reported previously, we predicted that the spatial distribution of Pocobletus sp. would be
clustered around A. instabilis nests. Specifically, we expected that the distance of
Pocobletus sp. to A. instabilis patrolled plants/trees would be less than the distance that
would be expected if Pocobletus sp. were distributed at random. In relation to the
contribution of plant structure and A. instabilis, we expected that both variables together
would better explain Pocobletus sp. abundance than either alone. Finally, we explore
resource availability and enemy free space as two potential mechanisms that could be
underlying the Pocobletus sp. - A. instabilis association. First, we hypothesize that the A.

108
instabilis-C. viridis mutualism attracts more flying insects that are consumed by spiders;
therefore, we expect more insects in the presence of the ant-hemipteran mutualism.
Second, we investigate whether A. instabilis ants provide some sort of protection to
Pocobletus sp. against predation. Specifically, we expect to find lower abundance of the
predators of Pocobletus sp. in the presence of A. instabilis.
Material and methods
Study Area
We conducted our research at the Finca Irlanda coffee farm (15° 11’ N, 92° 20’
W) in the Soconusco region of the Sierra Madre Mountains of Chiapas, Mexico, in July
2009 and June-July 2010. Finca Irlanda is approximately 300 hectares and represents a
diversified coffee plantation with trees that provide shade to the coffee plants (Perfecto
and Vandermeer 2008).
Pocobletus sp. and coffee plant survey
In the summer of 2010 we carried out two surveys on coffee plants to elucidate a)
the spatial distribution of Pocobletus sp. in relation to A. instabilis and b) the
relationships among number of coffee branches, A. instabilis presence and Pocobletus sp.
abundance. The first survey took place in mid May-early June (for simplicity we will call
it the June survey) whereas the second survey took place in late July (hereafter the July
survey). We conducted surveys in three 20 x 20 m and one 20 x 25 m plots within a 45-
hectare plot previously established (Vandermeer et al. 2008) for the study of the
aggressive arboreal ants A. instabilis, whose nests are distributed in clusters (Vandermeer
et al. 2008). We established each plot around the central nest of a given cluster of A.
instabilis nests. We selected clusters of nests taking into account accessibility and a
109
minimum distance of 100 m from the next nearest cluster. Each plot was set up using an
x, y coordinate system, thus creating a grid wherein the location of each coffee plant and
shade tree was recorded.
For each coffee plant within a plot we recorded all spiders present as well the
number of webs of Pocobletus sp., the number of Pocobletus adults (females and males)
and ovisacs found on each web. In order to increase the detection of spiders and in
particular of the Pocobletus sp. webs we sprayed coffee plants with a hand-held water
sprayer. In addition, for each coffee plant we recorded its height and number of branches
and whether or not the coffee plant was patrolled by A. instabilis. After beginning the
first survey, we noticed that Pheidole synanthropica, a small ant (average body size ~ 2
mm) that nests in the ground was very abundant on some coffee plants and seemed to be
associated with Pocobletus sp., thus we decided to include P. synanthropica as an
explanatory variable.
Vacant webs and intruders
We recorded the number of vacant webs, defined as those Pocobletus sp. webs
that did not have any Pocobletus (adults, juveniles or spiderlings) but were not damaged.
In addition, we recorded whether or not vacant webs were actually vacant or were
occupied by a different spider species. In the case that the web was occupied by another
species we recorded the identity and abundance of those intruders per web and their
activity (e.g. resting, consuming, etc) and also recorded the identity and abundance of
those intruder spiders per coffee plant.
Insect abundance

110
To explore whether or not A. instabilis may benefit Pocobletus sp. by increasing
the amount of prey resources available to spiders, we quantified insect abundance on
coffee plants with and without A. instabilis in the summers of 2009 and 2010 with two
methods.
First, we used sticky traps placed on coffee plants. On each coffee plant two (7 x
11 cm) sticky traps were placed horizontally approximately 1.5 m above the ground. The
horizontal position mimics the placement of Pocobletus sp. webs. Sticky traps were
attached to coffee plants using wires. After 48 hrs, sticky traps were collected and insects
were counted and identified using a dissecting microscope. In 2009, sticky traps were
placed on 14 plants with and 14 plants without A. instabilis. In 2010, sticky traps were
placed on 15 plants, five with and ten without A. instabilis. Second, we quantified prey
items collected from Pocobletus sp. webs. We used index cards as a collecting device for
the webs to keep the Pocobletus sp. webs in their original horizontal position without
major damage or losses. Each web-card was kept in a plastic bag and labeled. Samples
were taken to the lab for examination and identification of arthropods under a dissecting
microscope. In 2009, 12 plants with and 12 plants without A. instabilis were randomly
selected and two Pocobletus sp. webs were collected from each plant.
Data analyses
Spatial distribution
In order to elucidate the spatial distribution of Pocobletus in relation to the
presence of A. instabilis and P. synanthropica we compared the observed weighed mean
distance of Pocobletus sp. to A. instabilis and P. synanthropica with a random weighed
mean distance that assumed a random distribution for Pocobletus sp. First, in each plot
111
we calculated the minimum distance between each coffee plant and the nearest coffee
plant or tree patrolled by A. instabilis, with the Pythagoras theorem. Then we calculated
the weighted mean distance in each plot according to the formula:
Where W = weighted mean distance, Ni = number of Pocobletus (adults or
ovisacs) on plant i, and di = the distance of plant i to the nearest plant/tree with A.
instabilis
Thus the weighted mean distance reflected the observed weighted mean distance
of Pocobletus sp. to A. instabilis in each plot. Then, we compared the observed weighted
mean distance with a random mean distance. In order to calculate the random mean
distances for Pocobletus sp. (adults or ovisacs) we randomly sampled Pocobletus sp. data
(either adults or ovisacs) by using a random sample function and then assigned the
random values to coffee plants. These random values were taken and used to calculate the
random weighted means following the same equation used for calculating the observed
weighed means. We ran this procedure 10, 000 times. We expected that the distance
between coffee plants that harbor Pocobletus sp. and a A. instabilis site (nearest coffee
plant or shade tree) would be smaller than the random distance. We therefore calculated
the probability of the random distance being less or equal to the observed weighed
distance as the sum of the times that random weighted mean distance was less than the
observed weighted mean distance and then divided this sum by 10,000. This procedure
was repeated for each plot in both months. The same procedure was conducted for
W =Ni
i∑ di
Nii∑

112
elucidating the spatial distribution of Pocobletus sp. in relation to P. synanthropica but
using the corresponding data (e.g. the minimum distance between each coffee plant and
the nearest coffee plant or tree patrolled by P. synanthropica).
A.instabilis, plant structure and Pocobletus sp. abundance
As a surrogate of plant structure, we estimated the amount of foliage on each
coffee bush by dividing the total number of branches of each coffee plant by its own
height. Then in order to eliminate influential points coffee foliage was square rooted. For
each month, we pooled together the variables recorded in each plot. The dependent
variable was Pocobletus sp. abundance (adults or ovisacs) and the independent variables
were A. instabilis, P. synanthropica presence and coffee foliage. Given that across plots
an excess of zeros characterized Pocobletus abundance, we analyzed data with zero
inflated models with a Poisson distribution. These models consist of two analytical tests;
the first test, the count model, analyzes the dependent variable as a function of the
explanatory variables under the assumption that the response variable follows a Poisson
distribution. The second test, the zero inflation model, analyzes the probability of having
an excess of zeros in the dependent variable as a function of the explanatory variables
with the logit function. We compared the zero inflated models to null models using the
likelihood test ratio; we also compared the zero inflated models to simple generalized
linear models (GLM) with Poisson distribution using the Vuong test (Faraway 2006).
Vacant webs and intruders
In order to test if the number of vacant webs was associated with A. instabilis
presence, P. synanthropica presence, and coffee foliage we used a GLM model with a
binomial distribution. In this case vacant webs were considered as a failure of the total

113
number of counted webs per plant. In this model the number of vacant webs with respect
to the total number of webs per coffee plant was a function of A. instabilis and P.
synanthropica presence, and coffee foliage.
In order to analyze the relationship among spider intruders, Pocobletus sp.
abundance, A. instabilis presence and P. synanthropica presence we used a zero inflated
model. In this case the total number of intruders per plant was dependent upon the
abundance of Pocobletus sp. adults and A. instabilis presence. We did not use the number
of intruders per web given the low numbers recorded. However, the field observations
allowed us to identify which of the spiders present in coffee plants were potential
intruders of Pocobletus sp. webs. Indeed, all species (except one) recorded as intruders
of Pocobletus sp. webs were recorded preying upon Pocobletus sp. at least once during
spider surveys. Both a tree fall and ongoing management practices slightly decreased the
number of coffee plants from June to July in plots I, III and IV. Plot I lost three plants
whereas plots III and IV each lost two plants.
All statistical analyses were carried out with the R software (R Development Core
Team 2005).
Results
Spatial distribution of Pocobletus sp. in relation to A. instabilis and P. synanthropica
Pocobletus sp. was clustered near to A. instabilis such that the average distance of
any Pocobletus sp. adult or ovisac to a plant patrolled by A. instabilis was less than the
distance expected if spiders were distributed at random (Table 4.1). The mean weighed
distance between Pocobletus sp. (adult/ovisac) and a plant with A. instabilis varied across
the four plots, however, these distances were always significantly smaller than the

114
expected distance under a random distribution (Table 4.1). This response was strong for
both adults and ovisacs of Pocobletus sp. for all plots in the June sample (Fig. 4.1).
Nonetheless, in plots I and IV, the distribution of Pocobletus was more spread in space,
suggesting that other factors are involved in shaping the distribution of the spider.
The spatial distribution of Pocobletus sp. changed slightly in July. In late July the
clustered pattern around A. instabilis disappeared from plot I and was marginally
significant in plot III, but was still strongly significant in plots II and IV (Table 4.1). In
July, the number of coffee plants patrolled by A. instabilis decreased in plots I and III.
The response of the spatial distribution of Pocobletus sp. to the presence of P.
synanthropica was very strong and significant but only in Plot IV.
Relationships among A. instabilis, coffee foliage and Pocobletus sp.
The abundance of Pocobletus sp. (adults and ovisacs) was positively associated
with the presence of A. instabilis, coffee foliage and the presence of P. synantropica
(Table 4.2). In all cases the zero inflated models were more accurate in explaining the
variance of Pocobletus sp. abundance in relation to the presence of A. instabilis, coffee
foliage and P. synanthropica than the GLMs (all Vuong tests p < 0.0001).
Over the two surveys, the abundance of Pocobletus sp. was explained by the
presence of A. instabilis and P. synantropica and by coffee foliage (p < 0.0001). The
abundance of Pocobletus increased by at least 100% in the presence of A. instabilis, 40%
in the presence of P. synanthropica, and 20% for each unit of foliage (Table 4.2). The
increase in Pocobletus sp. abundance (adults and ovisacs) in the presence of A. instabilis
and P. synanthropica was more pronounced during June than in late July, however, the

115
correlation with coffee foliage showed little variation over surveys (Table 4.2). Over the
two surveys the probability of having zero adults or ovisacs decreased when A. instabilis,
and coffee foliage were considered; however, the effect of P. synanthropica was less
consistent (Table 4.2, zero inflated model).
Vacant webs and intruders
The probability of finding vacant webs of Pocobletus sp. varied across surveys. In
June, the probability of finding vacant webs of Pocobletus sp. decreased in the presence
of A. instabilis by a factor of 0.70; however, it did not show any significant variation in
regards to P.synanthropica and coffee foliage. In July, none of the variables influenced
the probability of finding vacant webs (Table 4.3).
In total we found 7 morphospecies of intruder spiders in the vacant webs of
Pocobletus sp. Two morphospecies were active hunters belonging to the Salticidae
family (~3.5 mm) whereas the other 5 species were web-builders belonging to the
families Linyphiidae (~ 3 mm), Pholcidae (~ 2 mm) and Theridiidae (~ 2 mm). The three
most abundant web builders found in the Pocobletus sp webs were Faiditus dracus,
Neospintharus sp., and Rhomphaea sp., all of them belonging to the subfamily
Argyrodinae, well known for its kleptoparasitic members. The most abundant hunter
spider found in the webs of Pocobletus sp. belonged to the genus Sidusa.
The abundance of intruders per plant increased with the abundance of Pocobletus
adults and coffee foliage, and decreased in the presence of A. instabilis and P.
synanthropica (Table 4.4). The abundance of intruders decreased by 50% in the presence
of A. instabilis in June (p = 0.003) but not in July (p = 0.3). In addition, the abundance of
intruders was positively correlated to the increase in coffee foliage in both months by at

116
least 17 %. The zero inflated models showed that the probability of having zero intruders
per plant was related to the abundance of Pocobletus sp. adults, A. instabilis presence and
the coffee foliage (Table 4.4). In June, the probability of having zero intruders decreased
with the increase in coffee foliage. In July the probability of having zero intruders per
plant decreased with the abundance of Pocobletus adults and increased with the presence
of A. instabilis, whereas the presence of P. synanthropica was not related to the
probability of having zero intruders in any season.
Insect abundance in sticky traps and in spider webs
Insect abundance in sticky traps was higher with A. instabilis during both 2009 (p
= 0.0001) and 2010 (p = 0.005). Mean insect abundance and its respective standard error
in the presence of A. instabilis was 65 ± 2.47 per trap in 2009 and 36.07 ± 1.15 per trap
in 2010 whereas mean insect abundance on plants without A. instabilis was 41.58 ±1.90
per trap in 2009 and 31.23 ±0.87 per trap in 2010 (Fig. 4.2a and b). In addition, the
analysis of the content of Pocobletus sp. webs showed that overall more insects or
residues of insects were present in the webs of Pocobletus sp. when the ant was present
(13.03 ± 1.05) than when the ant was absent (3.8 ± 1.10, p < 0.0001, Fig. 4.2c). Although
a variety of orders were present in Pocobletus sp. webs, the higher prey abundance was
driven by the abundance of C.viridis, the coffee green scale.
Discussion
In this study we found a positive relationship among Pocobletus sp., A. instabilis,
P. synanthropica and coffee foliage. Indeed, the spatial distribution of Pocobletus was
associated with A. instabilis presence, whereas Pocobletus abundance was strongly and
positively associated with A. instabilis, P. synanthropica and coffee foliage. In none of

117
the studies reporting significant effect of ants on spiders (either positive or negative) has
the relationship been made spatially explicit. Analysis of the spatial distribution of the
associates can help us to better understand the strength of the interaction and the
ecological forces that shape the spatial distribution of the associates. This is particularly
important when the interactions are not between models and their mimics or specialist
predators and prey. The spatial distribution of Pocobletus in the four sites illustrates that
these tiny spiders are linked to A. instabilis ants; however, it also illustrates that other
factors beside A. instabilis influence Pocobletus abundance.
Indeed, coffee foliage and the presence of P. synanthropica also contributed to
explaining variation in the abundance of Pocobletus. The correlation between coffee
foliage and Pocobletus sp. abundance is not surprising considering that these spiders
build long lasting hammock webs. Coffee plants with more foliage may offer more sites
for attaching webs. Pocobletus also increased in the presence of P. synanthropica;
however, although significant, this increase was four times lower than the increase
associated with the presence of A. instabilis.
A growing literature has documented that ants may positively influence spider
populations and distributions through direct and indirect effects. Indirect effects include
the cascading effects of their mutualistic interactions with hemipterans (Styrsky and
Eubanks 2007, Zhang et al. 2012), plants (Meehan et al. 2009), and those resulting from
ecosystem engineering (Schuch et al. 2008, Sanders and van Veen 2011). Positive direct
effects of ants on spiders are due to their predation by spiders (Gibb 2003).
We propose that the association between A. instabilis and Pocobletus sp. can be
explained by 1) the mutualism between A. instabilis and C. viridis and its indirect effects

118
and 2) A. instabilis aggressiveness and the enemy free space that may create for
Pocobletus sp. We suggest that the mutualism between A. instabilis and C. viridis attracts
insects that can exploit the honeydew resource secreted by the homopterans or even the
homopterans (Volkl 1992, Liere and Perfecto 2008). In turn, this increase in insects
attracts spiders that prey upon them. Linyphiids are known for efficiently tracking
resources and setting up their webs in prey-rich sites (Harwood et al. 2001, 2003,
Harwood and Obrycki 2007) and our results from both sticky traps and web surveys
indicate that more prey resources were recorded in the presence of A. instabilis.
Ant aggressiveness plays a central role in some food webs (Sanders and Platner
2007, Vandermeer et al. 2010, Pardee and Philpott 2011, Sanders et al. 2011, Sanders and
van Veen 2011) because in addition to its potential negative effects on predators involved
in biological control (Sanders et al. 2011) ant aggressiveness may create enemy free
space for other taxa besides their mutualists (Volkl 1992, Dejean et al. 2001, Liere and
Perfecto 2008).
Indeed, the analyses of vacant webs and number of intruders per coffee plant
suggest that A. instabilis protects Pocobletus sp. from predators. Marín and Perfecto
(2013b) reported that Sidusa sp., one of intruders recorded in the coffee plants, was less
abundant on plants with A. instabilis. Interestingly, the effects of A. instabilis on the
probability of finding vacant webs and on the abundance of intruders per plant held only
for June, indicating that the influence of A. instabilis may vary over time. Although, we
found a positive correlation between P. synanthropica and Pocobletus sp. abundance, we
did not find any relation between these ants and the number of vacant webs or the
abundance of intruders per plant, thus suggesting that Pocobletus would not get any

119
enemy free space from P. synanthropica. Indeed, Ibarra-Nunez et al. (2001) reported that
the webs of Pocobletus sp, then referred as Linyphiidae sp.1, had a great abundance of
hemipterans and ants as prey. We think that these ants might have been P. synanthropica
or any other small ant present at that time in the coffee plants, but not A. instabilis since
these ants are twice as large (3.5 mm) as Pocobletus (1.4mm), and can get out the webs
relatively easy (L. M. personal observations).
In summary, this study documents the positive relationships among the abundance
of Pocobletus, coffee foliage and the presence of A. instabilis and P. synanthropica.
Specifically, this study shows that the spider Pocobletus sp. and A. instabilis have a
strong spatial association. Variation in the abundance of Pocobletus sp. is likely due to
the combination of both coffee foliage, a factor that might directly affect web attachment,
and to A. instabilis ants that may play a dual role by increasing resource availability and
reducing the number of potential predators of Pocobletus sp.

120
Acknowledgments
Comments from S. Philpott, M. Hunter and J. Vandermeer and two anonymous
reviewers greatly helped to improve the manuscript. L. Marín was funded by scholarship
185699 granted by the National Council of Science and Technology (CONACYT) in
Mexico, Rackham School and School of Natural Resources and Environment, University
of Michigan. C. Pérez Velázquez provided field assistance. D. Jackson, D. Allen and D.
Childers provided support with data analyses. Guillermo Ibarra-Núñez and Gustavo
Hormiga helped with spider identification. S. Philpott provided additional funds through
an NSF grant (DEB-1020096).
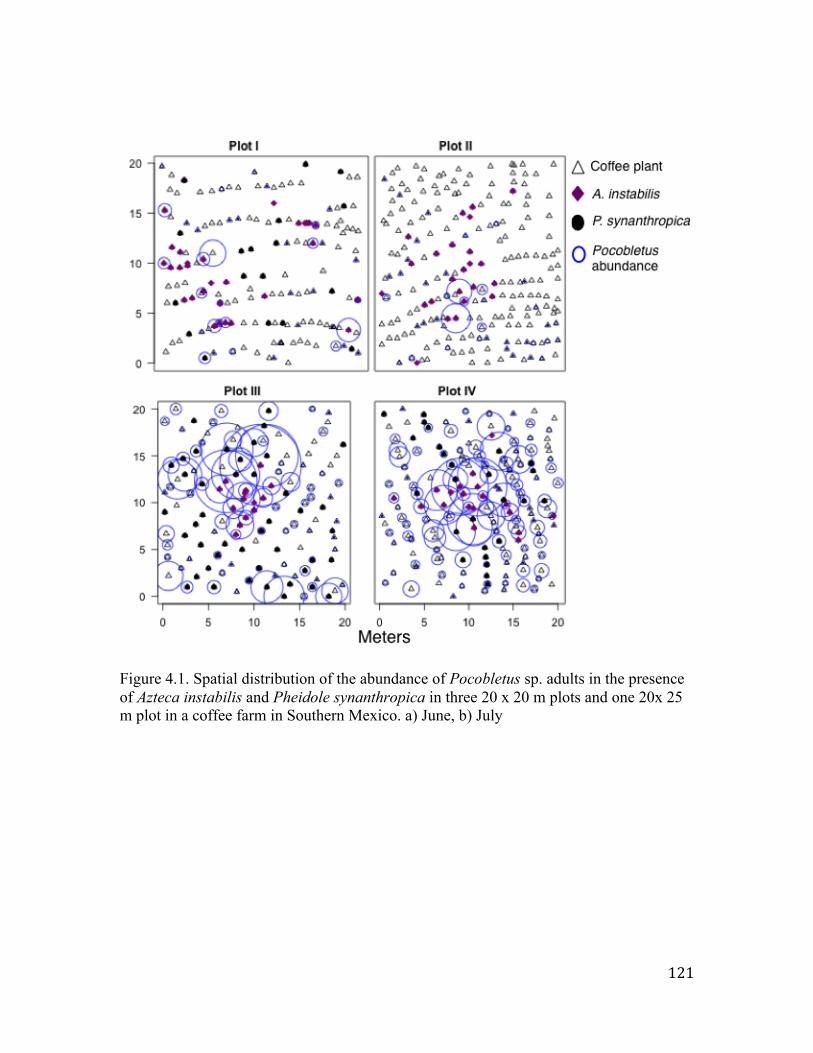
121
Figure 4.1. Spatial distribution of the abundance of Pocobletus sp. adults in the presence of Azteca instabilis and Pheidole synanthropica in three 20 x 20 m plots and one 20x 25 m plot in a coffee farm in Southern Mexico. a) June, b) July

122
Figure 4.2. Insect abundance per coffee plant (mean ± SE) in the presence and absence of Azteca instabilis in 2009 (a) and 2010 (b) and mean insect abundance per web of Pocobletus sp. collected in plants patrolled and not patrolled by the ant (c)

123
Table 4.1. Observed and random weighted mean distances (m) of Pocobletus sp. to the nearest coffee plant/tree patrolled by Azteca instabilis and P. synanthropica in the summer of 2010
Ants Plot Pocobletus Observed Random Observed Random distance distance distance distance
June JulyA. instabilis I Adults 1.13 2.65 3.85 3.98 <0.0001 0.31
II Adults 1.92 3.19 1.41 3.21 0.001 <0.0001III Adults 3.84 4.71 5.03 5.64 <0.0001 0.05IV Adults 2.25 3.38 2.47 3.37 <0.0001 <0.0001I Ovisacs 0.8 2.67 4.2 4 <0.0001 0.65II Ovisacs 2.04 3.2 1.27 3.21 0.008 <0.0001III Ovisacs 3.26 4.7 4.75 5.64 <0.0001 0.023IV Ovisacs 2.21 3.38 2.37 3.37 <0.0001 <0.0001
P.synanthropica I Adults 3.03 2.5 2.79 2.56 <0.977 0.9II Adults NA NA NA NA NA NAIII Adults 1.43 1.72 1.66 1.79 0.11 0.52IV Adults 1.92 2.48 1.9 2.6 0.0014 <0.0001I Ovisacs 3.06 2.41 2.73 2.14 0.95 0.83II Ovisacs NA NA NA NA NA NAIII Ovisacs 1.45 1.5 1.64 1.51 0.23 0.48IV Ovisacs 1.85 2.22 1.84 2.2 <0.0001 0.0012
P-value
June July

124
Table 4.2. Abundance of Pocobletus sp. adults and ovisacs in relation to coffee foliage and the presence of Azteca instabilis and Pheidole synanthropica in June and July 2010
Pocobletus adults~ A. instabilis + P. synanthropica + FoliageJune Count model
Estimate Standard error P-value % of change Intercept -0.46 0.10 <0.0001 *** A. instabilis 0.96 0.05 <0.0001 *** 161.8 P. synanthropica 0.43 0.05 <0.0001 *** 54.4 Foliage 0.29 0.01 <0.0001 *** 33.6 Zero-inflation model
Estimate Standard error P-value Intercept 5.45 0.54 <0.0001 *** A. instabilis -1.43 0.35 <0.0001 *** P. synanthropica -1.03 0.32 0.001 ** Foliage -0.97 0.09 <0.0001 ***July Count model
Estimate Stdandard error P-value % of change Intercept 0.11 0.10 0.27 A. instabilis 0.75 0.05 < 0.0001 *** 111.7 P. synanthropica 0.38 0.05 < 0.0001 *** 46.4 Foliage 0.23 0.01 < 0.0001 *** 26.0 Zero-inflation model
Estimate Standard error P-value Intercept 4.70 0.47 < 0.0001 *** A. instabilis -1.60 0.36 < 0.0001 *** P. synanthropica -0.63 0.29 0.03 * Foliage -0.82 0.08 < 0.0001 ***
Pocobletus ovisacs~ A. instabilis + P. synanthropica + FoliageJune Count model
Estimate Standard error P-value % of change Intercept 0.43 0.12 0.0002 *** A. instabilis 0.85 0.05 < 0.0001 *** 134.3 P. synanthropica 0.20 0.06 0.0003 *** 22.4 Foliage 0.18 0.02 < 0.0001 *** 0.3 Zero-inflation model
Estimate Standard error P-value Intercept 5.79 0.52 < 0.0001 *** A. instabilis -1.35 0.30 < 0.0001 *** P. synanthropica -0.75 0.28 0.006 ** Foliage -0.90 0.09 < 0.0001 ***July Count model
Estimate Standard error P-value % of change Intercept 0.41 0.11 <0.0001 *** A. instabilis 0.87 0.05 <0.0001 *** 139.7 P. synanthropica 0.17 0.06 0.001 * 19.2 Foliage 0.20 0.01 <0.0001 *** 22.5 Zero-inflation model
Estimate Standard error P-value Intercept 4.99 0.48 <0.0001 *** A. instabilis -1.42 0.32 <0.0001 *** P. synanthropica -0.74 0.28 0.028 * Foliage -0.77 0.08 <0.0001 ***

125
Table 4.3. Vacant webs of Pocobletus in relation to coffee foliage, and the presence of Azteca instabilis and Pheidole synanhtropica in June and July 2010.
Estimate Standard error P-value June Intercept -2.05 0.40 <0.0001 ***
A. instabilis -0.72 0.20 0.0004 ***P. synanthropica -0.03 0.18 0.85Foliage -0.095 0.06 0.07 *
July Intercept -3.40 0.44 <0.0001 ***A. instabilis -0.08 0.21 0.68P. synanthropica -0.09 0.21 0.65Foliage 0.05 0.06 0.37
Vacant webs~ A. instabilis + P. synanthropica + Foliage

126
Table 4.4. Abundance of spider intruders per coffee plant in relationship to coffee foliage and the presence of Azteca instabilis and Pheidole synanthropica in June and July 2010
Intruders~Pocobletus adults + A. instabilis + P. synanthropica + FoliageJune Count model
Estimate Standard error P-value % of change Intercept -0.47 0.19 0.02 Pocobletus adults 0.01 0.01 0.06 1.20 A. instabilis -0.66 0.23 0.005 ** -48.1 P. synanthropica 0.02 0.12 0.83 Foliage 0.16 0.03 <0.0001*** 17.8 Zero-inflation model
Estimate Standard error P-value Intercept 0.50 0.62 0.42 Pocobletus adults -0.01 0.03 0.80 A. instabilis 0.42 0.62 0.50 P. synanthropica 0.40 0.37 0.27 Foliage -0.27 0.11 0.01*July Count model
Estimate Standard error P-value % of change Intercept -1.37 0.34 <0.0001 *** Pocobletus adults -0.008 0.0100 0.4 A. instabilis 0.28 0.26 0.3 P. synanthropica 0.13 0.19 0.5 Foliage 0.20 0.05 <0.0001 *** 22.4 Zero-inflation model
Estimate Standard error P-value Intercept 1.12 0.81 0.16 Pocobletus adults -0.13 0.05 0.015 * A. instabilis 1.23 0.59 0.038 * P. synanthropica -0.21 0.60 0.73 Foliage -0.21 0.14 0.12

127
References
Arim, M. and P. A. Marquet. 2004. Intraguild predation: a widespread interaction related to species biology. Ecology Letters 7:557-564.
Buckley, R. 1990. Ants protect tropical homoptera against nocturnal spider predation. Biotropica 22:207-209.
Cushing, P. E. 1998. Population structure of the ant nest symbiont Masoncus pogonophilus (Araneae : Linyphiidae). Annals of the Entomological Society of America 91:626-631.
Davic, R. D. 2003. Linking keystone species and functional groups: A new operational definition of the keystone species concept - Response. Conservation Ecology 7.
de Souza, A. U. T. and R. P. Martins. 2005. Foliage density of branches and distribution of plant-dwelling spiders. Biotropica 37:416-420.
Dejean, A., J. Orivel, B. Corbara, I. Olmsted, and J. P. Lachaud. 2001. Nest site selection by two polistine wasps: The influence of Acacia-Pseudomyrmex associations against predation by army ants (Hymenoptera). Sociobiology 37:135-146.
Durkee, C. A., M. R. Weiss, and D. B. Uma. 2011. Ant Mimicry Lessens Predation on a North American Jumping Spider by Larger Salticid Spiders. Environmental Entomology 40:1223-1231.
Dyer, L. A. and D. K. Letourneau. 1999. Relative strengths of top-down and bottom-up forces in a tropical forest community. Oecologia 119:265-274.
Gibb, H. 2003. Dominant meat ants affect only their specialist predator in an epigaeic arthropod community. Oecologia 136:609-615.
Halaj, J., D. W. Ross, and A. R. Moldenke. 1997. Negative effects of ant foraging on spiders in Douglas-fir canopies. Oecologia 109:313-322.
Harwood, J. D. and J. J. Obrycki. 2007. Web-site selection strategies of linyphiid spiders in alfalfa: implications for biological control. Biocontrol 52:451-467.
Harwood, J. D., K. D. Sunderland, and W. O. C. Symondson. 2001. Living where the food is: web location by linyphiid spiders in relation to prey availability in winter wheat. Journal of Applied Ecology 38:88-99.
Harwood, J. D., K. D. Sunderland, and W. O. C. Symondson. 2003. Web-location by linyphiid spiders: prey-specific aggregation and foraging strategies. Journal of Animal Ecology 72:745-756.
Heikkinen, M. W. 1999. Negative effects of the western thatching ant (Formica obscuripes) on spiders (Araneae) inhabiting big sagebrush (Artemisia tridentata). Great Basin Naturalist 59:380-383.
Hölldobler, B. and E. O. Wilson. 1990. The ants. The Belknap Press of Harvard University Press, Cambridge, Mass.

128
Huang, J. N., R. C. Cheng, D. Q. Li, and I. M. Tso. 2011. Salticid predation as one potential driving force of ant mimicry in jumping spiders. Proceedings of the Royal Society B-Biological Sciences 278:1356-1364.
Ibarra-Nunez, G., J. A. Garcia, J. A. Lopez, and J. P. Lachaud. 2001. Prey analysis in the diet of some ponerine ants (Hymenoptera : Formicidae) and web-building spiders (Araneae) in coffee plantations in Chiapas, Mexico. Sociobiology 37:723-755.
Izzo, T. J. and H. L. Vasconcelos. 2005. Ants and plant size shape the structure of the arthropod community of Hirtella myrmecophila, an Amazonian ant-plant. Ecological Entomology 30:650-656.
James, D. G., M. M. Stevens, K. J. O'Malley, and R. J. Faulder. 1999. Ant foraging reduces the abundance of beneficial and incidental arthropods in citrus canopies. Biological Control 14:121-126.
Laakso, J. and H. Setala. 2000. Impacts of wood ants (Formica aquilonia Yarr.) on the invertebrate food web of the boreal forest floor. Annales Zoologici Fennici 37:93-100.
Langellotto, G. A. and R. F. Denno. 2004. Responses of invertebrate natural enemies to complex-structured habitats: a meta-analytical synthesis. Oecologia 139:1-10.
Lenoir, L., J. Bengtsson, and T. Persson. 2003. Effects of Formica ants on soil fauna-results from a short-term exclusion and a long-term natural experiment. Oecologia 134:423-430.
Liere, H. and I. Perfecto. 2008. Cheating on a mutualism: Indirect benefits of ant attendance to a coccidophagous coccinellid. Environmental Entomology 37:143-149.
Marín, L. and I. Perfecto. 2013. Spider Diversity in Coffee Agroecosystems: The Influence of Agricultural Intensification and Aggressive Ants. Environmental Entomology 42:204-213.
Meehan, C. J., E. J. Olson, M. W. Reudink, T. K. Kyser, and R. L. Curry. 2009. Herbivory in a spider through exploitation of an ant-plant mutualism. Current Biology 19:R892-R893.
Moya-Larano, J. and D. H. Wise. 2007. Direct and indirect effects of ants on a forest-floor food web. Ecology 88:1454-1465.
Paine, R. T. 1966. Food web complexity and species diversity. American Naturalist 100:65.
Pardee, G. L. and S. M. Philpott. 2011. Cascading Indirect Effects in a Coffee Agroecosystem: Effects of Parasitic Phorid Flies on Ants and the Coffee Berry Borer in a High-Shade and Low-Shade Habitat. Environmental Entomology 40:581-588.
Pekar, S. and P. Jiros. 2011. Do ant mimics imitate cuticular hydrocarbons of their models? Animal Behaviour 82:1193-1199.
Perfecto, I. 1990. Indirect and direct effects in a tropical agroecosystem - the maize-pest-ant system in nicaragua. Ecology 71:2125-2134.

129
Perfecto, I. 1991. Ants (Hymenoptera, Formicidae) as natural control agents of pests in irrigated maize in Nicaragua. Journal of Economic Entomology 84:65-70.
Perfecto, I. and J. Vandermeer. 2008. Spatial pattern and ecological process in the coffee agroforestry system. Ecology 89:915-920.
Philpott, S. M. 2010. A canopy dominant ant affects twig-nesting ant assembly in coffee agroecosystems. Oikos 119:1954-1960.
Philpott, S. M., R. Greenberg, P. Bichier, and I. Perfecto. 2004. Impacts of major predators on tropical agroforest arthropods: comparisons within and across taxa. Oecologia 140:140-149.
Pinol, J., X. Espadaler, N. Canellas, J. Martinez-Vilalta, J. A. Barrientos, and D. Sol. 2010. Ant versus bird exclusion effects on the arthropod assemblage of an organic citrus grove. Ecological Entomology 35:367-376.
Polis, G. A., C. A. Myers, and R. D. Holt. 1989. The ecology and evolution of intraguild predation - potential competitors that eat each other. Annual Review of Ecology and Systematics 20:297-330.
Risch, S. J. and C. R. Carroll. 1982. Effect of a keystone predaceous ant, Solenopsis-geminata, on arthropods in a tropical agroecosystem. Ecology 63:1979-1983.
Sanders, D. and C. Platner. 2007. Intraguild interactions between spiders and ants and top-down control in a grassland food web. Oecologia 150:611-624.
Sanders, D., M. Schaefer, C. Platner, and G. J. K. Griffi. 2011. Intraguild interactions among generalist predator functional groups drive impact on herbivore and decomposer prey. Oikos 120:418-426.
Sanders, D. and F. J. F. van Veen. 2011. Ecosystem engineering and predation: the multi-trophic impact of two ant species. Journal of Animal Ecology 80:569-576.
Schuch, S., C. Platner, and D. Sanders. 2008. Potential positive effect of the ant species Lasius niger on linyphiid spiders. Journal of Applied Entomology 132:375-381.
Stadler, B. and A. F. G. Dixon. 2005. Ecology and evolution of aphid-ant interactions. Pages 345-372 Annual Review of Ecology Evolution and Systematics.
Stenchly, K., Y. Clough, D. Buchori, and T. Tscharntke. 2011. Spider web guilds in cacao agroforestry - comparing tree, plot and landscape-scale management. Diversity and Distributions 17:748-756.
Styrsky, J. D. and M. D. Eubanks. 2007. Ecological consequences of interactions between ants and honeydew-producing insects. Proceedings of the Royal Society B-Biological Sciences 274:151-164.
Vandermeer, J., I. Perfecto, G. I. Nunez, S. Phillpott, and A. G. Ballinas. 2002. Ants (Azteca sp.) as potential biological control agents in shade coffee production in Chiapas, Mexico. Agroforestry Systems 56:271-276.
Vandermeer, J., I. Perfecto, and S. Philpott. 2010. Ecological Complexity and Pest Control in Organic Coffee Production: Uncovering an Autonomous Ecosystem Service. Bioscience 60:527-537.

130
Vandermeer, J., I. Perfecto, and S. M. Philpott. 2008. Clusters of ant colonies and robust criticality in a tropical agroecosystem. Nature 451:457-U453.
Volkl, W. 1992. Aphids or their parasitoids - who actually benefits from ant-attendance. Journal of Animal Ecology 61:273-281.
Wise, D. H. 1993. Spiders in ecological webs. Cambridge University Press, Cambridge ; New York.
Zhang, S., Y. X. Zhang, and K. M. Ma. 2012. The ecological effects of the ant-hemipteran mutualism: A meta-analysis. Basic and Applied Ecology 13:116-124.

131
CHAPTER 5
CONCLUSION
In my dissertation, I studied spider diversity in a coffee landscape in Southern
Mexico with the goal of gaining a better understanding of the ecology of predators in
tropical agroforestry systems. I hoped to help unravel the richness of ecological
interactions that take place in agricultural settings. Specifically, the analysis of spiders
distributed on the ground, on coffee plants, and on tree trunks, and their correlations with
coffee management, aggressive ants and distance to forest, shows that even though the
spiders found in these three strata exhibit different behaviors, a general pattern in
diversity is present. Overall, the local diversity of ground dwelling spiders (Chapter 1)
and coffee inhabiting spiders (Chapter 3), but not the local diversity of tree-trunk
dwelling spiders (Chapter 2) tends to reach higher values in the most intensified coffee
agroforestry systems (e.g. in those coffee systems with less canopy shade). Second,
Azteca instabilis ants have a strong correlation with the local spider richness, abundance
and biomass found in the coffee and tree layer (Chapter 2, Chapter 3 and Chapter 4).
Third, plant characteristics seem to strongly influence spider abundance in the coffee and
tree trunk layers (Chapter 2 and Chapter 4). Fourth, distance to forest is not a crucial

132
variable for explaining the richness of spiders in this agroforested landscape (Chapter 1
and Chapter 2), though forests sites might contribute to spider assemblages.
In addition, an important technical consideration regarding species diversity also
emerged. This study has pointed out the need to consider both the local species richness
and the accumulated species richness and used both of them to better understand the
interplay between diversity, management type and aggressive ants. Indeed, in most cases
of my research across spider communities the observed patterns in local spider richness
differed from the total accumulated spider richness patterns. For example, in both the
coffee layer and the tree trunk layer the patterns of accumulated species richness did not
differ in the presence and absence of A. instabilis; however, local spider richness was
higher in the presence of A. instabilis. Thus, although in terms of total accumulated
species richness the presence of A. instabilis did not affect spider diversity, at the local
level (either coffee plant or shade tree) the average spider richness increased. The same
is true in the case of the coffee dwelling spider community and its contrasting results in
species accumulation patterns and local richness in relation to coffee management type.
In Chapter 1, I showed that local spider richness and abundance were higher in
low shade coffee systems across the dry and rainy seasons. However, the pattern of the
accumulated species richness across systems was more complex. Indeed, accumulated
species richness was higher in the high shade coffee systems over the dry season,
whereas in the rainy season the pattern reversed. Accumulated species richness was
higher in the low shade coffee systems than in any other systems. Thus in the ground

133
dwelling spider community there is a clear trend to increase diversity in the most
intensified systems at least in the rainy season. The positive association between low-
shade coffee systems and spiders seem to be due to a variety of causes including dispersal
capabilities and prey availability, but only further studies will elucidate the underlying
mechanisms. In Chapter 1, I also reported that distance to the forest was a poor predictor
of spider richness and abundance. However, in the dry season, probably the harshest
season in the tropics, the forest sites were the most dissimilar in terms of species
composition when compared with low and high-shade coffee sites. Other studies have
found stronger correlations and effects on spider diversity with distance to forest.
However, those studies have been conducted in landscapes with a high contrast between
forest and agricultural systems. I suggest that in agroforestry landscapes, the effect of
forest fragments on spider diversity is less pronounced (see also Stenchly et al. 2011,
2012).
In chapter 2, I showed that local spider richness, abundance and biomass were
positively correlated with the number of concavities found in the trunks of shade trees
and that spider abundance and biomass increased in the presence of A. instabilis.
However, I did not find any correlation with canopy cover as I did with the ground
dwelling spiders. It seems that for the tree trunk spiders the identity of the tree on which
they build their webs is more important than canopy cover. Indeed, I found that local
spider richness; abundance and biomass were higher in non- Inga trees than in Inga trees,
probably because non-Inga trees were structurally more complex than Inga trees, which
in the region are characterized by their straight trunk and small tree diameter. Given that
intensification of coffee agroecosystems implies an increase in the proportion of Inga
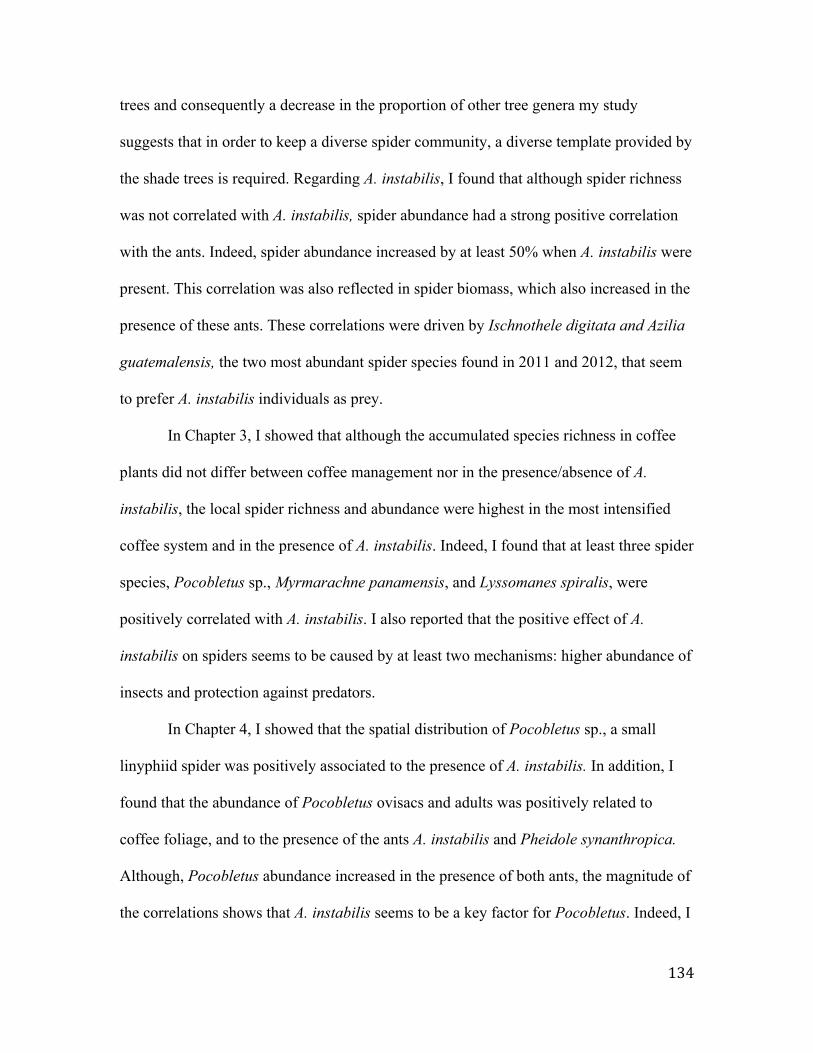
134
trees and consequently a decrease in the proportion of other tree genera my study
suggests that in order to keep a diverse spider community, a diverse template provided by
the shade trees is required. Regarding A. instabilis, I found that although spider richness
was not correlated with A. instabilis, spider abundance had a strong positive correlation
with the ants. Indeed, spider abundance increased by at least 50% when A. instabilis were
present. This correlation was also reflected in spider biomass, which also increased in the
presence of these ants. These correlations were driven by Ischnothele digitata and Azilia
guatemalensis, the two most abundant spider species found in 2011 and 2012, that seem
to prefer A. instabilis individuals as prey.
In Chapter 3, I showed that although the accumulated species richness in coffee
plants did not differ between coffee management nor in the presence/absence of A.
instabilis, the local spider richness and abundance were highest in the most intensified
coffee system and in the presence of A. instabilis. Indeed, I found that at least three spider
species, Pocobletus sp., Myrmarachne panamensis, and Lyssomanes spiralis, were
positively correlated with A. instabilis. I also reported that the positive effect of A.
instabilis on spiders seems to be caused by at least two mechanisms: higher abundance of
insects and protection against predators.
In Chapter 4, I showed that the spatial distribution of Pocobletus sp., a small
linyphiid spider was positively associated to the presence of A. instabilis. In addition, I
found that the abundance of Pocobletus ovisacs and adults was positively related to
coffee foliage, and to the presence of the ants A. instabilis and Pheidole synanthropica.
Although, Pocobletus abundance increased in the presence of both ants, the magnitude of
the correlations shows that A. instabilis seems to be a key factor for Pocobletus. Indeed, I
135
showed that in the presence of A. instabilis, the number of predators of Pocobletus
decreased, thus suggesting that these linyphiid spiders might gain enemy-free space in the
presence of A. instabilis. In addition, I reported that in the presence of A. instabilis, more
potential prey insects were found in the webs of Pocobletus, thus suggesting that this tiny
spider might take advantage of an increase in insect abundance.
Thus, my research on local and landscape factors and their relationship with
spider communities and diversity in tropical agroforestry systems at least opened three
new areas that require further research. First, the positive correlation between low-shade
coffee systems and local spider diversity found in the ground and coffee layers may be
linked with dispersal capabilities and prey availability, whereas the positive correlation
with plant characteristics (either coffee foliage or tree trunk characteristics) shows that
spiders may prefer to build their webs in more structurally complex plants and trees.
Second, the positive associations between A. instabilis and local spider richness and
abundance seem to be due to a combination of indirect effects, such as the higher
abundance of resources recorded in the presence of the ants and potential enemy-free
space, and direct effects, such as predation of the ants. Third, the low correlation value
between distance to forest and local spider richness and abundance suggest that distance
to forest is not an important variable in this agroforested landscape. I suggest that in
agroforestry landscapes, the effect of forest fragments on spider diversity is less
pronounced.

136
Overall, my research adds to the growing literature in agroforestry systems that
explores the influence of agricultural management, aggressive ants and landscape effects
on natural agents of biological control.