Embed Size (px)
Citation preview

Japan International Cooperation Agency (JICA) National Council for Climate Change and Clean Development Mechanism (CNCCMDL) The Study for the Promotion of CDM Projects in the Dominican Republic
THE DOMINICAN REPUBLIC NATIONAL ACTION PLAN FOR CDM
PROJECT DEVELOPMENT
FINAL REPORT
ANNEX I
TOOLS FOR CDM PROJECT DEVELOPMENT
December 2010
Japan International Cooperation Agency
EX CORPORATION
環境
JR
10-133

List of the Reports
Summary (Japanese)
Main Report (Japanese)
Summary (English)
Main Report (English)
Summary (Spanish)
Main Report (Spanish)
ANNEX I: Tools for CDM Project Development
ANNEX II: Seminars and Workshops
This is the ANNEX I.
The currency exchange rate used in this report is as follows.
U$1.00= JP¥91.10.

CONTENTS
1. Summary of the Tools for CDM Project Development .......................................... 1
2. PINs and Model PDDs .......................................................................................... 37
3. CDM Project Formulation Manual ..................................................................... 305
4. National CDM Project Portfolio ......................................................................... 395

1. Summary of the Tools for CDM Project
Development

Summary of
the Tools for CDM Project Development
1 PINs and Model PDDs
To encourage and facilitate CDM project development in the Dominican Republic, the Study
produced several Project Idea Notes (PINs) and model Project Design Document (PDD) for the
potential areas/sectors. This section outlines the process of selecting the areas sectors and
project prototypes of CDM in the course of the Study. The original PINs and model PDDs
produced are available in ANNEXES of this report.
1.1 Identification of Potential Projects
As a starting point of identifying the potential projects of CDM, JICA Study Team (JST)
presented the potential sectors and types of projects considered to be developed as CDM in the
Dominican Republic based on the information and materials obtained before this study visit.
The table below shows the potential sectors and type of projects and potentials analyzed by JST.
Table 1-1: Preliminary Analysis of Potential Sectors/Projects Types of CDM Potential Sector/Sub-Sector Current Status
A. Renewable Energy Sector Wind Power Potential study was carried out by the United States.
The estimated total potential was more than 10 thousand MW.
One project has already been registered at CDM Executive Board while the others still in the stage of PINs or plans.
Micro Hydropower State-Owned Hydropower Authority made a list of potential micro hydropower projects for their bidding as CDM projects.
Other Renewable Energy USAID provided assistance for development of micro renewables for 5 years until Sept. 2008. Renewables include bio-digester, wind power, and solar power
Those project plans has never been considered as CDM projects.
B. Agriculture Sugar production Energy saving in sugar factory
Project plan exists, but no effort of application for CDM project.
Bio-fuel (Bio-Ethanol) Production from sugarcane
PIN or project plan may exist.
Methane capture and energy utilization from piggery (anaerobic fermentation of pig manure)
Pilot plant exists according to information.
Community-based bio-diesel production from Jetropha
Detail unknown
C. Waste Management Methane capture and energy CDM project plan exists.
1

production Methane emission reduction by semi-aerobic landfill operation
JICA currently provides assistance. Now under trial of registering the project as CDM.
Methane emission reduction by composting of organic waste
No project planned
D. Industry CO2 reduction in cement industry PIN is now under preparation by cement industry E. Transport Public Transportation (Metro) Under consideration Fuel switch of motor vehicles (from LPG to CNG)
Under consideration
Introduction of bio-fuel for automobiles
Under consideration
F. Residential and Commercial (Demand Side Management) Introduction of solar water heater (conversion from electricity to solar energy) in hotels
Under consideration
Energy saving of light bulbs PIN under preparation
On the other hand, ONMDL presented the current status of CDM projects by showing the
following CDM project portfolio outlining the CDM project now under preparation of PIN or
PDD.
Table 1-2: CDM Project Portfolio under Preparation of PIN or PDD (September 2008)
Sector Project Proponent Project Outline Ethanol Dominican Forbes
Energy Generation with Biomass and Ethanol Production
Ethanol Ammadol Ethanol Production from Beet Plantation Methane North Santo Domingo
City Hall Methane Capture Project in the Duquesa Sanitary Landfill
Methane Chamber of Commerce of San José de Ocoa
Methane Capture Project in Sanitary Landfill
Methane SANUT Methane Capture Project from swine residues Wind Power EGE Haina Various Wind Power Projects Hydropower Rafael Beriguete Various Hydropower Projects Fuel Switch EGE Haina Fuel Switch Project from Bunker to LNG Fuel Switch EGE Haina Fuel Switch Project from Oil to LNG Bio-fuel IDDI Bio-diesel Production Bio-fuel IDDI Biomass Power Generation and Ethanol Production Bio-fuel Dominican
Induspalma Mercasil Group
Methane Capture and Power Generation from Palm Oil Effluent
Cement Dominica CEMEX Use of Fly Ash for Clinker Production in Cement Industry
Multiple Sector
Vicini Group Multiple Projects including Wind, Bagasse and Cattle.
These information and data presented by JST and ONMDL are compiled into the primary list of
potential project for CDM as shown in the next table.
2

Table 1-3: Primary List of Potential CDM Projects in the Dominican Republic
Areas/Sectors Types of CDM Projects
Renewable Energy Wind power
Hydropower
Biomass Power
Fuel Switch Fuel switch in power generation (from oil to natural gas)
Agriculture Methane capture and utilization in pig farms
Bio-diesel production of Jatropha curcas
Ethanol production from sugarcane
Industry CO2 emission reduction in cement industry (Increased use of fly ash in clinker production)
Energy efficiency improvement in sugar industry
Methane capture and utilization in palm oil industry
Bio-diesel production from biomass sources
Ethanol production from biomass sources
Waste Management Landfill methane capture and utilization
Methane avoidance by semi-aerobic treatment of waste at final disposal landfill
Methane avoidance by composting of organic waste
Transport Introduction of public transport system (subway)
Fuel switch (from gasoline/diesel oil to compressed natural gas: CNG)
Introduction of bio-diesel as motor fuel
Residential/Business/ Commercial
Introduction of solar water heater in hotels and buildings
Introduction of efficient lighting (Conversion from incandescent lamp to florescent bulb)
1.2 Selection of PIN/Model PDD Preparation Projects
1.2.1 Selection Process
Selection of PIN and model PDD preparation projects was made in accordance with the
selection flow shown in the figure on next page.
3

Figure 1-1: Flow of Selecting the CDM Project for PIN Preparation
1.2.2 Selection Criteria
Based on the explanation and agreement made in the meeting of Inception Report, the following
criteria are adopted for 1st screening and 2nd screening of the projects to determine the PIN
preparation.
Table 1-4: The Criteria for Selection of CDM Projects for PIN Preparation
Screening Criteria Parameters 1st Screening Consistency with
sustainable development of the country
GHGs emission reduction effect Other potential socio-economic and
environment benefit Consistency with the national development priority
Consistency with national development policies
Consistency with sectoral development priority
Eligibility of the Project as CDM
Additionality Non-diversion of Official Development
Assistance
Existing PINs and CDM Project Plans
New Potential CDM Projects Identified from the Study
Primary List of Potential CDM
1st Screening of the CDM Projects
Long List of Potential CDM
(1) Interviews with relevant stakeholders
(2) Visit of potential CDM project sites
(3) Collection of further information and data
Determining the types of CDM projects for PIN/Model PDD Preparation
Assessment of the Potential of Long-Listed CDM Projects
2nd Screening of the CDM Projects
4
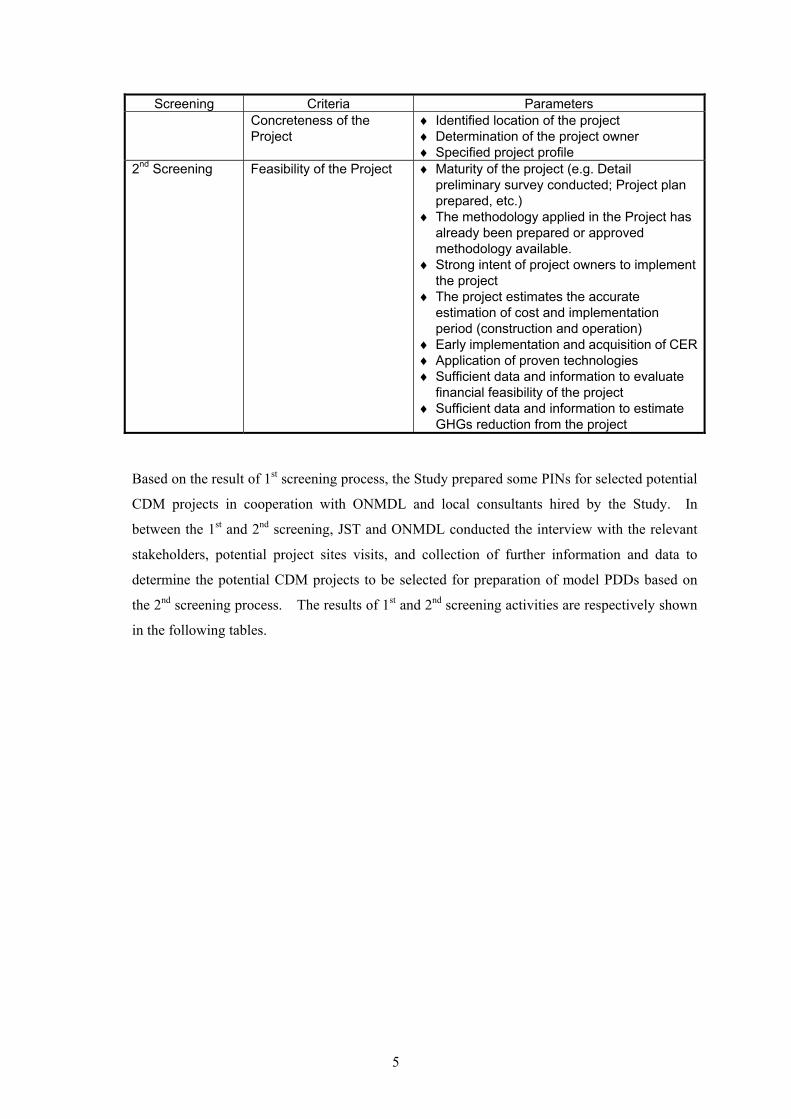
Screening Criteria Parameters Concreteness of the Project
Identified location of the project Determination of the project owner Specified project profile
2nd Screening Feasibility of the Project Maturity of the project (e.g. Detail preliminary survey conducted; Project plan prepared, etc.)
The methodology applied in the Project has already been prepared or approved methodology available.
Strong intent of project owners to implement the project
The project estimates the accurate estimation of cost and implementation period (construction and operation)
Early implementation and acquisition of CER Application of proven technologies Sufficient data and information to evaluate
financial feasibility of the project Sufficient data and information to estimate
GHGs reduction from the project
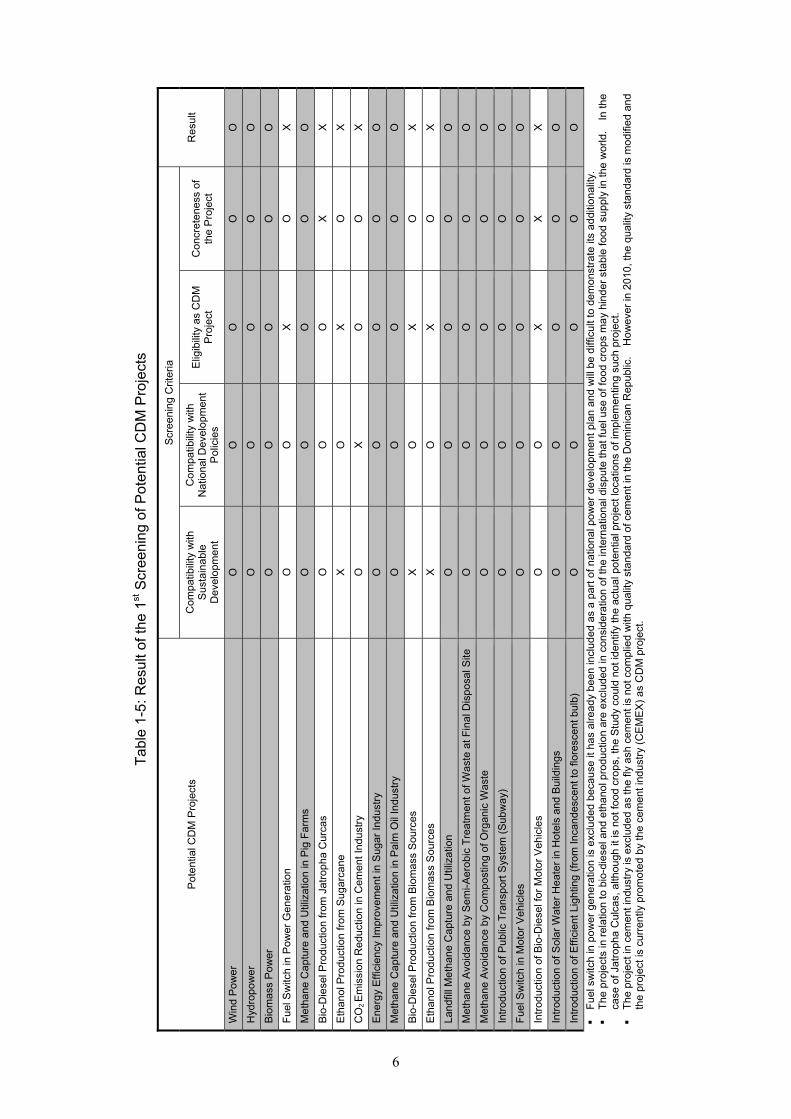
Based on the result of 1st screening process, the Study prepared some PINs for selected potential
CDM projects in cooperation with ONMDL and local consultants hired by the Study. In
between the 1st and 2nd screening, JST and ONMDL conducted the interview with the relevant
stakeholders, potential project sites visits, and collection of further information and data to
determine the potential CDM projects to be selected for preparation of model PDDs based on
the 2nd screening process. The results of 1st and 2nd screening activities are respectively shown
in the following tables.
5
Tab
le 1
-5: R
esul
t of t
he 1
st S
cree
ning
of P
oten
tial C
DM
Pro
ject
s
Pot
entia
l CD
M P
roje
cts
Scr
eeni
ng C
riter
ia
Res
ult
Com
patib
ility
with
S
usta
inab
le
Dev
elop
men
t
Com
patib
ility
with
N
atio
nal D
evel
opm
ent
Po
licie
s
Elig
ibili
ty a
s C
DM
P
roje
ct
Con
cret
enes
s of
th
e P
roje
ct
Win
d P
owe
r O
O
O
O
O
Hyd
ropo
we
r O
O
O
O
O
Bio
ma
ss P
ow
er
O
O
O
O
O
Fue
l Sw
itch
in P
ower
Gen
era
tion
O
O
X
O
X
Met
hane
Cap
ture
and
Util
izat
ion
in P
ig F
arm
s O
O
O
O
O
Bio
-Die
sel P
rodu
ctio
n fr
om J
atro
pha
Cur
cas
O
O
O
X
X
Eth
anol
Pro
duct
ion
from
Sug
arc
ane
X
O
X
O
X
CO
2 E
mis
sion
Re
duct
ion
in C
emen
t In
dust
ry
O
X
O
O
X
Ene
rgy
Eff
icie
ncy
Impr
ovem
ent i
n S
ugar
Indu
stry
O
O
O
O
O
Met
hane
Cap
ture
and
Util
izat
ion
in P
alm
Oil
Indu
stry
O
O
O
O
O
Bio
-Die
sel P
rodu
ctio
n fr
om B
iom
ass
Sou
rces
X
O
X
O
X
Eth
anol
Pro
duct
ion
from
Bio
mas
s S
ourc
es
X
O
X
O
X
Land
fill M
etha
ne C
aptu
re a
nd U
tiliz
atio
n O
O
O
O
O
Met
hane
Avo
ida
nce
by
Sem
i-Ae
robi
c T
reat
men
t of W
aste
at F
inal
Dis
posa
l Site
O
O
O
O
O
Met
hane
Avo
ida
nce
by
Com
post
ing
of O
rgan
ic W
aste
O
O
O
O
O
Intr
oduc
tion
of P
ublic
Tra
nspo
rt S
yste
m (
Sub
wa
y)
O
O
O
O
O
Fue
l Sw
itch
in M
otor
Veh
icle
s O
O
O
O
O
Intr
oduc
tion
of B
io-D
iese
l for
Mot
or
Veh
icle
s O
O
X
X
X
Intr
oduc
tion
of S
olar
Wat
er H
eat
er
in H
otel
s an
d B
uild
ings
O
O
O
O
O
Intr
oduc
tion
of E
ffic
ient
Lig
htin
g (f
rom
Inca
ndes
cent
to fl
ores
cent
bul
b)
O
O
O
O
O
F
uel s
witc
h in
po
we
r ge
nera
tion
is e
xclu
ded
beca
use
it h
as a
lread
y be
en in
clud
ed a
s a
part
of n
atio
nal p
owe
r de
velo
pm
ent p
lan
and
will
be
diff
icul
t to
dem
onst
rate
its
addi
tiona
lity.
The
pro
ject
s in
rel
atio
n to
bio
-die
sel a
nd e
than
ol p
rodu
ctio
n ar
e e
xclu
ded
in c
onsi
dera
tion
of th
e in
tern
atio
nal d
ispu
te th
at f
uel u
se o
f fo
od c
rops
ma
y hi
nde
r st
able
food
sup
ply
in th
e w
orld
. I
n th
e
case
of J
atro
pha
Cul
cas,
alth
ough
it is
not
food
cro
ps, t
he S
tud
y co
uld
not i
dent
ify th
e ac
tual
pot
entia
l pro
ject
loca
tions
of i
mpl
emen
ting
such
pro
ject
.
The
pro
ject
in c
emen
t ind
ustr
y is
exc
lude
d as
the
fly a
sh c
emen
t is
not c
ompl
ied
with
qua
lity
stan
dard
of c
emen
t in
the
Dom
inic
an R
epub
lic.
How
ever
in 2
010,
the
qual
ity s
tand
ard
is m
odi
fied
and
the
proj
ect i
s cu
rren
tly p
rom
oted
by
the
cem
ent i
ndus
try
(CE
ME
X)
as
CD
M p
roje
ct.
6

Tab
le 1
-6: R
esul
t of t
he 2
nd S
cree
ning
of P
oten
tial C
DM
Pro
ject
s
Pot
entia
l CD
M P
roje
cts
Scr
een
ing
Cri
teria
R
esul
t R
easo
ns fo
r E
xclu
sio
n
Via
bili
ty
Rep
lica
bilit
yM
arke
t Nee
ds
Win
d P
ow
er
O
O
O
X
S
ince
ther
e is
one
reg
iste
red
pro
ject
that
can
be
refe
rred
for
de
velo
pmen
t of s
imila
r C
DM
pro
ject
s; th
eref
ore,
it is
not
ne
cess
ary
to p
rodu
ce P
INs
and
mod
el P
DD
s.
Hyd
ropo
we
r O
O
O
O
Bio
ma
ss P
ow
er
O
O
O
O
Met
hane
Cap
ture
and
Util
izat
ion
in P
ig F
arm
s O
O
O
O
Ene
rgy
Eff
icie
ncy
Impr
ovem
ent i
n S
ugar
Indu
stry
O
X
X
X
Due
to c
onve
rsio
n to
pro
duct
ion
of e
than
ol a
nd b
io-d
iese
l in
suga
r in
dust
ry, t
he
mar
ket n
eeds
and
rep
licab
ility
of t
his
CD
M
proj
ect i
s no
t hig
h
Met
hane
Cap
ture
and
Util
izat
ion
in P
alm
Oil
Indu
stry
O
X
X
X
T
he n
umbe
r of
Pal
m o
il in
dust
ry is
lim
ited
whi
le th
e re
leva
nt
indu
strie
s ha
s en
ough
cap
abili
ty o
f de
velo
ping
CD
M p
roje
cts
by
them
selv
es.
Land
fill M
etha
ne C
aptu
re a
nd U
tiliz
atio
n O
O
O
X
Sin
ce o
ne la
ndfil
l met
hane
cap
ture
pro
ject
is in
the
proc
ess
of
deve
lopi
ng a
PD
D, t
he S
tud
y e
xclu
ded
prep
arat
ion
of m
odel
P
DD
for
this
typ
e o
f pro
ject
.
Met
hane
Avo
ida
nce
by
Sem
i-Ae
robi
c T
reat
men
t of
Was
te a
t Fin
al D
ispo
sal S
ite
O
O
O
X
A
noth
er J
ICA
Pro
ject
is c
urre
ntly
in p
roce
ss o
f dev
elop
ing
this
pr
ojec
t und
er C
DM
.
Met
hane
Avo
ida
nce
by
Com
post
ing
of O
rgan
ic
Was
te
O
O
O
O
Intr
oduc
tion
of P
ublic
Tra
nspo
rt S
yste
m (
Sub
wa
y)
O
X
X
X
A
s to
sub
wa
y p
roje
ct, r
elev
ant o
rgan
izat
ions
are
in th
e pr
oces
s of
dev
elop
ing
it as
CD
M p
roje
ct w
hile
rep
licab
ility
of
sim
ilar
proj
ect i
s lo
w w
ithin
the
cou
ntry
.
Fue
l Sw
itch
in M
otor
Veh
icle
s X
O
X
X
Mat
urity
of
proj
ect i
s lo
w a
nd e
stim
ated
diff
icul
t to
deve
lop
it as
CD
M p
roje
ct w
ithin
the
limite
d tim
e.
Intr
oduc
tion
of S
olar
Wat
er H
eat
er
in H
otel
s an
d B
uild
ings
X
O
X
X
Mat
urity
of
proj
ect i
s lo
w a
nd e
stim
ated
diff
icul
t to
deve
lop
it as
CD
M p
roje
ct w
ithin
the
limite
d tim
e.
Intr
oduc
tion
of E
ffic
ient
Lig
htin
g (f
rom
Inca
ndes
cent
to
flor
esce
nt b
ulb)
X
O
X
X
Mat
urity
of
proj
ect i
s lo
w a
nd e
stim
ated
diff
icul
t to
deve
lop
it as
CD
M p
roje
ct w
ithin
the
limite
d tim
e.
7

1.2.3 Potential Projects Selected for Preparation of Model PDDs
Through a series of selection process mentioned above, the following potential sectors and
projects were selected for preparation of model PDDs.
Hydropower
Biomass power generation
Methane capture and utilization in pig farms
Methane avoidance by composting of organic waste
The model PDDs for the above potential CDM projects is available in this ANNEX. These
model PDDs are prepared for the use by the potential CDM project proponent to understand the
contents of PDDs required for registration under CDM. It also provides examples of GHGs
reduction estimation for each type of CDM projects based on the assumption of project profile
and outline. Such information can help estimating the potentials of GHGs emissions reduction
and carbon credit from the projects that proponents plan to carry out.
8
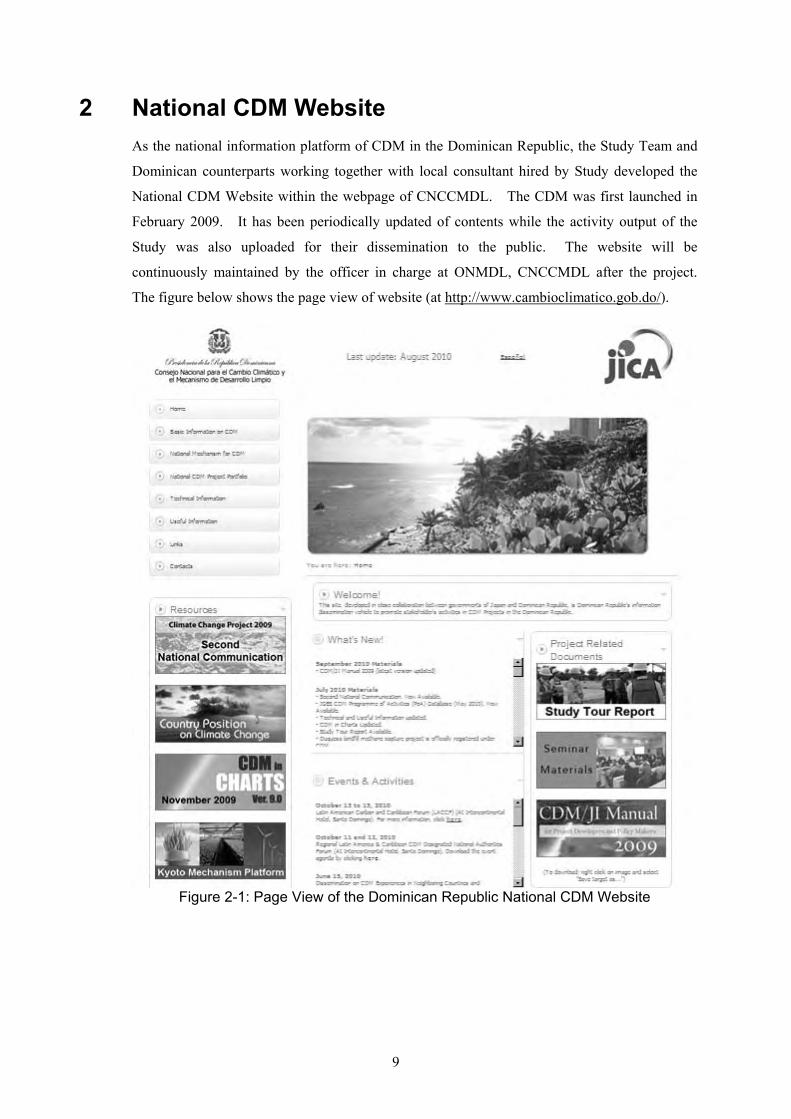
2 National CDM Website
As the national information platform of CDM in the Dominican Republic, the Study Team and
Dominican counterparts working together with local consultant hired by Study developed the
National CDM Website within the webpage of CNCCMDL. The CDM was first launched in
February 2009. It has been periodically updated of contents while the activity output of the
Study was also uploaded for their dissemination to the public. The website will be
continuously maintained by the officer in charge at ONMDL, CNCCMDL after the project.
The figure below shows the page view of website (at http://www.cambioclimatico.gob.do/).
9
Figure 2-1: Page View of the Dominican Republic National CDM Website

3 CDM Project Formulation Manual
The CDM Project Formulation Manual is prepared in Spanish for the use by the potential
project proponents as the guidebook for CDM project development. Based on the reviews and
discussions about the contents, the manual is finalized with the contents outlined in the table
below.
Table 3-1: Contents of CDM Project Formulation Manual
1. Introduction to CDM
1.1 What is CDM?
1.2 Key Concepts of CDM
1.3 CDM Institutions
1.4 CDM Typology
1.5 CDM Project Cycle
1.6 Costs related to CDM project cycle
1.7 Recent Status of CDM
2. Project Design Document
2.1 Overview of the PDD
2.2 Contents of the PDD
2.3 A/R CDM Project Activities: Technical Aspects
This manual will be periodically reviewed and updated by ONMDL, CNCCMDL to provide
potential CDM project proponents with the latest technical information and data on CDM
project documentation. The complete document of this Manual is available in this ANNEX.
10

4 National CDM Portfolio
The Study produced the national CDM portfolio of the Dominican Republic based on the CDM
project proposals submitted to ONMDL in the form of PINs and/or PDDs for the purpose of
promoting the proposed CDM projects to potential investors, financiers and buyers of CERs at
domestic as well as international levels. The portfolio is uploaded to the Dominican Republic
CDM website so that any interested individuals or parties can access the latest information and
details of the CDM projects proposed in this country.
4.1 Basic Structure of the National CDM Portfolio
The national CDM portfolio currently uploaded in the Dominican Republic CDM website is as
shown in the figure below.
Figure 4-1: Page View of the National CDM Portfolio on the CDM Website
The CDM portfolio is first given on the website in the form of the list of CDM projects
recognized by ONMDL, DNA of the Dominican Republic. There are currently 40 projects
listed in this portfolio.
In addition, the project details and information on the latest update are also available for each of
the listed CDM projects in the format as shown in the next figure.
11
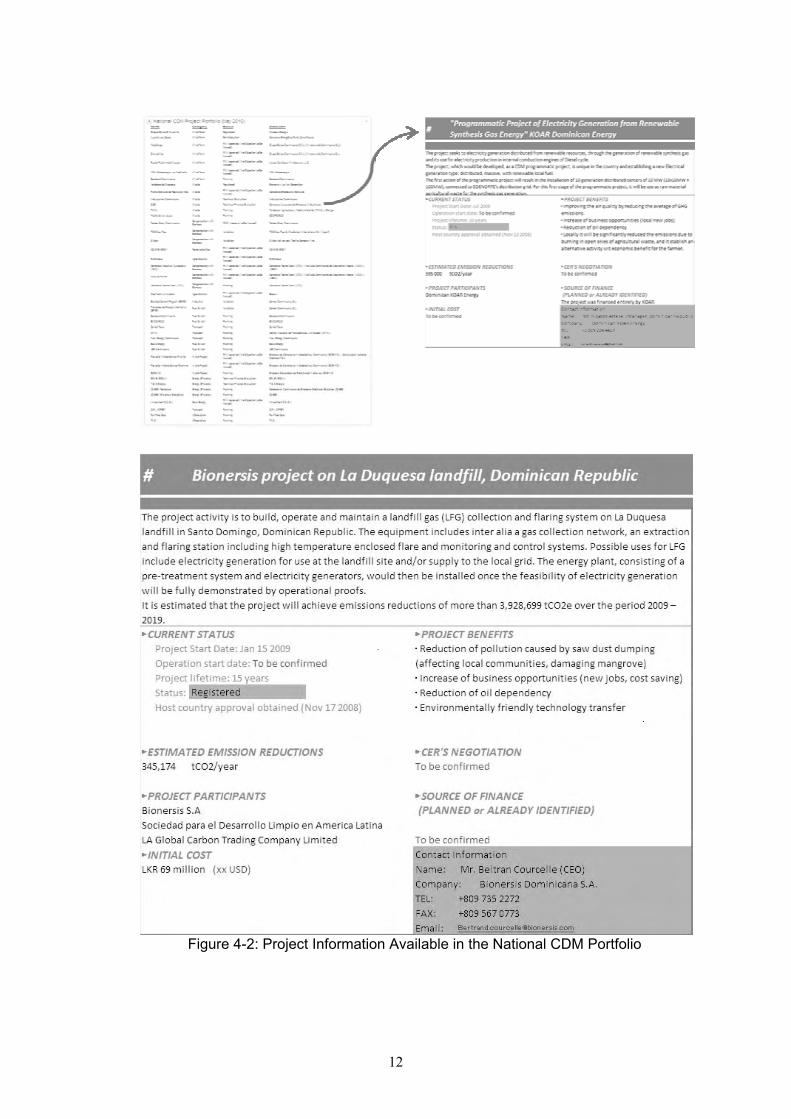
Figure 4-2: Project Information Available in the National CDM Portfolio
12

4.2 CDM Project Development in the Current National CDM Portfolio
Reviewing the current national CDM portfolio, there are 2 (two) registered CDM projects in the
Dominican Republic, i.e. one wind power project and one landfill methane capture project.
However, the first registered wind power project has not been implemented so far and is
currently reintroduced in the different location while the landfill methane capture project is
about to start its full-scale project operation. In addition, there are 4 (four) CDM projects now
under validation by the relevant DOEs (Designated Operation Entities) to apply for registration
while the remaining 34 CDM projects are under preparation of PDDs or PINs as shown in the
table below.
Table 4-1: CDM Project Development Status in National CDM Portfolio
Development Status Number of Projects
Estimated CERs (tonsCO2/yr)
Registered CDM Projects 2 465,876
CDM projects at Validation 4 466,504
CDM projects under PDD preparation (PIN Prepared)
13 1,224,898
CDM Projects under PIN preparation 21 8,390,217
Total 40 10,547,495
Most of the projects are still in the early stage of CDM project development. Even if all the
projects currently under PDD preparation are registered and implemented, the estimated total
CERs will be more or less 2 million tons of CO2 equivalent.
In terms of the sectors and areas, the composition of the projects in the national CDM portfolio
is illustrated as shown in the table below.
Table 4-2: Composition of CDM Projects in National CDM Portfolio by Sectors/Areas
Sectors/Areas Number of Projects Estimated CERs (tonsCO2/yr)
Energy Industries 23 3,179,556 Renewable Sources 20 2,479,556 Non-Renewable Sources 3 700,000 Other Energy Related 4 157,000 Industry 2 276,725 Agriculture 1 6,000 Transport 4 210,000 Waste Handling and Disposal 4 432,977 Afforestation and Reforestation 2 6,401,000
Total 40 10,547,495
Although the afforestation and reforestation projects totally estimate the CER as around 6.54
million tons of CO2, they are still in the early stage of CDM project development without any
13
PDD preparation. It is difficult to consider that they can be registered and implemented before
the year 2012. Most of the projects that are matured with preparation of PDDs and/or at
validation stage come from energy, industry and waste management sector. The country has to
promote CDM projects in the sectors and areas where the projects can be realized within the
short-term by 2012.
The complete list of CDM projects recognized by ONMDL, CNCCMDL is shown in the next
table.
14

Tab
le 4
-3: T
he C
urre
nt L
ist o
f CD
M P
roje
cts
in th
e N
atio
nal C
DM
Por
tfolio
Nº
Cate
gory
Ch
arac
teri
stic
s D
escr
ipti
on
Stat
us
CERs
/yea
rIn
stit
utio
n
1 Re
new
able
Sou
rces
W
ind
Farm
64M
W
Cons
truc
tion,
inst
alla
tion
and
star
t-up
of t
he w
ind
gene
rato
rs w
ith 8
50 k
W o
f po
wer
by
win
d ge
nera
tor,
tr
iple
-bla
de r
otor
and
as
ynch
rono
us g
ener
ator
of
four
pol
es, c
onst
itute
the
best
te
chno
logy
for
optim
al u
se o
f th
e ex
istin
g re
sour
ces.
Win
d Fa
rm E
l Gua
nillo
Regi
ster
ed
115.
879
Gam
esa
ener
gy
2 Re
new
able
Sou
rces
Co
gene
ratio
n w
ith A
gro
fore
stry
Res
idue
s
Use
and
ene
rgy
appr
ecia
tion
fr
om a
gric
ultu
ral w
aste
(ric
e hu
sk, c
ocon
ut w
aste
and
ot
her.
Tex
tile
Off
shor
e Si
te
Dom
inic
an (T
OS-
2Rio
s)
In v
alid
atio
n pr
oces
s, In
Ev
alua
tion
of th
e PD
D
150,
000
TOS-
Dos
Rio
s &
One
Ca
rbon
Inte
rnat
iona
l B.
V. (A
gent
)
3 Re
new
able
Sou
rces
W
ind
Farm
25.
2MW
W
ind
proj
ect o
f 25.
2 M
W, L
os
Coco
s Re
intr
oduc
tion
51,0
00Co
nsor
tium
Ene
rget
ic
Punt
a Ca
na-M
acao
and
EG
E-H
aina
4 Re
new
able
Sou
rces
St
eam
Gen
erat
ion
from
Bi
omas
s Fo
ssil
fuel
sw
itch
by b
iom
ass
for
stea
m g
ener
atio
n.
In v
alid
atio
n pr
oces
s, In
ev
alua
tion
of th
e PD
D
39,7
79G
ildan
Act
ivew
ear,
Te
xtile
Com
pany
Inc.
15
Nº
Cate
gory
Ch
arac
teri
stic
s D
escr
ipti
on
Stat
us
CERs
/yea
rIn
stit
utio
n
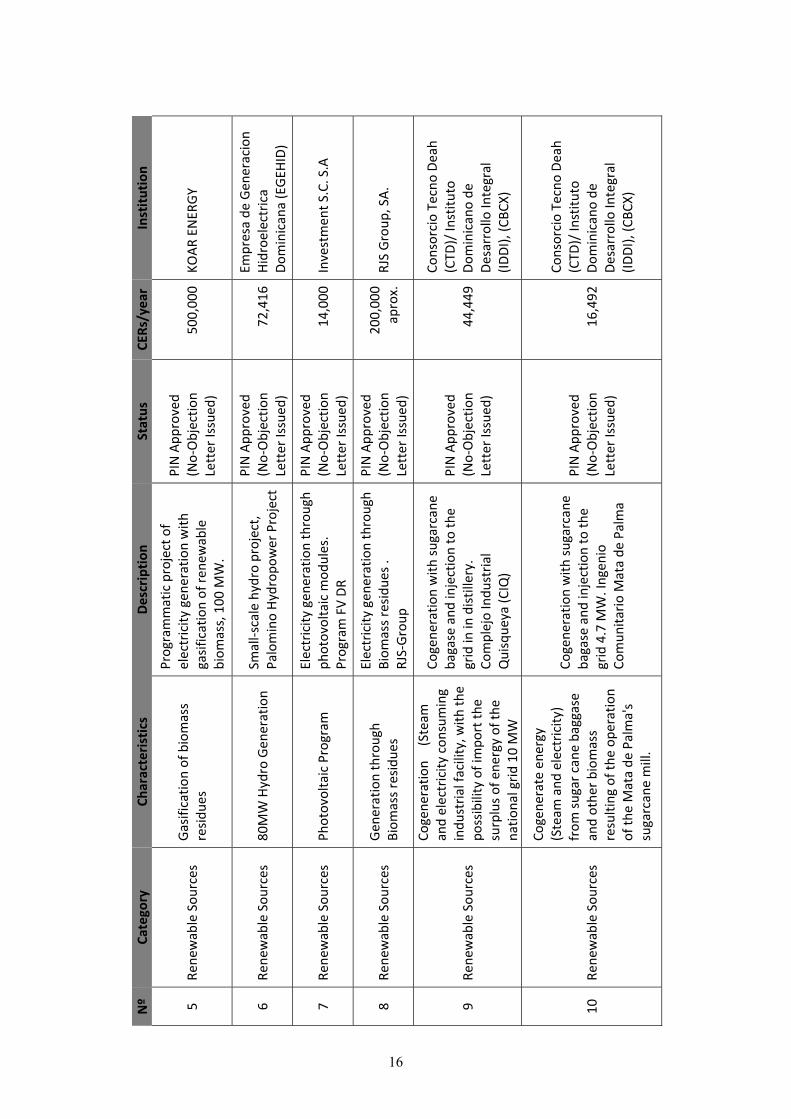
5 Re
new
able
Sou
rces
G
asifi
catio
n of
bio
mas
s re
sidu
es
Prog
ram
mat
ic p
roje
ct o
f el
ectr
icity
gen
erat
ion
with
ga
sific
atio
n of
ren
ewab
le
biom
ass,
100
MW
.
PIN
App
rove
d (N
o-O
bjec
tion
Lett
er Is
sued
)
500,
000
KOA
R EN
ERG
Y
6 Re
new
able
Sou
rces
80
MW
Hyd
ro G
ener
atio
n Sm
all-s
cale
hyd
ro p
roje
ct,
Pa
lom
ino
Hyd
ropo
wer
Pro
ject
PIN
App
rove
d (N
o-O
bjec
tion
Lett
er Is
sued
)
72,4
16Em
pres
a de
Gen
erac
ion
Hid
roel
ectr
ica
Dom
inic
ana
(EG
EHID
)
7 Re
new
able
Sou
rces
Ph
otov
olta
ic P
rogr
am
Elec
tric
ity g
ener
atio
n th
roug
h ph
otov
olta
ic m
odul
es.
Pr
ogra
m F
V D
R
PIN
App
rove
d (N
o-O
bjec
tion
Lett
er Is
sued
)
14,0
00In
vest
men
t S.C
. S.A
8 Re
new
able
Sou
rces
G
ener
atio
n th
roug
h Bi
omas
s re
sidu
es
Elec
tric
ity g
ener
atio
n th
roug
h Bi
omas
s re
sidu
es .
RJ
S-G
roup
PIN
App
rove
d (N
o-O
bjec
tion
Lett
er Is
sued
)
200,
000
apro
x.RJ
S G
roup
, SA
.
9 Re
new
able
Sou
rces
Coge
nera
tion
(St
eam
an
d el
ectr
icity
con
sum
ing
indu
stri
al fa
cilit
y, w
ith th
e po
ssib
ility
of i
mpo
rt th
e su
rplu
s of
ene
rgy
of th
e na
tiona
l gri
d 10
MW
Coge
nera
tion
with
sug
arca
ne
baga
se a
nd in
ject
ion
to th
e gr
id in
in d
istil
lery
.
Com
plej
o In
dust
rial
Q
uisq
ueya
(CIQ
)
PIN
App
rove
d (N
o-O
bjec
tion
Lett
er Is
sued
)
44,4
49
Cons
orci
o Te
cno
Dea
h (C
TD)/
Inst
ituto
D
omin
ican
o de
D
esar
rollo
Inte
gral
(ID
DI),
(CBC
X)
10
Rene
wab
le S
ourc
es
Coge
nera
te e
nerg
y
(Ste
am a
nd e
lect
rici
ty)
from
sug
ar c
ane
bagg
ase
and
othe
r bi
omas
s re
sulti
ng o
f the
ope
ratio
n of
the
Mat
a de
Pal
ma'
s su
garc
ane
mill
.
Coge
nera
tion
with
sug
arca
ne
baga
se a
nd in
ject
ion
to th
e gr
id 4
.7 M
W. I
ngen
io
Com
unita
rio
Mat
a de
Pal
ma
PIN
App
rove
d (N
o-O
bjec
tion
Lett
er Is
sued
)
16,4
92
Cons
orci
o Te
cno
Dea
h (C
TD)/
Inst
ituto
D
omin
ican
o de
D
esar
rollo
Inte
gral
(ID
DI),
(CBC
X)
16

Nº
Cate
gory
Ch
arac
teri
stic
s D
escr
ipti
on
Stat
us
CERs
/yea
rIn
stit
utio
n
11
Rene
wab
le S
ourc
es
Win
d G
ener
ator
s of
85
0KW
Inst
alla
tion
of 4
0 w
ind
gene
rato
rs o
f 8
50 K
W, o
f po
wer
(ele
ctri
c su
b-st
atio
ns
and
othe
rs).
Mat
afon
go W
ind
Farm
PIN
App
rove
d (N
o-O
bjec
tion
Lett
er Is
sued
)
62,7
65
Gru
po E
ólic
o D
omin
ican
o C
X A
. (In
vera
vant
e D
omin
ican
a S.
A.
12
Rene
wab
le S
ourc
es
Win
d G
ener
ator
s of
85
0KW
Inst
alla
tion
of 4
0 w
ind
gene
rato
rs o
f 8
50 K
W, o
f po
wer
(ele
ctri
c su
b-st
atio
ns
and
othe
rs).
Gra
nadi
llos
Win
d Fa
rm
PIN
App
rove
d (N
o-O
bjec
tion
Lett
er Is
sued
)
65,1
78
Gru
po E
ólic
o D
omin
ican
o C
X A
. (In
vera
vant
e D
omin
ican
a S.
A.
13
Rene
wab
le S
ourc
es
50M
W H
ydro
Gen
erat
ion
dist
ribu
ted
in tw
o Pe
lton
vert
ical
axi
s un
its o
f 25
MW
Smal
l-sca
le h
ydro
pro
ject
,
Pi
nalit
o H
ydro
pow
er P
roje
ct
PIN
App
rove
d (N
o-O
bjec
tion
Lett
er Is
sued
)
97,8
20
Empr
esa
de G
ener
ació
n
Hid
roel
ectr
ica
Dom
inic
ana
(EG
EHID
)/
Cont
ruct
ora
Nor
bert
o O
debr
echt
S.A
14
Rene
wab
le S
ourc
es
Gen
erat
ion
thro
ugh
Biom
ass
resi
dues
Foss
il Fu
el S
witc
hing
by
biog
as a
nd b
iom
ass.
D
estil
eria
La
Isab
ela
PIN
App
rove
d (N
o-O
bjec
tion
Lett
er Is
sued
)
27,0
00Ec
osur
15
Rene
wab
le S
ourc
es
Win
d G
ener
ator
s of
11
5KW
Inst
alla
tion
of 5
8 tu
rbin
e of
2M
w o
f pow
er w
ith 8
0 m
ts
heig
ht, (
elec
tric
sub
-sta
tion.
Pu
erto
Pla
ta-Im
bert
Win
d Fa
rm.
PIN
App
rove
d (N
o-O
bjec
tion
Lett
er Is
sued
)
65,1
78Ja
sper
Car
ibbe
an W
ind
pow
er L
.L.C
.
17

Nº
Cate
gory
Ch
arac
teri
stic
s D
escr
ipti
on
Stat
us
CERs
/yea
rIn
stit
utio
n
16
Rene
wab
le S
ourc
es
Win
d G
ener
ator
s of
10
KW
Inst
alla
tion
of 1
0 w
ind-
gene
rato
rs o
f 100
0 kW
ea
ch, i
f the
mea
sure
men
ts
are
abov
e co
uld
vary
the
pow
er o
f the
mac
hine
s. L
a M
adri
leña
Win
d Fa
rm
PIN
( in
ev
alua
tion)
19
,600
MD
L Cu
ba e
nerg
ia
17
Fuel
sw
itch
Fuel
sw
itch
HFO
by
Gas
N
atur
al
Repl
acem
ent o
f HFO
Nº6
by
Nat
ural
Gas
. 112
MW
Pl
anni
ng
200,
000
Seab
oard
Dom
inic
ana
18
Rene
wab
le S
ourc
es
Win
d Fa
rms
Win
d Fa
rm o
f 100
MW
Pl
anni
ng
300,
000
Seab
oard
Dom
inic
ana
19
Rene
wab
le S
ourc
es
Fuel
sw
itch
from
die
sel b
y Re
new
able
Bio
mas
s. 1
M
W
Die
sel s
witc
h by
ren
ewab
le
biom
ass
prod
uctio
n pl
ant o
f co
coa.
Pl
anni
ng
6,00
0BI
OCA
FCA
O, S
A
20
Non
ren
ewab
le
sour
ces
Fuel
sw
itch
HFO
by
Nat
ural
Gas
Re
plac
emen
t of H
FO N
º6 b
y N
atur
al G
as. 3
00M
W
Plan
ning
50
0,00
0Ba
sic
Ener
gy
21
Fuel
sw
itch
Fuel
sw
itch
from
die
sel b
y N
atur
al G
as. P
oA
Prog
ram
mat
ic p
roje
ct o
f sw
itchi
ng d
iese
l by
Nat
ural
G
as in
hea
t gen
erat
ion
and
elec
tric
ity in
Indu
stry
and
H
otel
Sec
tor.
Plan
ning
A
ES D
omin
ican
a
18

Nº
Cate
gory
Ch
arac
teri
stic
s D
escr
ipti
on
Stat
us
CERs
/yea
rIn
stit
utio
n
22
Rene
wab
le S
ourc
es
Win
d Fa
rms
Win
d pr
ojec
t of 2
5.2
MW
, Q
uilv
io C
abre
ra
Rein
trod
uctio
n 16
,000
Cons
ortiu
m E
nerg
etic
Pu
nta
Cana
-Mac
ao a
nd
EGE-
Hai
na
23
Rene
wab
le S
ourc
es
119
MW
in h
ydro
ge
nera
tion
5 H
ydro
pro
ject
s of
sm
all-s
cale
and
2 o
f la
rge-
scal
e Pl
anni
ng
616,
000
Empr
esa
Gen
erad
ora
de
Elec
tric
idad
Hid
rául
ica,
EG
EHID
24
Ener
gy E
ffic
ienc
y y
Rene
wab
le E
nerg
y
Ener
gy E
ffic
ienc
y M
easu
res
and
Rene
wab
le
Ener
gy
Ener
gy E
ffic
ienc
y Pr
ojec
ts
Tech
nica
l-fin
ance
ev
alua
tion
34,0
00En
ergi
as R
enov
able
s A
ltern
ativ
as
25
Ener
gy e
ffic
ienc
y Re
plac
emen
t of
T12
and
T8
ligh
tnin
g by
T5
Repl
acem
ent 1
50,0
00
low
-eff
icie
ncy
bulb
s by
hig
h ef
ficen
cy b
ulbs
in p
ublic
bu
ildin
gs
Plan
ning
33
,000
Corp
orac
ión
Dom
inic
ana
de E
mpr
esas
Elé
ctri
cas
Esta
tale
s, C
DEE
E
26
Ener
gy E
ffic
ienc
y im
prov
emen
t
Ener
gy E
ffic
ienc
y by
sm
art
devi
ces
or r
epla
cing
hig
h co
msu
mpt
ion
appl
ianc
es
Ener
gy E
ffic
ienc
y M
easu
res
in
Hot
els,
thro
ugh
the
inst
alla
tion
of s
mar
t dev
ices
in
roo
ms
and
repl
acem
ent o
f in
divi
dual
s A
/C u
nits
by
Chill
ers
Tech
nica
l-fin
ance
ev
alua
tion
40,0
00T
& S
Ene
rgia
27
Ener
gy e
ffic
ienc
y Im
prov
emen
t of t
he
effic
ienc
y of
ele
ctri
city
di
stri
butio
n
Com
pens
atio
n of
the
reac
tive
pow
er
Plan
ning
50
,000
CDEE
E
28
Indu
stri
al
Incr
easi
ng o
f add
ition
s in
th
e ce
men
t pro
duct
ion
Add
ictio
ns u
se to
red
uce
the
perc
enta
ge o
f clin
ker i
n ce
men
t pro
duct
ion.
Ble
nded
ce
men
t pro
ject
.
Valid
atio
n 12
7,83
6Ce
mex
D
omin
ican
, S.A
.
19
Nº
Cate
gory
Ch
arac
teri
stic
s D
escr
ipti
on
Stat
us
CERs
/yea
rIn
stit
utio
n
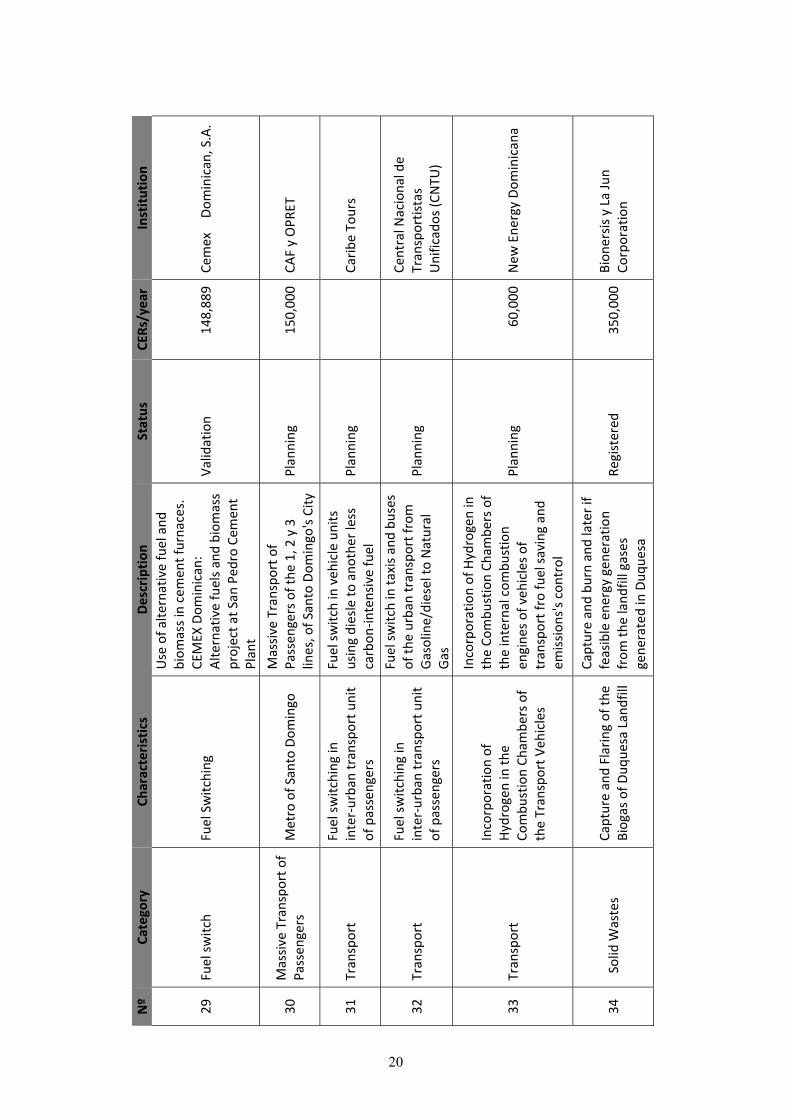
29
Fuel
sw
itch
Fuel
Sw
itchi
ng
Use
of a
ltern
ativ
e fu
el a
nd
biom
ass
in c
emen
t fur
nace
s.
CEM
EX D
omin
ican
: A
ltern
ativ
e fu
els
and
biom
ass
proj
ect a
t San
Ped
ro C
emen
t Pl
ant
Valid
atio
n 14
8,88
9Ce
mex
D
omin
ican
, S.A
.
30
Mas
sive
Tra
nspo
rt o
f Pa
ssen
gers
M
etro
of S
anto
Dom
ingo
M
assi
ve T
rans
port
of
Pass
enge
rs o
f the
1, 2
y 3
lin
es, o
f San
to D
omin
go's
City
Pl
anni
ng
150,
000
CAF
y O
PRET
31
Tran
spor
t Fu
el s
witc
hing
in
inte
r-ur
ban
tran
spor
t uni
t of
pas
seng
ers
Fuel
sw
itch
in v
ehic
le u
nits
us
ing
dies
le to
ano
ther
less
ca
rbon
-inte
nsiv
e fu
el
Plan
ning
Ca
ribe
Tou
rs
32
Tran
spor
t Fu
el s
witc
hing
in
inte
r-ur
ban
tran
spor
t uni
t of
pas
seng
ers
Fuel
sw
itch
in ta
xis
and
buse
s of
the
urba
n tr
ansp
ort f
rom
G
asol
ine/
dies
el to
Nat
ural
G
as
Plan
ning
Ce
ntra
l Nac
iona
l de
Tran
spor
tista
s U
nific
ados
(CN
TU)
33
Tran
spor
t
Inco
rpor
atio
n of
H
ydro
gen
in th
e Co
mbu
stio
n Ch
ambe
rs o
f th
e Tr
ansp
ort V
ehic
les
Inco
rpor
atio
n of
Hyd
roge
n in
th
e Co
mbu
stio
n Ch
ambe
rs o
f th
e in
tern
al c
ombu
stio
n en
gine
s of
veh
icle
s of
tr
ansp
ort f
ro fu
el s
avin
g an
d em
issi
ons'
s co
ntro
l
Plan
ning
60
,000
New
Ene
rgy
Dom
inic
ana
34
Sol
id W
aste
s Ca
ptur
e an
d Fl
arin
g of
the
Biog
as o
f Duq
uesa
Lan
dfill
Capt
ure
and
burn
and
late
r if
feas
ible
ene
rgy
gene
ratio
n fr
om th
e la
ndfil
l gas
es
gene
rate
d in
Duq
uesa
Regi
ster
ed
350,
000
Bion
ersi
s y
La Ju
n Co
rpor
atio
n
20

Nº
Cate
gory
Ch
arac
teri
stic
s D
escr
ipti
on
Stat
us
CERs
/yea
rIn
stit
utio
n
35
Solid
Was
tes
Indu
stri
al tr
eatm
ent p
lant
of
Urb
an s
olid
was
tes
Capa
city
of d
aily
pro
cess
ing
80
0 to
ns p
f Sol
ids
was
te.
Bi
ofut
uro
Indu
stri
al R
ecyc
ling
Plan
t. o
f RSU
.
PIN
App
rove
d (N
o-O
bjec
tion
Lett
er Is
sued
)
40,0
00Co
nsor
cio
Empr
esar
ial
Biof
utur
o
36
Solid
Was
tes
Elab
orat
ion
of C
ompo
st
thro
ugh
Solid
Was
tes
and
Was
tew
ater
Use
of t
he S
olid
and
Liq
uid
Was
tes
from
the
Extr
actio
n Pr
oces
s of
Pal
m O
il
Tech
nica
l ev
alua
tion
10,0
00In
dusp
alm
a D
omin
ican
a
37
Ani
mal
Was
te W
ater
Bi
ogas
rec
over
y fr
om
anae
robi
c w
ater
tr
eatm
ent s
yste
ms
Prog
ram
mat
ic p
roje
ct o
f pig
fa
rms
Plan
ning
32
,977
COO
PCIB
AO
38
Aff
ores
tatio
n Re
fore
stat
ion
of
defo
rest
ed z
ones
Refo
rest
atio
n of
def
ores
ted
zone
s of
the
coun
try
with
ag
rofo
rest
ry c
oope
rativ
es a
nd
nurs
ery.
Plan
ning
6,
000,
000
Rain
Tree
Cor
p
39
Aff
ores
tatio
n Re
fore
stat
ion
of
defo
rest
ed z
ones
Re
fore
stat
ion
of th
e U
pper
Ba
sin
of th
e Bl
anco
Riv
er
Plan
ning
40
1,00
0TN
C
40
Was
te
co- d
iges
tion
(exc
reta
+
cach
aza)
+ tr
eatm
ent b
y co
mpo
stin
g
Co-d
iges
tion
of th
e liv
esto
ck
excr
etas
and
was
tew
ater
Te
chni
cal-f
inan
ce
eval
uatio
n 6,
000
Cons
orci
o A
zuca
rero
de
Empr
esas
Indu
stri
ales
21

5 GIS-Based Potential Map of CDM Project Development
5.1 Advantage of Using GIS for CDM Project Promotion
GIS (Geographical Information System) consists of two major components, i.e. geographical
information (location, altitude, etc.) of the project activity and information about the activity
itself. GIS is a useful tool of information management for the promotion and/or control of a
CDM project development.
Specifically (in case of this study), the location information of existing CDM projects can be
obtained from the figure (geographical information) below. It currently contains two
registered projects (one wind power generation and one CH4 gas capture from final disposal
landfill) and other several projects under preparation stages. More detail project information
can be obtained from project information/data table shown as an example in the table on next
page.
Figure 5-1 : Location Map of the Existing CDM Project
22

Table 5-1 : Sample of the Attribution Data Table (waste management sector)
No Categoria_ Categoria1 Caracteris Descripcio Situacion CER
anual Institucio Municipio Provincia XCoordinat Ycoordinat
2 Gestion de Residuos
Residuos Sólidos
Captura y quema del Biogas del relleno de Duquesa
Captura y quema y de ser factible posterior generación de energia a partir de los Gases de Relleno generados en Duquesa
Registrado 350,000Bionersis y La Jun Corporation
Santo Domingo Norte
Santo Domingo
397,832 2,052,560
13 Gestion de Residuos
Residuos Sólidos
Planta de tratamiento industrial de residuos solidos Urbanos
Capacidad de procesar dariamente una 800 toneladas de residuos Sólidos. Planta Biofuturo de Reciclaje Inds. de RSU.
PIN Aprobado (carta de No objeció
Otorgada)
40,000Consorcio Empresarial Biofuturo
Santo Domingo Oeste
Santo Domingo
393,935 2,038,199
31 Gestion de Residuos
Residuos Sólidos
Elaboraci� de Compost a partir de los Residuos Solidos y las Aguas Residuales
Aprovechamiento de los Residuos Sólidos y Líuidos del Proceso de Extracción del Aceite de Palma
Definició Tecnica
10,000Induspalma Dominicana
Monte Plata
Monte Plata
417,183 2,078,355
The Study prepared the GIS data for the sectors of renewable energy (wind, hydropower, and
biomass) and waste management (solid waste and wastewater). The relationship between the
maps and GIS data is illustrated in the figure below.
Figure 5-2 : Association Chart of Sector and Data Sources
GIS-based CDM Project Potential Map
Renewable energy (Location of the potential site)
Biomass energy (Potential energy generation amount)
Waste management(Potential CH4 generation amount)
Hydraulic power generation site (source: INDRHI)
Wind power generation site (source: U.S. Department of Energy NREL)
Bagasse (production amount, source: INAZUCAR)
Rice husk (production amount, source: SEA)
Coconut shell (production amount, , source: SEA)
Domestic wastewater (Residential population source: ONE)
Municipal solid waste (Residential population source: ONE)
Political division map (source: SEA)
23
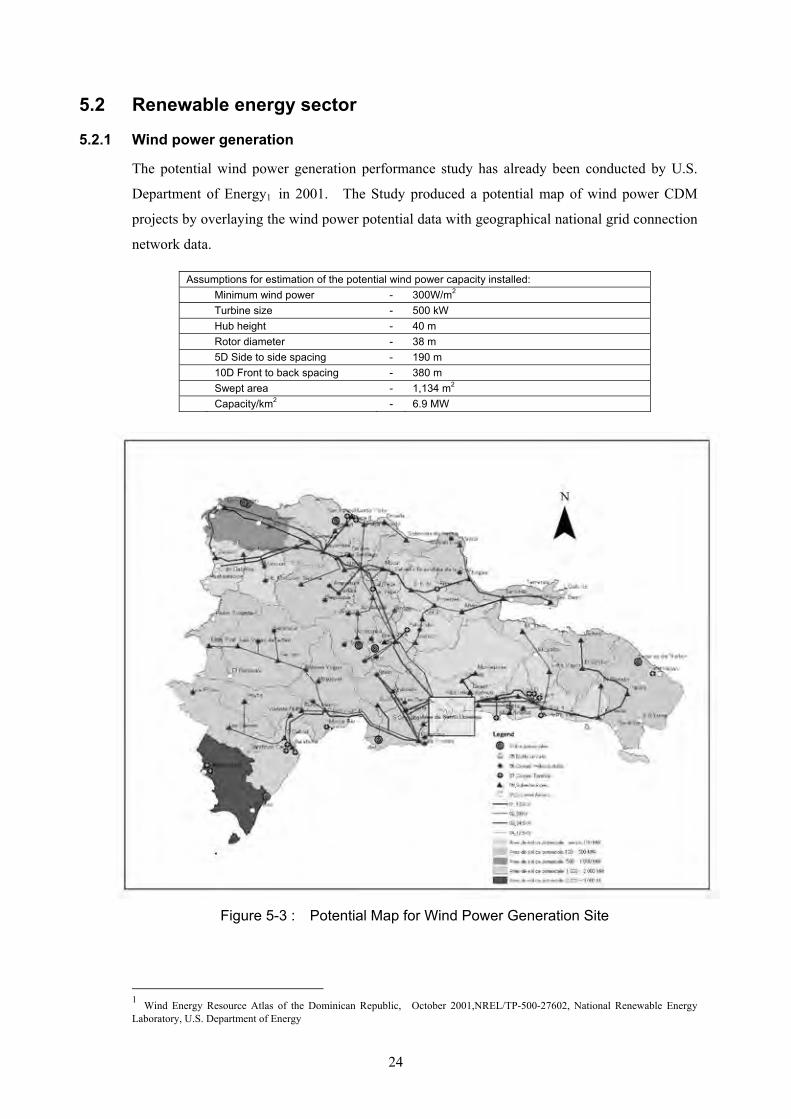
5.2 Renewable energy sector
5.2.1 Wind power generation
The potential wind power generation performance study has already been conducted by U.S.
Department of Energy1 in 2001. The Study produced a potential map of wind power CDM
projects by overlaying the wind power potential data with geographical national grid connection
network data.
Assumptions for estimation of the potential wind power capacity installed:
Minimum wind power - 300W/m2
Turbine size - 500 kW
Hub height - 40 m
Rotor diameter - 38 m
5D Side to side spacing - 190 m
10D Front to back spacing - 380 m
Swept area - 1,134 m2
Capacity/km2 - 6.9 MW
Figure 5-3 : Potential Map for Wind Power Generation Site
1 Wind Energy Resource Atlas of the Dominican Republic, October 2001,NREL/TP-500-27602, National Renewable Energy Laboratory, U.S. Department of Energy
24

5.2.2 Hydraulic power generation
The potential hydraulic power generation performance (amount, etc.) is dependent on many
factors (a water head, flow rate, water transmission technologies, a water storage amount at a
dam site, etc.). However, as the baseline information to investigate potential hydropower
development, the Study used the geographical data of INDRHI on potential dam site with
estimated water storage capacity. The figure below overlays the INDRHI data with national
grid electricity network to identify the potential hydropower areas with grid conncetions.
Figure 5-4 : Potential Map for Hydraulic Power Generation Site
25

5.2.3 Biomass energy
a. Bagasse
Potential energy from the bagasse setting up based on the annual sugarcane production amount
and following assumptions;
Bagasse generation ratio is 33% of sugarcane prodcution, Potential calorific value of the bagasse is 8.2 Mj/ton.
Also, sugar refinery plant is located only two provinces in the whole country.
Table 5-2 : Annual Sugarcane and Bagasse Production Amount in 2009
Sugar refinery location
(Municipalities)
Plant Area (ha)
Sugarcane Production amount
(MT/year)
Estimated Bagasse Generation amount
(MT/year)
Potential calorific value of Bagasse
(GJ)
Remarks
Central Romana 65,497 3,178,881 1,049,031 8,602,052 ESTE total
10,835,725Cristal Colon 18,298 825,452 272,399 2,233,673
Barahona 8,176 616,942 203,591 1,669,445 SUR
TOTAL 91,971 4,621,275 1,525,021 12,505,170
Souce: Instituto nacional del Azúcar (INAZUCAR)
Note: Residue Production Ration(Residue/Product rations/Mid-range)of Sugarcane is approximately 0.33 of Sugarcane (Source:MEMORIA DEL INSTITUTO AZUCARERO DOMINICANO 1995) Note: Lower heating value (MJ/kg or GJ/ton) of Bagasse(wet) is 8.2 (Source: Biomass:based on Leach &Gowen 1987;Fossil fuel:IEA 2003a;Natural gas:BP2003)
b. Rice husk
Rice production data was available for the 8 regions below by SEA (Secretaría de Estado de
Agricultura).
Table 5-3 : Agriculture Region and Name of Municipalities
Region Municipality
NORTE Puerto Plata, Santiago, Espaillata
NORDESTE Maria Trinidad Sanchez, Duarte, Sanchez Ramirez, Samana
NOROESTE Monte Cristi, Dajabon, Santiago Rodriguez, Valverde
NORCENTRAL Salcedo, (Hermanas Mirabal), La vega, Monseñor nouel
CENTRAL Monte Plata, Santo Domingo, District Nacional, San Cristobal, Peravia, San José De Ocoa
SUR Bahoruco, Independencia, Barahona, Pedernales
SUROESTE San juan, Azua, Elias Piña
ESTE La Altagracia, La Romana, San Pedro De Macoris, El Seibo, Hato Mayor
The energy potential of rice husk was estimated based on the following assumptions;
rice husk generation ratio is 27% of the rice crop yields, potential calorific value of the rice husk is 14.4 Mj/ton of rice husk
26

Table 5-4 : Annual Rice and Rice Husk Production Amount in 2009
Region Crop Area
(ha)
White rice production amount
(MT/yr)
Estimated Rice husk production amount (MT/yr)
Potential calorific value of rice husk (GJ)
NORTE 1,902 5,840 1,577 22,705
NORDESTE 82,708 230,024 62,106 894,333
NOROESTE 49,004 166,543 44,967 647,521
NORCENTRAL 27,951 94,214 25,438 366,302
CENTRAL 3,466 12,554 3,390 48,809
SUR 566 0 0 0
SUROESTE 13,237 33,781 9,121 131,342
ESTE 3,178 8,410 2,271 32,697
TOTAL 182,012 551,365 148,869 2,143,709
Source: SEA, Departamento de Seguimiento, Control y Evaluación Note: Residue Producation Rations(Residue/product ratios/Mid-range) of Rice husk is 0.27(Source: Koopmans&Koppejan 1998) Note: Lower heating value (MJ/kg or GJ/tonne) of Rice hulls is 14.4 (Source: Biomass:based on Leach &Gowen 1987;Fossil fuel:IEA 2003a;Natural gas:BP2003)
c. Coconut shell
Coconut production data is also available in 8 regions SEA (Secretaría de Estado de
Agricultura). The energy potential of coconut husk was estimated based on the following
assumptions;
Coconut shell generation ratio is 53% of the crop yields, Potential calorific value of the coconut shell is 17.9 Mj/ton
Table 5-5 : Annual Coconut and Coconut Shell Production Amount in 2009
Region Crop Area (ha)
Production: Coconut(MT/yr)
Estimated Coconut shell production amount (MT/yr)
Potential calorific value of coconut shell
(GJ)
NORTE 1,140 170 90 1,612
NORDESTE 54,181 2,911 1,543 27,621
NOROESTE 284 57 30 543
NORCENTRAL 842 100 53 947
CENTRAL 6,501 532 282 5,050
SUR 3,185 384 203 3,639
SUROESTE 482 60 32 568
ESTE 22,444 1,220 647 11,575
TOTAL 89,059 5,434 2,880 51,555
Source: SEA, Departamento de Seguimiento, Control y Evaluación
Note: Residue Production Ration(Residue/Product rations/Mid-range) of Coconut Shell is 0.53(Source Koopmans & Koppejan 1998)
Note: Lower heating value (MJ/kg or GJ/ton) of Coconut shells is 17.9 (Source: Biomass: based on Leach & Gowen 1987;Fossil fuel: IEA 2003a;Natural gas:BP2003)
27

d. Coffee residue
Based on the available coffee production data in 8 regions by SEA (Secretaría de Estado de
Agricultura, its total energy potential was estimated with the following assumptions:
coffee residue generation ratio is 140% of the crop yields, potential calorific value of the coffee residue is 14.4 Mj/ton
Table 5-6 : Annual Coffee and Coffee Residue Production Amount in 2008
Region Crop Area (ha)
Production: Coffee Beans(MT/yr)
Coffee residue production amount (MT/yr)
Potential calorific value of coffee residue(GJ)
NORTE 24,813 11,343 15,880 260,432
NORDESTE 5,289 1,745 2,443 40,065
NOROESTE 8,073 3,199 4,479 73,456
NORCENTRAL 15,178 5,718 8,006 131,298
CENTRAL 31,694 5,411 7,575 124,230
SUR 27,636 5,845 8,182 134,185
SUROESTE 18,869 3,562 4,987 81,787
ESTE 1,790 1,528 2,139 35,080
TOTAL 133,342 38,351 53,691 880,532
Source: Division de Estadisticas e Informacion, Dpto. De Planificacion, CODOCAFE
Note: The residue potential would be 1.4 times the mass of green beans produced (Source: UNDP Biomass Energy For Cement Production Opportunities in Ethiopia 2009)
Note: Lower heating value(MJ/kg) of coffee husk is 16.4 (Source: UNDP Biomass Energy For Cement Production Opportunities in Ethiopia 2009)
28

e. Potential map of biomass energy
Based on the above calculation, the Study produced the potential map of biomass energy as
shown in the figure below.
Figure 5-5 : Potential Map for Biomass Energy
5.3 Waste Mamagement
5.3.1 Municipal Solid Waste
The Study estimated the potential CH4 generation rate (CH4 kg/person/year) by municipal solid
waste generation based on IPCC guideline2. The total CH4 generation amount was calculated as
the product of waste generation rate and estimated population data in 2010 by ONE (Oficina
Nacional de Estadística).
2 2006 IPCC Guideline for National Greenhouse Gas Inventories Volume5, Chapter 2&3
29

a. IPPC Guidline
The equation used from IPCC guidelines for estimating potential CH4 emissions from municipal
solid waste is as follows:
EQUATION 3.2 (IPCC)
DECOMPOSABLE DOC FROM WASTE DISPOSAL DATA
DDOCm = W • DOC • DOCf •MCF
Where: DDOCm = mass of decomposable DOC deposited, Gg W = mass of waste deposited, Gg DOC = degradable organic carbon in the year of deposition, fraction, Gg C/Gg waste DOC f = fraction of DOC that can decompose (fraction) MCF = CH4correction factor for aerobic decomposition in the year of deposition
(fraction)
EQUATION 3.3 (IPCC)
TRANSFORMATION FROM DDOCm TO L0
L0 = DDOCm•F•16/12
Where: L o = CH4 generation potential, Gg CH4 DDOCm = mass of decomposable DOC, Gg F = fraction of CH4 in generated landfill gas (volume fraction) 16/12 = molecular weight ratio CH4/C (ratio) The annual CH4 emission potential from municipal solid waste is shown in the table below.
Table 5-7 : Potential CH4 Generation Ratio (Municipal Solid Waste)
Composition (Caribbean)
Amount (Gg/y/million
persons)
DOC (Degradable
organic carbon)
Contents (%)
DOCf (fraction of
DOC dissimilated) MCF
Decomposable DOC (DDOCm)
deposited
Fraction of methane
(F) in developed
gas
CH4 generation
(Gg/y/million persons)
W DOC DOCf D = W * DOC * DOCf * MCF F Q = D *
16/12 * F
Paper/card board 17% 833.00 40% 0.5 1.0 166.6 0.5 111.067
Textiles 5.10% 249.90 24% 0.5 1.0 29.988 0.5 19.992
Food waste 46.90% 2,298.10 15% 0.5 1.0 172.3575 0.5 114.905
Wood 2.40% 117.60 43% 0.5 1.0 25.284 0.5 16.856
Garden/ park 0.00 20% 0.5 1.0 0 0.5 0.000
Nappies/ Diapers 0.00 24% 0.5 1.0 0 0.5 0.000
Sewage sludge 0.00 0.5 1.0 0 0.5 0.000
Rubber/ leather 1.90% 93.10 0.5 1.0 0
All other, inerts 26.70% 1,308.30 0.5 1.0 0
Total 100% 4,900.00 394.23 262.820
Waste Generation Rate 0.49 (ton/cap/yr)= 1,342 (g/person/day) Potential CH4 Generation Ratio
26,282(g/person/year)
72(g/person/day)
0.02628(ton/person/year)
30

Table 5-8 : Annual CH4 Generation Potential Amount (Municipal Solid Waste)
Province Population(2010)
(source : ,Oficina Nacional Estadística) CH 4 Generation Potential Amount
(ton/year)
DISTRITO NACIONAL 1,111,838 29,221
AZUA 242,109 6,363
DAJABON 66,954 1,760
DUARTE 299,188 7,863
ELIAS PINA 72,130 1,896
EL SEIBO 105,994 2,786
ESPAILLAT 237,101 6,231
LA ALTAGRACIA 229,428 6,030
LA ROMANA 246,234 6,472
LA VEGA 429,563 11,290
MARIA TRINIDAD SANCHEZ 141,678 3,724
MONTE CRISTI 120,833 3,176
PERAVIA 202,250 5,316
PUERTO PLATA 327,510 8,608
SALCEDO 103,259 2,714
SAMANA 98,820 2,597
SAN CRISTOBAL 660,009 17,346
SAN JUAN 245,377 6,449
SAN PEDRO DE MACORIS 337,108 8,860
SANCHEZ RAMIREZ 156,238 4,106
SANTIAGO 1,046,182 27,496
SANTIAGO RODRIGUEZ 54,865 1,442
VALVERDE 190,253 5,000
MONSENOR NOUEL 194,505 5,112
MONTE PLATA 210,365 5,529
HATO MAYOR 90,773 2,386
SAN JOSE DE OCOA 69,204 1,819
SANTO DOMINGO 2,198,333 57,777
BAORUCO 114,967 3,022
BARAHONA 200,602 5,272
INDEPENDENCIA 55,223 1,451
PEDERNALES 25,478 670
31

Figure 5-6 : Annual CH4 Generation Potential Amount (Municipal Solid Waste)
5.3.2 Domestic Wastwater
The study team estimated potential CH4 generation rate (CH4 kg/person/year) from domestic
wastewater based on IPCC guideline3. The total CH4 generation amount was calculated as the
product of domestic wastewater discharge rate and estimated population data in 2010 by ONE
(Oficina Nacional de Estadística).
The equation used from IPCC guidelines for estimating potential CH4 emissions from domestic
wastewater is as follows:
EQUATION 6.1(IPCC) TOTAL CH 4 EMISSIONS FROM DOMESTIC WASTEWATER
CH4Emissions= ∑ U · T , · EF, TOW S R
Where: CH4 Emissions = CH4 emissions in inventory year, kg CH4 /yr TOW = total organics in wastewater in inventory year, kg BOD/yr S = organic component removed as sludge in inventory year, kg BOD/yr U i = fraction of population in income group i in inventory year
3 2006 IPCC Guideline for National Greenhouse Gas Inventories Volume5, Chapter 6
32

Ti,j =degree of utilization of treatment/discharge pathway or system, j, for each income group fraction i in inventory year
i = income group: rural, urban high income and urban low income j = each treatment/discharge pathway or system EF j = emission factor, kg CH 4 / kg BOD R = amount of CH 4 recovered in inventory year, kg CH 4 /yr
EQUATION 6.2(IPCC) CH 4 EMISSION FACTOR FOR EACH DOMESTIC WASTEWATER TREATMENT/DISCHARGE PATHWAY OR SYSTEM EFj B0 · MCFj Where: EF j = emission factor, kg CH4 /kg BOD j = each treatment/discharge pathway or system B o = maximum CH4 producing capacity, kg CH4 /kg BOD MCF j = methane correction factor (fraction), TABLE 6.2 (IPCC) DEFAULT MAXIMUM CH4 PRODUCING CAPACITY (BO) FOR DOMESTIC WASTEWATER
0.6 kg CH4 /kg BOD 0.25 kg CH4 /kg COD
Based on expert judgment by lead authors and on Doorn et al., (1997)
TABLE 6.3(IPCC) DEFAULT MCF VALUES FOR DOMESTIC WASTEWATER Type of treatment and discharge pathway or system
Comments MCF Range
Untreated system Sea, river and lake discharge Rivers with high organics loadings can turn
anaerobic. 0.1 0 – 0.2
Stagnant sewer Open and warm 0.5 0.4 – 0.8Flowing sewer (open or closed)
Fast moving, clean. (Insignificant amounts of CH 4 from pump stations, etc)
0 0
EQUATION 6.3 (IPCC) TOTAL ORGANICALLY DEGRADABLE MATERIAL IN DOMESTIC WASTEWATER TOW P · BOD · 0.001 · I · 365 Where: TOW = total organics in wastewater in inventory year, kg BOD/yr P = country population in inventory year, (person) BOD = country-specific per capita BOD in inventory year, g/person/day 0.001 = conversion from grams BOD to kg BOD I = correction factor for additional industrial BOD discharged into sewers
(for collected the default is 1.25, for uncollected the default is 1.00.)
33

TABLE 6.4(IPCC) ESTIMATED BOD 5 VALUES IN DOMESTIC WASTEWATER FOR SELECTED REGIONS AND COUNTRIES Country/Region BOD5 (g/person/day) Range Reference Africa 37 35 – 45 1 Egypt 34 27 – 41 1 Asia, Middle East, Latin America 40 35 – 45 1 Note: These values are based on an assessment of the literature. Please use national values, if available. Reference: 1. Doorn and Liles (1999).
TOW = P * 40* 0.001*1*365 = 14.6 kg/person/year
EFj = 0.6 * 0.1 = 0.06 kg CH4/kg BOD
CH 4 Generation = 0.06 * 14.6 =0.876 kg/person/year
Annual CH4 generation potential from domestic wastewater was estimated as shown in the table
below.
Table 5-9 : Annual CH4 Generation Potential Amount (Domestic Wastewater)
Province Population(2010)
(source : ,Oficina Nacional Estadística)TOW (kg/year)
CH 4 Generation Potential Amount (ton/year)
DISTRITO NACIONAL 1,111,840 16,232,864.0 974.0
AZUA 242,109 3,534,791 212.1
DAJABON 66,954 977,528 58.7
DUARTE 299,188 4,368,145 262.1
ELIAS PINA 72,130 1,053,098 63.2
EL SEIBO 105,994 1,547,512 92.9
ESPAILLAT 237,101 3,461,675 207.7
LA ALTAGRACIA 229,428 3,349,649 201.0
LA ROMANA 246,234 3,595,016 215.7
LA VEGA 429,563 6,271,620 376.3
MARIA TRINIDAD SANCHEZ 141,678 2,068,499 124.1
MONTE CRISTI 120,833 1,764,162 105.8
PERAVIA 202,250 2,952,850 177.2
PUERTO PLATA 327,510 4,781,646 286.9
SALCEDO 103,259 1,507,581 90.5
SAMANA 98,820 1,442,772 86.6
SAN CRISTOBAL 660,009 9,636,131 578.2
SAN JUAN 245,377 3,582,504 215.0
SAN PEDRO DE MACORIS 337,108 4,921,777 295.3
SANCHEZ RAMIREZ 156,238 2,281,075 136.9
SANTIAGO 1,046,180 15,274,228 916.5
SANTIAGO RODRIGUEZ 54,865 801,029 48.1
VALVERDE 190,253 2,777,694 166.7
MONSENOR NOUEL 194,505 2,839,773 170.4
MONTE PLATA 210,365 3,071,329 184.3
HATO MAYOR 90,773 1,325,286 79.5
SAN JOSE DE OCOA 69,204 1,010,378 60.6
SANTO DOMINGO 2,198,330 32,095,618 1,925.7
BAORUCO 114,967 1,678,518 100.7
34

Province Population(2010)
(source : ,Oficina Nacional Estadística)TOW (kg/year)
CH 4 Generation Potential Amount (ton/year)
BARAHONA 200,602 2,928,789 175.7
INDEPENDENCIA 55,223 806,256 48.4
PEDERNALES 25,478 371,979 22.3
Figure 5-7 : CH4 Generation Potential Amount form Domestic Wastewater
35

2. PINs and Model PDDs

Project Idea Notes (PINs)
1. Programmatic CDM project of power generation from renewable synthesis
gas (from biomass)
2. Methane capture and its applications in pig farms’ self-consumption and in
associative activities
3. Composting organic waste
4. Fuel switch in cocoa processing factories
39

(1) Programmatic CDM project of power generation from renewable
synthesis gas (from biomass)
41

42

43

44
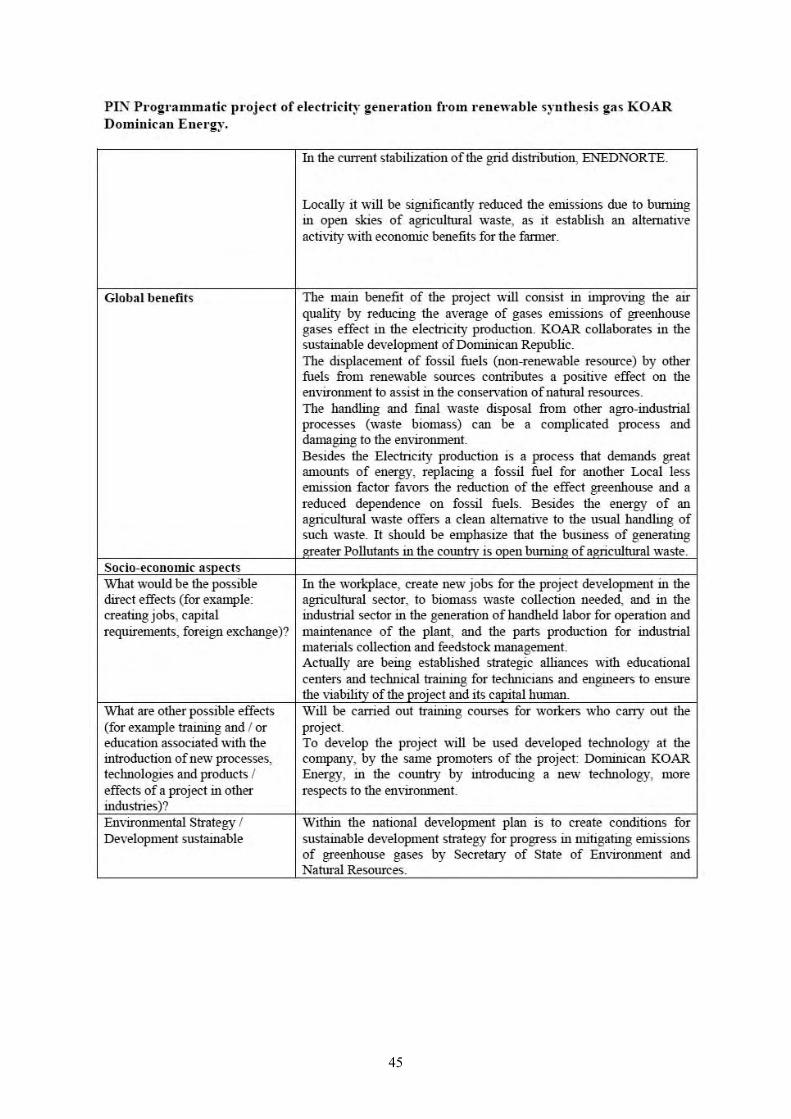
45
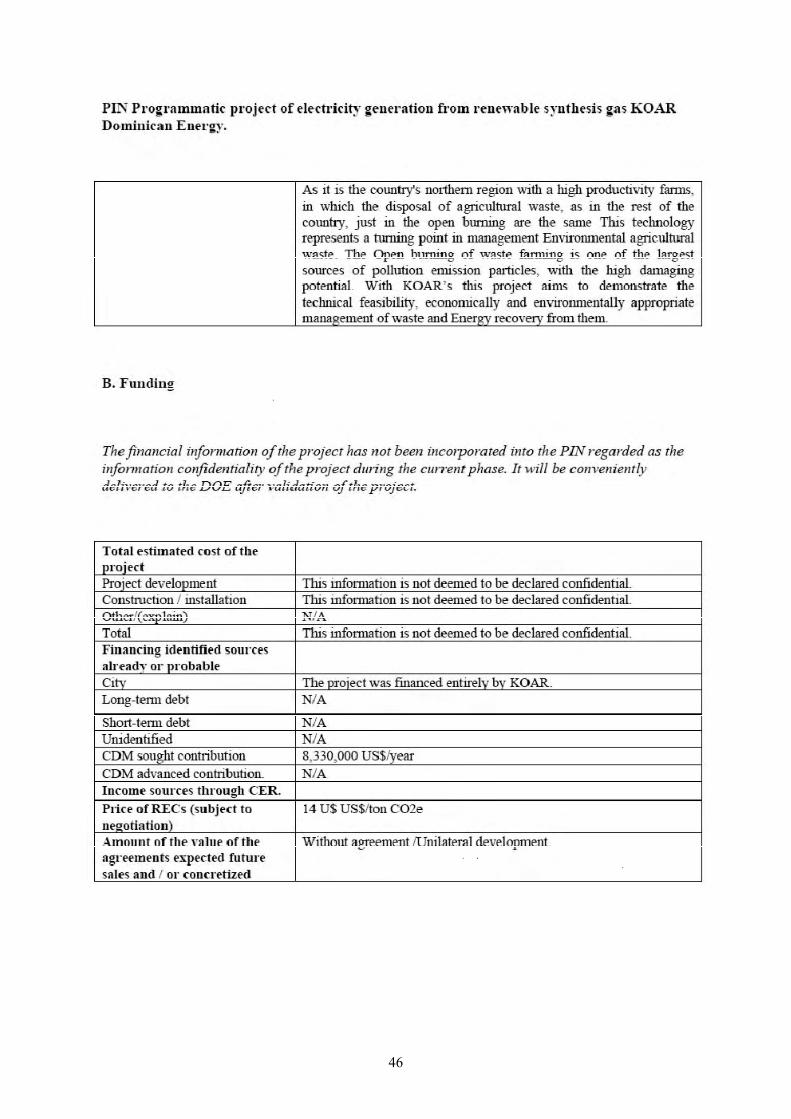
46

(2) Methane capture and its applications in pig farms’ self-consumption
and in associative activities
47
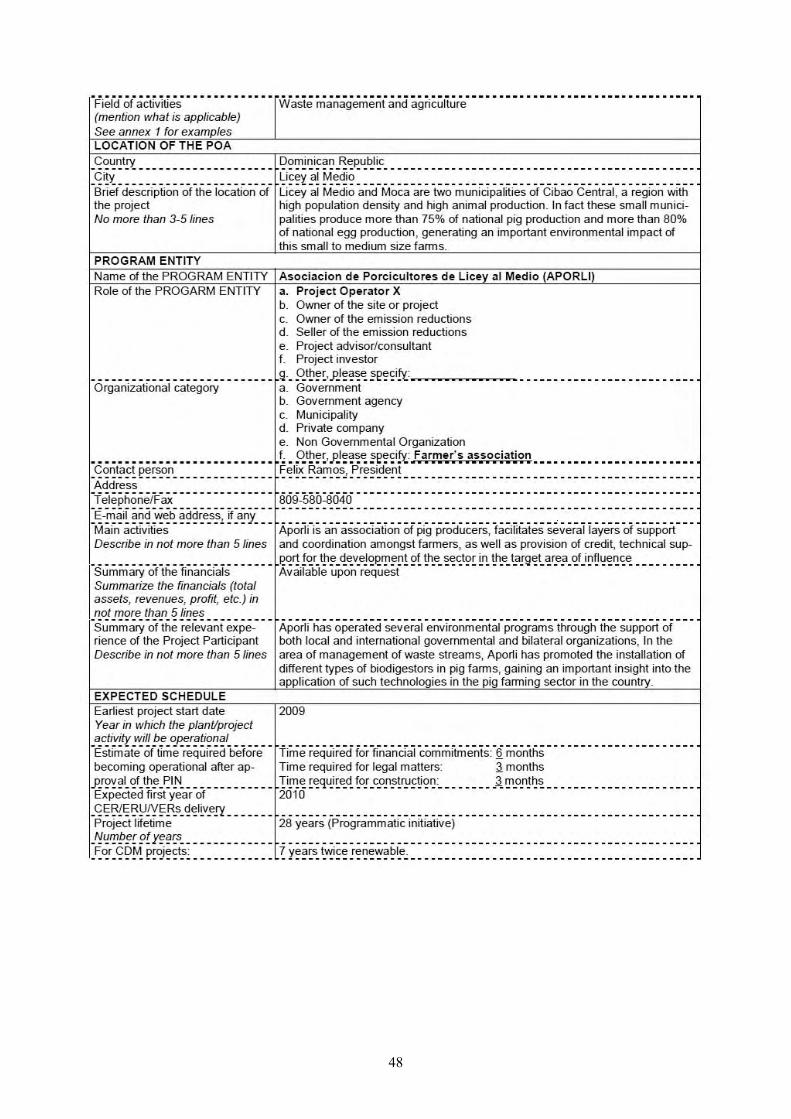
48

49

50
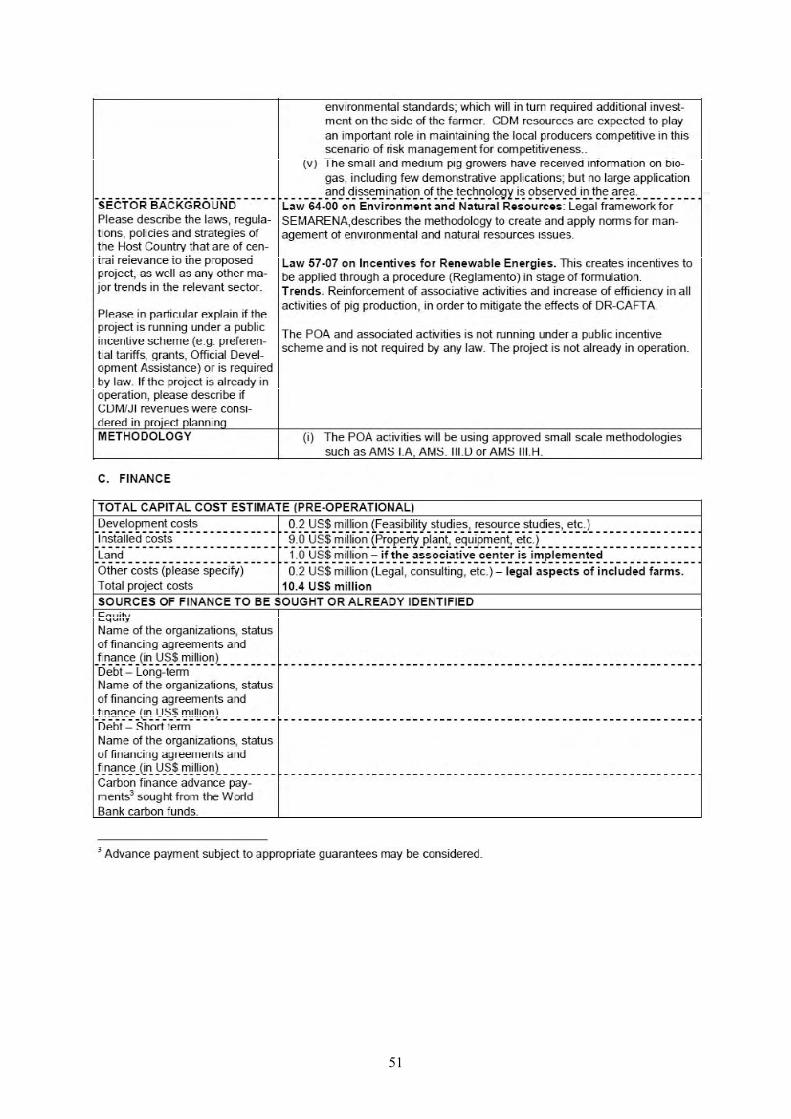
51
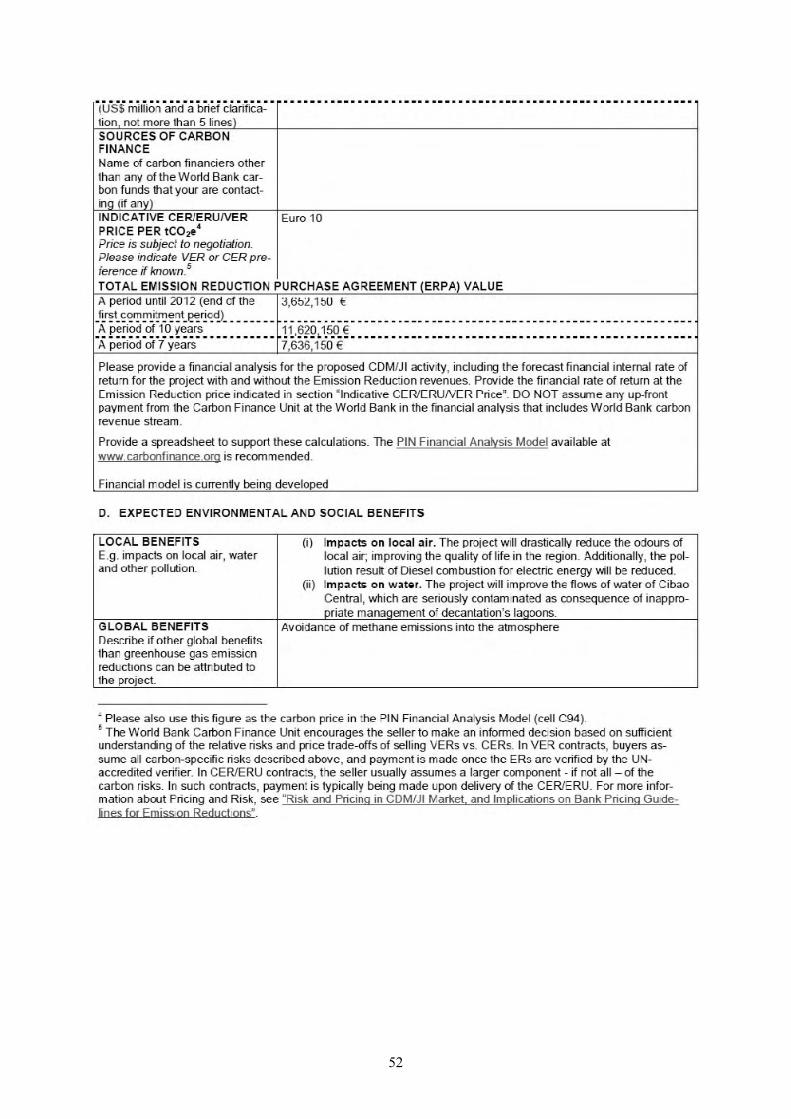
52

53

(3) Composting organic waste
A. Basic Project description
Name of Project and date submitted
Composting Organic Waste in Rafey, submitted in January 2009
Technical Project summary
Project objective
To reduce the quantity of MSW disposed at the Rafey Landfill and the GHG emissions related, providing a model environmental friendly and economically attractive trough the CDM, which would be replicable in other municipalities in Dominican Republic.
Technical description of the project and the proposed activities
The project is an effort to support the ECOPARQUE RAFEY Project, a complex developed by municipal authorities for treatment of the solid waste of Santiago. This project include a recycling facility in the project site to process all MSW from Santiago City. The project activity consists in the use of the organic fraction of this MSW to produce compost, reducing the total quantity of waste to be landfilled and the GHG emissions related. More than 70 percent of all materials entering to Rafey landfill (in total, more of 850 tons per day today) can be diverted through composting. Because the low quality of the compost produced in this conditions, is not an economically attractive sell it as soil conditioner, therefore its planned disposed all compost produced in the landfill site. The project is strongly endorsed by the municipal authorities, who are highly interested in implement effective solutions to handle and to dispose the waste of Santiago City. It’s expected the project will help to transfer know-how for the replication of the model.
Technology to be employed
to be defined
Owner and/or project developer
Name Ayuntamiento de Santiago
Organizational category Municipality
Other function(s) of the project developer in the project
Owner / Operator
Summary of the relevant experience of the project developer
By mandate of Dominican Law 176-074, its responsibility of the municipality to collect, handle, and disposal all kind of solid waste produced by the population. Among other measurements, since 2005 the Municipality has taken full control of the Landfill (formerly a dumping site) and the waste collecting system; has looking for the support from Japan International Cooperation Agency (technical assistance, implementation of technological solutions, and capacitating programs for municipality professionals) and Xunta de Andalucía (project concept, social impacts, and partial financing).
Address to be defined
Contact Person to be defined
Telephone / fax to be defined
E-mail /webpage to be defined
Project Sponsors / financers
Name to be defined
4 Law of Municipalities in Dominican Republic. http://fedomu.org.do/docs/LeyMunicipal176-07.pdf
54

Organizational category to be defined
Main activity and summary of the financials
to be defined
Address to be defined
Contact Person to be defined
Telephone / fax to be defined
E-mail /webpage to be defined
Type of project
Green House Gas (GHG) targeted
CH4 / N2O
CDM Sectoral scope 13: Waste handling and disposal
[ _ ] Energy production
[ _ ] Renewable energy, except for biomass projects
[ _ ] Biomass
[ _ ] Cogeneration
[ _ ] Energy efficiency by the replacing of technology/existing equipment
[ _ ] Energy efficiency, by reengineering / process optimizing
[ _ ] Energy efficiency by fuel switch
[ _ ] Energy demand [ _ ] Replacement of existing “household equipment”
[ _ ] Improvement of energy efficiency of existing production equipment
[ _ ] Transport
[ _ ] Engine efficiency
[ _ ] Modal shift
[ _ ] Fuel switch
[ _ ] Emissions from the hydrocarbon industry
[ _ ] Optimizing the extraction, transport and processing of oil and natural gas
[ _ ] Waste management
[ _ ] Capture of landfill methane emissions
[ _ ] Utilization of waste and wastewater emissions
[ X ] Avoidance of methane emissions through composting
[ _ ] Others
Project location
Region The Caribbean
Country Dominican Republic
Region / Province Santiago
City Santiago de los Caballeros
Brief description of location
The project site is located in the Norwest part of Santiago de los Caballeros City (12 km from the urban area). Its geographical UTM coordinates are the following: Y : 315,796.8204 (east) X : 2,153,864.7590 (west)
Expected schedule
Earliest project start date January 2011
Estimate of time required before becoming operational after approval of the PIN
0 years, 0 months
55

Project life span 16 years
Expected first year of Certified Emission Reduction (CER)
2011
Current status or phase of the project
Identifying / Planning
Dominican Republic and Kyoto
Dominican Republic is a non-Annex I country of the UNFCCC and has ratified the Kyoto Protocol in February 2002. In September 2008, the country has designed the Consejo Nacional para el Cambio Climatico y Mecanismo de Desarrollo Limpio (National Council for Climate Change and Clean Development Mechanism) as Designed National Authority.
B. Expected environmental and social benefits
Estimated Greenhouse Gases abated /CO2 Sequestered (in metric tons of C02 equivalent)
Units in metric tonnes of CO2-equivalent per year [tonCO2e/year] Per year (average) in the 10 Year: 101,643 ton CO2e/year Accumulated in lifespan: 2,256,579 ton CO2e/year Accumulated in 7 years: 597,501 ton CO2e/year Accumulated in 10 years: 1,016,426 ton CO2e/year Accumulated until year 2012: 89,165 ton CO2e/year
Baseline scenario (before the project)
Which emissions is the proposed CDM project displacing? The CDM project activity will avoid the methane emissions associated with the anaerobic decomposition of the organic fraction of the waste being dumped in the Landfill. What would the future look like without the proposed project? Currently, more of 300,000 tons of solid waste (mostly organic) are being dumped per year in Rafey, a semi-controlled landfill without a methane collection system. This leads to methane emission from the anaerobic digestion of the organic waste. Without the aerobic composting proposed by the project activity, is likely that emissions will occur. Describe the project barriers (finance, market, institutional, legal, and technological). What are the solutions to these problems? Most of municipalities in Dominican Republic have failed in to develop and to implement self-supported systems to manage their MSW, mainly for the difficulties to establish fees for services offered and the legal responsibility to collect, handle, and dispose them. As results, there are not conditions for neither bring investment to the waste sector, or to promote the creation of public politics for incentive them. Under these conditions, the storing of solid waste on dumps keeps being the cheapest method of their neutralization in comparison with alternative methods of neutralization of waste, such as: capture and utilization of landfill gas, high-tech processing, sorting or burning In the case of Rafey Landfill, is not an economical attractive option to base the financial structure of the project in sell the compost produced, mainly for the logistic required and the absence of a formal market of compost, therefore the CDM would be the just one income for the project activity, versus the investment costs and the operating expenses, which the project itself cannot cover. Which politics, strategies, laws etc. affects the project activities? The project activity and it is not mandated neither for national law, nor regulation. The project is a voluntary initiative and it is not part of a public or private politic or strategy.
Specific global and local environmental benefits Maximum ½ page in total
Global benefits The project will avoid the methane emissions (an average of 101,643 ton CO2e/year) and it could be an example for other developing countries on a relative low cost project for disposal their organic solid waste.
Local benefits The waste disposed in Rafey Landfill will be reduced. Emissions like odors, flies, liquid leakage from deposited waste, and the methane hazards will be reduced or eliminated.
56

Environmental impact study
It is not expected the project have any negative environmental impacts. The Project includes carrying an EIA (¿?).
Which guidelines will be applied?
The project will meet all regulation criteria rules and requirements regarding to environmental impacts, these criteria will be taken into account during the preparation of the EIS. Some guidelines to be applied are: Dominican Law 64-00 about Environment and Natural Resources Environmental norm about groundwater and underground discharges Environmental norm about solid waste non-hazardous Environmental norm about water quality and discharges control Environmental norm about air quality and pollution control
Socioeconomic benefits from the project Maximum ½ page in total
Benefits on the national / sub regional level
The project will help the development of Dominican Republic, thus not only with the creation of employment and the local staff that will be trained in new technologies and processes, but the development of a high structure of social and economical support for the near communities. This could be a replicable model for the country for a decentralized, environmentally friendly, sustainable, low risk and cost municipal solid waste management.
Benefits in local level
The communities near to the project site (mainly La Mosca / Santa Lucía, La Piña, and Las Colinas) are being highly included in the social component of the project. It is consist in a participative model to rise the life quality of the communities near to Rafey Landfill which includes: programs of education, technical trainee, basic infrastructure for water supply, sanity, health , and some actions for organization and strengthening of community By recovering non-renewable resources (plastic, glass, paper, metals, etc,) and recycling them and by composting the organic waste. The Santiago de los Caballeros city will benefit from an environmentally friendly and low cost waste management and a longer useful life of the existing landfill, thus avoiding the usual opposition against creation of new landfills.
Social impact study It is not expected the project have any negative environmental impacts.
Which guidelines will be applied?
The municipal authorities are high interested in to develop the project with the minimal negative impacts (environmental and social) possible. The project activity will meet with all rules and requirements regarding to social impacts and community participation.
Environmental strategy / priorities of the Host country
The increment of the population and the growth of productive activities in the country are causing all municipalities considerate the solid waste management like as their top
priority. Currently the Dominican Congress is discussing a Solid Waste Law Project5.
C. Finance
Total project cost estimate
Development costs US$ to be defined
Construction/installation costs US$ to be defined
Other costs US$ to be defined
Total project costs US$ to be defined
Sources of finance to be sought or already identified
Equity US$
US$
organization
organization
[%]
[%]
committed / negotiation
committed / negotiation
Debt – Long term US$
US$
organization
organization
[%]
[%]
committed / negotiation
committed / negotiation
Debt – Short term US$
US$
organization
organization
[%]
[%]
committed / negotiation
committed / negotiation
Non identified None
5 Dominican Deputies Chamber: initiative 05874-2006-2019-CD. http://www.camaradediputados.gov.do
57

CDM contribution (complimentary earnings on the sale of CERs)
Average reduction a year
44,582 ton CO2 (up to 2012 including itself)
85,357 ton CO2 (7 years based period)
101,643 ton CO2 (10 years based period)
Indicative price on one “CER” € 6 / ton CO2 € 9 / ton CO2 € 12 / ton CO2
Sale of CERs until 2012 € 524,288 € 786,432 € 1,048,576
CDM contribution if certified 7 years
€ 3,513,303 € 5,269,954 € 7,026,606
CDM contribution if certified 10 years
€ 5,976,584 € 8,964,876 € 11,953,168
CERs sold in advance Is your financial structure depending on CERs sold in advance?
Please clarify
Basic estimation on profitability
Internal return rate (FRR) If the CDM project are financed, please state the financial return rate with and without the sale of the CERs
IRR without CERs [XXX] %
IRR with CERs, until 2012 [xxx] % [xxx] % [xxx] %
IRR with CERs, 7 years period [xxx] % [xxx] % [xxx] %
IRR with CERs, 10 years period [xxx] % [xxx] % [xxx] %
58