Embed Size (px)
Citation preview

The Downs and Ups of the SNAP Caseload: What Matters?*
Stacy Dickert-Conlin, Katie Fitzpatrick, Laura Tiehen
February 2015
Please do not cite without permission of the authors.
Abstract: Since the early 1990s, states have received unprecedented flexibility to determine Supplemental Nutrition Assistance Program (SNAP) eligibility and program administration. We estimate that state SNAP policies accounted for 40 percent of the predicted caseload decline between 1993 and 2000 – primarily through the eligibility restrictions on noncitizens. More recent eligibility expansions and reductions in transaction costs explain 20 percent of the 2000-2011 caseload increase. The state unemployment rate plays a strong role in caseload changes over the study period, accounting for more than 60 percent of the predicted caseload decline between 1993 and 2000 and increase between 2007 and 2011.
* The authors thank Brian Stacy for excellent research assistance. They also thank Craig Gundersen, Lucie Schmidt, Michele Ver Ploeg, and participants at the Association for Public Policy Analysis and Management Conference, the National Tax Association Conference, the Annual Welfare Research and Evaluation Conference, and a USDA Economic Research Service seminar for helpful comments. This research was supported by a cooperative agreement through the U.S. Department of Agriculture’s Economic Research Service. The views and opinions expressed in this article are those of the authors and may not be attributed to the Economic Research Service or the USDA.

1
I. Introduction
The Supplemental Nutrition Assistance Program (SNAP) is one of the
largest social safety net programs in the United States. In 2014, an average of 46.5
million individuals in 22.7 million households received SNAP benefits each
month, and federal spending on the program totaled $74.1 billion
(http://www.fns.usda.gov/pd/supplemental-nutrition-assistance-program-snap).
Originally known as the Food Stamp Program, SNAP received permanent
legislative authority in 1964. Congress typically reauthorizes the program every
five years, most recently in the Agricultural Act of 2014. Because spending on
SNAP was at historically high levels during the Congressional negotiations over
the Agricultural Act of 2014, a number of proposals sought to rein in SNAP,
primarily by eliminating the ability of states to expand SNAP eligibility
requirements.
State flexibility in program rules and administration is relatively new.
Throughout much of its history, SNAP had nationally uniform program eligibility
standards and benefit levels, and states had little latitude in program
administration. Beginning with the 1996 welfare reform legislation and
significantly expanding with the 2002 Farm Bill, legislative and regulatory
changes gave states increased flexibility to simplify program administration and
increase program access, especially for low-income working families. Recent
Congressional testimony by Audrey Rowe, Administrator of the USDA agency
that oversees SNAP, described efforts to “assist States with workload
management while easing the burden of the application process for recipients,
many of whom are new to the program” (Rowe, 2012). Rowe’s testimony
2
highlighted strategies such as aligning eligibility requirements across programs
and streamlining interview processes.1
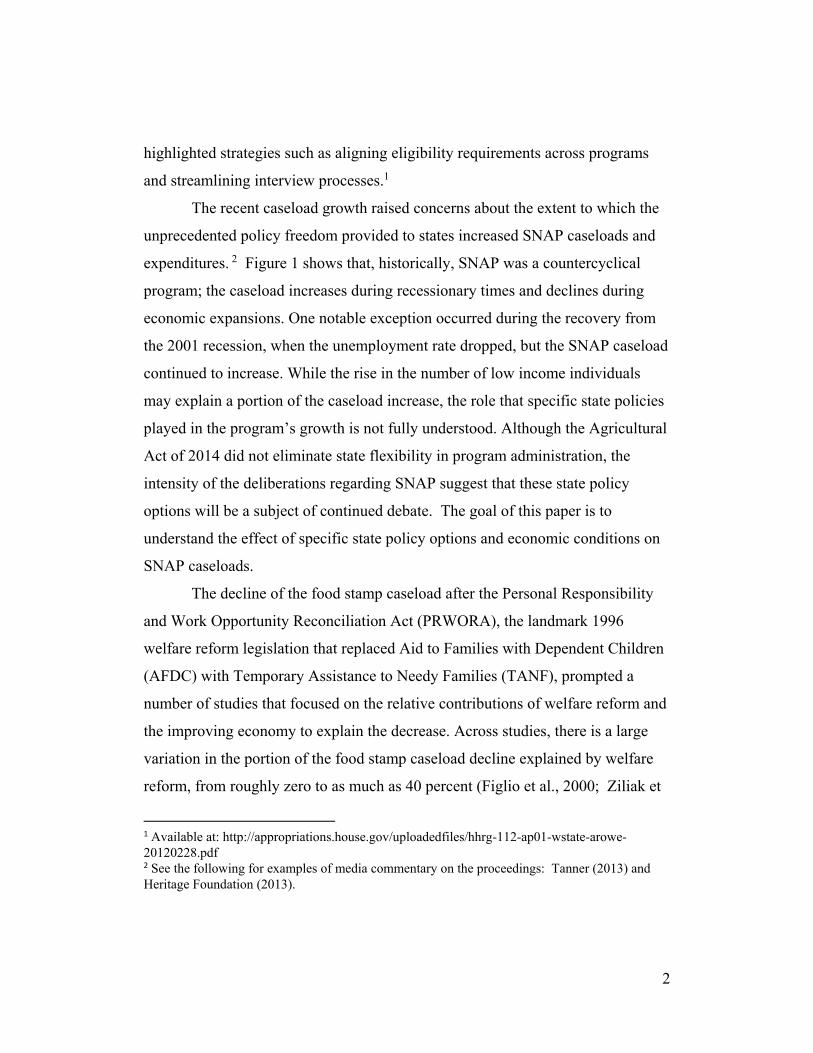
The recent caseload growth raised concerns about the extent to which the
unprecedented policy freedom provided to states increased SNAP caseloads and
expenditures. 2 Figure 1 shows that, historically, SNAP was a countercyclical
program; the caseload increases during recessionary times and declines during
economic expansions. One notable exception occurred during the recovery from
the 2001 recession, when the unemployment rate dropped, but the SNAP caseload
continued to increase. While the rise in the number of low income individuals
may explain a portion of the caseload increase, the role that specific state policies
played in the program’s growth is not fully understood. Although the Agricultural
Act of 2014 did not eliminate state flexibility in program administration, the
intensity of the deliberations regarding SNAP suggest that these state policy
options will be a subject of continued debate. The goal of this paper is to
understand the effect of specific state policy options and economic conditions on
SNAP caseloads.
The decline of the food stamp caseload after the Personal Responsibility
and Work Opportunity Reconciliation Act (PRWORA), the landmark 1996
welfare reform legislation that replaced Aid to Families with Dependent Children
(AFDC) with Temporary Assistance to Needy Families (TANF), prompted a
number of studies that focused on the relative contributions of welfare reform and
the improving economy to explain the decrease. Across studies, there is a large
variation in the portion of the food stamp caseload decline explained by welfare
reform, from roughly zero to as much as 40 percent (Figlio et al., 2000; Ziliak et
1 Available at: http://appropriations.house.gov/uploadedfiles/hhrg-112-ap01-wstate-arowe-20120228.pdf 2 See the following for examples of media commentary on the proceedings: Tanner (2013) and Heritage Foundation (2013).
3
al., 2003; Blank and Wallace 1999; Currie and Grogger, 2001). Researchers
attribute between 6 and 20 percent of the Food Stamp caseload decline to
macroeconomic conditions (Wallace and Blank 1999; Currie and Grogger,
2001).3 Related research using individual data finds that specific policies such as
requiring participants to more frequently verify their continued eligibility and
exempting the value of vehicles from the eligibility critieria, affect food stamp
participation and caseloads (Currie and Grogger, 2001; Mickelson and Lerman,
2004, McKernan and Ratcliffe, 2003; Kabbani and Wilde, 2003; Ratcliffe et al.
2008).
Recent work focuses on the factors behind the increase in the food stamp
caseload since 2001. Researchers find SNAP participation to be very responsive
to changes in economic conditions, with a one percentage point increase in the
unemployment rate associated with increases in SNAP participation ranging from
4 to 11 percent (Bitler and Hoynes, 2010; Bitler and Hoynes, 2013; Ganong and
Liebman, 2013; Klerman and Danielson, 2011; Ziliak, 2013). Using individual-
level panel data, Ratcliffe et al. (2008) and Ribar et al. (2008, 2010) find evidence
that policies that influence the transaction costs of SNAP participation affect
program take-up. Overall, estimates from the research most closely related to
ours suggest that economic conditions account for 27 to 45 percent of the recent
caseload increase, while new state SNAP policies account for estimated 16 to 35
percent of the increase (Klerman and Danielson, 2011; Ziliak, 2013). The
primary focus of Klerman and Danielson (2011) is the role of welfare reform,
SNAP policies, and economic conditions on the composition of state, monthly
SNAP caseloads from 1989 to 2009. Ziliak (2013) seeks to explain SNAP
3 Other research on food stamp caseloads such as Heflin (2004), Richburg-Hayes and Kwakye (2005) and Tschoepe and Hindera (1998) generally finds similar results.

4
caseload changes using annual, household survey data from 1980 to 2011. Our
research extends the literature on SNAP caseload dynamics by examining a
broader set of SNAP policies than previously available and using over 20 years of
monthly SNAP administrative data that can precisely measure program
participation and capture the timing of state policy implementation.
Our empirical approach is straightforward. We rely on variation across
states and over time in economic conditions and policy from January 1990
through December 2011 to identify the role of these factors in changes in state-
level monthly SNAP caseloads. We broadly group thirteen policies into several,
non-mutually exclusive, types: those that affect SNAP eligibility, those that affect
the transaction costs associated with SNAP participation, those that affect the
stigma of SNAP participation, those that affect outreach towards potentially
eligible non-participants, and those that reflect other means-tested transfer
programs. We compare the estimated effect of economic conditions and these
state-level policies across static and dynamic first-differenced models with
differing numbers of lags. We also compare our results between measuring the
caseload based on the number of households receiving SNAP in each state and the
number of individuals receiving SNAP in each state.
To preview our results, we find across specifications that the economy
plays a central role in determining state caseloads but state-specific SNAP
policies also contribute to the ups and downs of the caseload over the last two
decades, both through policies that affect eligibility and policies that affect the
costs of participation for those eligible. Specifically, we find that restricting the
eligibility of legal noncitizens has a large and significant chilling effect on the
caseload. Broad-based categorical eligibility, a policy that waives the SNAP asset
test and increases income limits for many households, has a positive effect on
caseload growth, but the effect is relatively small. Exempting vehicles from the
SNAP asset test has a small effect in the short-run but the effect grows over a
5
longer period. Providing transitional benefits to households leaving TANF has a
significant, positive effect on the SNAP caseload.
We find that reducing the burdens associated with SNAP recertification
and reporting requirements for income changes is associated with higher
caseloads. Allowing households to submit applications online appears to have a
small positive effect on the caseload, but estimates are not statistically significant
in the dynamic specifications. Stigma, in the form of requiring SNAP applicants
to be fingerprinted, has large negative effects on the caseload. In contrast,
distributing benefits via electronic benefit transfer (EBT) cards is not robustly
correlated with caseloads. We find little effect of federally funded radio and TV
outreach ads on caseloads. Finally, policies related to other means-tested
programs contribute to SNAP caseload changes, as both the expansion of state
and federal EITC programs and welfare reform both had a long-term, negative
effect on the caseload.
The next section of the paper describes SNAP and its recent history.
Section III considers the caseload data and how to parameterize the institutional
details to capture their effect on caseloads. Section IV describes the estimation
results and Section V presents results from policy simulations. Section VI
concludes.
II. SNAP: Institutional Details and Recent Program History
SNAP is designed to increase the food purchasing power of households
with low levels of monthly income and assets. In 2014, SNAP participants
received an average of $125 in monthly benefits per person
(http://www.fns.usda.gov/pd/supplemental-nutrition-assistance-program-snap). In
contrast with many other programs serving low-income households, SNAP
eligibility does not generally depend on family structure, age, or disability status,
6
so benefits reach a broad range of economically disadvantaged households.4 The
basic eligibility criteria for SNAP includes household gross income of 130
percent or less of the federal poverty level and household net income (gross
income less certain deductions, such as a standard deduction and deductions for
earned income, dependent care, utilities, and more) of 100 percent or less of the
federal poverty level.5 Additionally, households must have $2,000 or less in
assets. SNAP determines monthly benefits by subtracting 30 percent of household
net income from a maximum benefit level that depends on household size.
Nationwide, over 80 percent of eligible individuals participated in SNAP in 2012
(Eslami, 2014) but SNAP participation rates among eligible persons (take-up
rates) vary widely across time and states, from a low of roughly 57 percent in
California and Wyoming to over 90 percent in eight U.S. states (Cunnyngham,
2014).
SNAP underwent a number of changes in the past two decades that altered
the basic eligibility standards and program administration in ways that could
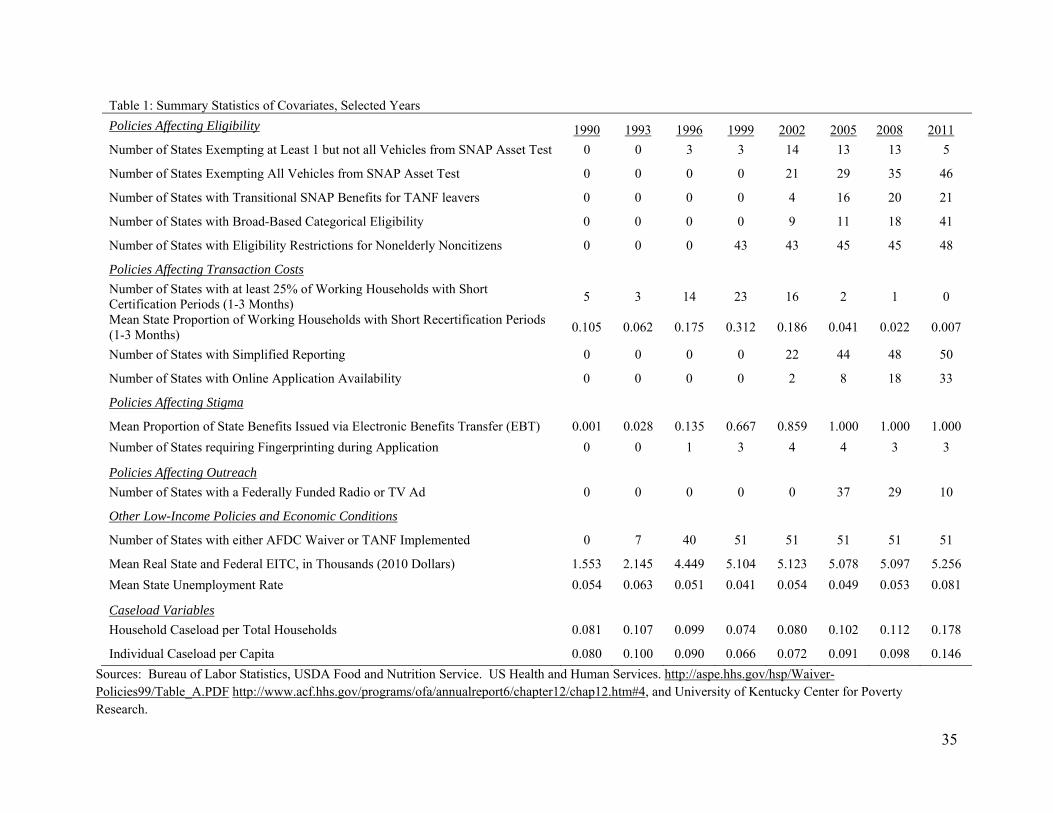
affect both the difficulty in enrolling in and staying on the program. Table 1
illustrates the increasing variation in state-level SNAP policies. The 1996 welfare
reform legislation made direct changes to SNAP eligibility, imposing strong
restrictions on SNAP benefits to able-bodied adults without dependents
(ABAWDs) and eliminating the eligibility of legal noncitizens to receive SNAP.
When welfare reform eliminated federal SNAP eligibility for legal noncitizens, a
handful of states created and maintained state-funded food assistance programs
for those that were otherwise ineligible for federal SNAP benefits. Subsequent
legislation reinstated eligibility for legal noncitizen children, legal immigrants in
4 There are certain restrictions on the receipt of food stamps by legal immigrants and able-bodied adults without dependents (ABAWDs). Households receiving Supplemental Security Income (SSI) or Temporary Assistance to Needy Families (TANF) are categorically eligible. 5 Households with elderly or disabled individuals have slightly more generous program rules.
7
the country for at least five years, and some specific legal immigrant groups, such
as refugees. Still, changes to the citizenship rules lingered, particularly as some
states eliminated or scaled back their state-funded food assistance programs. By
2011, although all otherwise eligible legal immigrant children could receive
SNAP in all 51 states, nonelderly legal immigrant adults faced at least some
restrictions on their SNAP eligibility in all but three states.
Welfare reform also had an indirect effect on SNAP participation because
of the mechanical link between AFDC and SNAP eligibility and participation:
specifically, AFDC recipients were “categorically eligible” to receive food
stamps. The sharp declines in TANF, AFDC’s replacement, recipients after
PRWORA decreased the number of households that were categorically eligible
for SNAP. Even among those who remained eligible for TANF, most TANF
funds provided in-kind benefits, such as child care, which did not confer
categorical eligibility for SNAP. The sharp declines in SNAP caseloads
following welfare reform prompted regulatory and legislative changes to expand
eligibility and reduce the burden of applying for SNAP. States were given more
flexibility to simplify administration and increase program access, especially for
low-income working families. In late 2000, states were authorized to extend
SNAP categorical eligibility to households that receive noncash, as well as cash,
TANF benefits. Over time, some states adopted a policy referred to as “broad-
based categorical eligibility,” which allows the state to remove the federal SNAP
asset restriction and increase the income limit for most low-income households in
the state. The number of states using broad-based categorical eligibility increased,
particularly after 2006, and 41 states adopted the policy by 2011.
The post-PRWORA era saw additional reforms affecting eligibility,
particularly the treatment of vehicles as household assets. States received the
ability to align their definitions of income and assets with their TANF or
Medicaid programs, as long as these definitions are less restrictive than the
8
federal SNAP definitions. Some states chose to exclude the value of one or all
vehicles in their TANF cash assistance program, and used the increased flexibility
to do the same in determining SNAP eligibility. States were also given the option
to provide an automatic SNAP benefit to families leaving TANF, for up to five
months after their TANF exit. In 2011, 21 states offered transitional SNAP
benefits to TANF leavers, with all of these states choosing to offer the full five
months of benefits.
Throughout the post-PRWORA period of emphasizing labor force
participation among lower income populations, state policies also changed with
respect to how recipients must establish their continued eligibility for the
program. State recertification periods—the number of months that can elapse
before a SNAP household has to recertify eligibility – shortened dramatically
through the 1990s as states sought ways to avoid federally-administered penalties
for benefit calculation errors (Rosenbaum, 2000). Short recertification periods
increase the difficulty of continued program participation for working families, in
particular, who may need to take off from work to complete the recertification
process. The 2000s saw states lengthen the recertification periods in an effort to
increase access to SNAP, particularly among low-income working households.
In between certifications, households who receive food stamps must report
changes in circumstances that may affect their eligibility or monthly benefit.
Before 2000, recipients had to report monthly and within ten days of a change in
circumstances that could affect eligibility. Since 2000, all states have the option to
allow SNAP recipients with earned income to report income changes on a
quarterly or semi-annual basis, rather than each month or each time a change in
circumstances occurs (U.S. GAO, 2002). Semi-annual, or “simplified” reporting
decreases reporting burdens on SNAP recipients because it requires households to
report changes to their financial circumstances within reporting periods only if the
changes would make them ineligible for the program.

9
Other SNAP policy changes since the 1990s affected how states utilize
technology in program administration. Beginning with Maryland in 1989, states
rolled out electronic benefit transfer (EBT) cards that can be used like a bank
debit card to purchase eligible food to reduce benefit fraud, program
administration costs, and the stigma of participation. The welfare reform
legislation imposed a deadline on states’ implementation of EBT for food stamp
benefits (USDA, 2006) and by 2004 every state paid all SNAP benefits via EBT.
Also beginning in the mid-1990s, a few states implemented fingerprinting
during the application process to reduce fraud associated with enrolling for
benefits under multiple names. In January 1996, New York was the only state
with a statewide fingerprinting requirement, but by January 2001, three additional
states –Arizona, California, and Texas – required fingerprinting statewide. While
only these four states ever adopted this requirement they comprise a large portion
of the national caseload: accounting for one quarter of the total national SNAP
caseload in 2001. Over time, states eliminated fingerprinting requirements and by
January 2012, Arizona was the only state to have a fingerprinting requirement.
In the early 2000’s, states began utilizing the internet in program
administration. A growing number of states allowed applicants to complete and
submit an application for SNAP benefits over the internet. By the summer of
2012, 35 states allowed all applicants to submit online applications and in three
additional states (California, Indiana, and New York), residents in some counties
could submit their application online. States differ in whether or not they allow
for an electronic signature or if applicants must mail in their signature to complete
an application. Some states also provide SNAP recipients with online access to
information about their case, recertification and changes in income reporting.
Finally, the emphasis on program access during the 2000s manifested
itself in a trend towards increased outreach to potentially eligible non-participants.
The federal government reimbursed states with a federally approved SNAP

10
outreach plan for half of their administrative costs on outreach spending. Each
fiscal year from 2001 to 2009, the federal government also awarded outreach
grants to non-profit organizations to increase participation among eligible non-
participants, particularly those with historically low participation rates such as
Hispanics and the elderly. In addition, a large-scale federally funded radio and
television advertising campaign in selected media markets, launched in 2004
sought to raise awareness about SNAP among potentially eligible non-
participants.
III. Data and Identification Strategy
We use the significant temporal and spatial variation in SNAP policies
described in the previous section as the source of our identification in estimating
the effect of these policies on the SNAP caseload. We measure the SNAP
caseload at the state, monthly level from January 1990 through December 2011.
We use two measures: the number of households and the number of individuals
receiving benefits.6 We normalize each state-month individual caseload by the
state’s population and each state-month household caseload by the number of
households in each state.7 Measuring a state’s caseload at monthly intervals
(versus annual intervals) can better capture the response to the precise timing of
the change in policy and coincides with the timing of benefit payment.
Administrative caseload data capture the measure of interest to policymakers and
avoid the substantial underreporting of SNAP receipt in household surveys
6 We are very grateful to Rebecca Blank and Geoffrey Wallace for providing us with the household level data between 1990 and 1998, and to Nadine Nichols of the Food and Nutrition Service, USDA for providing us with the additional data. 7 The Census Bureau provides estimates of the state population in July of each year. The number of households in each state uses data from the March CPS, provided by IPUMS-CPS. For both estimates, we assume a constant rate of change and smooth each population throughout the year.
11
(Meyer et al., 2009). The household caseload provides estimates for the relevant
SNAP benefit unit while the individual caseload captures the number of persons
that rely on benefits to meet their food needs.
The first set of covariates reflects state-level SNAP policy changes
described in the previous section. Table 1 describes each of the covariates in
selected years over our time period. To capture policies that affect mechanical
eligibility for benefits, we include a vector of dichotomous variables. The first
variable takes a value of one if noncitizens under age 65 face any restrictions to
their SNAP eligibility. Limits on the eligibility for noncitizens should reduce the
caseload through entry and exit, particularly in states with large immigrant
populations. We also include dichotomous variables for state vehicle policies,
parameterized as two dichotomous variables representing state policies to exempt
at least one but not all vehicles in the household and state policies to exempt all
vehicles in a household (state policies that do not exempt any vehicles serve as the
omitted group); state policies providing up to five months of transitional SNAP
benefits to those leaving TANF; and state adoption of broad-based categorical
eligibility. We expect each of these policies to contribute to growth in the SNAP
caseload by mechanically increasing the size of the eligible population.
Another set of variables captures SNAP policies that may affect stigma
and transaction costs among those eligible for SNAP. While not mutually
exclusive from those that affect stigma, we begin by considering policies that
affect transaction costs. We include measures to capture the implementation of
short recertification periods, defined as the proportion of working households
subject to a certification period of three months or less; state reporting policies,
defined as a dichotomous variables indicating the implementation of simplified
(or biannual) reporting (with quarterly, monthly or change reporting as the
omitted group); and, state online application availability, defined as a
dichotomous variable for states that allowed submission of an application for
12
SNAP benefits online. More frequent reporting and recertification policies should
reduce the caseload by encouraging exit from the program at the reporting or
recertification interval. Online applications should increase the ease of completing
application by eliminating the need to travel to the local SNAP office to apply for
benefits and encouraging entry into the program.
For policies affecting stigma, we include state EBT policies, defined as the
portion of state SNAP benefits issued via EBT, and the implementation of
fingerprinting requirements, defined as a dichotomous variable indicating the
statewide use of fingerprinting during the application process.8 Use of EBT may
increase caseloads by reducing the stigma of redeeming benefits, although the
new technology may pose difficulties for some individuals and grocery stores to
adopt. We presume that fingerprinting will reduce access by increasing the stigma
associated with entry into the program.
We examine outreach efforts, which seek to provide information on the
program to potentially eligible but non-participating populations. To capture this,
we examine federally funded SNAP radio and TV advertisements. 9 The media
campaigns, which we characterize with a dichotomous variable indicating the
airing of a federally funded TV or radio ad campaign in any media market in the
state, may increase SNAP participation by reducing the costs of learning about the
program and its eligibility criteria, in addition to reducing the transaction and
stigma costs associated with the program. Moreover, because state willingness to
accommodate any increase in applications was one criterion for deciding
8 New York State ended fingerprinting statewide in 2007 but New York City continued fingerprinting SNAP applicants through May 2012. We only consider fingerprinting policies in effect statewide. 9 Previous research captures outreach through state outreach spending under a federally approved outreach plan (Kabbani and Wilde 2003; Ratcliffe et al. 2008; Ratcliffe et al. 2011; Ziliak 2013). This measure of outreach is problematic because it only captures state-level spending each fiscal year that is reimbursed by the federal government, rather than the total of state-level outreach spending and it would require smoothing the annual data to fit our monthly observations. Because of these measurement challenges, we chose not to include this variable in our estimates.
13
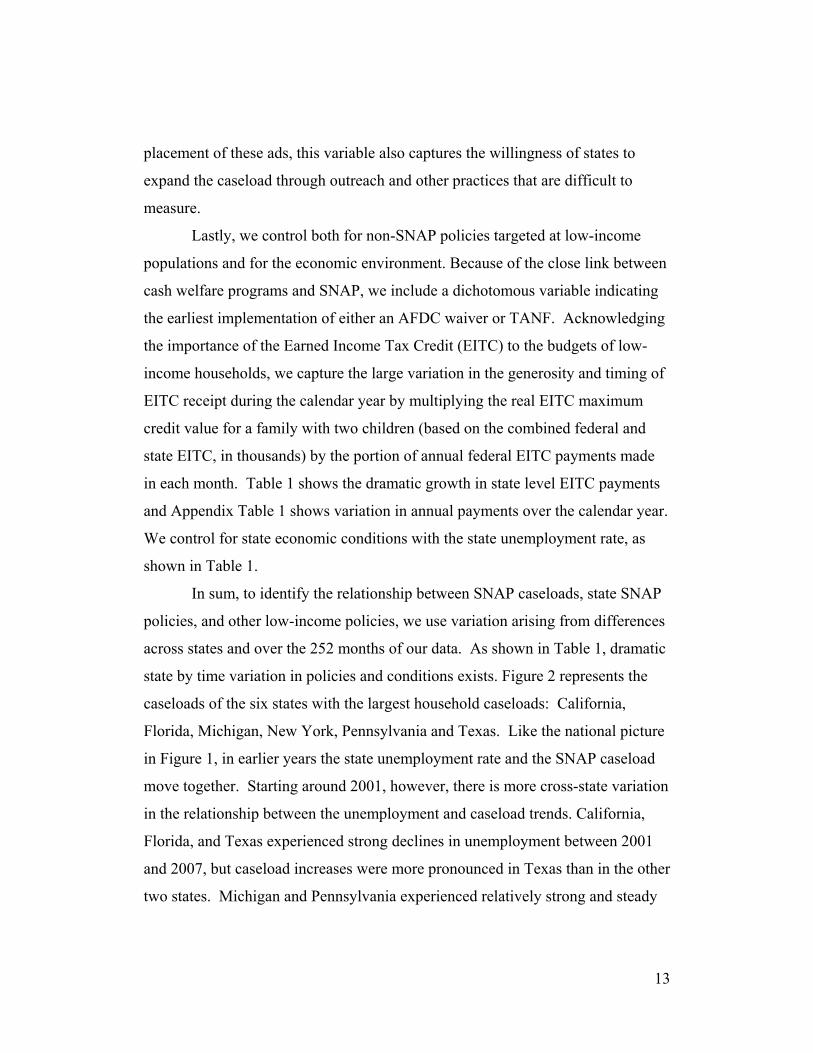
placement of these ads, this variable also captures the willingness of states to
expand the caseload through outreach and other practices that are difficult to
measure.
Lastly, we control both for non-SNAP policies targeted at low-income
populations and for the economic environment. Because of the close link between
cash welfare programs and SNAP, we include a dichotomous variable indicating
the earliest implementation of either an AFDC waiver or TANF. Acknowledging
the importance of the Earned Income Tax Credit (EITC) to the budgets of low-
income households, we capture the large variation in the generosity and timing of
EITC receipt during the calendar year by multiplying the real EITC maximum
credit value for a family with two children (based on the combined federal and
state EITC, in thousands) by the portion of annual federal EITC payments made
in each month. Table 1 shows the dramatic growth in state level EITC payments
and Appendix Table 1 shows variation in annual payments over the calendar year.
We control for state economic conditions with the state unemployment rate, as
shown in Table 1.
In sum, to identify the relationship between SNAP caseloads, state SNAP
policies, and other low-income policies, we use variation arising from differences
across states and over the 252 months of our data. As shown in Table 1, dramatic
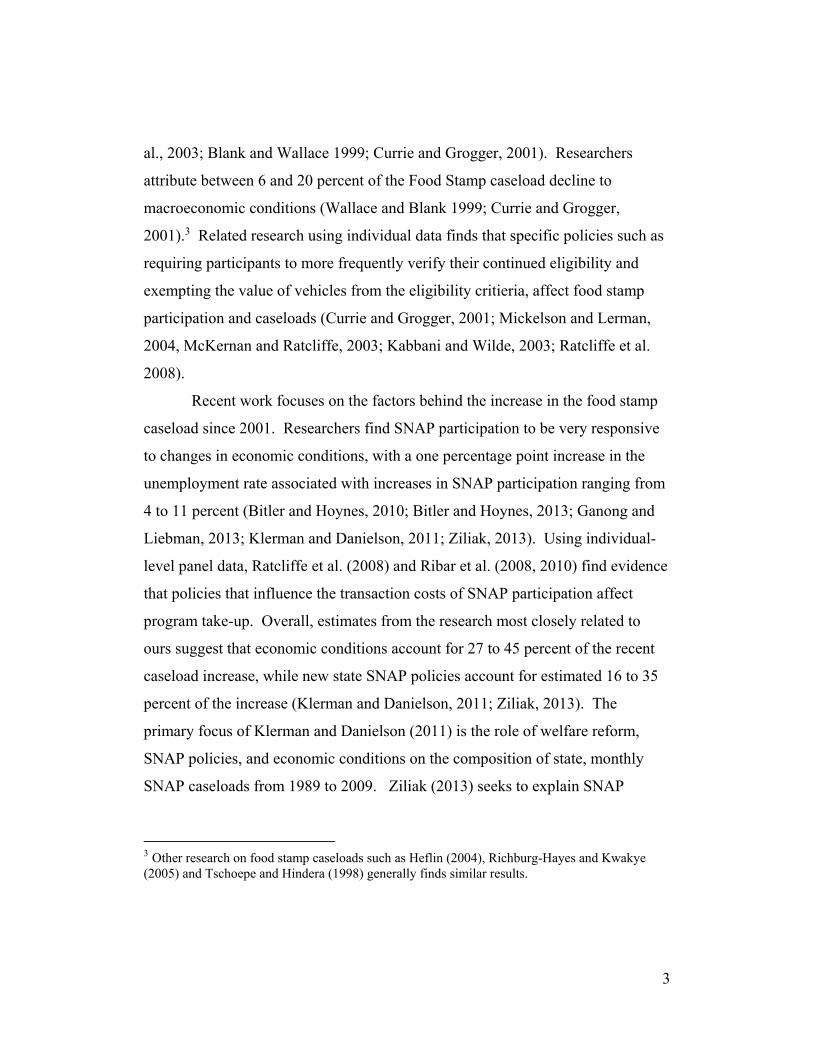
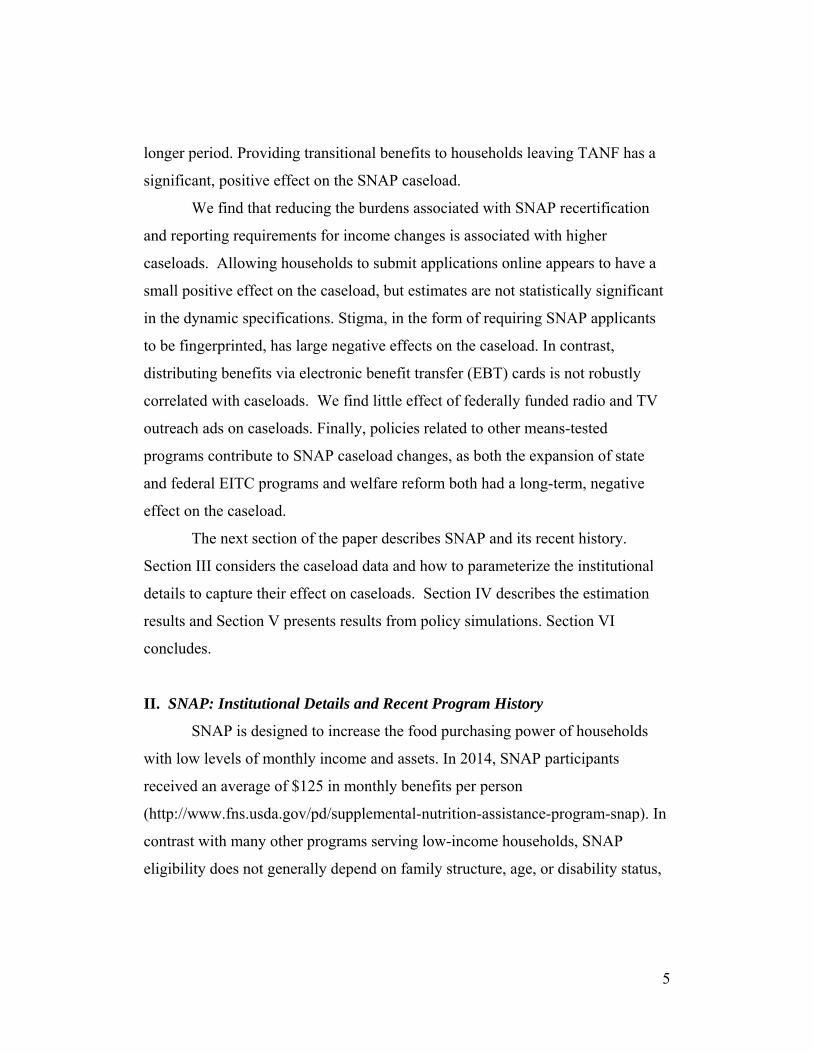
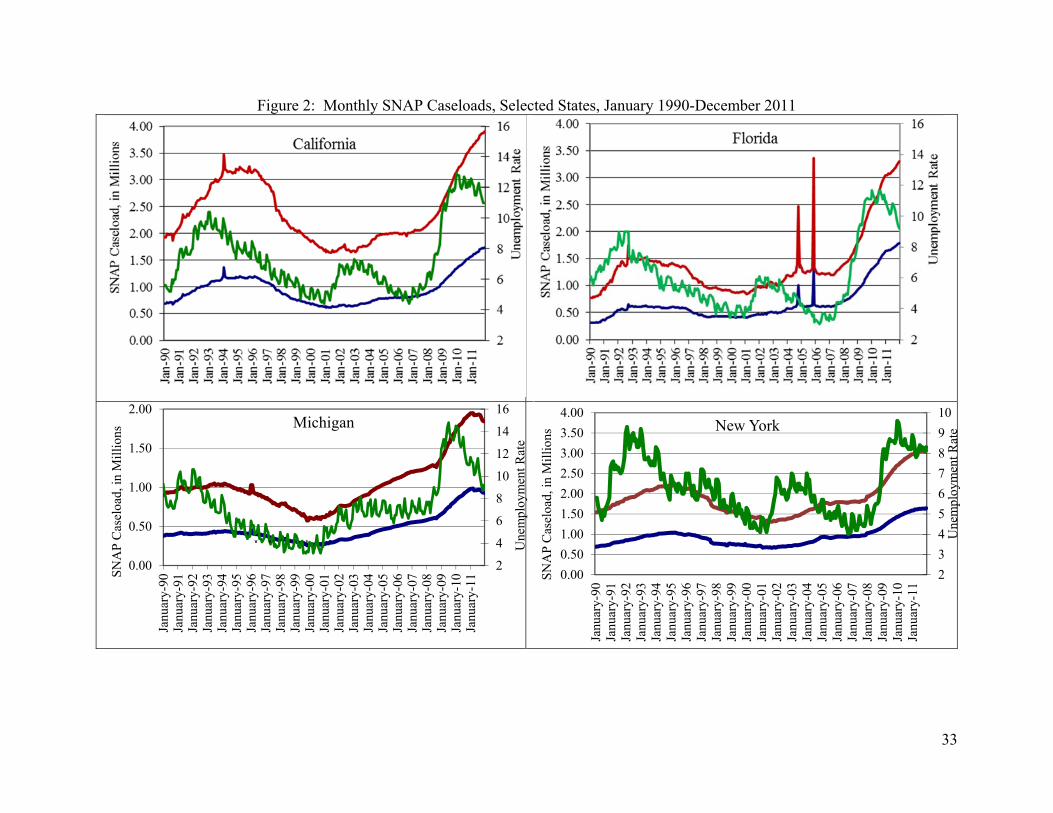
state by time variation in policies and conditions exists. Figure 2 represents the
caseloads of the six states with the largest household caseloads: California,
Florida, Michigan, New York, Pennsylvania and Texas. Like the national picture
in Figure 1, in earlier years the state unemployment rate and the SNAP caseload
move together. Starting around 2001, however, there is more cross-state variation
in the relationship between the unemployment and caseload trends. California,
Florida, and Texas experienced strong declines in unemployment between 2001
and 2007, but caseload increases were more pronounced in Texas than in the other
two states. Michigan and Pennsylvania experienced relatively strong and steady
14
increases in their SNAP caseloads between 2001 and 2007, despite a falling
unemployment rate in Pennsylvania and a relatively flat unemployment rate in
Michigan. The onset of the Great Recession led to sharp increases in SNAP
caseloads in all six states, but differences again emerge in the timing and
magnitude of the later decreases in unemployment rate and slowing of caseload
growth. It appears possible that state-specific SNAP policies may play a role in
determining the realization of the state SNAP caseload.
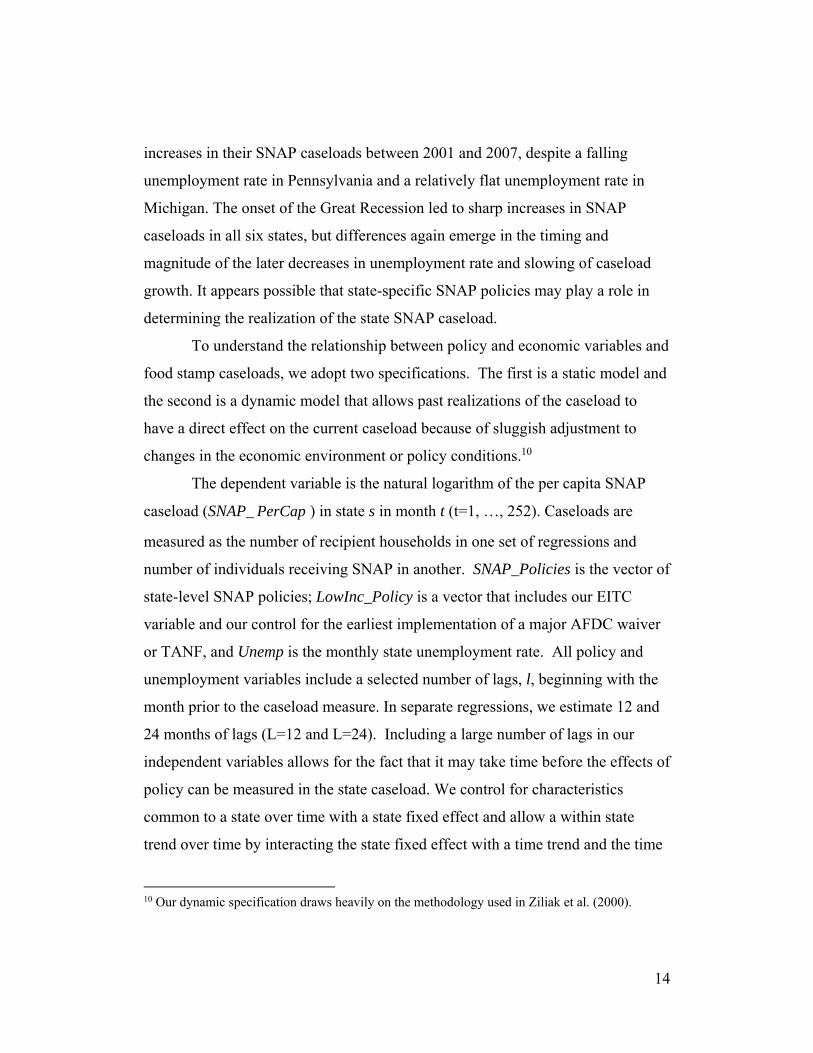
To understand the relationship between policy and economic variables and
food stamp caseloads, we adopt two specifications. The first is a static model and
the second is a dynamic model that allows past realizations of the caseload to
have a direct effect on the current caseload because of sluggish adjustment to
changes in the economic environment or policy conditions.10
The dependent variable is the natural logarithm of the per capita SNAP
caseload (SNAP_ PerCap ) in state s in month t (t=1, …, 252). Caseloads are
measured as the number of recipient households in one set of regressions and
number of individuals receiving SNAP in another. SNAP_Policies is the vector of
state-level SNAP policies; LowInc_Policy is a vector that includes our EITC
variable and our control for the earliest implementation of a major AFDC waiver
or TANF, and Unemp is the monthly state unemployment rate. All policy and
unemployment variables include a selected number of lags, l, beginning with the
month prior to the caseload measure. In separate regressions, we estimate 12 and
24 months of lags (L=12 and L=24). Including a large number of lags in our
independent variables allows for the fact that it may take time before the effects of
policy can be measured in the state caseload. We control for characteristics
common to a state over time with a state fixed effect and allow a within state
trend over time by interacting the state fixed effect with a time trend and the time
10 Our dynamic specification draws heavily on the methodology used in Ziliak et al. (2000).
15
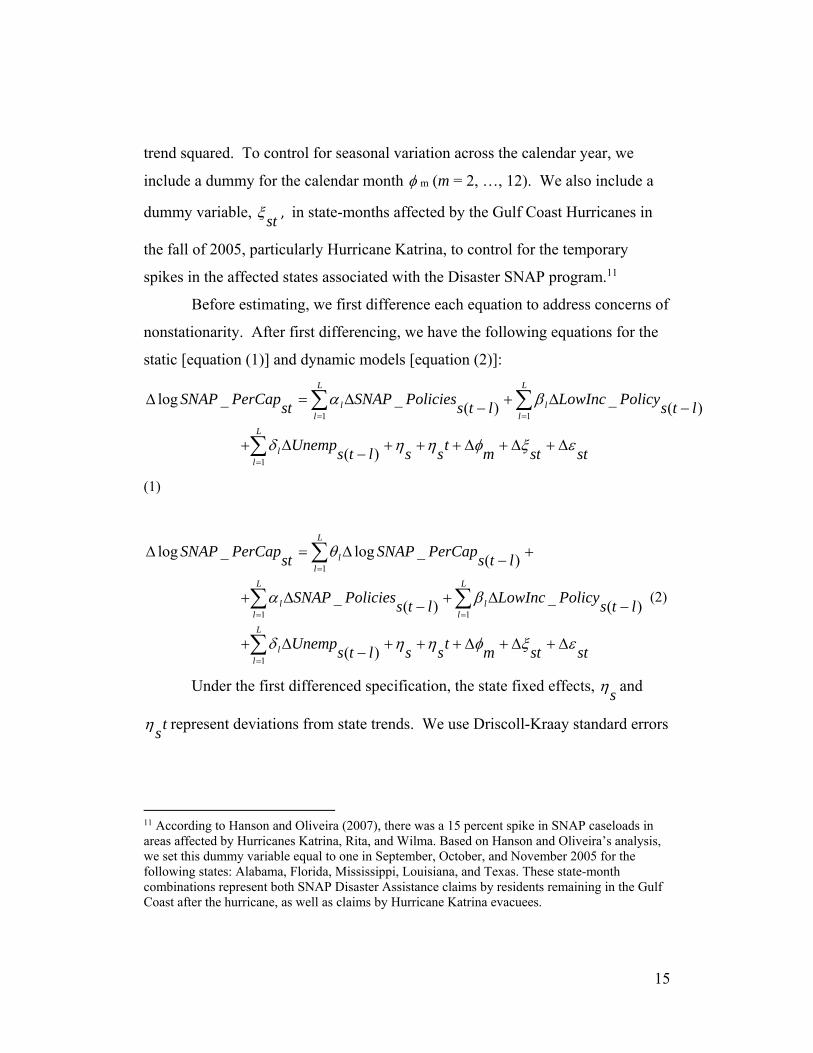
trend squared. To control for seasonal variation across the calendar year, we
include a dummy for the calendar month m (m = 2, …, 12). We also include a
dummy variable, st
, in state-months affected by the Gulf Coast Hurricanes in
the fall of 2005, particularly Hurricane Katrina, to control for the temporary
spikes in the affected states associated with the Disaster SNAP program.11
Before estimating, we first difference each equation to address concerns of
nonstationarity. After first differencing, we have the following equations for the
static [equation (1)] and dynamic models [equation (2)]:
ststmt
ssltsUnemp
ltsPolicyLowInc
ltsPoliciesSNAP
stPerCapSNAP
L
ll
L
ll
L
ll
1
11
)(
)(_
)(__log
(1)
ststmt
ssltsUnemp
ltsPolicyLowInc
ltsPoliciesSNAP
ltsPerCapSNAP
stPerCapSNAP
L
ll
L
ll
L
ll
L
ll
1
11
1
)(
)(_
)(_
)(_log_log
(2)
Under the first differenced specification, the state fixed effects, s
and
ts
represent deviations from state trends. We use Driscoll-Kraay standard errors
11 According to Hanson and Oliveira (2007), there was a 15 percent spike in SNAP caseloads in areas affected by Hurricanes Katrina, Rita, and Wilma. Based on Hanson and Oliveira’s analysis, we set this dummy variable equal to one in September, October, and November 2005 for the following states: Alabama, Florida, Mississippi, Louisiana, and Texas. These state-month combinations represent both SNAP Disaster Assistance claims by residents remaining in the Gulf Coast after the hurricane, as well as claims by Hurricane Katrina evacuees.
16
to account for spatial and temporal dependence in the covariance matrix (Driscoll
and Kraay, 1998).
IV. Results
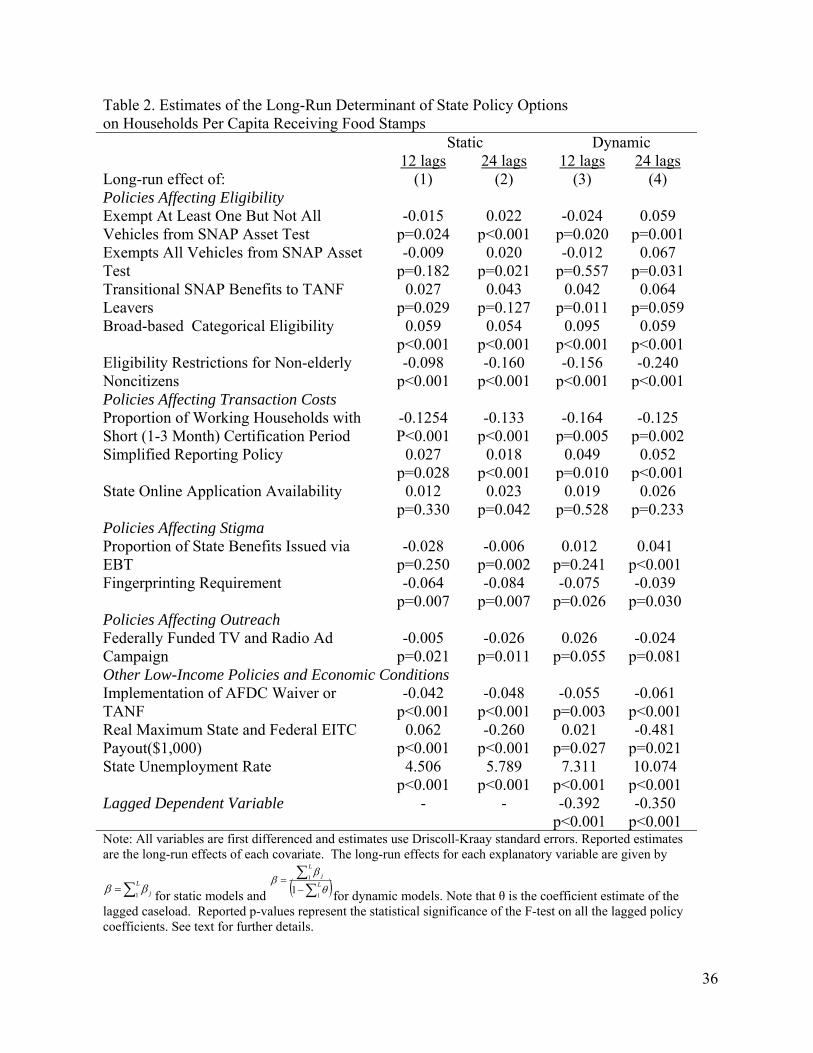
Table 2 and Table 3 provide the results of empirical estimation of the
household and individual per capita caseload, respectively. Column 1 of each
table provides static estimates using 12 lags of the explanatory variables while
Column 2 provides static estimates using 24 lags of the explanatory variables.
Columns 3 and 4 provide results for the dynamic specification, which includes
either 12 or 24 lags of the dependent variable. All reported estimates are the long-
run effects and we report p-values from the F-test of joint significance below each
estimate.12
Generally, specifying the dependent variable as either the household
caseload or the individual caseload tends to produce similar long-run estimates.
This suggests that the SNAP policies we consider do not, by and large, have
differing effects on larger households versus smaller households. Models that
include 24 lags rather than 12 lags tend to have larger and more statistically
significant long-run effects, implying that it can take more than a year for the
SNAP caseload to respond to changes in policy and economic conditions.
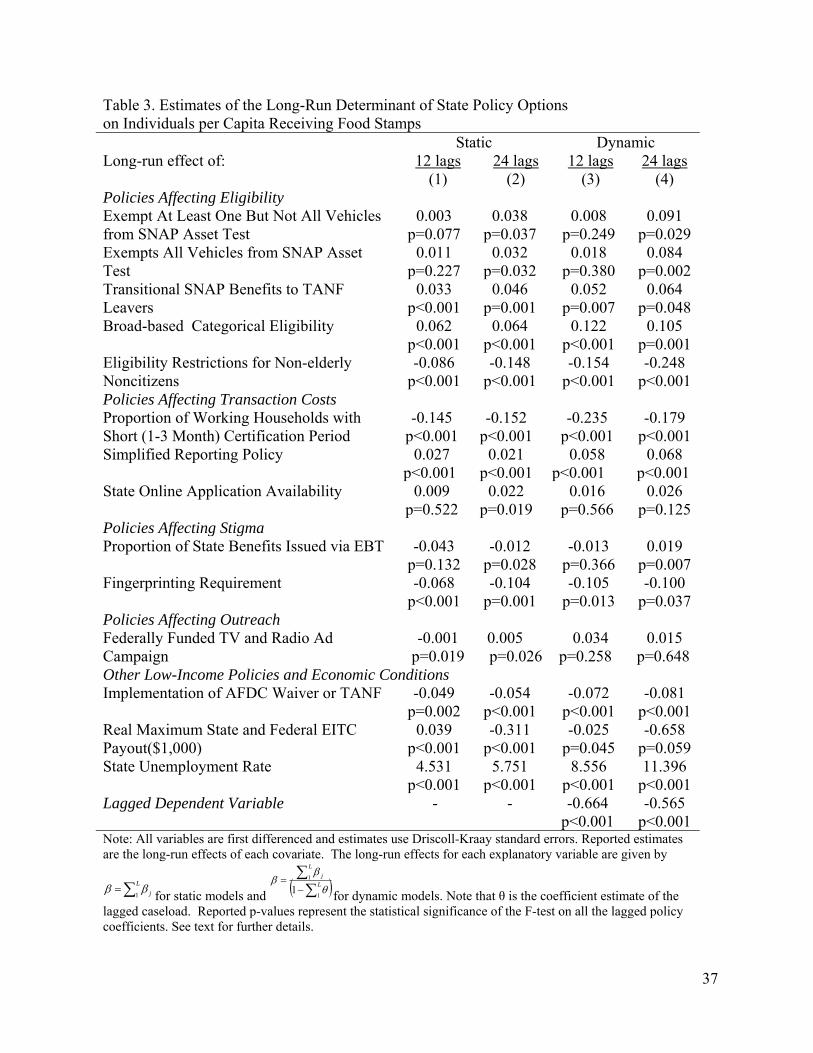
We turn now to a specific discussion of the estimated effects of SNAP
policies, beginning with SNAP policies affecting eligibility. We first discuss the
effect of vehicle exemption policies, where the omitted category is that no
12 The long-run effects for each explanatory variable are given by L
j1 for static models
and
L
L
j
1
1
1
for dynamic models. Note that θ is the coefficient estimate of the lagged
caseload.
17
vehicles are exempted from the SNAP asset test. We generally find no significant
effect of exempting vehicles after 12 months, except for a small and surprisingly
negative effect of exempting one but not all household vehicles on the household
caseload. After 24 months, we find consistently positive and statistically
significant effects of the vehicle exemption policies on both the household and
individual caseloads. The estimated effects are larger in the dynamic than in the
static model. For example, exempting at least one but not all vehicles from the
SNAP asset test increases the household SNAP caseload by 2.2 percent after 24
months in the static model and by 5.9 percent in the dynamic model. Likewise,
exempting all vehicles increases the household SNAP caseload by 2.0 percent in
the static model and 6.7 percent in the dynamic model. The point estimates of the
coefficients on the two vehicle policy variables are quite similar within each
model, suggesting that a policy to exempt all vehicles does not lead to greater
increases in the SNAP caseload than a policy to exempt one but not all vehicles.
Prior researchers find mixed evidence on the vehicle exemption policies, with
Ratcliffe et al. (2008) and Klerman and Danielson (2011) finding positive effects
on SNAP participation and Hanratty (2006) and Ziliak (2013) finding no effect.
We estimate that other policies intended to extend SNAP eligibility to
more types of households increase caseloads. Providing transitional benefits to
TANF leavers increases the caseload per capita between 2.7 percent and 5.2
percent after 12 months and between 4.5 percent and 6.4 percent after 24 months.
Broad-based categorical eligibility for SNAP increases the household caseload up
to 5.9 percent and the individual caseload up to 10.5 percent after 24 months. The
similarity of estimates in the model with 12 lags versus 24 lags suggests that most
of the caseload increase in response to the adoption of broad-based categorical
eligibility occurs within one year. Recent studies (Klerman and Danielson, 2011;
Ganong and Leibman, 2013; Ziliak, 2013) also find similar effects of broad-based
categorical eligibility.
18
In contrast to vehicle exemptions, transitional benefits and broad-based
categorical eligibility, the eligibility restrictions on noncitizens reduce the size of
the eligible population. We find large, negative effects of policies that prevent
nonelderly noncitizens from receiving benefits. The effect is much larger in the
long run, with caseload reduction of 14.8 to 24.8 percent after 24 months of the
rule preventing noncitizens from receiving benefits, compared to 8.6 to 15.6
percent reductions in caseloads after 12 months.
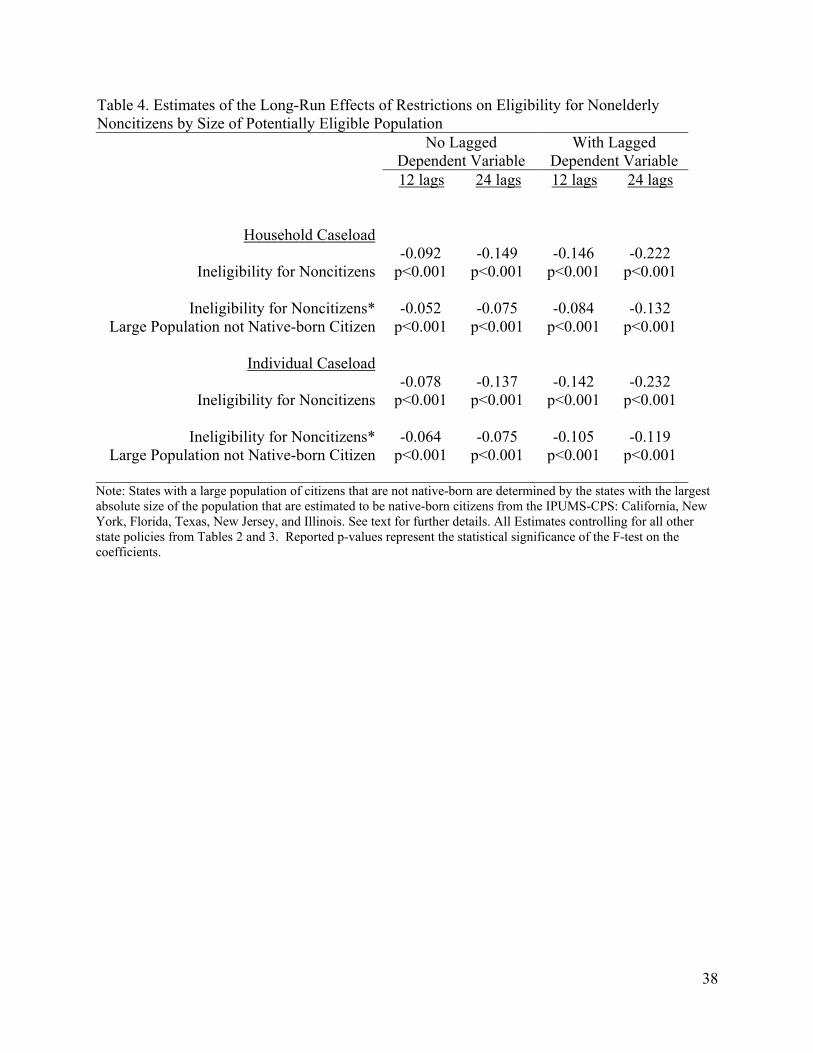
Table 4 shows that the large declines in caseloads in response to the
eligibility restrictions have the expected differential effect in states with large
populations of noncitizens.13 In particular, consider the results in the final column
of Table 4, from the dynamic model of the SNAP household caseload that
includes 24 monthly lags of the explanatory variables. Imposing eligibility
restrictions on nonelderly noncitizens lowers the caseloads by 35 percent in states
that have large populations of noncitizens, relative to 22 percent in states that do
not have large populations of noncitizens. In all cases, the estimated magnitude of
the effect of these restrictions on SNAP eligibility of noncitizens on caseload
appears very large, suggesting these policies affected participation not only by
reducing the pool of eligible noncitizens, but also through a chilling effect that
discouraged participation among eligible noncitizens. Evidence of chilling effects
from the post-welfare reform change in the eligibility rules for legal noncitizens
has also been found for other means-tested programs, including SNAP (Bitler and
Hoynes, 2011; Borjas 2003; Borjas 2004, Fix and Passel, 1999).
13 To define states as differentially affected, we tabulate the size of the adult population that is not native-born citizens in each state using IPUMS-CPS data from 1996 through 2012. Examining the states with the largest non-native citizen populations in each year, we find the largest populations in California, New York, Florida, Texas, New Jersey, and Illinois and a clear break in the distribution after these states. Specifications that defined states as differentially affected by examining the percent of the population that were not native-born citizens or the percent of the population that were not citizens produce similar results.

19
Among policies that affect the transaction costs associated with
participating in SNAP, we estimate that short recertification periods for working
households reduce the caseload, as first shown by Kabbani and Wilde (2003).
With a 10 point increase in the percentage of working households with
recertification periods of three months or less, the SNAP caseload declines by 1.3
to 2.4 percent. Kabbani and Wilde (2003) find similar effects during the 1990s.
Replacing monthly reporting requirements with simplified reporting
policies have a long-run effect increasing the caseload by 2.7 to 5.8 percent after
12 months and similar effects after 24 months. While the availability of online
SNAP applications may reduce the transaction costs of entering SNAP by
eliminating the need to travel to a county office to complete the forms, the
estimated effect is positive but not statistically significant in most specifications.
The point estimates are similar to Schwabish (2012) who finds in the first three
years after the availability of online applications, per capita SNAP participation
increases less than one percent per year.
Turning to policy variables that may affect stigma among the potential
caseload, our results confirm the findings of Ratcliffe et al. (2008) and Ziliak et
al. (2003) who find little to no effect of EBT on SNAP participation. Our long
term estimates are statistically significant only in the models with 24 lags,
however the estimates are small and negative in the static model and small and
positive in the dynamic model.
In contrast, we find that requiring SNAP applicants to be fingerprinted,
which we would expect to increase the stigma associated with benefit receipt, has
a large negative effect on SNAP caseloads. Over a 12 month period, the
implementation of a fingerprinting requirement reduces the caseload by 6.4 to
10.5 percent. After 24 months, a fingerprinting requirement reduces the caseload
by 3.9 to 10.4 percent. As previously discussed, these policies occurred in states
with large SNAP caseloads: Arizona, California, New York, and Texas. These
20
large negative estimates are consistent with other research (Ratcliffe et al., 2008;
Ratcliffe et al., 2011; Ziliak, 2013) and anecdotal evidence by anti-hunger groups
that fingerprinting requirements dissuade eligible households from applying for
SNAP (California Association of Food Banks 2010; Eligon 2012; Goetz 2009).
The estimates on the effect of having a federally funded TV or radio
campaign in at least one media market in the state are weak and contradictory,
despite anecdotally evidence that the ads generated a large number of requests for
program information and application assistance.. In the dynamic model, the
results are positive but never statistically significant. In the static model, the
estimates are negative, but close to zero. Prior studies using a different measure of
outreach--outreach spending in the state under a federally-approved outreach
plan--also found mixed results. Ratcliffe et al. (2008) find no effect of outreach
spending on SNAP participation, Kabbani and Wilde (2003) find a positive effect
only among working households, and Ziliak (2013) finds a small negative effect.
We find, as expected, that welfare reform has a significant negative effect
on SNAP caseloads, which indicates that the mechanical link between AFDC and
food stamps helps explain the decline in the SNAP caseload in the late 1990s. The
long-run coefficient estimate on the indicator variable of implementation of either
an AFDC waiver or TANF suggests that food stamp caseloads were 4.1 to 8.0
percent lower as a result of welfare reform.
Changes in the EITC are also highly correlated with the monthly SNAP
caseload. The federal EITC expansions – particularly the 1993 expansion – were
intended to ensure that joint receipt of SNAP and EITC would raise employed
families’ after-tax and after-benefit income above the federal poverty level. In
three out of the four models, we estimate a positive effect of the EITC on
caseloads after 12 months. However, we find that EITC benefits are associated
with caseload reductions after 24 months. For every $1,000 increase in the
monthly EITC benefit payout in the state, the SNAP caseload declined by 2.6 to
21
6.6 percent after 24 months. Our results suggest that in the long run increases in
EITC generosity may influence food stamp recipients to either transition off the
caseload or never apply for benefits. It is possible that the EITC’s influence on
labor supply and earned income may reduce eligibility or the benefits associated
with SNAP participation (for example, Eissa and Liebman 1996). In addition, the
annual EITC payment may reduce SNAP eligibility if EITC recipients invest in
assets with their payment (for example, Goodman–Bacon and McGranahan,
2007). Our results contrast with Mickelson and Lerman (2004) who find some
negative, yet non-robust, effect of the EITC on SNAP participation. Ratcliffe et
al. (2008), however, find results consistent with our estimated effects of the EITC
on SNAP participation.
Finally, the results on the long-run effect of unemployment on SNAP
caseloads imply that a one percentage point increase in the unemployment rate is
associated with a 4.5 to 11.4 percent increase in caseloads. The dynamic
specifications predict that a one percentage point increase in the unemployment
rate results in at least a 7 percent increase in the SNAP caseload, which is larger
than the effect found in most recent studies (Bitler and Hoynes, 2012, 2013;
Ziliak, 2013), but similar to the finding of Klerman and Danielson (2011).
V. Simulations
We use our regression estimates to.calculate the contribution of each
explanatory variable to the predicted change in the caseload over a specified time
period. We first calculate the predicted change in the caseload due to all
observable factors over the chosen time period. We then calculate what the
predicted change would have been, if the factor of interest were held constant at
the baseline month. For example, we calculate the predicted change in the
caseload from July 2000 to December 2011, holding SNAP policies at their July
22
2000 levels. The difference between the overall predicted change and the
predicted change with SNAP policies held at the baseline level gives us the
contribution of SNAP policies to the predicted caseload change. We estimate the
share of our predicted caseload change that is due to changes in SNAP policies,
Welfare Reform, the EITC and economic and seasonal factors. In each of our time
periods, the actual change in household caseloads is larger than our predicted
change. We report the simulated effect of the policy or economic changes as a
share of the predicted change in caseloads, acknowledging that factors
unobserved to us play a further role in actual caseload changes.
We use the estimates from the dynamic specification where the outcome
variable is the number of SNAP households per capita and the estimates include
24 lags of the independent variables (Column 4 of Table 2). In this dynamic
specification, SNAP policies have a direct effect on future caseloads, through the
lag structure (and the estimates of the vector ), and, therefore, an indirect effect
on future caseloads by affecting the lagged caseloads for future time periods (and
the parameter estimates of the vector ). Our simulations account for both of
these effects through an iterative process of predicting the 51 state SNAP
caseloads, holding the set of covariates of interest constant between a beginning
and ending time. Obviously, we estimate these contribution of the policy
changes with error and so, in order to put standard errors on our estimates, we
bootstrap with random draws from the parameters (specific details are available in
an online appendix)..14
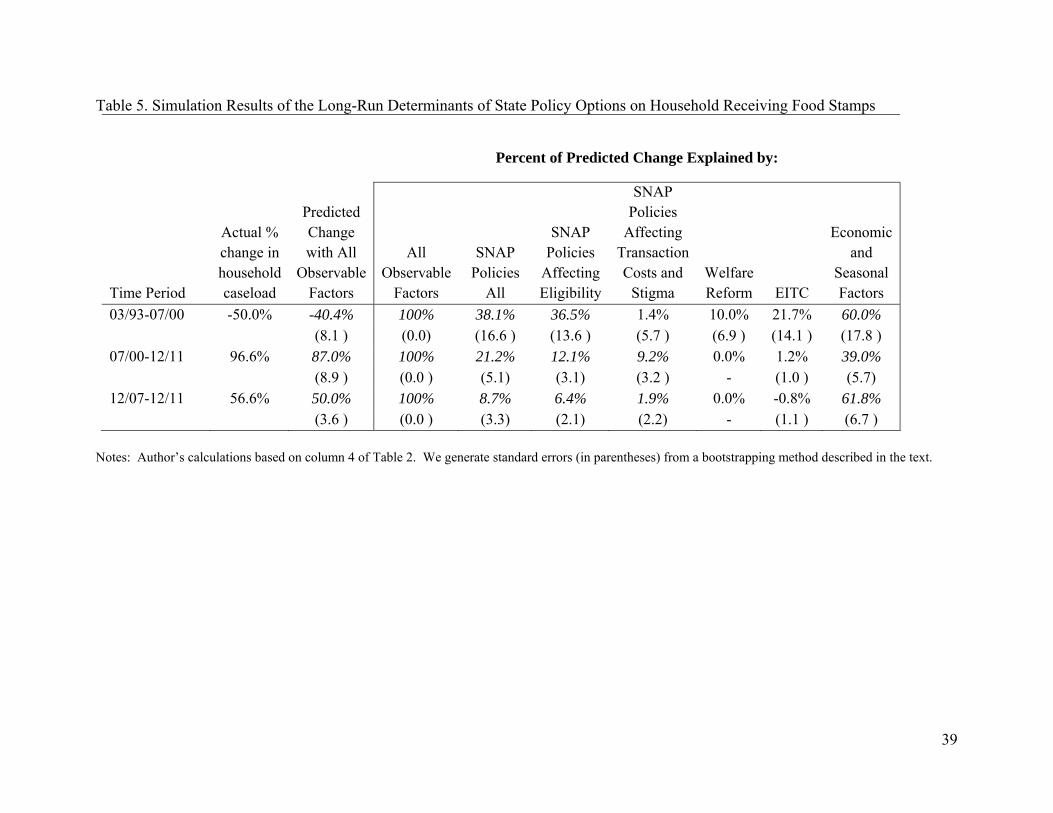
Table 5 shows the results of the simulations. We consider three distinct
time periods: March 1993 to July 2000, which includes the period of welfare
reform, an overall improving economy, and the large decline in SNAP caseloads;
23
July 2000 to December 2011, covering two recessions, increased access to SNAP,
and the dramatic caseload increase; and December 2007 to December 2011,
which marked the beginning of the Great Recession through the end of our data.
During the 1993 to 2000 period the actual caseload declined by 50 percent
and we predict a 40.4 percent decline. We simulate that the changes in the
combined SNAP policies explain 38.1 percent of the 40.4 percent decline our
specification predicts. Nearly all of this predicted effect reflects the restrictions
on eligibility for noncitizens in the post PRWORA era. We also capture changes
in state policies that likely affected transaction costs (shorter recertification
periods) and stigma (increased EBT receipt).15 Overall, these combined policies
affecting transaction costs and stigma explain only 1.4 percent of the predicted
decline, with large standard errors around this small point estimate. Welfare
reform alone, either an AFDC waiver or TANF implementation, explains 10.0
percent of the predicted decline. Expansions in the EITC explain 21 percent of
the predicted decline, but the effects of both the EITC and welfare reform are
imprecisely estimated. In contrast, our simulations suggest that the improvements
in the economy account for 60 percent of the decline in predicted SNAP
caseloads. This estimate is precisely estimated at standard significance levels.
Moving into the more recent time period, the SNAP caseload nearly
doubled between July 2000 and December 2011, increasing by 96.6 percent.
Overall, SNAP policies account for one-fifth of the predicted caseload increase.
In contrast to the 1993 to 2000 time period, the SNAP reforms generally
expanded eligibility and reduced transaction costs and stigma. We estimate that
the SNAP policy changes that expanded eligibility explain 12.1 percent of the
15 Individual SNAP policy reforms, like the EBT payouts are often very imprecisely estimated, as expected from the regression results in Table 2, and we choose not to report the simulation results with them, although they are available upon request. Although there were some state specific changes in ABAWD policies, the data on their implementation have never been collected consistently, so we do not parameterize these changes in our empirical work.

24
dramatic increase, with the adoption of broad-based categorical eligibility
accounting for 4.3 percent of the increase. Reductions in transaction costs and
stigma explain 9.2 percent of the caseload increase. Each of these are precisely
estimated at standard levels. Because there was no change in our indicator
variable for welfare reform during this period, it plays no estimated direct role in
the expansion. Although we estimate the EITC to be a small positive factor in the
caseload explosion, the estimate is again very imprecise. The economy continues
to play a large role, but not as large as in the pre-2000 period, explaining only
39.0 percent of the caseload increase.
Our simulation methodology allows us to estimate the role of SNAP
policies across states in this recent, 2000 to 2011, caseload increase. Returning to
the states highlighted in Figure 2, we are able to show see that because state
policies and unemployment rates varied so greatly, our estimates of the role of
SNAP policies on caseloads also varies greatly. For example, state SNAP
policies explain15 percent of the predicted caseload increase in Michigan and
27.9 percent in New York. Michigan had larger swings in unemployment rates
over this period and New York eliminated their fingerprinting requirement in
2007, while Michigan never had one. Note that our simulation results are based
on the coefficients for the entire United States, so that differences between states
reflect differences in which policies were implemented, not differential responses
to those policies. We include West Virginia and Oklahoma as the two states
where the SNAP policy explain the largest amount of their predicted state
caseload increases, 53.3 percent and 34 percent respectively. Economic
conditions account for more than 20 percent of the predicted caseload increases
over this time in all states, with California and Michigan at 60.2 percent and 47.5
percent respectively.
Given the severity of the Great Recession, our final set of simulations,
returning to Table 5, includes the years 2007 to 2011. In those four years, the
25
SNAP household caseloads expanded by 56.6 percent and our specification
predicts at 50 percent increase. Perhaps not surprisingly, we estimate that the
economy explained 61.8 percent of the predicted increase. The pace of policy
changes had slowed substantially by 2007, so the SNAP policy reforms explain
only 8.7 percent of the predicted increase, which is swamped by the share
explained by the economic and seasonal factors of 61.8 percent.
VI. Discussion and Conclusion
In this paper, we examine the role of economic conditions and policy
changes in explaining both the 1994-2001 decline in the SNAP caseload and the
2001-2011 increase. We estimate a first-differenced equation explaining state-
level monthly SNAP caseloads for the period January 1990 to December 2011 in
both static and dynamic caseload models. Using more than twenty year time
series of state, monthly caseload data allows us to more precisely identify how
changes in the economy and state policy choices influence its SNAP caseload.
Our estimation results indicate that the recent policies intended to increase
access to SNAP, such as more simplified application processes, increased state
SNAP caseloads. Consistent with previous research, we find that the SNAP
caseload increased as eligibility certification periods increased in the 2000s. In
addition, States’ adoption of less restrictive income reporting policies and asset
tests contributed to the 2000-2011 SNAP caseload increase, although the
measured effects were smaller than that of shortening recertification periods.
Importantly, while the broad-based categorical eligibility policy was a subject of
heated debate in the Congressional deliberations over the Agricultural Act of
2014, we find that it explains less than 5 percent of the recent caseload increase.
The unprecedented freedom states recently acquired to shape SNAP
eligibility and administration is not solely responsible for the recent caseload
26
changes. Other means-tested programs, including welfare reform and the EITC,
have influenced SNAP caseloads in expected ways, highlighting the importance
of examining the SNAP caseload in the context of the overall policy environment
affecting low-income households. Moreover, the results also indicate a strong
positive relationship between the state unemployment rate and the SNAP
caseload, even after controlling for a large number of policies that increased
access to SNAP in the 2000s. Therefore, although we see a divergence in the
trends in state unemployment rates and the state SNAP caseload, the strong effect
of the unemployment rate suggests that a sustained economic recovery will reduce
the SNAP caseload from its recent historically high levels.

27
References
Bitler, Marianne and Hilary W. Hoynes. 2010. "The State of the Safety Net in the Post-Welfare Reform Era." Brookings Papers on Economic Activity, (Fall 2010).
Bitler, Marianne and Hilary W. Hoynes. 2011. “Immigrants, Welfare Reform, and
the U.S. Safety Net.” in Card, David and Steven Raphael (eds), Immigration, Poverty, and Socioeconomic Inequality, in press, Russell Sage Foundation, New York, NY
Bitler, Marianne and Hilary W. Hoynes. 2013. "The More Things Change, The
More They Stay The Same: The Safety Net, Living Arrangements, and Poverty in the Great Recession, NBER Working Paper 19449, (September 2013).
Borjas, George J. 2003. "Welfare Reform, Labor Supply, and Health Insurance in
the Immigrant Population.” Journal of Health Economics, 22(6): 933-958. Borjas, George J. 2004. “Food Insecurity and Public Assistance.” Journal of
Public Economics 88(7–8): 1421–443. California Association of Food Banks. 2010. “Finger Imaging: Pointing
California in the Wrong Direction”. Executive Summary. July 6, 2010. http://www.cafoodbanks.org/docs/Finger%20Imaging%20Report%20Executive%20Summary.pdf
Cunnyngham, Karen E. “Reaching Those in Need: State Food Stamp Participation
Rates in 2011.” Alexandria, VA: U.S. Department of Agriculture, Food and Nutrition Service, February 2014.
Currie, Janet and Jeffrey Grogger. 2001. "Explaining Recent Declines in Food
Stamp Program Participation." Brookings-Wharton Papers on Urban Affairs: 203-244.
Driscoll, John C. and Aart C. Kraay. 1998. “Consistent Covariance Matrix
Estimation with Spatially Dependent Panel Data.” The Review and Economics and Statistics 80: 549-560.
Eissa, Nada and Jeffrey B. Liebman. 1996. “Labor Supply Response to the Earned
Income Tax Credit,” Quarterly Journal of Economics 111(2): 605-637.

28
Eligon, John. 2012. “Cuomo Pushing City to End Food Stamp-Fingerprinting”
New York Times. May 17. http://www.nytimes.com/2012/05/18/nyregion/cuomo-seeks-to-end-fingerprinting-for-food-stamps-in-nyc.html
Eslami, Esa. “Trends in Supplemental Nutrition Assistance Program Participation
Rates: Fiscal Year 2010 to Fiscal Year 2012.” Alexandria, VA: Food and Nutrition Service, U.S. Department of Agriculture, July 2014.
Figlio, David N, Craig Gundersen and James P. Ziliak, 2000. “The Effects of the
Macroeconomy and Welfare Reform on Food Stamp Caseloads.” American Journal of Agricultural Economics, vol. 82, no. 3, August: 635-41
Fix, Michael E. and Jeffrey S. Passel 1999. “Trends in Noncitizens’ and Citizens’
Use of Public Benefits Following Welfare Reform: 1994–1997.” Washington, D.C.: The Urban Institute.
Ganong, Peter and Jeffrey B. Liebman. 2013. “The Decline, Rebound, and
Further Rise in SNAP Enrollment: Disentangling Business Cycle Fluctuations and Policy Changes,” NBER Working Paper 19363, August.
Goetz, Kaomi. 2009. “Fingerprinting for Food Stamps Under Scrutiny”
National Public Radio. December 18. http://www.wbur.org/npr/121560340/fingerprinting-for-food-stamps-under-scrutiny
Goodman-Bacon, Andrew and Leslie McGranahan 2007. “How Do EITC
Recipients Spend Their Refunds?” Economic Perspectives, Federal Reserve Bank of Chicago, Vol. 31, First Quarter 2007.
Hanratty, Maria J. 2006. "Has the Food Stamp Program Become More
Accessible? Impacts of Recent Changes in Reporting Requirements and Asset Eligibility Limits." Journal of Policy Analysis and Management 25 (3):603-621.
Hanson, Kenneth and Victor Oliveira. 2007. “The 2005 Gulf Coast Hurricanes'
Effect on Food Stamp Program Caseloads and Benefits Issued.” Economic
29
Research Report Number 37, USDA Economic Research Service. http://www.ers.usda.gov/publications/err37/err37fm.pdf
Heflin, Coleen. 2004. “Who Exits the Food Stamp Program after Welfare
Reform?” IRP Discussion Paper 1279-04. Kabbani, Nader S., and Parke E. Wilde. 2003. "Short Recertification Periods in
the U.S. Food Stamp Program." Journal of Human Resources 38 (Special Issue on Income Volatility and Implications for Food Assistance Programs):1112-1138.
King, Miriam, Steven Ruggles, J. Trent Alexander, Sarah Flood, Katie Genadek,
Matthew B. Schroeder, Brandon Trampe, and Rebecca Vick. Integrated Public Use Microdata Series, Current Population Survey: Version 3.0. [Machine-readable database]. Minneapolis: University of Minnesota, 2010.
Klerman, Jacob Alex and Caroline Danielson. 2011. “The Transformation of the
Supplemental Nutrition Assistance Program” Journal of Policy Analysis and Management, 30(4): 863-888).
McKernan, Signe-Mary and Caroline Ratcliffe. 2003. “Employment Factors
Influencing Food Stamp Program Participation,” E-FAN-03-012, Washington, DC: Economic Research Service, U.S. Department of Agriculture.
Meyer, Bruce D., Wallace K. C. Mok, and James X. Sullivan. 2009. "The Under-
Reporting of Transfers in Household Surveys: Its Nature and Consequences." National Bureau of Economic Research Working Paper Series No. 15181.
Mikelson, Kelly S. and Robert I. Lerman. 2004. “The Relationship between the
EITC and Food Stamp Program Participation Among Households with Children.” Urban Institute. http://www.urban.org/UploadedPDF/411033_EITC.pdf
Ratcliffe, Caroline and Signe-Mary McKernan and Kenneth Finegold. 2008.
“Effect of Food Stamp and TANF Policies on Food Stamp Program Participation.” Social Service Review, 82(2), June: 291-334.

30
Ratcliffe, Caroline, Signe-Mary McKernan, and Sisi Zhang. 2011. "How Much Does the Supplemental Nutrition Assistance Program Reduce Food Insecurity?" American Journal of Agricultural Economics 93 (4):1082-1098.
Ribar, David C, Marilyn Edelhoch, and Qiduan Liu. 2008. “Watching the Clocks:
The Role of Food Stamp Recertification and TANF Time Limits in Caseload Dynamics” Journal of Human Resources, 43(1): 208-39.
Ribar, David C., Marilyn Edelhoch, and Qiduan Liu. 2010. “Food Stamp
Participation among Adult-Only Households. Southern Economic Journal. 77(2): 244-270.
Richburg-Hayes and Lashawn and Isaac Kwakye. 2005. Food Stamp Caseload
Dynamics: A Study in Four Big Cities, MDRC Technical Report. Rosenbaum, Dorothy. 2000. “Improving Access to Food Stamps: New Reporting
Options Can Reduce Administrative Burdens and Error Rates.” Washington, DC: Center on Budget and Policy Priorities, September.
Rowe, Audrey. 2012. Budget Hearing before the House Committee on
Appropriations Subcommittee on Agriculture, Rural Development, Food and Drug Administration and Related Agencies, February 28.
Schwabish, Jonathan. 2012. “Downloading Benefits: The Impact of Online Food
Stamp Applications on Participation.” APPAM Conference Paper. Available at: https://appam.confex.com/appam/2012/webprogram/ExtendedAbstract/Paper2890/Schwabish%20Online%20SNAP%20Paper_10_12_2012_APPAM.pdf
Tanner, Michael. 2013. "It's Time to Rein In the Growth of Food Stamps."
Commentary, CQ Roll Call, November 13, 2013. http://www.rollcall.com/news/its_time_to_rein_in_the_growth_of_food_stamps_commentary-229047-1.html
Heritage Foundation, “Reforming the Swelling Food Stamps Program,” Factsheet No. 129, October 28, 2013: http://www.heritage.org/research/factsheets/2013/10/reforming-the-swelling-food-stamps-program

31
Tschoepe Gary J. John J. Hindera. 1998. Explaining State Food Stamp Caseload Variance: Does State Administration Matter? Administration & Society, 30(1): 53-61.
U.S. Department of Agriculture, Food and Nutrition Service. 2006. “An Analysis of Food Stamp Benefit Redemption Patterns,” http://www.fns.usda.gov/analysis-food-stamp-benefit-redemption-patterns.
U.S. General Accounting Office. 2002. “Food Stamp Program: States' Use of Options and Waivers to Improve Program Administration and Promote Access,” GAO-02-409, Washington, DC.
Wallace, Geoffrey, and Rebecca M. Blank. 1999. "What Goes up Must Come Down: Explaining Recent Trends in Public Assistance Caseloads." In Economic Conditions and Welfare Reform, edited by Sheldon Danziger. Kalamazoo, MI: W.E. Upjohn Institute for Employment Research.
Ziliak, James P, Craig Gundersen, and David N. Figlio. 2003. “Food Stamp
Caseloads over the Business Cycle” Southern Economic Journal, 69(4): 903-19.
Ziliak, James P. 2013. “Who Uses SNAP, and When? The Role of Economy,
Policy, and Demographics” University of Kentucky Center for Poverty Research Working Paper. (Forthcoming, Five Decades of Food Stamps, 2015)
Ziliak, James P., David N. Figlio; Elizabeth E. Davis; Laura S. Connolly. 2000.
“Accounting for the Decline in AFDC Caseloads: Welfare Reform or the Economy?” The Journal of Human Resources 35(3):570-586.

32
Figure 1. SNAP Participants, Unemployment Rate, and Poverty Rate, 1980 – 2013
Source: USDA, Food and Nutrition Service (SNAP participants), U.S. Department of Commerce, U.S. Census Bureau (poverty rate), and U.S. Department of Labor Bureau of Labor Statistics (unemployment rate).
0
2
4
6
8
10
12
14
16
18
20
0
5
10
15
20
25
30
35
40
45
50
1980 1983 1986 1989 1992 1995 1998 2001 2004 2007 2010 2013
Une
mpl
oym
ent R
ate,
Pov
erty
Rat
e
Mil
lion
s of
peo
ple
SNAP participants Poverty rate Unemployment rate
33
Figure 2: Monthly SNAP Caseloads, Selected States, January 1990-December 2011
2
4
6
8
10
12
14
16
0.00
0.50
1.00
1.50
2.00
Janu
ary-
90Ja
nuar
y-91
Janu
ary-
92Ja
nuar
y-93
Janu
ary-
94Ja
nuar
y-95
Janu
ary-
96Ja
nuar
y-97
Janu
ary-
98Ja
nuar
y-99
Janu
ary-
00Ja
nuar
y-01
Janu
ary-
02Ja
nuar
y-03
Janu
ary-
04Ja
nuar
y-05
Janu
ary-
06Ja
nuar
y-07
Janu
ary-
08Ja
nuar
y-09
Janu
ary-
10Ja
nuar
y-11
Une
mpl
oym
ent R
ate
SN
AP
Cas
eloa
d, in
Mil
lion
s Michigan
I di id l
2
3
4
5
6
7
8
9
10
0.00
0.50
1.00
1.50
2.00
2.50
3.00
3.50
4.00
Janu
ary-
90Ja
nuar
y-91
Janu
ary-
92Ja
nuar
y-93
Janu
ary-
94Ja
nuar
y-95
Janu
ary-
96Ja
nuar
y-97
Janu
ary-
98Ja
nuar
y-99
Janu
ary-
00Ja
nuar
y-01
Janu
ary-
02Ja
nuar
y-03
Janu
ary-
04Ja
nuar
y-05
Janu
ary-
06Ja
nuar
y-07
Janu
ary-
08Ja
nuar
y-09
Janu
ary-
10Ja
nuar
y-11
Une
mpl
oym
ent R
ate
SN
AP
Cas
eloa
d, in
Mil
lion
s New York

34
Monthly Unemployment Rate Individual SNAP Caseload Household SNAP Caseload
2
4
6
8
10
12
14
16
0.00
0.50
1.00
1.50
2.00
Jan-
90Ja
n-91
Jan-
92Ja
n-93
Jan-
94Ja
n-95
Jan-
96Ja
n-97
Jan-
98Ja
n-99
Jan-
00Ja
n-01
Jan-
02Ja
n-03
Jan-
04Ja
n-05
Jan-
06Ja
n-07
Jan-
08Ja
n-09
Jan-
10Ja
n-11
Une
mpl
oym
ent R
ate
SN
AP
Cas
eloa
d, in
Mil
lion
s Pennsylvania
2
4
6
8
10
12
14
16
0.00
0.50
1.00
1.50
2.00
2.50
3.00
3.50
4.00
4.50
Jan-
90Ja
n-91
Jan-
92Ja
n-93
Jan-
94Ja
n-95
Jan-
96Ja
n-97
Jan-
98Ja
n-99
Jan-
00Ja
n-01
Jan-
02Ja
n-03
Jan-
04Ja
n-05
Jan-
06Ja
n-07
Jan-
08Ja
n-09
Jan-
10Ja
n-11
Une
mpl
oym
ent R
ate
SN
AP
Cas
eloa
d, in
Mil
lion
s Texas
35
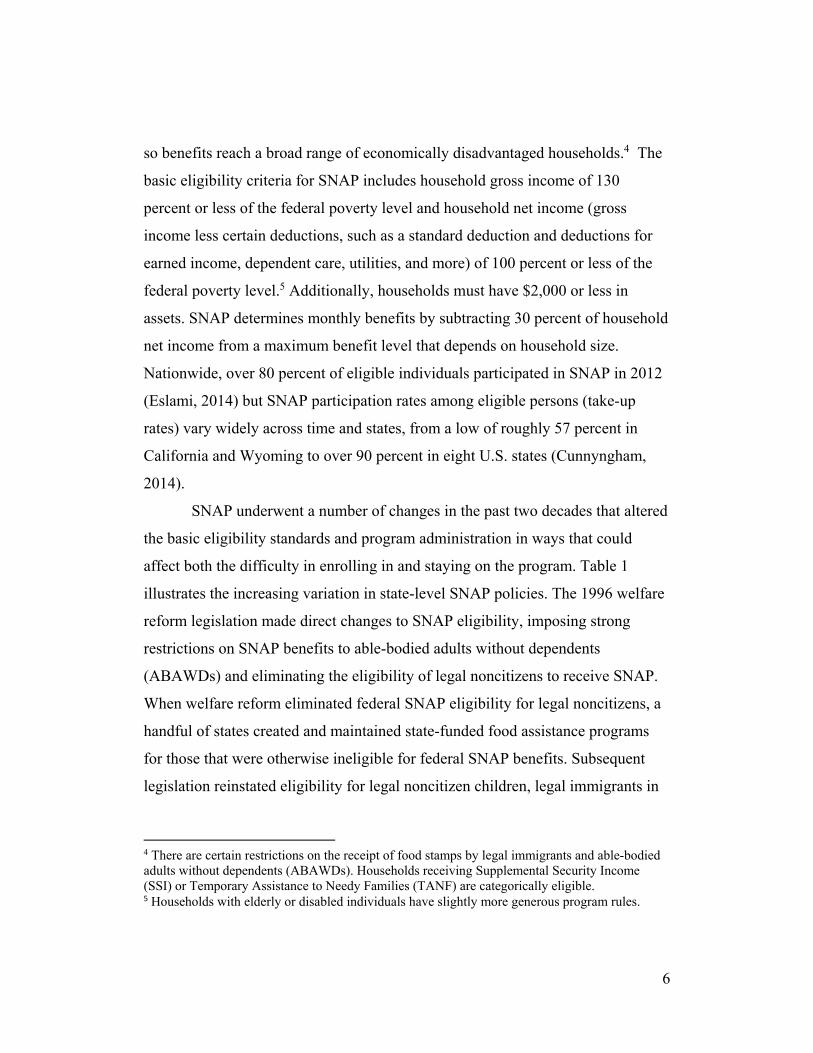
Table 1: Summary Statistics of Covariates, Selected Years
Policies Affecting Eligibility 1990 1993 1996 1999 2002 2005 2008 2011
Number of States Exempting at Least 1 but not all Vehicles from SNAP Asset Test 0 0 3 3 14 13 13 5
Number of States Exempting All Vehicles from SNAP Asset Test 0 0 0 0 21 29 35 46
Number of States with Transitional SNAP Benefits for TANF leavers 0 0 0 0 4 16 20 21
Number of States with Broad-Based Categorical Eligibility 0 0 0 0 9 11 18 41
Number of States with Eligibility Restrictions for Nonelderly Noncitizens 0 0 0 43 43 45 45 48
Policies Affecting Transaction Costs
Number of States with at least 25% of Working Households with Short Certification Periods (1-3 Months)
5 3 14 23 16 2 1 0
Mean State Proportion of Working Households with Short Recertification Periods (1-3 Months)
0.105 0.062 0.175 0.312 0.186 0.041 0.022 0.007
Number of States with Simplified Reporting 0 0 0 0 22 44 48 50
Number of States with Online Application Availability 0 0 0 0 2 8 18 33
Policies Affecting Stigma
Mean Proportion of State Benefits Issued via Electronic Benefits Transfer (EBT) 0.001 0.028 0.135 0.667 0.859 1.000 1.000 1.000
Number of States requiring Fingerprinting during Application 0 0 1 3 4 4 3 3
Policies Affecting Outreach
Number of States with a Federally Funded Radio or TV Ad 0 0 0 0 0 37 29 10
Other Low-Income Policies and Economic Conditions
Number of States with either AFDC Waiver or TANF Implemented 0 7 40 51 51 51 51 51
Mean Real State and Federal EITC, in Thousands (2010 Dollars) 1.553 2.145 4.449 5.104 5.123 5.078 5.097 5.256
Mean State Unemployment Rate 0.054 0.063 0.051 0.041 0.054 0.049 0.053 0.081
Caseload Variables
Household Caseload per Total Households 0.081 0.107 0.099 0.074 0.080 0.102 0.112 0.178
Individual Caseload per Capita 0.080 0.100 0.090 0.066 0.072 0.091 0.098 0.146
Sources: Bureau of Labor Statistics, USDA Food and Nutrition Service. US Health and Human Services. http://aspe.hhs.gov/hsp/Waiver-Policies99/Table_A.PDF http://www.acf.hhs.gov/programs/ofa/annualreport6/chapter12/chap12.htm#4, and University of Kentucky Center for Poverty Research.
36
Table 2. Estimates of the Long-Run Determinant of State Policy Options on Households Per Capita Receiving Food Stamps Static Dynamic 12 lags 24 lags 12 lags 24 lags Long-run effect of: (1) (2) (3) (4) Policies Affecting Eligibility Exempt At Least One But Not All Vehicles from SNAP Asset Test
-0.015 0.022 -0.024 0.059 p=0.024 p<0.001 p=0.020 p=0.001
Exempts All Vehicles from SNAP Asset Test
-0.009 0.020 -0.012 0.067 p=0.182 p=0.021 p=0.557 p=0.031
Transitional SNAP Benefits to TANF Leavers
0.027 0.043 0.042 0.064 p=0.029 p=0.127 p=0.011 p=0.059
Broad-based Categorical Eligibility 0.059 0.054 0.095 0.059 p<0.001 p<0.001 p<0.001 p<0.001
Eligibility Restrictions for Non-elderly Noncitizens
-0.098 -0.160 -0.156 -0.240 p<0.001 p<0.001 p<0.001 p<0.001
Policies Affecting Transaction Costs Proportion of Working Households with Short (1-3 Month) Certification Period
-0.1254 -0.133 -0.164 -0.125 P<0.001 p<0.001 p=0.005 p=0.002
Simplified Reporting Policy 0.027 0.018 0.049 0.052 p=0.028 p<0.001 p=0.010 p<0.001
State Online Application Availability 0.012 0.023 0.019 0.026 p=0.330 p=0.042 p=0.528 p=0.233 Policies Affecting Stigma Proportion of State Benefits Issued via EBT
-0.028 -0.006 0.012 0.041 p=0.250 p=0.002 p=0.241 p<0.001
Fingerprinting Requirement -0.064 -0.084 -0.075 -0.039 p=0.007 p=0.007 p=0.026 p=0.030
Policies Affecting Outreach Federally Funded TV and Radio Ad Campaign
-0.005 -0.026 0.026 -0.024 p=0.021 p=0.011 p=0.055 p=0.081
Other Low-Income Policies and Economic Conditions Implementation of AFDC Waiver or TANF
-0.042 -0.048 -0.055 -0.061 p<0.001 p<0.001 p=0.003 p<0.001
Real Maximum State and Federal EITC Payout($1,000)
0.062 -0.260 0.021 -0.481 p<0.001 p<0.001 p=0.027 p=0.021
State Unemployment Rate 4.506 5.789 7.311 10.074 p<0.001 p<0.001 p<0.001 p<0.001
Lagged Dependent Variable - - -0.392 p<0.001
-0.350 p<0.001
Note: All variables are first differenced and estimates use Driscoll-Kraay standard errors. Reported estimates are the long-run effects of each covariate. The long-run effects for each explanatory variable are given by
L
j1
for static models and
L
L
j
1
1
1
for dynamic models. Note that θ is the coefficient estimate of the lagged caseload. Reported p-values represent the statistical significance of the F-test on all the lagged policy coefficients. See text for further details.
37
Table 3. Estimates of the Long-Run Determinant of State Policy Options on Individuals per Capita Receiving Food Stamps Static Dynamic Long-run effect of: 12 lags 24 lags 12 lags 24 lags (1) (2) (3) (4) Policies Affecting Eligibility Exempt At Least One But Not All Vehicles from SNAP Asset Test
0.003 0.038 0.008 0.091 p=0.077 p=0.037 p=0.249 p=0.029
Exempts All Vehicles from SNAP Asset Test
0.011 0.032 0.018 0.084 p=0.227 p=0.032 p=0.380 p=0.002
Transitional SNAP Benefits to TANF Leavers
0.033 0.046 0.052 0.064 p<0.001 p=0.001 p=0.007 p=0.048
Broad-based Categorical Eligibility
0.062 0.064 0.122 0.105 p<0.001 p<0.001 p<0.001 p=0.001
Eligibility Restrictions for Non-elderly Noncitizens
-0.086 -0.148 -0.154 -0.248 p<0.001 p<0.001 p<0.001 p<0.001
Policies Affecting Transaction Costs Proportion of Working Households with Short (1-3 Month) Certification Period
-0.145 -0.152 -0.235 -0.179 p<0.001 p<0.001 p<0.001 p<0.001
Simplified Reporting Policy
0.027 0.021 0.058 0.068 p<0.001 p<0.001 p<0.001 p<0.001
State Online Application Availability
0.009 0.022 0.016 0.026 p=0.522 p=0.019 p=0.566 p=0.125
Policies Affecting Stigma Proportion of State Benefits Issued via EBT
-0.043 -0.012 -0.013 0.019 p=0.132 p=0.028 p=0.366 p=0.007
Fingerprinting Requirement
-0.068 -0.104 -0.105 -0.100 p<0.001 p=0.001 p=0.013 p=0.037
Policies Affecting Outreach Federally Funded TV and Radio Ad Campaign
-0.001 0.005 0.034 0.015 p=0.019 p=0.026 p=0.258 p=0.648
Other Low-Income Policies and Economic Conditions Implementation of AFDC Waiver or TANF -0.049 -0.054 -0.072 -0.081
p=0.002 p<0.001 p<0.001 p<0.001 Real Maximum State and Federal EITC Payout($1,000)
0.039 -0.311 -0.025 -0.658 p<0.001 p<0.001 p=0.045 p=0.059
State Unemployment Rate 4.531 5.751 8.556 11.396 p<0.001 p<0.001 p<0.001 p<0.001
Lagged Dependent Variable - - -0.664 p<0.001
-0.565 p<0.001
Note: All variables are first differenced and estimates use Driscoll-Kraay standard errors. Reported estimates are the long-run effects of each covariate. The long-run effects for each explanatory variable are given by
L
j1
for static models and
L
L
j
1
1
1
for dynamic models. Note that θ is the coefficient estimate of the lagged caseload. Reported p-values represent the statistical significance of the F-test on all the lagged policy coefficients. See text for further details.
38
Table 4. Estimates of the Long-Run Effects of Restrictions on Eligibility for Nonelderly Noncitizens by Size of Potentially Eligible Population No Lagged
Dependent Variable With Lagged
Dependent Variable 12 lags 24 lags 12 lags 24 lags
Household Caseload
Ineligibility for Noncitizens-0.092
p<0.001 -0.149
p<0.001 -0.146
p<0.001 -0.222
p<0.001
Ineligibility for Noncitizens*Large Population not Native-born Citizen
-0.052 p<0.001
-0.075 p<0.001
-0.084 p<0.001
-0.132 p<0.001
Individual Caseload
Ineligibility for Noncitizens-0.078
p<0.001 -0.137
p<0.001 -0.142
p<0.001 -0.232
p<0.001
Ineligibility for Noncitizens*Large Population not Native-born Citizen
-0.064 p<0.001
-0.075 p<0.001
-0.105 p<0.001
-0.119 p<0.001
Note: States with a large population of citizens that are not native-born are determined by the states with the largest absolute size of the population that are estimated to be native-born citizens from the IPUMS-CPS: California, New York, Florida, Texas, New Jersey, and Illinois. See text for further details. All Estimates controlling for all other state policies from Tables 2 and 3. Reported p-values represent the statistical significance of the F-test on the coefficients.
39
Table 5. Simulation Results of the Long-Run Determinants of State Policy Options on Household Receiving Food Stamps
Percent of Predicted Change Explained by:
Time Period
Actual % change in household caseload
Predicted Change with All
Observable Factors
All Observable
Factors
SNAP Policies
All
SNAP
Policies Affecting Eligibility
SNAP Policies
Affecting Transaction Costs and
Stigma Welfare Reform EITC
Economic and
Seasonal Factors
03/93-07/00 -50.0% -40.4% 100% 38.1% 36.5% 1.4% 10.0% 21.7% 60.0% (8.1 ) (0.0) (16.6 ) (13.6 ) (5.7 ) (6.9 ) (14.1 ) (17.8 ) 07/00-12/11 96.6% 87.0% 100% 21.2% 12.1% 9.2% 0.0% 1.2% 39.0% (8.9 ) (0.0 ) (5.1) (3.1) (3.2 ) - (1.0 ) (5.7) 12/07-12/11 56.6% 50.0% 100% 8.7% 6.4% 1.9% 0.0% -0.8% 61.8% (3.6 ) (0.0 ) (3.3) (2.1) (2.2) - (1.1 ) (6.7 )
Notes: Author’s calculations based on column 4 of Table 2. We generate standard errors (in parentheses) from a bootstrapping method described in the text.
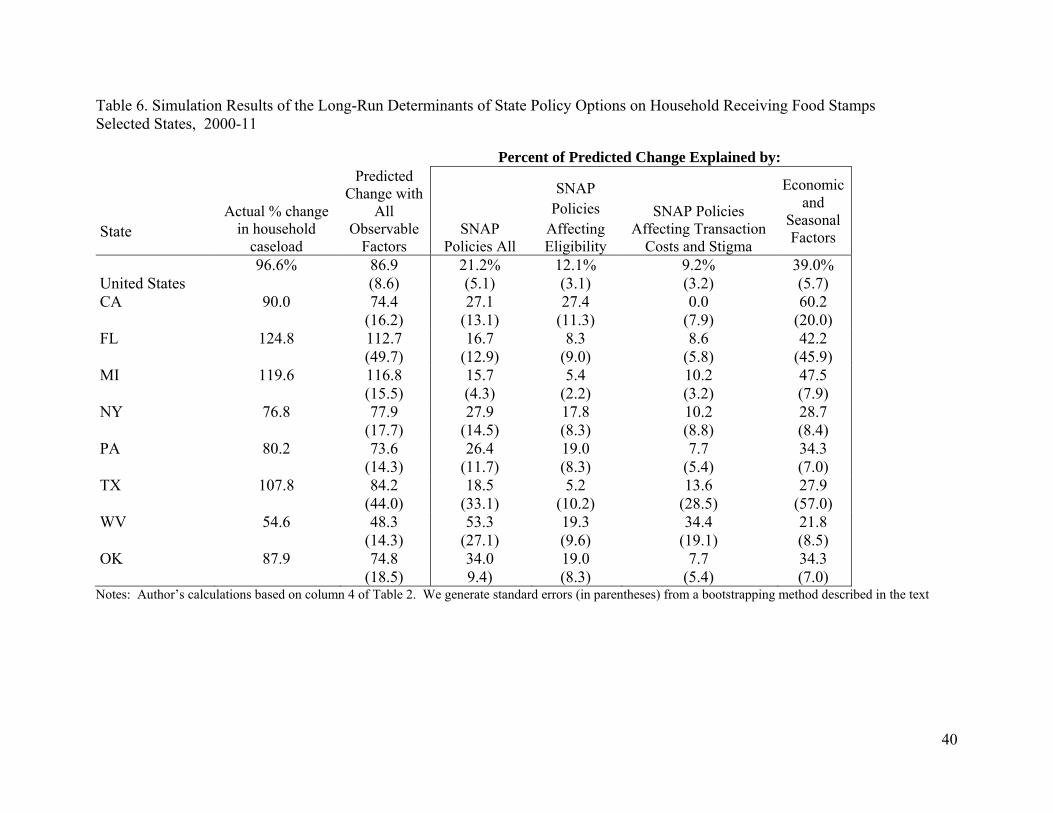
40
Table 6. Simulation Results of the Long-Run Determinants of State Policy Options on Household Receiving Food Stamps Selected States, 2000-11 Percent of Predicted Change Explained by: State
Actual % change in household
caseload
Predicted Change with
All Observable
FactorsSNAP
Policies All
SNAP Policies
Affecting Eligibility
SNAP Policies Affecting Transaction
Costs and Stigma
Economic and
Seasonal Factors
United States 96.6%
86.9 (8.6)
21.2% (5.1)
12.1% (3.1)
9.2% (3.2)
39.0% (5.7)
CA
90.0
74.4 (16.2)
27.1 (13.1)
27.4 (11.3)
0.0 (7.9)
60.2 (20.0)
FL
124.8
112.7 (49.7)
16.7 (12.9)
8.3 (9.0)
8.6 (5.8)
42.2 (45.9)
MI
119.6
116.8 (15.5)
15.7 (4.3)
5.4 (2.2)
10.2 (3.2)
47.5 (7.9)
NY
76.8
77.9 (17.7)
27.9 (14.5)
17.8 (8.3)
10.2 (8.8)
28.7 (8.4)
PA
80.2
73.6 (14.3)
26.4 (11.7)
19.0 (8.3)
7.7 (5.4)
34.3 (7.0)
TX
107.8
84.2 (44.0)
18.5 (33.1)
5.2 (10.2)
13.6 (28.5)
27.9 (57.0)
WV
54.6
48.3 (14.3)
53.3 (27.1)
19.3 (9.6)
34.4 (19.1)
21.8 (8.5)
OK
87.9
74.8 (18.5)
34.0 9.4)
19.0 (8.3)
7.7 (5.4)
34.3 (7.0)
Notes: Author’s calculations based on column 4 of Table 2. We generate standard errors (in parentheses) from a bootstrapping method described in the text
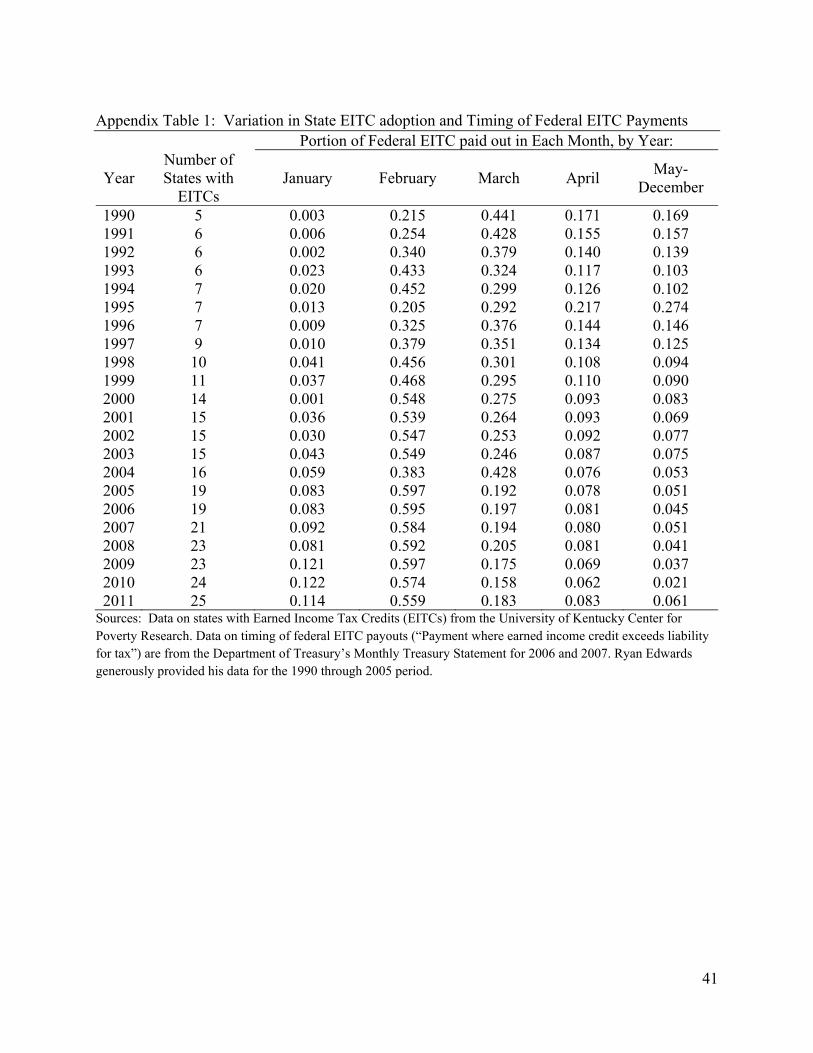
41
Appendix Table 1: Variation in State EITC adoption and Timing of Federal EITC Payments
Portion of Federal EITC paid out in Each Month, by Year:
Year Number of States with
EITCs January February March April
May-December
1990 5 0.003 0.215 0.441 0.171 0.169 1991 6 0.006 0.254 0.428 0.155 0.157 1992 6 0.002 0.340 0.379 0.140 0.139 1993 6 0.023 0.433 0.324 0.117 0.103 1994 7 0.020 0.452 0.299 0.126 0.102 1995 7 0.013 0.205 0.292 0.217 0.274 1996 7 0.009 0.325 0.376 0.144 0.146 1997 9 0.010 0.379 0.351 0.134 0.125 1998 10 0.041 0.456 0.301 0.108 0.094 1999 11 0.037 0.468 0.295 0.110 0.090 2000 14 0.001 0.548 0.275 0.093 0.083 2001 15 0.036 0.539 0.264 0.093 0.069 2002 15 0.030 0.547 0.253 0.092 0.077 2003 15 0.043 0.549 0.246 0.087 0.075 2004 16 0.059 0.383 0.428 0.076 0.053 2005 19 0.083 0.597 0.192 0.078 0.051 2006 19 0.083 0.595 0.197 0.081 0.045 2007 21 0.092 0.584 0.194 0.080 0.051 2008 23 0.081 0.592 0.205 0.081 0.041 2009 23 0.121 0.597 0.175 0.069 0.037 2010 24 0.122 0.574 0.158 0.062 0.021 2011 25 0.114 0.559 0.183 0.083 0.061
Sources: Data on states with Earned Income Tax Credits (EITCs) from the University of Kentucky Center for Poverty Research. Data on timing of federal EITC payouts (“Payment where earned income credit exceeds liability for tax”) are from the Department of Treasury’s Monthly Treasury Statement for 2006 and 2007. Ryan Edwards generously provided his data for the 1990 through 2005 period.