Embed Size (px)
DESCRIPTION
the Dynamic Land Ecosystem Model (DLEM) and Its Applications in north America. Ming-Liang Liu ( [email protected] ) Department of Civil and Environmental Engineering, WSU, Pullman, WA Prior Institute: International Center for Climate and Global Change Research - PowerPoint PPT Presentation
Citation preview

1
THE DYNAMIC LAND ECOSYSTEM MODEL (DLEM) AND ITS APPLICATIONS IN NORTH AMERICA
Ming-Liang Liu ([email protected])
Department of Civil and Environmental Engineering, WSU, Pullman, WA
Prior Institute:
International Center for Climate and Global Change Research
Ecosystem Dynamics and Global Ecology Laboratory
Auburn University, Auburn, AL
October 14, 2011
2
ACKNOWLEDGEMENTS• Hanqin TIAN
• Chi ZHANG
• Guangsheng CHEN
• Chaoquan LU
• Wei REN
• Xiaofeng XU
• Jia YANG
• Supported by NASA IDS, NASA LCLUC, DOE NICCR
3
OUTLINE
• Model Introduction – Dynamic Land Ecosystem Model (DLEM)
• Recent Improvements
• Validations
• Applications
• Discussions
4
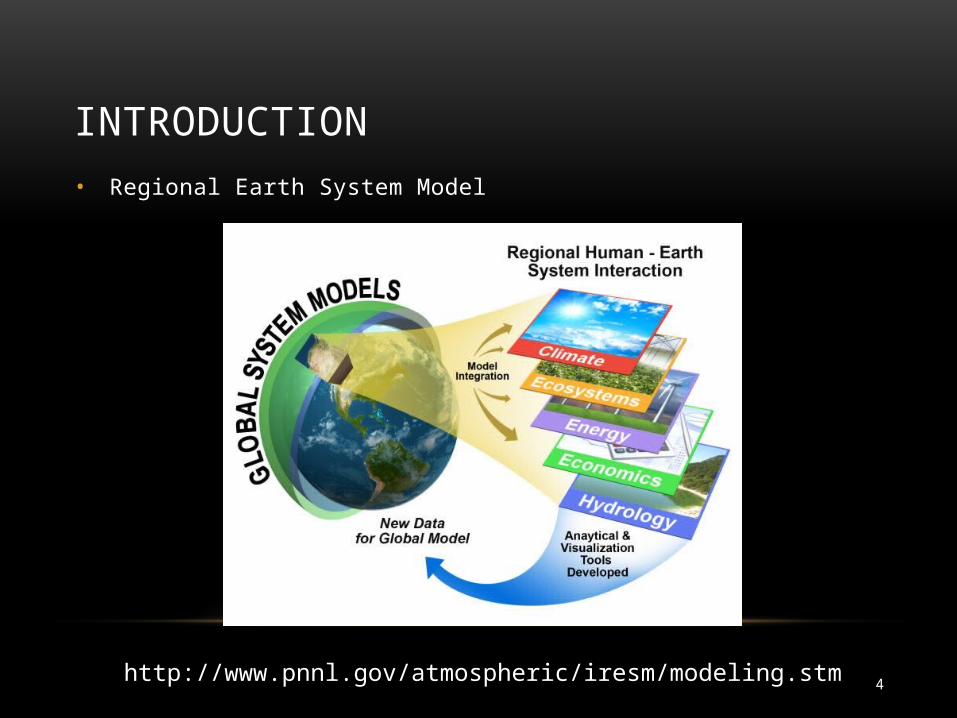
INTRODUCTION• Regional Earth System Model
http://www.pnnl.gov/atmospheric/iresm/modeling.stm
5
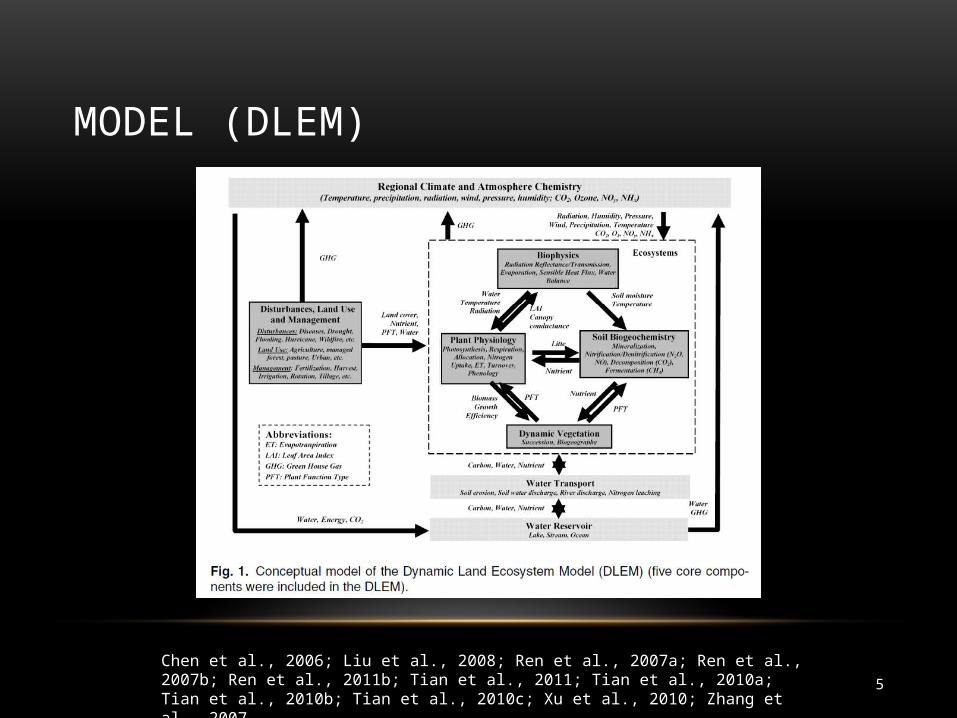
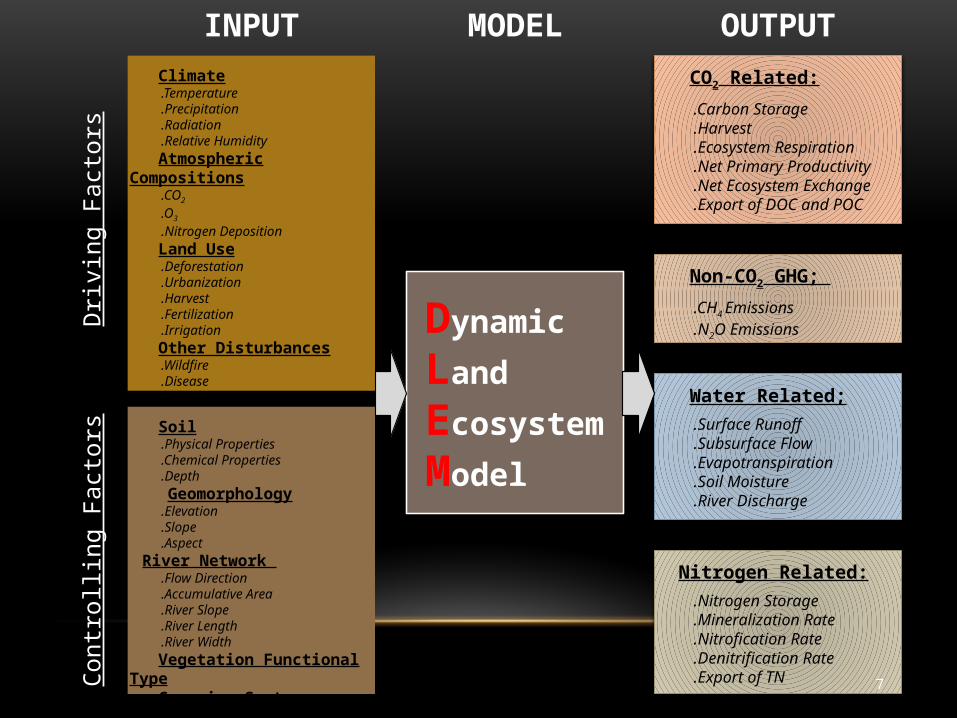
MODEL (DLEM)
Chen et al., 2006; Liu et al., 2008; Ren et al., 2007a; Ren et al., 2007b; Ren et al., 2011b; Tian et al., 2011; Tian et al., 2010a; Tian et al., 2010b; Tian et al., 2010c; Xu et al., 2010; Zhang et al., 2007
6
7
Dynamic
Land
Ecosystem
Model
Climate .Temperature .Precipitation .Radiation .Relative Humidity
Atmospheric Compositions .CO2
.O3
.Nitrogen Deposition
Land Use .Deforestation .Urbanization .Harvest .Fertilization .Irrigation
Other Disturbances .Wildfire .Disease .Climate Extremes
Dri
vin
g F
act
ors
Soil .Physical Properties .Chemical Properties .Depth
Geomorphology .Elevation .Slope .Aspect
River Network .Flow Direction .Accumulative Area .River Slope .River Length .River Width
Vegetation Functional Type Cropping System
Contr
olli
ng
Fact
ors
CO2 Related:
.Carbon Storage .Harvest .Ecosystem Respiration .Net Primary Productivity .Net Ecosystem Exchange .Export of DOC and POC
Nitrogen Related:
.Nitrogen Storage .Mineralization Rate .Nitrofication Rate .Denitrification Rate .Export of TN
Water Related;
.Surface Runoff .Subsurface Flow .Evapotranspiration .Soil Moisture .River Discharge
Non-CO2 GHG;
.CH4 Emissions .N2O Emissions
INPUT MODEL OUTPUT
8
IMPROVEMENTS
• From single land cover to cohort structure
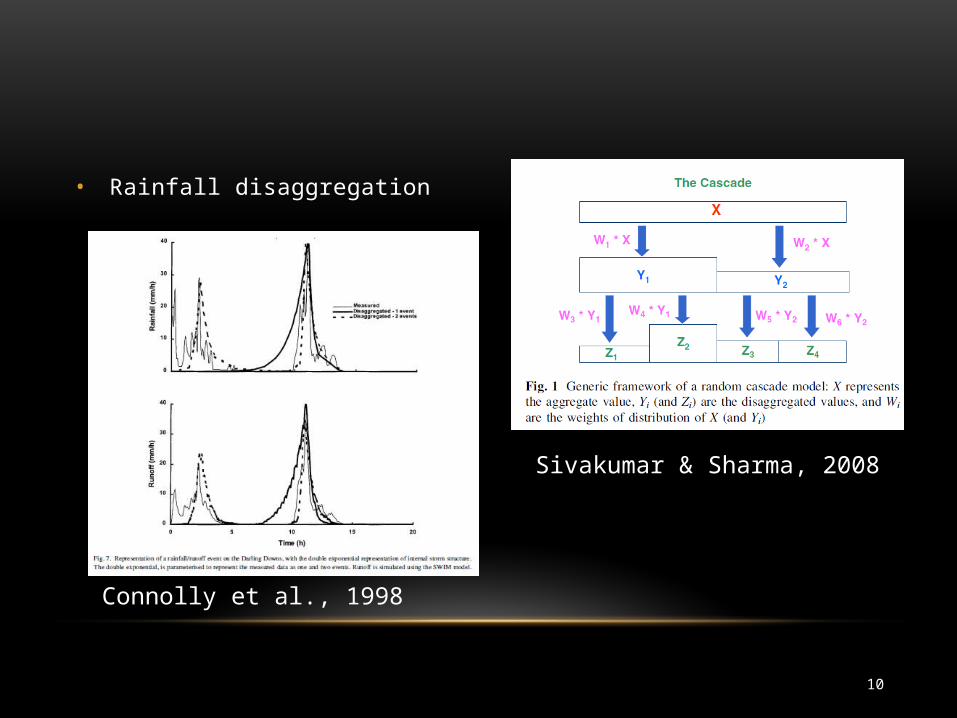
• Rainfall disaggregation
• Multi-soil layer, TOPMOD, Ground water - CLM methods
• River routine
9
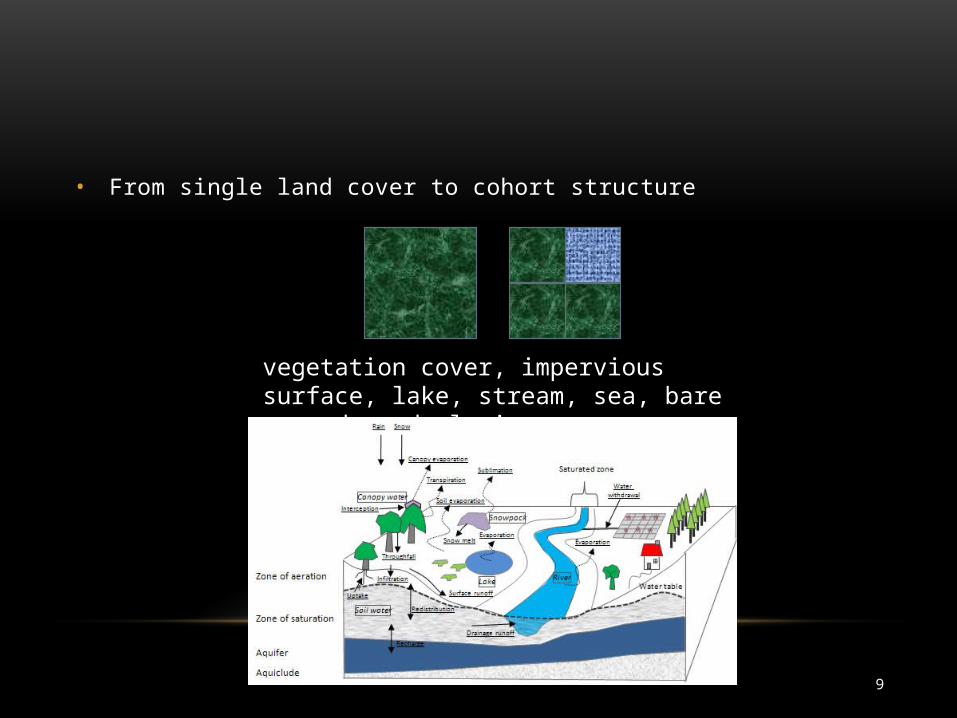
• From single land cover to cohort structure
vegetation cover, impervious surface, lake, stream, sea, bare ground, and glacier
10
• Rainfall disaggregation
Sivakumar & Sharma, 2008
Connolly et al., 1998
11
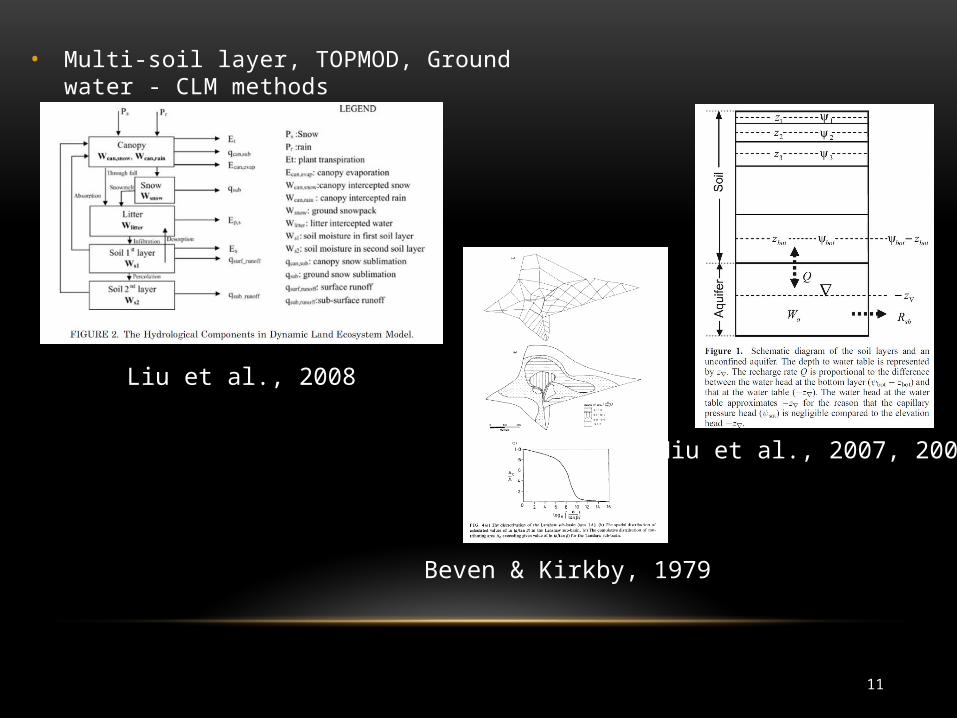
• Multi-soil layer, TOPMOD, Ground water - CLM methods
Liu et al., 2008
Niu et al., 2007, 2009
Beven & Kirkby, 1979
12
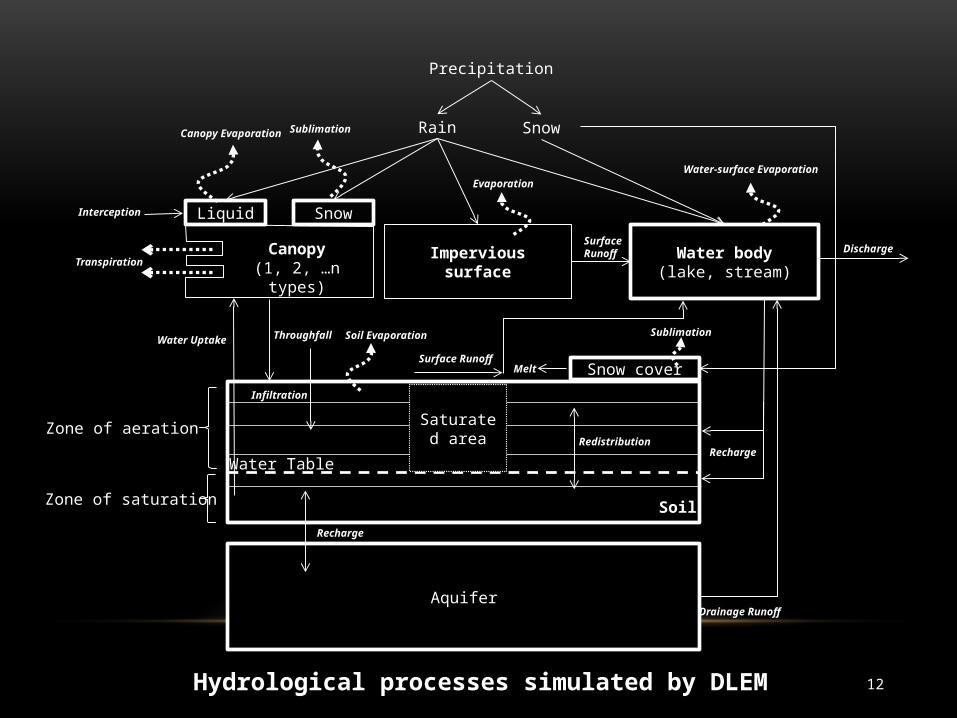
Rain
Precipitation
Snow
Liquid Snow
Impervious surfaceWater body
(lake, stream)
Aquifer
Snow cover
Soil
ThroughfallWater Uptake
Surface Runoff
Interception
Canopy(1, 2, …n types)Transpiration
Canopy Evaporation Sublimation
Sublimation
Water-surface Evaporation
Infiltration
Melt
Redistribution
Recharge
Drainage Runoff
Surface Runoff
Water Table
Zone of aeration
Zone of saturation
Soil Evaporation
Discharge
Recharge
Evaporation
Saturated area
Hydrological processes simulated by DLEM
13
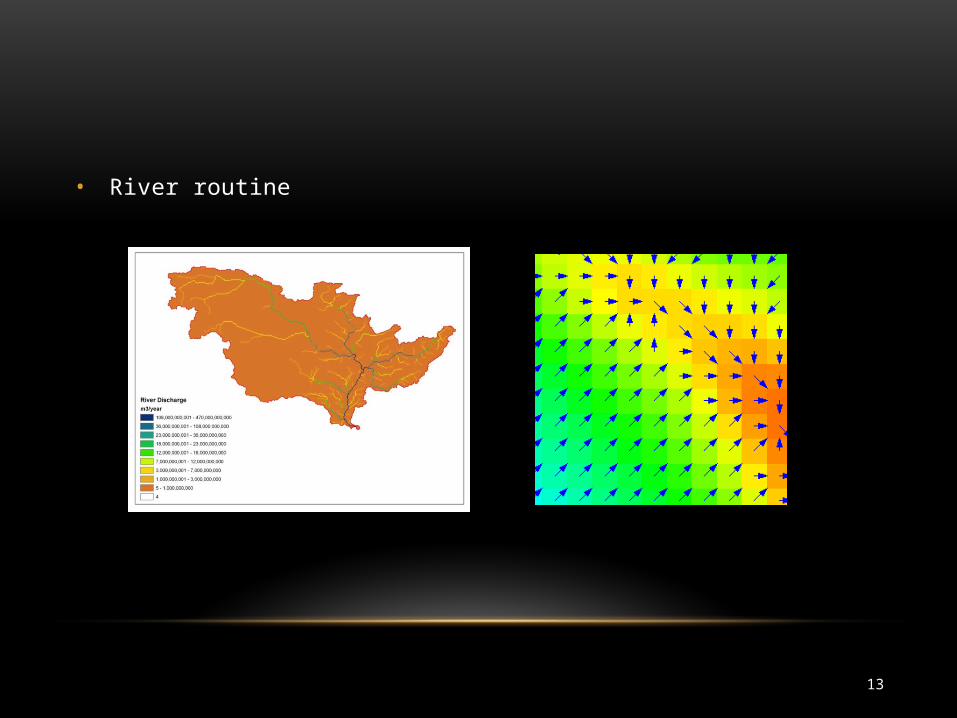
• River routine
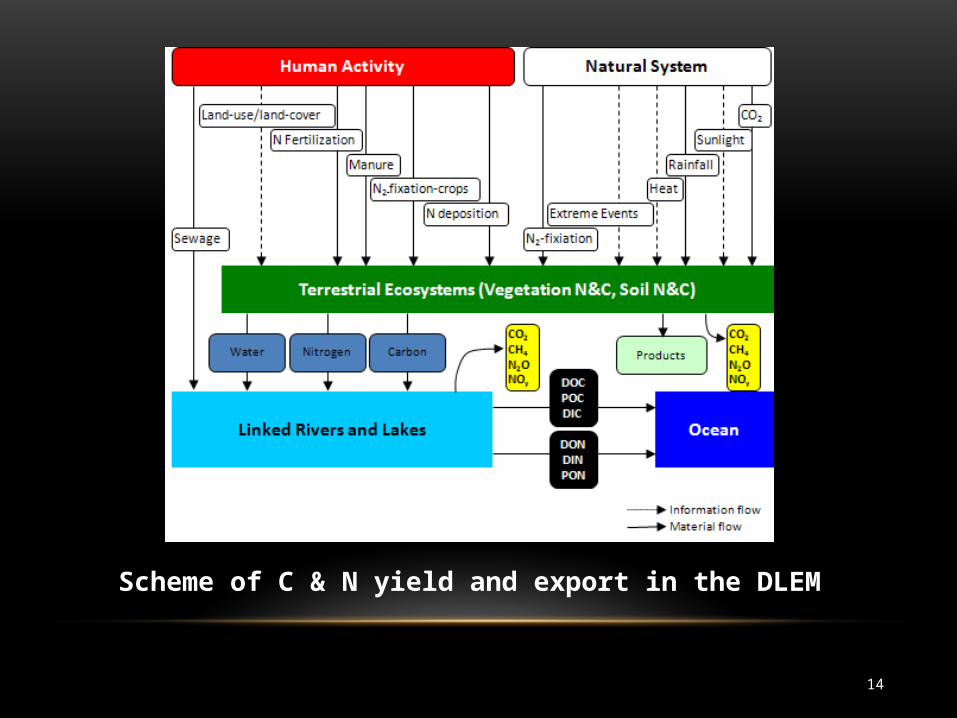
14
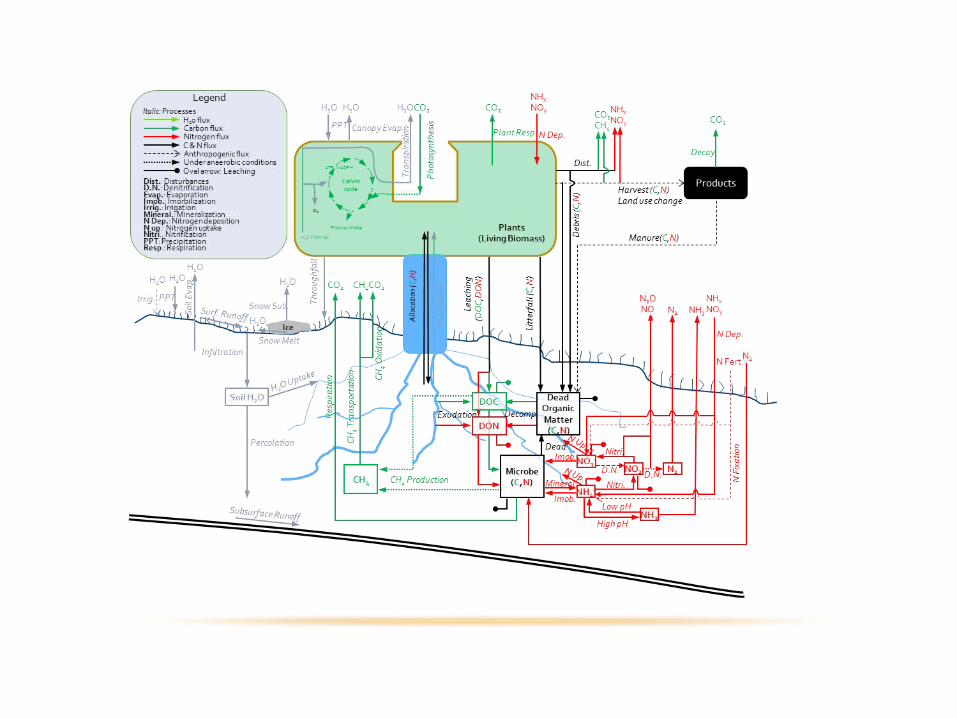
Scheme of C & N yield and export in the DLEM
15
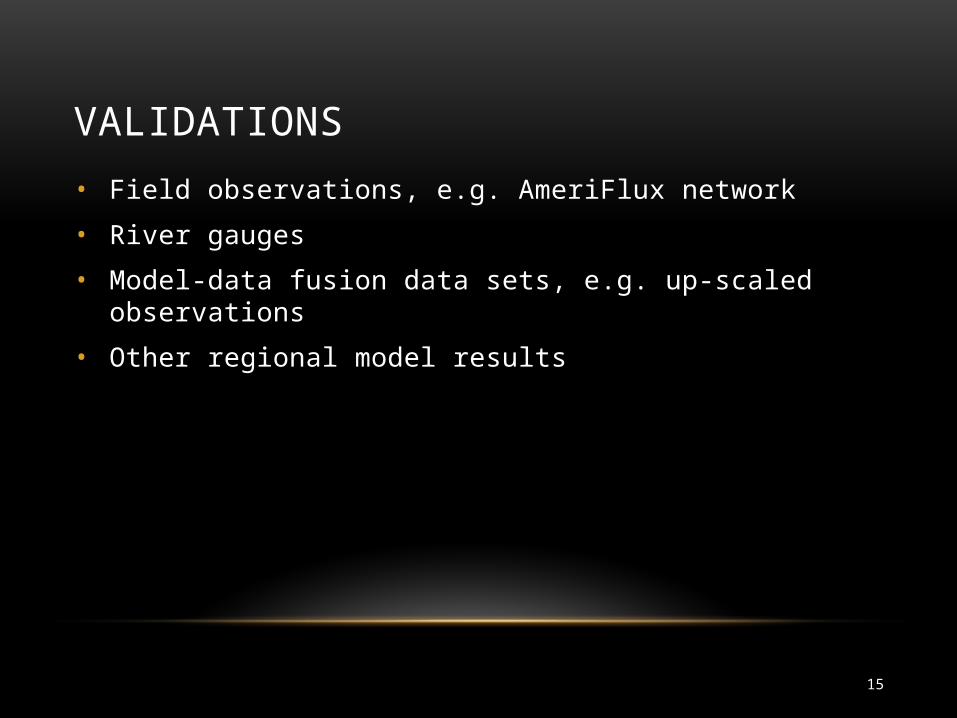
VALIDATIONS
• Field observations, e.g. AmeriFlux network
• River gauges
• Model-data fusion data sets, e.g. up-scaled observations
• Other regional model results
16
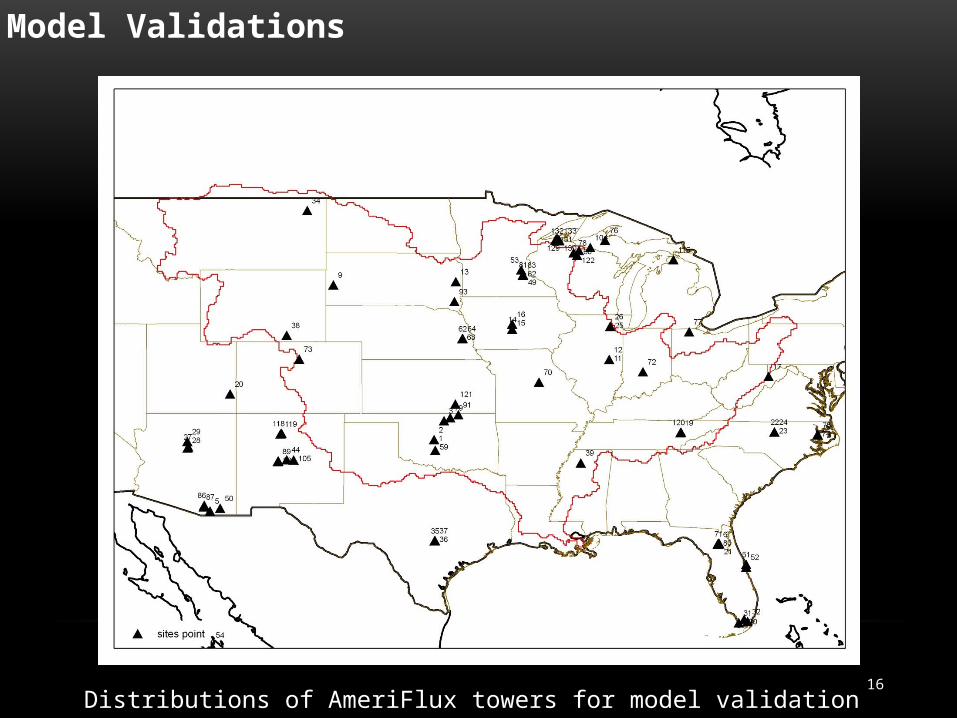
Model Validations
Distributions of AmeriFlux towers for model validation
17
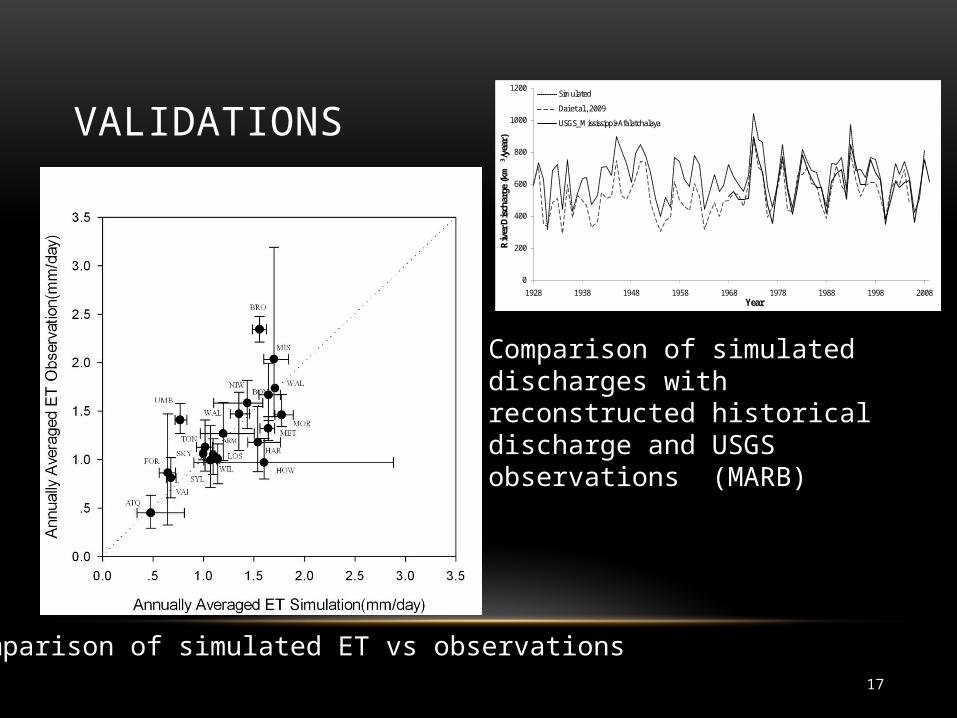
VALIDATIONS
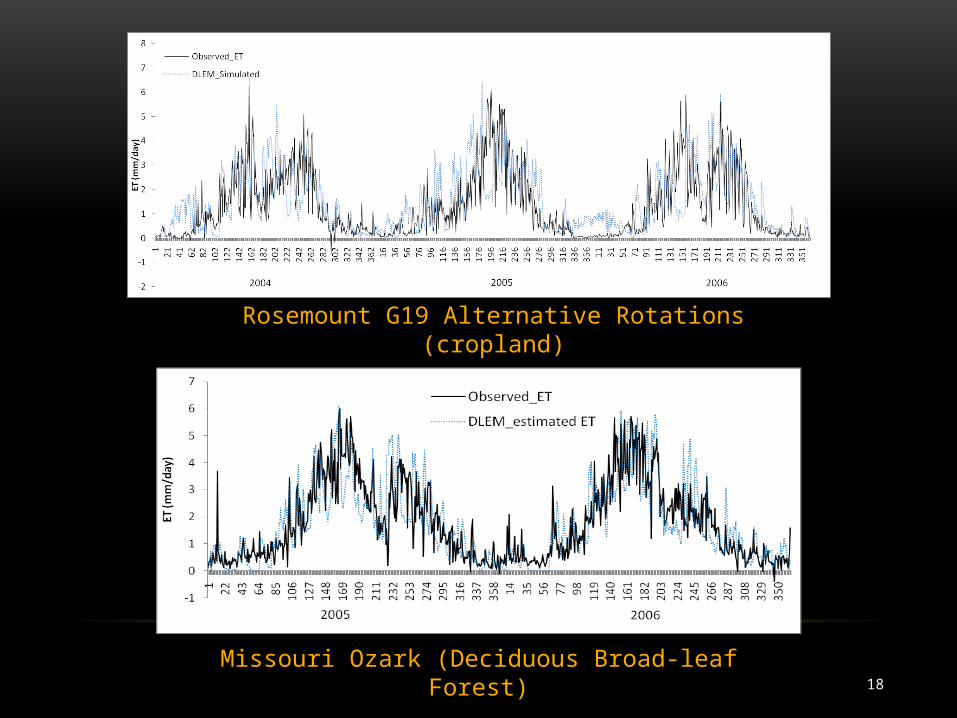
The comparison of simulated ET vs observations
0
200
400
600
800
1000
1200
1928 1938 1948 1958 1968 1978 1988 1998 2008
Riv
er D
isch
arge
(km
3 /ye
ar)
Year
Simulated
Dai et al., 2009
USGS_Mississippi+Afalatchalaya
Comparison of simulated discharges with reconstructed historical discharge and USGS observations (MARB)
18
Rosemount G19 Alternative Rotations (cropland)
Missouri Ozark (Deciduous Broad-leaf Forest)
19
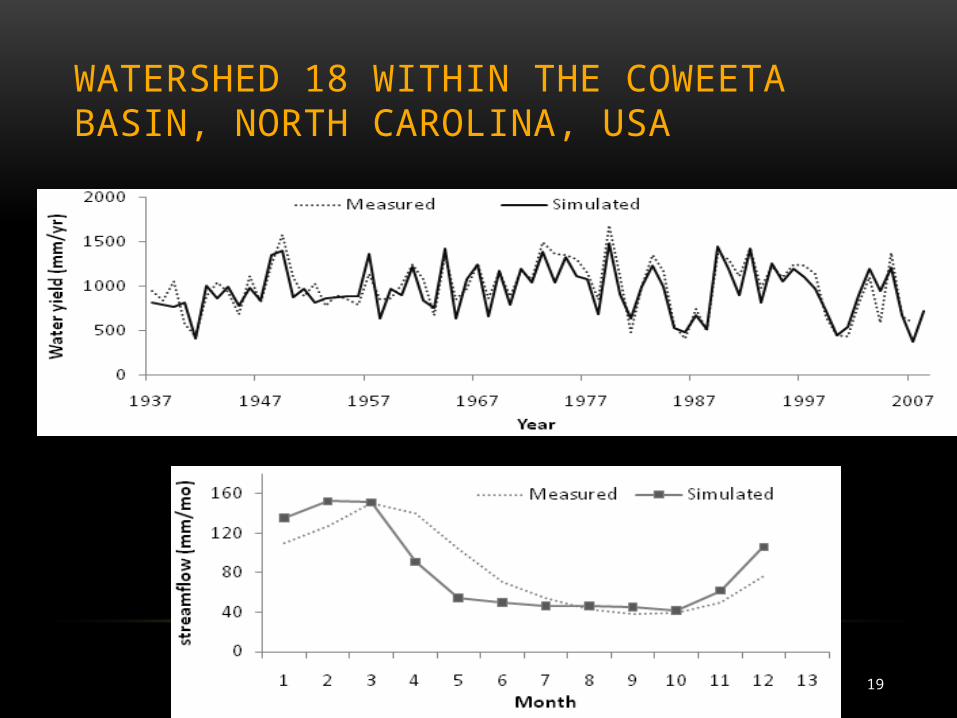
WATERSHED 18 WITHIN THE COWEETA BASIN, NORTH CAROLINA, USA
20
0
500
1000
1500
2000
2500
3000
3500
4000
4500
2003 2004 2005 2006 2007 2008
Observations
Simulated
0
1000
2000
3000
4000
5000
6000
7000
8000
2003 2004 2005 2006 2007 2008
Observations
Simulated
0
2000
4000
6000
8000
10000
12000
2003 2004 2005 2006 2007 2008
Observations
Simulated
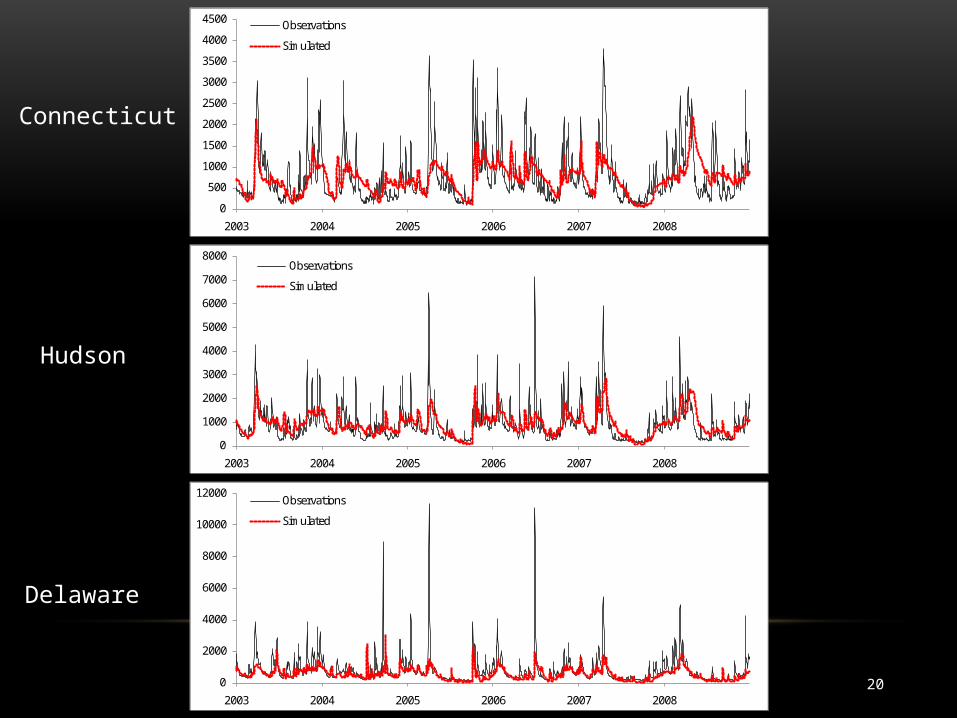
Connecticut
Hudson
Delaware
21
0
5000
10000
15000
20000
25000
30000
2003 2004 2005 2006 2007 2008
Observations
Simulated
0
1000
2000
3000
4000
5000
6000
2003 2004 2005 2006 2007 2008
Observations
Simulated
0
1000
2000
3000
4000
5000
6000
2003 2004 2005 2006 2007 2008
Observations
Simulated
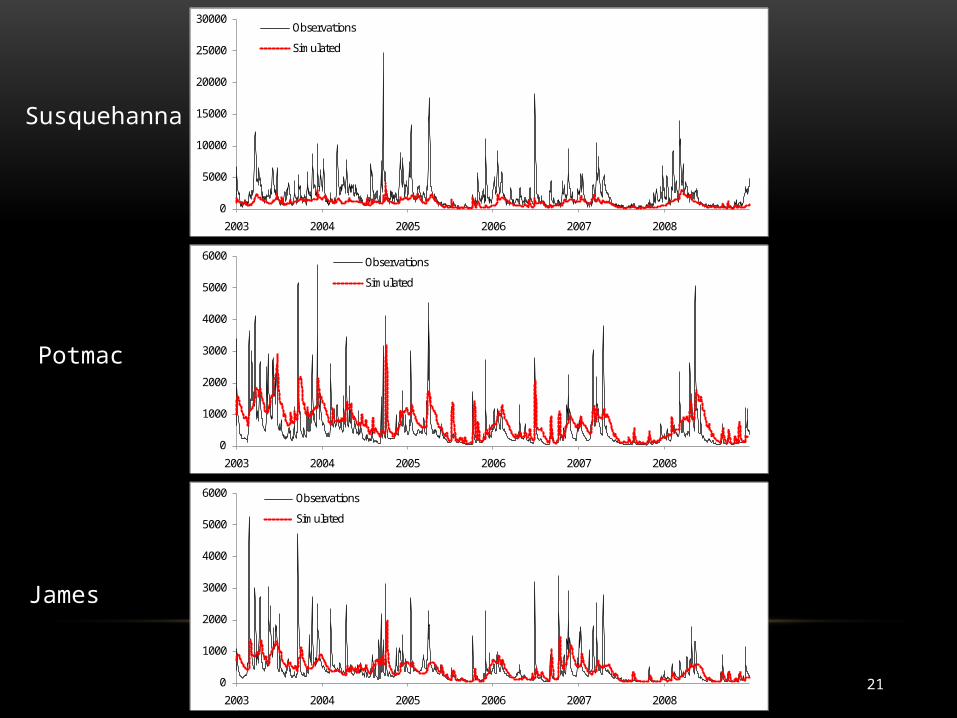
Susquehanna
Potmac
James
22
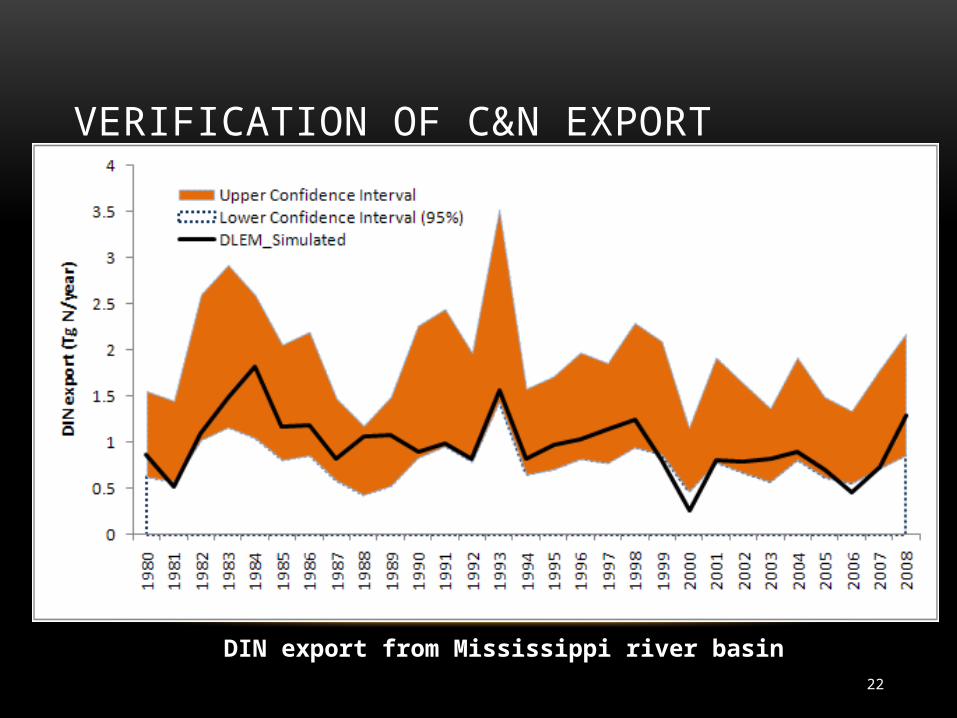
VERIFICATION OF C&N EXPORT
DIN export from Mississippi river basin
23
0
0.5
1
1.5
2
2.5
3
3.5
4
1/27
/198
1
2/3/
1981
2/10
/198
1
2/17
/198
1
2/24
/198
1
3/3/
1981
3/10
/198
1
3/17
/198
1
3/24
/198
1
3/31
/198
1
4/7/
1981
4/14
/198
1
4/21
/198
1
4/28
/198
1
5/5/
1981
5/12
/198
1
5/19
/198
1
5/26
/198
1
Tota
l Nitr
ogen
Con
cent
ratio
n (m
gN/L
)
Date
Simulated TN (mg/L)
obs_TN
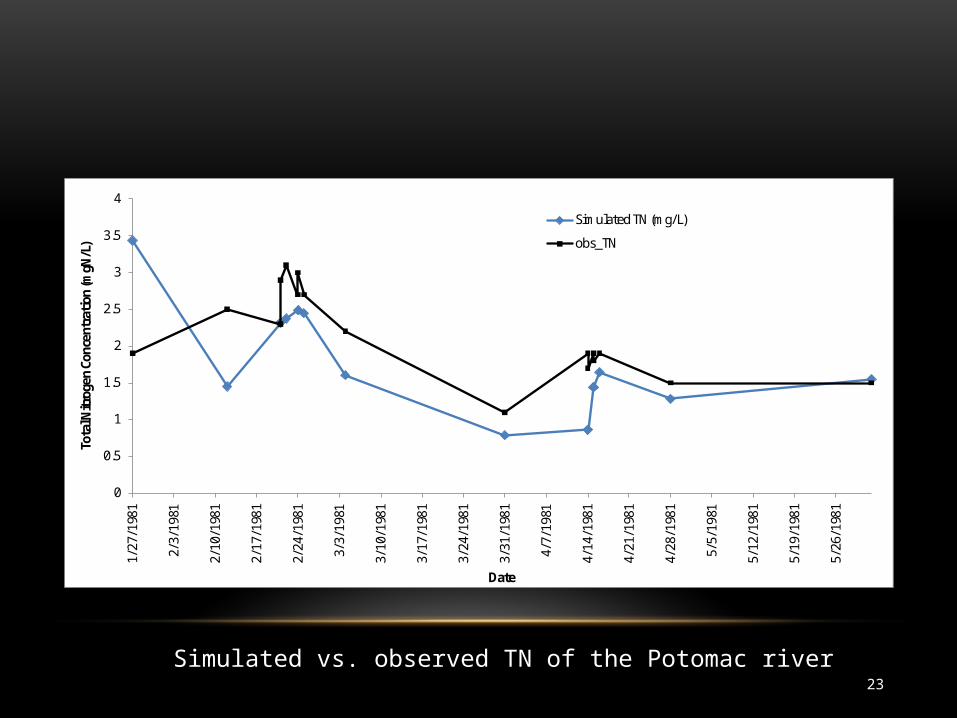
Simulated vs. observed TN of the Potomac river
24
APPLICATIONS
• The Gulf of Mexico
• The Eastern Coast
25
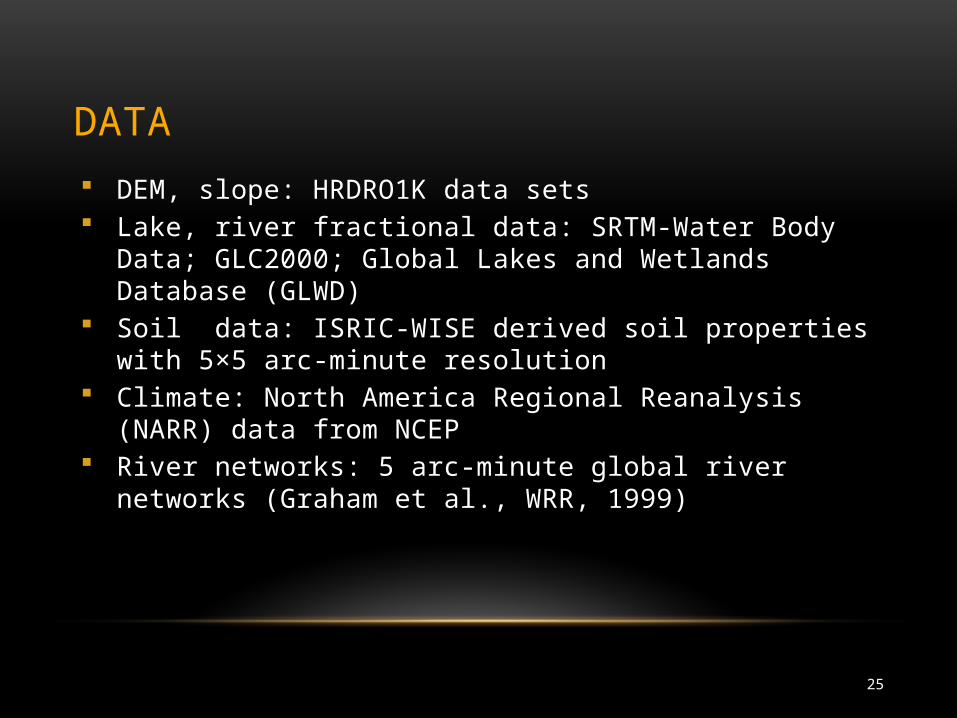
DATA DEM, slope: HRDRO1K data sets Lake, river fractional data: SRTM-Water Body Data; GLC2000; Global Lakes
and Wetlands Database (GLWD) Soil data: ISRIC-WISE derived soil properties with 5×5 arc-minute
resolution Climate: North America Regional Reanalysis (NARR) data from NCEP River networks: 5 arc-minute global river networks (Graham et al., WRR,
1999)
26
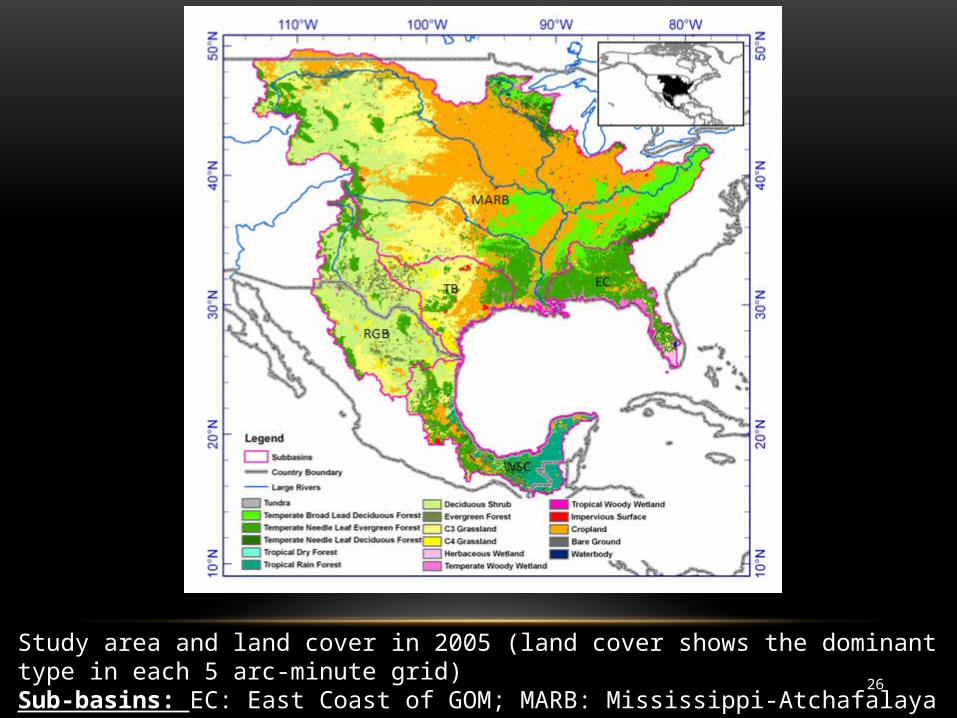
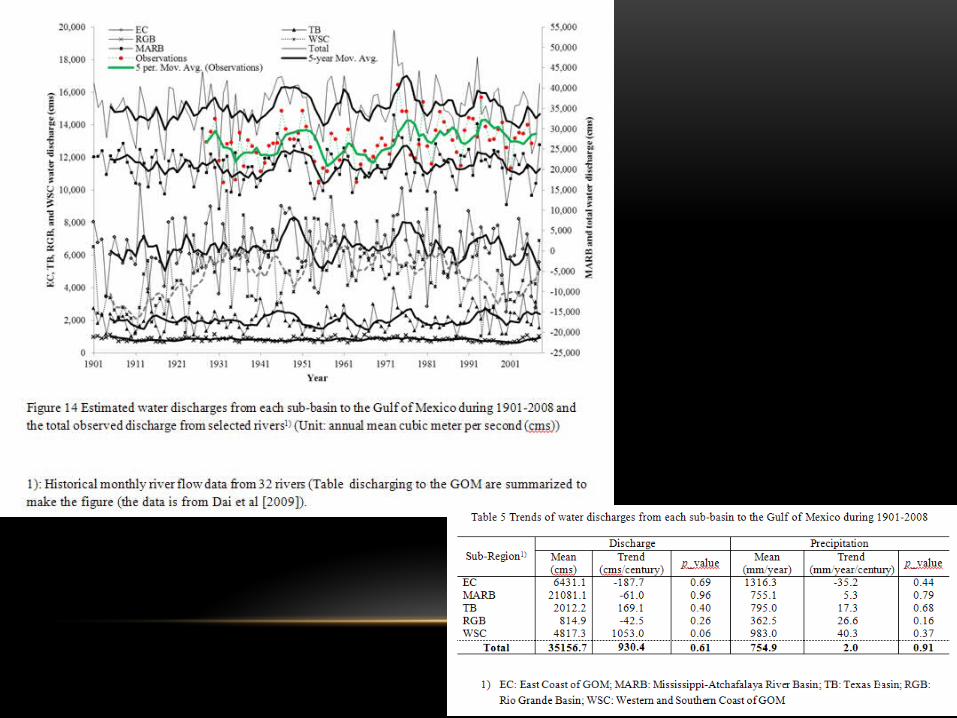
Study area and land cover in 2005 (land cover shows the dominant type in each 5 arc-minute grid) Sub-basins: EC: East Coast of GOM; MARB: Mississippi-Atchafalaya River Basin; TB: Texas Basin; RGB: Rio Grande Basin; WSC: Western and Southern Coast of GOM
27
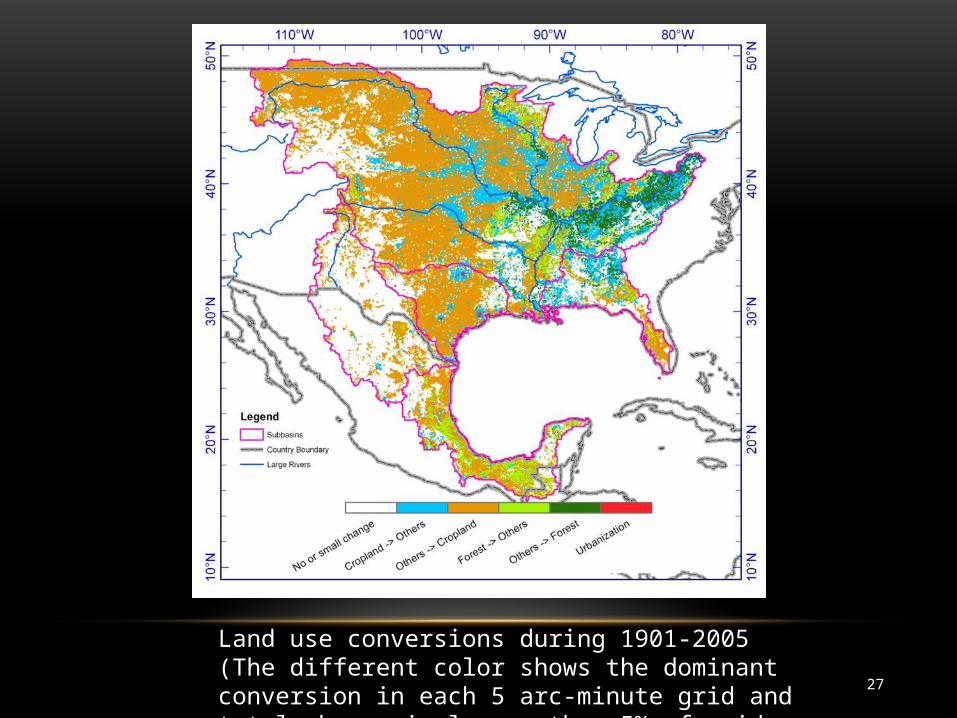
Land use conversions during 1901-2005 (The different color shows the dominant conversion in each 5 arc-minute grid and total change is larger than 5% of grid area)
28
29
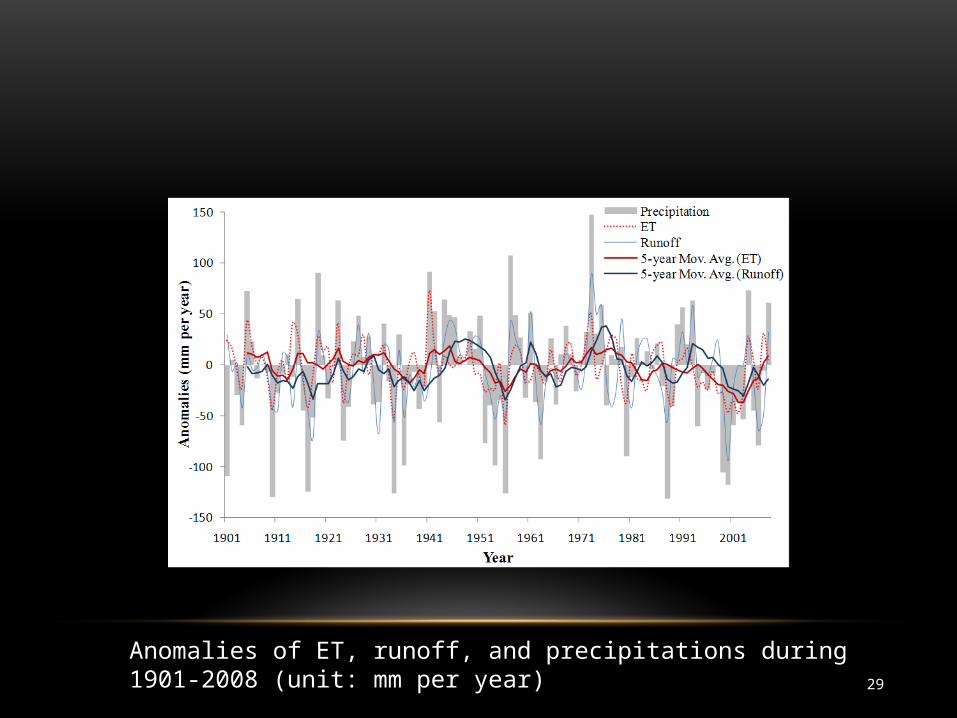
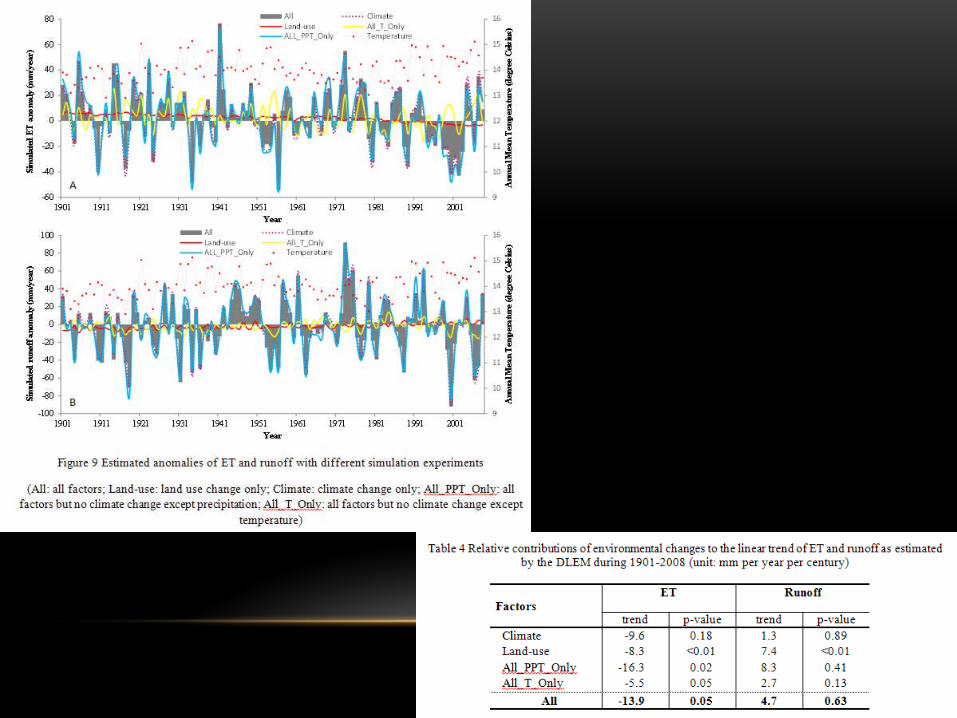
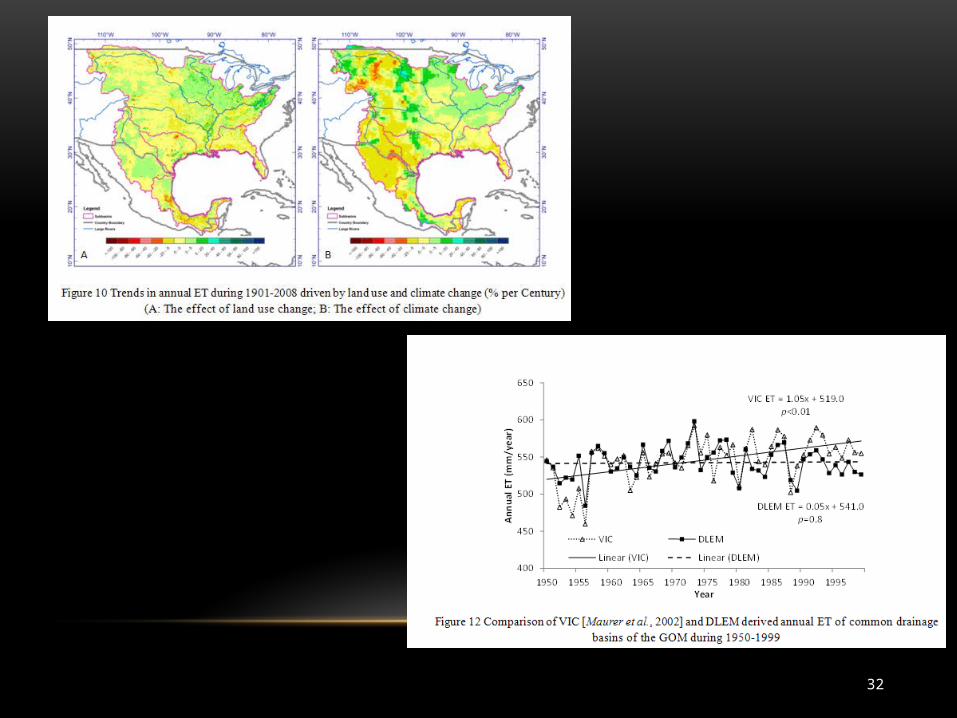
Anomalies of ET, runoff, and precipitations during 1901-2008 (unit: mm per year)
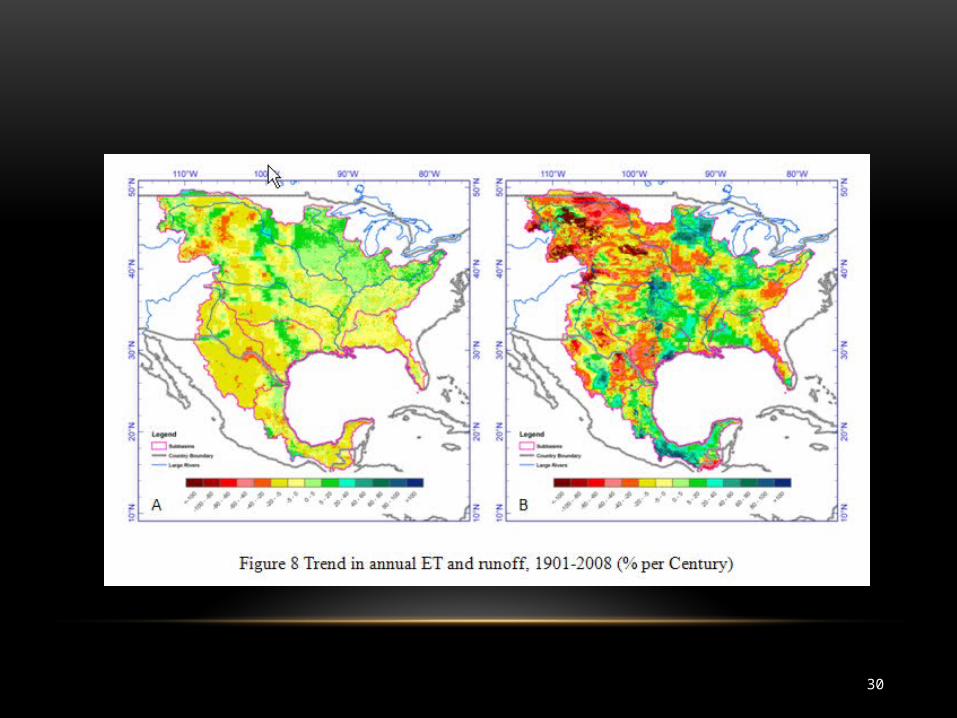
30
31
32
33
34
35
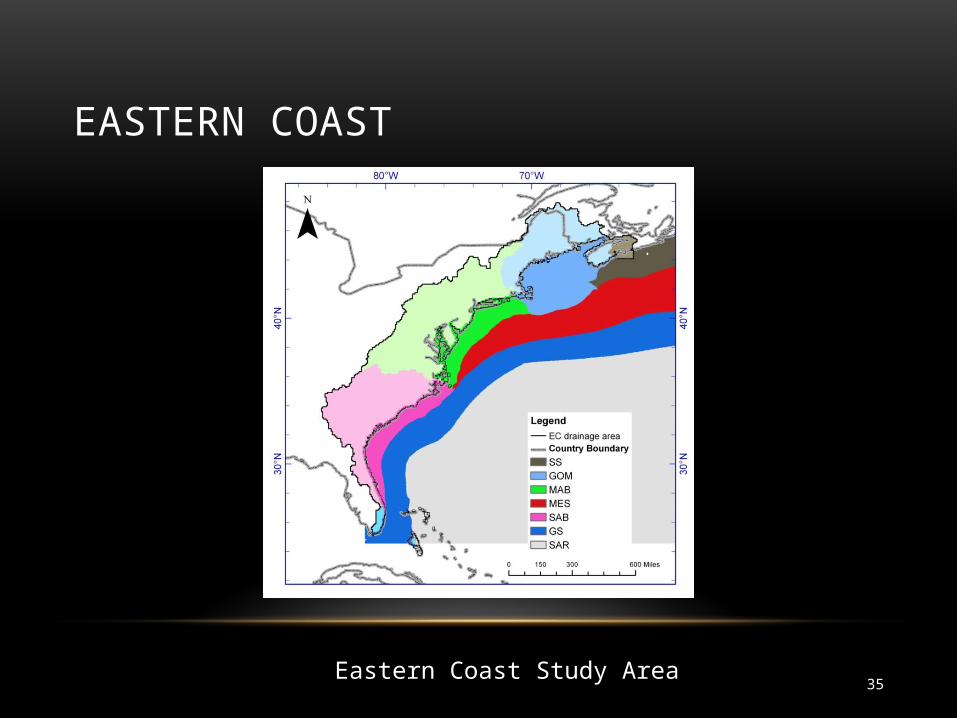
EASTERN COAST
Eastern Coast Study Area
36
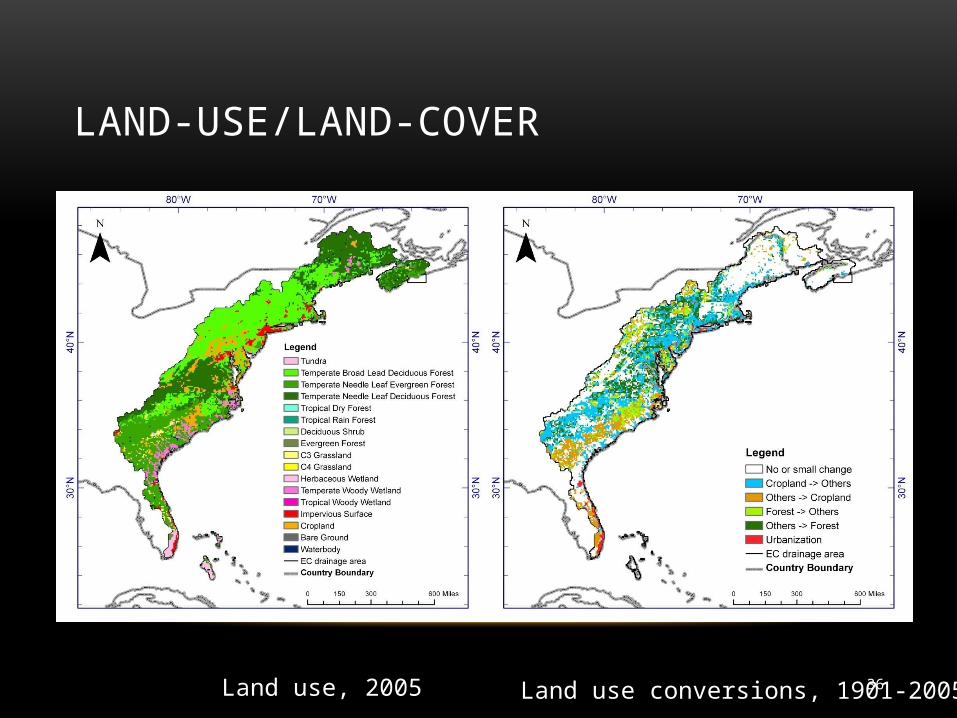
LAND-USE/LAND-COVER
Land use, 2005 Land use conversions, 1901-2005
37
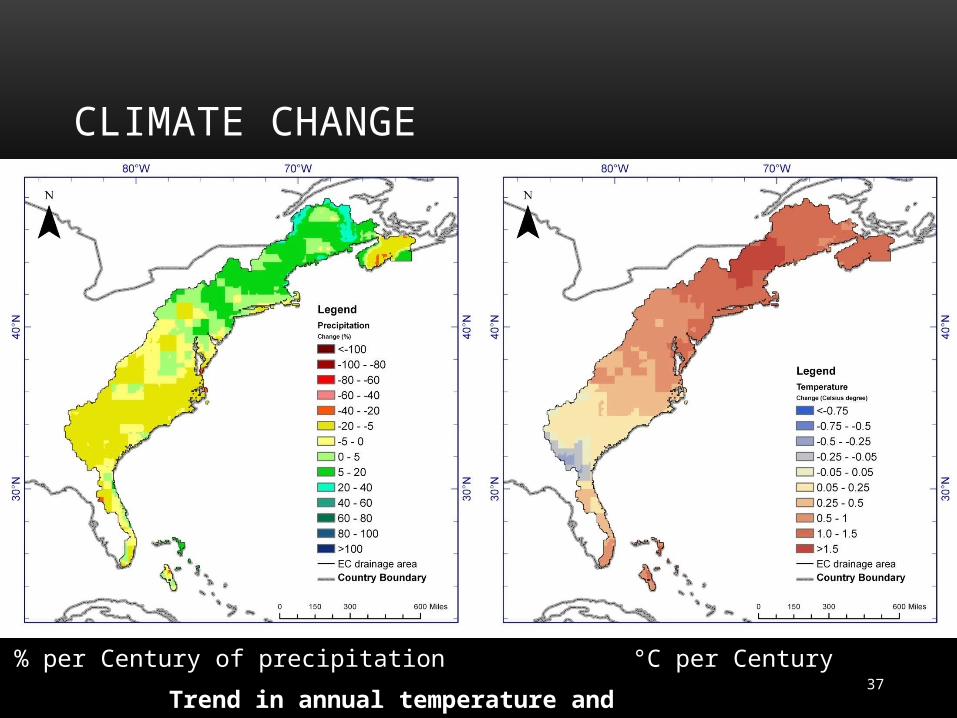
CLIMATE CHANGE
% per Century of precipitation °C per Century
Trend in annual temperature and precipitation, 1901-2008
38
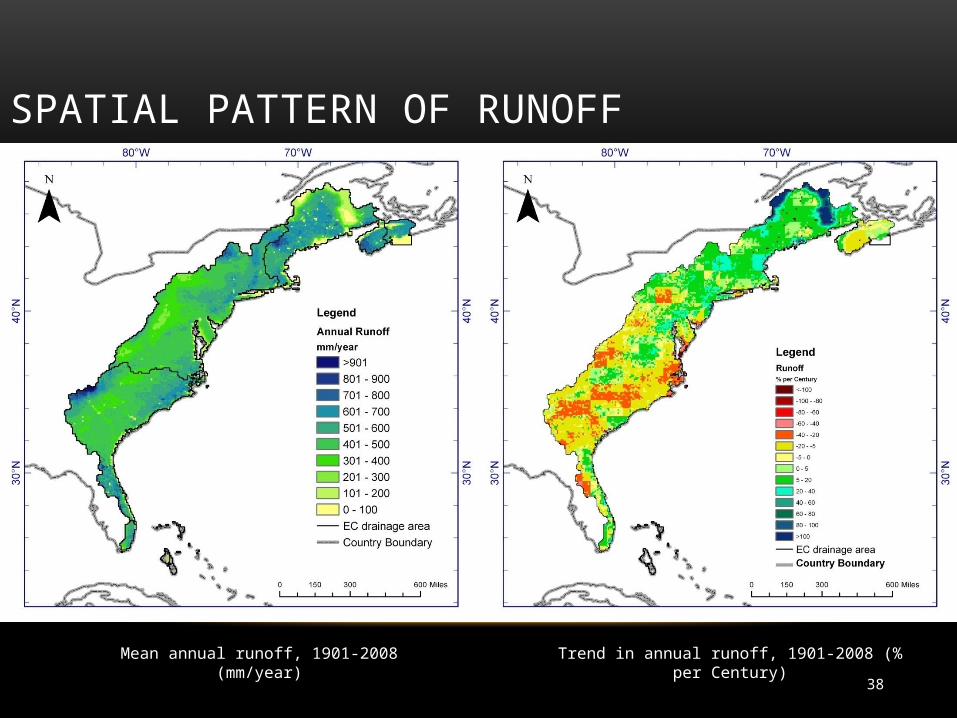
SPATIAL PATTERN OF RUNOFF
Trend in annual runoff, 1901-2008 (% per Century)Mean annual runoff, 1901-2008 (mm/year)
39
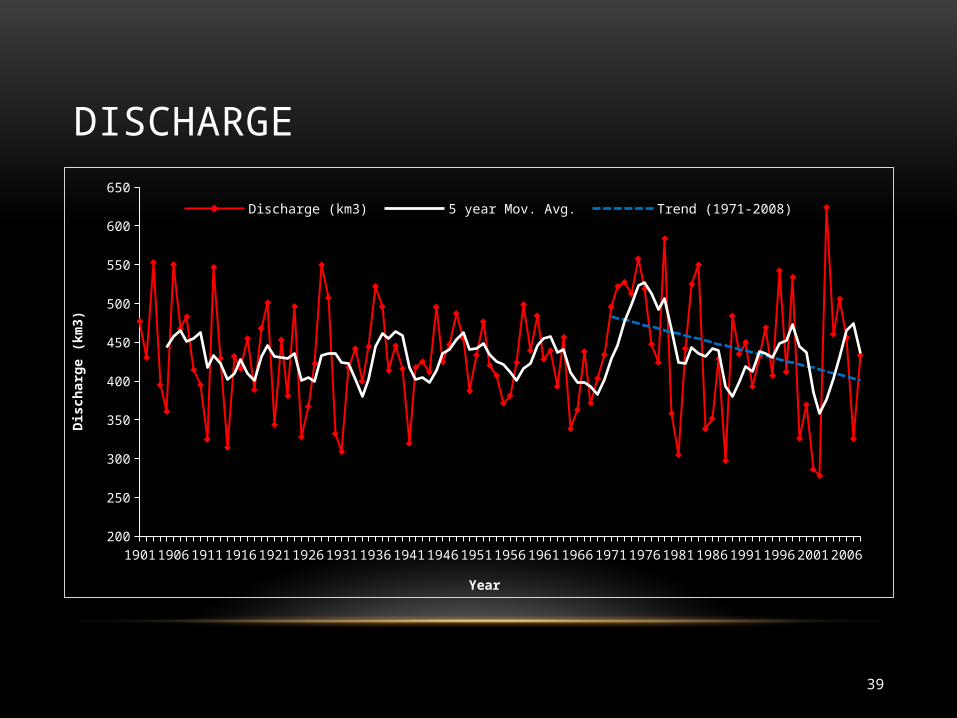
DISCHARGE
1901 1905 1909 1913 1917 1921 1925 1929 1933 1937 1941 1945 1949 1953 1957 1961 1965 1969 1973 1977 1981 1985 1989 1993 1997 2001 2005200
250
300
350
400
450
500
550
600
650
Discharge (km3) 5 year Mov. Avg. Trend (1971-2008)
Year
Dis
char
ge (k
m3)
40
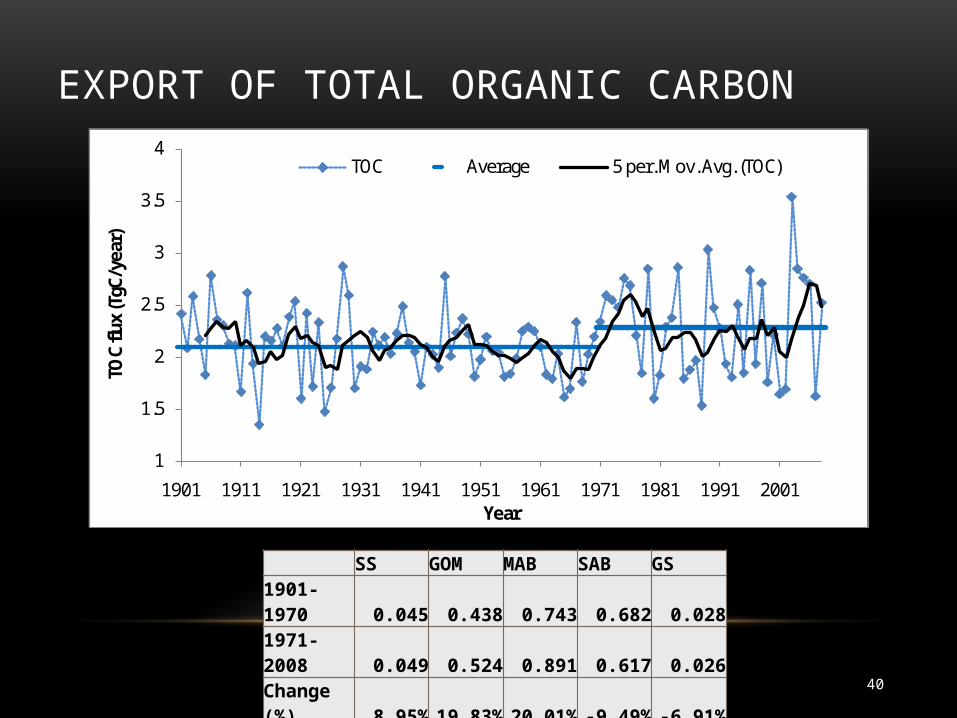
EXPORT OF TOTAL ORGANIC CARBON
1
1.5
2
2.5
3
3.5
4
1901 1911 1921 1931 1941 1951 1961 1971 1981 1991 2001
TOC
flux
(TgC
/yea
r)
Year
TOC Average 5 per. Mov. Avg. (TOC)
SS GOM MAB SAB GS1901-1970 0.045 0.438 0.743 0.682 0.0281971-2008 0.049 0.524 0.891 0.617 0.026Change (%) 8.95% 19.83% 20.01% -9.49% -6.91%
41
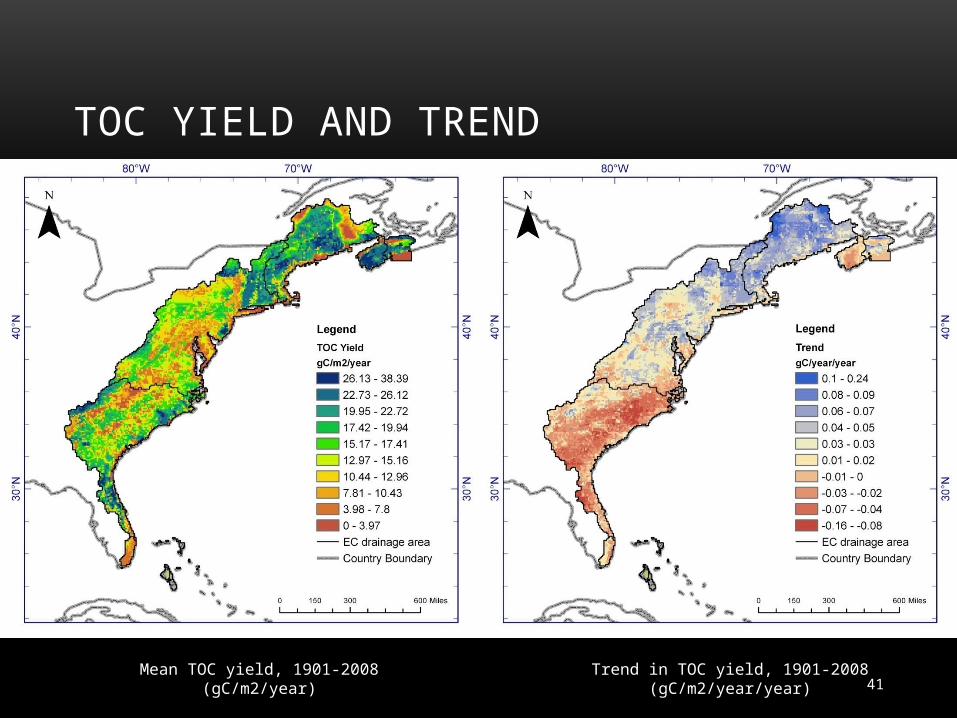
TOC YIELD AND TREND
Trend in TOC yield, 1901-2008 (gC/m2/year/year)Mean TOC yield, 1901-2008 (gC/m2/year)
42
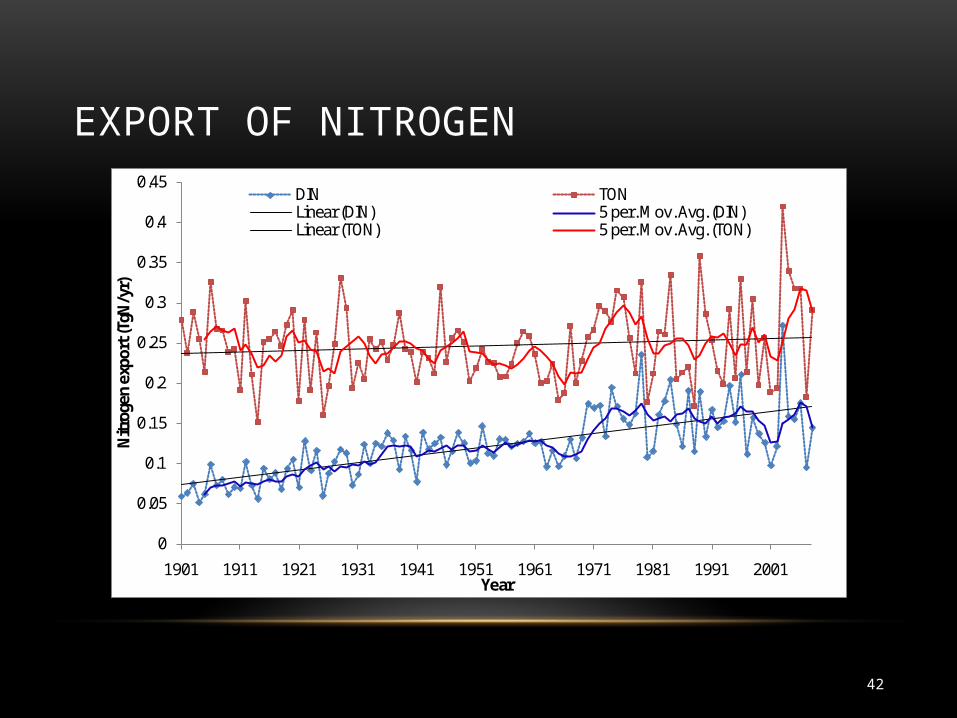
EXPORT OF NITROGEN
0
0.05
0.1
0.15
0.2
0.25
0.3
0.35
0.4
0.45
1901 1911 1921 1931 1941 1951 1961 1971 1981 1991 2001
Nitr
ogen
exp
ort (
TgN
/yr)
Year
DIN TONLinear (DIN) 5 per. Mov. Avg. (DIN)Linear (TON) 5 per. Mov. Avg. (TON)
43
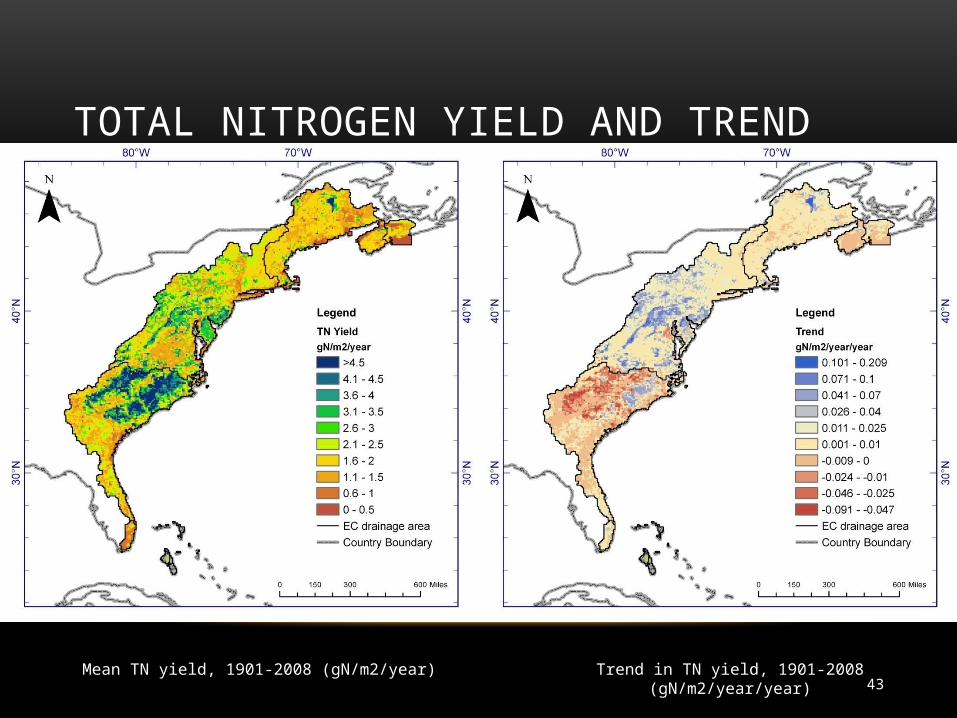
TOTAL NITROGEN YIELD AND TREND
Trend in TN yield, 1901-2008 (gN/m2/year/year)Mean TN yield, 1901-2008 (gN/m2/year)
44
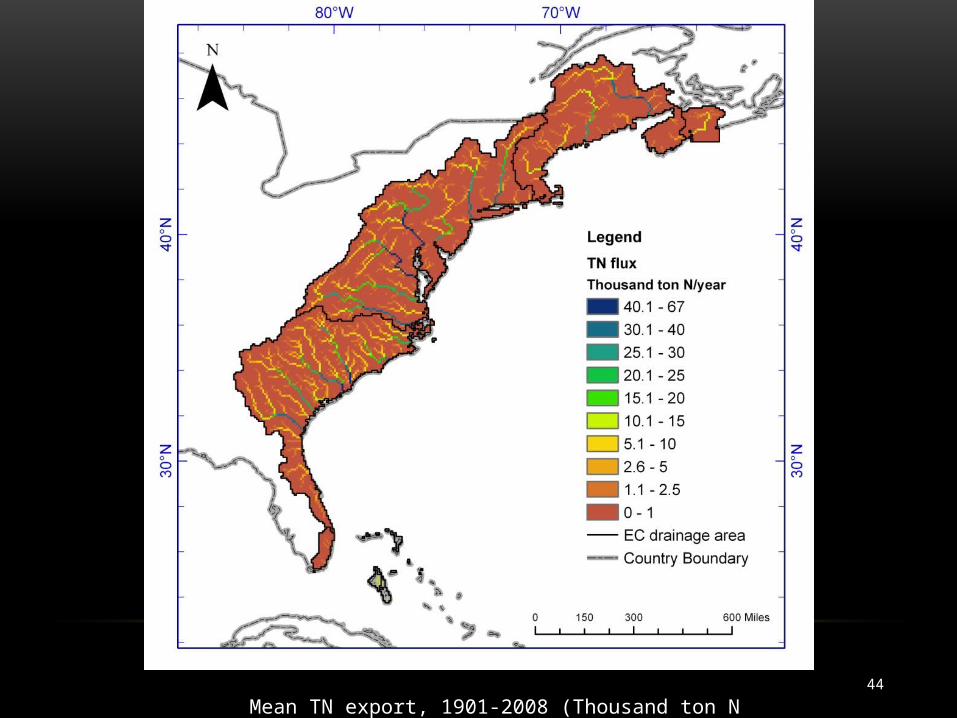
Mean TN export, 1901-2008 (Thousand ton N (109 gN)/year)
45
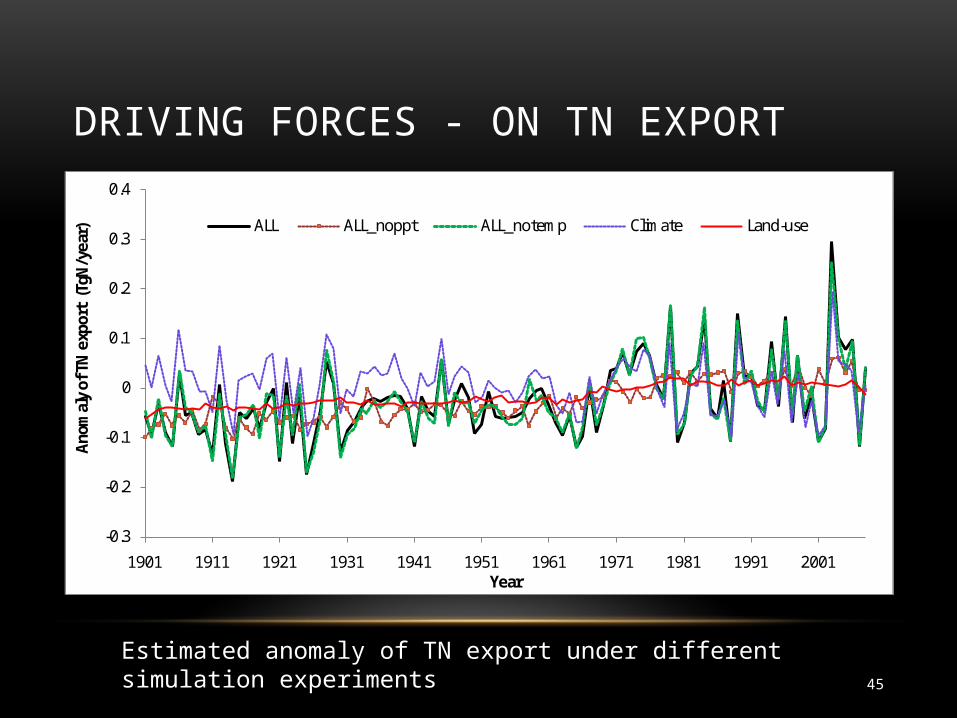
DRIVING FORCES - ON TN EXPORT
-0.3
-0.2
-0.1
0
0.1
0.2
0.3
0.4
1901 1911 1921 1931 1941 1951 1961 1971 1981 1991 2001
Anom
aly
of T
N e
xpor
t (T
gN/y
ear)
Year
ALL ALL_noppt ALL_notemp Climate Land-use
Estimated anomaly of TN export under different simulation experiments
46
OTHER APPLICATIONS• NACP – Site and regional model-data comparison
• North America GHG emissions
• Southeast of US
• China GHG budget
• Monsoon Asia
• Global
47
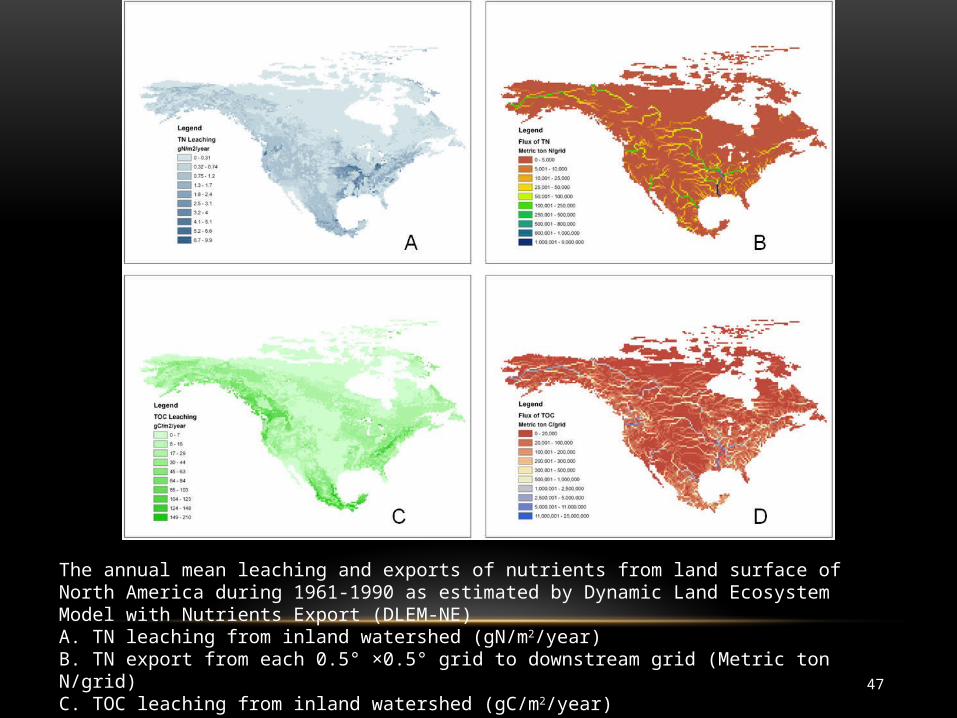
The annual mean leaching and exports of nutrients from land surface of North America during 1961-1990 as estimated by Dynamic Land Ecosystem Model with Nutrients Export (DLEM-NE) A. TN leaching from inland watershed (gN/m2/year) B. TN export from each 0.5° ×0.5° grid to downstream grid (Metric ton N/grid) C. TOC leaching from inland watershed (gC/m2/year) D. TOC export from each 0.5° ×0.5° grid to downstream grid (Metric ton C/grid)
48
49
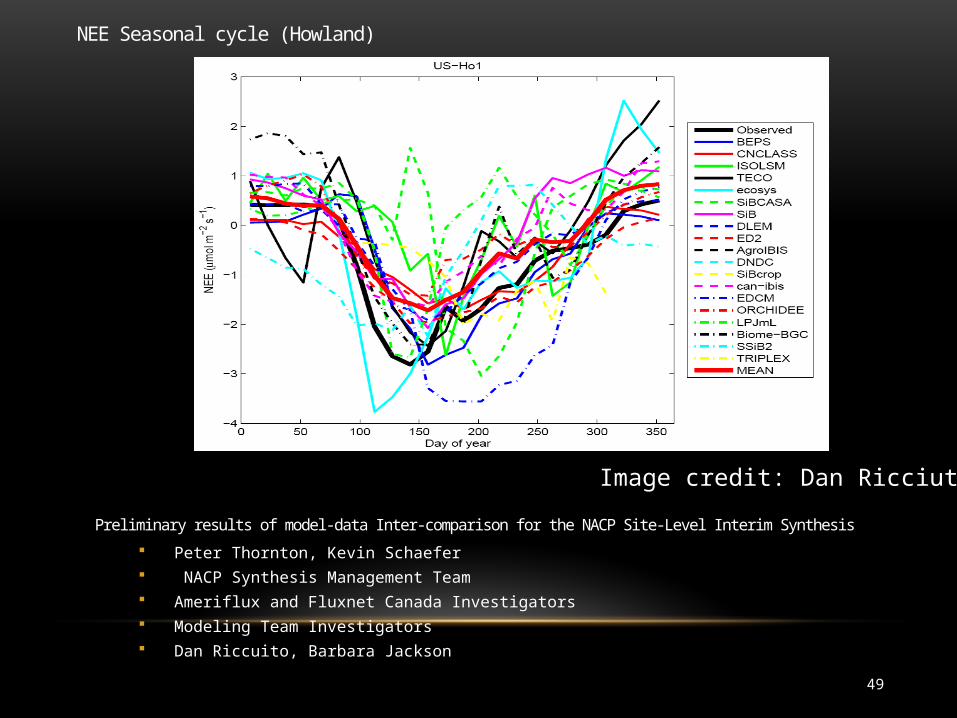
NEE Seasonal cycle (Howland)
Image credit: Dan Ricciuto
Preliminary results of model-data Inter-comparison for the NACP Site-Level Interim Synthesis
Peter Thornton, Kevin Schaefer NACP Synthesis Management Team Ameriflux and Fluxnet Canada Investigators Modeling Team Investigators Dan Riccuito, Barbara Jackson
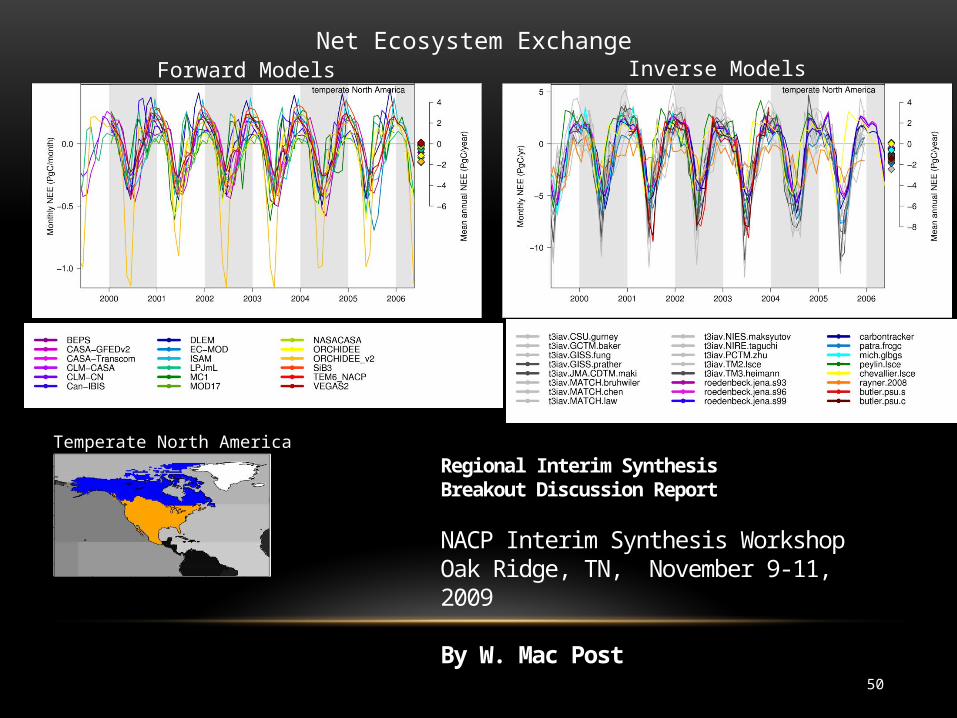
50
Forward Models Inverse ModelsNet Ecosystem Exchange
Temperate North AmericaRegional Interim SynthesisBreakout Discussion Report
NACP Interim Synthesis WorkshopOak Ridge, TN, November 9-11, 2009
By W. Mac Post
51
DISCUSSIONS• Coupling with water quality model and regional climate model
• Social-economic data/model
• Model-data fusion
• Super computer technology
52
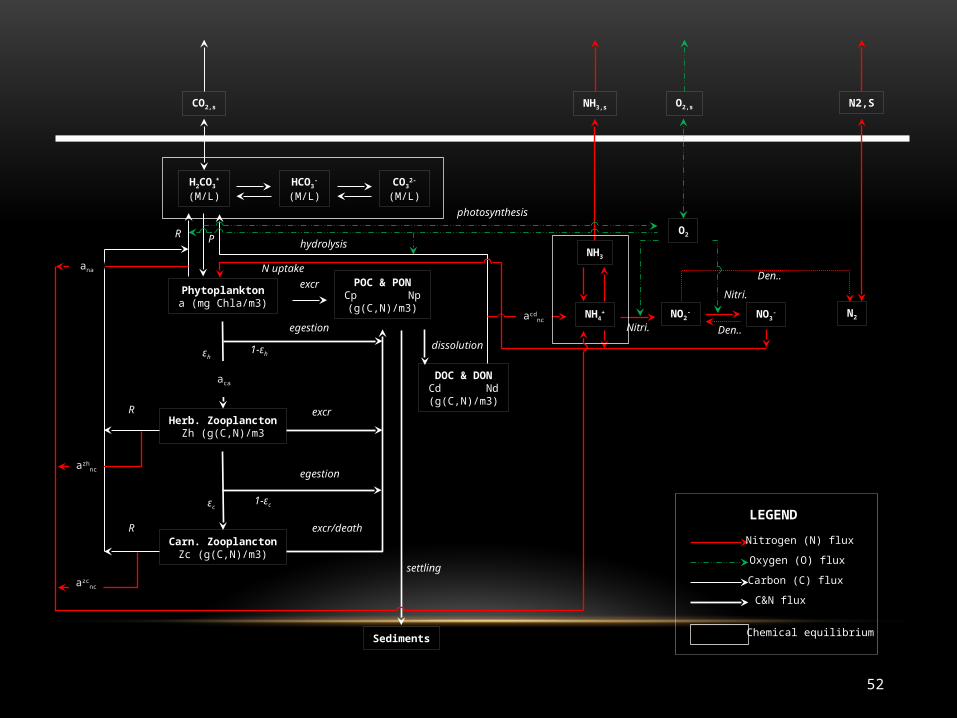
CO2,s
H2CO3*
(M/L)HCO3
-
(M/L)CO3
2-
(M/L)
Phytoplanktona (mg Chla/m3)
Herb. ZooplanctonZh (g(C,N)/m3
POC & PONCp Np
(g(C,N)/m3)
DOC & DONCd Nd
(g(C,N)/m3)
NH3
NH4+
O2
NO2-
Carn. ZooplanctonZc (g(C,N)/m3)
NO3- N2
N2,SO2,s
Sediments
εh
R P
aca
R
R
excr
egestion
excr
excr/death
egestion
settling
hydrolysis
dissolution1-εh
εc1-εc
Nitri.
Nitri.
Den..
Den..
NH3,s
ana
azhnc
azcnc
acdnc
N uptake
photosynthesis
Nitrogen (N) flux
Oxygen (O) flux
LEGEND
Carbon (C) flux
C&N flux
Chemical equilibrium
53
THANK YOU!
http://hill.chem.wsu.edu/PhotoGallery/Pullman
http://www.yearofplenty.org/2010/10/index.html

![DYNAMIC ECOLOGY AND DYNAMIC ECONOMICS: THE · 2019. 12. 31. · DYNAMIC ECOLOGY AND DYNAMIC ECONOMICS sign values to ecosystem services from the top down, Sagoff concludes that "[t]he](https://img.pdfslide.net/doc/110x75/614a09c612c9616cbc69277a/dynamic-ecology-and-dynamic-economics-the-2019-12-31-dynamic-ecology-and-dynamic.jpg)


![16662073 Dynamic Ecosystem Endangered Ecosystem[1]](https://img.pdfslide.net/doc/110x75/577d295b1a28ab4e1ea691a3/16662073-dynamic-ecosystem-endangered-ecosystem1.jpg)