Embed Size (px)
Citation preview
J. theor. Biol. (1997) 184, 301–317
0022–5193/97/030301+17 $25.00/0/jt960275 7 1997 Academic Press Limited
The Dynamics of Microbial Growth on Mixtures of Substrates in Batch Reactors
A N*, A K† D. R‡
* School of Chemical Engineering, † Department of Biological Sciences, ‡ School of ChemicalEngineering, Purdue University, W. Lafayette, IN 47907, U.S.A.
(Received on 13 November 1995, Accepted in revised form on 11 September 1996)
A quantitative understanding of microbial growth on mixtures of substrates is of considerable biologicaland practical interest. Microbes growing in mixed-substrate environments display a rich spectrum ofdynamics. The goal of this work is to show that it is possible to capture these dynamics by a judiciouschoice of only a few physiological variables. The central idea of the mathematical model is that theautocatalytic nature of enzyme induction is the basis of the dynamical behavior associated withmixed-substrate systems. We formulate a model taking due account of the cyclic structure of enzymesynthesis. By applying the quasisteadystate approximation to the model, we show how this cyclicstructure makes enzyme synthesis autocatalytic. Simulations of the model show that it successfullycaptures the experimental data for both the diauxic and the simultaneous substrate utilization patterns.Further insight into these simulations is obtained by performing a complete analysis of the dynamicsof the model. The model is first reduced by appealing to the theory of regular and singular perturbations.The reduced equations thus obtained are then analysed by the method of null clines.
7 1997 Academic Press Limited
1. Introduction
Microbial growth on mixtures of substrates has beenone of the most fertile areas of experimental biology.Indeed, many of the key developments of molecularbiology, such as allosteric and transcriptional control,were inspired by macroscopic phenomena, like thediauxie, observed during mixed-substrate growth.Mixed-substrate phenomena are also of greatecological and engineering interest (Egli, 1995). Innature, and in several man-made environments suchas wastewater purification systems and commercialfermenters, microorganisms grow on a diversemixture of substrates (Harder & Dijkhuizen, 1982).Thus, there are compelling reasons for developinga mathematical theory of mixed-substrate growth.Such a theory could play a useful role in determiningthe relative importance of the various regulatorymechanisms involved in mixed-substrate growth. Itcould also enhance our understanding of microbial
ecology, and enable the rational design of bioreactorsin biochemical and environmental engineering.
Mixed-substrate phenomena in nature and man-made systems occur in media containing extremelycomplex mixtures of substrates. The formulation of amathematical model of growth on such media is adaunting task. The model system we consider hereconsists of a batch culture growing on a syntheticmedium containing a mixture of only two carbon andenergy sources. Although this system is simple, itexhibits a rich spectrum of dynamics. Let us thereforecircumscribe the class of mixed-substrate phenomenawe wish to capture through our model. During batchgrowth on a binary mixture, one of the substrates isgenerally exhausted before the other, leading to theappearance of two exponential growth phases. Basedon the growth pattern observed during the firstgrowth phase, the experimental data on binarymixtures can be classified into three categories(Narang et al., 1996b):
(i) Sequential growth pattern independent of precul-turing (diauxie). Only one of the two substrates
† Present address: Amoco Research Center, MS H-7, 150 W.Warrenville Road, Naperville, IL 60563.
. E T A L .302
is consumed during the first growth phase.Moreover, the order in which the substrates areconsumed does not depend on the preculturingconditions.
(ii) Simultaneous growth pattern independent ofpreculturing. Both the substrates are consumedduring the first growth phase. Furthermore, thevery same specific growth rate and specificuptake rates are obtained, no matter how theinoculum is grown.
(iii) Growth pattern dependent on preculturing. Thegrowth rate and substrate utilization patternduring the first growth phase depend on themanner in which the inoculum has beenprecultured.
The mathematical model formulated here attempts tocapture the first two growth patterns; it does notembrace the preculture-dependent growth pattern.
Mathematical models of microbial growth havebeen classified into unstructured and structuredmodels (Tsuchiya et al., 1966). Unstructured modelsassume that either the physiological state of themicrobial population is not changing in time, or elsethat the specific growth rate is unaffected by changesin the population’s physiological state. Structuredmodels take into account the changes in thepopulation’s physiological state, and its effects on thespecific growth rate.
There are several unstructured models of mixed-substrate growth in the literature (Lee et al., 1974;Gondo et al., 1978; Hegewald & Knorre, 1978; Toda& Yabe, 1979). These models assume that the growthon each substrate follows Monod kinetics (Monod,1942), and the interaction between the growth rates ismutually inhibitory. However, they provide nophysiological basis for this mutually inhibitoryinteraction.
Following the discovery of the induction andrepression mechanisms controlling mRNA synthesis,steady state models were developed to explain thevariation of the enzyme level, E, with respect to thedilution rate, D, in single-substrate continuouscultures (Toda, 1976; Imanaka & Aiba, 1976; Gondoet al., 1978). The logical structure of these models canbe schematized as follows:
DcScSi , SrcQcE
where S, Si , and Sr denote the concentrations of thesubstrate, inducer, and corepressor, respectively, andQ denotes the fraction of free or unbound operatorgenes. It was assumed that S is related to D viaMonod’s model, Si and Sr are proportional to S, andE is proportional to Q. The missing link, contained
in the function Q(Si , Sr ), was derived by postulatingvarious models for induction and repression ofmRNA synthesis (Koch, 1967; Yagil & Yagil, 1971).These steady-state single-substrate models cannotcapture the dynamical phenomena observed duringbatch growth on mixtures of substrates.
Van Dedem & Moo-Young proposed the firststructured dynamic model of the diauxie (Van Dedem& Moo-Young, 1975). The model assumes a priorithat the enzyme for the preferred substrate isconstitutive, while that for the less preferred substrateis inducible. The diauxie is captured by postulatingcatabolite repression via ATP. In the presence of thepreferred substrate, the level of ATP is high, andrepresses the synthesis of the inducible enzyme. Bajpai& Ghose formulated a similar model, the onlydifference being that the repression was exerted by thepreferred substrate itself rather than by one of itsproducts (Bajpai & Ghose, 1978). Instances of thediauxie wherein the enzymes for both the substratesare inducible (Monod, 1947) are beyond the scope ofthese models. An entirely different approach wastaken by Kompala et al., who developed thecybernetic model for diauxic growth (Kompala et al.,1986). A dynamic analysis of this model shows thatit does not capture the simultaneous growth pattern(Narang et al., 1996a).
An important goal of the mathematical modelpresented here is to shed light on the relativeimportance of the various mechanisms underlying thedynamics of the environmental observables, celldensity and exogenous substrate concentrations.Experimental studies, particularly those concerningthe diauxie, have shown that these dynamics aredictated by the dynamics of the inducible enzymescatalyzing the transport and peripheral catabolism ofthe substrates. The enzymatic dynamics are in turndetermined by the rate of synthesis of the enzymes byinduction, and the rate of dilution of the enzymes bygrowth. Superimposed on the processes of enzymeinduction and dilution are regulatory mechanisms,such as catabolite inhibition (Magasanik, 1961) andinducer exclusion (Postma, 1987). In the literature, thedynamical behavior of the environmental variables,such as complete cessation of substrate uptake duringthe diauxie, is invariably attributed to regulatorymechanisms. Here, we wish to highlight the role of akey nonlinearity associated with enzyme induction.The seat of this nonlinearity is the autocatalyticnature of inducible enzyme synthesis; that is, theinducible enzyme, in effect, catalyzes its ownsynthesis.
The autocatalytic nature of inducible enzymesynthesis is rooted in the kinetic structure associated

303
with it. In Section 2, we formulate a model thatproperly accounts for this kinetic structure. In Section3, we show that for a suitable choice of parametervalues, the model captures the preculture-independentgrowth patterns. In Section 4, we show that theessential dynamics of the model can be approximatedby a reduced system of only two differentialequations. This formulates mathematically the fol-lowing empirical observation: The dynamics ofmixed-substrate growth is determined essentially bythe dynamics of the inducible enzymes. The reductionto a two-dimensional system enables us to perform adetailed global analysis of the model. The phaseportraits obtained from this global analysis arediscussed in Section 5.
2. Formulation
The kinetic scheme is shown in Fig. 1. Here, Si
denotes the ith substrate, Ei denotes the inducibleenzyme or ‘‘lumped’’ system of enzymes uniquelyassociated with the uptake and peripheral catabolismof Si , Xi denotes the inducer for Ei , P denotes the‘‘lumped’’ pool of biosynthetic precursors, and Bdenotes the biomass. The concentrations of theseentities are denoted by the lower-case letters si , ei , xi ,p, and c, respectively. The yield of biomass on Si ,denoted Yi , is the fraction of the stream from Xi thatis channeled into biomass, the remainder beingoxidized to produce the energy required for growth.
The kinetic scheme assumes that the inducer, Xi , isa product of the inducible enzyme(s) Ei . Theautocatalytic nature of enzyme synthesis is buried inthis structure, and is forcefully brought out by thefollowing intuitive argument:
(1) The inducible enzyme catalyzes the synthesis ofthe inducer associated with it.
(2) The inducer in turn stimulates the synthesis ofthe inducible enzyme.
This mutually dependent cycle of reactions, by itself,suggests that the enzyme effectively catalyzes its ownsynthesis. In Section 4, we show that the kineticstructure assumed does result in autocatalytic enzymesynthesis. Here, we pause to consider the empiricalbasis for the assumption. The inducible enzymesassociated with lactose and glycerol are well-knownexamples that support this assumption: Allolactose isa product of b-galactosidase, and glycerol-3-phos-phate is a product of glycerol-3-kinase (Lin, 1987). Itis important to note, however, that this assumption istrivially true if the enzyme catalyzing the transport ofa substrate is inducible, a condition that is satisfied bythe transport enzymes of most substrates (Lin, 1987).
The following assumptions are made about thekinetics of the various processes:
(1) The specific rate of uptake of the ith substrate,denoted rs,i , satisfies the kinetic law:
rs,i 0Vs,ieisi
Ks,i + si. (1)
(2) The specific rate of breakdown of Xi into energyand the precursor pool P, denoted rx,i , is givenby:
rx,i 0Vx,ixi
Kx,i + xi. (2)
(3) The yield, Yi , is a fixed ‘‘stoichiometric’’coefficient. This coefficient is the same as theyield observed during single-substrate growth.
(4) The specific growth rate, denoted rg , is givenby:
rg 0Vgp
Kg + p. (3)
(5) The specific rate of induced enzyme synthesis,denoted re,i , is hyperbolic with respect to theinducer Xi :
re,i 0Ve,ixi
Ke,i (p)+ xi(4)
where Ke,i (p) is given by:
Ke,i =K0e,i$1+0 p
Kinh,i1%. (5)
This dependence of Ke,i on the precursor level pis intended to reflect the effect of cataboliterepression. As precursor levels increase, theF. 1. Schematic diagram of the model.
. E T A L .304
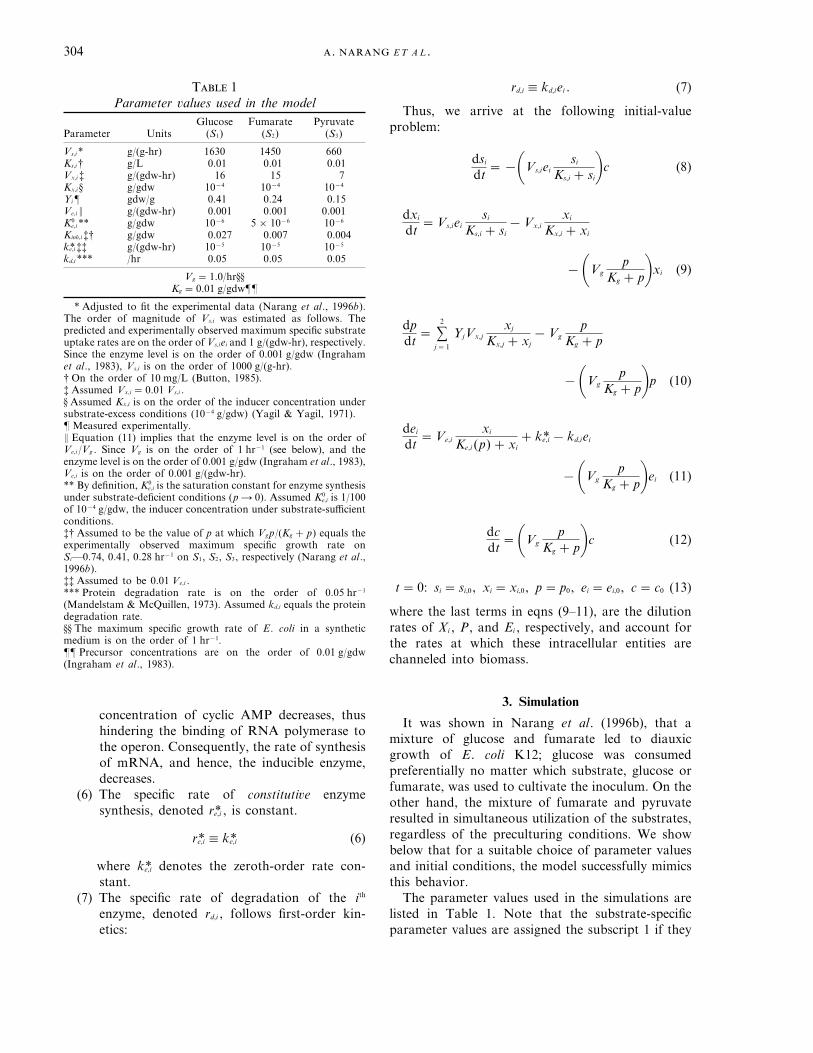
T 1Parameter values used in the model
Glucose Fumarate PyruvateParameter Units (S1) (S2) (S3)
Vs,i* g/(g-hr) 1630 1450 660Ks,i† g/L 0.01 0.01 0.01Vx,i‡ g/(gdw-hr) 16 15 7Kx,i § g/gdw 10−4 10−4 10−4
Yi¶ gdw/g 0.41 0.24 0.15Ve,i> g/(gdw-hr) 0.001 0.001 0.001K0
e,i** g/gdw 10−6 5×10⁻⁶ 10−6
Kinh,i‡† g/gdw 0.027 0.007 0.004k*e,i‡‡ g/(gdw-hr) 10−5 10−5 10−5
kd,i*** /hr 0.05 0.05 0.05
Vg =1.0/hr§§Kg =0.01 g/gdw¶¶
* Adjusted to fit the experimental data (Narang et al., 1996b).The order of magnitude of Vs,i was estimated as follows. Thepredicted and experimentally observed maximum specific substrateuptake rates are on the order of Vs,iei and 1 g/(gdw-hr), respectively.Since the enzyme level is on the order of 0.001 g/gdw (Ingrahamet al., 1983), Vs,i is on the order of 1000 g/(g-hr).† On the order of 10 mg/L (Button, 1985).‡ Assumed Vx,i =0.01 Vs,i .§ Assumed Kx,i is on the order of the inducer concentration undersubstrate-excess conditions (10−4 g/gdw) (Yagil & Yagil, 1971).¶ Measured experimentally.> Equation (11) implies that the enzyme level is on the order ofVe,i /Vg . Since Vg is on the order of 1 hr−1 (see below), and theenzyme level is on the order of 0.001 g/gdw (Ingraham et al., 1983),Ve,i is on the order of 0.001 g/(gdw-hr).** By definition, K0
e,i is the saturation constant for enzyme synthesisunder substrate-deficient conditions (p 4 0). Assumed K0
e,i is 1/100of 10−4 g/gdw, the inducer concentration under substrate-sufficientconditions.‡† Assumed to be the value of p at which Vgp/(Kg + p) equals theexperimentally observed maximum specific growth rate onSi—0.74, 0.41, 0.28 hr−1 on S1, S2, S3, respectively (Narang et al.,1996b).‡‡ Assumed to be 0.01 Ve,i .*** Protein degradation rate is on the order of 0.05 hr−1
(Mandelstam & McQuillen, 1973). Assumed kd,i equals the proteindegradation rate.§§ The maximum specific growth rate of E. coli in a syntheticmedium is on the order of 1 hr−1.¶¶ Precursor concentrations are on the order of 0.01 g/gdw(Ingraham et al., 1983).
rd,i 0 kd,iei . (7)
Thus, we arrive at the following initial-valueproblem:
dsi
dt=−0Vs,iei
si
Ks,i + si1c (8)
dxi
dt=Vs,iei
si
Ks,i + si−Vx,i
xi
Kx,i + xi
−0Vgp
Kg + p1xi (9)
dpdt
= s2
j=1
YjVx,jxj
Kx,j + xj−Vg
pKg + p
−0Vgp
Kg + p1p (10)
dei
dt=Ve,i
xi
Ke,i (p)+ xi+ k*e,i − kd,iei
−0Vgp
Kg + p1ei (11)
dcdt
=0Vgp
Kg + p1c (12)
t=0: si = si,0, xi = xi,0, p= p0, ei = ei,0, c= c0 (13)
where the last terms in eqns (9–11), are the dilutionrates of Xi , P, and Ei , respectively, and account forthe rates at which these intracellular entities arechanneled into biomass.
3. Simulation
It was shown in Narang et al. (1996b), that amixture of glucose and fumarate led to diauxicgrowth of E. coli K12; glucose was consumedpreferentially no matter which substrate, glucose orfumarate, was used to cultivate the inoculum. On theother hand, the mixture of fumarate and pyruvateresulted in simultaneous utilization of the substrates,regardless of the preculturing conditions. We showbelow that for a suitable choice of parameter valuesand initial conditions, the model successfully mimicsthis behavior.
The parameter values used in the simulations arelisted in Table 1. Note that the substrate-specificparameter values are assigned the subscript 1 if they
concentration of cyclic AMP decreases, thushindering the binding of RNA polymerase tothe operon. Consequently, the rate of synthesisof mRNA, and hence, the inducible enzyme,decreases.
(6) The specific rate of constitutive enzymesynthesis, denoted r*e,i , is constant.
r*e,i 0 k*e,i (6)
where k*e,i denotes the zeroth-order rate con-stant.
(7) The specific rate of degradation of the ith
enzyme, denoted rd,i , follows first-order kin-etics:
w
305
belong to glucose, 2 if they belong to fumarate, and3 if they belong to pyruvate. The parameter values forthese substrates are not available in the literature.Thus, the orders of magnitude of the parameters wereestimated as shown in Table 1. All parameters, exceptVs,i and K0
e,i , were then fixed. These two parameterswere adjusted to fit the experimental data (Naranget al., 1996b).
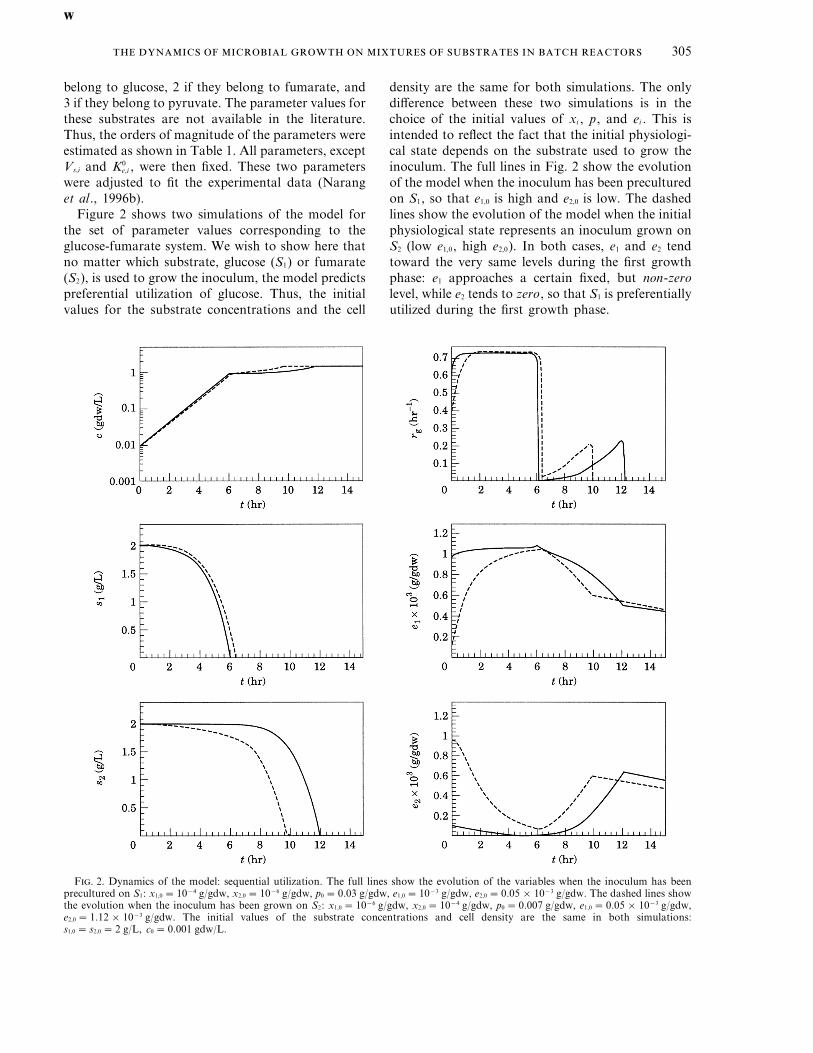
Figure 2 shows two simulations of the model forthe set of parameter values corresponding to theglucose-fumarate system. We wish to show here thatno matter which substrate, glucose (S1) or fumarate(S2), is used to grow the inoculum, the model predictspreferential utilization of glucose. Thus, the initialvalues for the substrate concentrations and the cell
density are the same for both simulations. The onlydifference between these two simulations is in thechoice of the initial values of xi , p, and ei . This isintended to reflect the fact that the initial physiologi-cal state depends on the substrate used to grow theinoculum. The full lines in Fig. 2 show the evolutionof the model when the inoculum has been preculturedon S1, so that e1,0 is high and e2,0 is low. The dashedlines show the evolution of the model when the initialphysiological state represents an inoculum grown onS2 (low e1,0, high e2,0). In both cases, e1 and e2 tendtoward the very same levels during the first growthphase: e1 approaches a certain fixed, but non-zerolevel, while e2 tends to zero, so that S1 is preferentiallyutilized during the first growth phase.
F. 2. Dynamics of the model: sequential utilization. The full lines show the evolution of the variables when the inoculum has beenprecultured on S1: x1,0 =10−4 g/gdw, x2,0 =10−6 g/gdw, p0 =0.03 g/gdw, e1,0 =10−3 g/gdw, e2,0 =0.05×10⁻³ g/gdw. The dashed lines showthe evolution when the inoculum has been grown on S2: x1,0 =10−6 g/gdw, x2,0 =10−4 g/gdw, p0 =0.007 g/gdw, e1,0 =0.05×10⁻³ g/gdw,e2,0 =1.12×10⁻³ g/gdw. The initial values of the substrate concentrations and cell density are the same in both simulations:s1,0 = s2,0 =2 g/L, c0 =0.001 gdw/L.
. E T A L .306
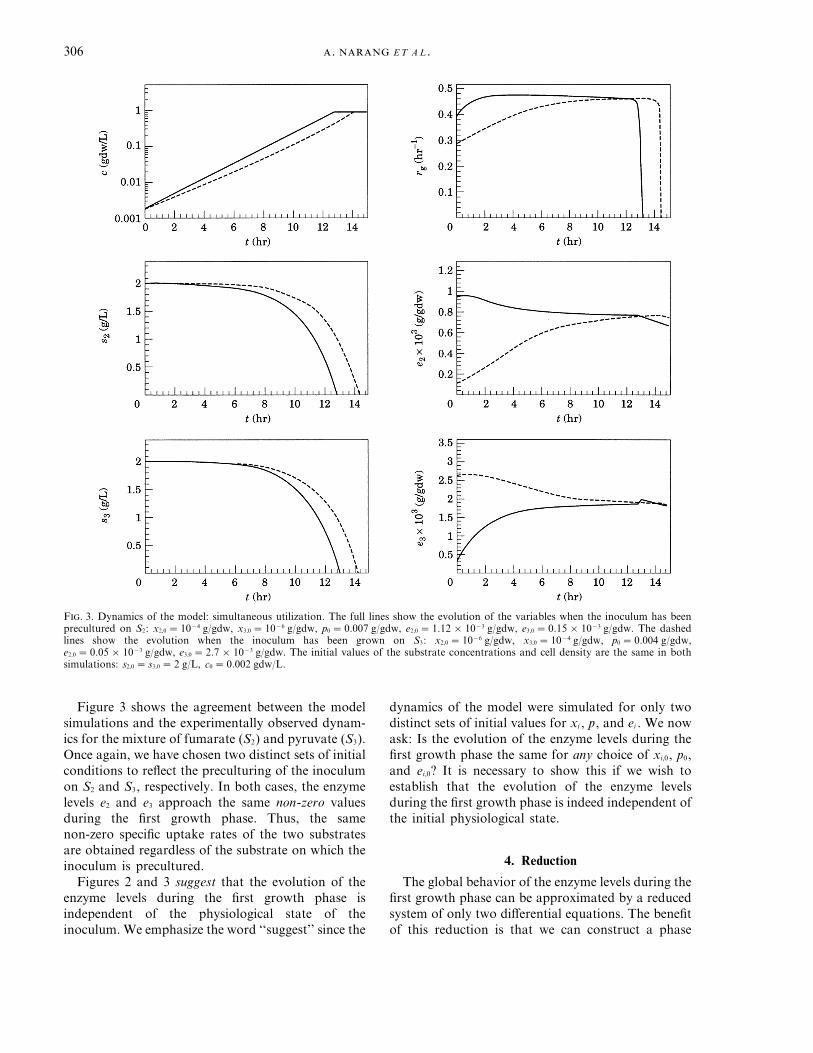
F. 3. Dynamics of the model: simultaneous utilization. The full lines show the evolution of the variables when the inoculum has beenprecultured on S2: x2,0 =10−4 g/gdw, x3,0 =10−6 g/gdw, p0 =0.007 g/gdw, e2,0 =1.12×10⁻³ g/gdw, e3,0 =0.15×10⁻³ g/gdw. The dashedlines show the evolution when the inoculum has been grown on S3: x2,0 =10−6 g/gdw, x3,0 =10−4 g/gdw, p0 =0.004 g/gdw,e2,0 =0.05×10⁻³ g/gdw, e3,0 =2.7×10⁻³ g/gdw. The initial values of the substrate concentrations and cell density are the same in bothsimulations: s2,0 = s3,0 =2 g/L, c0 =0.002 gdw/L.
Figure 3 shows the agreement between the modelsimulations and the experimentally observed dynam-ics for the mixture of fumarate (S2) and pyruvate (S3).Once again, we have chosen two distinct sets of initialconditions to reflect the preculturing of the inoculumon S2 and S3, respectively. In both cases, the enzymelevels e2 and e3 approach the same non-zero valuesduring the first growth phase. Thus, the samenon-zero specific uptake rates of the two substratesare obtained regardless of the substrate on which theinoculum is precultured.
Figures 2 and 3 suggest that the evolution of theenzyme levels during the first growth phase isindependent of the physiological state of theinoculum. We emphasize the word ‘‘suggest’’ since the
dynamics of the model were simulated for only twodistinct sets of initial values for xi , p, and ei . We nowask: Is the evolution of the enzyme levels during thefirst growth phase the same for any choice of xi,0, p0,and ei,0? It is necessary to show this if we wish toestablish that the evolution of the enzyme levelsduring the first growth phase is indeed independent ofthe initial physiological state.
4. Reduction
The global behavior of the enzyme levels during thefirst growth phase can be approximated by a reducedsystem of only two differential equations. The benefitof this reduction is that we can construct a phase
307
portrait that allows us to visualize the globalbehavior. Before deducing this reduction mathemat-ically, one can give the following heuristic justificationfor it.
The evolution of the physiological (biotic) statevariables xi , p, and ei , is influenced by theenvironmental (abiotic) state variables, si and c.According to the model, this influence is exerted onlyby the substrate concentrations through the ratios,si /(Ks,i + si ), appearing in the evolution equations (9)for the physiological state variables xi . Since si,0 is onthe order of 1 g/L, and Ks,i is on the order of 0.01 g/L,these ratios are initially almost equal to one.Moreover, they do not deviate significantly from thisvalue until si becomes as small as Ks,i . Hence, the cells‘‘see’’ a constant environment throughout almost theentire first growth phase. In the face of thisquasiconstant environment, the physiological statevariables tend toward a quasisteadystate. Theirapproach toward this quasisteadystate occurs instages. The fast variables, xi and p, achievequasisteadystate almost instantaneously. This isfollowed by the slow evolution of the enzyme levels,ei , toward their quasisteadystate values. In typicalbatch cultures, the first growth phase lasts longenough for the enzyme levels to also reach theirquasisteadystate values. Indeed, since the timeconstants for the cell density and the enzyme levels arethe same (1/Vg ),* the enzyme levels approachquasisteadystate in 2–3 cell doublings. In typicalbatch cultures, c0, si,0, and Yi are on the order of0.01–0.001 g dry weight (gdw) per liter, 1.0 g/L, and0.5 g/gdw, respectively. Hence, c0/(Yisi,0) is on theorder of 0.01–0.001, and the cells undergo at least7–10 doublings before the end of the first growthphase. This represents sufficient time for the enzymelevels to reach quasisteadystate. We are interested inthe motion of the enzyme levels toward thequasisteadystate values reached during the firstgrowth phase. This can be approximated by studyingthe dynamics of the reduced system obtained byletting xi = p=0 and si = si,0.
We begin the process of simplifying these equationsby expressing mathematically the fact that the fastvariables xi and p rapidly achieve quasisteadystate.Hence, we obtain the equations:
dsi
dt=−Vs,iei
si
Ks,i + sic (14)
dei
dt=Ve,i
xi
Ke,i (p)+ xi−0 s
2
j=1
YjVs,jejsj
Ks,j + sj 1ei
− kd,iei + k*e,i (15)
dcdt
= s2
j=1
YjVs,jejsj
Ks,j + sjc (16)
si (0)= si,0, ei (0)= ei,0, c(0)= c0 (17)
where:
xi =Kx,i(Vs,i /Vx,i )eisi /(Ks,i + si )
1− (Vs,i /Vx,i )eisi /(Ks,i + si )
2Kx,iVs,i
Vx,i
si
Ks,i + siei (18)
p=Kg
s2
j=1
(YjVx,j /Vg )xj /(Kx,j + xj )
1− s2
j=1
(YjVx,j /Vg )xj /(Kx,j + xj )(19)
are the quasisteadystate concentrations of theinducers and precursors, respectively. Equation (18),which shows that xi is a monotonically increasingfunction of ei , is the key to the autocatalytic natureof enzyme synthesis. Indeed, if we substitute xi in thekinetic expression for enzyme synthesis, we see thatthe quasisteadystate rate of synthesis of ei :
re,i 0Ve,ixi
Ke,i (p)+ xi
2Ve,i
eisi
Ks,i + si
K0e,iVx,i
Kx,iVs,i 01+p
Kinh,i1+ eisi
Ks,i + si
(20)
is zero whenever ei is zero. Such kinetics arecharacteristic of autocatalytic processes. The product(ei ) of the process (enzyme synthesis) is essential forits own synthesis; in the absence of the product, therate of the process is zero.*
* The term ‘‘autocatalytic’’ is generally used to describe thekinetics of single reactions that catalyze their own synthesis. Thefact that we are using this term to describe a process (i.e. a set ofreactions) calls for some clarification. In a process consisting of aclosed network of reactions, ‘‘substances which are by no meansself-replicating in their own right may nevertheless increaseaccording to the law of autocatalysis which makes them appearautosynthetic’’ (Dean & Hinshelwood, 1966). Neither the rate ofenzyme induction, nor the rate of inducer formation are, bythemselves, autocatalytic. However, due to cyclic structure ofenzyme synthesis, the process of enzyme synthesis exhibitsproperties characteristic of autocatalytic reactions.
* The quasisteadystate enzyme level, ei , is on the order of Ve,i /Vg .Hence, the time constant for the enzyme level is ei /Ve,i =1/Vg . Sincethe growth rate is on the order of Vg , the time constant for the celldensity is also on the order of 1/Vg .
. E T A L .308
The next simplification results from the existence ofa linear dependence between the cell density and thesubstrate concentrations. It follows from eqns (14)and (16) that:
ddt
(Y1s1 +Y2s2 + c)=0 (21)
whence:
c= c0 +Y1(s1,0 − s1)+Y2(s2,0 − s2) (22)
which says that the instantaneous cell density is theinitial cell density plus the density of the cells createdby consumption of the two substrates.
Substituting (22) in (14), we obtain:
dsi
dt=−Vs,iei
si
Ks,i + si
(c0 +Y1s1,0 +Y2s2,0 −Y1s1 −Y2s2) (23)
dei
dt=Ve,i
xi
Ke,i (p)+ xi
−0s2
j=1
YjVs,jejsj
Ks,j + sj1ei − kd,iei + k*e,i (24)
si (0)= si,0, ei (0)= ei,0. (25)
Further reduction of these equations obtains from thefact that for a certain finite interval of time, theenzyme levels evolve without ‘‘seeing’’ the changes inthe substrate concentrations. It is easier to explain thisfor the special case of single substrate growth, sincethe reduction can be shown graphically.
4.1. -
In the special case of single-substrate growth, theequations become:
ds1
dt=−Vs,1e1
s1
Ks,1 + s1(c0 +Y1s1,0 −Y1s1) (26)
de1
dt=Ve,1
x1
Ke,1(p)+ x1
−0Y1Vs,1e1s1
Ks,1 + s11e1 − kd,1e1 + k*e,1 (27)
s1(0)= s1,0, e1(0)= e1,0 (28)
where we use the subscript 1 since the substrate-specific parameter values used in the followingsimulations belong to glucose.
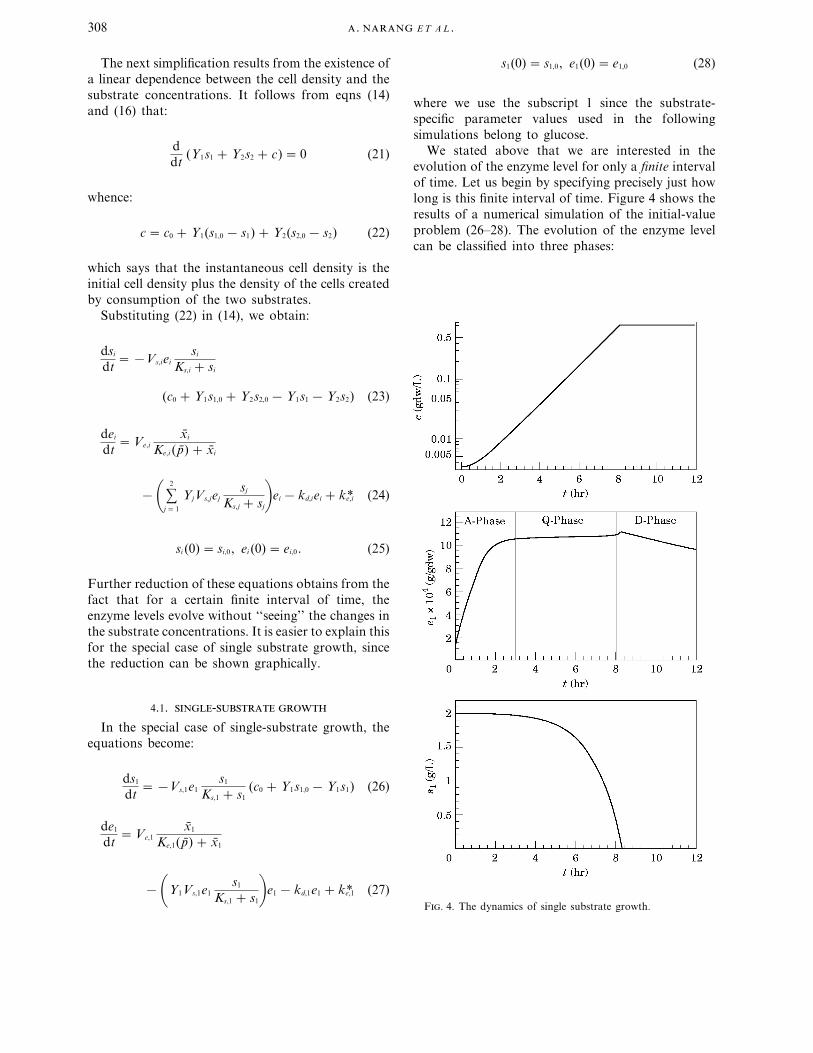
We stated above that we are interested in theevolution of the enzyme level for only a finite intervalof time. Let us begin by specifying precisely just howlong is this finite interval of time. Figure 4 shows theresults of a numerical simulation of the initial-valueproblem (26–28). The evolution of the enzyme levelcan be classified into three phases:
F. 4. The dynamics of single substrate growth.
309
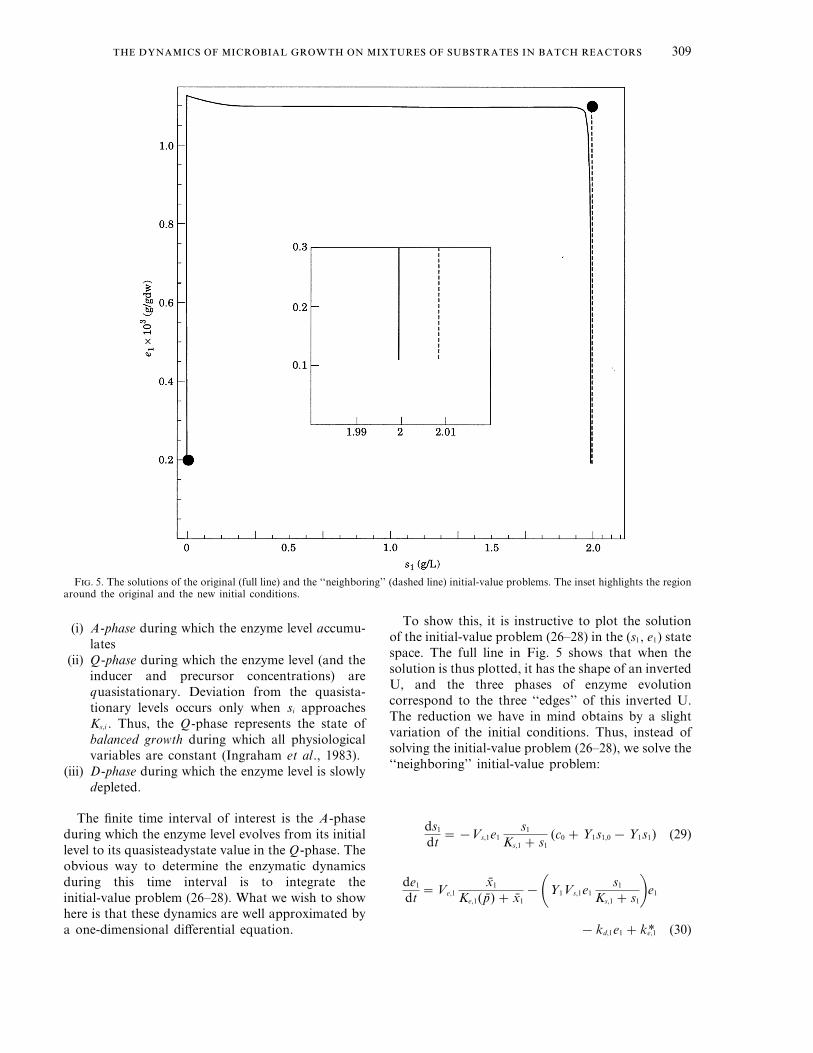
F. 5. The solutions of the original (full line) and the ‘‘neighboring’’ (dashed line) initial-value problems. The inset highlights the regionaround the original and the new initial conditions.
(i) A-phase during which the enzyme level accumu-lates
(ii) Q-phase during which the enzyme level (and theinducer and precursor concentrations) arequasistationary. Deviation from the quasista-tionary levels occurs only when si approachesKs,i . Thus, the Q-phase represents the state ofbalanced growth during which all physiologicalvariables are constant (Ingraham et al., 1983).
(iii) D-phase during which the enzyme level is slowlydepleted.
The finite time interval of interest is the A-phaseduring which the enzyme level evolves from its initiallevel to its quasisteadystate value in the Q-phase. Theobvious way to determine the enzymatic dynamicsduring this time interval is to integrate theinitial-value problem (26–28). What we wish to showhere is that these dynamics are well approximated bya one-dimensional differential equation.
To show this, it is instructive to plot the solutionof the initial-value problem (26–28) in the (s1, e1) statespace. The full line in Fig. 5 shows that when thesolution is thus plotted, it has the shape of an invertedU, and the three phases of enzyme evolutioncorrespond to the three ‘‘edges’’ of this inverted U.The reduction we have in mind obtains by a slightvariation of the initial conditions. Thus, instead ofsolving the initial-value problem (26–28), we solve the‘‘neighboring’’ initial-value problem:
ds1
dt=−Vs,1e1
s1
Ks,1 + s1(c0 +Y1s1,0 −Y1s1) (29)
de1
dt=Ve,1
x1
Ke,1(p)+ x1−0Y1Vs,1e1
s1
Ks,1 + s11e1
− kd,1e1 + k*e,1 (30)
. E T A L .310
s1(0)= s1,0 +c0
Y1, e1(0)= e1,0. (31)
The initial conditions (31) are obtained by orthogonalprojection of the actual initial condition (s1,0, e1,0) ontothe line:
c0 +Y1s1,0 −Y1s1 =0.
The solution of this new initial-value problem isshown as a dashed line in Fig. 5.
The new initial-value problem is simpler than theoriginal initial-value problem, yet its solution is agood approximation over the finite time interval ofinterest. Let us substantiate this claim. It issimpler than the original initial-value problem since itis equivalent to the one-dimensional initial-valueproblem:
s1(t)= s1,0 +c0
Y1(32)
de1
dt=Ve,1
x1
Ke,1(p)+ x1−0Y1Vs,1e1
s1
Ks,1 + s11e1 − kd,1e1 + k*e,1 (33)
e1(0)= e1,0. (34)
This is because the new initial conditions (31) lieon the line, c0 +Y1s1,0 −Y1s1 =0, which is invariantunder the flow of (29–30), i.e., a solution startingat any point on this line will remain on itsubsequently. The solution of the new initial valueproblem is also a good approximation over the
finite time interval of interest, since the newinitial-value problem is obtained from the originalinitial-value problem by a very slight modification ofthe initial conditions. The distance between the twosets of initial conditions is only c0/Y1 which issubstantially less than (s2
1,0 + e21,0)
12 2 s1,0, the distance
of the original initial conditions from the origin.Hence, the theorem of continuous dependenceon initial conditions assures us that the solutionswill remain close for a finite period of timewhose length depends on the magnitude of thedimensionless parameter c0/(Y1s1,0). The smaller themagnitude of c0/(Y1s1,0), the larger the time intervalover which the approximation is valid. In typicalbatch experiments, c0/(Y1s1,0) is on the order of0.01–0.001.
The theorem guarantees the proximity of theexact and approximate solutions only over afinite time interval; it does not preclude thepossibility that these solutions ultimately diverge.Figure 5 shows that their asymptotic behavior isindeed quite different. The approximate solutionultimately approaches the unstable steady state.The exact solution passes through a neighborhoodof this unstable steady state, but ultimatelyapproaches the stable steady state near theorigin (s1 =0, e1 =0.0002). However, throughoutthe finite time interval of interest, theapproximate solution is very close to the exactsolution.
It is now easy to deduce the global behavior of theenzyme level during its approach to balanced growth
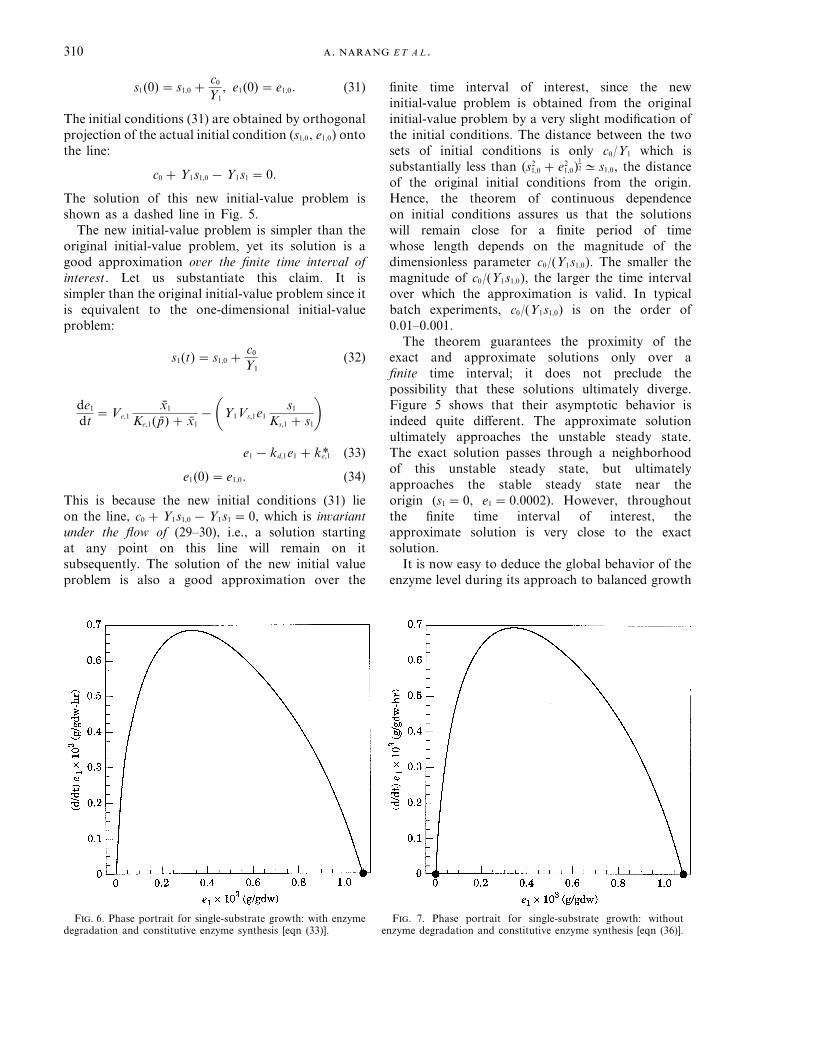
F. 6. Phase portrait for single-substrate growth: with enzymedegradation and constitutive enzyme synthesis [eqn (33)].
F. 7. Phase portrait for single-substrate growth: withoutenzyme degradation and constitutive enzyme synthesis [eqn (36)].
311
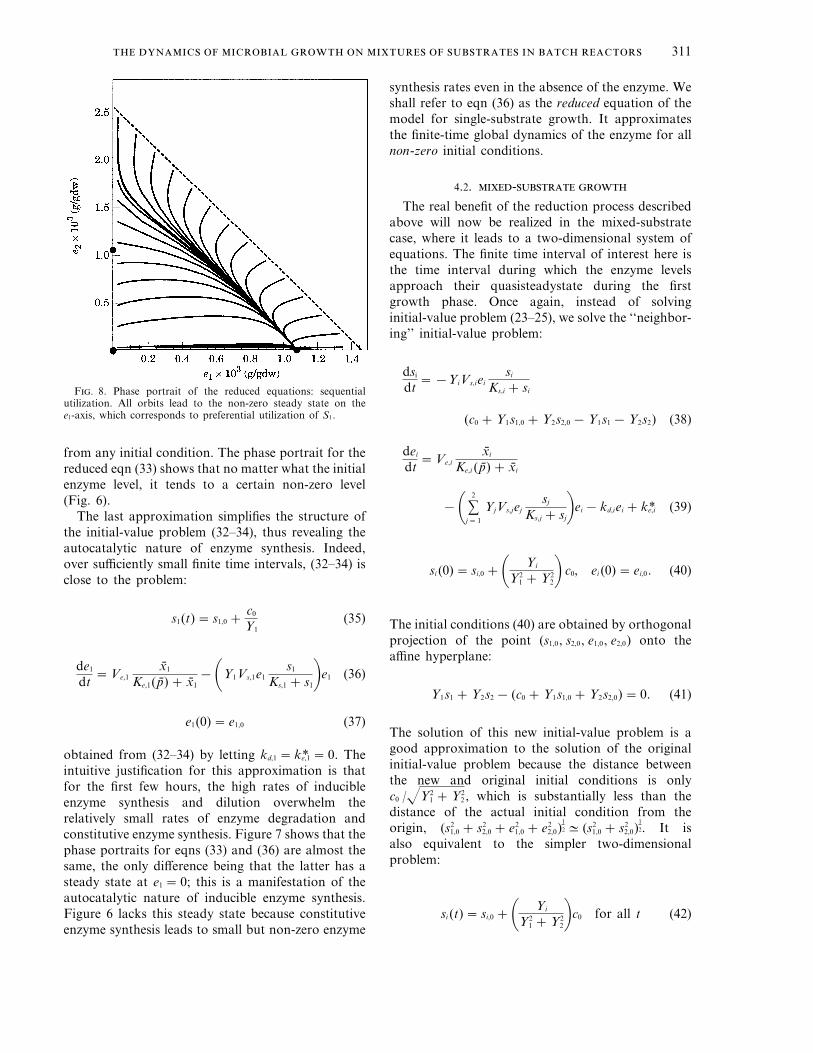
F. 8. Phase portrait of the reduced equations: sequentialutilization. All orbits lead to the non-zero steady state on thee1-axis, which corresponds to preferential utilization of S1.
synthesis rates even in the absence of the enzyme. Weshall refer to eqn (36) as the reduced equation of themodel for single-substrate growth. It approximatesthe finite-time global dynamics of the enzyme for allnon-zero initial conditions.
4.2. -
The real benefit of the reduction process describedabove will now be realized in the mixed-substratecase, where it leads to a two-dimensional system ofequations. The finite time interval of interest here isthe time interval during which the enzyme levelsapproach their quasisteadystate during the firstgrowth phase. Once again, instead of solvinginitial-value problem (23–25), we solve the ‘‘neighbor-ing’’ initial-value problem:
dsi
dt=−YiVs,iei
si
Ks,i + si
(c0 +Y1s1,0 +Y2s2,0 −Y1s1 −Y2s2) (38)
dei
dt=Ve,i
xi
Ke,i (p)+ xi
−0s2
j=1
YjVs,jejsj
Ks,j + sj1ei − kd,iei + k*e,i (39)
si (0)= si,0 +0 Yi
Y21 +Y2
21 c0, ei (0)= ei,0. (40)
The initial conditions (40) are obtained by orthogonalprojection of the point (s1,0, s2,0, e1,0, e2,0) onto theaffine hyperplane:
Y1s1 +Y2s2 − (c0 +Y1s1,0 +Y2s2,0)=0. (41)
The solution of this new initial-value problem is agood approximation to the solution of the originalinitial-value problem because the distance betweenthe new and original initial conditions is onlyc0 /zY2
1 +Y22 , which is substantially less than the
distance of the actual initial condition from theorigin, (s2
1,0 + s22,0 + e2
1,0 + e22,0)
12 2 (s2
1,0 + s22,0)
12. It is
also equivalent to the simpler two-dimensionalproblem:
si (t)= si,0 +0 Yi
Y21 +Y2
21c0 for all t (42)
from any initial condition. The phase portrait for thereduced eqn (33) shows that no matter what the initialenzyme level, it tends to a certain non-zero level(Fig. 6).
The last approximation simplifies the structure ofthe initial-value problem (32–34), thus revealing theautocatalytic nature of enzyme synthesis. Indeed,over sufficiently small finite time intervals, (32–34) isclose to the problem:
s1(t)= s1,0 +c0
Y1(35)
de1
dt=Ve,1
x1
Ke,1(p)+ x1−0Y1Vs,1e1
s1
Ks,1 + s11e1 (36)
e1(0)= e1,0 (37)
obtained from (32–34) by letting kd,1 = k*e,1 = 0. Theintuitive justification for this approximation is thatfor the first few hours, the high rates of inducibleenzyme synthesis and dilution overwhelm therelatively small rates of enzyme degradation andconstitutive enzyme synthesis. Figure 7 shows that thephase portraits for eqns (33) and (36) are almost thesame, the only difference being that the latter has asteady state at e1 =0; this is a manifestation of theautocatalytic nature of inducible enzyme synthesis.Figure 6 lacks this steady state because constitutiveenzyme synthesis leads to small but non-zero enzyme
. E T A L .312
dei
dt=Ve,i
xi
Ke,i (p)+ xi
−0s2
j=1
YjVs,jejsj
Ks,j + sj1ei − kd,iei + k*e,i (43)
ei (0)= ei,0 (44)
since the initial conditions (40) lie on the affinehyperplane (41), which is invariant under the flowof eqns (38–39). The solution of (42–44) iswell-approximated over the finite time interval ofinterest by the solution of:
si (t)= si,0 +0 Yi
Y21 +Y2
21c0 for all t (45)
dei
dt=Ve,i
xi
Ke,i (p)+ xi−0 s
2
j=1
YjVs,jejsj
Ks,j + sj 1ei (46)
ei (0)= ei,0. (47)
These equations will be referred to as the reducedequations of the model for mixed-substrate growth.They approximate the motion of the enzyme levelsfrom any given non- zero initial levels (e1,0, e2 0),e1,0, e2,0 $ 0, to their quasisteadystate values duringthe first growth phase.
We are now ready to show that there is nothingspecial about the initial physiological state,
(xi,0, p0, ei,0), chosen for the simulations depicted inFigs 2 and 3. The enzyme levels approach the samevalues during the first growth phase, no matter whatthe choice of (xi,0, p0, ei,0).
Figure 8 shows the phase portrait for the reducedequations obtained when the parameter values arethe same as those used to simulate sequentialutilization in Fig 2. The phase portrait contains threeaxial steady states, only one of which is stable,namely, the non-zero steady state on the e1-axis. Allorbits in Fig. 8 approach this stable steady state. Sincee2 =0 on this steady state, this corresponds topreferential utilization of S1 during the first growthphase.*
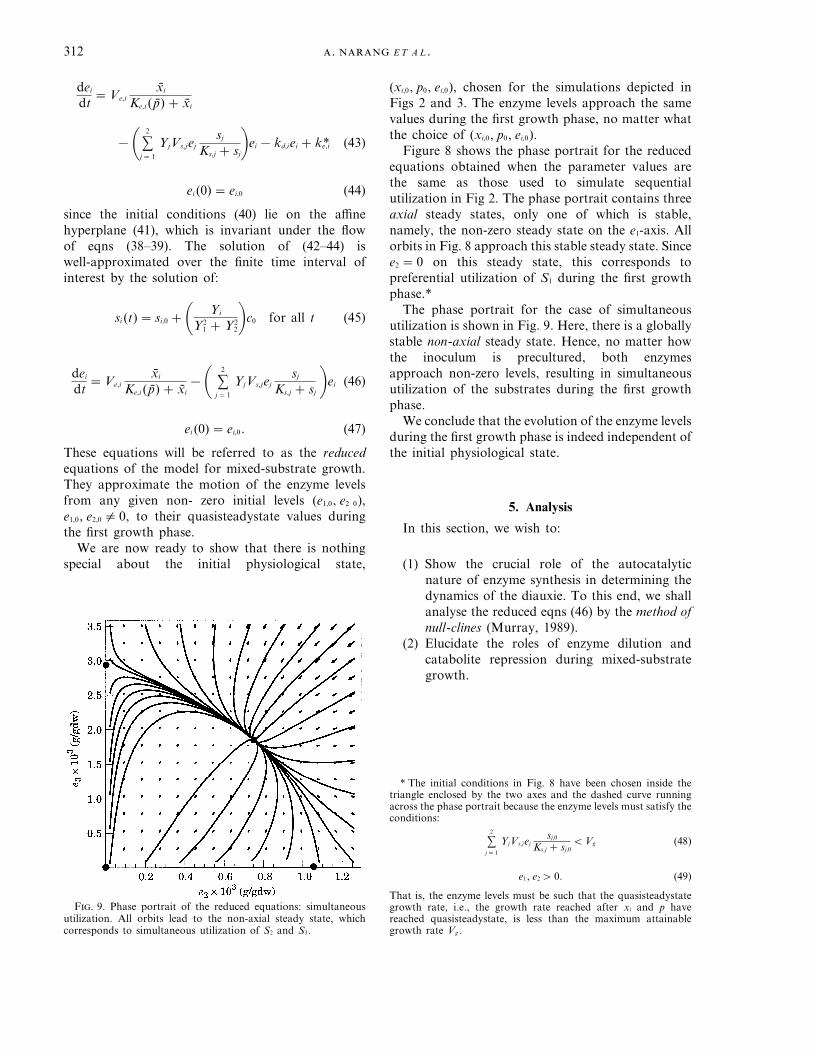
The phase portrait for the case of simultaneousutilization is shown in Fig. 9. Here, there is a globallystable non-axial steady state. Hence, no matter howthe inoculum is precultured, both enzymesapproach non-zero levels, resulting in simultaneousutilization of the substrates during the first growthphase.
We conclude that the evolution of the enzyme levelsduring the first growth phase is indeed independent ofthe initial physiological state.
5. Analysis
In this section, we wish to:
(1) Show the crucial role of the autocatalyticnature of enzyme synthesis in determining thedynamics of the diauxie. To this end, we shallanalyse the reduced eqns (46) by the method ofnull-clines (Murray, 1989).
(2) Elucidate the roles of enzyme dilution andcatabolite repression during mixed-substrategrowth.
F. 9. Phase portrait of the reduced equations: simultaneousutilization. All orbits lead to the non-axial steady state, whichcorresponds to simultaneous utilization of S2 and S3.
* The initial conditions in Fig. 8 have been chosen inside thetriangle enclosed by the two axes and the dashed curve runningacross the phase portrait because the enzyme levels must satisfy theconditions:
s2
j=1
YjVs,jejsj,0
Ks,j + sj,0QVg (48)
e1, e2 q 0. (49)
That is, the enzyme levels must be such that the quasisteadystategrowth rate, i.e., the growth rate reached after xi and p havereached quasisteadystate, is less than the maximum attainablegrowth rate Vg .
313
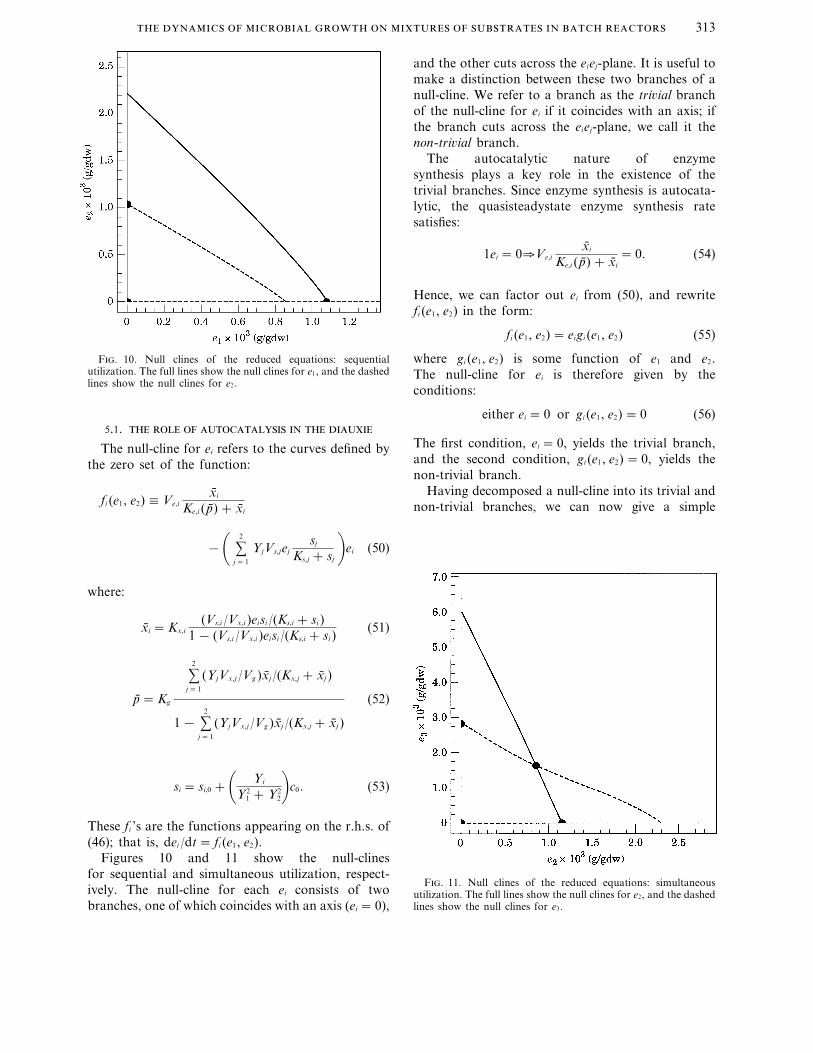
F. 10. Null clines of the reduced equations: sequentialutilization. The full lines show the null clines for e1, and the dashedlines show the null clines for e2.
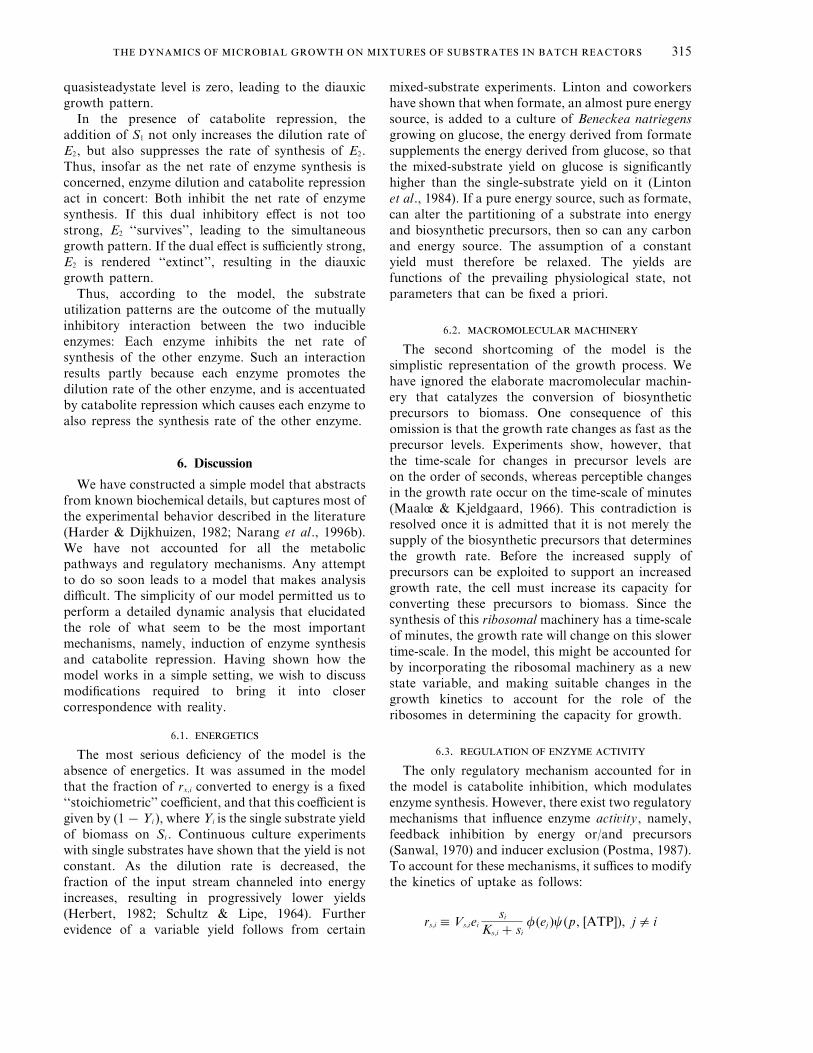
and the other cuts across the eiej-plane. It is useful tomake a distinction between these two branches of anull-cline. We refer to a branch as the trivial branchof the null-cline for ei if it coincides with an axis; ifthe branch cuts across the eiej-plane, we call it thenon-trivial branch.
The autocatalytic nature of enzymesynthesis plays a key role in the existence of thetrivial branches. Since enzyme synthesis is autocata-lytic, the quasisteadystate enzyme synthesis ratesatisfies:
1ei =0cVe,ixi
Ke,i (p)+ xi=0. (54)
Hence, we can factor out ei from (50), and rewritefi (e1, e2) in the form:
fi (e1, e2)= eigi (e1, e2) (55)
where gi (e1, e2) is some function of e1 and e2.The null-cline for ei is therefore given by theconditions:
either ei =0 or gi (e1, e2)=0 (56)
The first condition, ei =0, yields the trivial branch,and the second condition, gi (e1, e2)=0, yields thenon-trivial branch.
Having decomposed a null-cline into its trivial andnon-trivial branches, we can now give a simple
5.1.
The null-cline for ei refers to the curves defined bythe zero set of the function:
fi (e1, e2)0Ve,ixi
Ke,i (p)+ xi
−0 s2
j=1
YjVs,jejsj
Ks,j + sj 1ei (50)
where:
xi =Kx,i(Vs,i /Vx,i )eisi /(Ks,i + si )
1− (Vs,i /Vx,i )eisi /(Ks,i + si )(51)
p=Kg
s2
j=1
(YjVx,j /Vg )xj /(Kx,j + xj )
1− s2
j=1
(YjVx,j /Vg )xj /(Kx,j + xj )
(52)
si = si,0 +0 Yi
Y21 +Y2
21c0. (53)
These fi ’s are the functions appearing on the r.h.s. of(46); that is, dei /dt= fi (e1, e2).
Figures 10 and 11 show the null-clinesfor sequential and simultaneous utilization, respect-ively. The null-cline for each ei consists of twobranches, one of which coincides with an axis (ei =0),
F. 11. Null clines of the reduced equations: simultaneousutilization. The full lines show the null clines for e2, and the dashedlines show the null clines for e3.

. E T A L .314
F. 12. The phase portraits of equation (57): (a) sequential utilization (b) simultaneous utilization. The parameter values are the sameas those in Table 1 except the following: K0
e,1 =3×10⁻⁶ g/gdw, K0e,2 =15×10−6 g/gdw, K0
e,3 =3×10⁻⁶ g/gdw, Vs,1 =1800 g/(gdw-hr),Vs,2 =2500 g/(gdw-hr), Vs,3 =680 g/(gdw-hr), Kx,i =100 K0
e,i , Vx,i =0.01 Vs,i .
characterization of the axial and non-axial steadystates appearing in the phase portraits. The steadystates of the reduced equations are the points ofintersection of the null-clines for distinct enzymes.Axial steady states occur only if the intersection of thenull-clines involves at least one trivial branch (Figs 10and 11). Non-axial steady states occur only if theintersection of the null-clines involves no trivialbranches, i.e., by the intersection of the twonon-trivial null- clines (Fig. 11).
For the diauxie to occur, there must exist an axialsteady state. Such axial steady states exist onlybecause enzyme synthesis is autocatalytic. Indeed,suppose this was not true. Then the null clines for ei
would contain no trivial branches. But axial steadystates are obtained only if the intersection of thenull-clines involves at least one trivial null-cline. Itfollows that if there are no trivial null-clines, there areno axial steady states, and hence, no diauxie.Therefore, insofar as our model is concerned, theautocatalytic nature of inducible enzyme synthesisplays a critical role in capturing the diauxie: Itguarantees the existence of axial steady states.
5.2.
The role of catabolite repression is revealed byconsidering the reduced equations obtained when theeffect of catabolite repression is nullified (Kinh,i 4a):
dei
dt=Ve,i
ei
K0e,iVx,i
Kx,iVs,i+ ei
−0s2
j=1
YjVs,jej1ei (57)
ei (0)= ei,0 (58)
where we have used (20) and the relationKs,i�si,0 + c0Yi /(Y2
1 +Y22 ). These equations are for-
mally similar to the Lotka–Volterra model for twocompeting species (Murray, 1989). It follows that, intheory, the model can capture the substrate utilizationpatterns even in the absence of catabolite repression,although the choice of the parameter values willnecessarily be different (Fig. 12). Thus, the diauxiecan be viewed as ‘‘extinction’’ of one of the enzymes,and simultaneous utilization as ‘‘coexistence’’ of bothenzymes. This result can be intuitively explained asfollows. Suppose a substrate S1 is added to amicrobial culture growing exponentially on asubstrate S2. In the absence of catabolite repression,the addition of S1 has no influence on the synthesisof E2: In eqn (57), the term accounting for thesynthesis of Ei is independent of ej , j$ i. However,because of the uptake of S1, the growth rate, andhence the dilution rate of E2, increases. Hence, E2
tends toward a lower quasisteadystate level. Ifthe increase in the growth rate is not too large, thelower quasisteadystate level is non-zero, and oneobserves the simultaneous growth pattern. If theincrease in the growth rate is large, the lower
315
quasisteadystate level is zero, leading to the diauxicgrowth pattern.
In the presence of catabolite repression, theaddition of S1 not only increases the dilution rate ofE2, but also suppresses the rate of synthesis of E2.Thus, insofar as the net rate of enzyme synthesis isconcerned, enzyme dilution and catabolite repressionact in concert: Both inhibit the net rate of enzymesynthesis. If this dual inhibitory effect is not toostrong, E2 ‘‘survives’’, leading to the simultaneousgrowth pattern. If the dual effect is sufficiently strong,E2 is rendered ‘‘extinct’’, resulting in the diauxicgrowth pattern.
Thus, according to the model, the substrateutilization patterns are the outcome of the mutuallyinhibitory interaction between the two inducibleenzymes: Each enzyme inhibits the net rate ofsynthesis of the other enzyme. Such an interactionresults partly because each enzyme promotes thedilution rate of the other enzyme, and is accentuatedby catabolite repression which causes each enzyme toalso repress the synthesis rate of the other enzyme.
6. Discussion
We have constructed a simple model that abstractsfrom known biochemical details, but captures most ofthe experimental behavior described in the literature(Harder & Dijkhuizen, 1982; Narang et al., 1996b).We have not accounted for all the metabolicpathways and regulatory mechanisms. Any attemptto do so soon leads to a model that makes analysisdifficult. The simplicity of our model permitted us toperform a detailed dynamic analysis that elucidatedthe role of what seem to be the most importantmechanisms, namely, induction of enzyme synthesisand catabolite repression. Having shown how themodel works in a simple setting, we wish to discussmodifications required to bring it into closercorrespondence with reality.
6.1.
The most serious deficiency of the model is theabsence of energetics. It was assumed in the modelthat the fraction of rx,i converted to energy is a fixed‘‘stoichiometric’’ coefficient, and that this coefficient isgiven by (1−Yi ), where Yi is the single substrate yieldof biomass on Si . Continuous culture experimentswith single substrates have shown that the yield is notconstant. As the dilution rate is decreased, thefraction of the input stream channeled into energyincreases, resulting in progressively lower yields(Herbert, 1982; Schultz & Lipe, 1964). Furtherevidence of a variable yield follows from certain
mixed-substrate experiments. Linton and coworkershave shown that when formate, an almost pure energysource, is added to a culture of Beneckea natriegensgrowing on glucose, the energy derived from formatesupplements the energy derived from glucose, so thatthe mixed-substrate yield on glucose is significantlyhigher than the single-substrate yield on it (Lintonet al., 1984). If a pure energy source, such as formate,can alter the partitioning of a substrate into energyand biosynthetic precursors, then so can any carbonand energy source. The assumption of a constantyield must therefore be relaxed. The yields arefunctions of the prevailing physiological state, notparameters that can be fixed a priori.
6.2.
The second shortcoming of the model is thesimplistic representation of the growth process. Wehave ignored the elaborate macromolecular machin-ery that catalyzes the conversion of biosyntheticprecursors to biomass. One consequence of thisomission is that the growth rate changes as fast as theprecursor levels. Experiments show, however, thatthe time-scale for changes in precursor levels areon the order of seconds, whereas perceptible changesin the growth rate occur on the time-scale of minutes(Maalœ & Kjeldgaard, 1966). This contradiction isresolved once it is admitted that it is not merely thesupply of the biosynthetic precursors that determinesthe growth rate. Before the increased supply ofprecursors can be exploited to support an increasedgrowth rate, the cell must increase its capacity forconverting these precursors to biomass. Since thesynthesis of this ribosomal machinery has a time-scaleof minutes, the growth rate will change on this slowertime-scale. In the model, this might be accounted forby incorporating the ribosomal machinery as a newstate variable, and making suitable changes in thegrowth kinetics to account for the role of theribosomes in determining the capacity for growth.
6.3.
The only regulatory mechanism accounted for inthe model is catabolite inhibition, which modulatesenzyme synthesis. However, there exist two regulatorymechanisms that influence enzyme activity, namely,feedback inhibition by energy or/and precursors(Sanwal, 1970) and inducer exclusion (Postma, 1987).To account for these mechanisms, it suffices to modifythe kinetics of uptake as follows:
rs,i 0Vs,ieisi
Ks,i + sif(ej )c(p, [ATP]), j$ i
. E T A L .316
where f(ej ) and c(p,[ATP]) are suitable functionsdefined to capture the effects of inducer exclusion andfeedback inhibition.
These extensions will enhance the scope of themodel. We note, however, that even though the modelhas been formulated for two carbon and energysources, it applies to any pair of substrates satisfyingidentical nutritional requirements. The problem ofgrowth on, say, two nitrogen sources, such as nitrateand ammonia (Dean & Hinshelwood, 1966, p. 233),is even simpler. Unlike carbon and energy sources,these substrates fulfil exactly one nutritional require-ment. Hence, we do not have to contend with thedistribution of the substrate toward fulfilment ofdifferent nutritional requirements.
7. Conclusions
The key conclusions resulting from this work are:
(1) A simple model accounting only for enzymeinduction and catabolite repression is capableof capturing the preculturing-independentgrowth patterns.
(2) In the process of reducing this model, adynamical interpretation was given to the stateof balanced growth in batch cultures. Itcorresponds to almost the entire Q-phaseshown in Fig. 5.
(3) The autocatalytic nature of inducible enzymesynthesis plays a crucial role in mixed-substratedynamics. In particular, it offers a naturalexplanation for the all-or-none type of behav-ior observed during diauxic growth.
REFERENCES
B, R. K. & G, T. K. (1978). An induction-repressionmodel for growth of yeasts on glucose-cellobiose mixtures.Biotechnol. Bioeng. 20, 927–935.
B, D. K. (1985). Kinetics of nutrient-limited transport andmicrobial growth. Microbiol. Rev. 49, 270–297.
D, A. C. R. & H, C. (1966). Growth, Function andRegulation in Bacterial Cells. London: Oxford University Press.
V D, G. & M-Y, M. (1975). A model for diauxicgrowth. Biotechnol. Bioeng. 17, 1301–1312.
E, T. (1995). The ecological and physiological significance of thegrowth of heterotrophic microorganisms with mixtures ofsubstrates. Adv. Microb. Ecol. 14, 797–806.
G, S., V, K., V, W. R. & C-, A. (1978). Modeling the role of cyclic AMP in cataboliterepression of inducible enzyme biosynthesis in microbial cells.Biotechnol. Bioeng. 20, 1797–1815.
H, W. & D, L. (1982). Strategies of mixed substrateutilization in microorganisms. Philos. Trans. R. Soc. London B,297, 459–480.
H, E. & K, W. A. (1978). Kinetics of growth andsubstrate consumption of Escherichia coli M130 on two carbonsources. Z. Allg. Mikrobiol. 18, 415–426.
H, D. (1982). Some principles of continuous culture.In: Recent Progress in Microbiology pp. 381–396. Stock-holm: Proceedings of the International Congress of Micro-biology.
I, T. & A, S. (1976). A kinetic model of cataboliterepression in the dual control mechanism in microorganisms.Biotechnol. Bioeng. 19, 757–764.
I, J. L., N, F. C. & M, O. (1983). Growthof the Bacterial Cell. Sunderland, MA: Frank SinauerAssociates.
K, A. (1967). The tight binding nature of the repressor-operoninteraction J. theor. Biol. 16, 166–186.
K, D. S., R, D., J, N. B. & T, G. T.(1986). Investigation of bacterial growth on mixed substrates:Experimental evaluation of cybernetic models. Biotechnol.Bioeng. 28, 1044–1055.
L, I. H., F, A. G. & T, H. M. (1974). Diauxicgrowth of Propionibacterium shermanii. Appl. Microbiol. 28,
831–835.L, E. C. C. (1987). Dissimilatory pathways for sugars,
polyols, and carboxylates. In: Escherichia coli andSalmonella typhimurium: Cellular and Molecular Biology,Vol. 1, (Neidhardt, F. C., Ingraham, J. L., Low, K. B.,Magasanik, B., Schechter, M. & Umbarger, H. E., eds), chapter18, pp. 244–284. Washington DC: American Society forMicrobiology.
L, J. D., G, K. & G, M. (1984). The effect ofmixtures of glucose and formate on the yield and respiration ofa chemostat culture of Beneckea natriegens. Arch. Microbiol.129, 119–122.
M O. & K, N. O. (1966). Control of Macromol-ecular Synthesis: A Study of DNA, RNA, and Protein Synthesis.New York: W. A. Benjamin.
M, B. (1961). Catabolite represssion. Cold Spring HarborSymp. Quant. Biol. 26, 249–254.
M, J. & MQ, K. (1973). Biochemisty of BacterialGrowth 2nd Edn. pp. 487–488. New York: Wiley.
M, J. (1942). Recherches sur la croissance des culturesbacteriennes. Actualites Scientifique et Industrielles 911,
1–215.M, J. (1947). The phenomenon of enzymatic adaptation and
its bearings on problems of genetics and cellular differentiation.Growth, 11, 223–289.
M, J. D. (1989). Mathematical Biology. BiomathematicsTexts. New York: Springer-Verlag.
N, A., K, A. & R, D. (1996a). Dynamicanalysis of the cybernetic model for diauxic growth. Chem. Eng.Sc., In press.
N, A., K, A. & R, D. (1996b). Newpatterns of mixed substrate growth in batch cultures ofEscherichia coli K12. Submitted for publication in Biotechnol.Bioeng.
P, P. W. (1987). Phosphotransferase system for glucoseand other sugars. In Escherichia coli and Salmonellatyphimurium: Cellular and Molecular Biology. Vol. 1,(Neidhardt, F. C., Ingraham, J. L., Low, K. B., Magasanl,B., Schechter, M. & Umbarger, H. E., eds), chapter 11,pp. 127–141. Washington DC: American Society for Micro-biology.
S, B. D. (1970). Allosteric control of amphibolic pathwaysin bacteria. Bacteriol. Rev. 34, 20–39.
S, K. L. & L, R. S. (1964). Relationship betweensubstrate concentration, growth rate and respiration rate ofEscherichia coli in continuous culture. Arch. Microbiol. 64,
1–20.T, K. (1976). Dual control of invertase biosynthesis in
chemostat culture. Biotechnol. Bioeng. 18, 1117–1124.T, K. (1981). Induction and repression of enzymes in microbial
cultures. J. Chem. Tech. Biotechnol. 31, 775–790.
317
T, K. & Y, I. (1979). Mathematical model of cellgrowth and phosphate biosynthesis in Saccharomyces carlsber-gensis under phosphate limitation. Biotechnol. Bioeng. 21,
487–502.T, H. M., F, A. G. & A, R. (1966).
Dynamics of microbial cell populations. Adv. Chem. Eng. 6,
125–206.Y, G. & Y, E. (1971). On the relation between effector
concentration and the rate of induced enzyme synthesis.Biochem. J. 11, 11–17.