Embed Size (px)
Citation preview

The Effect of Private Tutoring Expenditures on Academic
Performance of Middle School Students: Evidence from the
Korea Education Longitudinal Study
Deockhyun Ryu Changhui Kang†
Department of Economics Department of Economics
Chung-Ang University Chung-Ang University
Seoul, South Korea Seoul, South Korea
† Corresponding address: Department of Economics, Chung-Ang University, 221 Heukseok-Dong Dongjak-Gu,
Seoul 156-756, South Korea; E-mail: [email protected], Phone: +82-2-820-5862, Fax: +82-2-812-9718.

Abstract
In order to shed light on the effectiveness of educational inputs for student outcomes,this paper examines the effect of private tutoring expenditures on academic performanceof middle school students in South Korea. In the face of difficulties in causal estimation,the paper employs IV, first-difference (FD), propensity-score matching and nonparametricbounding methods. We apply these methods to a panel data set from South Korea, theKorea Education Longitudinal Study (KELS). The results show that the true effect of privatetutoring remains at most modest. IV (FD) estimates suggest that a 10 percent increase inexpenditure raises a test score by 0.029 SD or 1.06 percent (a 0.003 SD or 0.122 percent).Matching estimates imply that the same amount of increase in expenditure leads to a 0.21to 0.60 percent higher average test score. The tightest bounds of the effect of tutoring revealthat the same increase in expenditure improves the test score by a low of 0 to a high of 2.03percent, while statistical tests fail to rule out zero effects. Such modest effects of privatetutoring seem fairly comparable to the effects of public school expenditures on test scoresand earnings estimated by previous studies.
JEL Classification : I20, C30Keywords : Private Tutoring, Test Scores, IV, First-difference, Matching, Nonparametric
Bounds, South Korea
2

1 Introduction
The effectiveness of monetary educational expenditures for student academic performance is
one of the most controversial issues in educational research. Papers that summarize the debate
often support conflicting views on the gains from educational investments.
On the one hand, there are a long list of research on the effectiveness of public school ex-
penditures, which yields different conclusions (Betts, 1996; Card and Krueger, 1996; Hanushek,
1986, 1997, 2003; Krueger, 2003). Recent studies based on natural experiments or randomiza-
tion in developing countries continue to reveal conflicting evidence on the effectiveness of public
school inputs (Banerjee et al., 2007; Glewwe et al., 2004, 2007; Jacob and Lefgren, 2004; Lavy
and Schlosser, 2005; Leuven et al., 2007).
On the other hand, studies focusing on private schools (e.g., Catholic schools) do not agree
on the impacts of educational inputs as well (Altonji et al., 2005a, 2005b; Evans and Schwab,
1995; Figlio and Stone, 1999; Goldhaber, 1996; Neal, 1997). Research drawing on private school
voucher experiments in the U.S. and some Latin American countries reveals recent evidence on
impacts of private school attendance (Anand et al., 2009; Angrist et al., 2002; Krueger and Zhu,
2004; McEwan, 2004).
As a third line of research in which the current study also engages, there is a small but
growing literature investigating impacts of private tutoring on students. The studies also have
yet to show unambiguous evidence on causal impacts of private tutoring: Dang (2007), Dang
and Rogers (2008) and Ono (2007) support strong effects of private tutoring; in contrast, Briggs
(2001), Gurun and Millimet (2008) and Kang (2007) document negligible impacts of tutoring
and coaching on education outcomes.
Although informative for furthering our understanding about the effectiveness of educational
investments, recent studies on private tutoring face at least two limitations. First, studies are
based on questionable empirical methods for drawing causal effects of private tutoring. Either
they are based on IVs that are potentially correlated with the outcome, or they fail to explicitly
control for endogeneity of private tutoring.1 Second, the measures of educational outcomes1For example, Dang (2007) relies on a joint Tobit-ordered probit model that involves a fairly complicated
likelihood function whereby an identification of the effect of private tutoring comes from an instrumental variable(IV) of tutoring fees charged by the schools in the commune. As the author admits, such a variable is likelyto proxy for local living standards, which can be directly correlated with a student’s educational outcome. Ono(2007) examines the effect of ronin—spending additional years upon graduation of high school to enter prestigiouscolleges in Japan—on college quality, employing the average quality of colleges within the respondent’s prefecture
1

used by the studies are usually indirect and rough for deep understanding for causal impacts of
private tutoring.2
Given a room for improvement in research and the continuing interests in the effectiveness of
educational inputs for outputs, this paper contributes to the literature by examining the causal
effect of private tutoring expenditures on academic performance of middle school students in
South Korea.3 Sharing the idea of examining the effectiveness of educational inputs by looking
into private tutoring with previous studies, the current study adds to the literature in at least
two dimensions. First, the present study employs a more direct measure of the educational
outcome and more detailed information on private tutoring expenditures than earlier studies
on private tutoring have available. For empirical analysis we rely on a student’s longitudinal
information on test scores of each of three primary academic subjects (Korean, English and
math) and tutoring expenditures for each subject. Using data from the Korean Education and
Employment Panel (KEEP) that has information on overall tutoring expenditures and average
test scores of Korean, English and math subjects, Kang (2007) shows that the true effect of
private tutoring on total scores of college entrance test for high school students (grade 12)
remains at best modest in South Korea. Given his results on the impact of tutoring on twelfth-
graders, we also extend his study by focusing on middle school students in grades 7 to 9, since
impacts of tutoring can vary by the grade level.
Second, in order to overcome endogeneity of tutoring expenditures in estimations, the cur-
rent paper employs four different empirical methods that are frequently used in the recent
treatment effects literature to draw causal estimates: an instrumental variable (IV) method, a
first-difference (FD) method, a propensity-score matching method and a nonparametric bound-
ing method.
In an IV method we rely on whether a student is first-born in the family as an IV for the
of origin as an IV for the ronin status. As in Dang (2007), such a variable can also be related with a respondent’scollege quality as a proxy for unobservable student and family characteristics. Briggs (2001) addresses endogeneityof coaching for standardized admissions tests (SAT or ACT) in the U.S. by means of Heckman’s selection correctionmethods but it is unclear where an identification comes from besides functional form assumptions.
2Dang (2007) employs self-reported academic ranking (poor, average, good and excellent) in school; Ono (2007)the attending college’s mean score of entrance examinations; Gurun and Millimet (2008) whether to attend auniversity. Briggs (2001) and Kang (2007) alone rely on test scores to measure educational outputs— SAT andACT scores in the U.S. and College Scholastic Ability Test (CSAT) in South Korea, respectively.
3In response to a rigid public education system and a lack of independent private schools and in order tosupplement public school education, parents in South Korea spend a great deal of money on private tutoring fortheir children. For an overview of the education system and private tutoring markets in South Korea, see Kang(2007) and Kim and Lee (2001). For an alternative explanation about widespread private tutoring that focuseson the ability-mixing school system of Korea, see Hur and Kang (2007).
2

amount of tutoring expenditures for that student. A rationale behind this idea is that a student’s
first-born status is determined by the nature, while parents usually invest more for the first-
born’s education than for the later-born’s (Black et al. 2005). In an FD method we remove a
student’s unobservable heterogeneity by first-differencing test scores and tutoring expenditures
for a student. A panel structure of the data enables such a longitudinal method.
A propensity-score matching method attempts to construct a counterfactual observation(s)
of the treated observation based on the propensity score (Rosenbaum and Rubin 1983). By
averaging the difference between the treated outcome and counterfactual outcomes for all the
treated observations, the matching method yields causal estimates for the average treatment
effects on the treated (ATT). In the current paper, the treatment is an increasing level of private
tutoring expenditure.
Our fourth method, a nonparametric bounding method, is relatively new and recently gaining
popularity in empirical analysis (Blundell et al., 2007; Gerfin and Schellhorn, 2006; Gonzalez,
2005; Kreider and Pepper, 2007; Lechner, 1999; Manski, 1990, 1997; Manski and Pepper, 2000).
Instead of obtaining point estimates that often rely on questionable assumptions, the bounding
method attempts to calculate the lower and upper bounds of the average treatment effect given
a few weaker assumptions.
We apply such four empirical methods to a panel data set from South Korea, the Korea
Education Longitudinal Study (KELS), that has longitudinal information on private tutoring
expenditures and test scores of three primary subjects (Korean, English and math) for students
of grades 7 to 9. A common finding from the four empirical methods is that the true effect of
private tutoring remains at most modest. IV (FD) estimates suggest that a 10 percent increase
in expenditure raises the average overall score by 0.029 SD or 1.06 percent (0.003 SD or 0.122
percent); matching estimates imply that the same amount of increase in expenditure leads to
a 0.21 to 0.60 percent higher average test score; the tightest bounds of the effect of tutoring
reveal that a 10 percent increase in expenditure improves the average test score by a minimum
of 0 to a maximum of 2.03 percent, while statistical tests fail to rule out zero effects of tutoring.
Our current findings for the effect of private tutoring for middle school students generally agree
with the results of Kang (2007) for high school students in grade 12. There is no compelling
evidence that causal impacts of private tutoring are strong and differ by the grade level of the
student.
3

The rest of the paper is organized as follows. Section 2 outlines the empirical strategy of
the paper. Data are discussed in section 3; empirical results are shown in section 4. Section 5
concludes.
2 Empirical Framework
For empirical analysis we consider a value-added model of educational production function
expressed by:
yit = β0 + yit−1β1 + sitβ2 +Xitβ3 + αi + uit (1)
where yit is the Z-score of student i (i = 1, · · · , N) at year t (t = 2006, 2007) that is normalized
from the raw test score (Yit) to have mean zero and variance one in each grade sample; yit−1 is
a measure of i’s pre-determined academic capability that attempts to control for i’s unobserved
and unmeasured characteristics (e.g., cognitive abilities, motivation, perseverance, etc.); sit is
a logarized value of the average monthly expenditures on i’s tutoring at year t (Sit)4; Xit is
a vector of i’s personal and family backgrounds as well as school characteristics at t; αi is i’s
unobserved and unmeasured characteristics that are left uncontrolled by yit−1; and uit is the
random error term.
Provided that OLS estimates for β2 can be biased due to endogeneity of sit, we employ four
methods that can address the endogeneity problem. First, an IV method follows an idea of
Black et al. (2005, p.695), using an indicator of whether a student is first-born in the family
(Fi) as an IV for sit. A rationale behind this idea is that a student’s birth order is no doubt
determined by the nature, while parents usually invest more for the first-born’s education than
for the later-born’s. Given that Cov(Fi, sit) is usually positive, as also empirically found in the
current study, a key assumption for causal estimation in this method is that Cov(Fi, αi + uit)
is equal to zero. Although Fi per se is given exogenously and there are studies showing little
impact of birth order on a child’s educational outcomes (Retherford and Sewell 1991, Rodgers et
al. 2000), such an assumption may be too strong due to potentially non-zero Cov(Fi, αi), while
we may suppose Cov(Fi, uit) = 0. Even if it is difficult to assume Cov(Fi, αi) = 0, however, our4To deal with a zero spending in the log transformation, a value of 10 is added to every student’s raw value
of tutoring expenditure. The value of 10 is used since it is the smallest accounting unit reported in the survey(W10,000). Whether a smaller value (e.g., 1) is added to every expenditure or the level of raw values is employedrather than the log, the results are qualitatively similar.
4

reading of the literature suggests that there can be a smaller risk in supposing that Cov(Fi, αi)
is positive rather than negative for the following two reasons.
First, papers that report strong, if any, birth order effects usually show negative rather than
positive effects of birth order on intelligence (Bjerkedal et al. 2007, Black et al. 2007, Zajonc 1976,
Zajonc and Mullally 1997). Namely, intelligence of older siblings is either as high or higher than
that of younger siblings on average. It is a well-established empirical regularity that a child’s
high intelligence leads to high academic performance in school (Herrnstein and Murray 1994).
Second, previous empirical studies show that parents favor the first-born over the later-born with
respect to educational investments in general (Behrman and Taubman 1986, Black et al. 2005).
To the extent that parents favor the first-born in monetary educational investments, they will
tend to support the same child more over other educational dimensions as well, say, by providing
better emotional and non-financial supports for the first-born. Provided that Cov(Fi, αi + uit)
is likely to be positive, we can infer that our 2SLS estimates for β2 will overstate causal effects
of private tutoring on test scores rather than understate them. If we find that 2SLS estimates
for β2 fail to be substantially different from zero, for instance, we conclude that private tutoring
does not lead to a substantial improvement of a student’s academic performance.
As a second method of our estimation, we employ an FD method, removing a student’s
time-invariant characteristics by differencing within i. As long as non-zero Cov(Fi, αi) primarily
yields biased estimates for β2, first-differencing is a method that can address an endogeneity
problem in a longitudinal context. To the extent that Cov(sit − sit−1, uit − uit−1) = 0, which is
more justifiable than Cov(sit, αi + uit) = 0 or Cov(Fi, αi + uit) = 0, FD estimates for β2 can
deliver causal estimates for the effect of private tutoring.
The third method of estimation is a propensity-score matching method, which is popular in
recent microeconometric evaluation literature (Heckman et al., 1999; Smith and Todd, 2005).5
For subsequent use, let us discretize the level of tutoring expenditures and define Ti as a treat-
ment indicator that is equal to zero if the average monthly expenditure on tutoring (Si) is equal
to zero; one if it is greater than zero but less than or equal to H1; and two if it is greater than
H1. In empirical analysis below, we set H1 equal to KRW 200,000 (US$195.3) for average over-
all tutoring expenditures for three subjects, KRW 30,000 (US$29.3) for average expenditures5In the matching method as well as the IV method and a bounding method presented shortly, we treat the
data as pooled cross-sectional data.
5

for Korean alone, and KRW 90,000 (US$87.9) for average expenditures for each of English and
math alone.6 Each student receives treatment t ∈ T = {0, 1, 2}. Since there are three discrete
levels of tutoring expenditures in the current estimation, we rely on Lechner (2001) who has
developed general propensity-score matching methods for more than two mutually exclusive
treatments. What follows heavily draws on Larsson (2003) and Lechner (2001, 2002).
Given three different levels of expenditures or treatments ({0, 1, 2}), we denote potential
outcomes by {y0, y1, y2}. For each student, only one outcome can be observable in the data
and the others are counterfactuals. Our evaluation problem is to estimate the average impact
of treatment m compared to treatment l for combinations of m, l ∈ {0, 1, 2} (m > l). More
formally, the outcome of interest is:
θm,l0 = E(ym − yl|T = m) = E(ym|T = m)− E(yl|T = m).
Here, θm,l0 is the multiple-treatment version of the average treatment effect on the treated
(ATT), which denotes the average treatment effect of treatment m relative to treatment l for
participants in treatment m. To the extent that E(ym|T = m) is easily constructed from the
data, matching methods attempt to construct the unobservable counterfactual E(yl|T = m)
under some assumptions. A key assumption employed in the matching literature is the Condi-
tional Independence Assumption (CIA), which states that treatment assignment and potential
outcomes are independent conditional on a set of the individual’s observable characteristics
W ≡ (X, yt−1). With q meaning independence, it is formally expressed as:
y0, y1, y2 q T | W
Extending Rosenbaum and Rubin (1983) into the multiple treatments framework, Lechner
(2001) shows that it is not necessary for matching to condition on multidimensional W but only
to condition on the participation probability conditional on W (the propensity score). Hence,
E(yl|T = m) = EP
m|ml(W )
[E(yl|Pm|ml(W ), T = l) | T = m]
6Such thresholds are arbitrary. As robustness checks, we construct two alternative Ti’s by employing differentvalues as a new threshold between 1 and 2 of Ti. The results based on such thresholds are qualitatively similarto those reported in the current paper. The alternative results are available upon request.
6

where Pm|ml(w) = Pm|ml(T = m|T = l or T = m, W = w).
We employ a matching protocol for the estimation of θm,l0 suggested in Lechner (2001, Table
1) as follows:
Step 1 Estimate the conditional probabilities on the subsample of participants in m and l to
obtain propensity score Pm|ml(w).
Step 2 For a given value of m and l, the following steps are performed:
1. Choose one observation in the subsample defined by participation in m and delete it
from that subsample.
2. Find an observation in the subsample of participants in l that is as close to the one
chosen in step 2.(1) in terms of Pm|ml(w). Do not remove that observation to be
used again.
3. Repeat (1) and (2) until no participant is left in subsample m.
4. Using the matched comparison group formed in (3), compute the sample mean
E(yl|T = m) as an estimate for E(yl|T = m).
Step 3 Repeat step 2 for all combinations of m and l.
Step 4 Compute the estimate of θm,l0 by θm,l
N = E(ym|T = m) − E(yl|T = m). Obtain the
standard error of θm,lN by generating 500 bootstrap samples.7
Along with estimates for ATT, we report the average treatment effect of treatment m relative
to treatment l for a participant drawn randomly from the population (ATE). According to
Lechner (2001), the ATE is calculated as follows:
γm,lN =
2∑j=0
[(E(ym|T = j)− E(yl|T = j)
)· P (T = j)
]
Such an ATE is comparable to the average treatment effects drawn from a bounding method
presented below.
The fourth method of estimation is a nonparametric bounding method that recently receives
attention in empirical analysis. The goal is to calculate the lower and upper bounds of the7A STATA software called PSMATCH2 that was developed by Leuven and Sianesi (2003) is employed for
matching estimations.
7

average treatment effect given a few assumptions. In the following presentation of the method,
we heavily draw on Gonzalez (2005), Kang (2007), Manski (1990) and Manski and Pepper (2000)
among others.
Let us define the response function yi(·) : T → Y , which maps treatments into outcomes.
The realized outcome y ≡ y(z) is the level of y for a student who actually receives treatment
z. The latent outcome y(t) (t 6= z) describes what level of performance the student would have
achieved had he or she received treatment t.
In order to set up bounds for the treatment effects, we first decompose E[y(t)] by
E[y(t)] = E[y|z = t]Pr(z = t) + E[y(t)|z 6= t]Pr(z 6= t) (2)
To make bounds analysis feasible, let us suppose that y is bounded by [K0, K1].8 Since the
unobservable counterfactual E[y(t)|z 6= t] is bounded by [K0, K1], we have the worst-case (WC)
bounds of E[y(t)] given by
E[y|z = t]Pr(z = t) +K0Pr(z 6= t)
≤ E[y(t)] ≤
E[y|z = t]Pr(z = t) +K1Pr(z 6= t)
(3)
In order to further tighten the bounds of E[y(t)], assumptions are introduced below individ-
ually as well as jointly. The first assumption is monotone treatment response (MTR), which is
specified as follows9:
tl < tm −→ y(tl) ≤ y(tm) (4)
Another assumption to be employed is monotone treatment selection (MTS), which is spec-8In fact, however, specific values of K0 and K1 make no difference in our reported results, because the current
paper examines the MTR+MTS and MIV+MTR+MTS bounds alone, which are not a function of K0 and K1.Estimated bounds based on other assumptions are available upon request.
9This assumption is drawn from a theory that there will be non-negative impacts of increased educationalspending on a student’s academic performance. A majority of empirical studies support the validity of such anassumption. Although the exact magnitude of a positive effect of educational spending on a student’s performanceis hardly agreed, it is rare that studies find strong negative impacts of monetary educational investments (seeHanushek (1997, 2003); an exception is a study of Leuven et al. (2007)).
8
ified by10:
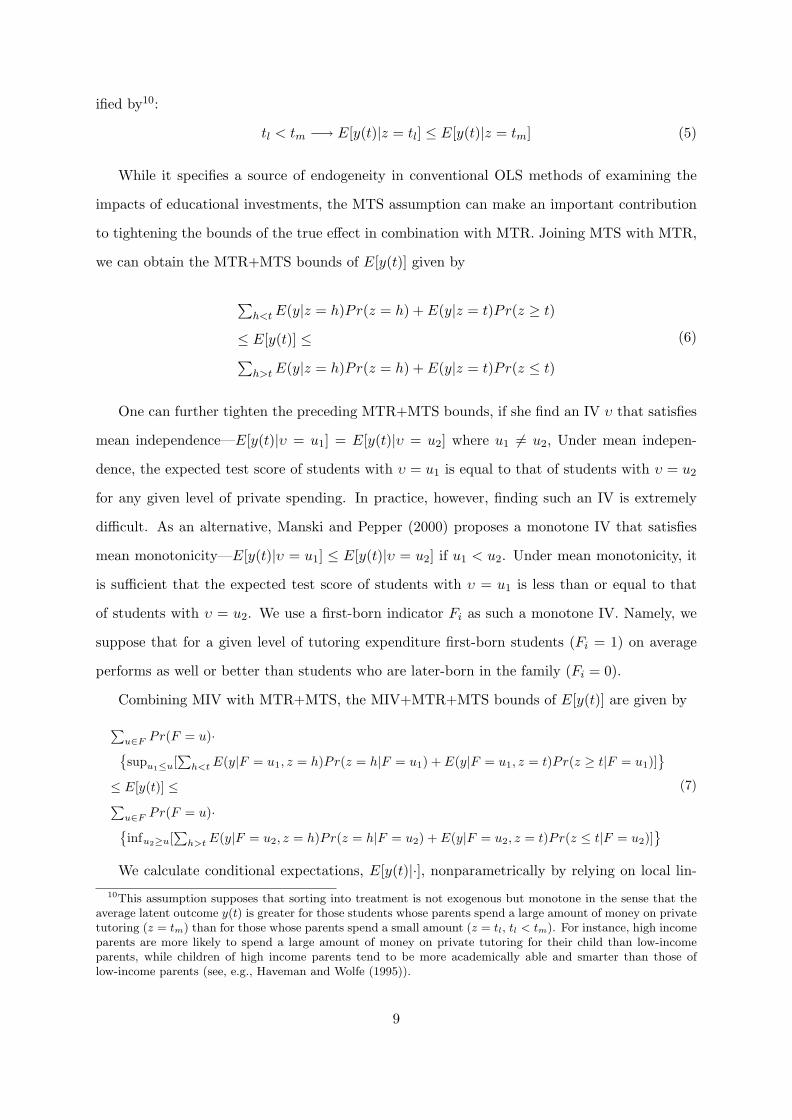
tl < tm −→ E[y(t)|z = tl] ≤ E[y(t)|z = tm] (5)
While it specifies a source of endogeneity in conventional OLS methods of examining the
impacts of educational investments, the MTS assumption can make an important contribution
to tightening the bounds of the true effect in combination with MTR. Joining MTS with MTR,
we can obtain the MTR+MTS bounds of E[y(t)] given by
∑h<tE(y|z = h)Pr(z = h) + E(y|z = t)Pr(z ≥ t)
≤ E[y(t)] ≤∑h>tE(y|z = h)Pr(z = h) + E(y|z = t)Pr(z ≤ t)
(6)
One can further tighten the preceding MTR+MTS bounds, if she find an IV υ that satisfies
mean independence—E[y(t)|υ = u1] = E[y(t)|υ = u2] where u1 6= u2, Under mean indepen-
dence, the expected test score of students with υ = u1 is equal to that of students with υ = u2
for any given level of private spending. In practice, however, finding such an IV is extremely
difficult. As an alternative, Manski and Pepper (2000) proposes a monotone IV that satisfies
mean monotonicity—E[y(t)|υ = u1] ≤ E[y(t)|υ = u2] if u1 < u2. Under mean monotonicity, it
is sufficient that the expected test score of students with υ = u1 is less than or equal to that
of students with υ = u2. We use a first-born indicator Fi as such a monotone IV. Namely, we
suppose that for a given level of tutoring expenditure first-born students (Fi = 1) on average
performs as well or better than students who are later-born in the family (Fi = 0).
Combining MIV with MTR+MTS, the MIV+MTR+MTS bounds of E[y(t)] are given by
∑u∈F Pr(F = u)·{supu1≤u[
∑h<tE(y|F = u1, z = h)Pr(z = h|F = u1) + E(y|F = u1, z = t)Pr(z ≥ t|F = u1)]
}≤ E[y(t)] ≤∑
u∈F Pr(F = u)·{infu2≥u[
∑h>tE(y|F = u2, z = h)Pr(z = h|F = u2) + E(y|F = u2, z = t)Pr(z ≤ t|F = u2)]
}(7)
We calculate conditional expectations, E[y(t)|·], nonparametrically by relying on local lin-10This assumption supposes that sorting into treatment is not exogenous but monotone in the sense that the
average latent outcome y(t) is greater for those students whose parents spend a large amount of money on privatetutoring (z = tm) than for those whose parents spend a small amount (z = tl, tl < tm). For instance, high incomeparents are more likely to spend a large amount of money on private tutoring for their child than low-incomeparents, while children of high income parents tend to be more academically able and smarter than those oflow-income parents (see, e.g., Haveman and Wolfe (1995)).
9

ear regression (Fan 1992) in which the control variable is a logarized value of i’s family income
and E[y(t)|·] is evaluated at its mean value. In section 4 we report estimated bounds under
MTR+MTS and MIV+MTR+MTS assumptions alone, suppressing those under other assump-
tions for a terse presentation. Given the bounds of E[y(t)] under varying assumptions, the lower
bound (LB) of an average treatment effect (ATE), E[y(tm) − y(tl)] (tm > tl), is calculated by
the difference between the lower bound of E[y(tm)] and the upper bound of E[y(tl)]; the upper
bound (UB) of ATE is obtained by the difference between the upper bound of E[y(tm)] and the
lower bound of E[y(tl)]. Along with the bounds of ATEs are calculated bootstrap 5th and 95th
percentiles of the lower and upper bound, respectively. The interval between these percentiles
shows a conservative 90% confidence interval for the true effect of private tutoring. The number
of the bootstrap samples is 50.
3 The Data - The Korea Education Longitudinal Study (KELS)
3.1 Description of the Main Sample
For empirical analysis the current study employs the Korea Education Longitudinal Study
(KELS). KELS is an annual longitudinal survey that is conducted from year 2005 by the Ko-
rea Educational Development Institute (KEDI)—a government-funded research institute. The
basic structure of KELS follows the National Educational Longitudinal Studies (NELS 88 and
ELS:2002) of the U.S.
The beginning cohort of KELS consists of 6,908 students in grade 7—the first year of middle
school in Korea—in 2005. The sample of the students and schools is drawn by a stratification
method to reflect the national population of 703,914 seventh graders in 2,929 middle schools.
More specifically, at first 150 schools are selected nationwide in consideration of the regional
distribution of schools and students. In each school 50 students are drawn at random, while all
students are drawn if the school is attended by less than 50 students. Each of the sampled stu-
dents is administered a series of personal, family and school-related questionnaires. In addition,
students’ homeroom teachers, school principals and parents are separately surveyed to collect a
range of background information on the sampled student.
In each wave of KELS student academic performance is measured by achievement tests for
three subjects: Korean, English and mathematics. The test score of each subject is scaled
10

from 0 (lowest) to 100 (highest). In the subsequent analysis the raw score of each subject is
normalized to have mean zero and variance one. In addition, we calculate a simple average of
the three subject scores—or two subject scores if only two are available. This average score is
also normalized to have mean zero and variance one.
Another important feature of the KELS data is the availability of detailed information on
a student’s private tutoring experience and tutoring expenditures by parents, and the sibling
composition from the parent questionnaire. It enables us to construct main explanatory variables
and the (monotone) instrumental variable of this study. As regards private tutoring for a
student, the parents are asked to report monthly average expenditures on private tutoring
for each subject of Korean, English and math during the survey year. Such expenditures are
reported not only for each subject, but for each type of tutoring methods, such as tutoring in
hakwons (private tutoring institutions), tutoring by individual tutors, tutoring via the Internet
and the broadcasting media, etc. Our measure of private tutoring expenditures is an overall
sum of expenditures for all these types. In the analysis we use either total expenditures on three
subjects as a whole, or expenditures on each subject.
For the current study we employ the first three waves (years 2005 to 2007) of KELS. Since
the test scores of the first wave are employed as a measure of a student’s pre-determined quality
(yt−1), we use test scores and information of the students collected in waves 2 and 3 more
extensively. In the raw samples, there are 6,538 and 6,310 valid test scores of the students
in waves 2 and 3, respectively. After removing observations that have missing values for the
variables used in regressions, we secure a total of 9,461 valid observations from 5,425 individual
students for further analysis. 50.4 percent of the observations are drawn from wave 2; the
remainder is from wave 3. Descriptive statistics of the analysis sample are documented in Table
1.
INSERT TABLE 1 HERE.
3.2 Descriptive Statistics
The mean raw score of Korean, English and math is 59.7, 56.5 and 52.5, respectively. The
mean of the average raw score of the three subjects is 56.2. Here, differences in the number of
observations across subjects are due to slightly different degrees of score availability. Since the
11

average score is calculated on the basis of two or three subject scores, the number of observations
is the largest for the average score, while it is smaller for the individual subject scores. The
same is true for tutoring expenditures and prior scores (yt−1) in the table.
If we compare test scores by birth order, the mean scores of Korean, English and math
among the first-born significantly exceed those of the later-born students. And the mean of the
average raw score is also significantly greater for the first-born (58.5) than for the later-born
(53.9). Yet, it is not clear whether these differences between the two groups are causally created
by variations in tutoring expenditures.
As for private tutoring expenditures, parents spend more on tutoring for the first-born than
for the later-born. While the overall average monthly spending on private tutoring is about
W178,900—approximately $174.6, the average spending for the first-born (W200,400) is 27
percent greater than that for the later-born (W157,400). This amount of gap is significantly
different from zero. The proportion of those who have received private tutoring—those with
positive average monthly spending—is also far higher among the first-born (72.3 percent) than
among the later-born (62.7 percent).
When tutoring experiences are subdivided into each of the three individual subjects, English
and math are primary subjects of private tutoring. While parents spend a monthly average of
W32,700 for Korean tutoring on average, they expend more than twice as much for each of En-
glish (W79,460) and math (W80,340) tutoring. For each subject, parents expend a significantly
greater amount on tutoring for the first-born than for the later-born.
Besides in terms of current academic performance and tutoring expenditures, the first-born
students have a pre-determined quality significantly greater than the later-born. If we proxy a
student’s pre-determined quality by the test score of the year before, the mean of the average
score as well as that of individual subject scores are significantly higher for the first-born than
for the later-born. The mean of the raw average score of the three subject is 61.25 (0.186 in
normalized Z-score) for the first-born and 56.83 (−0.040 in Z-score) for the later-born. The
pattern that the first-born have a better pre-determined quality than the later-born remains
same if the mean of each subject score is employed. In addition, weekly hours of self-study
excluding private tutoring hours are also greater for the first-born than for the later-born.
If we examine other variables, the first-born tend to have background characteristics more
favorable for academic performance than the later-born. For example, the first-born enjoy a
12
smaller sibling size in the family and greater average education level and income of the parents
than the later-born. The preceding comparisons of variables between the first-born and the
later-born cast doubt on the validity of the exogenous IV assumption; rather it supports the
validity of the mean monotonicity assumption. To the extent that mean monotonicity holds,
we can draw some useful information about the causal effect of private tutoring expenditures
from 2SLS estimations as well as from the bounding estimations.
4 Estimation Results
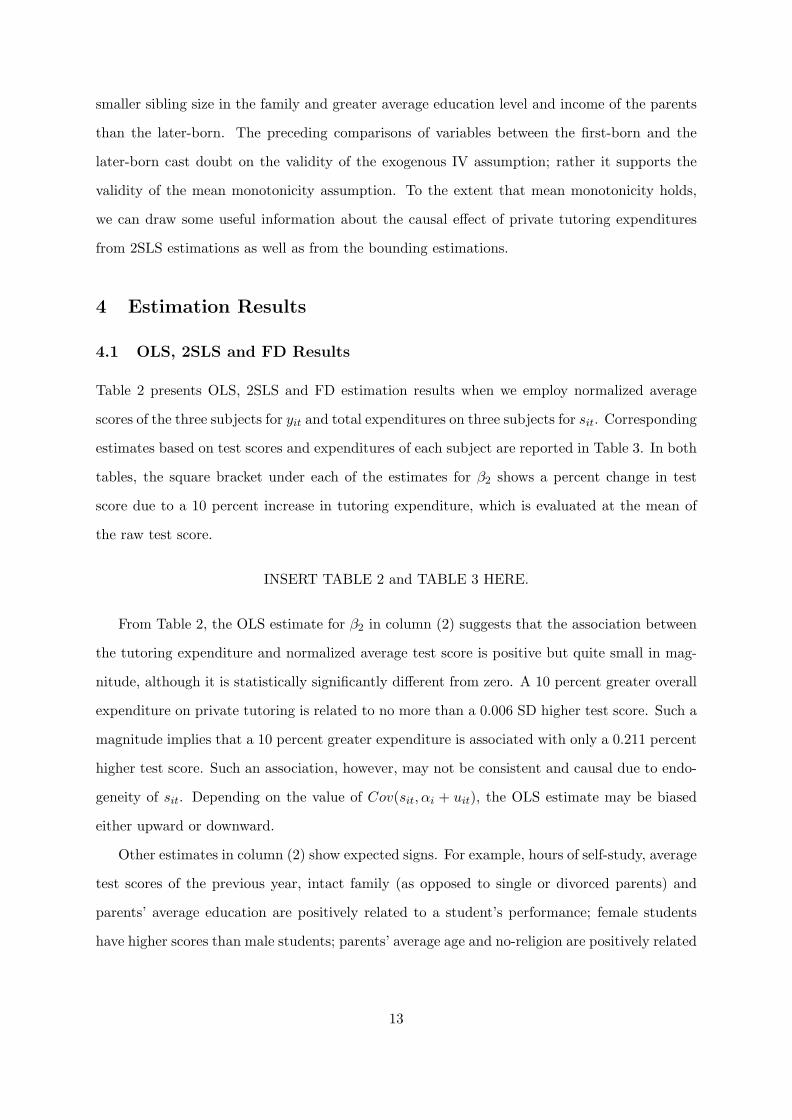
4.1 OLS, 2SLS and FD Results
Table 2 presents OLS, 2SLS and FD estimation results when we employ normalized average
scores of the three subjects for yit and total expenditures on three subjects for sit. Corresponding
estimates based on test scores and expenditures of each subject are reported in Table 3. In both
tables, the square bracket under each of the estimates for β2 shows a percent change in test
score due to a 10 percent increase in tutoring expenditure, which is evaluated at the mean of
the raw test score.
INSERT TABLE 2 and TABLE 3 HERE.
From Table 2, the OLS estimate for β2 in column (2) suggests that the association between
the tutoring expenditure and normalized average test score is positive but quite small in mag-
nitude, although it is statistically significantly different from zero. A 10 percent greater overall
expenditure on private tutoring is related to no more than a 0.006 SD higher test score. Such a
magnitude implies that a 10 percent greater expenditure is associated with only a 0.211 percent
higher test score. Such an association, however, may not be consistent and causal due to endo-
geneity of sit. Depending on the value of Cov(sit, αi + uit), the OLS estimate may be biased
either upward or downward.
Other estimates in column (2) show expected signs. For example, hours of self-study, average
test scores of the previous year, intact family (as opposed to single or divorced parents) and
parents’ average education are positively related to a student’s performance; female students
have higher scores than male students; parents’ average age and no-religion are positively related
13

to test scores. The number of children, being handicapped and family income, however, fail to
show strong associations with academic performance.
The first-stage results of the 2SLS regression of tutoring expenditures on the IV and explana-
tory variables are presented in column (1) of Table 2. As expected, being first-born significantly
increases private tutoring expenditures for a student. First-born students receive on average
a 17.6 percent greater expenditure on tutoring than later-born students. Such an amount is
significantly different from zero. According to Stock et al. (2002), Fi is a strong IV for tutoring
expenditures for a student, since the F-statistic for the IV (32.97) greatly exceeds proposed
thresholds of weak IVs (e.g., 16.38).
The 2SLS estimates for equation (1) are shown in column (3) of Table 2. The estimate for
β2 suggests that a 10 percent increase in expenditure enhances a student’s performance by 0.029
SD. Evaluated at the mean value of the test score, such an estimate implies that a 10 percent
increase in expenditure raises the average test score by 1.06 percent. Although the estimate is
significantly different from zero, the magnitude of the effect of private tutoring does not seem
to be large. Such a magnitude is much smaller than the amount of improvement in test score
(2.8 to 3.6 percent) due to a 10 percent increase in per-pupil expenditure suggested by Krueger
(2003). It is more analogous to the effect sizes suggested by Guryan (2003) in terms of test
scores (0.77 to 1.15 percent), and by Card and Krueger (1996) and Grogger (1996) in terms
of labor market earnings (0.7 to 1.1 percent). Furthermore, to the extent that there exists a
potentially positive rather than negative correlation between Fi and αi as is implied by the mean
monotonicity assumption, our 2SLS estimate is more likely to even overstate the true effect of
private tutoring rather than understate it.
A weak effect of private tutoring is also found in the FD estimation. The estimate in column
(4) suggests that a 10 percent increase in expenditure leads to nothing but a 0.003 SD (or 0.122
percent) higher average test score. In sum, the 2SLS and FD estimates suggest small (or modest
at best) effects of private tutoring on academic performance. Our current findings for the effect
of private tutoring for middle school students are in line with the results that Kang (2007) finds
for high school students in grade 12.
If we disaggregate tutoring expenditures and test scores by the subject, the patterns of weak
effects of private tutoring changes little. In Table 3, 2SLS estimates suggest that a 10 percent
increase in expenditure raises each test score of Korean, English and math by a 3.14, 1.25, and
14

1.28 percent, respectively. As explained earlier, such estimated effects are likely to be overes-
timates rather than underestimates of the effect of private tutoring, however. While the 2SLS
estimate of β2 for Korean implies a non-negligible effect of tutoring, the FD estimate suggests
a negligible effect of it. Similar patterns hold for English and math subjects. The FD estimates
suggest that a 10 percent rise in expenditure increases each test score of Korean, English and
math by mere 0.14, 0.12, and 0.22 percent, respectively. Moreover, such FD estimates are fairly
precise as shown by small standard errors of the estimates.
4.2 Results of the Matching Method
Table 4 shows the estimation results of the matching method for the average score of the
three subjects as well as for each subject score. The estimates of average treatment effects on
the treated (θm,lN , ATT) are reported in columns (1) to (3); average treatment effects (γm,l
N ,
ATE) in columns (4) to (6). The elasticities of ATT and ATE that show a percent change in
test score due to a 10 percent increase in expenditure are presented below the ATT and ATE
estimates, respectively. The elasticity for ATT (and that for ATE analogously) is calculated by
the following formula:
10×θm,lN × SD × E(Si|t = m)
Sml × E(Yi|t = m)(8)
where SD is a standard deviation of the raw test score before normalization (Y )—20.7 for
overall average, 19.7 for Korean, 25.6 for English, and 25.4 for math; θm,lN is an estimated ATT
of E[ym − yl|T = m]; and Sml ≡ E(Si|t = m) − E(Si|t = l) (m > l; m, l = 0, 1, 2). Since
different treatment levels represent different expenditure levels, elasticities rather than ATT or
ATE estimates are a better measure of comparison. We will focus on the elasticities of ATE
estimates rather than those of ATT estimates, since the former are comparable to those obtained
in the bounding analysis.
INSERT TABLE 4 HERE.
Using the matching method, we also fail to find compelling evidence that an increase in
tutoring expenditure yields strong positive causal impacts on the test scores. As regards the
average score of the three subjects, the elasticities imply that a 10 percent increase in tutor-
ing expenditure raises the average test score by a 0.21 to 0.60 percent, depending on where
15

the effect is evaluated. When tutoring expenditures and test scores are disaggregated by the
subject, similar patterns emerge. While the estimates are less precise, a 10 percent increase in
expenditure for Korean tutoring raises the Korean test score by a 0.20 to 0.25 percent. Tutoring
for English and math seems to be a bit more effective but the effect sizes are analogous to the
overall effect. A 10 percent increase in expenditure for English (math) tutoring enhances the
test score by a 0.29 to 0.82 (0.69 to 1.02) percent. These estimates are quite precise as shown
by small standard errors of the estimates. Overall, the matching estimates also suggest that
causal impacts of private tutoring on the test scores seem to be modest.
4.3 Results of the Bounds Analysis
The estimated bounds of average treatment effects (ATE) of tutoring expenditures are presented
in Table 5. In order to gain perspective, in the right-most two columns of the table, we convert
the upper bound estimate and its 95th percentile into elasticities representing a percent change
in test score due to a 10 percent increase in expenditure. The elasticity is calculated by equation
(8).
INSERT TABLE 5 HERE.
As for the bounding results for the total expenditures and average score of the three subjects
shown in Panel A, it is difficult to conclude that private tutoring strongly improves a student’s
academic performance, whichever ATEs are employed for interpretations. MTR+MTS upper
bounds suggest that a 10 percent increase in expenditure raises a student’s test score at most
by a 1.59 to 2.13, depending on where the effect is evaluated. Since the lower bounds fail to
be significantly greater than zero, however, the estimated bounds do not rule out zero causal
effects, suggesting that the true effect of private tutoring is unlikely to be substantial.
Manski and Pepper (2000, p.1004) suggest an informal method to check the validity of the
joint MTR+MTS hypothesis. Under MTR+MTS, it should be satisfied that E[y|z = u] must
be a weakly increasing function of u, namely,
u′ ≤ u ⇒ E[y|z = u′] = E[y(u′)|z = u′]MTR≤ E[y(u)|z = u′]
MTS≤ E[y(u)|z = u] = E[y|z = u]
(9)
16

To examine the validity of the joint MTR+MTS hypothesis, in Table 6 we present sample
means of E[y(0)], E[y(1)] and E[y(2)] that are calculated nonparametrically as explained in
section 2. In each of the whole and individual subject samples, E[y|z = u] is increasing with u;
hence it seems unlikely that either MTS or MTR is violated.
The tightest MIV+MTR+MTS bounds in Panel A draw a largely similar picture that private
tutoring does not raise a student’s performance substantially. The upper bounds suggest that a
10 percent increase in expenditure improves average test score at most by a 1.52 to 2.03 percent.
The lower bounds, however, fail to rule out zero effects of private tutoring significantly.11
If we examine the bounding results for the expenditure and test score of each individual
subject in Panels B to D of Table 5, the MIV+MTR+MTS bounds also fail to reveal compelling
evidence that private tutoring is strongly effective for raising a student’s performance. While
the upper bounds of the effect of private tutoring drawn for Korean show negligible impacts
of private tutoring, those upper bounds obtained for each of English and math present non-
negligible effects of it. At the largest, a 10 percent increase in expenditure raises an English
test score by a 1.9 to 2.4 percent, and a math test score by a 2.2 to 2.8 percent. Nonetheless,
the lower MIV+MTR+MTS bounds fail to significantly exclude zero effects of tutoring. Hence,
a conservative interpretation would be that there is a lack of evidence that private tutoring
strongly enhances a student’s academic performance of Korean, English and math alike.
To summarize the preceding estimation results, causal impacts of private tutoring on student
academic performance seem to be modest at best. If we take 2SLS, FD and matching estimates
as point estimates of the causal impacts of private tutoring, a 10 percent increase in expenditure
raises the overall average score by 0.12 to 1.06 percent, a Korean subject score by 0.14 to 3.14
percent, a English subject score by 0.12 to 1.25 percent, and a math subject score by 0.22 to
1.3 percent. Moreover, such ranges of the effect of private tutoring in general remain within the
bounds of the ATEs estimated by the nonparametric bounding method.
In order to gain perspective of the effect sizes, Kang (2007) compares the empirical results
of the effects of private tutoring with estimates of the effect of public school expenditures on
student outcomes. Given that our current findings for middle school students are similar to the11Employing a different data set of South Korea (the Korean Education and Employment Panel, KEEP), Kang
(2007) implements a similar bounding method to examine the causal effect of private tutoring expenditures ontest scores. While lower limits of the MIV+MTR+MTS bounds fail to exceed zero, their upper limits suggestthat a 10 percent increase in spending raises a student’s test score by 0.53 to 0.76 percent (Table 6).
17

results of Kang (2007) for high school students in grade 12, his conclusion in general applies
here: the causal effects of private tutoring expenditures on academic test scores are fairly
comparable to the effects of public school expenditures (Betts, 1995; Card and Krueger, 1992,
1996; Grogger, 1996; Guryan 2003), while some estimates of the previous studies are slightly
above our estimated effects of private tutoring expenditures (e.g., Banerjee et al., 2007; Krueger,
1999).
5 Concluding Remarks
In order to shed light on the effectiveness of educational inputs for student outcomes, this paper
examines a relatively unexplored dimension of educational inputs—private tutoring expendi-
tures. In the face of difficulties in causal estimation, the paper employs IV, FD, propensity-score
matching and nonparametric bounding methods. With these methods we show that the true
effect of private tutoring remains modest at best. IV (FD) estimates suggest that a 10 percent
increase in expenditure raises average overall score by 0.029 SD or 1.06 percent (0.003 SD or
0.122 percent); matching estimates imply that the same amount of increase in expenditure leads
to a 0.21 to 0.60 percent higher average test score; the tightest bounds of the true effect of tu-
toring reveal that a 10 percent increase in expenditure improves the average test score by a low
of 0 to a high of 2.03 percent, while statistical tests fail to rule out zero effects of tutoring. Such
modest impacts of private tutoring, however, are fairly comparable to the effects of public school
expenditures on test scores and earnings estimated by previous studies. In addition, our current
findings for the effect of private tutoring for middle school students agree with the results that
Kang (2007) finds for high school students in grade 12. There is no compelling evidence that
causal impacts of private tutoring are strong and differ by the grade level of the student.
Kang (2007) proposes two potential explanations for modest impacts of private tutoring in
South Korea. We believe they also apply to the current context. First, overall quality of teachers
in the private tutoring sector may be responsible for small effects of private expenditures. In
Korea, full-time public school teachers are tenured up to 62 years of age and enjoy the same
employment benefits as government officials. In contrast, contracts of instructors in private
tutoring institutions (hakwons) are usually short-term in nature and fairly unstable as in other
private small firms. This will cause teachers’ quality in the private sector to be worse than
18

that in the public sector. Poor teacher quality does not lead to an improvement in student
performance.
Second, peer pressure among parents may explain the lack of the effect. When private
tutoring is a norm in parents’ peer groups, the decision to invest in children’s tutoring may be
based on a subjective/cultural belief about the effectiveness of private tutoring, or the concern
about their being viewed by the peers as neglectful of children’s education. If the decision about
tutoring is based on peer pressure, small effects of private tutoring will hardly be a big surprise.
Although we suggest a couple of potential explanations about weak impacts of private tutor-
ing in Korea, searching for empirical foundations for such suggestions as well as for alternative
explanations will become a useful undertaking for future research. In addition, while we find
weak effects of private tutoring in Korea, whether similar monetary educational investments
raise student educational outcomes in different countries and contexts also remains to be fur-
ther examined.
References
Altonji, J.G., Elder, T.E., Taber, C.R., 2005a. Selection on observed and unobserved variables:
Assessing the effectiveness of Catholic schools, Journal of Political Economy 113 (1), 151-
184.
Altonji, J.G., Elder, T.E., Taber, C.R., 2005b. An evaluation of instrumental variable strategies
for estimating the effects of Catholic schooling, Journal of Human Resources 40 (4), 791-
821.
Anand, P., Mizala, A., Repetto, A., 2009. Using school scholarships to estimate the effect of
private education on the academic achievement of low-income students in Chile, Economics
of Education Review, forthcoming.
Angrist, J.D., Bettinger, E., Bloom, E., King, E., Kremer, M., 2002. Vouchers for private
schooling in Colombia: Evidence from a randomized natural experiment, American Eco-
nomic Review 92 (5), 1535-1558.
19
Behrman, J.R., Taubman, P., 1986. Birth order, schooling, and earnings, Journal of Labor
Economics 4 (3), S121-S145.
Banerjee, A.V., Cole, S., Duflo, E., Linden, L., 2007. Remedying Education: Evidence from Two
Randomized Experiments in India, Quarterly Journal of Economics, 122 (3), 1235-1264.
Betts, J.R., 1995. Does school quality matter? Evidence from the national longitudinal survey
of youth, Review of Economics and Statistics 77 (2), 231-250.
Betts, J.R., 1996. Is there a link between school inputs and earnings? Fresh scrutiny of an old
literature, In: Burtless, G. (Eds.), Does Money Matter? The Effect of School Resources on
Student Achievement and Adult Success, Brookings, Washington, DC, pp. 141-191.
Bjerkedal, T., Kristensen, P., Skjeret, G.A., Brevik, J.I., 2007. Intelligence test scores and birth
order among young Norwegian men (conscripts) analyzed within and between families
Intelligence 35 (5), 503-514.
Black, S.E., Devereux, P.J., Salvanes, K.G., 2005. The more the merrier? The effect of family
size and birth order on children’s education, Quarterly Journal of Economics 120 (2), 669-
700.
Black, S.E., Devereux, P.J., Salvanes, K.G., 2007. Older and Wiser? Birth Order and IQ of
Young Men, NBER Working Paper 13237.
Blundell, R., Gosling, A., Ichimura, H., Meghir, C., 2007. Changes in the Distribution of Male
and Female Wages Accounting for Employment Composition Using Bounds, Econometrica
75 (2), 323-363.
Briggs, D.C., 2001. The Effect of Admissions Test Preparation: Evidence from NELS:88, Chance
14 (1), 10-18.
Card, D., Krueger, A.B., 1992. Does school quality matter? returns to education and the
characteristics of public schools in the United States, Journal of Political Economy 100 (1),
1-40.
20

Card, D., Krueger, A. B., 1996. School resources and student outcomes: An overview of the liter-
ature and new evidence from North and South Carolina, Journal of Economic Perspectives
10 (4), 31-50.
Dang, H., 2007. The determinants and impact of private tutoring classes in Vietnam, Economics
of Education Review, 26 (6), 683-698.
Dang, H., Rogers, F.H., 2008. How to interpret the growing phenomenon of private tutoring:
human capital deepening, inequality increasing, or waste of resources?, Policy Research
Working Paper Series of The World Bank, No. 4530
Evans, W.N., Schwab, R.M., 1995. Finishing high school and starting college: Do Catholic
schools make a difference?, Quarterly Journal of Economics 110 (4), 941-974.
Fan, J., 1992. Design Adaptive Nonparametric Regression, Journal of of the American Statistical
Association 87, 998-1004.
Figlio, D.N., Stone, J.A., 1999. Are private schools really better?, In: Polachek, S. (Eds.),
Research in Labor Economics, Vol.18, JAI Press, Stamford, Connecticut, pp. 115-140.
Gerfin, M., Schellhorn, M., 2006. Nonparametric bounds on the effect of deductibles in health
care insurance on doctor visits - Swiss evidence, Health Economics 15 (9), 1011-1020.
Glewwe, P., Kremer, M., Moulin, S., Zitzewitz, E., 2004. Retrospective vs. prospective analyses
of school inputs: the case of flip charts in Kenya, Journal of Development Economics 74,
251-268.
Glewwe, P., Kremer, M., Moulin, S., 2007. Many children left behind? Textbooks and test scores
in Kenya, NBER Working Papers No.13300, National Bureau of Economic Research, Inc..
Goldhaber, D.D., 1996. Public and private high schools: Is school choice an answer to the
productivity problem?, Economics of Education Review 15 (2), 93-109.
Gonzalez, L., 2005. Nonparametric Bounds on the Returns to Language Skills, Journal of Ap-
plied Econometrics 20 (6), 771-795.
Grogger, J., 1996. School expenditures and post-schooling earnings: Evidence from High School
and Beyond, Review of Economics and Statistics 78 (4), 628-637.
21

Gurun, A., Millimet, D.L., 2008. Does Private Tutoring Payoff, IZA Discussion Paper No. 3637,
The Institute for the Study of Labor (IZA).
Guryan, J., 2003. Does Money Matter? Estimates from Education Fianance Reform in Mas-
sachusetts, Mimeo.
Hanushek, E.A., 1986. The economics of schooling: Production and efficiency in public schools,
Journal of Economic Literature 24 (3), 1141-1177.
Hanushek, E.A., 1997. Assessing the effects of school resources on student performance: An
update, Educational Evaluation and Policy Analysis 19 (2), 141-164.
Hanushek, E.A., 2003. The failure of input-based schooling policies, Economic Journal 113 (485),
F64-F98.
Haveman, R., Wolfe, B., 1995. The Determinants of Children’s Attainments: A Review of
Methods and Findings, Journal of Economic Literature 33 (4), 1829-1878.
Heckman, J., LaLonde, R., Smith, J., 1999. The Economics and Econometrics of Active Labour
Market Programme, in Ashenfelter, O. and Card, D. (eds.), The Handbook of Labor Eco-
nomics, Volume III.
Herrnstein, R., Murray, C., 1994. The Bell Curve, The Free Press, New York.
Hur, J., Kang, C., 2007. Educational Implications of School Systems at Different Stages of
Schooling, Working Paper, available at
“http://prof.cau.ac.kr/∼ckang/papers/School%20Systems%20at%20different%20levels.pdf”.
Jacob, B.A., Lefgren, L., 2004. Remedial Education and Student Achievement: A Regression-
Discontinuity Analysis, Review of Economics and Statistics, 86 (1), 226-244.
Kang, C., 2007. The Effect of Private Tutoring Expenditures on Academic Performance: Evi-
dence from a Nonparametric Bounding Method, Working Paper, Department of Economics,
National University of Singapore.
Kim, S., Lee, J.-H., 2001. Demand for education and developmental state: Private tu-
toring in South Korea, Social Science Research Network Electronic Paper Collection:
http://ssrn.com/abstract=268284.
22

Kreider, B., Pepper, J.V., 2007. Disability and Employment: Reevaluating the Evidence in Light
of Reporting Errors, Journal of the American Statistical Association 102 (478), 432-441.
Krueger, A.B., 1999. Experimental estimates of education production functions, Quarterly Jour-
nal of Economics 114 (2), 497-532.
Krueger, A.B., 2003. Economic considerations and class size, Economic Journal 113 (485), F34-
F62.
Krueger, A., Zhu, P., 2004. Another look at the New York City school voucher experiment,
American Behavioral Scientist 47, 699-717.
Larsson, L., 2003. Evaluation of Swedish youth labour market programmes, Journal of Human
Resources 38 (4), 891-927.
Lavy, V., Schlosser, A., 2005. Targeted Remedial Education for Underperforming Teenagers:
Costs and Benefits, Journal of Labor Economics, 23 (4), 839-874.
Lechner, J., 1999. Nonparametric bounds on employment and income effects of continuous
vocational training in East Germany, Econometrics Journal 2 (1), 1-28.
Lechner, M., 2001. Identification and Estimation of Causal Effects of Multiple Treatments under
the Conditional Independence Assumption, in Lechner, M., Pfeiffer, F. (eds), Econometric
Evaluation of Labour Market Policies, Heidelberg: Physica/Springer, pp. 43-58.
Lechner, M., 2002. Program Heterogeneity and Propensity Score Matching: An Application to
the Evaluation of Active Labor Market Policies, Review of Economics and Statistics 84 (2),
205-220.
Leuven, E., Lindahl, M., Oosterbeek, H., Webbink, D., 2007. The Effect of Extra Funding for
Disadvantaged Pupils on Achievement, Review of Economics and Statistics 89 (4), 721-736.
Leuven, E., Sianesi, 2003. PSMATCH2: Stata module to perform full Mahalanobis and propen-
sity score matching, common support graphing, and covariate imbalance testing, available
at “http://ideas.repec.org/c/boc/bocode/s432001.html”.
Manski, C.F., 1990. Nonparametric Bounds on Treatment Effects, American Economic Review
80 (2), 319-323.
23

Manski, C.F., 1997. Monotone Treatment Response, Econometrica 65(6), 1311-1334.
Manski, C.F., Pepper, J.V., 2000. Monotone Instrumental Variables, with an Application to the
Returns to Schooling, Econometrica 68 (4), 997-1012.
McEwan, P.J., 2004. The Potential Impact of Vouchers, Peabody Journal of Education 79 (3),
57-80.
Neal, D., 1997. The effects of Catholic secondary schooling on educational achievement, Journal
of Labor Economics 15 (1), 98-123.
Ono, H., 2007. Does examination hell pay off ? A cost-benefit analysis of ”ronin” and college
education in Japan, Economics of Education Review, 26 (3), 271-284.
Retherford, R.D., Sewell, W.H., 1991. Birth order and intelligence: Further tests of the conflu-
ence model, American Sociological Review 56 (2), 141-158.
Rodgers, J.L., Cleveland, H.H., Oord, E. V.D., Rowe, D.C., 2000. Resolving the debate over
birth order, family size, and intelligence, American Psychologist 55 (6), 599-612.
Rosenbaum, P.R., Rubin, D.B., 1983. The Central Role of the Propensity Score in Observational
Studies for Causal Effects, Biometrika 70 (1), 41-55.
Smith, A.S., Todd, P.E., 2005. Does matching overcome LaLonde’s critique of nonexperimental
estimators?, Journal of Econometrics 125 (1-2), 305-353.
Stock, J.H., Wright, J.H., Yogo, M., 2002. A survey of weak instruments and weak identification
in Generalized Method of Moments, Journal of Business and Economic Statistics 20 (4),
518-529.
Zajonc, R.B., 1976. Family configuration and intelligence, Science 192 (4236), 227-236.
Zajonc, R.B., Mullally, P.R., 1997. Birth order reconciling conflicting effects, American Psy-
chologist 52 (7), 685-699.
24

Tab
le1:
Des
crip
tive
Stat
isti
csof
the
Sam
ple
(1)
(2)
Tota
lsa
mple
Fir
st-b
orn
Late
r-b
orn
Diff
eren
ce[(
1)-
(2)]
Vari
able
sN
Mea
nS.D
.M
ean
S.D
.M
ean
S.D
.M
ean
S.E
.T
-valu
e
Aver
age
score
of
thre
ete
sts
9461
56.2
20.7
58.5
20.8
53.9
20.4
4.5
43
0.4
23
10.7
3T
est
score
of
Kore
an
9420
59.7
19.7
61.7
19.5
57.6
19.7
4.0
51
0.4
03
10.0
4T
est
score
of
English
9436
56.5
25.6
59.1
25.6
53.8
25.3
5.2
69
0.5
24
10.0
6T
est
score
of
math
9433
52.5
25.4
54.6
25.5
50.3
25.1
4.3
48
0.5
21
8.3
4T
ota
ltu
tori
ng
exp
endit
ure
s(W
1,0
00)
9461
178.9
226.5
200.4
231.5
157.4
219.4
42.9
74
4.6
37
9.2
7A
ny
tuto
ring
(Yes
=1)
9461
0.6
75
0.4
69
0.7
23
0.4
48
0.6
27
0.4
84
0.0
96
0.0
10
10.0
3T
uto
ring
exp
endit
ure
sfo
rK
ore
an
8594
32.6
860.7
035.8
60.8
29.6
60.5
6.2
23
1.3
08
4.7
6T
uto
ring
for
Kore
an
(Yes
=1)
8594
0.4
25
0.4
94
0.4
68
0.4
99
0.3
82
0.4
86
0.0
86
0.0
11
8.1
1T
uto
ring
exp
endit
ure
sfo
rE
nglish
8799
79.4
6106.7
089.9
112.3
69.1
99.7
20.7
71
2.2
64
9.1
7T
uto
ring
for
English
(Yes
=1)
8799
0.6
58
0.4
75
0.7
11
0.4
53
0.6
04
0.4
89
0.1
07
0.0
10
10.6
5T
uto
ring
exp
endit
ure
sfo
rm
ath
8865
80.3
4110.0
989.6
110.4
71.0
109.0
18.6
71
2.3
30
8.0
1T
uto
ring
for
math
(Yes
=1)
8865
0.6
59
0.4
74
0.7
13
0.4
52
0.6
05
0.4
89
0.1
08
0.0
10
10.7
8P
rior
aver
age
score
9461
0.0
73
0.9
92
0.1
86
0.9
91
-0.0
40
0.9
80
0.2
26
0.0
20
11.1
4P
rior
score
of
Kore
an
9420
0.0
73
0.9
80
0.1
64
0.9
66
-0.0
17
0.9
86
0.1
81
0.0
20
9.0
1P
rior
score
of
English
9452
0.0
64
0.9
97
0.1
74
1.0
04
-0.0
45
0.9
78
0.2
19
0.0
20
10.7
4P
rior
score
of
math
9433
0.0
57
0.9
97
0.1
52
0.9
89
-0.0
37
0.9
96
0.1
89
0.0
20
9.2
3H
ours
of
self
-stu
dy
9461
5.5
87
5.1
61
6.0
07
5.2
85
5.1
67
4.9
99
0.8
41
0.1
06
7.9
5M
ale
(Yes
=1)
9461
0.5
04
0.5
00
0.4
88
0.5
00
0.5
21
0.5
00
-0.0
33
0.0
10
-3.1
8N
um
ber
of
childre
n9461
2.2
14
0.7
09
2.0
03
0.6
51
2.4
26
0.7
00
-0.4
23
0.0
14
-30.4
0H
andic
ap
(Yes
=1)
9461
0.0
35
0.1
84
0.0
38
0.1
91
0.0
32
0.1
76
0.0
06
0.0
04
1.5
7F
irst
-born
(Yes
=1)
9461
0.5
00
0.5
00
1.0
00
0.0
00
0.0
00
0.0
00
1.0
00
Inta
ctfa
mily
(Yes
=1)
9461
0.9
13
0.2
82
0.9
12
0.2
83
0.9
13
0.2
82
0.0
00
0.0
06
-0.0
8P
are
nts
’av
erage
age
9461
42.3
14.0
640.9
13.7
443.7
13.8
9-2
.799
0.0
78
-35.6
7P
are
nts
’av
erage
educa
tion
9461
12.9
02.2
313.1
72.1
212.6
42.3
10.5
36
0.0
46
11.7
8H
ave
religio
n(Y
es=
1)
9461
0.6
85
0.4
64
0.6
74
0.4
69
0.6
96
0.4
60
-0.0
22
0.0
10
-2.3
1F
am
ily
inco
me
(W1,0
00)
9461
3718.9
3095.9
3792.0
3097.6
3645.7
3092.8
146.2
63.6
42.3
0Surv
eyyea
r2007
(Yes
=1)
9461
0.4
96
0.5
00
0.4
95
0.5
00
0.4
98
0.5
00
-0.0
03
0.0
10
-0.3
0Sch
ool
chara
cter
isti
csM
etro
polita
nci
ty(Y
es=
1)
9461
0.4
57
0.4
98
0.4
63
0.4
99
0.4
50
0.4
98
0.0
13
0.0
10
1.3
1M
ediu
mci
ty(Y
es=
1)
9461
0.4
54
0.4
98
0.4
65
0.4
99
0.4
43
0.4
97
0.0
22
0.0
10
2.1
2R
ura
lare
a(Y
es=
1)
9461
0.0
89
0.2
85
0.0
71
0.2
58
0.1
07
0.3
09
-0.0
35
0.0
06
-6.0
0P
riva
tesc
hool
(Yes
=1)
9461
0.2
00
0.4
00
0.1
92
0.3
94
0.2
09
0.4
07
-0.0
17
0.0
08
-2.0
8C
oed
school
(Yes
=1)
9461
0.6
44
0.4
79
0.6
43
0.4
79
0.6
44
0.4
79
-0.0
01
0.0
10
-0.1
1B
oys-
only
school
(Yes
=1)
9461
0.1
82
0.3
86
0.1
68
0.3
74
0.1
97
0.3
97
-0.0
29
0.0
08
-3.6
5G
irls
-only
school
(Yes
=1)
9461
0.1
74
0.3
79
0.1
89
0.3
92
0.1
59
0.3
66
0.0
30
0.0
08
3.8
6L
n(g
rade
size
)9461
5.4
91
0.8
03
5.5
45
0.7
53
5.4
37
0.8
48
0.1
07
0.0
16
6.5
2
25
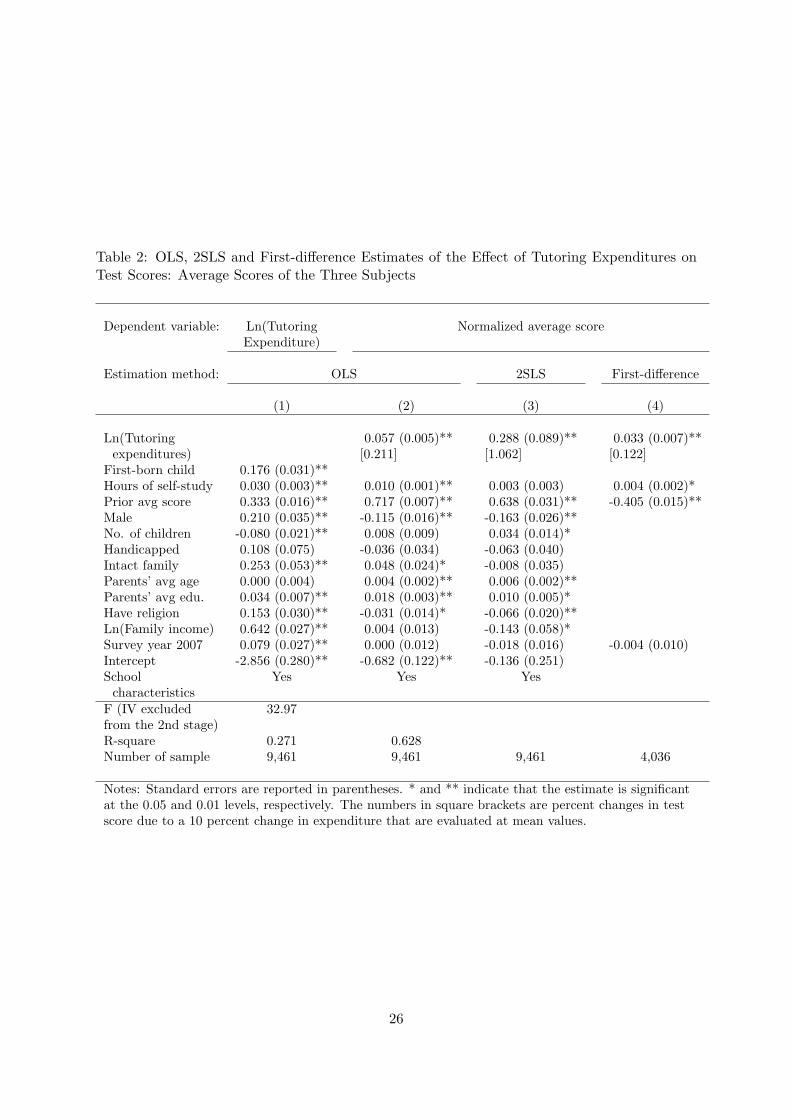
Table 2: OLS, 2SLS and First-difference Estimates of the Effect of Tutoring Expenditures onTest Scores: Average Scores of the Three Subjects
Dependent variable: Ln(Tutoring Normalized average scoreExpenditure)
Estimation method: OLS 2SLS First-difference
(1) (2) (3) (4)
Ln(Tutoring 0.057 (0.005)** 0.288 (0.089)** 0.033 (0.007)**expenditures) [0.211] [1.062] [0.122]
First-born child 0.176 (0.031)**Hours of self-study 0.030 (0.003)** 0.010 (0.001)** 0.003 (0.003) 0.004 (0.002)*Prior avg score 0.333 (0.016)** 0.717 (0.007)** 0.638 (0.031)** -0.405 (0.015)**Male 0.210 (0.035)** -0.115 (0.016)** -0.163 (0.026)**No. of children -0.080 (0.021)** 0.008 (0.009) 0.034 (0.014)*Handicapped 0.108 (0.075) -0.036 (0.034) -0.063 (0.040)Intact family 0.253 (0.053)** 0.048 (0.024)* -0.008 (0.035)Parents’ avg age 0.000 (0.004) 0.004 (0.002)** 0.006 (0.002)**Parents’ avg edu. 0.034 (0.007)** 0.018 (0.003)** 0.010 (0.005)*Have religion 0.153 (0.030)** -0.031 (0.014)* -0.066 (0.020)**Ln(Family income) 0.642 (0.027)** 0.004 (0.013) -0.143 (0.058)*Survey year 2007 0.079 (0.027)** 0.000 (0.012) -0.018 (0.016) -0.004 (0.010)Intercept -2.856 (0.280)** -0.682 (0.122)** -0.136 (0.251)School Yes Yes Yes
characteristicsF (IV excluded 32.97from the 2nd stage)R-square 0.271 0.628Number of sample 9,461 9,461 9,461 4,036
Notes: Standard errors are reported in parentheses. * and ** indicate that the estimate is significantat the 0.05 and 0.01 levels, respectively. The numbers in square brackets are percent changes in testscore due to a 10 percent change in expenditure that are evaluated at mean values.
26

Table 3: OLS, 2SLS and First-difference Estimates of the Effect of Tutoring Expenditures:Individual Subjects
Dependent variable: Ln(Tutoring Normalized test scoreExpenditure)
Estimation method: OLS 2SLS First-difference
(1) (2) (3) (4)
Panel A: Korean
Ln(Tutoring 0.025 (0.008)** 0.851 (0.245)** 0.038 (0.012)**expenditures) [0.092] [3.138] [0.141]
First-born child 0.110 (0.024)**
F (IV) 20.72R-square 0.096 0.415Number of sample 8,520 8,520 8,520 3,296
Panel B: English
Ln(Tutoring 0.084 (0.007)** 0.339 (0.112)** 0.032 (0.010)**expenditures) [0.310] [1.249] [0.117]
First-born child 0.151 (0.025)**
F (IV) 36.57R-square 0.291 0.564Number of sample 8,764 8,764 8,764 3,506
Panel C: Mathematics
Ln(Tutoring 0.111 (0.007)** 0.348 (0.117)** 0.061 (0.011)**expenditures) [0.408] [1.281] [0.223]
First-born child 0.156 (0.025)**
F (IV) 39.10R-square 0.293 0.475Number of sample 8,807 8,807 8,807 3,535
Notes: Other explanantory variables, whose estimates are suppressed here, are same as in Table 2.Standard errors are reported in parentheses. * and ** indicate that the estimate is significant at the0.05 and 0.01 levels, respectively. The numbers in square brackets are percent changes in test scoredue to a 10 percent change in expenditure that are evaluated at mean values.
27

Table 4: Matching Estimates of the Effect of Tutoring Expenditures
Average Treatment Effects Average Treatment Effectson the Treated (ATT) (ATE)
Outcome variables θ1,0N θ2,1
N θ2,0N γ1,0
N γ2,1N γ2,0
N
(1) (2) (3) (4) (5) (6)
A. Average score of 0.128** 0.062 0.170** 0.166** 0.046 0.164**the three subjects (0.030) (0.033) (0.039) (0.024) (0.026) (0.031)
Elasticity: 0.465 0.276 0.546 0.604 0.205 0.528
B. Test score of -0.033 0.060 0.048 0.061 0.061 0.070**Korean (0.052) (0.048) (0.034) (0.041) (0.043) (0.026)
Elasticity: -0.108 0.241 0.152 0.197 0.246 0.222
C. Test score of 0.111** 0.106** 0.226** 0.160** 0.056* 0.217**English (0.034) (0.031) (0.040) (0.026) (0.026) (0.034)
Elasticity: 0.496 0.544 0.858 0.715 0.288 0.823
D. Test score of 0.165** 0.136** 0.230** 0.181** 0.128** 0.253**Mathematics (0.033) (0.038) (0.044) (0.025) (0.030) (0.039)
Elasticity: 0.787 0.736 0.929 0.861 0.693 1.020
Notes: Bootstrap standard errors are reported in parentheses. * and * indicate thatthe estimate is significant at the 0.05 and 0.01 levels, respectively. The elasticitiesare percent changes in test score due to a 10 percent change in expenditure that areevaluated at mean values.
28

Table 5: Estimated Bounds of the Effect of Tutoring Expenditures
LB UB LB UB UB UB5 pctile 95 pctile 95 pctile
Panel A: Average score of the three subjects
MTR+MTS Bounds ElasticityE[y(1)− y(0)] 0.000 0.503 0.000 0.572 1.827 2.077E[y(2)− y(1)] 0.000 0.360 0.000 0.437 1.592 1.936E[y(2)− y(0)] 0.000 0.663 0.000 0.751 2.129 2.411
MIV+MTR+MTS Bounds ElasticityE[y(1)− y(0)] 0.000 0.488 0.000 0.544 1.772 1.977E[y(2)− y(1)] 0.000 0.344 0.000 0.407 1.523 1.802E[y(2)− y(0)] 0.000 0.632 0.000 0.702 2.029 2.255
Panel B: Test score of Korean
MTR+MTS Bounds ElasticityE[y(1)− y(0)] 0.000 0.067 0.000 0.134 0.216 0.432E[y(2)− y(1)] 0.000 0.060 0.000 0.139 0.241 0.559E[y(2)− y(0)] 0.000 0.086 0.000 0.169 0.272 0.536
MIV+MTR+MTS Bounds ElasticityE[y(1)− y(0)] 0.000 0.059 0.000 0.131 0.192 0.422E[y(2)− y(1)] 0.000 0.056 0.000 0.135 0.226 0.544E[y(2)− y(0)] 0.000 0.079 0.000 0.152 0.251 0.483
Panel C: Test score of English
MTR+MTS Bounds ElasticityE[y(1)− y(0)] 0.000 0.486 0.000 0.552 2.173 2.466E[y(2)− y(1)] 0.000 0.381 0.000 0.456 1.950 2.333E[y(2)− y(0)] 0.000 0.662 0.000 0.732 2.511 2.778
MIV+MTR+MTS Bounds ElasticityE[y(1)− y(0)] 0.000 0.474 0.000 0.533 2.117 2.383E[y(2)− y(1)] 0.000 0.371 0.000 0.442 1.899 2.261E[y(2)− y(0)] 0.000 0.639 0.000 0.710 2.426 2.694
Panel D: Test score of Mathematics
MTR+MTS Bounds ElasticityE[y(1)− y(0)] 0.000 0.518 0.000 0.582 2.471 2.777E[y(2)− y(1)] 0.000 0.418 0.000 0.482 2.256 2.603E[y(2)− y(0)] 0.000 0.712 0.000 0.788 2.873 3.178
MIV+MTR+MTS Bounds ElasticityE[y(1)− y(0)] 0.000 0.507 0.000 0.575 2.418 2.745E[y(2)− y(1)] 0.000 0.411 0.000 0.489 2.220 2.644E[y(2)− y(0)] 0.000 0.694 0.000 0.772 2.800 3.114
29

Table 6: Estimated means of E[y(t)]
Sample
Means: Whole Korean English Math
E[y(0)] -0.309 0.072 -0.319 -0.355E[y(1)] 0.119 0.122 0.092 0.085E[y(2)] 0.374 0.160 0.358 0.387
30


![Enriching the Student Model in an Intelligent Tutoring Systemsahanamurthy/students/ramkumar-presentation.pdf · [19] Wayang Out-post Agent to re ect student’s a ec-tive states and](https://img.pdfslide.net/doc/110x75/5d46e0f188c99304028bc4c4/enriching-the-student-model-in-an-intelligent-tutoring-sahanamurthystudentsramkumar-presentationpdf.jpg)