Embed Size (px)
Citation preview

materials
Article
The Effect of a Taper Angle on Micro-CompressionTesting of Mo-B-C Coatings
Lukáš Zábranský 1,* , Katarína Bernátová 1 , Jirí Dluhoš 2 , Rostislav Vána 2, Pavel Soucek 1,Petr Vašina 1 and Vilma Buršíková 1
1 Department of Physical Electronics, Faculty of Science, Masaryk University, Kotlárská 2,CZ–61137 Brno, Czech Republic; [email protected] (K.B.); [email protected] (P.S.);[email protected] (P.V.); [email protected] (V.B.)
2 Tescan Orsay Holding, a.s., Libušina trída 21, CZ–62300 Brno, Czech Republic; [email protected] (J.D.);[email protected] (R.V.)
* Correspondence: [email protected]
Received: 2 June 2020; Accepted: 3 July 2020; Published: 8 July 2020�����������������
Abstract: This research was devoted to studying the influence of the taper angle on themicro-compression of micro-pillars fabricated from near-amorphous and nanocrystalline Mo-B-Ccoatings. A series of micro-pillars with a taper angle between 4–14◦ was fabricated by focused ionbeam technique. The deformation mechanism was found to be dependent on the taper and, also,on the crystallinity of the coating. In order to obtain correct values of yield strength and Young’smodulus, three empirical models of stress correction were experimentally tested, and the resultswere compared with nanoindentation measurements. It was shown that the average stress correctionmodel provided comparable results with nanoindentation for the yield strength for taper angles up to~10◦. On the other hand, the average radius or area model gave the most precise results for Young’smodulus if the taper angle was <10◦.
Keywords: micro-compression; micro-pillars; Mo-B-C coatings; stress-strain; taper angle
1. Introduction
The stress–strain behavior is one of the key factors determining the mechanical properties of solids.When the nanoindentation technique is used, it is very complicated to obtain the stress–strain relationsdue to the constrained flow of material under pressure, leading to a very complex stress field underthe indenter depending on its geometry. Micro-pillar compression [1–3] has emerged as an alternativetechnique to analyze the stress–strain dependency of small-scale volumes. In this modification, thesharp Berkovich tip is replaced by a flat-ended tip to probe small cylindrical volumes (so-calledmicro-pillars) fabricated from the coating to obtain a uniaxial stress–strain behavior, converting themicro-indentation system into a micro-compression system. The micro-pillars are usually fabricatedby focused ion beam (FIB) techniques, and their diameters are typically ranging from ~100 nm up toseveral µm. This technique has already been used to analyze a wide range of materials in either a bulkform or as a thin film [1–8]. However, since this technique is relatively new, there are still no standardsfor evaluation, and there are several important variables, such as the stiffness and height of the substrateas a part of the micro-pillar, the aspect ratio (height of the micro-pillar divided by its diameter), the taperangle (angle between the pillars wall and central axis), etc., that need to be taken into account. It isvery convenient to fix as most of them as possible to avoid any over or under-estimations of calculatedmechanical properties. While it is very time-consuming to prepare a large number of micro-pillarsto study any possible drawbacks of this technique, the finite element modeling (FEM) [9,10] provesto be very useful for finding general rules how to obtain reliable results from the micro-compression
Materials 2020, 13, 3054; doi:10.3390/ma13143054 www.mdpi.com/journal/materials

Materials 2020, 13, 3054 2 of 11
tests. Zhang et al. [9] showed that the aspect ratio in-between 2 and 3 was recommended to eliminatethe buckling of the pillar during its compression and that the micro-compression of a pillar with thetaper angle of ~3◦ resulted in an overestimation of calculated elastic modulus due to taper-inducedspurious hardening. On the other hand, Fei et al. [10] concluded that the Sneddon’s correction for thecompliance [11,12] could be used for obtaining the correct strain for deformation of micro-pillars withhigh or low aspect ratios and with the taper angle up to 5◦, no matter whether the material was plasticor elastic. However, in the stress calculation, it is assumed that the micro-pillar is perfectly uniformthroughout its whole height, which is not true if the taper angle is nonzero. Fei et al. [10] proposedseveral simple stress correction procedures for obtaining the correct stress, although admitting thatthese corrections were just geometrical rather than having a physical meaning.
This study was devoted to experimentally evaluate the usability of empirical stress correctionstheoretically calculated and presented in [10] when applied to micro-compression experiments done tonear-amorphous and nanocrystalline Mo-B-C coatings. The Mo-B-C coatings show a very promisingcombination of high hardness and moderate ductility [13–19] due to their unique microstructure andchemistry. This unusual combination of high hardness and ductility is very demanding in the field ofprotective coatings, and a more detailed study of their mechanical properties at micro and nanoscalecan give a new insight into how the microstructure affects the properties of coatings for which themicro-compression testing is very suitable. The fabrication of the micro-pillars with the perfect shapeis, however, very time-consuming, and each attempt to hasten the process often leads to a highernumber of shape imperfections, such as the nonzero taper angle. Finding a proper way how to obtaincorrect stress during the micro-compression test even for micro-pillars with taper could decrease theexperimental time significantly. In this study, the taper angle was varied in the range between 4◦ and14◦ by changing the parameters of the FIB, and from the micro-compression tests, the stress–strainrelations were obtained. Afterward, Young’s modulus and yield stress were evaluated and correctedby three empirical models. The values of calculated elastic modulus and estimated hardness were thencompared with results obtained by simple quasistatic indentation testing to see which of these threemodels for stress correction could provide the most precise results.
2. Materials and Methods
The Mo-B-C coatings were synthesized by magnetron sputtering of the Mo2BC target.The depositions were carried out using a sputtering system with a cylindrical chamber (ø 50 cm × 50 cm).Prior to the deposition process, all cemented tungsten carbide WC-Co substrates were cleaned in anargon plasma (pressure 0.3 Pa) for 20 min. The rotation of the substrate holder was set to 5 rpm duringthe whole deposition process to ensure good homogeneity of growing films. The deposition pressurewas set to 0.1 Pa for all processes.
Two coatings were selected for this study: MoBCAM (Mo/B/C = 40/30/30 at.%) with near-amorphousmicrostructure and MoBCCR (Mo/B/C = 45/14/41 at.%) with nanocrystalline microstructure. Whilethe MoBCAM sample was prepared by DC (direct current) sputtering (250 W, deposition temperature~50 ◦C) [16] without any bias voltage applied to the substrate holder, the sample MoBCCR wassynthesized using mid-frequency pulsed DC sputtering (also 250 W and deposition temperature~50 ◦C) with a repetition frequency of 350 kHz and off-time of 1 µs and with a bias voltage of –200 V(13.56 MHz). The resulting thickness of the coatings—MoBCCR and MoBCAM—was 1.4 µm and 1.8 µm,respectively. Afterward, the as-deposited MoBCCR sample was subjected to thermal annealing underultra-high vacuum conditions to the final temperature of 1000 ◦C to promote the crystallinity of thecoating. Details of the annealing process are published in [17].
X-ray diffraction was used to determine the microstructure of both selected coatings.The measurements were performed on the Rigaku Smartlab X-ray diffractometer (Rigaku, Tokyo,Japan) with a grazing angle of incidence configuration. The hardness and effective elastic modulus, i.e.,Young’s modulus divided by 1 − ν2, where ν is Poisson’s ratio for the tested material, were obtained bydepth-sensing nanoindentation performed by Hysitron TI950 Triboindenter (Bruker, Billerica, MA,
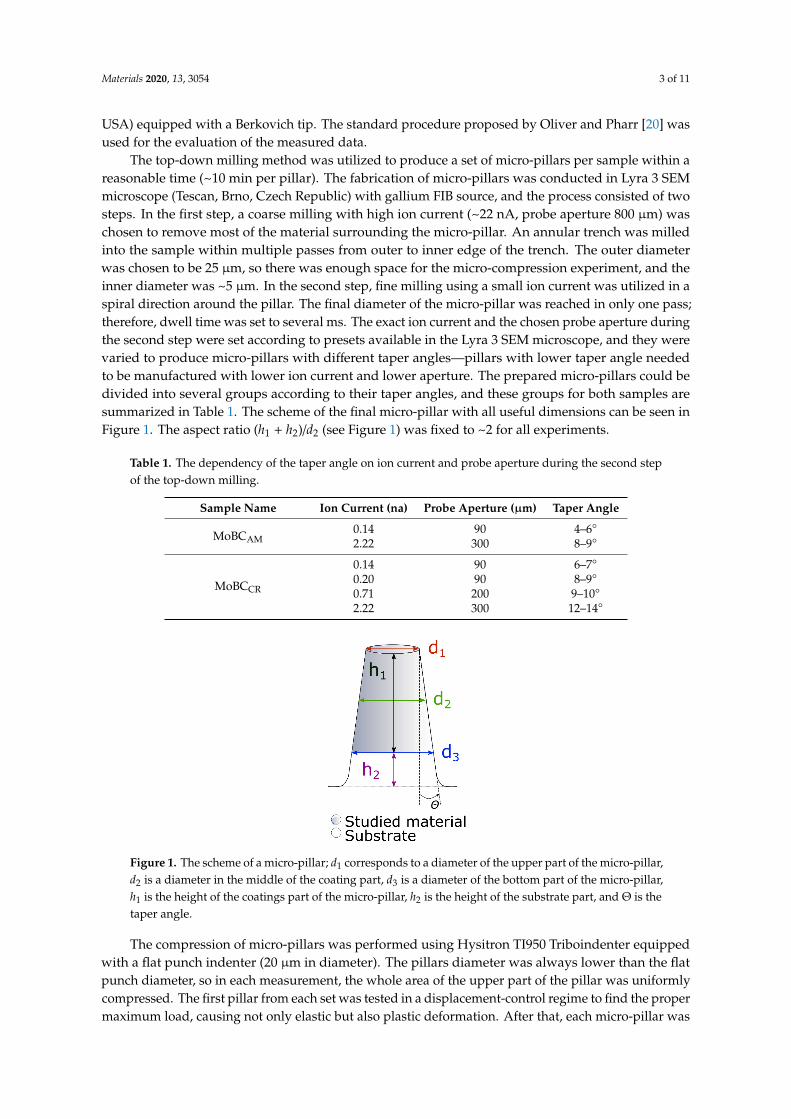
Materials 2020, 13, 3054 3 of 11
USA) equipped with a Berkovich tip. The standard procedure proposed by Oliver and Pharr [20] wasused for the evaluation of the measured data.
The top-down milling method was utilized to produce a set of micro-pillars per sample within areasonable time (~10 min per pillar). The fabrication of micro-pillars was conducted in Lyra 3 SEMmicroscope (Tescan, Brno, Czech Republic) with gallium FIB source, and the process consisted of twosteps. In the first step, a coarse milling with high ion current (~22 nA, probe aperture 800 µm) waschosen to remove most of the material surrounding the micro-pillar. An annular trench was milledinto the sample within multiple passes from outer to inner edge of the trench. The outer diameterwas chosen to be 25 µm, so there was enough space for the micro-compression experiment, and theinner diameter was ~5 µm. In the second step, fine milling using a small ion current was utilized in aspiral direction around the pillar. The final diameter of the micro-pillar was reached in only one pass;therefore, dwell time was set to several ms. The exact ion current and the chosen probe aperture duringthe second step were set according to presets available in the Lyra 3 SEM microscope, and they werevaried to produce micro-pillars with different taper angles—pillars with lower taper angle neededto be manufactured with lower ion current and lower aperture. The prepared micro-pillars could bedivided into several groups according to their taper angles, and these groups for both samples aresummarized in Table 1. The scheme of the final micro-pillar with all useful dimensions can be seen inFigure 1. The aspect ratio (h1 + h2)/d2 (see Figure 1) was fixed to ~2 for all experiments.
Table 1. The dependency of the taper angle on ion current and probe aperture during the second stepof the top-down milling.
Sample Name Ion Current (na) Probe Aperture (µm) Taper Angle
MoBCAM0.14 90 4–6◦
2.22 300 8–9◦
MoBCCR
0.14 90 6–7◦
0.20 90 8–9◦
0.71 200 9–10◦
2.22 300 12–14◦
Materials 2020, 13, x FOR PEER REVIEW 3 of 11
equipped with a Berkovich tip. The standard procedure proposed by Oliver and Pharr [20] was used for
the evaluation of the measured data.
The top-down milling method was utilized to produce a set of micro-pillars per sample within
a reasonable time (~10 min per pillar). The fabrication of micro-pillars was conducted in Lyra 3 SEM
microscope (Tescan, Brno, Czech Republic) with gallium FIB source, and the process consisted of two
steps. In the first step, a coarse milling with high ion current (~22 nA, probe aperture 800 μm) was
chosen to remove most of the material surrounding the micro-pillar. An annular trench was milled
into the sample within multiple passes from outer to inner edge of the trench. The outer diameter
was chosen to be 25 μm, so there was enough space for the micro-compression experiment, and the
inner diameter was ~5 μm. In the second step, fine milling using a small ion current was utilized in a
spiral direction around the pillar. The final diameter of the micro-pillar was reached in only one pass;
therefore, dwell time was set to several ms. The exact ion current and the chosen probe aperture
during the second step were set according to presets available in the Lyra 3 SEM microscope, and
they were varied to produce micro-pillars with different taper angles—pillars with lower taper angle
needed to be manufactured with lower ion current and lower aperture. The prepared micro-pillars
could be divided into several groups according to their taper angles, and these groups for both
samples are summarized in Table 1. The scheme of the final micro-pillar with all useful dimensions
can be seen in Figure 1. The aspect ratio (h1 + h2)/d2 (see Figure 1) was fixed to ~2 for all experiments.
Table 1. The dependency of the taper angle on ion current and probe aperture during the second step
of the top-down milling.
Sample Name Ion Current (na) Probe Aperture (μm) Taper Angle
MoBCAM 0.14 90 4–6°
2.22 300 8–9°
MoBCCR
0.14 90 6–7°
0.20 90 8–9°
0.71 200 9–10°
2.22 300 12–14°
Figure 1. The scheme of a micro-pillar; d1 corresponds to a diameter of the upper part of the micro-
pillar, d2 is a diameter in the middle of the coating part, d3 is a diameter of the bottom part of the
micro-pillar, h1 is the height of the coatings part of the micro-pillar, h2 is the height of the substrate
part, and Θ is the taper angle.
The compression of micro-pillars was performed using Hysitron TI950 Triboindenter equipped
with a flat punch indenter (20 μm in diameter). The pillars diameter was always lower than the flat
punch diameter, so in each measurement, the whole area of the upper part of the pillar was uniformly
Figure 1. The scheme of a micro-pillar; d1 corresponds to a diameter of the upper part of the micro-pillar,d2 is a diameter in the middle of the coating part, d3 is a diameter of the bottom part of the micro-pillar,h1 is the height of the coatings part of the micro-pillar, h2 is the height of the substrate part, and Θ is thetaper angle.
The compression of micro-pillars was performed using Hysitron TI950 Triboindenter equippedwith a flat punch indenter (20 µm in diameter). The pillars diameter was always lower than the flatpunch diameter, so in each measurement, the whole area of the upper part of the pillar was uniformlycompressed. The first pillar from each set was tested in a displacement-control regime to find the propermaximum load, causing not only elastic but also plastic deformation. After that, each micro-pillar was

Materials 2020, 13, 3054 4 of 11
tested using quasistatic load function (5 s loading up to this maximum load, 2 s constant load, and 5 sunloading) in a load-controlled regime up to a maximum load of 11 mN. Sneddon’s formula [10,11] forthe calculation of compliance associated with the deformation of the elastic half-space was used toobtain the strain of the micro-pillar, assuming that the deformations of the indenter and the substratewere given in terms of their compliance. The system was considered a series of springs consisting ofdeformations of the indenter ∆hi, micro-pillar (coating ∆h1 and substrate ∆h2 parts), and the substrate∆hsub. The total strain ∆htot was then given by:
∆htot = ∆hi + ∆h1 + ∆h2 + ∆hsub (1)
The ∆hi and ∆hsub were given by the Sneddon’s relationship:
∆h =
√π·F
(1− ν2
)2× E
√Ap
(2)
where F is the maximum applied force, and E, ν, and Ap are respected Young’s modulus, Poissonratio, and projected area, respectively. The strain of the substrate part of the micro-pillar ∆h2 could beexpressed as:
∆h2 =Fh2
πEs2r32 (3)
where Es is Young’s modulus of the substrate, and r3 is the radius of the substrate part of the micro-pillar(see Figure 1). The Young’s modulus of the coating was calculated from the stress/strain ratio from theunloading part of the load-displacement curve; hence, if micro-pillars were with nonzero taper angle,a correction factor for the stress needed to be included. Three empirical corrections based solely ongeometry were tested within this study [10]:
σ1 =F
12π(r1
2 + r32)(4)
σ2 =F
π( r1+r3
2
)2 (5)
σ3 =F
2π
(1
r12 +
1r32
)(6)
where the σ1 describes a correction based on averaging the area of the micro-pillar, the σ2 uses theaveraged radius, and the σ3 stress correction takes the stress averaged from the top and the bottomparts of a micro-pillar.
3. Results and Discussion
In order to provide a context to the material characterization by compression of micro-pillars,both selected coatings were analyzed by nanoindentation and X-ray diffraction to obtain their hardnessand elastic modulus and to evaluate their microstructure. In Figure 2, we could find X-ray diffractionpatterns for both Mo-B-C coatings. The diffraction maxima corresponding to selected pronouncedMo2BC (COD card no. 5910217) diffractions were plotted with dashed vertical lines for reference.The MoBCAM coatings exhibited a dominant broad peak centered at ~38◦ and second broad peakwith lower relative intensity centered at ~71◦. No well-defined sharp peaks implying a crystallinemicrostructure were observed, and the obtained diffractogram was in accordance with results typicalfor near-amorphous Mo-B-C coatings [16–18]. The diffractogram of the MoBCCR coating showedseveral sharp peaks with relative intensities and positions corresponding well with the referenceMo2BC material. The mean grain size calculated from the observed strongest peak (080), accordingto the Scherrer formula, was ~12 nm. The hardness and effective elastic modulus were obtained by

Materials 2020, 13, 3054 5 of 11
nanoindentation measurements. The near-amorphous coating showed hardness of ~20 GPa and theeffective elastic modulus of ~350 GPa. The crystalline coating showed higher values of both parameters:the hardness of 29 GPa and effective elastic modulus of ~650 GPa, which corresponded to Young’smodulus of 620 GPa, where the Poisson’s ratio was assumed to be 0.26, i.e., the value based on ab-initiocalculations [13].
Materials 2020, 13, x FOR PEER REVIEW 5 of 11
coating showed several sharp peaks with relative intensities and positions corresponding well with
the reference Mo2BC material. The mean grain size calculated from the observed strongest peak (080),
according to the Scherrer formula, was ~12 nm. The hardness and effective elastic modulus were
obtained by nanoindentation measurements. The near-amorphous coating showed hardness of ~20
GPa and the effective elastic modulus of ~350 GPa. The crystalline coating showed higher values of
both parameters: the hardness of 29 GPa and effective elastic modulus of ~650 GPa, which
corresponded to Young’s modulus of 620 GPa, where the Poisson’s ratio was assumed to be 0.26, i.e.,
the value based on ab-initio calculations [13].
20 30 40 50 60 70 800
200
400
600
800
1000
1200
1400
1600
1800
2000in
tensity [a.u
.]
2 [deg]
MoBCAM
MoBCCR
Mo2BC 1
10
13
0
04
1
15
0
08
01
11
13
1
08
1
17
1
20
00
02
19
1
24
1
28
0
Figure 2. Diffractograms of both studied Mo-B-C coatings with Mo2BC reference patterns.
A series of pillars with different taper angles was fabricated from the surface of the MoBCCR and
MoBCAM samples. The typical example of undeformed micro-pillar with the taper angle of ~8° for the
near-amorphous MoBCAM sample is shown in Figure 3a. Figure 3b shows an image of the
corresponding micro-pillar after deformation with the flat punch indenter. We could see that the
deformation led to the formation of several shear bands close to the top of the pillar resembling slip traces
caused by grain boundary sliding in metals [21,22], albeit, in this case, the coatings posed amorphous
microstructure. The sliding mechanism could be explained by the movement of the so-called Somigliana
dislocations observed in metallic glasses [23,24]. Under conditions where deformation of amorphous
material proceeded through shear localization, an emerging shear band might spread by the propagation
of a shear front, which, therefore, represented a kind of dislocation. The stress concentration associated
with the shear front could contribute to shear localization. This type of deformation in the case of the
MoBCAM sample was observed for both measured taper angles of 4–6° and 7–8°.
The type of deformation of micro-pillars for the case of the MoBCCR sample depended
substantially on the taper angle due to the nanocrystalline microstructure. In Figure 4, we could see
images of micro-pillars with different taper angles after compression in a load-controlled regime. The
plastic flow in case of micro-pillars with smaller taper angles (≤7°) was localized in the form of small-
scale shear bands that were similar to those observed in the sample MoBCAM; however, in this case,
the coating was composed of nanosized grains, and, thus, the shearing could be explained by grain
boundary sliding mechanism that is typical for polycrystalline metallic micro-pillars [21,22]. On the
other hand, for higher taper angles in the range between 7° and 12°, the excessive stress
concentrations close to the top of micro-pillars resulted in a higher probability of large-scale localized
specimen failure. In most cases, the entire top part slipped down, leading to subsequent failure of the
whole micro-pillar (see Figure 4b). If the taper angle was higher than 11°, in some cases, the
Figure 2. Diffractograms of both studied Mo-B-C coatings with Mo2BC reference patterns.
A series of pillars with different taper angles was fabricated from the surface of the MoBCCR
and MoBCAM samples. The typical example of undeformed micro-pillar with the taper angle of ~8◦
for the near-amorphous MoBCAM sample is shown in Figure 3a. Figure 3b shows an image of thecorresponding micro-pillar after deformation with the flat punch indenter. We could see that thedeformation led to the formation of several shear bands close to the top of the pillar resemblingslip traces caused by grain boundary sliding in metals [21,22], albeit, in this case, the coatingsposed amorphous microstructure. The sliding mechanism could be explained by the movement ofthe so-called Somigliana dislocations observed in metallic glasses [23,24]. Under conditions wheredeformation of amorphous material proceeded through shear localization, an emerging shear bandmight spread by the propagation of a shear front, which, therefore, represented a kind of dislocation.The stress concentration associated with the shear front could contribute to shear localization. Thistype of deformation in the case of the MoBCAM sample was observed for both measured taper anglesof 4–6◦ and 7–8◦.
Materials 2020, 13, x FOR PEER REVIEW 6 of 11
compression was further accompanied by a crack formation, which occurred by through-thickness
axial splitting [25,26] in the body of micro-pillars (see Figure 4c). The cracking present for the case of
MoBCCR with large taper angles (>11°) was most probably due to the geometry of the micro-pillar
and could not be easily claimed as the typical behavior of the material. For taper angles <11°, no brittle
failure or presence of crack formation in the body of micro-pillars, i.e., typical behavior for ceramic
materials [27], was observed, indicating the expected moderate intrinsic ductility of the Mo-B-C
material.
Figure 3. Comparison of fabricated micro-pillars: (a) MoBCAM undeformed and (b) MoBCAM after
compression.
Figure 4. Images of MoBCCR micro-pillars after deformation, showing different deformation
mechanisms depending on the taper angle: (a) 7° (engineering strain ~0.05), (b) 9° (engineering strain
~0.25), and (c) 12° (engineering strain ~0.10).
The above-mentioned observations for both samples were confirmed by analyzing the stress–
strain relations depending on the taper angle, which are presented in Figure 5. Both studied samples
first exhibited a linear elastic region for lower strains, and after reaching critical stress, the yielding
occurred. The initial part of the elastic region was, however, not precisely linear, which could be
caused by the geometry of the top part of prepared micro-pillars. The top edge was not perfectly sharp;
it was rather slightly rounded, causing some variance in the pillar’s radius. This nonlinear part of stress–
strain relations complicated the later evaluation of Young’s modulus, which had to be extracted from the
unloading curves. The actual value of the yield stress depended on the taper angle—for the increasing
taper angle, the gradual decrease of the yield stress was observed. For the lowest taper angle, we obtained
a compressive yield strength of 10.6 ± 0.7 GPa for the MoBCCR and 5.4 ± 0.5 GPa for the MoBCAM samples.
The yield strength for the crystalline sample was comparable with the yield strength of state-of-the-art
ceramic-based protective coatings [28–30], whereas the resulting yield strength for the amorphous coating
reached values typical for diamond-like carbon coatings [29]. While for the amorphous MoBCAM sample,
Figure 3. Comparison of fabricated micro-pillars: (a) MoBCAM undeformed and (b) MoBCAM
after compression.

Materials 2020, 13, 3054 6 of 11
The type of deformation of micro-pillars for the case of the MoBCCR sample depended substantiallyon the taper angle due to the nanocrystalline microstructure. In Figure 4, we could see images ofmicro-pillars with different taper angles after compression in a load-controlled regime. The plastic flowin case of micro-pillars with smaller taper angles (≤7◦) was localized in the form of small-scale shearbands that were similar to those observed in the sample MoBCAM; however, in this case, the coatingwas composed of nanosized grains, and, thus, the shearing could be explained by grain boundarysliding mechanism that is typical for polycrystalline metallic micro-pillars [21,22]. On the other hand,for higher taper angles in the range between 7◦ and 12◦, the excessive stress concentrations closeto the top of micro-pillars resulted in a higher probability of large-scale localized specimen failure.In most cases, the entire top part slipped down, leading to subsequent failure of the whole micro-pillar(see Figure 4b). If the taper angle was higher than 11◦, in some cases, the compression was furtheraccompanied by a crack formation, which occurred by through-thickness axial splitting [25,26] inthe body of micro-pillars (see Figure 4c). The cracking present for the case of MoBCCR with largetaper angles (>11◦) was most probably due to the geometry of the micro-pillar and could not be easilyclaimed as the typical behavior of the material. For taper angles <11◦, no brittle failure or presenceof crack formation in the body of micro-pillars, i.e., typical behavior for ceramic materials [27], wasobserved, indicating the expected moderate intrinsic ductility of the Mo-B-C material.
Materials 2020, 13, x FOR PEER REVIEW 6 of 11
compression was further accompanied by a crack formation, which occurred by through-thickness
axial splitting [25,26] in the body of micro-pillars (see Figure 4c). The cracking present for the case of
MoBCCR with large taper angles (>11°) was most probably due to the geometry of the micro-pillar
and could not be easily claimed as the typical behavior of the material. For taper angles <11°, no brittle
failure or presence of crack formation in the body of micro-pillars, i.e., typical behavior for ceramic
materials [27], was observed, indicating the expected moderate intrinsic ductility of the Mo-B-C
material.
Figure 3. Comparison of fabricated micro-pillars: (a) MoBCAM undeformed and (b) MoBCAM after
compression.
Figure 4. Images of MoBCCR micro-pillars after deformation, showing different deformation
mechanisms depending on the taper angle: (a) 7° (engineering strain ~0.05), (b) 9° (engineering strain
~0.25), and (c) 12° (engineering strain ~0.10).
The above-mentioned observations for both samples were confirmed by analyzing the stress–
strain relations depending on the taper angle, which are presented in Figure 5. Both studied samples
first exhibited a linear elastic region for lower strains, and after reaching critical stress, the yielding
occurred. The initial part of the elastic region was, however, not precisely linear, which could be
caused by the geometry of the top part of prepared micro-pillars. The top edge was not perfectly sharp;
it was rather slightly rounded, causing some variance in the pillar’s radius. This nonlinear part of stress–
strain relations complicated the later evaluation of Young’s modulus, which had to be extracted from the
unloading curves. The actual value of the yield stress depended on the taper angle—for the increasing
taper angle, the gradual decrease of the yield stress was observed. For the lowest taper angle, we obtained
a compressive yield strength of 10.6 ± 0.7 GPa for the MoBCCR and 5.4 ± 0.5 GPa for the MoBCAM samples.
The yield strength for the crystalline sample was comparable with the yield strength of state-of-the-art
ceramic-based protective coatings [28–30], whereas the resulting yield strength for the amorphous coating
reached values typical for diamond-like carbon coatings [29]. While for the amorphous MoBCAM sample,
Figure 4. Images of MoBCCR micro-pillars after deformation, showing different deformationmechanisms depending on the taper angle: (a) 7◦ (engineering strain ~0.05), (b) 9◦ (engineeringstrain ~0.25), and (c) 12◦ (engineering strain ~0.10).
The above-mentioned observations for both samples were confirmed by analyzing the stress–strainrelations depending on the taper angle, which are presented in Figure 5. Both studied samples firstexhibited a linear elastic region for lower strains, and after reaching critical stress, the yielding occurred.The initial part of the elastic region was, however, not precisely linear, which could be caused by thegeometry of the top part of prepared micro-pillars. The top edge was not perfectly sharp; it was ratherslightly rounded, causing some variance in the pillar’s radius. This nonlinear part of stress–strainrelations complicated the later evaluation of Young’s modulus, which had to be extracted from theunloading curves. The actual value of the yield stress depended on the taper angle—for the increasingtaper angle, the gradual decrease of the yield stress was observed. For the lowest taper angle, weobtained a compressive yield strength of 10.6 ± 0.7 GPa for the MoBCCR and 5.4 ± 0.5 GPa for theMoBCAM samples. The yield strength for the crystalline sample was comparable with the yield strengthof state-of-the-art ceramic-based protective coatings [28–30], whereas the resulting yield strength forthe amorphous coating reached values typical for diamond-like carbon coatings [29]. While for theamorphous MoBCAM sample, a small-scale shearing was observed, the nanocrystalline microstructureof the MoBCCR sample showed large-scale slipping, which was observed for higher taper anglesstarting from ~7◦.

Materials 2020, 13, 3054 7 of 11
Materials 2020, 13, x FOR PEER REVIEW 7 of 11
a small-scale shearing was observed, the nanocrystalline microstructure of the MoBCCR sample showed
large-scale slipping, which was observed for higher taper angles starting from ~7°.
Figure 5. The stress–strain relations depending on the taper angle for (a) MoBCAM and (b) MoBCCR samples.
The obtained stress–strain relations presented in Figure 5 were without any corrections to the
non-zero taper angle. Therefore, the uniform stress was assumed to be present in the whole micro-
pillar during the compression test, which was not correct, especially for higher taper, where this
simplification could lead to underestimation of the yield strength. The comparison of uncorrected
stress–strain relation for the sample MoBCAM (8–9° case) and relations corrected by σ1, σ2, and σ3
models, i.e., averaging the area, radius, or calculated stress at the top and bottom parts of the micro-
pillar, is depicted in Figure 6. The uncorrected data line was also without the Sneddon’s corrections
for the micro-pillar and the substrate, which was the reason for the shift in strain when compared to
corrected data. The corrected data lines for different models differed in stress magnitude
significantly, and the different slope of the unloading curves would generate different Young’s
moduli.
0.00 0.02 0.04 0.06 0.080
2
4
6
8
10
12
14 o uncorrected data
corrected using
corrected using
corrected using
Engin
eering s
tress [G
Pa]
Engineering strain
Figure 6. The comparison of uncorrected stress–strain relation and relations corrected by one of the
three empirical models for the MoBCAM coating.
To find out which correction model fits best for obtaining correct yield strength and Young’s
modulus, the nanoindentation method was used for comparison. The Young’s modulus E and
hardness H were obtained according to the Oliver and Pharr method. The yield strength was
approximated by H/3 [31]. In Figures 7 and 8, the cyan-colored region represents Young’s modulus
and yield strength calculated from the nanoindentation test, where its width was given by the
0.00 0.02 0.04 0.06 0.08 0.100
2
4
6
8
10
12
14
b)
° °
° °
En
gin
ee
ring
str
ess
[G
Pa]
Engineering strain
0.00 0.02 0.04 0.06 0.080
2
4
6
8
10
°
°
Engin
eering s
tress
[G
Pa]
Engineering strain
a)
Figure 5. The stress–strain relations depending on the taper angle for (a) MoBCAM and(b) MoBCCR samples.
The obtained stress–strain relations presented in Figure 5 were without any corrections to thenon-zero taper angle. Therefore, the uniform stress was assumed to be present in the whole micro-pillarduring the compression test, which was not correct, especially for higher taper, where this simplificationcould lead to underestimation of the yield strength. The comparison of uncorrected stress–strain relationfor the sample MoBCAM (8–9◦ case) and relations corrected by σ1, σ2, and σ3 models, i.e., averaging thearea, radius, or calculated stress at the top and bottom parts of the micro-pillar, is depicted in Figure 6.The uncorrected data line was also without the Sneddon’s corrections for the micro-pillar and thesubstrate, which was the reason for the shift in strain when compared to corrected data. The correcteddata lines for different models differed in stress magnitude significantly, and the different slope of theunloading curves would generate different Young’s moduli.
Materials 2020, 13, x FOR PEER REVIEW 7 of 11
a small-scale shearing was observed, the nanocrystalline microstructure of the MoBCCR sample showed
large-scale slipping, which was observed for higher taper angles starting from ~7°.
Figure 5. The stress–strain relations depending on the taper angle for (a) MoBCAM and (b) MoBCCR samples.
The obtained stress–strain relations presented in Figure 5 were without any corrections to the
non-zero taper angle. Therefore, the uniform stress was assumed to be present in the whole micro-
pillar during the compression test, which was not correct, especially for higher taper, where this
simplification could lead to underestimation of the yield strength. The comparison of uncorrected
stress–strain relation for the sample MoBCAM (8–9° case) and relations corrected by σ1, σ2, and σ3
models, i.e., averaging the area, radius, or calculated stress at the top and bottom parts of the micro-
pillar, is depicted in Figure 6. The uncorrected data line was also without the Sneddon’s corrections
for the micro-pillar and the substrate, which was the reason for the shift in strain when compared to
corrected data. The corrected data lines for different models differed in stress magnitude
significantly, and the different slope of the unloading curves would generate different Young’s
moduli.
0.00 0.02 0.04 0.06 0.080
2
4
6
8
10
12
14 o uncorrected data
corrected using
corrected using
corrected using
Engin
eering s
tress [G
Pa]
Engineering strain
Figure 6. The comparison of uncorrected stress–strain relation and relations corrected by one of the
three empirical models for the MoBCAM coating.
To find out which correction model fits best for obtaining correct yield strength and Young’s
modulus, the nanoindentation method was used for comparison. The Young’s modulus E and
hardness H were obtained according to the Oliver and Pharr method. The yield strength was
approximated by H/3 [31]. In Figures 7 and 8, the cyan-colored region represents Young’s modulus
and yield strength calculated from the nanoindentation test, where its width was given by the
0.00 0.02 0.04 0.06 0.08 0.100
2
4
6
8
10
12
14
b)
° °
° °
En
gin
ee
ring
str
ess
[G
Pa]
Engineering strain
0.00 0.02 0.04 0.06 0.080
2
4
6
8
10
°
°
Engin
eering s
tress
[G
Pa]
Engineering strain
a)
Figure 6. The comparison of uncorrected stress–strain relation and relations corrected by one of thethree empirical models for the MoBCAM coating.
To find out which correction model fits best for obtaining correct yield strength and Young’smodulus, the nanoindentation method was used for comparison. The Young’s modulus E and hardnessH were obtained according to the Oliver and Pharr method. The yield strength was approximatedby H/3 [31]. In Figures 7 and 8, the cyan-colored region represents Young’s modulus and yieldstrength calculated from the nanoindentation test, where its width was given by the experimental error.The data of yield strength (Figure 7a) and Young’s modulus (Figure 7b) obtained from the micro-pillarcompression corrected by one of the three models were plotted as functions of the taper angle for the

Materials 2020, 13, 3054 8 of 11
case of the MoBCCR sample. The corrected yield strength corresponded well with nanoindentationmeasurements for all three models up to taper angles of 8–9◦. For higher taper angles, for the σ1 and σ2
corrections, the calculations led to an underestimation of the yield strength, while the σ3 model resultedin the yield strength that was comparable with nanoindentation results up to ~10◦. This conclusionfitted well with theoretical predictions found in [10]. Averaging the stress at the bottom and topparts of a micro-pillar gave the most accurate result of the stress magnitude from all three models.Authors in [10] stated that the accuracy dropped down when the strain was higher than 0.4%, andthey modeled micro-pillars with taper angles up to 5◦. The results presented in Figure 7a showedthat micro-pillars with even higher taper angles could be used for the analysis of yield strength if theaveraging of the stress was used for estimation of the stress. From Figure 7b, it was clear that by usingthe σ3, i.e., the average stress correction, the obtained Young’s modulus was overestimated even for thesmallest taper angles, which also corresponded well with predictions [10]. On the other hand, if the σ1
and σ2 corrections were used, the obtained Young’s modulus was within the experimental error ofthe nanoindentation results for taper angles up to 9–10◦. For even higher taper, the values droppedsignificantly. So, in this case, the averaging of top and bottom radii or area of micro-pillars provedto generate more accurate values of Young’s modulus than averaging of the stress, and the situationwas opposite as for the yield strength. This conclusion was not surprising as Young’s modulus in theSneddon’s equation (see Equation (2)) was dependent on the contact area.
Materials 2020, 13, x FOR PEER REVIEW 8 of 11
experimental error. The data of yield strength (Figure 7a) and Young’s modulus (Figure 7b) obtained
from the micro-pillar compression corrected by one of the three models were plotted as functions of
the taper angle for the case of the MoBCCR sample. The corrected yield strength corresponded well
with nanoindentation measurements for all three models up to taper angles of 8–9°. For higher taper
angles, for the σ1 and σ2 corrections, the calculations led to an underestimation of the yield strength,
while the σ3 model resulted in the yield strength that was comparable with nanoindentation results
up to ~10°. This conclusion fitted well with theoretical predictions found in [10]. Averaging the stress
at the bottom and top parts of a micro-pillar gave the most accurate result of the stress magnitude
from all three models. Authors in [10] stated that the accuracy dropped down when the strain was
higher than 0.4%, and they modeled micro-pillars with taper angles up to 5°. The results presented
in Figure 7a showed that micro-pillars with even higher taper angles could be used for the analysis
of yield strength if the averaging of the stress was used for estimation of the stress. From Figure 7b,
it was clear that by using the σ3, i.e., the average stress correction, the obtained Young’s modulus was
overestimated even for the smallest taper angles, which also corresponded well with predictions [10].
On the other hand, if the σ1 and σ2 corrections were used, the obtained Young’s modulus was within
the experimental error of the nanoindentation results for taper angles up to 9–10°. For even higher
taper, the values dropped significantly. So, in this case, the averaging of top and bottom radii or area
of micro-pillars proved to generate more accurate values of Young’s modulus than averaging of the
stress, and the situation was opposite as for the yield strength. This conclusion was not surprising as
Young’s modulus in the Sneddon’s equation (see Equation (2)) was dependent on the contact area.
Figure 7. The comparison of (a) yield strength and (b) Young’s modulus for MoBCCR for different
taper angles with the nanoindentation data represented by the cyan region, where its width was given
by the experimental error.
The yield strength and Young’s modulus dependencies for the amorphous MoBCAM sample are
plotted in Figure 8a,b, respectively. The evolutions of calculated stresses and moduli using one of the
three models were smoother due to the more homogeneous microstructure of the studied material.
The corrected yield strength exhibited similar results as in the crystalline case, i.e., the σ3 average
stress correction showed results comparable with the nanoindentation data, whereas the other two
models showed underestimation in the calculated yield strength, which increased with the taper
angle. On the other hand, perhaps due to a more homogeneous microstructure of the material,
Young’s modulus calculated from the compression test resulted in similar results as the modulus
obtained by the nanoindentation test for all studied taper angles up to 8–9°. The data corrected by
the σ3 model indicated slightly higher values of E than other two models, which was in accordance
with findings in the former case; however, they still fitted within the error region, meaning that the
results of E after correction could be considered as valid up to taper angles of ~8°.
6 8 10 12 14
400
500
600
700
800
900
[°]
E[G
Pa]
nanoindentation
E = 620±40 GPa
1
2
3
b)
6 8 10 12 14
6
8
10
12
[G
Pa
]
[°]
nanoindentation
yield strength = 9.7± 0.5 GPaa)
Figure 7. The comparison of (a) yield strength and (b) Young’s modulus for MoBCCR for different taperangles with the nanoindentation data represented by the cyan region, where its width was given by theexperimental error.
Materials 2020, 13, x FOR PEER REVIEW 9 of 11
Figure 8. The comparison of (a) yield strength and (b) Young’s modulus for MoBCAM for different
taper angles with the nanoindentation data represented by the cyan region, where its width was given
by the experimental error.
4. Conclusions
A series of pillars with different taper angles in the range between 4° and 14° was fabricated
from the surface of the near-amorphous and nanocrystalline Mo-B-C coatings, which were afterward
subjected to micro-compression testing with the flat punch indenter. In the case of both coatings, the
deformation for lower taper angles resulted in the formation of several small-scale shear bands. While this
deformation mechanism remained unchanged for higher taper angles up to 9° in case of the near-
amorphous Mo-B-C coating, the deformation of the nanocrystalline coating strongly depended on the
taper angle. For higher taper angles (7–12°), the micro-compression in case of the nanocrystalline coating
led to large-scale failure, where usually the entire top of a micro-pillar slipped down, and for the taper
angle >11°, a severe crack formation caused by through-thickness axial splitting occurred in the body of
the micro-pillar. The nanoindentation analysis showed the compressive yield strength to be 5.4 GPa and
10.6 GPa for the near-amorphous and nanocrystalline coating, respectively. The yield stress depended on
the taper angle—for the increasing taper angle, the gradual decrease of the yield stress was observed.
Afterward, three empirical corrections for stress were applied in order to obtain the correct
stress–strain relations for respective micro-pillars with a non-zero taper angle. The calculated yield
strength and Young’s modulus were compared with the results obtained by standard nanoindentation
measurement. It was experimentally demonstrated that the averaging of the stress at the bottom and top
parts of a micro-pillar gave results of yield strength comparable with values obtained by nanoindentation
for taper angles up to 10° for the MoBCCR sample and 8° for the MoBCAM sample and, hence, it could be
used for correction of the yield strength. On the other hand, the averaging of top and bottom radii or area
of micro-pillars showed more accurate values for Young’s modulus up to 9–10° for both studied materials.
The main conclusion was that micro-compression testing of pillars with relatively high taper angle
produced by fast top-down milling method could still produce reliable results of yield strength and
Young’s modulus if the right stress correction was used.
Author Contributions: Conceptualization, L.Z., K.B., J.D., and R.V.; methodology, L.Z., P.S., V.B., R.V., and J.D.;
investigation, L.Z., P.S., and K.B.; writing, L.Z.; visualization, K.B.; supervision, P.V. and V.B.; funding
acquisition, P.V. and V.B. All authors have read and agreed to the published version of the manuscript.
Funding: This research has been supported by the project LM2018097 funded by the Ministry of Education,
Youth and Sports of the Czech Republic, and by The Czech Science Foundation (Project 19-03899S).
Conflicts of Interest: The authors declare no conflict of interest.
References
3 4 5 6 7 8 92
4
6
8nanoindentation
yield strength = 6.3 ± 0.5 GPaa)
[G
Pa
]
[°]
3 4 5 6 7 8 9250
300
350
400
450nanoindentation
E = 350 ± 10 GPab)
E[G
Pa
]
[o]
Figure 8. The comparison of (a) yield strength and (b) Young’s modulus for MoBCAM for differenttaper angles with the nanoindentation data represented by the cyan region, where its width was givenby the experimental error.

Materials 2020, 13, 3054 9 of 11
The yield strength and Young’s modulus dependencies for the amorphous MoBCAM sample areplotted in Figure 8a,b, respectively. The evolutions of calculated stresses and moduli using one of thethree models were smoother due to the more homogeneous microstructure of the studied material.The corrected yield strength exhibited similar results as in the crystalline case, i.e., the σ3 averagestress correction showed results comparable with the nanoindentation data, whereas the other twomodels showed underestimation in the calculated yield strength, which increased with the taper angle.On the other hand, perhaps due to a more homogeneous microstructure of the material, Young’smodulus calculated from the compression test resulted in similar results as the modulus obtained bythe nanoindentation test for all studied taper angles up to 8–9◦. The data corrected by the σ3 modelindicated slightly higher values of E than other two models, which was in accordance with findings inthe former case; however, they still fitted within the error region, meaning that the results of E aftercorrection could be considered as valid up to taper angles of ~8◦.
4. Conclusions
A series of pillars with different taper angles in the range between 4◦ and 14◦ was fabricatedfrom the surface of the near-amorphous and nanocrystalline Mo-B-C coatings, which were afterwardsubjected to micro-compression testing with the flat punch indenter. In the case of both coatings,the deformation for lower taper angles resulted in the formation of several small-scale shear bands.While this deformation mechanism remained unchanged for higher taper angles up to 9◦ in case of thenear-amorphous Mo-B-C coating, the deformation of the nanocrystalline coating strongly depended onthe taper angle. For higher taper angles (7–12◦), the micro-compression in case of the nanocrystallinecoating led to large-scale failure, where usually the entire top of a micro-pillar slipped down, and forthe taper angle >11◦, a severe crack formation caused by through-thickness axial splitting occurred inthe body of the micro-pillar. The nanoindentation analysis showed the compressive yield strength tobe 5.4 GPa and 10.6 GPa for the near-amorphous and nanocrystalline coating, respectively. The yieldstress depended on the taper angle—for the increasing taper angle, the gradual decrease of the yieldstress was observed.
Afterward, three empirical corrections for stress were applied in order to obtain the correctstress–strain relations for respective micro-pillars with a non-zero taper angle. The calculated yieldstrength and Young’s modulus were compared with the results obtained by standard nanoindentationmeasurement. It was experimentally demonstrated that the averaging of the stress at the bottomand top parts of a micro-pillar gave results of yield strength comparable with values obtained bynanoindentation for taper angles up to 10◦ for the MoBCCR sample and 8◦ for the MoBCAM sampleand, hence, it could be used for correction of the yield strength. On the other hand, the averaging oftop and bottom radii or area of micro-pillars showed more accurate values for Young’s modulus up to9–10◦ for both studied materials. The main conclusion was that micro-compression testing of pillarswith relatively high taper angle produced by fast top-down milling method could still produce reliableresults of yield strength and Young’s modulus if the right stress correction was used.
Author Contributions: Conceptualization, L.Z., K.B., J.D., and R.V.; methodology, L.Z., P.S., V.B., R.V., and J.D.;investigation, L.Z., P.S., and K.B.; writing, L.Z.; visualization, K.B.; supervision, P.V. and V.B.; funding acquisition,P.V. and V.B. All authors have read and agreed to the published version of the manuscript.
Funding: This research has been supported by the project LM2018097 funded by the Ministry of Education, Youthand Sports of the Czech Republic, and by The Czech Science Foundation (Project 19-03899S).
Conflicts of Interest: The authors declare no conflict of interest.
References
1. Uchic, M.D.; Dimiduk, D.M.; Florando, J.N.; Nix, W.D. Sample Dimensions Influence Strength and CrystalPlasticity. Science 2004, 305, 986–989. [CrossRef] [PubMed]
2. Uchic, M.D.; Dimiduk, D.M.; Florando, J.N.; Nix, W.D. Exploring specimen size effect in plastic deformationof Ni3 (Al,Ta). Mat. Res. Soc. Symp. Proc. 2003, 753, BB1.4.1–BB1.4.6. [CrossRef]

Materials 2020, 13, 3054 10 of 11
3. Greer, J.R.; Oliver, W.C.; Nix, W.D. Size dependence of mechanical properties of gold at the micron scale inthe absence of strain gradients. Acta Mater. 2005, 53, 1821–1830. [CrossRef]
4. Csanádi, T.; Bl’anda, M.; Duszová, A.; Chinh, N.Q.; Szommerc, P.; Dusza, J. Deformation characteristics ofWC micropillars. J. Eur. Ceram. Soc. 2014, 34, 4099–4103.
5. Greer, J.R.; Nix, W.D. Nanoscale gold pillars strengthened through dislocation starvation. Phys. Rev. 2006,B 73, 245410. [CrossRef]
6. Chen, W.; Huang, Z.; Cao, S.; Pan, Y.; Huang, M.; Huc, Q.; Xua, D.; Sun, Q.; Xiao, L.; Sun, J. Strain rate-inducedplasticity in bcc β-Ti alloy single crystal micropillars containing brittle ω-precipitates. Mater. Des. 2018,137, 404–413. [CrossRef]
7. Kaira, C.S.; Singh, S.S.; Kirubanandham, A.; Chawla, N. Microscale deformation behavior of bicrystalboundaries in pure tin (Sn) using micropillar compression. Acta Mater. 2016, 120, 56–67. [CrossRef]
8. Montagne, A.; Pathak, S.; Maeder, X.; Michler, J. Plasticity and fracture of sapphire at room temperature:Load-controlled microcompression of four different orientations. Ceram. Int. 2014, 40, 2083–2090. [CrossRef]
9. Zhang, H.; Schuster, B.E.; Wei, Q.; Ramesh, K.T. The design of accurate micro-compression experiments.Scripta. Mater. 2006, 54, 181–186. [CrossRef]
10. Fei, H.; Abraham, A.; Chawla, N.; Jiang, H.J. Evaluation of micro-pillar compression tests for accuratedetermination of elastic-plastic constitutive relations. Appl. Mech. 2012, 79, 061011. [CrossRef]
11. Sneddon, I.N. The relation between load and penetration in the axisymmetric boussinesq problem for apunch of arbitrary profile. Int. J. Eng. Sci. 1965, 3, 47–57. [CrossRef]
12. Jiang, L.; Chawla, N. Mechanical properties of Cu6Sn5 intermetallic by micropillar compression testing.Scripta. Mater. 2010, 63, 480–483. [CrossRef]
13. Emmerlich, J.; Music, D.; Braun, M.; Fayek, P.; Munnik, F.; Schneider, J.M. A proposal for an unusually stiffand moderately ductile hard coating material: Mo2BC. J. Phys. D Appl. Phys. 2009, 42, 185406. [CrossRef]
14. Gleich, S.; Fager, H.; Bolvardi, H.; Achenbach, J.-O.; Soler, R.; Pradeep, K.G.; Schneider, J.M.; Dehm, G.;Scheu, C. Nanostructure of and structural defects in a Mo2BC hard coating investigated by transmissionelectron microscopy and atom probe tomography. J. Appl. Phys. 2017, 122, 075305. [CrossRef]
15. Gleich, S.; Breitbach, B.; Peter, N.J.; Soler, R.; Bolvardi, H.; Schneider, J.M.; Dehm, G.; Scheu, C. Thermalstability of nanocomposite Mo2BC hard coatings deposited by magnetron sputtering. Surf. Coat. Technol.2018, 349, 378–383. [CrossRef]
16. Zábranský, L.; Buršíková, V.; Soucek, P.; Vašina, P.; Buršík, J. On the study of the mechanical properties ofMo-B-C coatings. Eur. Phys. J. Appl. Phys. 2016, 75, 24716.
17. Zábranský, L.; Buršíková, V.; Soucek, P.; Vašina, P.; Dugácek, J.; St’ahel, P.; Buršík, J.; Svoboda, M.; Perina, V.Thermal stability of hard nanocomposite Mo-B-C coatings. Vacuum 2017, 138, 199–204.
18. Soucek, P.; Zábranský, L.; Buršíková, V.; Buršík, J.; Debnárová, S.; Svoboda, M.; Perina, V.; Vašina, P. Fractureresistance enhancement in hard Mo-B-C coatings tailored by composition and microstructure. J. Nanomater.2018, 2018, 5184587, 7p, ISSN 1687-4110.
19. Gleich, S.; Soler, R.; Fager, H.; Bolvardi, H.; Achenbach, J.-O.; Hans, M.; Primetzhofer, D.; Schneider, J.M.;Dehm, G.; Scheu, C. Modifying the nanostructure and the mechanical properties of Mo2BC hard coatings:Influence of substrate temperature during magnetron sputtering. Mater. Des. 2018, 142, 203–211. [CrossRef]
20. Oliver, W.C.; Pharr, G.M. Measurement of hardness and elastic modulus by instrumented indentation:Advances in understanding and refinements to methodology. J. Mat. Res. 2004, 19, 3–20. [CrossRef]
21. Weaver, J.S.; Li, N.; Mara, N.A.; Jones, D.R.; Cho, H.; Bronkhorst, C.A.; Fensin, S.J.; Gray, G.T. Slip transmissionof high angle grain boundaries in body-centered cubic metals: Micropillar compression of pure Ta single andbi-crystals. Acta Mater. 2018, 156, 356–368. [CrossRef]
22. Wheeler, J.M.; Kirchlechner, C.; Micha, J.S.; Michler, J.; Kiener, D. The effect of size on the strength of FCCmetals at elevated temperatures: Annealed copper. Philos. Mag. 2016, 96, 3379–3395. [CrossRef] [PubMed]
23. Schuha, C.A.; Hufnagelb, T.C.; Ramamurty, U. Mechanical behavior of amorphous alloys. Acta Mater. 2007,55, 4067–4109. [CrossRef]
24. Li, J.C.M. Micromechanisms of Deformation and Fracture, in Metallic Glasses; ASM: Metals Park, OH, USA, 1978;Chapter 9, p. 224.
25. Howie, P.R.; Korte, S.; Clegg, W.J. Fracture modes in micropillar compression of brittle crystals. Mater. Res.2012, 27, 141–151. [CrossRef]
Materials 2020, 13, 3054 11 of 11
26. Östlund, F.; Rzepiejewska-Malyska, K.; Leifer, K.; Hale, L.M.; Tang, Y.; Ballarini, R.; Gerberich, W.W.; Michler, J.Brittle-to-ductile transition in uniaxial compression of silicon pillars at room temperature. Adv. Funct. Mater.2009, 19, 2439–2444.
27. Wheeler, J.M.; Raghavan, R.; Chawla, V.; Morstein, M.; Michler, J. Deformation of hard coatings at elevatedtemperatures. Surf. Coat. Technol. 2014, 254, 382–387. [CrossRef]
28. Martínez, E.; Romero, J.; Lousa, A.; Esteve, J. Nanoindentation stress–strain curves as a method for thin-filmcomplete mechanical characterization: Application to nanometric CrN/Cr multilayer coatings. Appl. Phys. A2003, 77, 419–426.
29. Bouzakis, K.D.; Pappa, M.; Gerardis, S.; Skordaris, G.; Bouzakis, E. PVD Coatings’ Strength Properties atVarious Temperatures by Nanoindentations and FEM Calculations Determined. Tribol. Ind. 2012, 34, 29–35.
30. Liang, H.; Chen, H.; Peng, F.; Liu, L.; Li, X.; Liu, K.; Liu, C.; Li, X.J. High-pressure strength and compressibilityof titanium diboride (TiB2) studied under non-hydrostatic compression. Phys. Chem. Solids. 2018, 121, 256–260.[CrossRef]
31. Tabor, D. The hardness and strength of metals. J. Inst. Metals. 1951, 79, 1–18.
© 2020 by the authors. Licensee MDPI, Basel, Switzerland. This article is an open accessarticle distributed under the terms and conditions of the Creative Commons Attribution(CC BY) license (http://creativecommons.org/licenses/by/4.0/).