Embed Size (px)
Citation preview
The East Asian Crisis:Causes and Effects
Joseph E. StiglitzSenior Vice President and Chief Economist,
World Bank
Outline of the Talk
I. Key Aspects of the East Asian Crisis
II. Prospects for East Asia
III. Impact on the U.S. Economy
IV. Impact on Developing Countries
Key Aspects of the East Asian Crisis
1. Not public sector profligacy, but private sector borrowing.
2. Not overall indebtedness, but the type of borrowing and use of funds.
3. Not just borrowers, but also lenders.
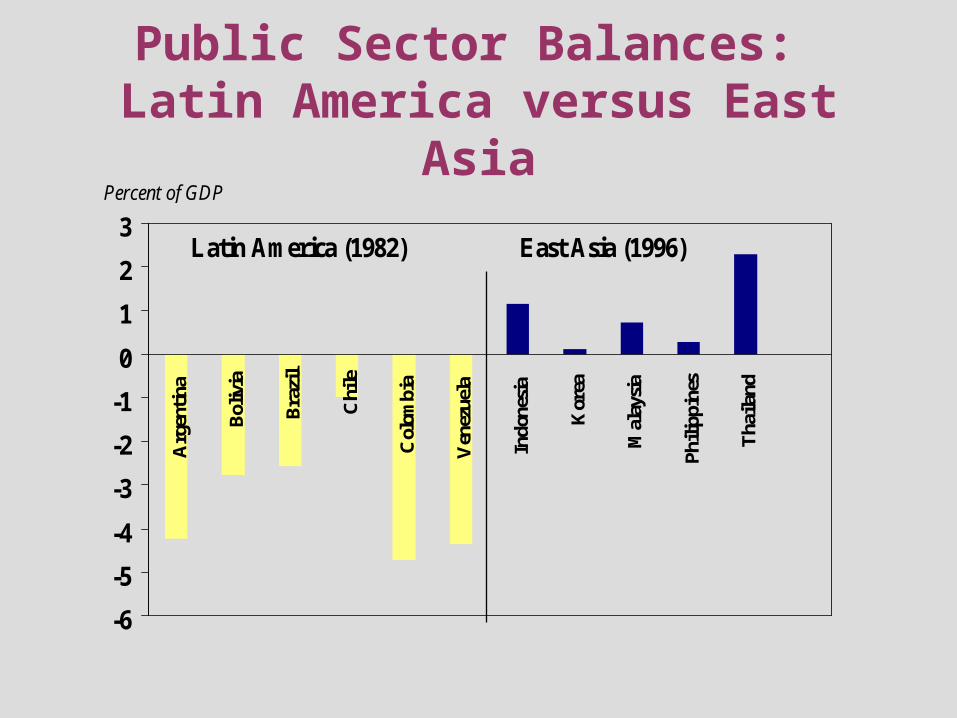
Public Sector Balances: Latin America versus East Asia
-6
-5
-4
-3
-2
-1
0
1
2
3
Arg
entin
a
Bol
ivia
Bra
zil
Chi
le
Col
ombi
a
Ven
ezue
la
Indo
nesi
a
Kor
ea
Mal
aysi
a
Phili
ppin
es
Tha
iland
Latin America (1982) East Asia (1996)
Percent of GDP
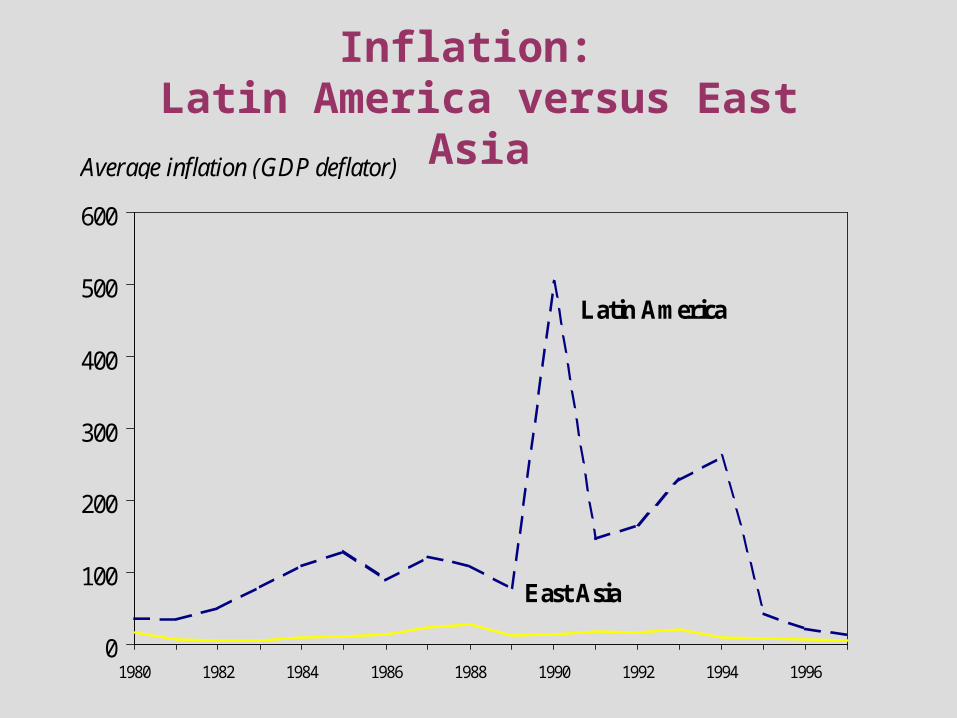
Inflation: Latin America versus East Asia
0
100
200
300
400
500
600
1980 1982 1984 1986 1988 1990 1992 1994 1996
Latin America
East Asia
Average inflation (GDP deflator)
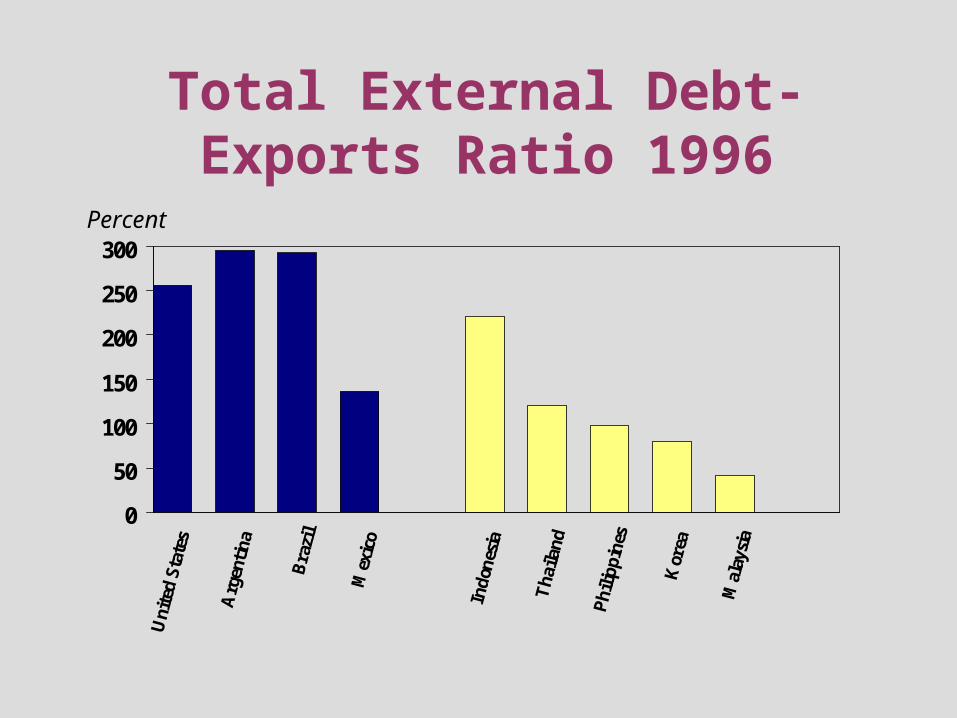
Total External Debt-Exports Ratio 1996
0
50
100
150
200
250
300
Uni
ted
Stat
es
Arg
enti
na
Bra
zil
Mex
ico
Indo
nesi
a
Tha
iland
Phi
lippi
nes
Kor
ea
Mal
aysi
a
Percent
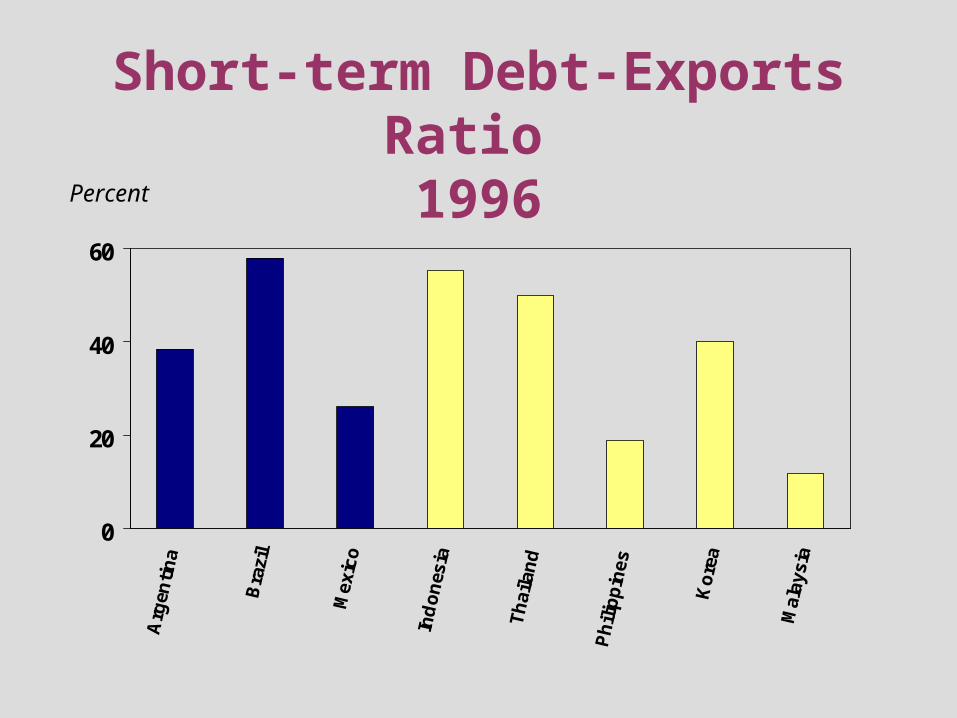
Short-term Debt-Exports Ratio 1996
0
20
40
60
Arg
enti
na
Bra
zil
Mex
ico
Ind
on
esia
Th
aila
nd
Ph
ilip
pin
es
Ko
rea
Mal
aysi
a
Percent
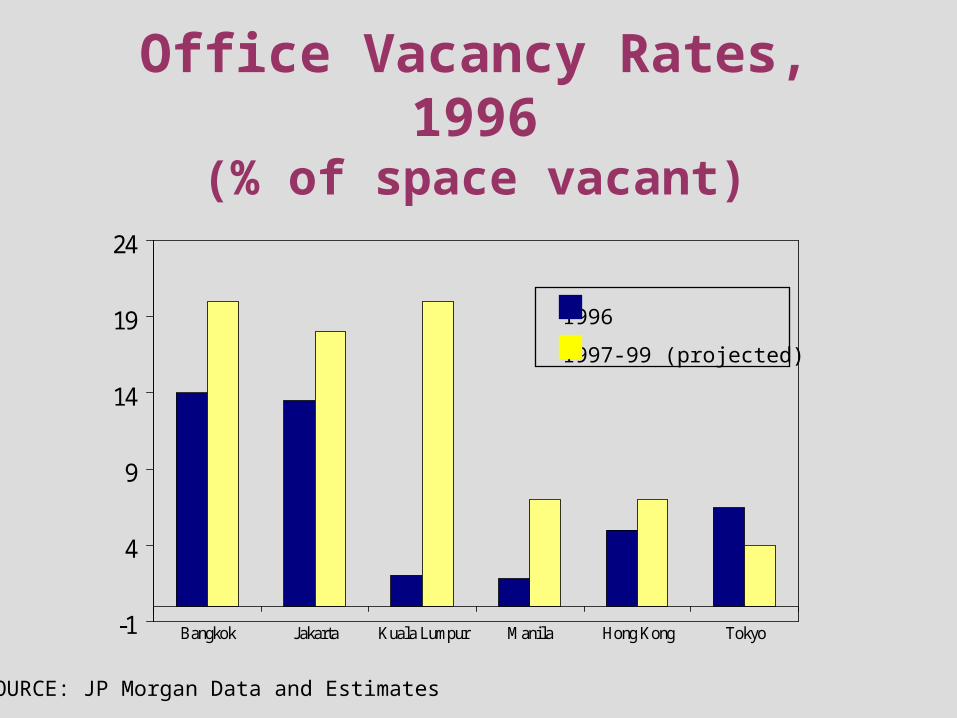
Office Vacancy Rates, 1996(% of space vacant)
-1
4
9
14
19
24
Bangkok Jakarta Kuala Lumpur Manila Hong Kong Tokyo
SOURCE: JP Morgan Data and Estimates
1996
1997-99 (projected)
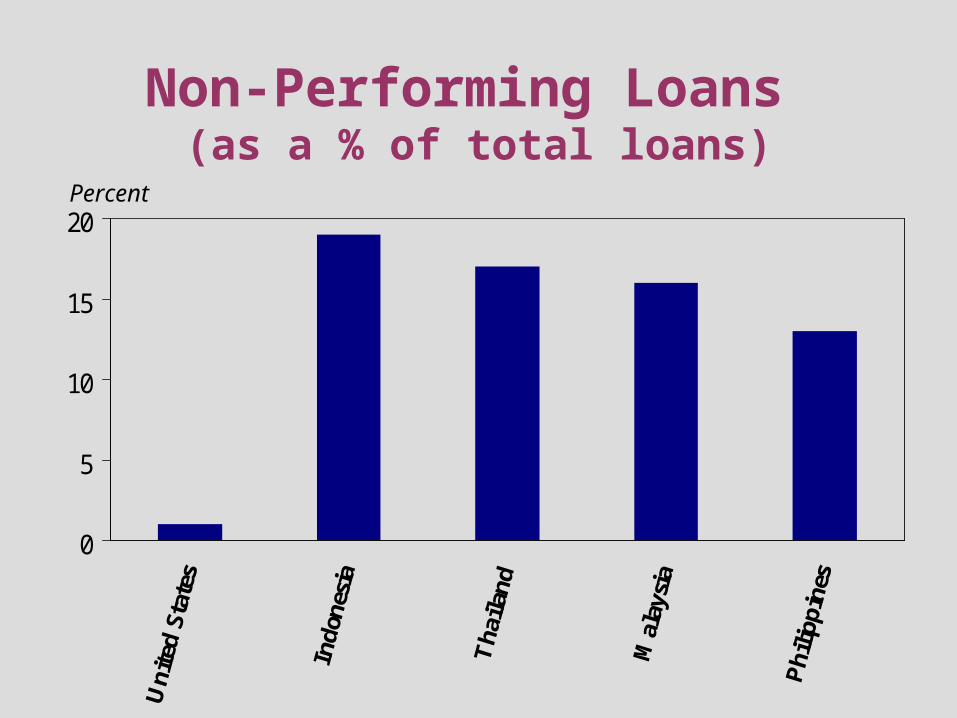
Non-Performing Loans (as a % of total loans)
0
5
10
15
20Percent
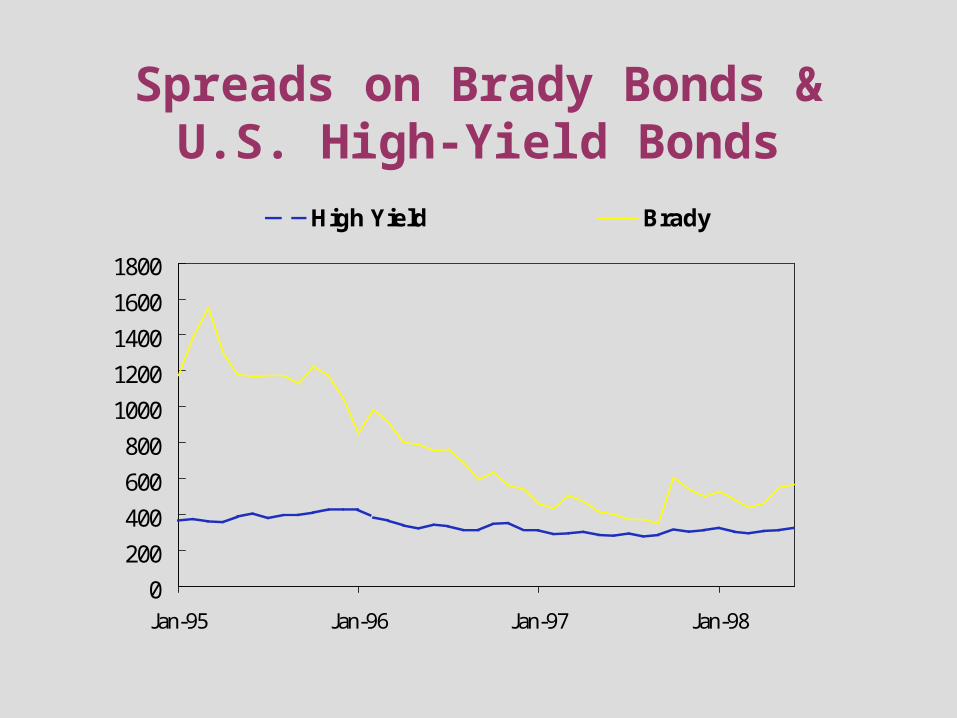
Spreads on Brady Bonds & U.S. High-Yield Bonds
0
200
400
600
800
1000
1200
1400
1600
1800
Jan-95 Jan-96 Jan-97 Jan-98
High Yield Brady
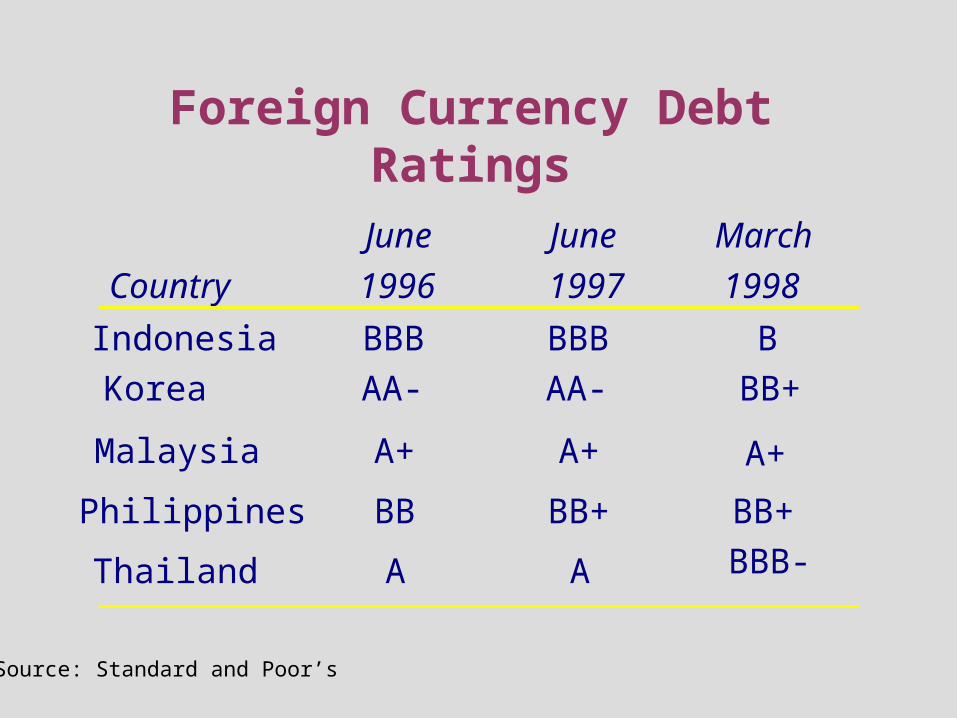
Foreign Currency Debt Ratings
Country
June
1996
June
1997
March
1998
Indonesia BBB BBB B
Korea AA- AA- BB+
Malaysia A+ A+ A+
Philippines BB BB+ BB+
Thailand A A BBB-
Source: Standard and Poor’s
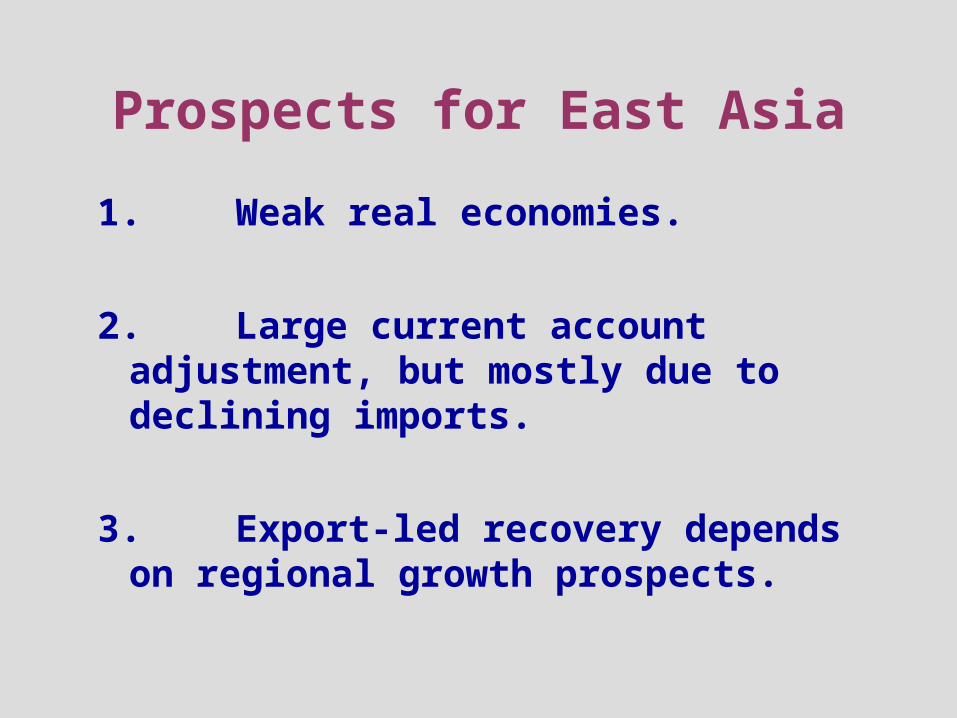
Prospects for East Asia
1. Weak real economies.
2. Large current account adjustment, but mostly due to declining imports.
3. Export-led recovery depends on regional growth prospects.
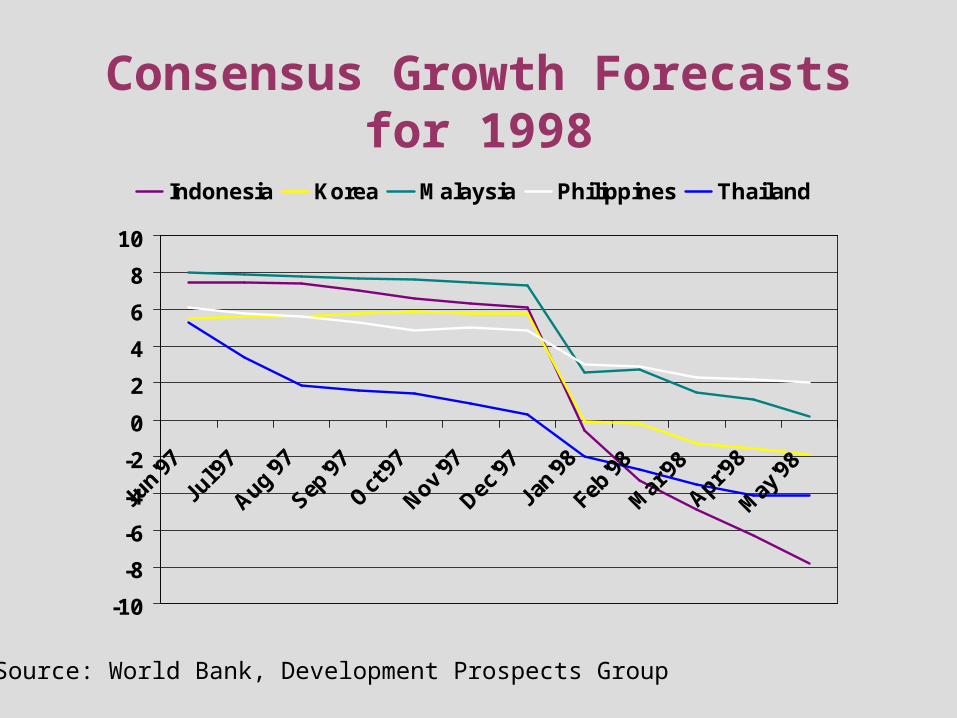
Consensus Growth Forecasts for 1998
-10
-8
-6
-4
-2
0
2
4
6
8
10
Jun'97
Jul'9
7
Aug'97
Sep'9
7
Oct'97
Nov'97
Dec'9
7
Jan'9
8
Feb'98
Mar
'98
Apr'98
May
'98
Indonesia Korea Malaysia Philippines Thailand
Source: World Bank, Development Prospects Group
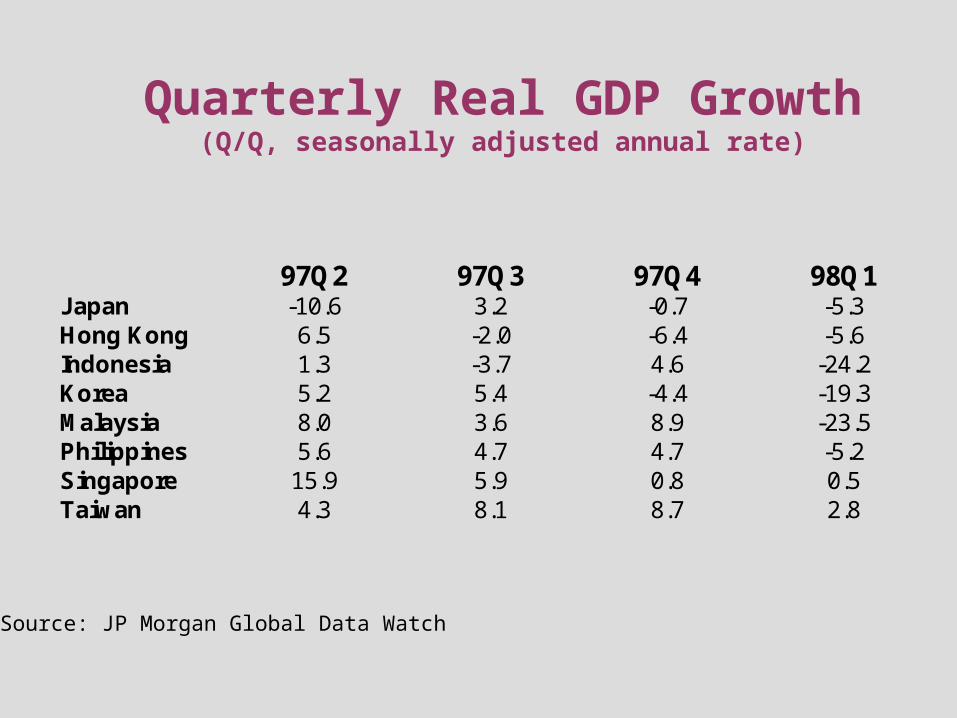
Quarterly Real GDP Growth(Q/Q, seasonally adjusted annual rate)
Source: JP Morgan Global Data Watch
97Q2 97Q3 97Q4 98Q1Japan -10.6 3.2 -0.7 -5.3Hong Kong 6.5 -2.0 -6.4 -5.6Indonesia 1.3 -3.7 4.6 -24.2Korea 5.2 5.4 -4.4 -19.3Malaysia 8.0 3.6 8.9 -23.5Philippines 5.6 4.7 4.7 -5.2Singapore 15.9 5.9 0.8 0.5Taiwan 4.3 8.1 8.7 2.8
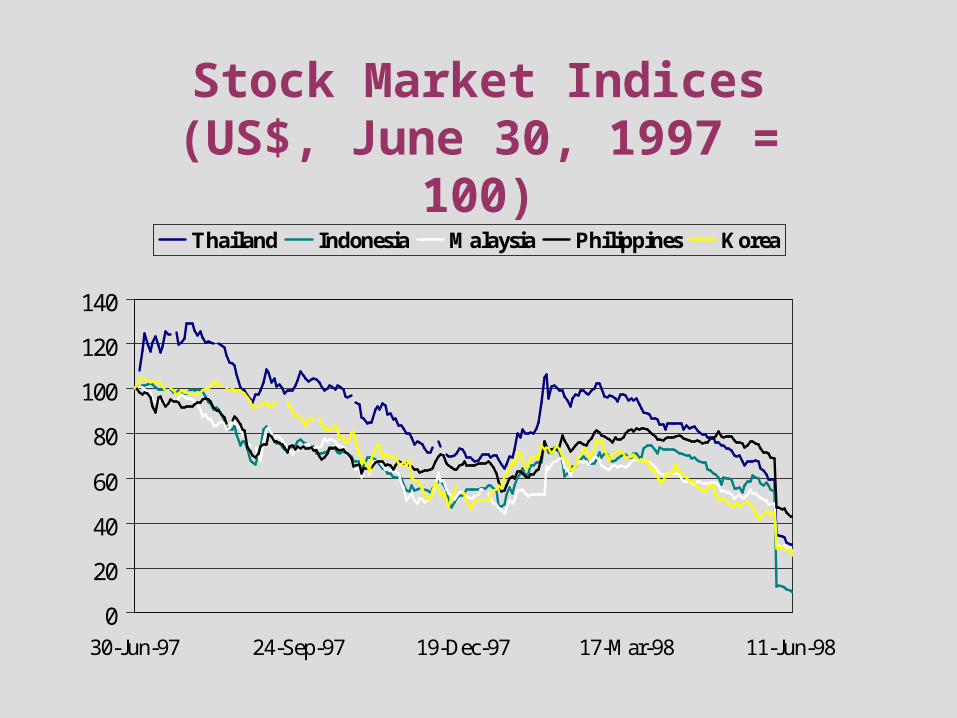
Stock Market Indices(US$, June 30, 1997 = 100)
0
20
40
60
80
100
120
140
30-Jun-97 24-Sep-97 19-Dec-97 17-Mar-98 11-Jun-98
Thailand Indonesia Malaysia Philippines Korea
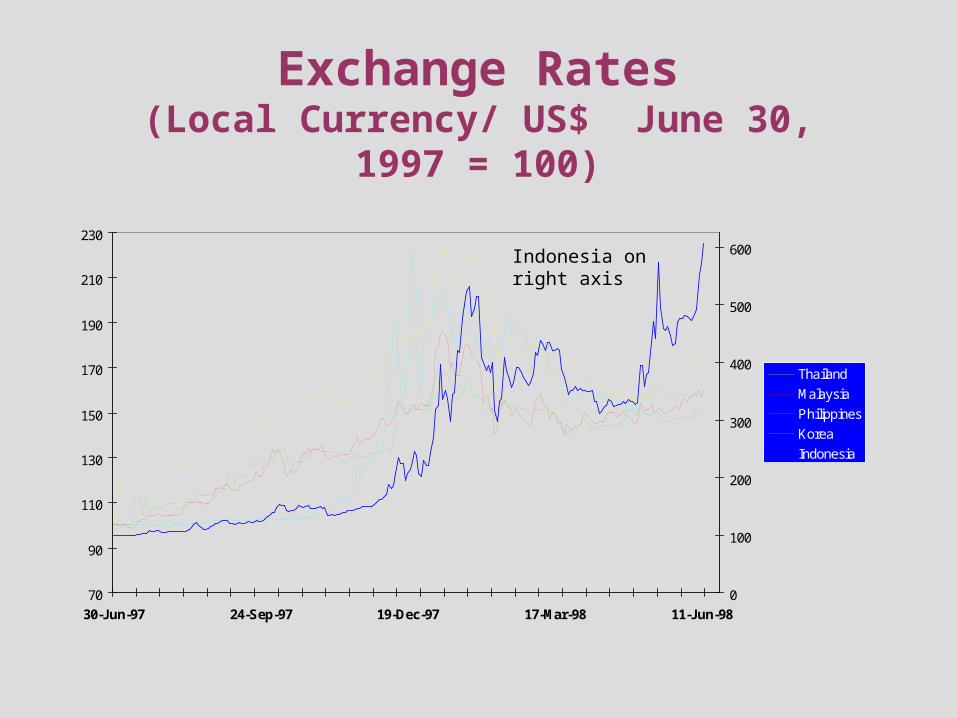
Exchange Rates(Local Currency/ US$ June 30, 1997 = 100)
70
90
110
130
150
170
190
210
230
30-Jun-97 24-Sep-97 19-Dec-97 17-Mar-98 11-Jun-98
0
100
200
300
400
500
600
Thailand
Malaysia
Philippines
Korea
Indonesia
Indonesia on right axis
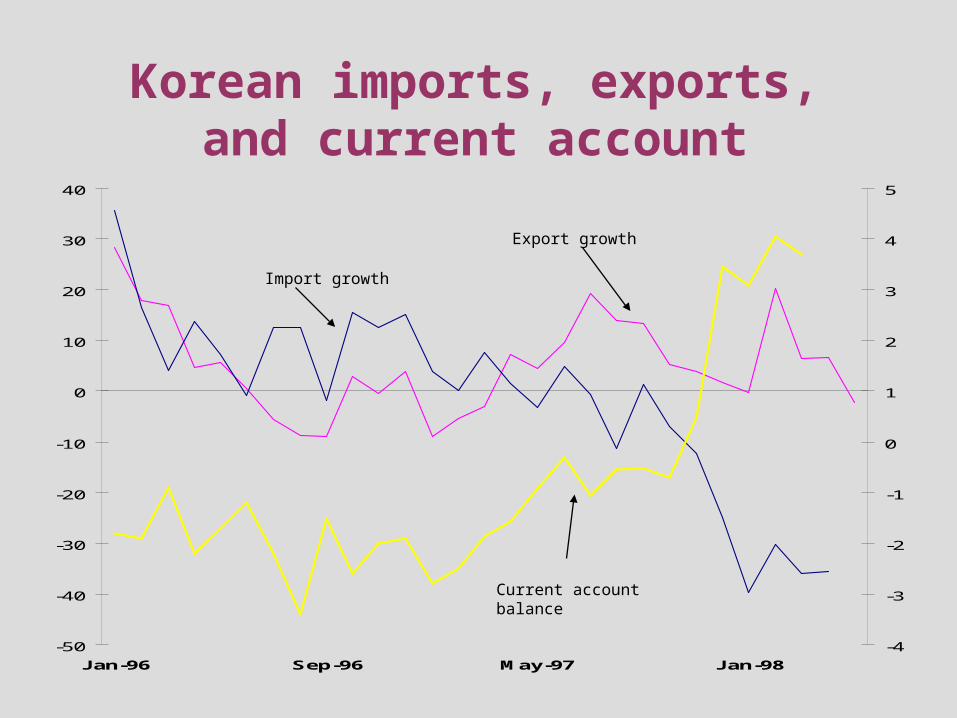
Korean imports, exports, and current account
-50
-40
-30
-20
-10
0
10
20
30
40
Jan-96 Sep-96 May-97 Jan-98
-4
-3
-2
-1
0
1
2
3
4
5
Import growth
Export growth
Current account balance
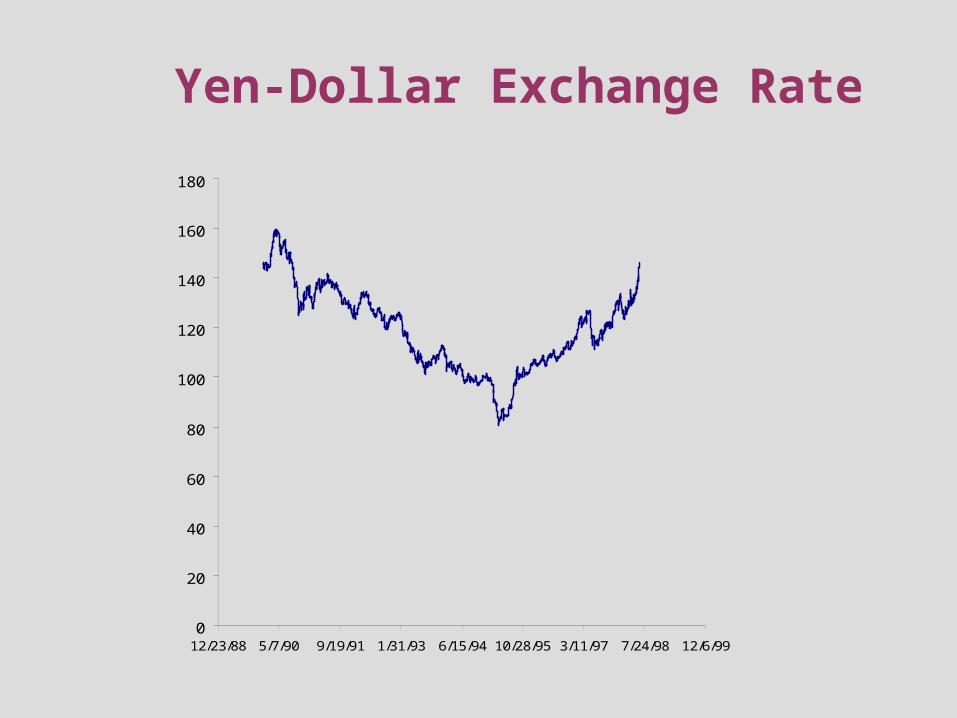
Yen-Dollar Exchange Rate
0
20
40
60
80
100
120
140
160
180
12/23/88 5/7/90 9/19/91 1/31/93 6/15/94 10/28/95 3/11/97 7/24/98 12/6/99
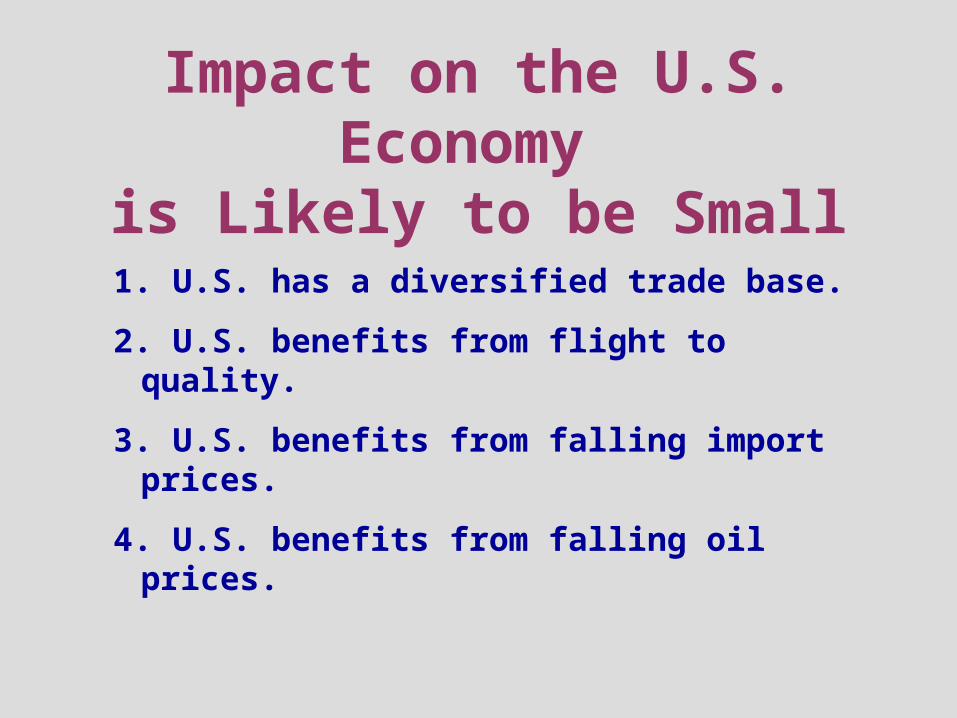
1. U.S. has a diversified trade base.
2. U.S. benefits from flight to quality.
3. U.S. benefits from falling import prices.
4. U.S. benefits from falling oil prices.
Impact on the U.S. Economy is Likely to be Small
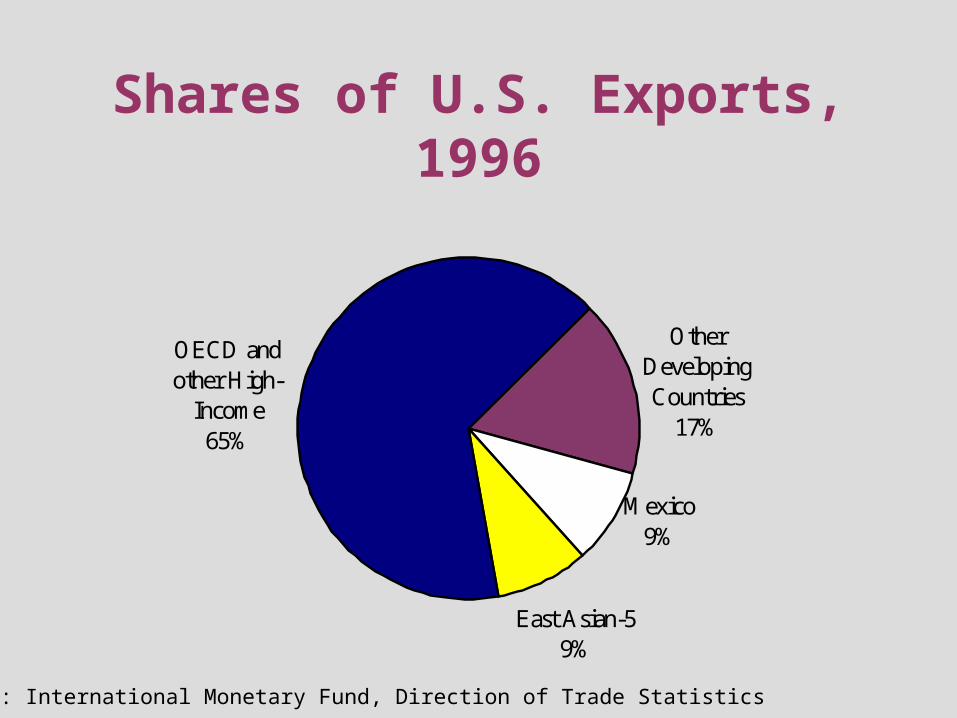
Shares of U.S. Exports, 1996
Other Developing Countries
17%
Mexico9%
East Asian-59%
OECD and other High-
Income65%
SOURCE: International Monetary Fund, Direction of Trade Statistics
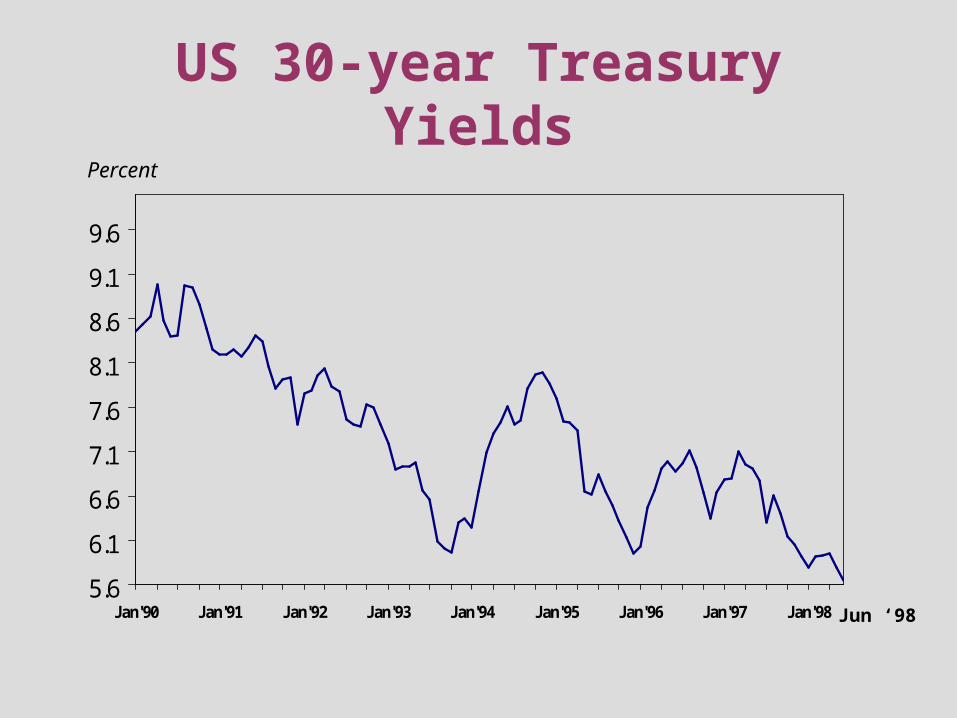
US 30-year Treasury Yields
5.6
6.1
6.6
7.1
7.6
8.1
8.6
9.1
9.6
Jan'90 Jan'91 Jan'92 Jan'93 Jan'94 Jan'95 Jan'96 Jan'97 Jan'98
Percent
Jun ‘98
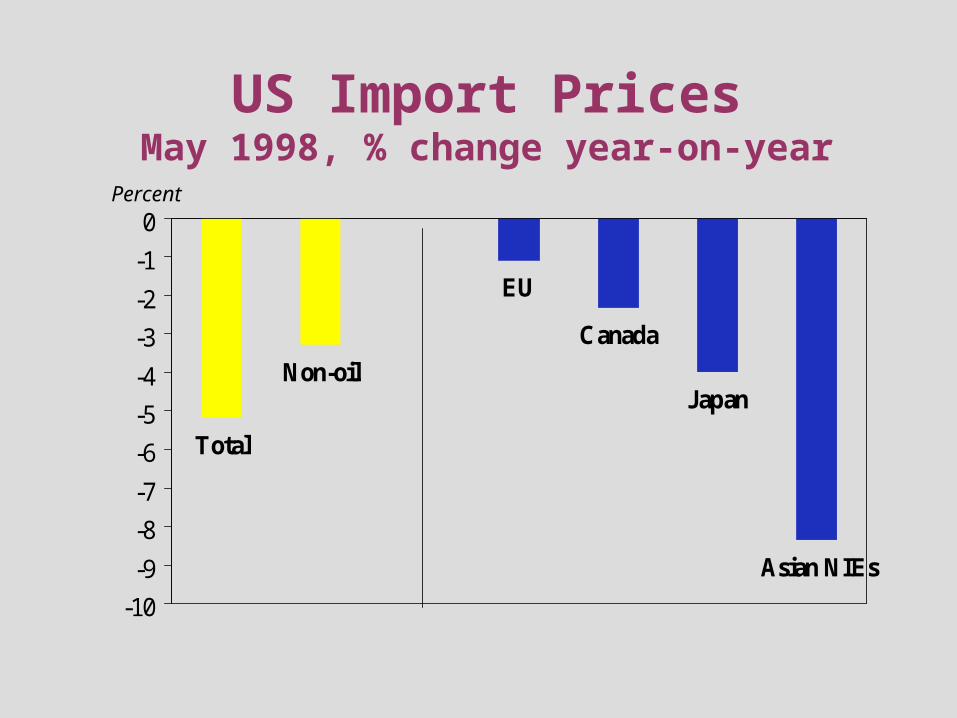
US Import PricesMay 1998, % change year-on-year
Total
Non-oil
EU
Canada
Japan
Asian NIEs
-10
-9
-8
-7
-6
-5
-4
-3
-2
-1
0Percent
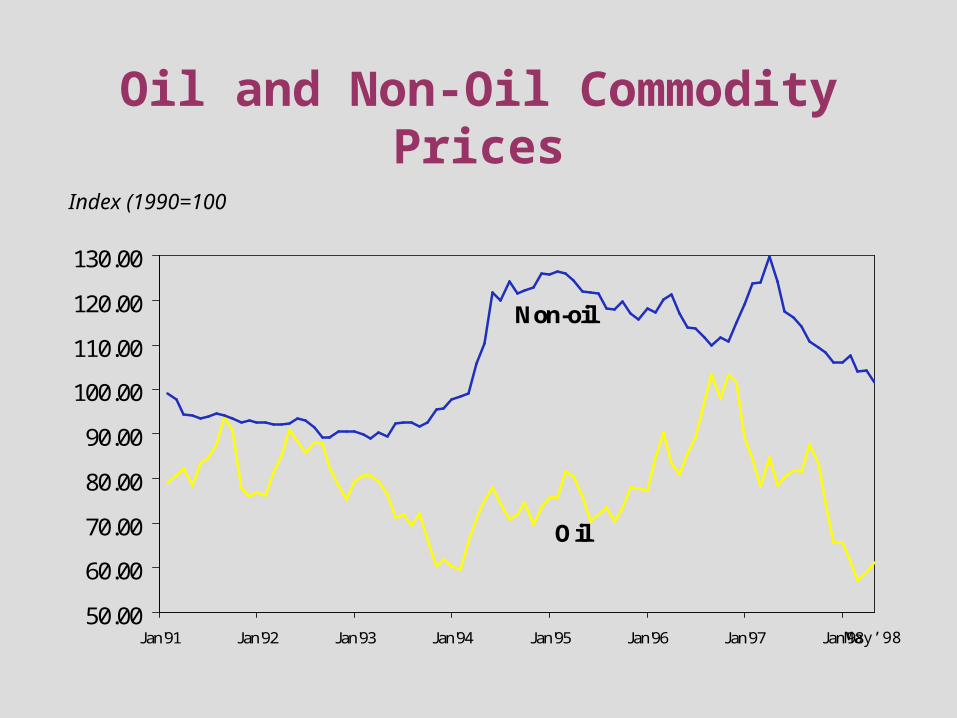
Oil and Non-Oil Commodity Prices
50.00
60.00
70.00
80.00
90.00
100.00
110.00
120.00
130.00
Jan'91 Jan'92 Jan'93 Jan'94 Jan'95 Jan'96 Jan'97 Jan'98
Non-oil
Oil
Index (1990=100
May’98
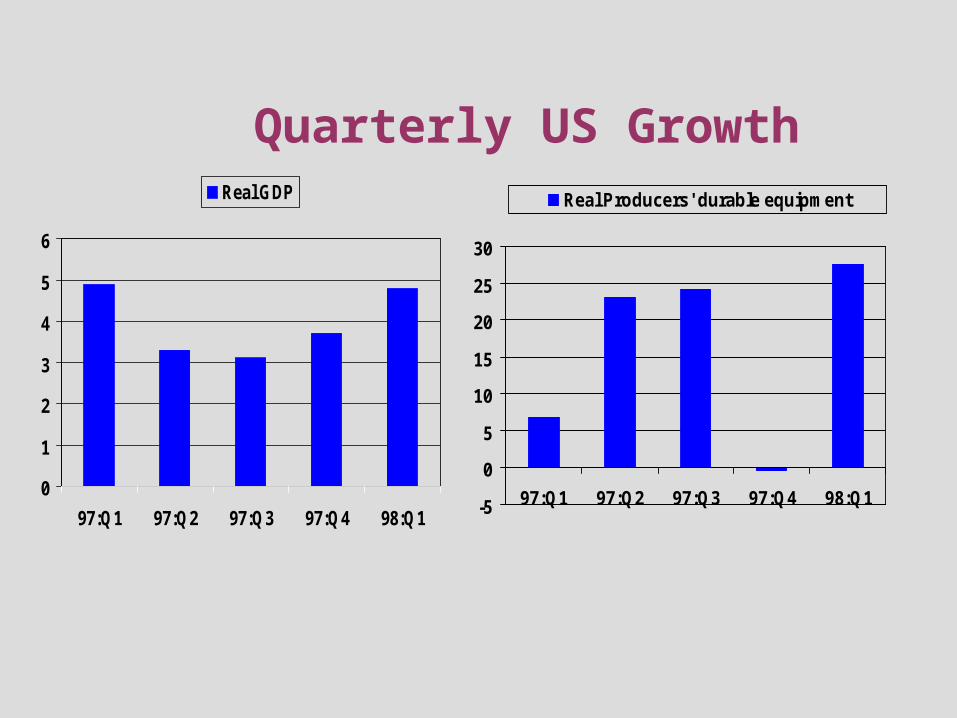
Quarterly US Growth
0
1
2
3
4
5
6
97:Q1 97:Q2 97:Q3 97:Q4 98:Q1
Real GDP
-5
0
5
10
15
20
25
30
97:Q1 97:Q2 97:Q3 97:Q4 98:Q1
Real Producers' durable equipment
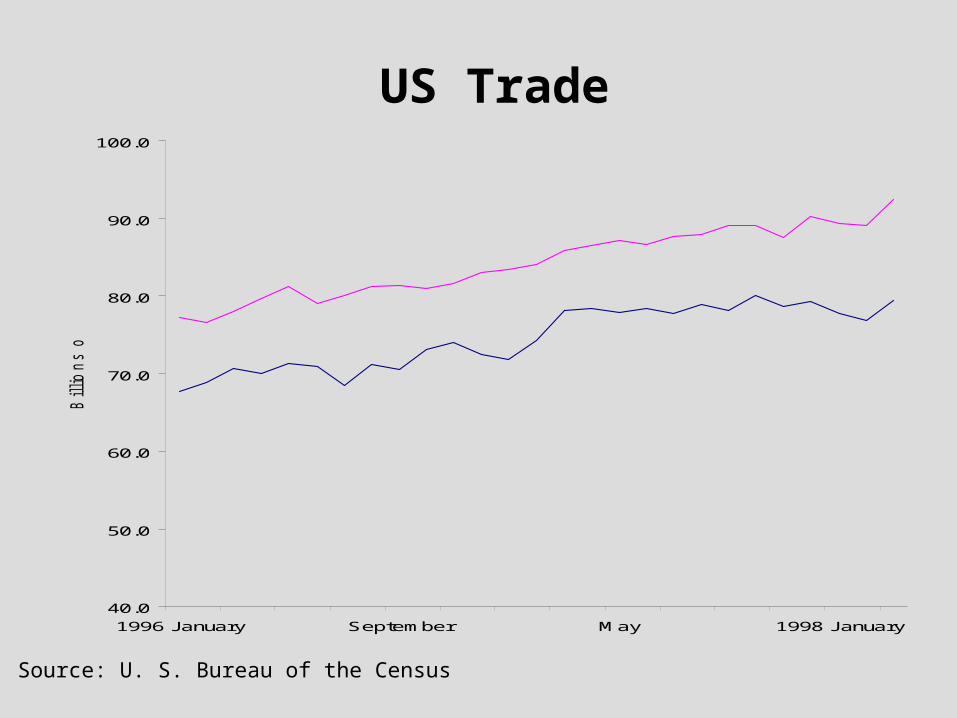
US Trade
Source: U. S. Bureau of the Census
40.0
50.0
60.0
70.0
80.0
90.0
100.0
1996 January September May 1998 January
Billio
ns o
f U
S $
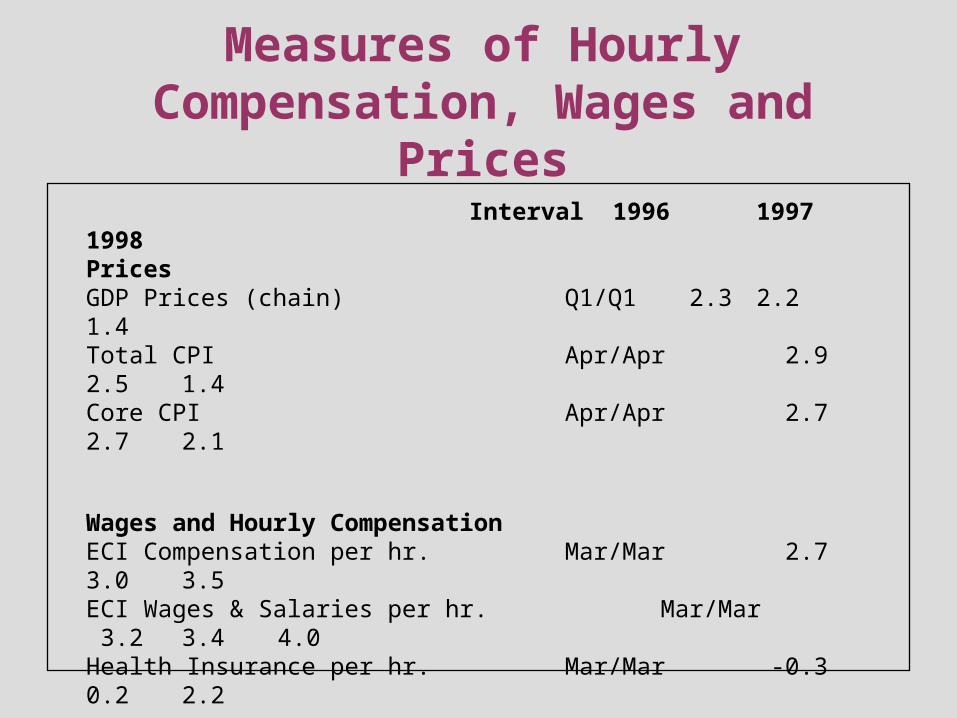
Measures of Hourly Compensation, Wages and
PricesInterval 1996 1997 1998
PricesGDP Prices (chain) Q1/Q1 2.3 2.2 1.4Total CPI Apr/Apr 2.9 2.5 1.4Core CPI Apr/Apr 2.7 2.7 2.1
Wages and Hourly CompensationECI Compensation per hr. Mar/Mar 2.7 3.0 3.5ECI Wages & Salaries per hr. Mar/Mar 3.2 3.4 4.0Health Insurance per hr. Mar/Mar -0.3 0.2 2.2
ProductivityNon-farm business Q1/Q1 1.8 1.3 2.1
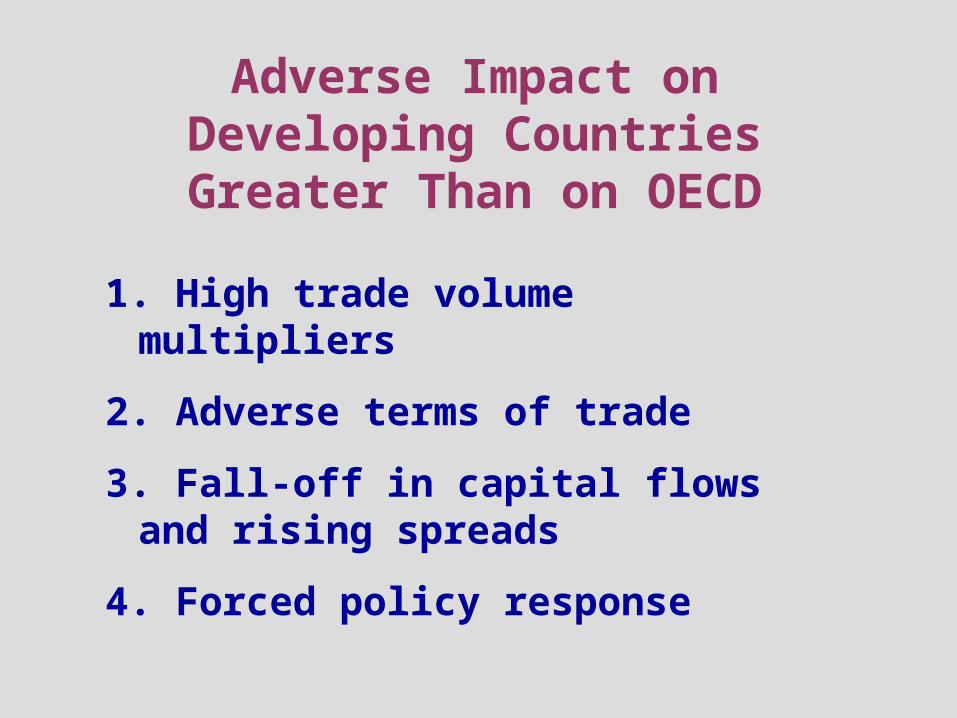
1. High trade volume multipliers
2. Adverse terms of trade
3. Fall-off in capital flows and rising spreads
4. Forced policy response
Adverse Impact on Developing Countries Greater Than on OECD
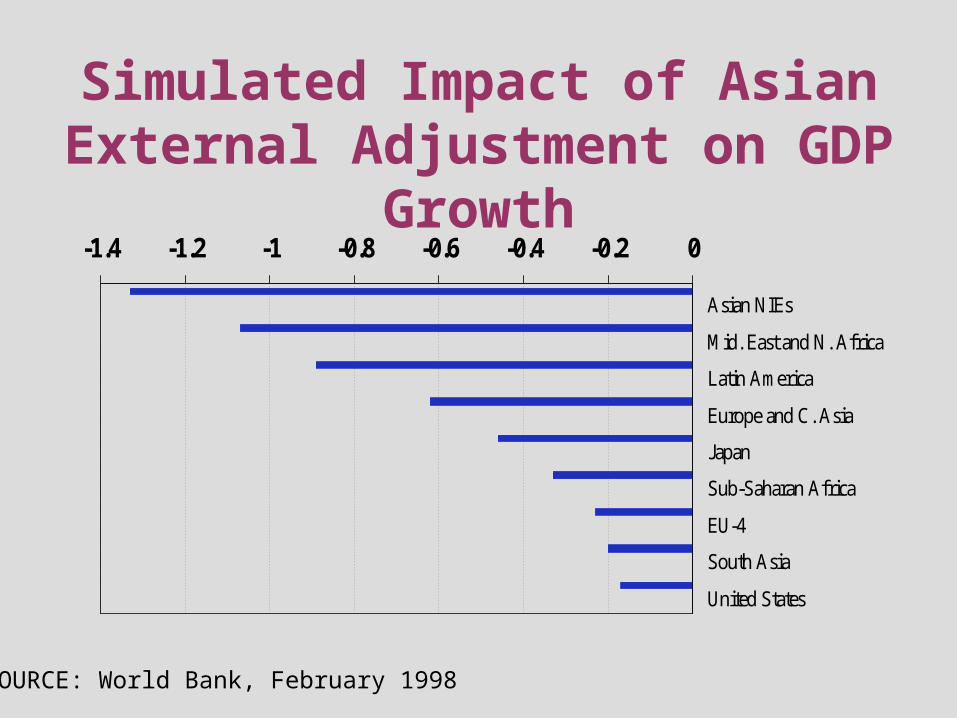
Simulated Impact of Asian External Adjustment on GDP Growth
-1.4 -1.2 -1 -0.8 -0.6 -0.4 -0.2 0
Asian NIEs
Mid. East and N. Africa
Latin America
Europe and C. Asia
Japan
Sub-Saharan Africa
EU-4
South Asia
United States
SOURCE: World Bank, February 1998
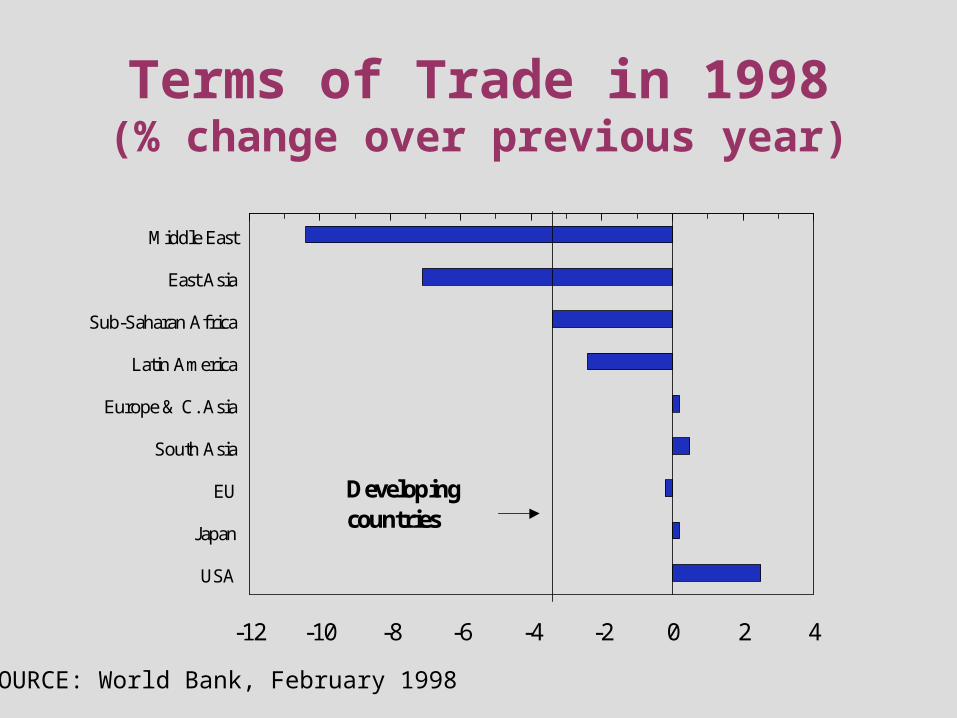
Terms of Trade in 1998(% change over previous year)
-12 -10 -8 -6 -4 -2 0 2 4
Middle East
East Asia
Sub-Saharan Africa
Latin America
Europe & C. Asia
South Asia
EU
Japan
USA
Developing countries
SOURCE: World Bank, February 1998
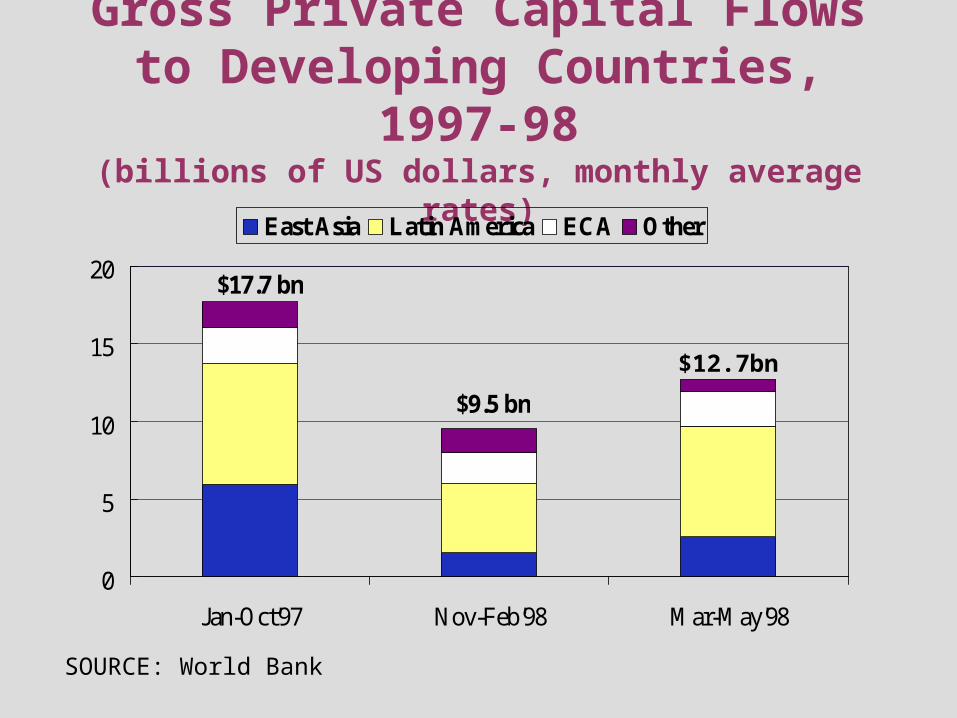
Gross Private Capital Flows to Developing Countries, 1997-98(billions of US dollars, monthly average rates)
0
5
10
15
20
Jan-Oct'97 Nov-Feb'98 Mar-May'98
East Asia Latin America ECA Other
$17.7 bn
$9.5 bn
SOURCE: World Bank
$12.7bn
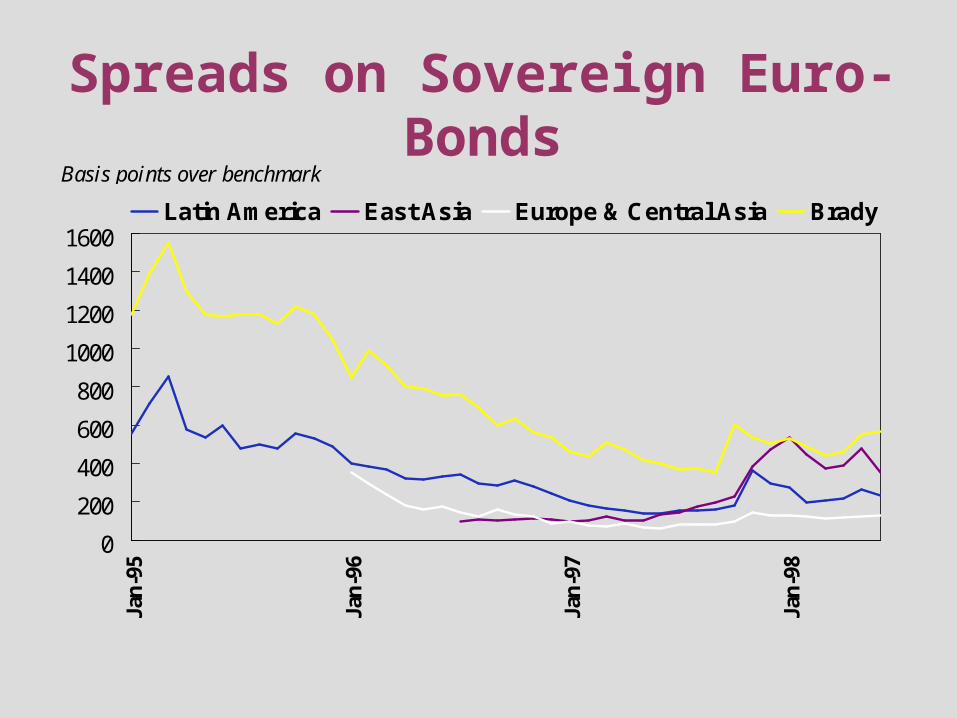
Spreads on Sovereign Euro-Bonds
0
200
400
600
800
1000
1200
1400
1600
Jan
-95
Jan
-96
Jan
-97
Jan
-98
Latin America East Asia Europe & Central Asia Brady
Basis points over benchmark
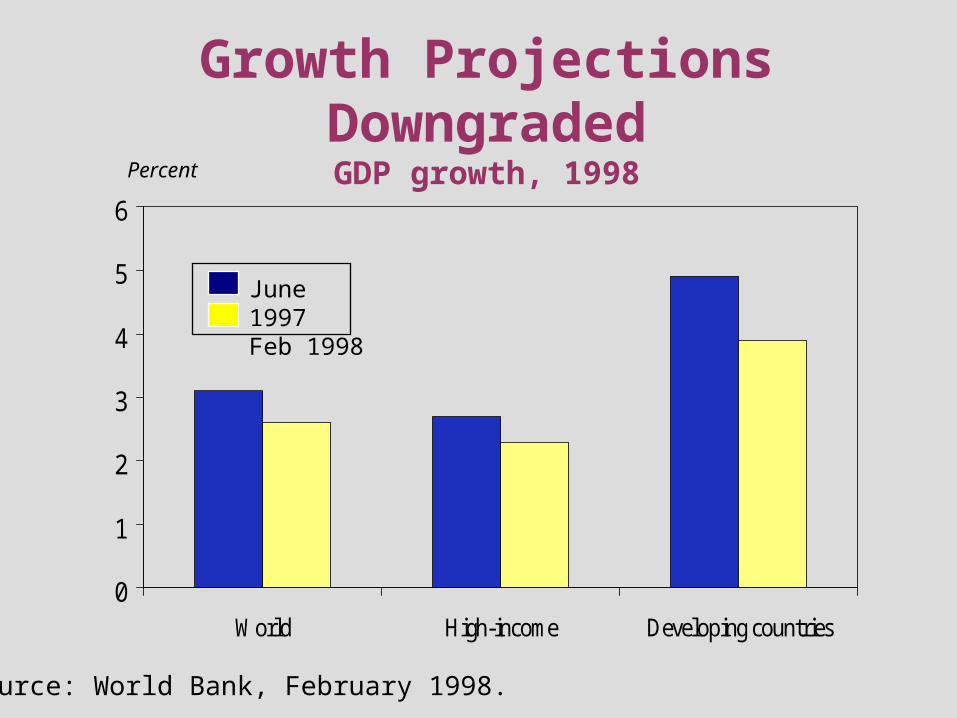
Growth Projections DowngradedGDP growth, 1998
0
1
2
3
4
5
6
World High-income Developing countries
Percent
June 1997Feb 1998
Source: World Bank, February 1998.
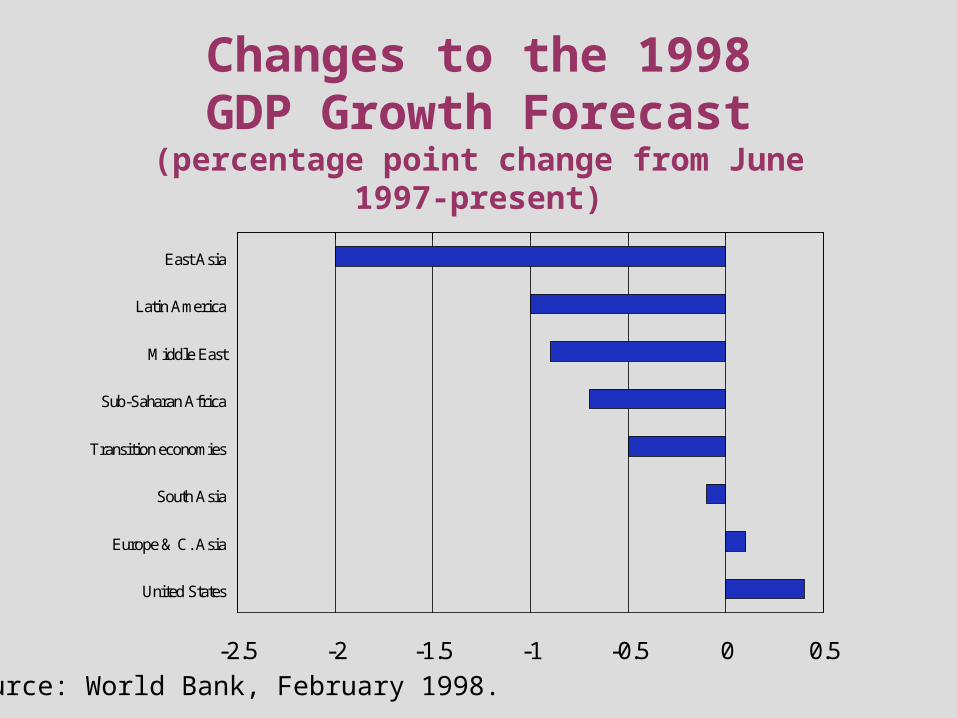
Changes to the 1998GDP Growth Forecast
(percentage point change from June 1997-present)
-2.5 -2 -1.5 -1 -0.5 0 0.5
East Asia
Latin America
Middle East
Sub-Saharan Africa
Transition economies
South Asia
Europe & C. Asia
United States
Source: World Bank, February 1998.
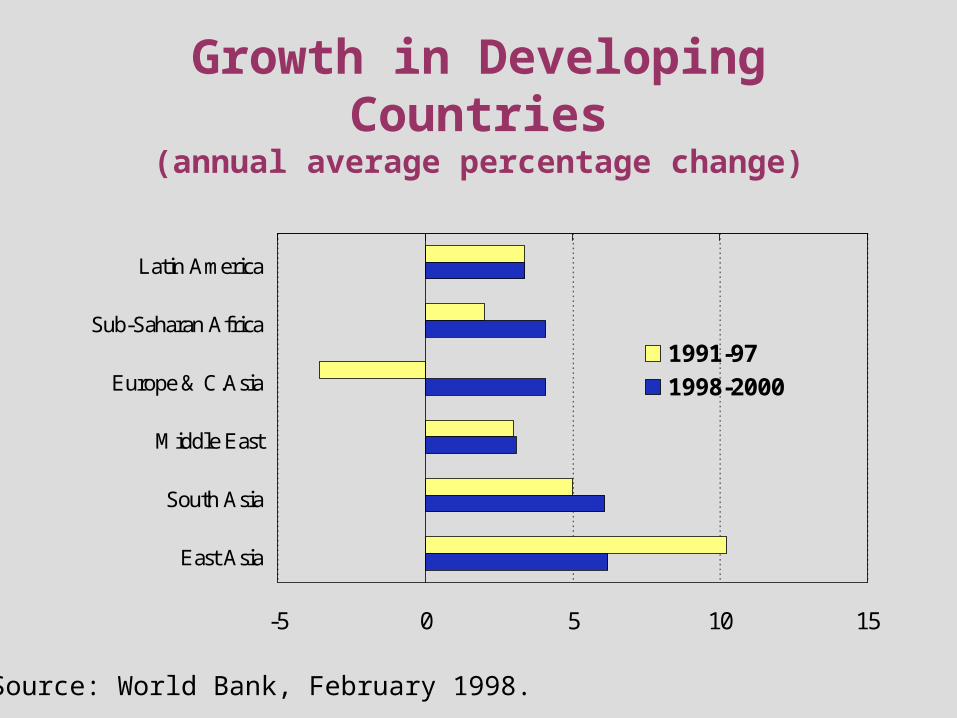
Growth in Developing Countries(annual average percentage change)
-5 0 5 10 15
Latin America
Sub-Saharan Africa
Europe & C.Asia
Middle East
South Asia
East Asia
1991-97
1998-2000
Source: World Bank, February 1998.