Embed Size (px)
Citation preview
ES46CH10-Knoll ARI 7 November 2015 12:5
The Ecological Physiologyof Earth’s Second OxygenRevolutionErik A. Sperling,1,2,4 Andrew H. Knoll,2,3
and Peter R. Girguis3
1Integrative Oceanography Division, Scripps Institution of Oceanography, La Jolla,California 920932Department of Earth and Planetary Sciences and 3Department of Organismic and EvolutionaryBiology, Harvard University, Cambridge, Massachusetts 02138;email: [email protected], [email protected] address: Department of Geological Sciences, Stanford University, Stanford,California 94305; email: [email protected]
Annu. Rev. Ecol. Evol. Syst. 2015. 46:215–35
First published online as a Review in Advance onSeptember 23, 2015
The Annual Review of Ecology, Evolution, andSystematics is online at ecolsys.annualreviews.org
This article’s doi:10.1146/annurev-ecolsys-110512-135808
Copyright c© 2015 by Annual Reviews.All rights reserved
Keywords
animal evolution, environmental change, Ediacaran, Cambrian,paleontology
Abstract
Living animals display a variety of morphological, physiological, and bio-chemical characters that enable them to live in low-oxygen environments.These features and the organisms that have evolved them are distributed in aregular pattern across dioxygen (O2) gradients associated with modern oxy-gen minimum zones. This distribution provides a template for interpretingthe stratigraphic covariance between inferred Ediacaran-Cambrian oxygena-tion and early animal diversification. Although Cambrian oxygen must havereached 10–20% of modern levels, sufficient to support the animal diversityrecorded by fossils, it may not have been much higher than this. Today’s lev-els may have been approached only later in the Paleozoic Era. Nonetheless,Ediacaran-Cambrian oxygenation may have pushed surface environmentsacross the low, but critical, physiological thresholds required for large, ac-tive animals, especially carnivores. Continued focus on the quantificationof the partial pressure of oxygen ( pO2) in the Proterozoic will provide thedefinitive tests of oxygen-based coevolutionary hypotheses.
215
Click here to view this article'sonline features:
• Download figures as PPT slides• Navigate linked references• Download citations• Explore related articles• Search keywords
ANNUAL REVIEWS Further
Ann
u. R
ev. E
col.
Evo
l. Sy
st. 2
015.
46:2
15-2
35. D
ownl
oade
d fr
om w
ww
.ann
ualr
evie
ws.
org
Acc
ess
prov
ided
by
Stan
ford
Uni
vers
ity -
Mai
n C
ampu
s -
Lan
e M
edic
al L
ibra
ry o
n 12
/13/
15. F
or p
erso
nal u
se o
nly.

ES46CH10-Knoll ARI 7 November 2015 12:5
INTRODUCTION
Around the midpoint of the last century, three discoveries collectively altered our understand-ing of deep evolutionary history. First, Tyler & Barghoorn (1954; Barghoorn & Tyler 1965)documented bacterial microfossils in ca. 1,880-million-year-old chert, more than tripling thelength of life’s known history on Earth. Subsequent research would double the length of thathistory again and demonstrate that Earth was a biological planet when the oldest-known, little-metamorphosed sedimentary rocks were deposited nearly 3,500 million years ago (Mya; reviewedin Schopf 2006). Second, geochemical research, initially focused on iron (Fe) formation, sug-gested that early evolution took place beneath an oxygen-free atmosphere (Holland 1962, Cloud1968). And, critically important, advances in mass spectrometry made it possible to obtain ra-diometric age constraints for sedimentary successions that preserved records of biological andenvironmental history; this enabled scientists to establish a timeline of Earth’s early development(Davis et al. 2003).
Two powerful narratives emerged from this research. The evolutionary narrative, constructedfrom fossils and phylogenies, arcs across the whole of Earth’s recorded history and connectsmicrobes in early oceans to the rich biodiversity observed today. In the complementary environ-mental narrative, habitats that were originally Fe rich and oxygen poor diversified through timeto eventually include oxygen-rich settings capable of supporting complex multicellular life. Notsurprisingly, these two trajectories quickly came to be viewed as intertwined, and this promoted acoevolutionary picture of Earth and life (Cloud 1968).
The coevolutionary theme of deep Earth history thrives today and is bolstered by decadesof research in paleontology and geochemistry. In particular, dioxygen (O2) is commonly seenas a master environmental variable, key to both the long-term expansion of biological diversityand the short-term perturbations that have episodically culled species. At the broadest level, itis thought that Earth surface environments have been shaped by two main oxygen revolutions,bracketing the beginning and end of the Proterozoic Eon (e.g., Lyons et al. 2014). The first,∼2,400 Mya, saw the initial appearance of a persistently oxic atmosphere, with the partial pressureof oxygen ( pO2) increasing by orders of magnitude from the previous essentially anoxic state.Still, at least in the canonical telling, it stabilized at no more than a few percent of present at-mospheric levels (PAL). A second redox transition is hypothesized for the end of the ProterozoicEon, with oxygen approaching modern levels. Both oxygen revolutions are thought to have haddramatic effects on apparent diversity and organismal complexity. If we are to sustain coevolu-tionary hypotheses, however, we must be able to support them in two ways: with stratigraphicresearch that links evolution and environmental change in time and through insights from eco-logical physiology that provide a mechanistic link between biological and environmental changes(Knoll 2013).
In the following pages, we explore the Neoproterozoic oxygen revolution. As the full range ofredox conditions experienced in Neoproterozoic and Cambrian seas can be found in present-dayoceans, physiological traits that influence, if not govern, species distributions across redox gra-dients in space may help us understand the evolutionary consequences of redox change throughtime. With this in mind, we review ecological and physiological data on the spatial distribu-tion of organisms in the modern ocean and present an overview of the morphological and bio-chemical adaptations that enable diverse taxa to thrive over a range of environmental oxygenconcentrations. We then shift to geological observations and synthesize available data on thedeep history of life and environments. We conclude by bringing the two data sets togetherto explore the power of ecological physiology to illuminate evolutionary history on a dynamicplanet.
216 Sperling · Knoll · Girguis
Ann
u. R
ev. E
col.
Evo
l. Sy
st. 2
015.
46:2
15-2
35. D
ownl
oade
d fr
om w
ww
.ann
ualr
evie
ws.
org
Acc
ess
prov
ided
by
Stan
ford
Uni
vers
ity -
Mai
n C
ampu
s -
Lan
e M
edic
al L
ibra
ry o
n 12
/13/
15. F
or p
erso
nal u
se o
nly.

ES46CH10-Knoll ARI 7 November 2015 12:5
THE PHYSIOLOGICAL ECOLOGY OF O2 IN PRESENT-DAY OCEANS
O2 is one of the more common allotropes of the element oxygen and currently makes up∼20.8%of Earth’s atmosphere by volume. However, O2 is not uniformly distributed throughout thebiosphere, particularly in aquatic habitats, because of the relatively modest solubility of oxygenin water. For example, in freshwater at biologically relevant temperatures, dissolved oxygen canreach ∼450 µmol/L, which is ∼20 times lower per unit volume than the level found in air. (Thesolubility of oxygen in saltwater is ∼25% lower.) Moreover, biological processes can influencedissolved O2 concentrations and result in habitats with even less or no O2. Thus, although O2
is replete in the atmosphere, its distribution throughout the biosphere, most of which is ocean,varies widely.
Aerobic Respiration
Cellular respiration can broadly be defined as the set of exothermic biochemical reactions thatharness energy from the oxidation of exogenous substrates to generate adenosine triphosphate(ATP). Aerobic respiration refers to a subset of these reactions in which O2 is the oxidant (orterminal electron acceptor). O2 is a powerful oxidant with a high reduction potential, and whenorganic matter is used as the reductant, the free energy yields are among the highest that organismscan capture per unit substrate (∼2,880 kJ/mol glucose). By comparison, glucose oxidation usingFe oxides as an oxidant only yields up to 441 kJ/mol, and free energy yields are even less for otherbiologically relevant oxidants, such as sulfate.
The use of oxygen clearly provides a means of harnessing a greater amount of energy per unitorganic matter. However, although O2’s potency as an electron acceptor is beneficial for energygeneration, it can be deleterious for cellular function because reactive oxygen species can damageor kill cells. Mitigating the deleterious effects of reactive oxygen species is equally critical to theevolution of aerobic life, but this subject has been reviewed well elsewhere (Metcalfe & Alonso-Alvarez 2010) and so is not addressed here. Animals must also contend with O2’s aforementionedmodest solubility, because cells and tissues are primarily water and cellular enzymatic machineryonly uses dissolved O2. Animals also face habitat-specific challenges with respect to the provi-sion of O2 (e.g., mitigating water or ion loss across gas exchange surfaces). These challenges arenot unique to modern organisms, and ancient organisms faced with the same challenges prob-ably evolved coping mechanisms similar to those we see today. Although many morphologicaladaptations to oxygen provision are captured in the fossil record, biochemical attributes are not.Reviewing the biochemical, physiological, and morphological traits that organisms have evolvedto acquire and use O2 enables us to evaluate early animals in the context of their reconstructedredox environments.
The Biochemical and Physiological Challenges of Aerobic Respiration
All animals must acquire enough O2 to maintain their respiratory and biosynthetic needs. The O2
flux into a cell is a function of environmental concentration, intra- and intercellular concentrations,and diffusion distance. In light of O2’s solubility in water, investigators have long suggested thatwhen oxygen availability is limited by diffusion, cell size will be restricted to ∼1 mm or less tomaintain appropriate diffusion distances (Harvey 1911). Most single-celled organisms are indeedsmaller than 1 mm, consistent with—if not attributable to—the need to maintain sufficient oxygendiffusion into the cell. Although cells larger than 1 mm do exist, and some of Harvey’s assumptions(such as the requirement that O2 penetrate the full volume of the cell) are not appropriate, singlecells are generally small because a higher surface-to-volume ratio facilitates the influx and effluxrequired to maintain cellular function.
www.annualreviews.org • Earth’s Second Oxygen Revolution 217
Ann
u. R
ev. E
col.
Evo
l. Sy
st. 2
015.
46:2
15-2
35. D
ownl
oade
d fr
om w
ww
.ann
ualr
evie
ws.
org
Acc
ess
prov
ided
by
Stan
ford
Uni
vers
ity -
Mai
n C
ampu
s -
Lan
e M
edic
al L
ibra
ry o
n 12
/13/
15. F
or p
erso
nal u
se o
nly.
ES46CH10-Knoll ARI 7 November 2015 12:5
b c
SW
SW
P
MM
C
5 μm
a
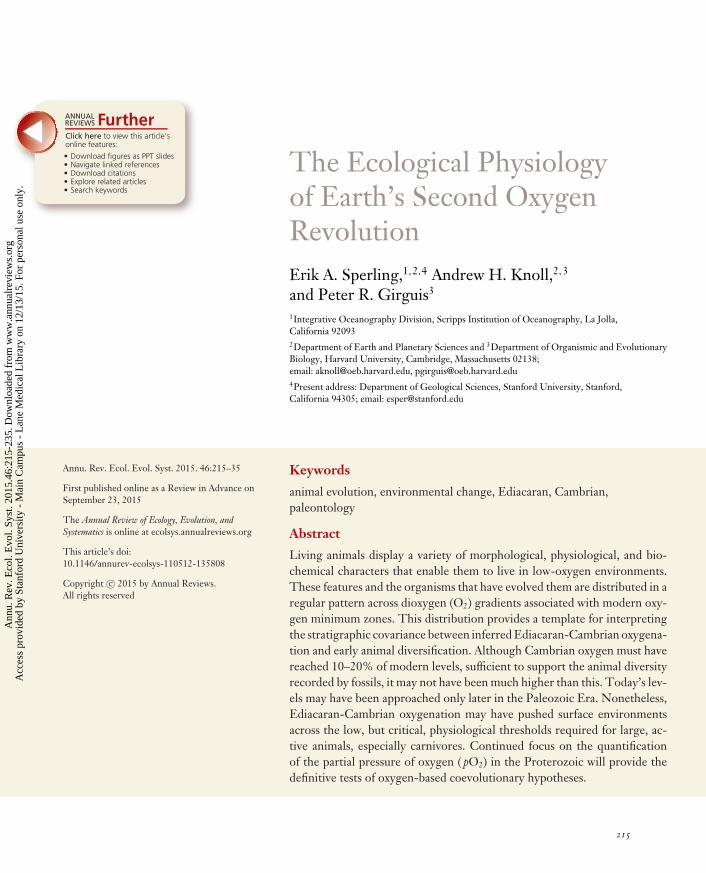
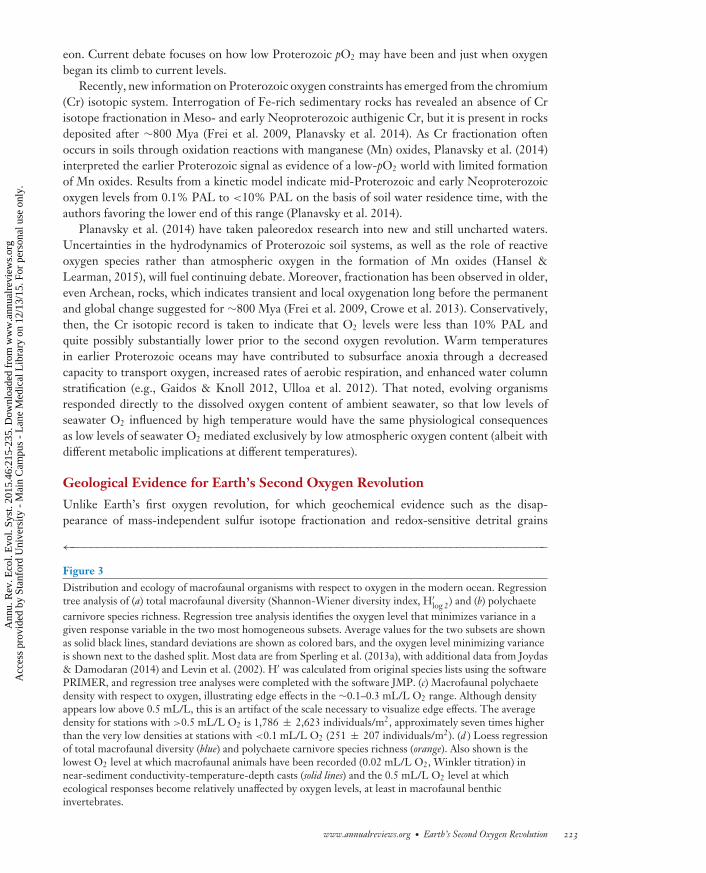
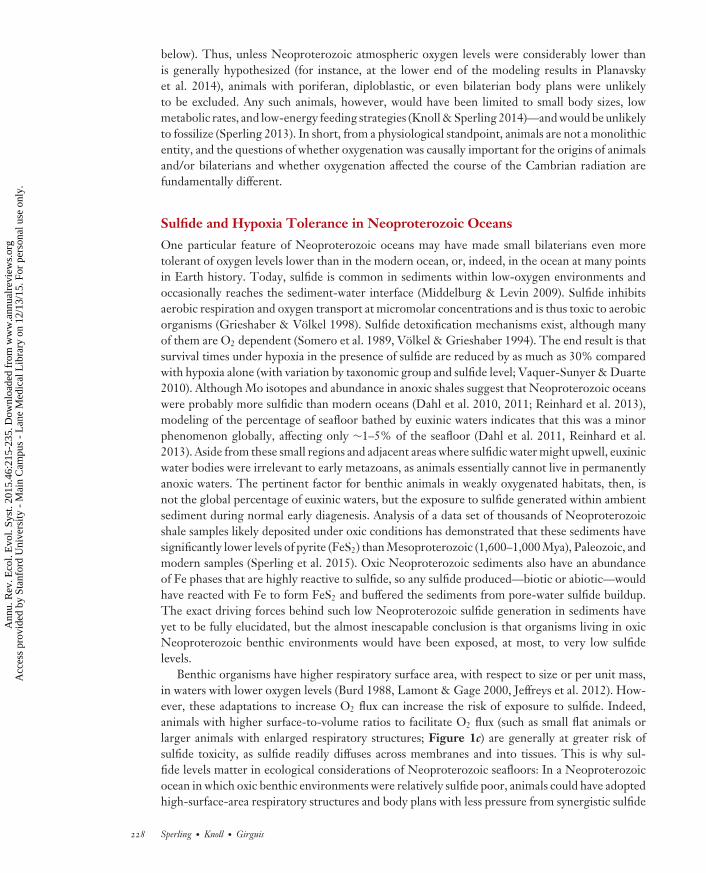
Figure 1Diploblastic and triploblastic animal body plans. (a) Transmission electron microscopy image through the body of the calcareous spongeSycon coactum. The sponge has only two cell layers, the external pinacoderm (P) and the internal choanoderm (C), which are separatedby a largely metabolically inert mesohyl (M). Both cell layers are in direct contact with seawater (SW). Image courtesy of S. Leys andoriginally published in Knoll & Sperling (2014). (b) This body plan allows sponges, such as the pictured giant barrel sponge, Xestospongiamuta, and other diploblasts, such as cnidarians and ctenophores, to achieve very large sizes while keeping the diffusion distance foroxygen to any cell short. Image courtesy of J. Pawlik. (c) Triploblastic animals with three cell layers (for instance, some nematodes andflatworms) can also obtain oxygen through pure diffusion, but it limits their body plans to very small and thin forms. Larger sizerequires an oxygen-transport system, as in the pictured polychaete Neoamphitrite robusta. This polychaete lives at ∼0.02 mL/L dioxygen(O2) on the Costa Rica margin and exhibits elaborate branchiae for increased oxygen uptake. Image courtesy of G. Rouse.
With this constraint on O2 diffusion to individual cells, the challenge for multicellular organ-isms is to create three-dimensional forms while maintaining an O2 supply to all cells. Two generalstrategies exist to achieve this goal: maintaining body shapes that minimize the diffusion distancebetween the extracellular environment and each individual cell and evolving oxygen-transportsystems that deliver O2 throughout the body. Diploblastic animals, such as sponges, placozoans,ctenophores, and cnidarians, illustrate the first strategy (Figure 1a). They maintain appropriatediffusion distances by having only two layers of cells separated by a metabolically inert substance(mesoglea in cnidarians and ctenophores, mesohyl in sponges). Thus, every cell in the organismis essentially in diffusional contact with seawater. Members of these taxa, for example, sponges,jellyfish, and massive coral heads in the tropics, can achieve great size (Figure 1b). However,although their size and diversity of shapes are impressive, closer examination reveals that the max-imum diffusion distance at any location on the organism is indeed on the order of 1 mm (Knoll &Sperling 2014). Triploblastic animals (those with three cell layers) that depend solely on diffusionmust also maintain short diffusion distances, but within a three-dimensional form. As a result, theyexhibit small and thin body plans, as exemplified by nematodes and flatworms.
The second strategy involves increasing oxygen transport to internal tissues (Figure 1c). Maxi-mizing oxygen availability has key ecological advantages, including the ability to support sustainedactivity as needed (in active predation, for example, discussed in detail below). Enhanced accessto oxygen can be achieved by any or all of the following means: (a) storing and concentratingO2 within fluids and tissues, (b) facilitating O2 flux to metabolically active tissues via circulatingoxygen-rich fluids, and (c) biochemically facilitating the diffusion of O2 into cells. Because O2 isvolatile and cannot be concentrated in a vacuole, as dissolved ions are, storing and concentratingO2 requires specialized O2-binding proteins (also called oxygen-binding pigments). The broaddistribution of some of these molecules, such as hemoglobins, across the Tree of Life suggests thatthey may predate the origin of animals (Hardison 1996), although specific circulating intracellularglobins with oxygen-transport functions probably evolved independently in multiple lineages (e.g.,deuterostomes; Hoffmann et al. 2012). Oxygen-binding proteins can be described generically as
218 Sperling · Knoll · Girguis
Ann
u. R
ev. E
col.
Evo
l. Sy
st. 2
015.
46:2
15-2
35. D
ownl
oade
d fr
om w
ww
.ann
ualr
evie
ws.
org
Acc
ess
prov
ided
by
Stan
ford
Uni
vers
ity -
Mai
n C
ampu
s -
Lan
e M
edic
al L
ibra
ry o
n 12
/13/
15. F
or p
erso
nal u
se o
nly.
ES46CH10-Knoll ARI 7 November 2015 12:5
having a single or multiple protein subunits, each of which contains a metal-containing active sitethat binds or releases O2 as a function of dissolved oxygen concentration, pH, carbon dioxide, orregulatory molecules that alter oxygen affinity. Reversibility of binding is a necessary attribute thatallows O2-binding proteins to load up on O2 where it is most available (e.g., in gills) and to releaseO2 where it is least abundant (e.g., in muscle). The presence of binding proteins can enhance therate of diffusion by up to five orders of magnitude (Costa & Sinervo 2004).
Binding proteins enable animals to achieve O2 concentrations in biological fluids and tissuesthat are equal to or greater than the per volume concentration of O2 in air. The evolution of circula-tory systems and high-surface-area gas exchange organs, which has occurred multiple times acrossa wide array of taxa, further ensures a continuous supply of O2 to tissues well beyond the reach ofdiffusion. The morphological and physiological diversity of these adaptations in modern animalsis tremendous, and paleontological and molecular evidence underscores the likelihood that com-parable diversity existed in earlier bilaterians. Indeed, simpler systems in which epithelia act as thegas exchange surface and internal organs are bathed in an open, fluid-filled cavity are still observedtoday among reptiles and amphibians, many of which are quite active. More sophisticated gas ex-change surfaces, such as gills and lungs, and closed circulatory systems are found among vertebratesand some invertebrates, including cephalopods. These features sustain even higher metabolic ratesby maximizing the efficacy of O2 uptake (and, for that matter, carbon dioxide emission).
The value of physiological and biochemical adaptations that facilitate O2 acquisition and use isapparent when considering organisms with higher metabolic rates: It comes down to a question ofsustaining oxygen flux to metabolically active tissues. However, these same mechanisms are highlyeffective in enabling an organism to acquire sufficient O2 when environmental concentrations arelow. As noted above, O2 acquisition is ultimately a matter of surface area and gradients. The varietyof morphologies that increase surface area—as well as the variety of oxygen-binding pigments andcardiopulmonary systems—found across the many extinct and modern taxa illustrates the variedmeans by which organisms can compensate for a paucity of oxygen in their environment.
The Distribution of Animals with Respect to the Modern OceanOxygen Landscape
For almost 50 years it has been known that low oxygen is a major factor controlling the structureof animal communities in oceans (Sanders 1969). A great deal of research has focused on pelagicanimals in low-oxygen settings (Childress 1995), but, as it pertains to metazoans, Earth’s secondoxygen revolution was essentially a benthic affair, with pelagic animals proliferating only near theend of the Cambrian radiation (Butterfield 1997, Peterson et al. 2005). For this reason, we focuson the benthos.
Of the low-oxygen regions in the world’s oceans, oxygen minimum zones (OMZs) are perhapsthe most useful analog in space-for-time translation. Redox profiles in the modern ocean areincreasingly well studied as a result of the recent recognition that some OMZs are expandingand shoaling (Bograd et al. 2008, Stramma et al. 2008, Gilly et al. 2013), with potentially negativeeffects for both pelagic and benthic ecosystems, including commercially important fisheries. OMZsintersect the seafloor over large areas of continental margins (Helly & Levin 2004) and thus providenatural oxygen gradients that can be used to study how animal communities respond to differentoxygen levels. The major OMZs are geologically long-lasting features (Levin 2003, Jacobs et al.2004), so the animals that inhabit them are well adapted to low-oxygen conditions (locally, OMZsare dynamic on glacial-interglacial timescales; Moffitt et al. 2015).
The nature of these adaptations is important in considering their relevance to ProterozoicEarth history: Are they evolutionary novelties derived relatively recently or general strategies
www.annualreviews.org • Earth’s Second Oxygen Revolution 219
Ann
u. R
ev. E
col.
Evo
l. Sy
st. 2
015.
46:2
15-2
35. D
ownl
oade
d fr
om w
ww
.ann
ualr
evie
ws.
org
Acc
ess
prov
ided
by
Stan
ford
Uni
vers
ity -
Mai
n C
ampu
s -
Lan
e M
edic
al L
ibra
ry o
n 12
/13/
15. F
or p
erso
nal u
se o
nly.

ES46CH10-Knoll ARI 7 November 2015 12:5
that would have been available to early animals? Although the adaptations of the OMZ benthoshave not been studied in detail, most of them—including thin body plans, enhanced respiratorysurface area, and high-affinity respiratory proteins (Levin 2003)—are relatively straightforwardmodifications adopted independently by many clades. There is no a priori reason such adaptationswould not have been available to early animals as well. The one reported exception to this statementis a recently described loriciferan from an anoxic and sulfidic Mediterranean salt basin (Danovaroet al. 2010). If the data have been interpreted correctly, this animal has irrevocably convertedits mitochondria into hydrogenosomes. Although fascinating from a biochemical standpoint, thisexample has few implications for early animal evolution, as this evolutionary trajectory is a one-way street and the loriciferan presumably cannot function aerobically. (Further, it would requiredietary sterols sourced by aerobes.)
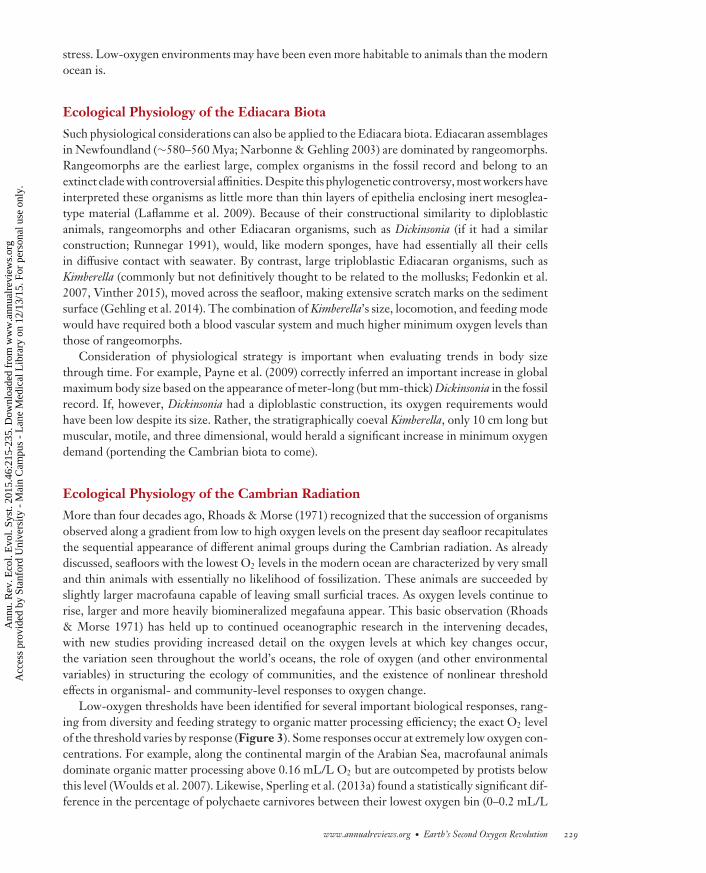
For animals with normal mitochondria, the O2 concentration at which metazoans can surviveis vanishingly low; the lower threshold beyond which no animals can live remains unknown.For example, animals occur in OMZ sediments at O2 levels as low as standard oceanographictechniques can measure (e.g., 0.02 mL/L O2 via Winkler titration; Levin et al. 2002, Palma et al.2005, Raman et al. 2014) (Figure 1c; see Figure 2 for nomenclature of oxygen measurement).Even these estimates are conservative, as they measure O2 concentrations in water several meters
μmol/kg
0 4422 66 884.8
0 0.5 1.0 1.5 2.00.11 1.43 =2 mg/L
Suboxic
Severehypoxia
Hypoxia Oxic
0.05–0.35
mL/L
0 167.8 31
(T = 10°C, S = 35, P = 1 atm)
1.7 23
Saturation (%)
0.2–4.2
Figure 2Description of the low-O2 state. Today, normal surface ocean concentrations range from ∼5 to 10 mL/Ldepending on temperature and salinity. Oxygen measurement styles include mL/L (used by benthicecologists and many oceanographers); µM or µM/kg (used by chemists and geochemists); gas tension inmmHg or KPa (used by physiologists); percentage of present atmospheric levels (used by geologists/modelers); and the partial pressure of oxygen, expressed in terms of milli-atmospheres, percent saturation,and mg/L O2. Recent years have seen an explosion of conflicting definitions for low-O2 states, especially inthe ecological and global change literature. Hofmann et al. (2011) summarized the definitions used orsuggested for different oxygen states in 29 different studies, and the scheme they developed is depicted here.Compared with traditional classification schemes (e.g., Tyson & Pearson 1991), the operational oxic-hypoxiaboundary (or oxic-dysoxic boundary) has shifted slightly lower, from 2 mL/L in Tyson & Pearson to 2 mg/L(1.43 mL/L). The definition of hypoxia varies widely, however, from 4.2 mL/L to 0.2 mL/L. A separatecategory of severe hypoxia at 0.5 mL/L O2 has emerged, with no alternate definitions yet published. Thedefinition of suboxic has also shifted lower, from 0.2 mL/L in Tyson & Pearson to a median of 0.11 mL/L(∼5 µM), although, again, multiple definitions, from 0.05 mL/L to 0.32 mL/L, have been proposed. Thesedefinitions, although useful for communication, are operational (e.g., Canfield & Thamdrup 2009). Dashedarrows schematically represent published ranges. Abbreviations: S, salinity in permil; P, atmosphericpressure; T, temperature.
220 Sperling · Knoll · Girguis
Ann
u. R
ev. E
col.
Evo
l. Sy
st. 2
015.
46:2
15-2
35. D
ownl
oade
d fr
om w
ww
.ann
ualr
evie
ws.
org
Acc
ess
prov
ided
by
Stan
ford
Uni
vers
ity -
Mai
n C
ampu
s -
Lan
e M
edic
al L
ibra
ry o
n 12
/13/
15. F
or p
erso
nal u
se o
nly.

ES46CH10-Knoll ARI 7 November 2015 12:5
above the benthos (Breur et al. 2009). Determining the actual minimum levels animals can toleratewill require more sensitive measurements (Revsbech et al. 2009). Regardless, in these microxic(suboxic) conditions, animals tend to be rare (i.e., at reduced density), generally unmineralized,and of low diversity. Such environments are dominated by nematodes, oligochaetes, and somepolychaetes with extremely small and thin bodies (between 50 and 300 µm; Levin 2003).
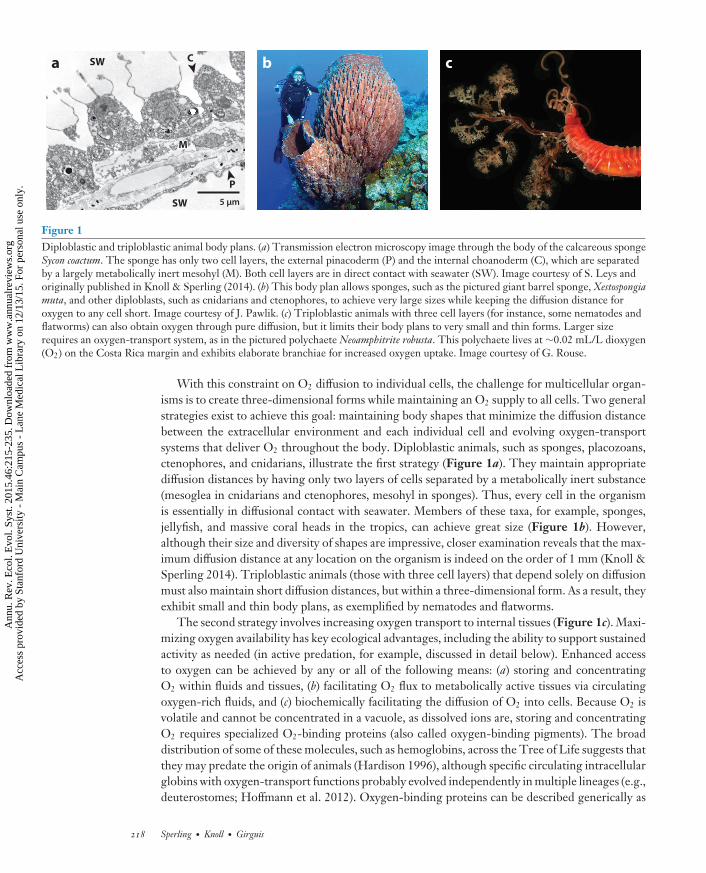
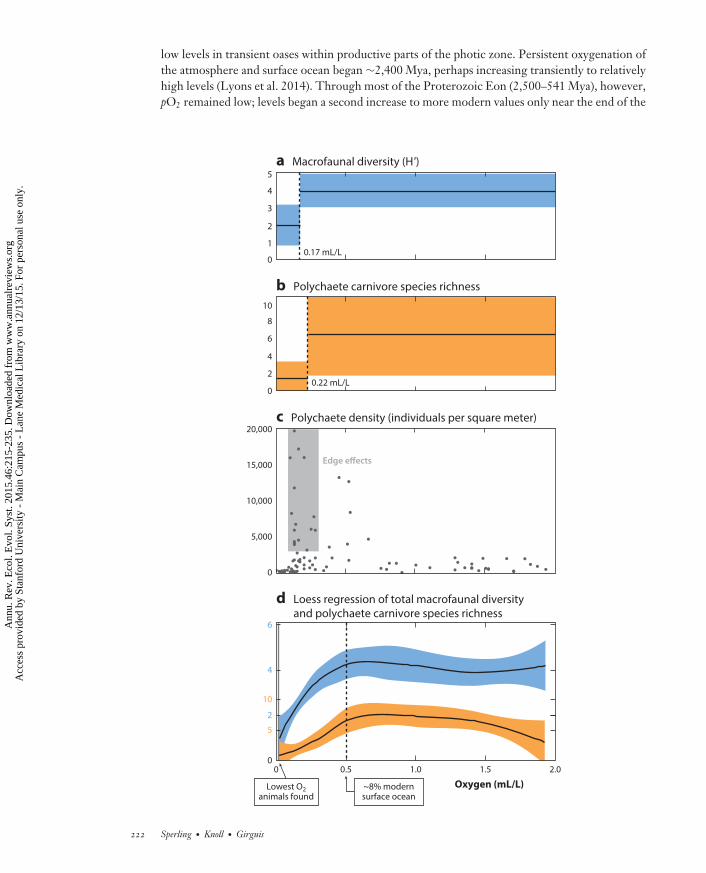
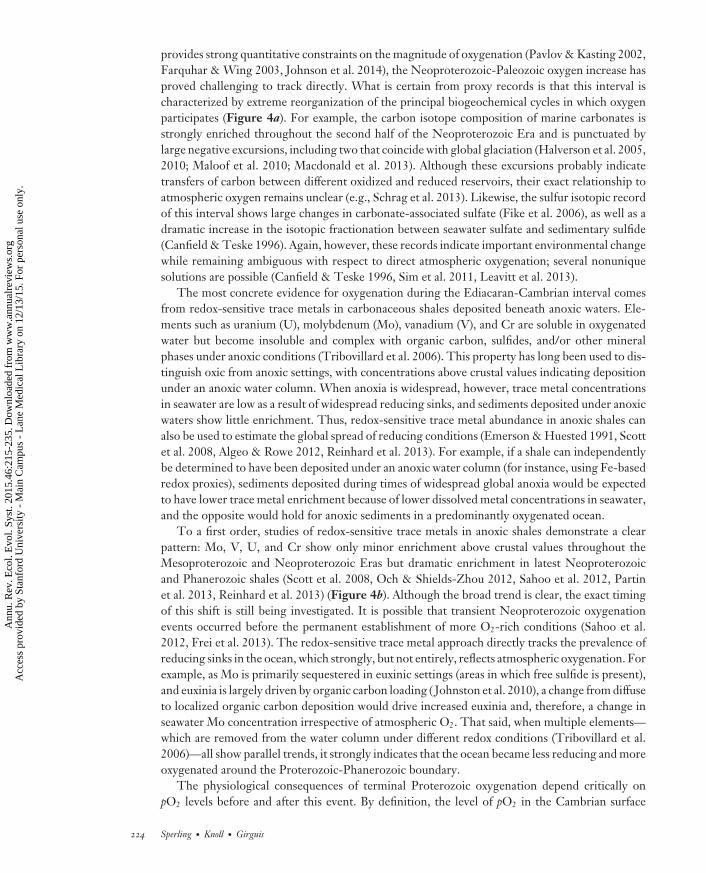
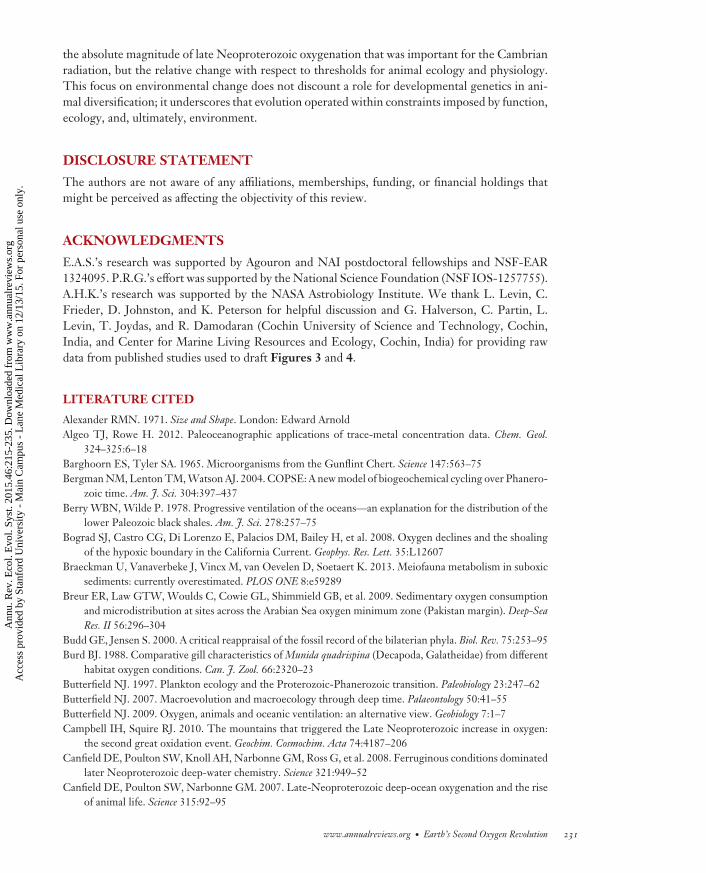
At slightly higher O2 concentrations, animal communities begin to change with respect tobody size, diversity, and lifestyle (Figure 3). Macrofaunal taxa (those retained on a 300-µm sieve)typically begin to appear in greater numbers above ∼0.1 mL/L O2 (Levin 2003). The exactoxygen level differs among locations, reflecting the complex interplay of food availability, releasefrom oxygen limitation, and low predation pressures that controls macrofaunal densities andcommunities. At these slightly higher oxygen levels (0.1–0.2 mL/L O2), animals generally stillhave relatively low diversity but often show density maxima, resulting from an abundance ofopportunistic taxa (edge effects; Mullins et al. 1985) (Figure 3c). Macrofauna in this oxygen rangeare generally deposit feeders and detritivores; food webs appear to be relatively short, with anabsence of predators (Sperling et al. 2013a). Megafauna (organisms easily visible to the naked eye)also show edge effects, although their oxygen thresholds are higher than those of macrofauna.Overall body size in a transect through an OMZ thus generally increases with rising oxygen levels(Gooday et al. 2009), although this statement may not hold for certain individual taxa becauseof the interaction between oxygen tolerance and food supply. Food availability, as measured bypercent organic carbon, often has an inverse relationship with oxygen as a result of lower overallutilization at lower oxygen levels (Levin 2003). The edges of OMZs (∼0.3–0.5 mL/L O2) supportdense communities of megafaunal brittle stars, starfish, crabs, sponges, and shrimp and includemore robustly biomineralized organisms. An O2 level of 0.5 mL/L, which corresponds to thehistorical definition of an OMZ, is also increasingly being identified by statistical analyses as theapproximate level at which oxygen effects on factors such as macrofaunal carnivory and speciesdiversity become less pronounced (Levin & Gage 1998, Sperling et al. 2013a) (Figure 3d ).
Although OMZs are perhaps our best analogs for ancient low-O2 oceans, several differencesbetween the two need to be considered. Most important, perhaps, are differences in causation.Ancient low-oxygen oceans presumably resulted from equilibrium with a low-oxygen atmosphere.By contrast, modern OMZs sit beneath a relatively high-oxygen atmosphere; O2 depletion at depthreflects high rates of aerobic remineralization of organic matter. O2 minima in the modern oceanare thus also inorganic carbon maxima (Paulmier et al. 2011), characterized by low pH. This hasimplications, for instance, for interpreting the observation that taxa in the core of modern OMZsare often lightly calcified or unmineralized (Levin 2003). The relative lack of mineralization couldbe related to lowered pH and carbonate saturation state, the bioenergetics of calcification inhypoxic conditions, or the relative lack of predators in low-O2 environments (e.g., Sperling et al.2013a). These highly correlated variables are difficult to decouple. Other important ecologicalparameters (including temperature, organic carbon quantity and quality, light, and pressure) alsovary with depth. An exciting future research direction will be to better understand the intertwinedroles of these factors and redox in governing modern and ancient ecological patterns.
ECOLOGICAL PHYSIOLOGY OF THE SECONDOXYGEN REVOLUTION
Oxygen Levels Prior to Late Neoproterozoic Oxygenation
Broad qualitative consensus exists on the long-term history of biospheric oxygen (e.g., Holland2006, Lyons et al. 2014). In the Archean Eon (3,800–2,500 Mya), oxygen was, at best, confined to
www.annualreviews.org • Earth’s Second Oxygen Revolution 221
Ann
u. R
ev. E
col.
Evo
l. Sy
st. 2
015.
46:2
15-2
35. D
ownl
oade
d fr
om w
ww
.ann
ualr
evie
ws.
org
Acc
ess
prov
ided
by
Stan
ford
Uni
vers
ity -
Mai
n C
ampu
s -
Lan
e M
edic
al L
ibra
ry o
n 12
/13/
15. F
or p
erso
nal u
se o
nly.
ES46CH10-Knoll ARI 7 November 2015 12:5
low levels in transient oases within productive parts of the photic zone. Persistent oxygenation ofthe atmosphere and surface ocean began ∼2,400 Mya, perhaps increasing transiently to relativelyhigh levels (Lyons et al. 2014). Through most of the Proterozoic Eon (2,500–541 Mya), however,pO2 remained low; levels began a second increase to more modern values only near the end of the
2
6
10
4
8
0
b Polychaete carnivore species richness
0.22 mL/L
d Loess regression of total macrofaunal diversityand polychaete carnivore species richness
2
4
6
0
5
10
Oxygen (mL/L)
0.5 1.51.0 2.00
Lowest O2
animals found~8% modernsurface ocean
1
3
5
2
4
0
a Macrofaunal diversity (H')
0.17 mL/L
Edge effects
5,000
10,000
15,000
20,000c Polychaete density (individuals per square meter)
0
222 Sperling · Knoll · Girguis
Ann
u. R
ev. E
col.
Evo
l. Sy
st. 2
015.
46:2
15-2
35. D
ownl
oade
d fr
om w
ww
.ann
ualr
evie
ws.
org
Acc
ess
prov
ided
by
Stan
ford
Uni
vers
ity -
Mai
n C
ampu
s -
Lan
e M
edic
al L
ibra
ry o
n 12
/13/
15. F
or p
erso
nal u
se o
nly.
ES46CH10-Knoll ARI 7 November 2015 12:5
eon. Current debate focuses on how low Proterozoic pO2 may have been and just when oxygenbegan its climb to current levels.
Recently, new information on Proterozoic oxygen constraints has emerged from the chromium(Cr) isotopic system. Interrogation of Fe-rich sedimentary rocks has revealed an absence of Crisotope fractionation in Meso- and early Neoproterozoic authigenic Cr, but it is present in rocksdeposited after ∼800 Mya (Frei et al. 2009, Planavsky et al. 2014). As Cr fractionation oftenoccurs in soils through oxidation reactions with manganese (Mn) oxides, Planavsky et al. (2014)interpreted the earlier Proterozoic signal as evidence of a low-pO2 world with limited formationof Mn oxides. Results from a kinetic model indicate mid-Proterozoic and early Neoproterozoicoxygen levels from 0.1% PAL to <10% PAL on the basis of soil water residence time, with theauthors favoring the lower end of this range (Planavsky et al. 2014).
Planavsky et al. (2014) have taken paleoredox research into new and still uncharted waters.Uncertainties in the hydrodynamics of Proterozoic soil systems, as well as the role of reactiveoxygen species rather than atmospheric oxygen in the formation of Mn oxides (Hansel &Learman, 2015), will fuel continuing debate. Moreover, fractionation has been observed in older,even Archean, rocks, which indicates transient and local oxygenation long before the permanentand global change suggested for ∼800 Mya (Frei et al. 2009, Crowe et al. 2013). Conservatively,then, the Cr isotopic record is taken to indicate that O2 levels were less than 10% PAL andquite possibly substantially lower prior to the second oxygen revolution. Warm temperaturesin earlier Proterozoic oceans may have contributed to subsurface anoxia through a decreasedcapacity to transport oxygen, increased rates of aerobic respiration, and enhanced water columnstratification (e.g., Gaidos & Knoll 2012, Ulloa et al. 2012). That noted, evolving organismsresponded directly to the dissolved oxygen content of ambient seawater, so that low levels ofseawater O2 influenced by high temperature would have the same physiological consequencesas low levels of seawater O2 mediated exclusively by low atmospheric oxygen content (albeit withdifferent metabolic implications at different temperatures).
Geological Evidence for Earth’s Second Oxygen Revolution
Unlike Earth’s first oxygen revolution, for which geochemical evidence such as the disap-pearance of mass-independent sulfur isotope fractionation and redox-sensitive detrital grains
←−−−−−−−−−−−−−−−−−−−−−−−−−−−−−−−−−−−−−−−−−−−−−−−−−−−−−−−−−−−−−−−−−−−−−−−−Figure 3Distribution and ecology of macrofaunal organisms with respect to oxygen in the modern ocean. Regressiontree analysis of (a) total macrofaunal diversity (Shannon-Wiener diversity index, H′log 2) and (b) polychaetecarnivore species richness. Regression tree analysis identifies the oxygen level that minimizes variance in agiven response variable in the two most homogeneous subsets. Average values for the two subsets are shownas solid black lines, standard deviations are shown as colored bars, and the oxygen level minimizing varianceis shown next to the dashed split. Most data are from Sperling et al. (2013a), with additional data from Joydas& Damodaran (2014) and Levin et al. (2002). H′ was calculated from original species lists using the softwarePRIMER, and regression tree analyses were completed with the software JMP. (c) Macrofaunal polychaetedensity with respect to oxygen, illustrating edge effects in the ∼0.1–0.3 mL/L O2 range. Although densityappears low above 0.5 mL/L, this is an artifact of the scale necessary to visualize edge effects. The averagedensity for stations with >0.5 mL/L O2 is 1,786 ± 2,623 individuals/m2, approximately seven times higherthan the very low densities at stations with <0.1 mL/L O2 (251 ± 207 individuals/m2). (d ) Loess regressionof total macrofaunal diversity (blue) and polychaete carnivore species richness (orange). Also shown is thelowest O2 level at which macrofaunal animals have been recorded (0.02 mL/L O2, Winkler titration) innear-sediment conductivity-temperature-depth casts (solid lines) and the 0.5 mL/L O2 level at whichecological responses become relatively unaffected by oxygen levels, at least in macrofaunal benthicinvertebrates.
www.annualreviews.org • Earth’s Second Oxygen Revolution 223
Ann
u. R
ev. E
col.
Evo
l. Sy
st. 2
015.
46:2
15-2
35. D
ownl
oade
d fr
om w
ww
.ann
ualr
evie
ws.
org
Acc
ess
prov
ided
by
Stan
ford
Uni
vers
ity -
Mai
n C
ampu
s -
Lan
e M
edic
al L
ibra
ry o
n 12
/13/
15. F
or p
erso
nal u
se o
nly.
ES46CH10-Knoll ARI 7 November 2015 12:5
provides strong quantitative constraints on the magnitude of oxygenation (Pavlov & Kasting 2002,Farquhar & Wing 2003, Johnson et al. 2014), the Neoproterozoic-Paleozoic oxygen increase hasproved challenging to track directly. What is certain from proxy records is that this interval ischaracterized by extreme reorganization of the principal biogeochemical cycles in which oxygenparticipates (Figure 4a). For example, the carbon isotope composition of marine carbonates isstrongly enriched throughout the second half of the Neoproterozoic Era and is punctuated bylarge negative excursions, including two that coincide with global glaciation (Halverson et al. 2005,2010; Maloof et al. 2010; Macdonald et al. 2013). Although these excursions probably indicatetransfers of carbon between different oxidized and reduced reservoirs, their exact relationship toatmospheric oxygen remains unclear (e.g., Schrag et al. 2013). Likewise, the sulfur isotopic recordof this interval shows large changes in carbonate-associated sulfate (Fike et al. 2006), as well as adramatic increase in the isotopic fractionation between seawater sulfate and sedimentary sulfide(Canfield & Teske 1996). Again, however, these records indicate important environmental changewhile remaining ambiguous with respect to direct atmospheric oxygenation; several nonuniquesolutions are possible (Canfield & Teske 1996, Sim et al. 2011, Leavitt et al. 2013).
The most concrete evidence for oxygenation during the Ediacaran-Cambrian interval comesfrom redox-sensitive trace metals in carbonaceous shales deposited beneath anoxic waters. Ele-ments such as uranium (U), molybdenum (Mo), vanadium (V), and Cr are soluble in oxygenatedwater but become insoluble and complex with organic carbon, sulfides, and/or other mineralphases under anoxic conditions (Tribovillard et al. 2006). This property has long been used to dis-tinguish oxic from anoxic settings, with concentrations above crustal values indicating depositionunder an anoxic water column. When anoxia is widespread, however, trace metal concentrationsin seawater are low as a result of widespread reducing sinks, and sediments deposited under anoxicwaters show little enrichment. Thus, redox-sensitive trace metal abundance in anoxic shales canalso be used to estimate the global spread of reducing conditions (Emerson & Huested 1991, Scottet al. 2008, Algeo & Rowe 2012, Reinhard et al. 2013). For example, if a shale can independentlybe determined to have been deposited under an anoxic water column (for instance, using Fe-basedredox proxies), sediments deposited during times of widespread global anoxia would be expectedto have lower trace metal enrichment because of lower dissolved metal concentrations in seawater,and the opposite would hold for anoxic sediments in a predominantly oxygenated ocean.
To a first order, studies of redox-sensitive trace metals in anoxic shales demonstrate a clearpattern: Mo, V, U, and Cr show only minor enrichment above crustal values throughout theMesoproterozoic and Neoproterozoic Eras but dramatic enrichment in latest Neoproterozoicand Phanerozoic shales (Scott et al. 2008, Och & Shields-Zhou 2012, Sahoo et al. 2012, Partinet al. 2013, Reinhard et al. 2013) (Figure 4b). Although the broad trend is clear, the exact timingof this shift is still being investigated. It is possible that transient Neoproterozoic oxygenationevents occurred before the permanent establishment of more O2-rich conditions (Sahoo et al.2012, Frei et al. 2013). The redox-sensitive trace metal approach directly tracks the prevalence ofreducing sinks in the ocean, which strongly, but not entirely, reflects atmospheric oxygenation. Forexample, as Mo is primarily sequestered in euxinic settings (areas in which free sulfide is present),and euxinia is largely driven by organic carbon loading ( Johnston et al. 2010), a change from diffuseto localized organic carbon deposition would drive increased euxinia and, therefore, a change inseawater Mo concentration irrespective of atmospheric O2. That said, when multiple elements—which are removed from the water column under different redox conditions (Tribovillard et al.2006)—all show parallel trends, it strongly indicates that the ocean became less reducing and moreoxygenated around the Proterozoic-Phanerozoic boundary.
The physiological consequences of terminal Proterozoic oxygenation depend critically onpO2 levels before and after this event. By definition, the level of pO2 in the Cambrian surface
224 Sperling · Knoll · Girguis
Ann
u. R
ev. E
col.
Evo
l. Sy
st. 2
015.
46:2
15-2
35. D
ownl
oade
d fr
om w
ww
.ann
ualr
evie
ws.
org
Acc
ess
prov
ided
by
Stan
ford
Uni
vers
ity -
Mai
n C
ampu
s -
Lan
e M
edic
al L
ibra
ry o
n 12
/13/
15. F
or p
erso
nal u
se o
nly.
ES46CH10-Knoll ARI 7 November 2015 12:5
Cry
og
en
ian
Ed
iaca
ran
Ca
mb
ria
n
Fortunian
Stage 2
Stage 3Stage 4Stage 5
Terr.
Series 2
Mil
lio
ns
of
ye
ars
be
fore
pre
sen
t
Ord
.Early
500
520
540
560
580
600
620
640
660
680
700
720
740
760
780
800
480
Furo.
Series 3
Sturtian glaciation
Marinoanglaciation
Gaskiersglaciation
0 250 500 0.4 0.6 0.8–12 –6 0 6 12
Range of Cenozoic variation
(4)
a Carbon isotopechemostratigraphy (δ13C)
b Uranium (ppm) inanoxic shales
c Binned iron dataproportion anoxic
To
nia
n
1
2
3
45
6
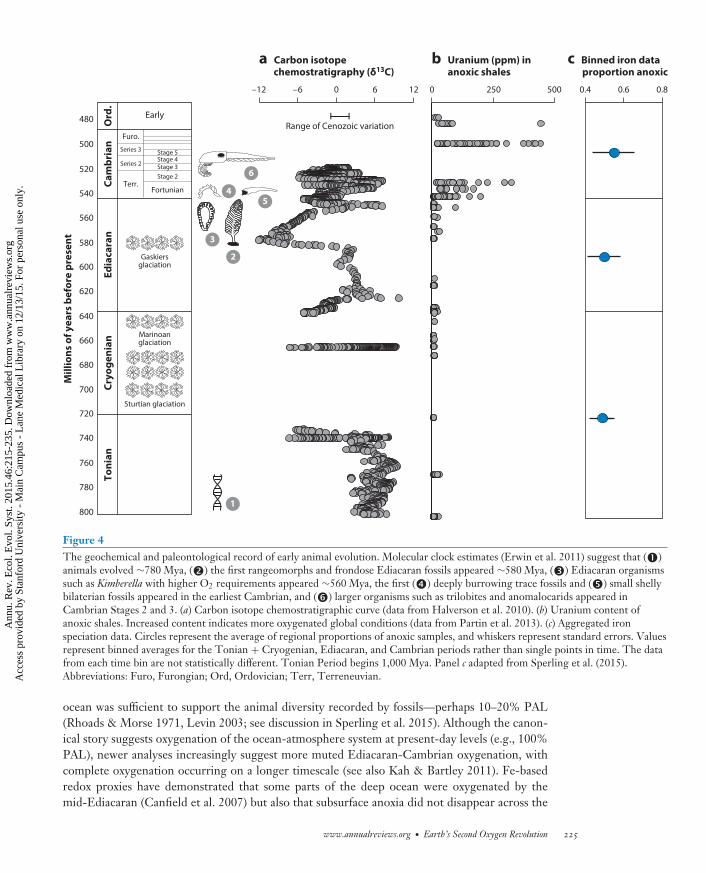
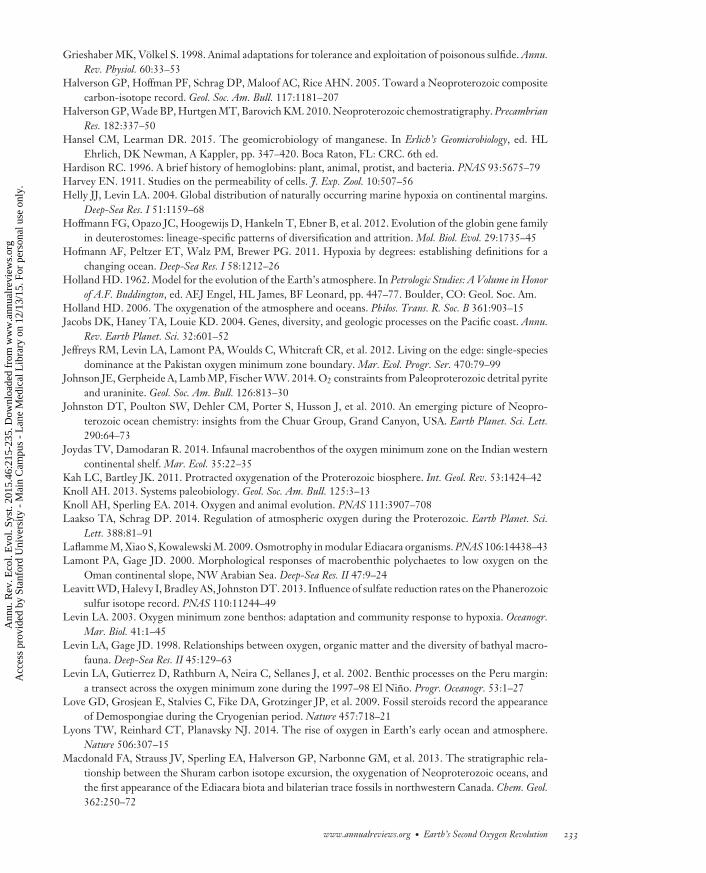
Figure 4The geochemical and paleontological record of early animal evolution. Molecular clock estimates (Erwin et al. 2011) suggest that (�)animals evolved ∼780 Mya, (�) the first rangeomorphs and frondose Ediacaran fossils appeared ∼580 Mya, (�) Ediacaran organismssuch as Kimberella with higher O2 requirements appeared ∼560 Mya, the first (�) deeply burrowing trace fossils and (�) small shellybilaterian fossils appeared in the earliest Cambrian, and (�) larger organisms such as trilobites and anomalocarids appeared inCambrian Stages 2 and 3. (a) Carbon isotope chemostratigraphic curve (data from Halverson et al. 2010). (b) Uranium content ofanoxic shales. Increased content indicates more oxygenated global conditions (data from Partin et al. 2013). (c) Aggregated ironspeciation data. Circles represent the average of regional proportions of anoxic samples, and whiskers represent standard errors. Valuesrepresent binned averages for the Tonian + Cryogenian, Ediacaran, and Cambrian periods rather than single points in time. The datafrom each time bin are not statistically different. Tonian Period begins 1,000 Mya. Panel c adapted from Sperling et al. (2015).Abbreviations: Furo, Furongian; Ord, Ordovician; Terr, Terreneuvian.
ocean was sufficient to support the animal diversity recorded by fossils—perhaps 10–20% PAL(Rhoads & Morse 1971, Levin 2003; see discussion in Sperling et al. 2015). Although the canon-ical story suggests oxygenation of the ocean-atmosphere system at present-day levels (e.g., 100%PAL), newer analyses increasingly suggest more muted Ediacaran-Cambrian oxygenation, withcomplete oxygenation occurring on a longer timescale (see also Kah & Bartley 2011). Fe-basedredox proxies have demonstrated that some parts of the deep ocean were oxygenated by themid-Ediacaran (Canfield et al. 2007) but also that subsurface anoxia did not disappear across the
www.annualreviews.org • Earth’s Second Oxygen Revolution 225
Ann
u. R
ev. E
col.
Evo
l. Sy
st. 2
015.
46:2
15-2
35. D
ownl
oade
d fr
om w
ww
.ann
ualr
evie
ws.
org
Acc
ess
prov
ided
by
Stan
ford
Uni
vers
ity -
Mai
n C
ampu
s -
Lan
e M
edic
al L
ibra
ry o
n 12
/13/
15. F
or p
erso
nal u
se o
nly.

ES46CH10-Knoll ARI 7 November 2015 12:5
Proterozoic-Cambrian boundary (Canfield et al. 2008, Gill et al. 2011). Indeed, statistical analysesof Fe data indicate no significant difference between Ediacaran and Cambrian data sets (Figure 4c;Sperling et al. 2015), which implies that full oxygenation occurred later. [Biogeochemical model-ing suggests that persistent subsurface anoxia requires atmospheric pO2 <∼40% PAL, providingan upper bound for Cambrian oxygen levels (Canfield & Teske 1996).] Even among trace metaldata, Sperling et al. (2015) demonstrated a continued increase in U abundance in anoxic shalesbetween the early and late Paleozoic Era. Mo isotopes (Dahl et al. 2010), the global sedimen-tary sulfate reduction rate (Leavitt et al. 2013), a decreasing magnitude of sulfate sulfur isotopeexcursions (Gill et al. 2007), and some models of atmospheric O2 (Bergman et al. 2004) also sug-gest that oxygenation of the ocean-atmosphere system continued after the Cambrian Period. Fulloxygenation of the oceans is, thus, increasingly being pushed further into the Paleozoic, a viewthat harkens back to earlier hypotheses based on the distribution of black shales (Berry & Wilde1978).
Why, then, did oxygen levels change in the late Neoproterozoic Era? On this subject, noconsensus exists. Some have hypothesized that the Neoproterozoic breakup of a supercontinentand subsequent continent-continent collision increased erosional fluxes into the oceans; thesefluxes would have boosted nutrient availability while facilitating organic carbon burial (Derryet al. 1992, Campbell & Squire 2010, Cawood & Hawkesworth 2014). However, although such atrigger could, in principle, drive pO2 levels upward, the long-term persistence of a new redox stagerequires an essentially permanent change in the Earth system. As an example, Laakso & Schrag(2014) hypothesized that under a low-pO2 atmosphere, much of the phosphorus (P) released bycontinental weathering would be absorbed on Fe oxides precipitated from rivers and estuaries andnever make it into the oceans. Any event that pushed pO2 to higher levels—and end-Proterozoicorogenesis is a reasonable candidate—would change the kinetics of Fe oxidation to allow muchmore P to enter and fertilize continental shelf seas. The subsequent burial of this reduced carbonwould then allow the oxygen produced by photosynthesis to accumulate in the atmosphere. Alter-natively, B. Mills et al. (2014) proposed that a long-term shift in the balance between terrestrialsilicate weathering and ocean crust alteration mediated the second oxygen revolution. Still others(e.g., Butterfield 2009) speculate that the event that reordered the Earth system was, in fact, theemergence of animals themselves.
In summary, Mesoproterozoic and early Neoproterozoic oceans probably had very low oxygenlevels, ∼1–10% PAL or perhaps even lower. Toward the end of the Neoproterozoic Era, in theCryogenian and Ediacaran Periods, the isotopic records of elements that interact with the oxygencycle, such as carbon and sulfur, show extreme changes, but these changes have been difficult torelate quantitatively to changing oxygen levels. The inventory of redox-sensitive trace elements inanoxic shales expands dramatically around the Proterozoic-Cambrian boundary, which suggestsan important oxygenation event at this time. However, some analyses of these trace metal records,as well as other redox proxies, indicate that the increase in oxygen to modern levels was a protractedevent, culminating only in later Paleozoic times.
Ecological Physiology of the Earliest Animals
Molecular divergence estimates and the organic geochemical record agree that animals probablyoriginated during the later Tonian or Cryogenian Periods (Figure 4; Love et al. 2009, Erwinet al. 2011), hundreds of millions of years before the inferred Ediacaran-Cambrian oxygenationevent. An enduring question is whether the first appearance of metazoan or bilaterian body planswas limited by oxygen levels in early Neoproterozoic oceans (Mills & Canfield 2014). How do thephysiological requirements for animal function compare with geochemical inferences about pO2
226 Sperling · Knoll · Girguis
Ann
u. R
ev. E
col.
Evo
l. Sy
st. 2
015.
46:2
15-2
35. D
ownl
oade
d fr
om w
ww
.ann
ualr
evie
ws.
org
Acc
ess
prov
ided
by
Stan
ford
Uni
vers
ity -
Mai
n C
ampu
s -
Lan
e M
edic
al L
ibra
ry o
n 12
/13/
15. F
or p
erso
nal u
se o
nly.
ES46CH10-Knoll ARI 7 November 2015 12:5
levels, if we account for animals of varying size, body plans, and functional capabilities differingin their minimum oxygen requirements?
From a body plan standpoint, the earliest animals must have exemplified the first strategyoutlined earlier for coping with O2 limitation. Debate exists about the exact phylogenetic rela-tionships at the base of Metazoa (Nosenko et al. 2013), but all basal lineages are diploblastic. Withessentially all cells in diffusional contact with seawater (Figure 1a), and if we assume metabolicrates similar to those of diploblasts today, the theoretical oxygen requirements of these organismswould be quite low. Specifically, their metabolic demands per cell would not be drastically dif-ferent from those of the single-celled eukaryotes that inhabited Proterozoic oceans long beforeanimals arose (Runnegar 1982, Sperling et al. 2013b, Knoll & Sperling 2014). Thus, the earliestanimals were unlikely to experience O2 limitations. D.B. Mills et al. (2014) recently providedexperimental confirmation of this inference by demonstrating that a temperate shallow-watersponge, with no apparent adaptations for low-oxygen conditions, was able to survive and evengrow at oxygen levels as low as 0.5% PAL. The oxygen levels required to escape other constraints,such as steroid synthesis (Waldbauer et al. 2011), collagen synthesis, or the development of a UVshield (reviewed in Mills & Canfield 2014), are also exceedingly low. With an ancestral capacityto survive brief periods of anoxia (Mentel et al. 2014), early diploblasts likely had only minimaloxygen requirements.
Bilaterian (triploblastic) animals have different oxygen demands, and so it is possible that earlydiploblastic animals were not oxygen limited, but emerging bilaterians were. A substantial body ofresearch uses models to estimate the maximum size of bilaterians at different oxygen levels, underthe two general strategies of pure diffusion or a blood vascular system (Alexander 1971; Runnegar1982, 1991; Payne et al. 2010). Although respiratory pigments and a blood vascular system greatlyincrease oxygen transport, at least some respiratory pigments evolved early in (or before) animalevolution. Thus, these adaptations are related more to the earliest evolution of bilaterians than tothe Cambrian radiation (Erwin et al. 2011). The different modes of oxygen transport—from simplediffusion to complex vascular systems—are, therefore, optimal designs for life below and abovea given size threshold (Budd & Jensen 2000). Previous studies all reached the same conclusion:Under low oxygen levels, with either transport system, bilaterians are limited to small sizes.
To investigate whether Neoproterozoic oxygen levels would actually have limited bilaterianevolution, theoretical equations can be inverted to calculate the minimum oxygen requirementfor a small bilaterian. Such calculations indicate that bilaterians can live at O2 values <0.5% PAL(Sperling et al. 2013b) and perhaps far lower. A turn to the modern ocean shows that theory andobservation are aligned: Bilaterian animals are present in many areas with <0.1 mL/L O2 (∼1.5%of modern surface ocean concentrations) and some with levels as low as 0.02 mL/L (∼0.3%).Planavsky et al. (2014) considered these theoretical values and empirical observations to be biasedtoward lower values, because they do not consider alternative life history stages or synergisticeffects. However, in our view these are likely overestimates of the minimal oxygen requirementsof bilaterians, for the following reasons: (a) Alternative life history stages, such as larvae, have higherper-gram metabolic rates but lower total oxygen requirements than adults, for the simple reasonthat they are smaller (Alexander 1971). (b) Theoretical calculations of minimal O2 requirementsassume a perfectly tubular animal with no adaptations to increase respiratory surface area, but thisassumption does not represent most known animals (see discussion in Sperling et al. 2013b). (c) Thetheoretical calculations used metabolic requirements that are likely an overestimate (Braeckmanet al. 2013). (d ) Empirical observations of bilaterians living at the resolvable edge of low O2
concentrations (0.02 mL/L) were conducted using near-sediment conductivity-temperature-depthcasts, and actual seafloor oxygen concentrations are even lower (Breur et al. 2009). (e) Finally,synergistic stressors such as sulfide were probably not important in Neoproterozoic oceans (see
www.annualreviews.org • Earth’s Second Oxygen Revolution 227
Ann
u. R
ev. E
col.
Evo
l. Sy
st. 2
015.
46:2
15-2
35. D
ownl
oade
d fr
om w
ww
.ann
ualr
evie
ws.
org
Acc
ess
prov
ided
by
Stan
ford
Uni
vers
ity -
Mai
n C
ampu
s -
Lan
e M
edic
al L
ibra
ry o
n 12
/13/
15. F
or p
erso
nal u
se o
nly.
ES46CH10-Knoll ARI 7 November 2015 12:5
below). Thus, unless Neoproterozoic atmospheric oxygen levels were considerably lower thanis generally hypothesized (for instance, at the lower end of the modeling results in Planavskyet al. 2014), animals with poriferan, diploblastic, or even bilaterian body plans were unlikelyto be excluded. Any such animals, however, would have been limited to small body sizes, lowmetabolic rates, and low-energy feeding strategies (Knoll & Sperling 2014)—and would be unlikelyto fossilize (Sperling 2013). In short, from a physiological standpoint, animals are not a monolithicentity, and the questions of whether oxygenation was causally important for the origins of animalsand/or bilaterians and whether oxygenation affected the course of the Cambrian radiation arefundamentally different.
Sulfide and Hypoxia Tolerance in Neoproterozoic Oceans
One particular feature of Neoproterozoic oceans may have made small bilaterians even moretolerant of oxygen levels lower than in the modern ocean, or, indeed, in the ocean at many pointsin Earth history. Today, sulfide is common in sediments within low-oxygen environments andoccasionally reaches the sediment-water interface (Middelburg & Levin 2009). Sulfide inhibitsaerobic respiration and oxygen transport at micromolar concentrations and is thus toxic to aerobicorganisms (Grieshaber & Volkel 1998). Sulfide detoxification mechanisms exist, although manyof them are O2 dependent (Somero et al. 1989, Volkel & Grieshaber 1994). The end result is thatsurvival times under hypoxia in the presence of sulfide are reduced by as much as 30% comparedwith hypoxia alone (with variation by taxonomic group and sulfide level; Vaquer-Sunyer & Duarte2010). Although Mo isotopes and abundance in anoxic shales suggest that Neoproterozoic oceanswere probably more sulfidic than modern oceans (Dahl et al. 2010, 2011; Reinhard et al. 2013),modeling of the percentage of seafloor bathed by euxinic waters indicates that this was a minorphenomenon globally, affecting only ∼1–5% of the seafloor (Dahl et al. 2011, Reinhard et al.2013). Aside from these small regions and adjacent areas where sulfidic water might upwell, euxinicwater bodies were irrelevant to early metazoans, as animals essentially cannot live in permanentlyanoxic waters. The pertinent factor for benthic animals in weakly oxygenated habitats, then, isnot the global percentage of euxinic waters, but the exposure to sulfide generated within ambientsediment during normal early diagenesis. Analysis of a data set of thousands of Neoproterozoicshale samples likely deposited under oxic conditions has demonstrated that these sediments havesignificantly lower levels of pyrite (FeS2) than Mesoproterozoic (1,600–1,000 Mya), Paleozoic, andmodern samples (Sperling et al. 2015). Oxic Neoproterozoic sediments also have an abundanceof Fe phases that are highly reactive to sulfide, so any sulfide produced—biotic or abiotic—wouldhave reacted with Fe to form FeS2 and buffered the sediments from pore-water sulfide buildup.The exact driving forces behind such low Neoproterozoic sulfide generation in sediments haveyet to be fully elucidated, but the almost inescapable conclusion is that organisms living in oxicNeoproterozoic benthic environments would have been exposed, at most, to very low sulfidelevels.
Benthic organisms have higher respiratory surface area, with respect to size or per unit mass,in waters with lower oxygen levels (Burd 1988, Lamont & Gage 2000, Jeffreys et al. 2012). How-ever, these adaptations to increase O2 flux can increase the risk of exposure to sulfide. Indeed,animals with higher surface-to-volume ratios to facilitate O2 flux (such as small flat animals orlarger animals with enlarged respiratory structures; Figure 1c) are generally at greater risk ofsulfide toxicity, as sulfide readily diffuses across membranes and into tissues. This is why sul-fide levels matter in ecological considerations of Neoproterozoic seafloors: In a Neoproterozoicocean in which oxic benthic environments were relatively sulfide poor, animals could have adoptedhigh-surface-area respiratory structures and body plans with less pressure from synergistic sulfide
228 Sperling · Knoll · Girguis
Ann
u. R
ev. E
col.
Evo
l. Sy
st. 2
015.
46:2
15-2
35. D
ownl
oade
d fr
om w
ww
.ann
ualr
evie
ws.
org
Acc
ess
prov
ided
by
Stan
ford
Uni
vers
ity -
Mai
n C
ampu
s -
Lan
e M
edic
al L
ibra
ry o
n 12
/13/
15. F
or p
erso
nal u
se o
nly.
ES46CH10-Knoll ARI 7 November 2015 12:5
stress. Low-oxygen environments may have been even more habitable to animals than the modernocean is.
Ecological Physiology of the Ediacara Biota
Such physiological considerations can also be applied to the Ediacara biota. Ediacaran assemblagesin Newfoundland (∼580–560 Mya; Narbonne & Gehling 2003) are dominated by rangeomorphs.Rangeomorphs are the earliest large, complex organisms in the fossil record and belong to anextinct clade with controversial affinities. Despite this phylogenetic controversy, most workers haveinterpreted these organisms as little more than thin layers of epithelia enclosing inert mesoglea-type material (Laflamme et al. 2009). Because of their constructional similarity to diploblasticanimals, rangeomorphs and other Ediacaran organisms, such as Dickinsonia (if it had a similarconstruction; Runnegar 1991), would, like modern sponges, have had essentially all their cellsin diffusive contact with seawater. By contrast, large triploblastic Ediacaran organisms, such asKimberella (commonly but not definitively thought to be related to the mollusks; Fedonkin et al.2007, Vinther 2015), moved across the seafloor, making extensive scratch marks on the sedimentsurface (Gehling et al. 2014). The combination of Kimberella’s size, locomotion, and feeding modewould have required both a blood vascular system and much higher minimum oxygen levels thanthose of rangeomorphs.
Consideration of physiological strategy is important when evaluating trends in body sizethrough time. For example, Payne et al. (2009) correctly inferred an important increase in globalmaximum body size based on the appearance of meter-long (but mm-thick) Dickinsonia in the fossilrecord. If, however, Dickinsonia had a diploblastic construction, its oxygen requirements wouldhave been low despite its size. Rather, the stratigraphically coeval Kimberella, only 10 cm long butmuscular, motile, and three dimensional, would herald a significant increase in minimum oxygendemand (portending the Cambrian biota to come).
Ecological Physiology of the Cambrian Radiation
More than four decades ago, Rhoads & Morse (1971) recognized that the succession of organismsobserved along a gradient from low to high oxygen levels on the present day seafloor recapitulatesthe sequential appearance of different animal groups during the Cambrian radiation. As alreadydiscussed, seafloors with the lowest O2 levels in the modern ocean are characterized by very smalland thin animals with essentially no likelihood of fossilization. These animals are succeeded byslightly larger macrofauna capable of leaving small surficial traces. As oxygen levels continue torise, larger and more heavily biomineralized megafauna appear. This basic observation (Rhoads& Morse 1971) has held up to continued oceanographic research in the intervening decades,with new studies providing increased detail on the oxygen levels at which key changes occur,the variation seen throughout the world’s oceans, the role of oxygen (and other environmentalvariables) in structuring the ecology of communities, and the existence of nonlinear thresholdeffects in organismal- and community-level responses to oxygen change.
Low-oxygen thresholds have been identified for several important biological responses, rang-ing from diversity and feeding strategy to organic matter processing efficiency; the exact O2 levelof the threshold varies by response (Figure 3). Some responses occur at extremely low oxygen con-centrations. For example, along the continental margin of the Arabian Sea, macrofaunal animalsdominate organic matter processing above 0.16 mL/L O2 but are outcompeted by protists belowthis level (Woulds et al. 2007). Likewise, Sperling et al. (2013a) found a statistically significant dif-ference in the percentage of polychaete carnivores between their lowest oxygen bin (0–0.2 mL/L
www.annualreviews.org • Earth’s Second Oxygen Revolution 229
Ann
u. R
ev. E
col.
Evo
l. Sy
st. 2
015.
46:2
15-2
35. D
ownl
oade
d fr
om w
ww
.ann
ualr
evie
ws.
org
Acc
ess
prov
ided
by
Stan
ford
Uni
vers
ity -
Mai
n C
ampu
s -
Lan
e M
edic
al L
ibra
ry o
n 12
/13/
15. F
or p
erso
nal u
se o
nly.

ES46CH10-Knoll ARI 7 November 2015 12:5
O2) and all higher-O2 bins. However, a different measure of carnivory, the number of carnivorousspecies present (an estimate of food web complexity), showed statistically significant increases upto 1.0 mL/L O2. Total species-level diversity also probably has a slightly higher threshold (Levin& Gage 1998). Statistically important splits for macrofaunal diversity and polychaete carnivorespecies richness in regression tree analysis occur at ≤0.22 mL/L O2 (∼3.4% of modern surfaceocean levels) (Figure 3a,b). All key morphological, functional, and ecological thresholds occurat low levels: Above ∼0.5 mL/L O2 (∼8% of modern surface ocean levels), oxygen is relativelyunimportant in explaining these ecological factors (Figure 3d ).
The observation from ecological physiology that carnivory is inhibited at low pO2 levels hasimportant implications for our understanding of Cambrian animal diversification. In filter ordeposit feeding, animals can search for and ingest food slowly and continuously. By contrast,active predation is typically a muscular, intense, and anaerobic effort. Animals can generate ATPanaerobically, but it is relatively inefficient and produces reducing equivalents. This incurs anoxygen debt that cannot be paid off in a permanently hypoxic environment. Many paleontologistshave argued that the Cambrian explosion of new animal body plans is a consequence of the firstwidespread macropredation (Stanley 1973, Peterson et al. 2005, Butterfield 2007, Dzik 2007). Thephysiological constraint that relates carnivory to pO2 therefore links ecological drivers of body planevolution with environmental triggers and allows us to formulate an integrative causal hypothesisfor the Cambrian radiation. Clearly, an oxygenation event (even a smaller-magnitude event, ofthe type toward which various data sets increasingly point) could have moved animal communitiespast critical ecological thresholds and triggered the observed Cambrian biodiversification.
CONCLUSIONS
Geochemical data increasingly suggest that Earth’s second oxygen revolution was more modest,or at least more protracted, than conventionally envisioned. Pre-revolution oxygen levels werealmost certainly much lower than today’s, but unless early Neoproterozoic pO2 levels fell nearthe bottom of the range permitted by Planavsky et al.’s (2014) model calculations, it is doubtfulthat low oxygen markedly affected the origin and earliest evolution of animals. Early metazoans,however, would have been restricted to small and thin body plans and potentially low densities,with low fossilization potential. By the same token, unless Neoproterozoic pO2 levels fell near thetop of Planavsky et al.’s range, the end-Proterozoic increase in oxygen very probably facilitatedCambrian animal diversification. Several lines of geochemical evidence indicate oxygenation nearthe Proterozoic-Cambrian boundary, but pO2 levels may well have remained relatively low inCambrian oceans, reaching modern levels only later in the Paleozoic Era. This might intuitivelyseem to mute the impact of oxygen as a causal factor in Cambrian diversification, but modernoceanographic studies indicate that critical oxygen thresholds with respect to animal function,ecology, and, hence, evolution occur at low pO2 levels.
Much still remains to be learned about the geological history of oxygen, especially regard-ing pO2 levels before the second oxygen revolution. We will also benefit from improved dataon the nonlinear responses of animals to changing O2 levels. Moreover, oxygen is just one fac-tor shaping marine communities, and its interactions with other environmental parameters (forexample, temperature, organic carbon quantity and quality, and sulfide) need to be consideredwithin a multivariate framework. It is clear, however, that metazoan communities exhibit severalnonlinear responses at low oxygen levels; indeed, the most dramatic effects are at these low levels.Consequently, it is possible that the relatively modest oxygenation inferred for the Ediacaran Pe-riod could have moved the biosphere past critical physiological thresholds for animal evolution,especially with respect to ecological forcing factors such as carnivory. In other words, it was not
230 Sperling · Knoll · Girguis
Ann
u. R
ev. E
col.
Evo
l. Sy
st. 2
015.
46:2
15-2
35. D
ownl
oade
d fr
om w
ww
.ann
ualr
evie
ws.
org
Acc
ess
prov
ided
by
Stan
ford
Uni
vers
ity -
Mai
n C
ampu
s -
Lan
e M
edic
al L
ibra
ry o
n 12
/13/
15. F
or p
erso
nal u
se o
nly.
ES46CH10-Knoll ARI 7 November 2015 12:5
the absolute magnitude of late Neoproterozoic oxygenation that was important for the Cambrianradiation, but the relative change with respect to thresholds for animal ecology and physiology.This focus on environmental change does not discount a role for developmental genetics in ani-mal diversification; it underscores that evolution operated within constraints imposed by function,ecology, and, ultimately, environment.
DISCLOSURE STATEMENT
The authors are not aware of any affiliations, memberships, funding, or financial holdings thatmight be perceived as affecting the objectivity of this review.
ACKNOWLEDGMENTS
E.A.S.’s research was supported by Agouron and NAI postdoctoral fellowships and NSF-EAR1324095. P.R.G.’s effort was supported by the National Science Foundation (NSF IOS-1257755).A.H.K.’s research was supported by the NASA Astrobiology Institute. We thank L. Levin, C.Frieder, D. Johnston, and K. Peterson for helpful discussion and G. Halverson, C. Partin, L.Levin, T. Joydas, and R. Damodaran (Cochin University of Science and Technology, Cochin,India, and Center for Marine Living Resources and Ecology, Cochin, India) for providing rawdata from published studies used to draft Figures 3 and 4.
LITERATURE CITED
Alexander RMN. 1971. Size and Shape. London: Edward ArnoldAlgeo TJ, Rowe H. 2012. Paleoceanographic applications of trace-metal concentration data. Chem. Geol.
324–325:6–18Barghoorn ES, Tyler SA. 1965. Microorganisms from the Gunflint Chert. Science 147:563–75Bergman NM, Lenton TM, Watson AJ. 2004. COPSE: A new model of biogeochemical cycling over Phanero-
zoic time. Am. J. Sci. 304:397–437Berry WBN, Wilde P. 1978. Progressive ventilation of the oceans—an explanation for the distribution of the
lower Paleozoic black shales. Am. J. Sci. 278:257–75Bograd SJ, Castro CG, Di Lorenzo E, Palacios DM, Bailey H, et al. 2008. Oxygen declines and the shoaling
of the hypoxic boundary in the California Current. Geophys. Res. Lett. 35:L12607Braeckman U, Vanaverbeke J, Vincx M, van Oevelen D, Soetaert K. 2013. Meiofauna metabolism in suboxic
sediments: currently overestimated. PLOS ONE 8:e59289Breur ER, Law GTW, Woulds C, Cowie GL, Shimmield GB, et al. 2009. Sedimentary oxygen consumption
and microdistribution at sites across the Arabian Sea oxygen minimum zone (Pakistan margin). Deep-SeaRes. II 56:296–304
Budd GE, Jensen S. 2000. A critical reappraisal of the fossil record of the bilaterian phyla. Biol. Rev. 75:253–95Burd BJ. 1988. Comparative gill characteristics of Munida quadrispina (Decapoda, Galatheidae) from different
habitat oxygen conditions. Can. J. Zool. 66:2320–23Butterfield NJ. 1997. Plankton ecology and the Proterozoic-Phanerozoic transition. Paleobiology 23:247–62Butterfield NJ. 2007. Macroevolution and macroecology through deep time. Palaeontology 50:41–55Butterfield NJ. 2009. Oxygen, animals and oceanic ventilation: an alternative view. Geobiology 7:1–7Campbell IH, Squire RJ. 2010. The mountains that triggered the Late Neoproterozoic increase in oxygen:
the second great oxidation event. Geochim. Cosmochim. Acta 74:4187–206Canfield DE, Poulton SW, Knoll AH, Narbonne GM, Ross G, et al. 2008. Ferruginous conditions dominated
later Neoproterozoic deep-water chemistry. Science 321:949–52Canfield DE, Poulton SW, Narbonne GM. 2007. Late-Neoproterozoic deep-ocean oxygenation and the rise
of animal life. Science 315:92–95
www.annualreviews.org • Earth’s Second Oxygen Revolution 231
Ann
u. R
ev. E
col.
Evo
l. Sy
st. 2
015.
46:2
15-2
35. D
ownl
oade
d fr
om w
ww
.ann
ualr
evie
ws.
org
Acc
ess
prov
ided
by
Stan
ford
Uni
vers
ity -
Mai
n C
ampu
s -
Lan
e M
edic
al L
ibra
ry o
n 12
/13/
15. F
or p
erso
nal u
se o
nly.

ES46CH10-Knoll ARI 7 November 2015 12:5
Canfield DE, Teske A. 1996. Late Proterozoic rise in atmospheric oxygen concentration inferred from phy-logenetic and sulphur-isotope studies. Nature 382:127–32
Canfield DE, Thamdrup B. 2009. Towards a consistent classification scheme for geochemical environments,or, why we wish the term ‘suboxic’ would go away. Geobiology 7:385–92
Cawood PA, Hawkesworth CJ. 2014. Earth’s middle age. Geology 42:503–6Childress JJ. 1995. Are there physiological and biochemical adaptations of metabolism in deep-sea animals?
Trends Ecol. Evol. 10(1):30–36Cloud PE. 1968. Atmospheric and hydrospheric evolution on primitive Earth. Science 160:729–36Costa DP, Sinervo B. 2004. Field physiology: physiological insights from animals in nature. Annu. Rev. Physiol.
66:209–38Crowe SA, Dossing LN, Beukes NJ, Bau M, Kruger SJ, et al. 2013. Atmospheric oxygenation three billion
years ago. Nature 501:535–38Dahl TW, Canfield DE, Rosing MT, Frei RE, Gordon GW, et al. 2011. Molybdenum evidence for expansive
sulfidic water masses in ∼750 Ma oceans. Earth Planet. Sci. Lett. 311:264–74Dahl TW, Hammarlund EU, Anbar AD, Bond DPG, Gill BC, et al. 2010. Devonian rise in atmospheric
oxygen correlated to the radiation of terrestrial plants and large predatory fish. PNAS 107:17911–15Danovaro R, Dell’Anno A, Pusceddu A, Gambi C, Heiner I, Kristensen RM. 2010. The first metazoa living
in permanently anoxic conditions. BMC Biol. 8:30Davis DW, Williams IS, Krogh TE. 2003. Historical development of zircon geochronology. Rev. Mineral.
Geochem. 53:145–81Derry LA, Kaufman AJ, Jacobsen SB. 1992. Sedimentary cycling and environmental change in the Late
Proterozoic: evidence from stable and radiogenic isotopes. Geochim. Cosmochim. Acta 56:1317–29Dzik J. 2007. The Verdun syndrome: simultaneous origin of protective armour and infaunal shelters at the
Precambrian-Cambrian transition. Geol. Soc. Lond. Spec. Publ. 286:405–14Emerson SR, Huested SS. 1991. Ocean anoxia and the concentrations of molybdenum and vanadium in
seawater. Mar. Chem. 34:177–96Erwin DH, Laflamme M, Tweedt SM, Sperling EA, Pisani D, Peterson KJ. 2011. The Cambrian conundrum:
early divergence and later ecological success in the early history of animals. Science 334:1091–97Farquhar J, Wing BA. 2003. Multiple sulfur isotopes and the evolution of the atmosphere. Earth Planet. Sci.
Lett. 213:1–13Fedonkin MA, Simonetta A, Ivantsov AY. 2007. New data on Kimberella, the Vendian mollusc-like organism
(White Sea region, Russia): palaeoecological and evolutionary implications. Geol. Soc. Spec. Publ. 286:157–79
Fike DA, Grotzinger JP, Pratt LM, Summons RE. 2006. Oxidation of the Ediacaran ocean. Nature 444:744–47Frei R, Gaucher C, Poulton SW, Canfield DE. 2009. Fluctuations in Precambrian atmospheric oxygenation
recorded by chromium isotopes. Nature 461:250–53Frei R, Gaucher C, Stolper D, Canfield DE. 2013. Fluctuations in late Neoproterozoic atmospheric oxidation:
Cr isotope chemostratigraphy and iron speciation of the late Ediacaran lower Arroyo del Soldado Group(Uruguay). Gondwana Res. 23:797–811
Gaidos E, Knoll AH. 2012. Our evolving planet: from the dark ages to an evolutionary renaissance. In Frontiersof Astrobiology, ed. C Impie, J Lunine, J Funes, pp. 132–53. Cambridge, UK: Cambridge Univ. Press
Gehling JG, Runnegar BN, Droser ML. 2014. Scratch traces of large Ediacara bilaterian animals. J. Paleontol.88:284–98
Gill BC, Lyons TW, Saltzman MR. 2007. Parallel, high-resolution carbon and sulfur isotope records of theevolving Paleozoic marine sulfur reservoir. Palaeogeogr. Palaeoclimatol. Palaeoecol. 256:156–73
Gill BC, Lyons TW, Young SA, Kump LR, Knoll AH, Saltzman MR. 2011. Geochemical evidence forwidespread euxinia in the later Cambrian ocean. Nature 469:80–83
Gilly WF, Beman JM, Litvin SY, Robison BH. 2013. Oceanographic and biological effects of shoaling of theoxygen minimum zone. Annu. Rev. Mar. Sci. 5:393–420
Gooday AJ, Levin LA, Aranda da Silva A, Bett BJ, Cowie GL, et al. 2009. Faunal responses to oxygengradients on the Pakistan margin: a comparison of foraminiferans, macrofauna and megafauna. Deep-SeaRes. II 56:488–502
232 Sperling · Knoll · Girguis
Ann
u. R
ev. E
col.
Evo
l. Sy
st. 2
015.
46:2
15-2
35. D
ownl
oade
d fr
om w
ww
.ann
ualr
evie
ws.
org
Acc
ess
prov
ided
by
Stan
ford
Uni
vers
ity -
Mai
n C
ampu
s -
Lan
e M
edic
al L
ibra
ry o
n 12
/13/
15. F
or p
erso
nal u
se o
nly.
ES46CH10-Knoll ARI 7 November 2015 12:5
Grieshaber MK, Volkel S. 1998. Animal adaptations for tolerance and exploitation of poisonous sulfide. Annu.Rev. Physiol. 60:33–53
Halverson GP, Hoffman PF, Schrag DP, Maloof AC, Rice AHN. 2005. Toward a Neoproterozoic compositecarbon-isotope record. Geol. Soc. Am. Bull. 117:1181–207
Halverson GP, Wade BP, Hurtgen MT, Barovich KM. 2010. Neoproterozoic chemostratigraphy. PrecambrianRes. 182:337–50
Hansel CM, Learman DR. 2015. The geomicrobiology of manganese. In Erlich’s Geomicrobiology, ed. HLEhrlich, DK Newman, A Kappler, pp. 347–420. Boca Raton, FL: CRC. 6th ed.
Hardison RC. 1996. A brief history of hemoglobins: plant, animal, protist, and bacteria. PNAS 93:5675–79Harvey EN. 1911. Studies on the permeability of cells. J. Exp. Zool. 10:507–56Helly JJ, Levin LA. 2004. Global distribution of naturally occurring marine hypoxia on continental margins.
Deep-Sea Res. I 51:1159–68Hoffmann FG, Opazo JC, Hoogewijs D, Hankeln T, Ebner B, et al. 2012. Evolution of the globin gene family
in deuterostomes: lineage-specific patterns of diversification and attrition. Mol. Biol. Evol. 29:1735–45Hofmann AF, Peltzer ET, Walz PM, Brewer PG. 2011. Hypoxia by degrees: establishing definitions for a
changing ocean. Deep-Sea Res. I 58:1212–26Holland HD. 1962. Model for the evolution of the Earth’s atmosphere. In Petrologic Studies: A Volume in Honor
of A.F. Buddington, ed. AEJ Engel, HL James, BF Leonard, pp. 447–77. Boulder, CO: Geol. Soc. Am.Holland HD. 2006. The oxygenation of the atmosphere and oceans. Philos. Trans. R. Soc. B 361:903–15Jacobs DK, Haney TA, Louie KD. 2004. Genes, diversity, and geologic processes on the Pacific coast. Annu.
Rev. Earth Planet. Sci. 32:601–52Jeffreys RM, Levin LA, Lamont PA, Woulds C, Whitcraft CR, et al. 2012. Living on the edge: single-species
dominance at the Pakistan oxygen minimum zone boundary. Mar. Ecol. Progr. Ser. 470:79–99Johnson JE, Gerpheide A, Lamb MP, Fischer WW. 2014. O2 constraints from Paleoproterozoic detrital pyrite
and uraninite. Geol. Soc. Am. Bull. 126:813–30Johnston DT, Poulton SW, Dehler CM, Porter S, Husson J, et al. 2010. An emerging picture of Neopro-
terozoic ocean chemistry: insights from the Chuar Group, Grand Canyon, USA. Earth Planet. Sci. Lett.290:64–73
Joydas TV, Damodaran R. 2014. Infaunal macrobenthos of the oxygen minimum zone on the Indian westerncontinental shelf. Mar. Ecol. 35:22–35
Kah LC, Bartley JK. 2011. Protracted oxygenation of the Proterozoic biosphere. Int. Geol. Rev. 53:1424–42Knoll AH. 2013. Systems paleobiology. Geol. Soc. Am. Bull. 125:3–13Knoll AH, Sperling EA. 2014. Oxygen and animal evolution. PNAS 111:3907–708Laakso TA, Schrag DP. 2014. Regulation of atmospheric oxygen during the Proterozoic. Earth Planet. Sci.
Lett. 388:81–91Laflamme M, Xiao S, Kowalewski M. 2009. Osmotrophy in modular Ediacara organisms. PNAS 106:14438–43Lamont PA, Gage JD. 2000. Morphological responses of macrobenthic polychaetes to low oxygen on the
Oman continental slope, NW Arabian Sea. Deep-Sea Res. II 47:9–24Leavitt WD, Halevy I, Bradley AS, Johnston DT. 2013. Influence of sulfate reduction rates on the Phanerozoic
sulfur isotope record. PNAS 110:11244–49Levin LA. 2003. Oxygen minimum zone benthos: adaptation and community response to hypoxia. Oceanogr.
Mar. Biol. 41:1–45Levin LA, Gage JD. 1998. Relationships between oxygen, organic matter and the diversity of bathyal macro-
fauna. Deep-Sea Res. II 45:129–63Levin LA, Gutierrez D, Rathburn A, Neira C, Sellanes J, et al. 2002. Benthic processes on the Peru margin:
a transect across the oxygen minimum zone during the 1997–98 El Nino. Progr. Oceanogr. 53:1–27Love GD, Grosjean E, Stalvies C, Fike DA, Grotzinger JP, et al. 2009. Fossil steroids record the appearance
of Demospongiae during the Cryogenian period. Nature 457:718–21Lyons TW, Reinhard CT, Planavsky NJ. 2014. The rise of oxygen in Earth’s early ocean and atmosphere.
Nature 506:307–15Macdonald FA, Strauss JV, Sperling EA, Halverson GP, Narbonne GM, et al. 2013. The stratigraphic rela-
tionship between the Shuram carbon isotope excursion, the oxygenation of Neoproterozoic oceans, andthe first appearance of the Ediacara biota and bilaterian trace fossils in northwestern Canada. Chem. Geol.362:250–72
www.annualreviews.org • Earth’s Second Oxygen Revolution 233
Ann
u. R
ev. E
col.
Evo
l. Sy
st. 2
015.
46:2
15-2
35. D
ownl
oade
d fr
om w
ww
.ann
ualr
evie
ws.
org
Acc
ess
prov
ided
by
Stan
ford
Uni
vers
ity -
Mai
n C
ampu
s -
Lan
e M
edic
al L
ibra
ry o
n 12
/13/
15. F
or p
erso
nal u
se o
nly.
ES46CH10-Knoll ARI 7 November 2015 12:5
Maloof AC, Porter SM, Moore JL, Dudas FO, Bowring SA, et al. 2010. The earliest Cambrian record ofanimals and ocean geochemical change. Geol. Soc. Am. Bull. 122:1731–74
Mentel M, Roettge M, Leys S, Tielens AGM, Martin WF. 2014. Of early animals, anaerobic mitochondria,and a modern sponge. Bioessays 36:924–32
Metcalfe NB, Alonso-Alvarez C. 2010. Oxidative stress as a life history constraint: the role of reactive oxygenspecies in shaping phenotypes from conception to death. Funct. Ecol. 24:984–96
Middelburg J, Levin L. 2009. Coastal hypoxia and sediment biogeochemistry. Biogeosci. Discuss. 6:3655–706Mills B, Lenton TM, Watson AJ. 2014. Proterozoic oxygen rise linked to shifting balance between seafloor
and terrestrial weathering. PNAS 111:4168–72Mills DB, Canfield DE. 2014. Oxygen and animal evolution: Did a rise of atmospheric oxygen trigger the
origin of animals? Bioessays 36:1145–55Mills DB, Ward LM, Jones C, Sweeten B, Forth M, et al. 2014. The oxygen requirements of sponges: modern
analogues for the earliest animals. PNAS 111:9073–78Moffitt SE, Moffitt RA, Sauthoff W, Davis CV, Hewett K, Hill TM. 2015. Paleoceanographic insights on
recent Oxygen Minimum Zone expansion: lessons for modern oceanography. PLOS ONE 10:e0115246Mullins HT, Thompson JB, McDougall K, Vercoutere TL. 1985. Oxygen-minimum zone edge effects: evi-
dence from central California upwelling system. Geology 13:491–94Narbonne GM, Gehling JG. 2003. Life after snowball: the oldest complex Ediacaran fossils. Geology 31:27–30Nosenko T, Schreiber F, Adamska M, Adamski M, Eitel M, et al. 2013. Deep metazoan phylogeny: when
different genes tell different stories. Mol. Phylogen. Evol. 67:223–33Och LM, Shields-Zhou GA. 2012. The Neoproterozoic oxygenation event: environmental perturbations and
biogeochemical cycling. Earth-Sci. Rev. 110:26–57Palma M, Quiroga E, Gallardo VA, Arntz W, Gerdes D, et al. 2005. Macrobenthic animal assemblages of the
continental margin off Chile (22◦ to 42◦S). J. Mar. Biol. Ass. U.K. 85:233–45Partin CA, Bekker A, Planavsky NJ, Scott CT, Gill BC, et al. 2013. Large-scale fluctuations in Precambrian
atmospheric and oceanic oxygen levels from the record of U in shales. Earth Planet. Sci. Lett. 369–370:284–93
Paulmier A, Ruiz-Pino D, Garcon V. 2011. CO2 maximum in the oxygen minimum zone (OMZ). Biogeosciences8:239–52
Pavlov AA, Kasting JF. 2002. Mass-independent fractionation of sulfur isotopes in Archean sediments: strongevidence for an anoxic Archean atmosphere. Astrobiology 2:27–41
Payne JL, Boyer AG, Brown JH, Finnegan S, Kowalewski M, et al. 2009. Two-phase increase in the maximumsize of life over 3.5 billion years reflects biological innovation and environmental opportunity. PNAS106:24–27
Payne JL, McClain CR, Boyer AG, Brown JH, Finnegan S, et al. 2010. The evolutionary consequences ofoxygenic photosynthesis: a body size perspective. Photosynth. Res. 107:37–57
Peterson KJ, McPeek MA, Evans DAD. 2005. Tempo and mode of early animal evolution: inferences fromrocks, Hox, and molecular clocks. Paleobiology 31(Suppl. 5):36–55
Planavsky NJ, Reinhard CT, Wang X, Thompson D, McGoldrick P, et al. 2014. Low mid-Proterozoicatmospheric oxygen levels and the delayed rise of animals. Science 346:635–38
Raman AV, Damodaran R, Levin LA, Ganesh T, Rao YKV, et al. 2014. Macrobenthos relative to the oxygenminimum zone on the East Indian margin, Bay of Bengal. Mar. Ecol. 36:679–700
Reinhard CT, Planavsky NJ, Robbins LJ, Partin CA, Gill BC, et al. 2013. Proterozoic ocean redox andbiogeochemical stasis. PNAS 110:5357–62
Revsbech NP, Larsen LH, Gundersen J, Dalsgaard T, Ulloa O, Thamdrup B. 2009. Determination of ultra-low oxygen concentrations in oxygen minimum zones by the STOX sensor. Limnol. Oceanogr. Methods7:371–81
Rhoads DC, Morse JW. 1971. Evolutionary and ecologic significance of oxygen-deficient marine basins.Lethaia 4:413–28
Runnegar B. 1982. The Cambrian explosion: animals or fossils? J. Geol. Assoc. Aust. 29:395–411Runnegar B. 1991. Precambrian oxygen levels estimated from the biochemistry and physiology of early eu-
karyotes. Palaeogeogr. Palaeoclimatol. Palaeoecol. 97:97–111
234 Sperling · Knoll · Girguis
Ann
u. R
ev. E
col.
Evo
l. Sy
st. 2
015.
46:2
15-2
35. D
ownl
oade
d fr
om w
ww
.ann
ualr
evie
ws.
org
Acc
ess
prov
ided
by
Stan
ford
Uni
vers
ity -
Mai
n C
ampu
s -
Lan
e M
edic
al L
ibra
ry o
n 12
/13/
15. F
or p
erso
nal u
se o
nly.
ES46CH10-Knoll ARI 7 November 2015 12:5
Sahoo SK, Planavsky NJ, Kendall B, Wang X, Shi X, et al. 2012. Ocean oxygenation in the wake of theMarinoan glaciation. Nature 489:546–49
Sanders H. 1969. Benthic marine diversity and the stability-time hypothesis. Brookhaven Symp. Biol. 22:71–81Schopf JW. 2006. Fossil evidence of Archaean life. Philos. Trans. R. Soc. B 361:869–85Schrag DP, Higgins JA, Macdonald FA, Johnston DT. 2013. Authigenic carbonate and the history of the
global carbon cycle. Science 339:540–43Scott C, Lyons TW, Bekker A, Shen Y, Poulton SW, et al. 2008. Tracing the stepwise oxygenation of the
Proterozoic ocean. Nature 452:456–59Sim MS, Bosak T, Ono S. 2011. Large sulfur isotope fractionation does not require disproportionation. Science
333:74–77Somero GN, Childress JJ, Anderson A. 1989. Transport, metabolism and detoxification of hydrogen sulfide
in animals from sulfide-rich marine environments. Crit. Rev. Aquat. Sci. 1:591–614Sperling EA. 2013. Tackling the 99%: Can we begin to understand the paleoecology of the small and soft-
bodied animal majority? Paleontol. Soc. Pap. 19:77–86Sperling EA, Frieder CA, Raman AV, Girguis PR, Levin LA, Knoll AH. 2013a. Oxygen, ecology, and the
Cambrian radiation of animals. PNAS 110:13446–51Sperling EA, Halverson GP, Knoll AH, Macdonald FA, Johnston DT. 2013b. A basin redox transect at the
dawn of animal life. Earth Planet. Sci. Lett. 371–372:143–55Sperling EA, Wolock CJ, Morgan AS, Gill BC, Kunzmann M, et al. 2015. Statistical analysis of iron geo-
chemical data suggests limited late Proterozoic oxygenation. Nature 523:451–54Stanley SM. 1973. An ecological theory for the sudden origin of multicellular life in the late Precambrian.
PNAS 70:1486–89Stramma L, Johnson GC, Sprintall J, Mohrholz V. 2008. Expanding oxygen-minimum zones in the tropical
oceans. Science 320:655–58Tribovillard N, Algeo TJ, Lyons T, Riboulleau A. 2006. Trace metals as paleoredox and paleoproductivity
proxies: an update. Chem. Geol. 232:12–32Tyler SA, Barghoorn ES. 1954. Occurrence of structurally preserved plants in pre-Cambrian rocks of the
Canadian Shield. Science 119:606–8Tyson RV, Pearson TH. 1991. Modern and ancient continental-shelf anoxia: an overview. Geol. Soc. Lond.
Spec. Publ. 58:1–24Ulloa O, Canfield DE, DeLong EF, Letelier RM, Stewart FJ. 2012. Microbial oceanography of anoxic oxygen
minimum zones. PNAS 109:15996–6003Vaquer-Sunyer R, Duarte CM. 2010. Sulfide exposure accelerates hypoxia-driven mortality. Limnol. Oceanogr.
55:1075–82Vinther J. 2015. The origins of molluscs. Palaeontology 58:19–34Volkel S, Grieshaber MK. 1994. Oxygen-dependent sulfide detoxification in the lugworm Arenicola marina.
Mar. Biol. 118:137–47Waldbauer JR, Newman DK, Summons RE. 2011. Microaerobic steroid biosynthesis and the molecular fossil
record of Archean life. PNAS 108:13409–14Woulds C, Cowie GL, Levin LA, Andersson JH, Middelburg JJ, et al. 2007. Oxygen as a control on seafloor
biological communities and their roles in sedimentary carbon cycling. Limnol. Oceanogr. 52:1698–709
www.annualreviews.org • Earth’s Second Oxygen Revolution 235
Ann
u. R
ev. E
col.
Evo
l. Sy
st. 2
015.
46:2
15-2
35. D
ownl
oade
d fr
om w
ww
.ann
ualr
evie
ws.
org
Acc
ess
prov
ided
by
Stan
ford
Uni
vers
ity -
Mai
n C
ampu
s -
Lan
e M
edic
al L
ibra
ry o
n 12
/13/
15. F
or p
erso
nal u
se o
nly.