Embed Size (px)
Citation preview
Afro Asian Journal of Social Sciences Volume 3, No. 3.4 Quarter IV 2012 ISSN: 2229 – 5313
1
THE ECONOMIC ANALYSIS OF THE PROFITABILITY OF SMALL-SCALE PURE WATER PRODUCTION IN NIGERIA
(A CASE STUDY OF JABU PACKAGED WATER FACTORY)
Omoniyi, Benjamin Badeji Economics Department, Joseph Ayo Babalola University, Ikeji Arakeji, Nigeria Abu, Zekeri Entrepreneurship Department, Joseph Ayo Babalola University, Ikeji Arakeji, Nigeria
ABSTRACT
The paper examines the profitability or viability of small-scale packaged water factory in Nigeria
using JABU packaged water factory as a case study. The paper uses a combination of descriptive
analysis and simple mathematical formulae to compute the profitability and the degree of
operating leverage of the factory. The result reveals that the firm is able to make some profit at
the end of the first year from which the entrepreneurship dividend could shared showing that the
firm is able to break-even. This suggests that the packaged water business is a viable business in
Nigeria if the same scenario operates in other packaged water factories in Nigeria while the
break-even analysis supports the production of bottled water. This therefore suggest that the
packaged water production should be encouraged in Nigeria under a guided atmosphere such that
non-registered packaged water factories are not allowed to produce untreated water for human
consumption, that the water source be subjected to periodic test by analysts and that packaged
water should be produced under hygienic condition that conforms with the standard required by
the World Health Organization.
Keywords: Profitability, Pure Water, Viability, Mathematical Formulae and Operating Leverage.

Afro Asian Journal of Social Sciences Volume 3, No. 3.4 Quarter IV 2012 ISSN: 2229 – 5313
2
1.0 INTRODUCTION
Water has been identified to be very important to human existence because it is very necessary
for survival. Water ranked second to oxygen. A reliable supply of clean wholesome water is
crucial in an attempt to promote healthy living amongst the inhabitants of a well defined
geographical region (Mustapha and Adam, 1999). In an attempt to proffer solution to water
problem, it was estimated that 1.2 billion people around the world does not have access to clean
safe water and about 2.5 billion people are not provided with adequate sanitation (Third World
Water Forum, 2003). Majority of the affected people that lack access to clean safe water and
adequate sanitation are located in the developing countries because the standard industrialized
global model for safe water delivery and sanitation technology is not affordable (Gadgil and
Derby, 2003).
Narrowing down to Nigeria, the supply or provision of public drinking water is not reliable
(Egwari and Aboaba, 2002). As a result, this has adversely affected the good health of Nigerians
most especially during the dry season (Adesunkanmi and Ajao, 1986). In Nigeria, ground water
and pipe borne (tap) water are the major sources of drinking water. These sources are said to be
unsafe sources of drinking water because findings indicated that ground water sources contain
trace elements, dissolved solids and pathogens in excessive quantities that may be dangerous to
the health of the people. Consequently, most of the investigations carried out on ground water
samples from different parts of Nigeria revealed that most of the available sources of water or
water types are polluted or contaminated hence, were not fit for drinking purpose (Ogunbanjo,
2004 and Tijani, 2003) cited in Olaposi (2009) unpublished PhD Thesis. In addition, physical
assessment of many public supplied pipe-borne water samples also testified to their poor quality.
The achievement or realization of the renewed global Commitments toward the Millennium
Development Goals (MDGs) by 2015 required the development of locally sourced alternative
low cost drinking water schemes that will provide sustainable access to safe drinking water in
both rural and urban settings (areas) in developing countries (UNDESA, 2004). An example of
locally developed alternative of safe water provision in Nigeria is the drinking water sold in
polythene sachets and plastic bottles. In carrying out this business, some small and medium scale
enterprises use various production techniques and technologies to purify and package water
Afro Asian Journal of Social Sciences Volume 3, No. 3.4 Quarter IV 2012 ISSN: 2229 – 5313
3
sourced from springs, bore holes and public water main or points in sachets and plastic bottles
that are sealed electrically. A sachet contains 50cl and a medium plastic bottle contains 75cl
while the big plastic bottle contains 1 litre of water. The products are popularly known as pure
water and bottled water. Many small and medium scale enterprises are now set up with each of
them producing a particular brand hence, the availability of several brands of these types of
packaged water in Nigeria and other developing Countries (Ogan, 1992; and Kasenga, 2007).
Pure water factories were established for the purpose of making profits by the provider or owners
of the enterprise. To this end, water in sachets are readily available at affordable prices but, the
concern is the nature of its wholesomeness, the integrity of the hygienic environment and the
conditions of the places where majority of the sachet and bottled water are produced (Dada,
2009). However, there are traces of outbreak of water borne diseases that has been linked with
the consumption of polluted water in sachets in the past even though there is no national
evidence (Dada, 2009). To protect the individual and maintain good health for the people, the
Nigerian Government set up National Agency for Food and Drug Administration Control
(NAFDAC) to develop standard production procedure that must be adhered to by promoters of
pure water factories before their enterprises are approved by NAFDAC. Despite control by
NAFDAC, complaints abound on the unwholesomeness of sachet water in Nigeria (C.A.M.O.N
2004). Thus, a gradual nationwide ban was proposed by the national regulator on package water
but the pure water market continued to grow. It is therefore worthy to note that there is need to
improve the quality of sachet and bottled water in Nigeria because the quality of some brands of
sachet water has been taking, assessed and condemned by previous studies as opined by
Ogunfowokan, et al, 2000, Dada, 2009 etc.
It is as a result of these identified problems that were attributed to some brands of sachet or
packaged water that arouse the interest of Joseph Ayo Babalola University in, Ikeji- Arakeji
which operate a fully residential private university to establish, a packaged water factory in
November, 2009 as a joint venture with ministers wives council of Christ Apostolic Church to
cater for its teeming number of students, staff, towns and villages around its location so that it
could prevent the outbreak of diseases around its location which could pose threat or danger to
the students and staff such that good, health is maintained. Consequently, JABU packaged water
factory was established in October, 2009 by council of ministers wives of the Christ Apostolic

Afro Asian Journal of Social Sciences Volume 3, No. 3.4 Quarter IV 2012 ISSN: 2229 – 5313
4
Church in a joint venture with the University authority and commenced operation on 3rd
November, 2009.
The promoters provided thirty-two million naira (N32million) divided into fixed capital of
Twenty million naira (N20m) and working capital of twelve million naira (N12m). The factory
uses integrated water treatment of ozonization / continuous production functions. It has fourteen
employees out of which two are management staff and twelve factory workers. This shown that
the factory has only been in existence for one year. It operate with NAFDAC registration number
and use borehole water as its raw- water source. This philosophy is quite different from other
providers whose interest is profit making. However, one cannot rule out the fact that the factory
could still be used as an internally means of generating income if it is able to make profit. The
factory therefore produces sachet water and medium size bottled water presently.
A great deal of research has been carried out on (pure) sachet and bottled water production
testing how safe the water is, the determinants and the technologies employed but, non has ever
been interested in testing whether it is a profitable venture or not in Nigeria hence this paper
intends to fill this gap.
The objective of the paper is to investigate whether JABU pure water factory is making profit
from the production of sachet and bottled water or not as a means of determining the viability of
the packaged water business. The paper will also determine the degree of operating leverage for
both sachet and bottled water. The paper is divided into five sections. Section one introduces the
study, two presents review of literature. Section three discusses the methodology. Section four
contains presentation of data and discussion of results while section five concludes the study.
2.0 REVIEW OF LITERATURE
The processing of water into sachets and bottled water involved the use of capital intensive
technology. Technology is a technical term of transforming inputs into outputs at any particular
time. It therefore connects factor inputs and outputs. The production function represents the
technology of firms in an industry or in the economy as a whole. In essence, the production
function encompasses all efficient technical methods of production. A production process is
considered to be better than another when it uses less of at least one factor than all other
alternative methods. This tends to explain that there are efficient and inefficient technical
Afro Asian Journal of Social Sciences Volume 3, No. 3.4 Quarter IV 2012 ISSN: 2229 – 5313
5
methods of production. However, basic theory of production concentrates only on efficient
methods because rational entrepreneurs will only engage efficient methods (Olayemi, 2004).
The selection of an efficient production method among all technically efficient production
techniques is an economic decision which depends on the prices of factors of production such as
capital, labour etc (Koutsoyiannis, 1983; Henderson and Quandt, 2003; and Oyeniyi, 2005). All
the technically efficient methods or combination of the factors of production for producing a
given level of output involves the use of the production isoquants which assume various shapes
depending on the degree of substitutability of the factors.
2.1 Packaged Water Production System
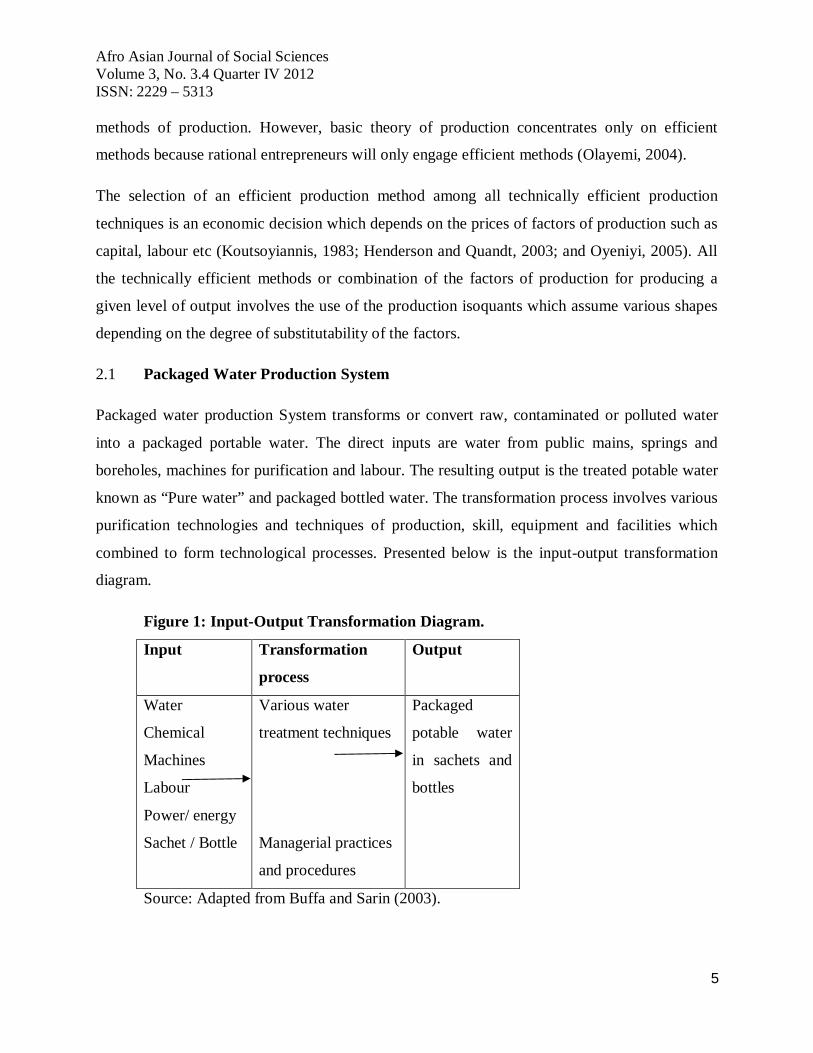
Packaged water production System transforms or convert raw, contaminated or polluted water
into a packaged portable water. The direct inputs are water from public mains, springs and
boreholes, machines for purification and labour. The resulting output is the treated potable water
known as “Pure water” and packaged bottled water. The transformation process involves various
purification technologies and techniques of production, skill, equipment and facilities which
combined to form technological processes. Presented below is the input-output transformation
diagram.
Figure 1: Input-Output Transformation Diagram.
Input Transformation
process
Output
Water
Chemical
Machines
Labour
Power/ energy
Sachet / Bottle
Various water
treatment techniques
Managerial practices
and procedures
Packaged
potable water
in sachets and
bottles
Source: Adapted from Buffa and Sarin (2003).

Afro Asian Journal of Social Sciences Volume 3, No. 3.4 Quarter IV 2012 ISSN: 2229 – 5313
6
The above table shows the raw materials or inputs required for the production of packaged water,
the transformation techniques and managerial procedure required in the transformations process
and the output which is the sachet pure water and bottled water. The arrows shows the directions
of the movement of inputs been transformed into output. The transformation process is the
technical core of the manufacturing system (Buffa and Sarin, 2003 cited in Olaposi, 2009). The
important role of the operation management function is to measure and control the
transformations process by monitoring the output in terms of quality and quantity and use
information as feedback to make necessary adjustments toward improvement of the process
(Buffa and Sarin, 2003). Improvement in the production process is essential to permit the
achievement of operations management objective while customer satisfaction may be ensured
through the production of high quality product. In addition, high quality products are essential to
maintain customer loyalty and long-term customer relationship that may eventually increase
profitability of the firm. Hence, provision of high quality products is a mandatory requirement if
the organization would succeed in the long-run (Davis, Aquilano and Chase, 2003).
2.2 Standard for Potable Drinking Water
The major concern for drinking water is the presence and absence of pathogenic organisms.
Water comes from faecal contaminant. Hence water to be used is tested against Escherichia Coli
an indicator organism for faecal contamination (Mendie, 2005). To guide against contamination,
WHO (2006) provide guidelines for quality drinking water. The guideline opined that water that
is provided for direct drinking must not contain E-Coli or thermotolerant coliform bacteria,
giardia worms, viruses, cryptosporidium spp, legionella pneumophila entamoeba hystolitical and
other opportunistic pathogens such as clostridium spp, kiebsiella spp and pseudomonas. The
guideline stated further that the water should be tested against the presence of notorious
pathogens such as salmonella typhi, shigella dysenteriae and vibrio Cholerae that are responsible
for typhoid, bacillary dysentery and Cholera diseases which arises due to high level of organic
decay and fermentation on tropical waters. All these bacteria must not exist in water that are
meant for drinking hence sources of water for packaged water are subjected to laboratory test by
public analyst in which any of the bacteria must not be found or detected in any 100ml water
sample.
Afro Asian Journal of Social Sciences Volume 3, No. 3.4 Quarter IV 2012 ISSN: 2229 – 5313
7
2.3 Quality Issues in Packaged Water Production
The quality of a product determines its market share. Market share of a product could increase or
decrease based on issues concerning the quality of the product. Hence quality is the competitive
priority of the promoters or managers (Buffa and Sarin, 2003). Issues bordering quality is a vital
one in packaged water production because it affects human health directly and may cause death
if compromised. Quality is therefore defined as “the degree to which a set of inherent
characteristics fulfils requirements (BS EN ISO 9000, 2000). The quality of any packaged water
is therefore determined by the degree of compliance with the guideline set by regulatory bodies
or agencies. Determination of the quality of any drinking water must satisfy customer ratings by
assessment in terms of physical parameter such as colour, taste, odour and presence of particles
in the water (Mendie, 2005) and quality assessment which certify that the water is safe for
drinking by meeting physical, chemical and microbiological parameter (Wikipedia, 2007d).
Thus, potable water for drinking must meet acceptable standard set by world Health
Organization.
2.4 Packaged Water Production in Nigeria
Package water is the water that is sealed in plastic bottles and sachets provided for human
consumption (Mendie, 2005). Packaged water is an alternative water source to public water
supply in Nigeria. This arises because of the inadequacies and poor quality of public water
supply for drinking purpose. The packaged water in sachets are common everywhere in Nigeria
because it has become the product of middle class entrepreneurs and small scale business
ventures.
A Study opined that people demand for packaged water because they thought that packaged
water taste better and safer in quality than water from public main (tap or pipe borne water)
(World Wildlife Commissioned study, 2003). However a great deal of studies have revealed that
packaged water may not be as safe as consumers perceived because there are mixed reports,
while some showed that packaged water are safe, a couple of others found abnormalies in
packaged water produced for human consumption (Adekunle, Sridhar, Ajayi, Oluwande and
Olawuyi 2004, Dada, 2009, Mendie, 2005, and Viessman and Mark, 2005). One striking piece of
information provided by mendie (2005) is that the magnitude of physical, chemical and

Afro Asian Journal of Social Sciences Volume 3, No. 3.4 Quarter IV 2012 ISSN: 2229 – 5313
8
microbiological impurities present in packaged water may be due to poor level of control to all
factors influencing packaged water production.
2.5 Procedures for Packaged Water Production
Packaged water production procedure encompasses water sources and purification technologies.
Sources of water are generally classified into surface and ground water. National agency for
food, Drugs, Administration and control (NAFDAC) approved tap water (surface water), bore
hole (ground water) and spring water as sources of raw water for packaged water production
(Abati, 2005). Surface water is exposed to contamination from animal wastes, pesticides
insecticides industrial wastes and many other organic materials and as such should be treated
before they are fit for drinking. On the other hand, underground water from boreholes and
springs are subject to many sources of recharge such that they may contain contaminants found
in surface water and dissolved minerals that was picked due to its long stay underground. This is
why it was discovered that water contain high calcium content in areas where rocks like
limestone, magnetite, gypsum, fluorspar etc are commonly located. To this end, all sources of
water should be tested to identify the type of treatment it required before becoming safe for
human consumption.
Purification technologies are process of freeing water from any kind of impurity it contained
such as contaminants or micro organism (Viessman and Mark, 2005). The purification steps to
be followed depend on the type of impurities found in the source of water to be used. A wide
variety of technologies could be adopted in providing safe water for drinking but the adoption of
a particular technology depend on source of water, contaminant found to be present in the water
source, the standard set which must be met by packaged water factories and available finances
(Bionesoline, 2007). It must be noted that there is no single water treatment technique or devise
that treat all problems because they are subject to limitations (Geo insight, 2003). However, an
effective treatment process must try to eliminate all contaminants identified during chemical and
microbiological analyses. At this juncture, a well designed purification system must use a
combination of purification technologies to achieve the best quality for drinking water and must
be used in appropriate sequence that will optimize particles removal capabilities (Water
Education, 2006).
Afro Asian Journal of Social Sciences Volume 3, No. 3.4 Quarter IV 2012 ISSN: 2229 – 5313
9
3.0 METHODOLOGY
A combination of descriptive and mathematical approach to research in which data received are
calculated or computed, arranged and analyzed for output, total variable cost of production and
total revenue is employed. In addition, mathematical computation of profit realized and degree of
operating leverage is also included. The authors then applied the profit formula to determine
profit or loss for the factory. The authors also carried out a break-even analysis of both pure and
bottled water produced by the factory in which the degree of operating leverage is determined.
3.1 Optimizing Behaviours
In determining the optimizing behaviour, the entrepreneur purchase inputs such as X1 and
X2 in perfect competitive market at constant prices and his total cost of production (TC) is
assumed to be linear in the form:
C = r1q1 + r2q2 + b (1)
Where
r1 = price of q1 input, r2 = price of q2 input and b = cost of fixed inputs. At this stage, the isocost
line which is the locus of input combinations that may be purchase at a specified total cost is
introduced and given as:
C0 = r1q1 + r2q2 + b (2)
Where
C0 is a parameter while other variables are as explained earlier. At this point we mention that the
farther an isocost line lies from the origin, the higher the cost of production. With an array of
isoquants and isocosts lines, the tangency of the respective isoquants and isocosts determines the
minimum cost of producing a given level of output. Drawing a straight line passing through the
origin at the points of the respective tangencies of the different isoquants and isocosts is called
the expansion path. The entrepreneur can therefore maximize output subject to cost constraint or
minimize the cost of producing a prescribed level of output since price is given (Anderson and
Afro Asian Journal of Social Sciences Volume 3, No. 3.4 Quarter IV 2012 ISSN: 2229 – 5313
10
Quandt, 2003). Resources are therefore re-directed to the production of the product with greater
demand.
3.2 The Total Revenue Curve
To permit the application of the theory of cost to the production of packaged water in JABU
packaged water factory, it requires the introduction of the total revenue curve. This will assist in
our investigation into the determination of the profitability of the project which is the same as
considering the equilibrium of the firm in a perfect competitive industry. The total revenue curve
is a Straight line passing through the origin and increases as sales increases. It is therefore the
total income or proceeds earned from the sale of the products of the firm. The total revenue is
simply given as TR = P.Q.
In determining the equilibrium or the profitability of the firm, the total revenue curve is
superimposed on the total cost curve.
3.3 Determination of the Profitability of the Firm
The profitability of the industry can be determined from two major approaches depending on the
number of the firms in the industry. If there is only one firm in the industry, the total cost /total
revenue approach is engaged while the Marginal revenue / Marginal cost approach is employed
when there are many firms in the industry (Jhingan, 2007). However, this paper employs the
Total revenue/Total cost approach because a single firm is considered in the study.
JABU pure water is assumed at this stage to have its objective as profit maximization which is
mathematically presented as:
(3)
Where
Π = Profit, TR = Total Revenue and TC = Total cost.
From the above, it is clear that both revenue and cost are related to output that is, TR=
F1(Q) and TC = f2(Q), with the price given as P. However, the condition of profit maximization
must satisfy the first and second order condition of differentiation or derivatives in theory.

Afro Asian Journal of Social Sciences Volume 3, No. 3.4 Quarter IV 2012 ISSN: 2229 – 5313
11
The profit of the entrepreneur or the firm (π) is the difference between his total revenue (TR) and
his total cost (TC).
Hence π = pf (q2, q2) – r1q1 – r2q2 – b (4)
Profit is therefore maximized with respect to q1 and q2. When the partial derivatives of π is set
with respect to q1 and q2 equal to zero we have
(5)
By re – arranging input – price terms we have pf1 = r1 and Pf2 = r2
The partial derivatives of production function as presented above with respect to the inputs are
the marginal products ( MP) of the inputs while the value of the marginal products (MP) of Xi
(pfi) is the rate at which the firm’s or entrepreneur’s revenue will change or increase with further
application of X1. The same goes for X2. First order condition of profit maximization stipulate
that each input should be employed or utilized up to a point where the value of its (MP) marginal
product equals its price. Further increase in profit is subject to the fact that addition to revenue
from the employment of an additional unit of X exceeds its cost. Hence, the maximum profit –
input combination lies on the expansion path.
The second order condition is that the principal minor of the relevant Hessian determinant must
alternate in sign that is,
(6)
The above condition implies that profit is decreasing as a result of further application of either q1
or q2 because marginal products (MP) of both inputs are decreasing.
Also
(7)

Afro Asian Journal of Social Sciences Volume 3, No. 3.4 Quarter IV 2012 ISSN: 2229 – 5313
12
The above conditions ensure that profit is decreasing with further application of both q1 and q2
because P is greater than zero (p > 0). Given the entire second order condition, the production
function is strictly concave when first order condition is satisfied. Hence, that point is a unique
profit maximizing solution.
3.4 Determination of Profit or Loss
The profit or loss of the factory is determined by applying the profit formula
π = TR –TC (8)
3.5 The Break-even Analysis of Pure Water Production
The break-even analysis helps to analyse how total costs and profits vary with output with
respect to the degree of automation or mechanization of the installed plant of a factory such that
the factory can withstand competition more effectively and give top level managers the
opportunity to make comparisons. This is done to enable the factory choose between high
mechanized technology than other competitors such that it maintains high fixed costs and low
average variable costs. This is because the firm has substituted capital for labour and materials.
The break-even analysis is important because it provides the opportunity to compute the degree
of operating leverage which is defined as “the percentage change in profit resulting from a one
(1) percent change in the number of units of product sold” (Mansfield, 1990).
The degree of operating leverage can be computed in two ways: method I uses percentage
change in profit divided by percentage change in quantity sold. Given as:
Degree operating leverage = …………………………(9).
= or
Where: = profit and Q = Quantity sold.
Alternatively, the degree of operating leverage can be calculated with the formula stated below.
Afro Asian Journal of Social Sciences Volume 3, No. 3.4 Quarter IV 2012 ISSN: 2229 – 5313
13
Degree of operating leverage = …………………………(10)
Where:
P = Selling Price, AVC = Average Variable Cost and TFC = Total Fixed Cost.
The second formula will be employed in the calculation of the degree of operating leverage.
3.5 Sources of Data
The paper used primary data collected from JABU packaged water factory from November, 2009
– October, 2010 based on the interview granted by the factory manager and the answered
questionnaire sent to the factory by the author.
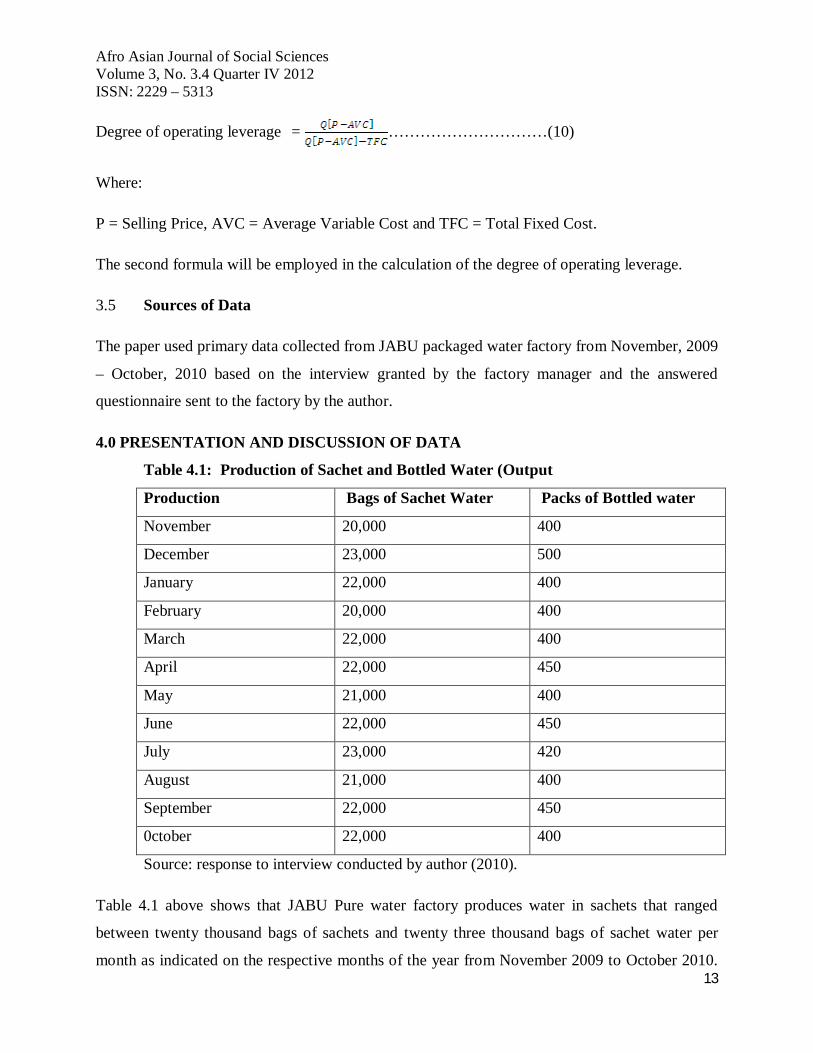
4.0 PRESENTATION AND DISCUSSION OF DATA
Table 4.1: Production of Sachet and Bottled Water (Output
Production Bags of Sachet Water Packs of Bottled water
November 20,000 400
December 23,000 500
January 22,000 400
February 20,000 400
March 22,000 400
April 22,000 450
May 21,000 400
June 22,000 450
July 23,000 420
August 21,000 400
September 22,000 450
0ctober 22,000 400
Source: response to interview conducted by author (2010).
Table 4.1 above shows that JABU Pure water factory produces water in sachets that ranged
between twenty thousand bags of sachets and twenty three thousand bags of sachet water per
month as indicated on the respective months of the year from November 2009 to October 2010.
Afro Asian Journal of Social Sciences Volume 3, No. 3.4 Quarter IV 2012 ISSN: 2229 – 5313
14
A total of 260,000 bags of sachet water were produced. The production of bottled water ranged
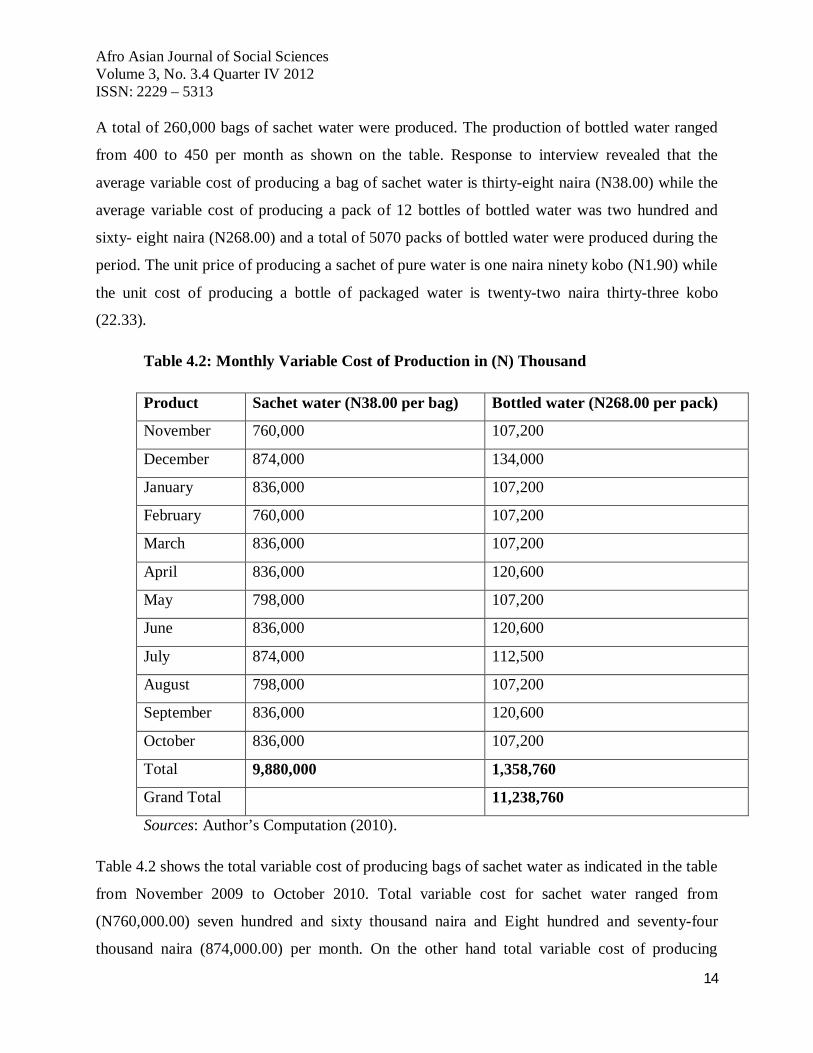
from 400 to 450 per month as shown on the table. Response to interview revealed that the
average variable cost of producing a bag of sachet water is thirty-eight naira (N38.00) while the
average variable cost of producing a pack of 12 bottles of bottled water was two hundred and
sixty- eight naira (N268.00) and a total of 5070 packs of bottled water were produced during the
period. The unit price of producing a sachet of pure water is one naira ninety kobo (N1.90) while
the unit cost of producing a bottle of packaged water is twenty-two naira thirty-three kobo
(22.33).
Table 4.2: Monthly Variable Cost of Production in (N) Thousand
Product Sachet water (N38.00 per bag) Bottled water (N268.00 per pack)
November 760,000 107,200
December 874,000 134,000
January 836,000 107,200
February 760,000 107,200
March 836,000 107,200
April 836,000 120,600
May 798,000 107,200
June 836,000 120,600
July 874,000 112,500
August 798,000 107,200
September 836,000 120,600
October 836,000 107,200
Total 9,880,000 1,358,760
Grand Total 11,238,760
Sources: Author’s Computation (2010).
Table 4.2 shows the total variable cost of producing bags of sachet water as indicated in the table
from November 2009 to October 2010. Total variable cost for sachet water ranged from
(N760,000.00) seven hundred and sixty thousand naira and Eight hundred and seventy-four
thousand naira (874,000.00) per month. On the other hand total variable cost of producing
Afro Asian Journal of Social Sciences Volume 3, No. 3.4 Quarter IV 2012 ISSN: 2229 – 5313
15
bottled water ranged from One hundred and seven thousand two hundred naira (N107, 200.00)
and one hundred and thirty-four thousand naira (N134,000.00) per month. Total variable cost of
producing sachet pure water is Nine million, eight hundred and eighty thousand naira
(N9,880,000.00) and One million, three hundred and fifty-eight thousand seven hundred and
sixty naira (1,358,760.00) for bottled water. Combination of both sachet and bottled water
amounts to Eleven million, two hundred and thirty-eight thousand, seven hundred and sixty naira
(N11238760.00)
In addition to total variable cost (TVC), the fixed cost will also be added to the TVC to
determine total cost of producing both sachet and bottled water by JABU packaged water
factory. This is done to conform to theory. However, information received revealed that the total
fixed cost is Twenty million naira (N20m) to be depreciated on fixed depreciation method for
five years. Thus, depreciation per annum amounts to four million naira (N4m). Also salaries of
two management staff of the factory amount to one million, two hundred thousand naira
(N1.2m) per annum which is part of the fixed cost of the factory since their salaries must be paid
whether production take place or not. Furthermore, the wages of the twelve factory workers
amounted to one million two hundred thousand naira (N1.2m) per annum but it is assumed that it
has been added to the cost of producing the two products. Other routine expenses amounted to
three million, eight hundred and twenty-three thousand naira (N3823000.00)
Afro Asian Journal of Social Sciences Volume 3, No. 3.4 Quarter IV 2012 ISSN: 2229 – 5313
16
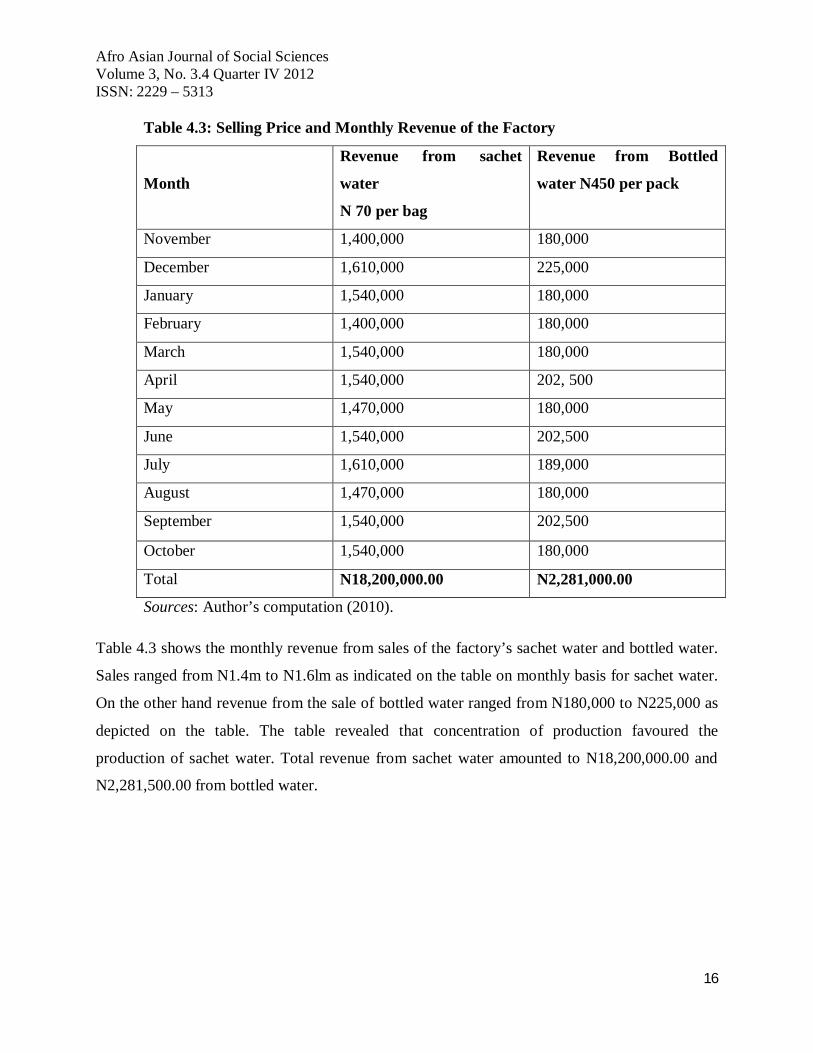
Table 4.3: Selling Price and Monthly Revenue of the Factory
Month
Revenue from sachet
water
N 70 per bag
Revenue from Bottled
water N450 per pack
November 1,400,000 180,000
December 1,610,000 225,000
January 1,540,000 180,000
February 1,400,000 180,000
March 1,540,000 180,000
April 1,540,000 202, 500
May 1,470,000 180,000
June 1,540,000 202,500
July 1,610,000 189,000
August 1,470,000 180,000
September 1,540,000 202,500
October 1,540,000 180,000
Total N18,200,000.00 N2,281,000.00
Sources: Author’s computation (2010).
Table 4.3 shows the monthly revenue from sales of the factory’s sachet water and bottled water.
Sales ranged from N1.4m to N1.6lm as indicated on the table on monthly basis for sachet water.
On the other hand revenue from the sale of bottled water ranged from N180,000 to N225,000 as
depicted on the table. The table revealed that concentration of production favoured the
production of sachet water. Total revenue from sachet water amounted to N18,200,000.00 and
N2,281,500.00 from bottled water.
Afro Asian Journal of Social Sciences Volume 3, No. 3.4 Quarter IV 2012 ISSN: 2229 – 5313
17
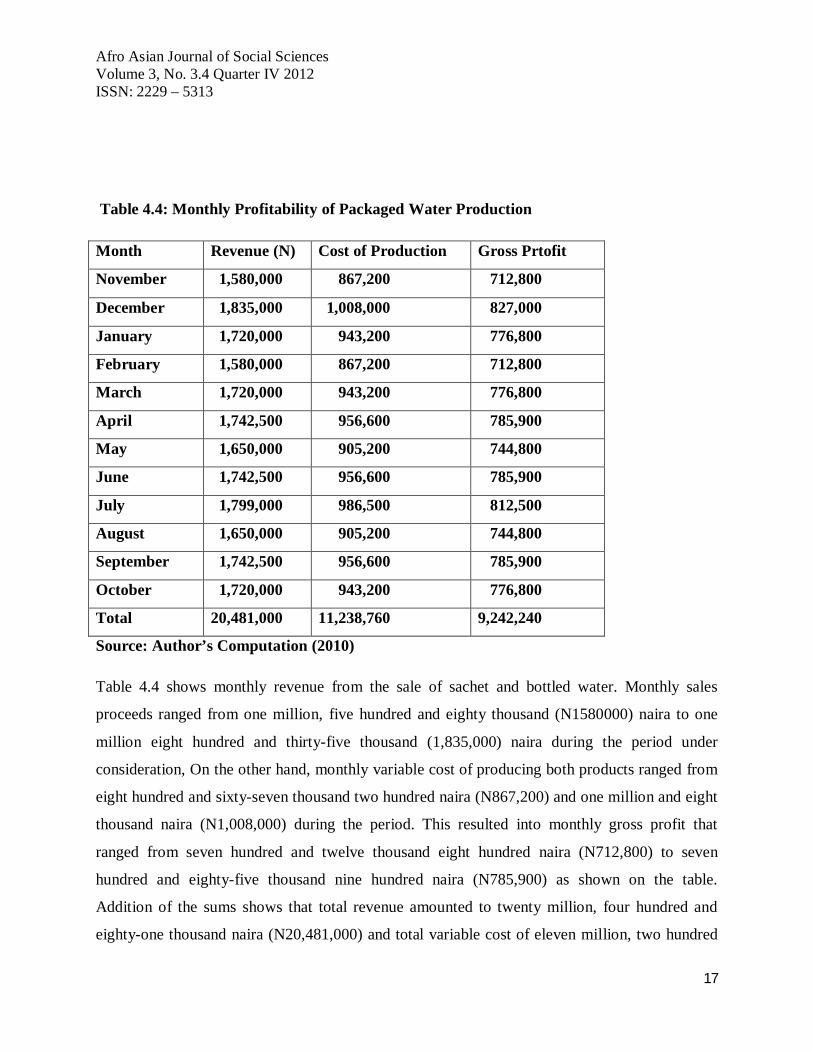
Table 4.4: Monthly Profitability of Packaged Water Production
Month Revenue (N) Cost of Production Gross Prtofit
November 1,580,000 867,200 712,800
December 1,835,000 1,008,000 827,000
January 1,720,000 943,200 776,800
February 1,580,000 867,200 712,800
March 1,720,000 943,200 776,800
April 1,742,500 956,600 785,900
May 1,650,000 905,200 744,800
June 1,742,500 956,600 785,900
July 1,799,000 986,500 812,500
August 1,650,000 905,200 744,800
September 1,742,500 956,600 785,900
October 1,720,000 943,200 776,800
Total 20,481,000 11,238,760 9,242,240
Source: Author’s Computation (2010)
Table 4.4 shows monthly revenue from the sale of sachet and bottled water. Monthly sales
proceeds ranged from one million, five hundred and eighty thousand (N1580000) naira to one
million eight hundred and thirty-five thousand (1,835,000) naira during the period under
consideration, On the other hand, monthly variable cost of producing both products ranged from
eight hundred and sixty-seven thousand two hundred naira (N867,200) and one million and eight
thousand naira (N1,008,000) during the period. This resulted into monthly gross profit that
ranged from seven hundred and twelve thousand eight hundred naira (N712,800) to seven
hundred and eighty-five thousand nine hundred naira (N785,900) as shown on the table.
Addition of the sums shows that total revenue amounted to twenty million, four hundred and
eighty-one thousand naira (N20,481,000) and total variable cost of eleven million, two hundred
Afro Asian Journal of Social Sciences Volume 3, No. 3.4 Quarter IV 2012 ISSN: 2229 – 5313
18
and thirty-eight thousand seven hundred and sixty naira(N11,238,760). This resulted in a gross
profit of nine million, two hundred and forty-two thousand two hundred and forty naira
(N9,242,240).
Total revenue N20,481,500 while total cost is TVC + Depreciation of fixed cost and other
routine costs that are not involved in the production process. TC therefore is:
4.1 Presentation and Discussion of Result
TC= 11,238,760 + 4,000,000 + 1,200,000 + 3,823,000
TC = N 20,261,760.00
Π = 20,481,500 – 20,261,760.00
π = N219,740.00
This shows that at the end of first year in operation, the factory was able to realize a profit as
stated above. However, the entrepreneurial allowances are yet to be deducted from the profit
which invariably meant that the factory at the end would have made a loss. This finding therefore
corroborate or confirmed the information received from the factory management that the firm
cannot be said to be making any profit at the end of the first year in operation.
Afro Asian Journal of Social Sciences Volume 3, No. 3.4 Quarter IV 2012 ISSN: 2229 – 5313
19
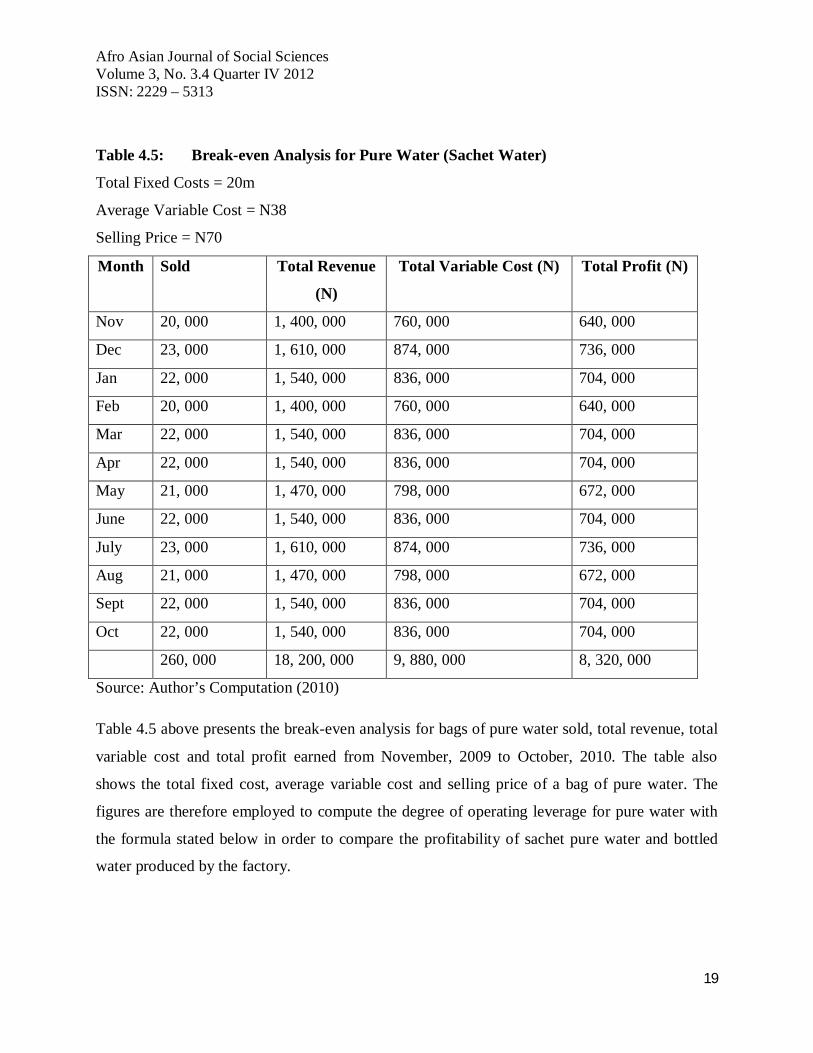
Table 4.5: Break-even Analysis for Pure Water (Sachet Water)
Total Fixed Costs = 20m
Average Variable Cost = N38
Selling Price = N70
Month Sold Total Revenue
(N)
Total Variable Cost (N) Total Profit (N)
Nov 20, 000 1, 400, 000 760, 000 640, 000
Dec 23, 000 1, 610, 000 874, 000 736, 000
Jan 22, 000 1, 540, 000 836, 000 704, 000
Feb 20, 000 1, 400, 000 760, 000 640, 000
Mar 22, 000 1, 540, 000 836, 000 704, 000
Apr 22, 000 1, 540, 000 836, 000 704, 000
May 21, 000 1, 470, 000 798, 000 672, 000
June 22, 000 1, 540, 000 836, 000 704, 000
July 23, 000 1, 610, 000 874, 000 736, 000
Aug 21, 000 1, 470, 000 798, 000 672, 000
Sept 22, 000 1, 540, 000 836, 000 704, 000
Oct 22, 000 1, 540, 000 836, 000 704, 000
260, 000 18, 200, 000 9, 880, 000 8, 320, 000
Source: Author’s Computation (2010)
Table 4.5 above presents the break-even analysis for bags of pure water sold, total revenue, total
variable cost and total profit earned from November, 2009 to October, 2010. The table also
shows the total fixed cost, average variable cost and selling price of a bag of pure water. The
figures are therefore employed to compute the degree of operating leverage for pure water with
the formula stated below in order to compare the profitability of sachet pure water and bottled
water produced by the factory.
Afro Asian Journal of Social Sciences Volume 3, No. 3.4 Quarter IV 2012 ISSN: 2229 – 5313
20
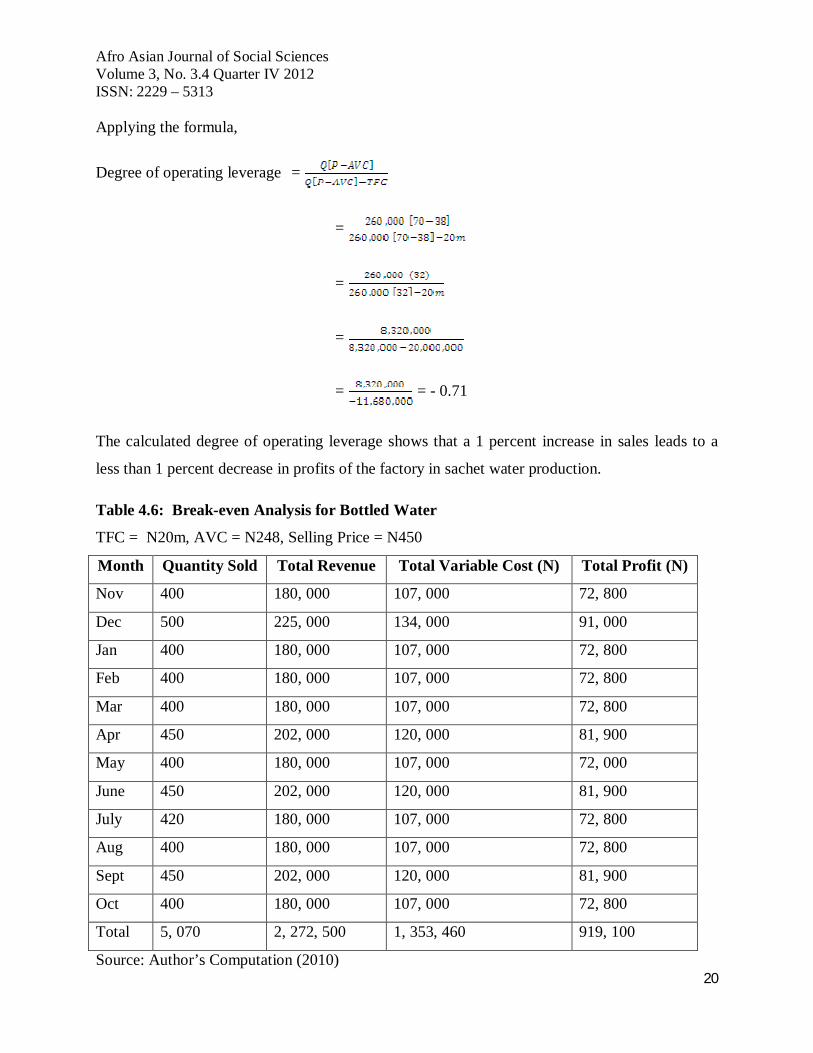
Applying the formula,
Degree of operating leverage =
=
=
=
= = - 0.71
The calculated degree of operating leverage shows that a 1 percent increase in sales leads to a
less than 1 percent decrease in profits of the factory in sachet water production.
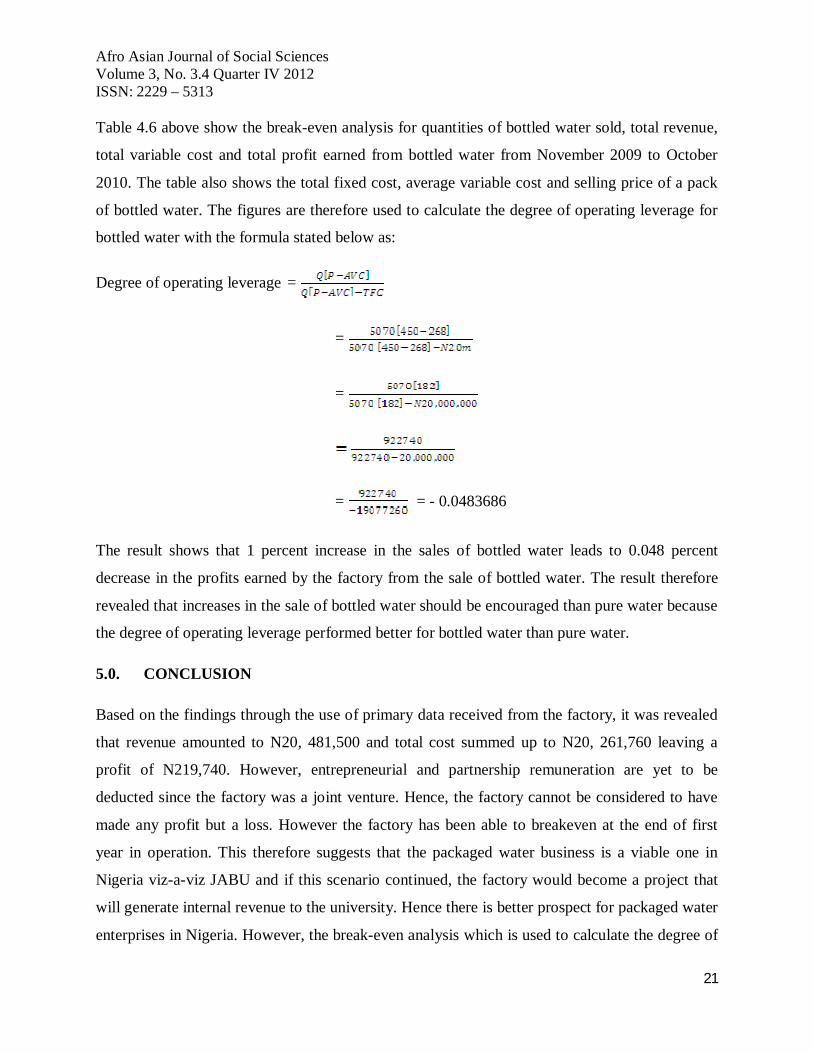
Table 4.6: Break-even Analysis for Bottled Water
TFC = N20m, AVC = N248, Selling Price = N450
Month Quantity Sold Total Revenue Total Variable Cost (N) Total Profit (N)
Nov 400 180, 000 107, 000 72, 800
Dec 500 225, 000 134, 000 91, 000
Jan 400 180, 000 107, 000 72, 800
Feb 400 180, 000 107, 000 72, 800
Mar 400 180, 000 107, 000 72, 800
Apr 450 202, 000 120, 000 81, 900
May 400 180, 000 107, 000 72, 000
June 450 202, 000 120, 000 81, 900
July 420 180, 000 107, 000 72, 800
Aug 400 180, 000 107, 000 72, 800
Sept 450 202, 000 120, 000 81, 900
Oct 400 180, 000 107, 000 72, 800
Total 5, 070 2, 272, 500 1, 353, 460 919, 100
Source: Author’s Computation (2010)
Afro Asian Journal of Social Sciences Volume 3, No. 3.4 Quarter IV 2012 ISSN: 2229 – 5313
21
Table 4.6 above show the break-even analysis for quantities of bottled water sold, total revenue,
total variable cost and total profit earned from bottled water from November 2009 to October
2010. The table also shows the total fixed cost, average variable cost and selling price of a pack
of bottled water. The figures are therefore used to calculate the degree of operating leverage for
bottled water with the formula stated below as:
Degree of operating leverage =
=
=
= = - 0.0483686
The result shows that 1 percent increase in the sales of bottled water leads to 0.048 percent
decrease in the profits earned by the factory from the sale of bottled water. The result therefore
revealed that increases in the sale of bottled water should be encouraged than pure water because
the degree of operating leverage performed better for bottled water than pure water.
5.0. CONCLUSION
Based on the findings through the use of primary data received from the factory, it was revealed
that revenue amounted to N20, 481,500 and total cost summed up to N20, 261,760 leaving a
profit of N219,740. However, entrepreneurial and partnership remuneration are yet to be
deducted since the factory was a joint venture. Hence, the factory cannot be considered to have
made any profit but a loss. However the factory has been able to breakeven at the end of first
year in operation. This therefore suggests that the packaged water business is a viable one in
Nigeria viz-a-viz JABU and if this scenario continued, the factory would become a project that
will generate internal revenue to the university. Hence there is better prospect for packaged water
enterprises in Nigeria. However, the break-even analysis which is used to calculate the degree of
Afro Asian Journal of Social Sciences Volume 3, No. 3.4 Quarter IV 2012 ISSN: 2229 – 5313
22
operating leverage favoured the production and sale of bottled water rather than pure water based
on the result of calculated degree of operating leverage via the break-even analysis.
5.1 RECOMMENDATIONS
Based on the conclusion, the study recommends that the pure water business should be allowed
to thrive. This is because it provides employment for labour and profitable to the owners. Hence
it is a viable business in Nigeria. However, the business should be properly guided so that non
registered enterprises are not allowed to produce untreated water for human consumption in
Nigeria. Above all, NAFDAC should ensure that the sources of water used by packaged water
factories are subjected to periodic test by public analysts to test the safety of such sources of
water. Finally, the environment and condition in which the products are been produced should be
hygienic and conformed with the standard required by World Health Organization. The break-
even analysis which is used to determine the degree of operating leverage should be improved so
that increased product sales would lead to increased profitability rather than a loss or a declining
profitability.
REFERENCES
Abati, T. (2005) Water Sources and Treatments: Food Forum, Nigerian Institute of Food Science and Technology, September (2005) Pp.10
Adekunle, L.V., Sridhar, M.K.C., Ajayi, A.A., Adesunkanmi, A.R.K. and Ajao, O.O. (1986) Typhoid Heal Perforation: the value of Delayed Primary Closure of Abdominal Wound, African Journal of Medicine and Sciences, Vol. 25, Pp 311 – 315.
Biones Online (2007) What is Water Purification? http://www. Bionesoline. Com
/s/ what – is Water Purification. Htm
Afro Asian Journal of Social Sciences Volume 3, No. 3.4 Quarter IV 2012 ISSN: 2229 – 5313
23
Buffa, E.S. and Sarin, R.K. (2003) Modern Production /Operations Management, Eighth Edition, John Wiley and Sons, Singapore, Pp. 631-642.
Dada, A.C. (2009). Sachet Water Phenomenon in Nigeria: Assessment of the Potential Health Impacts. Journal of Microbiology Research, Vol.3, No.1, Pp. 015 – 021.
Davis, M.M., Aquilano, N.J. and Chase, R.B. (2003), Fundamentals of Operations Management, McGraw –Hill, Irwin, Pp. 3-12.
Egwari, L. and Aboaba, O. (2002) Environmental Impact on the Bacteriological
Quality of Domestic Water Supplies in Lagos Nigeria, Rev. Saude Publications, vol. 36 no. 4, Pp. 513 – 520.
Gadgil, A and Derby, E. (2003), Providing Safe Drinking Water to 1.1 Billion Unserved People, paper No 70492.
Geo Insight (2003). A Primer on Small Water Treatment Method, Point of Entry and Point of Use System infor@geo inc.com
Water Education (2006), Free Drinking Water. http://www.fao.org/waucent/faoinfo /economic/esn /codex 23rd February
Henderson, J.M. and Quandt, R.E. (2003), Microeconomic Theory: A Mathematical
Approach, Third Edition, Tata McGraw–Hill Publishing Company Limited, New Delhi, Pp. 64 -104.
Kassanga, G.R. (2007). The Health Related Microbiological Quality of Bottled Drinking Water Sold in Dares Salaam, Tanzania, Journal of water Health, Vol.5, No.1, 179 -186.
Koutsoyiannis, A. (1983). A Modern Microeconomics, Second Edition, Macmillan Press Ltd., London, Pp. 67 – 160. Mansfied, E. (1990). Managerial Economics www.Norton&company, New York, London, Pp. 300-302.
Mendie, U.E. (2005). The Theory and Practices of Clean Water Production for
Domestic and Industrial Use. Purified and Packaged Water, Lactomedals Publishers, pp. 51 – 104.
Mustapha, S. and Adam, E.A. (1991) Discussion on Water Problems in Nigeria: Focus on Bauchi State, National Water Resource Institute. Ogan, M.T. (1992). Microbiological Quality of Bottled Water sold in Retail Outlets in Nigeria, Journal of Applied Bacteriol, Vol. 73, Pp.175 -181.
Ogunbanjo, M.I. (2004). The Geochemical Evaluation of Water Resources in and Around Ijebu-Ode Town, Southwestern Nigeria and its Environmental Implications, in Water Resources, Journal of the Nigerian Association of Hydrogeologists, 20.

Afro Asian Journal of Social Sciences Volume 3, No. 3.4 Quarter IV 2012 ISSN: 2229 – 5313
24
C.A.M.O.N. (2004) Consumer Affairs Movement in Nigeria, NAFDAC to Ban Pure Sachet Water, Consumer Link 1:1.
Olaposi T.O (2009). Technology Assessment of Packaged Water Production in Osun State, Ph.D Thesis, Unpublished.
Olayemi, J.K. (2004). Principles of Microeconomics for Applied Economic Analysis Siko Publishers, Ibadan, Nigeria, Pp. 67 – 123.
Oluwande, P.A. and Olawuyi, J.F. (2004) An Assessment of Health and Social Economic Imlications of Sachet Water in Ibadan, Nigeria: A Public Health Challenge, African Journal of Biochemical Research, Ibadan Biomedical Communication Group, vol.7, No.1, Pp. 5-8.
Oyeniyi, T.A. (2005). Microeconomic Theory and Application, Third Edition, Cedar
Publishers (Nig) Ltd. Nigeria, Pp. 296 – 409.
Third World Water Forum on Water (2003) Blockade Myth, Illusions in Development and Cooperation, January, 2003, Vol. 30, No. 1
Tijani M.N. (2004). Bacteriological, Chemical and Lithogic Controls on Water
Quality, Sagamu Area, Southwestern Nigeria, Water Resources 73
United Nations Department of Economic and Social Affairs (UNDESA, 2004) Urban Agglomerations, Population, Division of the Department of Economic and Social Affairs,
United Nations, In Gandy, M 2006 Planning Anti – Planning and the Infrastructure, Crisis facing Metropolitan Lagos, Urban Studies, Vol. 43, No. 2, Pp. 371 – 396.
Viessman, W. and Mark, J.H. (2005) Water Supply and Pollution Control. Seventh Edition, Upper Saddle River, Prentice Hall, New Jersey
World Wide life Commissioned Study (2003) Bottled Water: Understanding a Social Phenomenon, http./ www.Water year 2003.Org/en/ev.Phe urlid.