Embed Size (px)
Citation preview

PA R T I I
The Economic and Development
Impacts of HIV and AIDS


Introduction
The epidemiology of HIV and AIDS in the countries of South Asia andthe economic context in which the epidemic takes place are very differ-ent from those in high-prevalence countries, which have motivated mostof the studies on the economic development implications of HIV andAIDS. The extent to which South Asia can learn from the literature istherefore unclear. Against this background, the present chapter takesstock of the development impacts of HIV and AIDS. Specifically, thechapter addresses two objectives. First, in addition to providing somesummary indicators of the impacts of HIV and AIDS (such as key healthindicators, or economic growth), the chapter analyzes the impacts of HIVand AIDS on a microeconomic level and across population groups.Second, the chapter discusses the interactions of the ongoing response toHIV and AIDS with development impacts across population groups.
Among the consequences of HIV and AIDS that can be most directlymeasured or estimated are the health and related demographic impacts(section 2). In light of the overall low HIV prevalence rates in the region,the section discusses the contribution of HIV and AIDS to the burden ofdisease (including comparisons with other diseases). Next, it providesestimates of the impacts of HIV and AIDS on key demographic variables,
Development Impact of HIV
and AIDS in South Asia
Markus Haacker
75
C H A P T E R 3
such as the mortality rate, the population growth rate, and lifeexpectancy. Finally, it discusses some of the consequences of the socioe-conomic profile of the epidemic.
Section 3 addresses aggregate measures of the economic impact ofHIV and AIDS. First, we discuss the magnitude of the impact of HIV andAIDS on economic growth. Second, we present estimates of the welfareeffects of HIV and AIDS that more explicitly account for the increasedrisks to health and life. The section concludes with a discussion of theshortcomings of such aggregate approaches; in particular, they do not cap-ture development implications of HIV and AIDS that arise when theimpact of HIV and AIDS is asymmetric across population groups.
Section 4 summarizes the available information on the impact of HIVand AIDS across population groups. The main part of this section dealswith the economic impact and coping, discussing issues such as the incomeand employment losses associated with HIV and AIDS, other adverseimpacts like stigma, the role of caregiving, and the burden of medicalexpenditures.Where available, we present data on differences in the impactof HIV and AIDS across population groups, for example, differentiating bywealth. One item on which we place particular emphasis throughout thissection is the gender dimension of HIV and AIDS (HIV awareness, eco-nomic impact); a separate section deals with the impact on orphans.
Section 5 focuses on challenges associated with and developmentaspects of the response to HIV and AIDS. One key aspect of the responseis access to prevention. Effective prevention is crucial not only in terms ofcontaining the scale of the epidemic and its economic impact, but also fora successful and sustainable scaling up of treatment, with the aim of con-taining pressures on health services in the future. Meanwhile, access totreatment has the potential of mitigating the health and economic impactsof HIV and AIDS. At the same time, inequities in access to treatment canbe an important source of inequities in the development impact of HIVand AIDS, and exacerbate its impact on key development indicators,e.g., those related to poverty. We focus on two main issues. First, we ana-lyze access to treatment on the country level (which—in an internationalcontext—is low in South Asia), and discuss potential impediments to thescaling up of treatment in South Asia. Second, we discuss the limited evi-dence regarding inequities in access to treatment, using both data on accessto health services in general and summarizing the (very limited) direct evi-dence on access to antiretroviral treatment across population groups.
The picture that emerges regarding the economic development impactsof HIV and AIDS is complex. We find the impact of HIV and AIDS on
76 Haacker

economic growth in South Asia to be very small, especially when com-pared with the high growth rates realized in most of the region. However,the welfare implications, taking into account the impact of increasedmortality, are by no means negligible. Meanwhile, we find that the mostrelevant implications of HIV and AIDS in an economic development con-text arise on a subnational level, in terms of inequities according tosocioeconomic status (wealth, access to education) regarding the suscep-tibility to HIV and AIDS and the ability to cope with the economicimpact. Also, we present evidence regarding an asymmetric impact ofHIV and AIDS on women, arising particularly from the socioeconomicconsequences of widowhood. Finally, we note that access to treatment inthe region is low in an international context, and present evidence thatpoints to weaknesses in health systems as a factor not only impedingprogress in extending access to treatment, but also as a factor in exacer-bating inequities in terms of the socioeconomic impact of HIV and AIDS.
Health and Demographic Impacts of HIV and AIDS
HIV prevalence in Asia is relatively low in an international context,especially when compared against regions that have inspired much of the literature on economic or development impacts of HIV andAIDS. The role of HIV and AIDS as an economic development issuein the region—particularly in the context of the broader developmentagenda objectives, such as the MDGs—therefore is not as prominentor obvious as for countries where HIV and AIDS have assumed cata-strophic proportions.
One of the recognizable aspects of the health impact of HIV and AIDSis increasing mortality. Estimates of mortality attributable to AIDS andother diseases and conditions provide an indicator for the relative contri-bution of AIDS to the burden of disease in a country or region. WHO(2006c) also allows assessments of the burden of disease in terms of lossesof disability-adjusted life years (DALYs). The findings are similar to theone presented here for mortality, with AIDS accounting for 1.3 percentof DALYs lost in South Asia overall, and 1.8 percent of DALYs lost inIndia. This partly reflects that HIV and AIDS primarily affect working-age adults, while diseases primarily affecting children have a larger weightin terms of losses of DALYs, and diseases associated with old age corre-spondingly carry a lower weight. The average loss in DALYs associatedwith an AIDS-related death thus happens to be close to the average lossin DALYs across all deaths. Estimates of the causes of deaths by country
Development Impact of HIV and AIDS in South Asia 77

are available from WHO (2006c) for 2002 (see also Lopez and others2006). To assess the mortality associated with HIV and AIDS in SouthAsia, however, it is important to recognize that estimates of AIDS-relatedmortality have since been revised, especially for India. To obtain a moreaccurate estimate of mortality associated with AIDS, we therefore substi-tute adjusted estimates of AIDS-related deaths in India (about 190,000in 2005; see table 3.1) for the earlier WHO estimates (about 360,000; seeWHO 2006c).
Figure 3.1 illustrates the mortality associated with AIDS in the region(the eight countries covered by the World Bank’s South Asia Region, seetable 3.1), as well as for India. Overall, AIDS accounts for 1.5 percent ofall deaths in South Asia, about the same level as measles or diabetes. ForIndia, the share of deaths attributed to AIDS is higher, at about 2 percent,slightly more than half the level of deaths from tuberculosis.
The mortality estimates also allow for comparisons between countriesin terms of the state of health systems. We illustrate this point with acomparison between India and the United States. Controlling for the agestructure of the population, mortality associated with HIV and AIDS inIndia was about five times higher than in the United States, even though
78 Haacker
Table 3.1 South Asia: Key HIV and AIDS Statistics
HIV prevalence,ages 15–49
(percent)People living with
HIV and AIDS
Share ofwomen
among PLWA AIDS deaths
2007 2001 2007 2001 2007 2007 2001
Afghanistan <0.01 <0.01 <1,000 <500 n.a. <100 <100
Bangladesh 0.01 <0.01 12,000 7,500 16.7 <500 <100
Bhutan 0.09 <0.01 <200 <100 n.a. <100 n.a.
India 0.34 0.46 2,400,000 2,700,000 36.7 = 190,000 n.a.
Maldives n.a. n.a. n.a. n.a. n.a. n.a. n.a.
Nepal 0.5 0.5 70,000 56,000 17.1 4,900 2,600
Pakistan 0.10 0.07 96,000 51,000 28.1 5,000 1,900
Sri Lanka 0.03 0.03 3,800 3,000 36.8 <500 <200
Memorandum Items
Cambodia 0.8 1.5 75,000 120,000 26.7 6,900 14,000
China 0.08 0.06 700,000 470,000 28.6 39,000 15,000
Thailand 1.4 1.7 610,000 660,000 41.0 31,000 66,000
Myanmar 0.7 0.9 240,000 300,000 41.7 24,000 24,000
Sources: UNAIDS/WHO (2008) and author’s calculations.Note: AIDS deaths for India approximated based on the midpoint of estimates included in UNAIDS (2006a),
adjusted for revisions in the estimated for HIV prevalence in India that have occurred meanwhile. The number of
deaths for India relates to 2005, not to 2007.

HIV prevalence was lower in India (about 0.4 percent, as compared to0.6 percent).1 Thus, relative to the number of people living with HIV andAIDS, the estimated number of AIDS-related deaths in India is eighttimes higher than in the United States.
Table 3.1 presents key indicators for the state of HIV and AIDS inSouth Asia, based on the 2008 Report on the Global AIDS Epidemic(UNAIDS and WHO 2008). Overall, the number of people living withHIV and AIDS in the region is about 2.6 million, of whom the lion’s shareare located in India (in line with its population weight, but also reflectingthat HIV prevalence is higher there than in the other countries in theregion, except for Nepal). The number of AIDS deaths amounted toabout 200,000 (based on a crude approximation for India, see above).The countries covered differ significantly in terms of the share of womenamong the people living with HIV and AIDS, which ranges from about
Development Impact of HIV and AIDS in South Asia 79
Figure 3.1 South Asia and India: Contribution of AIDS to Mortality
infectiousn.i.e.
noncom-municable
injuries
HIV/AIDS
tuberculosis
maternal,perinatal,
nutritional
maternal,perinatal,
nutritional
India
South Asia
infectiousn.i.e.
noncom-municable
injuries
HIV/AIDS
tuberculosis
Source: Author’s calculations, based on WHO (2006c) and UNAIDS, NACO, and WHO (2007).
Note: n.i.e. = not included elsewhere.
17 percent (Bangladesh, Nepal) to about 37 percent (India, Sri Lanka).Overall, the number of people living with HIV and AIDS in the region isestimated to have declined between 2001 and 2007, owing to an esti-mated decline in the number of people living with HIV and AIDS inIndia, while the estimated numbers increased for every other country inSouth Asia where estimates were available.
One point worth noting about table 3.1 regards the availability of esti-mates of the scale of the epidemic in some countries under consideration.First, no estimates are available for Maldives; for this reason, the countrywill not be included in the tables summarizing the demographic or eco-nomic impacts of HIV and AIDS. Point estimates for most variables arealso not available for Afghanistan and Bhutan, so these countries will alsonot be included in our analysis below.
In order to address the impact of HIV and AIDS for the economies inquestion, it is necessary to understand the impacts of HIV and AIDS onkey demographic indicators. To this end, we face several challenges. Themost comprehensive estimates of the demographic impacts of HIV andAIDS are those by the UN Population Division. However, among the 62countries for which the UN Population Division (2007) provides coun-terfactual estimates of a “no-AIDS” demographic scenario, there is onlyone South Asian country (India). For this country, the demographic pro-jections are based on estimates of HIV prevalence that have been super-seded by the more recent ones discussed above. Our estimates of thedemographic impact of HIV and AIDS in India are therefore based onthose from the UN Population Division (2007), but scaled to account foran updated lower estimate of HIV prevalence. For the other countries, weassume that the impacts of HIV and AIDS on key demographic indica-tors, adjusted for the scale of the epidemic, are similar to those in India,and therefore apply coefficients derived from the estimates for India.2 Toprovide a wider regional context, we also report demographic indicatorsfor some other Asian countries, especially those with large numbers ofpeople living with HIV and AIDS.
We find that HIV and AIDS do have a perceptible impact on keydemographic indicators (table 3.2). Life expectancy at birth in India andNepal declines by about half a year, the rate of population growthdeclines by about one-tenth of a percentage point, and mortality ratesincrease by 0.2–0.3 per 1,000 (meaning that in India and Nepal, one in36 or one in 25 deaths, respectively, are estimated to be AIDS-related).Taking a broader Asian perspective, we see that, in the countries whereestimated HIV prevalence exceeded 1 percent (Cambodia, Thailand), life
80 Haacker

Tab
le 3
.2Th
e D
emo
gra
ph
ic Im
pac
t o
f HIV
an
d A
IDS
in S
elec
ted
So
uth
an
d E
ast
Asi
an C
ou
ntr
ies
HIV
pre
vale
nce,
ages
15–
49
(Per
cent
)C
rude
dea
th ra
te(P
er 1
,000
)
Cru
de d
eath
ra
te:I
mpa
ct
of H
IV a
nd A
IDS
Popu
lati
ongr
owth
(Per
cent
)
Popu
lati
ongr
owth
:Im
pact
of H
IVan
d A
IDS
Life
exp
ecta
ncy
at b
irth
(Yea
rs)
Life
exp
ecta
ncy:
Impa
ct o
f HIV
and
AID
S(Y
ears
)
2005
2005
2005
2005
2005
2005
2005
So
uth
Asi
an
co
un
trie
s
Ban
gla
de
sh0
.01
7.5
0.0
11
.67
0.0
06
4.1
–0
.02
Ind
ia0
.38
7.9
0.2
21
.49
–0
.02
65
.5–
0.5
Ne
pal
0.5
7.7
0.3
01
.97
–0
.03
63
.8–
0.7
Paki
stan
0.1
7.1
0.0
71
.84
–0
.01
65
.5–
0.2
Sri L
anka
0.0
37
.20
.02
0.4
7–
0.0
17
2.4
–0
.1
Ea
st A
sia
n c
ou
ntr
ies
Cam
bo
dia
1.0
68
.40
.59
1.7
4–
0.1
35
9.7
–0
.8
Ch
ina
0.0
87
.10
.03
0.5
80
.00
73
.0–
0.1
Thai
lan
d1
.46
8.5
0.6
30
.66
–0
.05
70
.6–
1.1
Mya
nm
ar0
.76
9.7
0.5
30
.85
–0
.05
62
.1–
0.6
Sour
ces:
UN
AID
S/W
HO
(20
08
) fo
r H
IV p
reva
len
ce, U
N P
op
ula
tio
n D
ivis
ion
(20
07
) fo
r p
op
ula
tio
n in
dic
ato
rs, a
uth
or’s
est
imat
es,
bas
ed
on
dat
a fr
om
UN
Po
pu
lati
on
Div
isio
n (2
00
7) a
nd
oth
er
sou
rce
s, fo
r H
IV a
nd
AID
S-re
late
d in
dic
ato
rs.
81

expectancy declined by around one year, and up to 1 in 11 deaths wasaccounted for by HIV and AIDS.
One of the characteristic features of the HIV and AIDS epidemic isthat the majority of those infected are young adults; therefore mortalityis also concentrated at relatively young ages. Figure 3.2, based on esti-mates by the UN Population Division (modified to account for lower esti-mates of HIV prevalence) shows that HIV and AIDS do have a notableimpact on mortality, especially at ages 30–44. As the majority (about 70percent) of people living with HIV and AIDS in India are male, theimpact on mortality is much more pronounced for this group. Between theages 25 and 40, mortality increases by 20 percent for males, and 14 per-cent for females. Consequently, the probability of reaching age 50declines by 1.5 percentage points for men, and by 0.6 percentage pointsfor women. Another consequence of the age structure of people livingwith HIV and AIDS is that people dying for AIDS-related reasons fre-quently leave behind dependents, including orphans.
Obviously, the demographic projections, especially the impact of HIVand AIDS on the age profile of mortality, depend on the coverage rateof antiretroviral treatment in the respective country (a point that wewill return to below). The UN Population Division incorporates estimates
82 Haacker
Figure 3.2 India: HIV/AIDS and Mortality by Age and Sex
Source: Author’s calculations.
0.0
0.2
0.4
0.6
0.8
1.0
1.2
1.4
1.6
1.8
0–4 5–9 15–19 20–24 25–29 30–34 35–39 40–44 45–49 50–54 55–59age group
mo
rtal
ity
(an
nu
al, i
n p
erce
nt)
male, no AIDSfemale, no AIDS
male, including AIDSfemale, including AIDS

of the coverage rate of antiretroviral treatment in their demographicprojections, in line with WHO (2006). According to those estimates,access to antiretroviral treatment in India was limited in 2005 (about7 percent), and therefore had limited impact on the estimated mortal-ity rates shown in figure 3.3 below. However, the more recent esti-mates of the scale of the epidemic suggest that the coverage ratesachieved in India were higher, around 15 percent to 20 percent.3
Nevertheless, even with complete coverage of antiretroviral treatment,figure 3.3 would still show a significant increase in mortality amongyoung adults, as the UN Population Division assumed that the medianand average survival times of adults after initiation of treatment are 6.6years and 9.5 years, respectively.4
While the most readily available estimates of the demographic impactsof HIV and AIDS presented here provide some indicators for the averageimpact of HIV and AIDS on the population, they fall short from an eco-nomic perspective as they do not capture the socioeconomic profile ofthe epidemic. Most important, the available evidence suggests that themost important drivers of the HIV epidemic in South Asia are injectingdrug use and sex work (see the discussion by Claeson and Wilson, thisvolume). These findings, however, do not easily translate into socioeco-nomic categories commonly used in analyzing distributional aspects ofhealth developments.
Development Impact of HIV and AIDS in South Asia 83
Figure 3.3 Evaluating the Loss from Reduced Life Expectancy
Source: Author’s calculation.
life expectancyL0
ann
ual
inco
me
L1
y1
y0
y2
EV
CV

The Economic Impact of HIV and AIDS: Aggregate Approaches
The scale of the demographic impact of HIV and AIDS in some regionshas motivated studies of the actual or potential economic impact of HIVand AIDS, most of which discuss the effects on economic growth, GDP,or GDP per capita. While the earlier studies employed a neoclassicalgrowth framework to derive estimates of the growth impact of HIV andAIDS from its direct impacts on (physical and, sometimes, human) capi-tal accumulation and the demographic implications, some more recentstudies also consider longer-run effects, for example, through access toand decisions on education. A somewhat different approach is based onthe premise that the most direct and severe impact of HIV and AIDS onwelfare arises from the increased risk to health and life associated with it.Accordingly, some studies attempt to quantify the welfare losses causedby increased mortality and deteriorated health. Finally, in a context ofincreasing access to treatment, it is also important to consider therepercussions of access to treatment for the economic impact.
Economic GrowthMany studies of the impact of HIV and AIDS on economic growthemploy a neoclassical growth model in which HIV and AIDS affectparameters or factors of production that enter an aggregate productionfunction.5 To capture the essence of these earlier studies, and as a ref-erence point for a discussion of some more recent efforts to calibratethe macroeconomic impact of HIV and AIDS, we briefly present a sim-ple version as a “workhorse.” We distinguish two production factors,capital K and labor L, and two productivity parameters, A (total factorproductivity) and h, which is a measure of the average level of humancapital and affects the productivity of labor. Thus, Y = AKa(hL)(1–a). Toobtain GDP per capita, it is necessary to divide Y by the size of thetotal population P, which yields
(1)
where y � Y/P stands for GDP per capita, k � K/P, and l � L/P. Inequilibrium,
(2)
In this framework, HIV and AIDS has a level effect on steady-state GDPper capita, which can be attributed to changes in total factor productiv-ity A, labor productivity or human capital h, the labor force participation
y A hl s n= +( )− −1 (1 ) (1 )( ) .α α α
/ δ
y A hl k= −( ) ,(1 )α α
84 Haacker

rate l, the savings rate s, and the population growth rate n (assuming thatthe parameters a and the depreciation rate d remain constant).
What are the implications of HIV and AIDS for GDP per capita inthis framework? As an example, we illustrate the predicted effects forIndia, assuming an HIV prevalence rate of 0.36 percent, and settingthe parameters a and d equal to 0.35 and 0.08, respectively. Haacker(2004b) summarizes some of the most commonly quoted productivityeffects, suggesting that an HIV prevalence of 20 percent would be consis-tent with a productivity loss of 2 percent to 3 percent; for India, the impliedloss in GDP per capita through this channel would be about 0.08 per-cent.6 Changes in labor force participation would reflect both peopleliving with HIV and AIDS withdrawing from the labor market, anddemographic shifts (specifically, a change in the share of the working-agepopulation in the total population). Regarding the former, assuming that5 percent of people living with HIV and AIDS withdraw from the labormarket appears to be on the high side, this would translate into a declinein l by 0.02 percent. Regarding the role of induced demographic shifts,we use data from the UN Population Division (2007), suggesting that theimpact at present is minimal (0.02 percent), but that it will rise to around0.1 percent by 2020. Overall, the impact of HIV and AIDS on l wouldamount to 0.05 percent in 2005, but may rise to about 0.1 percent by 2020.
The potential impact of HIV and AIDS on savings and investment ismore difficult to establish, and we consider the following as a plausibleguess for the purpose of our numerical exercise. From microeconomicstudies, we note that households affected by HIV and AIDS tend to dis-save to finance treatment and care. This, however, applies less to wealthyhouseholds, which carry a disproportionate weight in national savings.Somewhat arbitrarily, we assume that national savings decline by 0.1percent (corresponding to 0.03 percentage points, given a savings rate ofabout 30 percent). Finally, based on estimates by the UN PopulationDivision (2007), we assume that population growth slows from 1.51percent to 1.49 percent (for 2005–10), which would raise GDP percapita by about 0.1 percent.
Overall, the impact of HIV and AIDS on steady-state GDP per capitain India, through the direct effects described, appears to be very small.Adding up the various channels, we arrive at an overall negative impactof 0.16 percent, owing to the productivity effect (–0.12 percent), thedecline in the share of the working-age population (–0.10 percent), anda decline in savings (–0.05 percent), partly offset by the slowdown inpopulation growth (+0.12 percent). To understand the magnitude of this
Development Impact of HIV and AIDS in South Asia 85

effect, it is instructive to relate it to the annual rate of growth of GDP percapita (about 6 percent annually in 2001–06). A decline in the level ofsteady-state GDP per capita of 0.16 percent thus corresponds to a one-off loss of about 1.5 weeks of GDP growth. This would be barely percep-tible, especially as the adjustment to the new steady-state level of GDPper capita would take several years, so that the slowdown in growthwould be spread accordingly.
While focusing on the impacts of HIV and AIDS on the level andgrowth of GDP per capita above, it is also important to understand theimpact on long-term GDP growth. For this, it is convenient to think ofGDP as the product of GDP per capita and the size of the population.Regarding GDP per capita, the most concrete effects of HIV and AIDS onGDP we describe relate to the level, but not the rate of growth, of GDPper capita. The key channel through which HIV and AIDS affects GDPgrowth in our preliminary analysis is the rate of population growth, whichin India slows down by about 0.02 percentage points in 2005–15, afterwhich the negative impact gradually tapers off through 2050 (accordingto the UN Population Division 2007). Overall, the level of the populationis projected to be 0.5 percent lower than in the absence of HIV and AIDSby 2050 (a small change relative to the projected increase of 44 percentbetween 2006 and 2050). Assuming an average GDP growth rate of 5percent over this period, the slowdown in GDP growth owing to an HIVand AIDS-related slowdown in population growth would thus be rela-tively modest, corresponding to the loss of about one-200th of the averagegrowth rate attained through 2050.7
Two aspects of the impact of HIV and AIDS on growth could resultin a somewhat more adverse outcome than the one described above.First, if reduced expectations of economic growth or higher productioncosts result in a decline in investment, this could exacerbate the impacton growth. We have not modeled this channel, as HIV and AIDS are notnormally rated among key factors affecting growth prospects or produc-tion costs in South Asia,8 and apparently do not factor into investmentdecisions in the region. Second, HIV and AIDS may affect the rate ofaccumulation of human capital, including through impaired access toeducation (both formal and within the family) for an increasing numberof orphans. While we do provide some evidence that access to educationmay be an issue, we cannot adequately quantify the implications for eco-nomic growth without better knowledge about the impact of HIV andAIDS on orphans, the socioeconomic profile of the epidemic, and theconsequences of orphanhood in the region.
86 Haacker

On the other hand, aggregate economic models of the type used heremay overestimate the impact of an epidemic on economic growth if thedistributional aspects of the epidemic matter. There are two factors thatmay suggest that the growth impacts of HIV and AIDS are lower than themodel above suggests. To the extent that the contribution of high-riskpopulation groups—notably injecting drug users and sex workers—toGDP is below average GDP per capita, and if the epidemic is concen-trated among these groups, an aggregate model such as the one employedhere may overstate the impact on GDP.9 A second factor not capturedhere regards access to treatment. If the economically most active seg-ments of the populations have privileged access to treatment, the impactsof HIV and AIDS on GDP growth could be milder than suggested byaggregate demographic indicators (while poverty outcomes could beworse). The limited access to treatment in South Asia so far (table 3.8),and the important role of private out-of-pocket spending in the healthsystems of most South Asian countries (see Over, this volume), suggeststhat this is a relevant consideration.
WelfareWhile the scale of the impact of HIV and AIDS on GDP or GDP percapita is important for many reasons, observers agree that the adverseimpact of HIV and AIDS is not adequately described by these measures.There are two main approaches to developing more substantial (in thesense of providing policy guidance) measures of the economic impacts ofHIV and AIDS. One line of reasoning emphasizes the distributionalaspects of HIV and AIDS, which arise if the risk of infection, the abilityto cope with the economic impact, and the access to care and treatmentare correlated with income or other poverty-related indicators. Theseissues are at the heart of many of the policy issues regarding the responseto HIV and AIDS, and are discussed in more detail further below. Asecond approach, which we now turn to, focuses on the direct implica-tions of HIV and AIDS on health and mortality, and attempts to estimatethe economic costs of risks to health and life. The logic behind thisapproach (and its relation to the estimates of the impact on GDP percapita, above) can be summarized by an equation describing an individual’swelfare over his or her lifetime, depending on consumption, the state ofhealth, and expected survival rates, for example:
(3)W h u S D h u ct t t ti ti i ii t
T
= +⎡
⎣⎢⎢
⎤
⎦⎥⎥= +
∑(c ) ( ) .1
E
Development Impact of HIV and AIDS in South Asia 87

This individual’s well-being in period t, htu(ct) depends on consump-tion in that period (ct) and an indicator of the individual’s state of health(ht). The individual’s lifetime welfare also includes expectations (E[...])about well-being in future periods, taking into account a possible discountfactor (Dti, – frequently, it is assumed that Dti = e–g (i–t)) and the probabil-ity to survive from period t to period i, Sti.
10
An individual whose welfare is described by Eq. (3) values a highincome (which translates into high consumption) and longevity. Whenanalyzing the welfare impact of an epidemic, which brings about adecline in survival rates, Eq. (3) can therefore be used to calculate theincome loss that, at survival rates prior to the adverse health event, wouldhave yielded the same welfare loss as the observed increase in mortality,given income. As this hypothetical change in income describes an incomeloss equivalent to the observed increase in mortality, it is referred to in themicroeconomic literature as equivalent variation.
This reasoning is illustrated in figure 3.3. The indifference curvesdescribe combinations of life expectancy and annual income that yieldthe same welfare level. An adverse health event results in a decline in lifeexpectancy from L0 to L1. For a given life expectancy of L0, a drop inincome from y0 to y1 would yield the same decline in welfare; this is theequivalent variation referred to above (labeled EV in figure 3.3), and willbe used as a measure of the welfare costs of HIV and AIDS in our analy-sis. A different measure of the costs of HIV and AIDS that is sometimespresented is the amount that would, at the lower level of life expectancyL1, restore welfare to the initial level. This is also referred to as compen-sating variation (labeled CV in figure 3.3).11
The shape of the curves in figure 3.3, and thus the size of the equiva-lent income loss, depends on the curvature of the function u(c) in Eq. (3).The faster the marginal utility of c declines, the steeper is the indiffer-ence, and the higher is the income loss that is equivalent to a givendecline in life expectancy.
The approach sketched here had originally been used to estimate thecontribution of improving life expectancy to living standards. It had firstbeen applied to illustrate the welfare effects of HIV and AIDS by Jamison,Sachs, and Wang (2001); Crafts and Haacker (2002, 2004) present a morefully developed framework; more recently, Philipson and Soares (2005)confirm the earlier findings; and Das and others (2006) apply a similarframework to India, but focus on morbidity rather than the risk of pre-mature death. To estimate the welfare costs of increasing mortality inSouth Asia, we follow Crafts and Haacker, who postulate that a 1 percent
88 Haacker
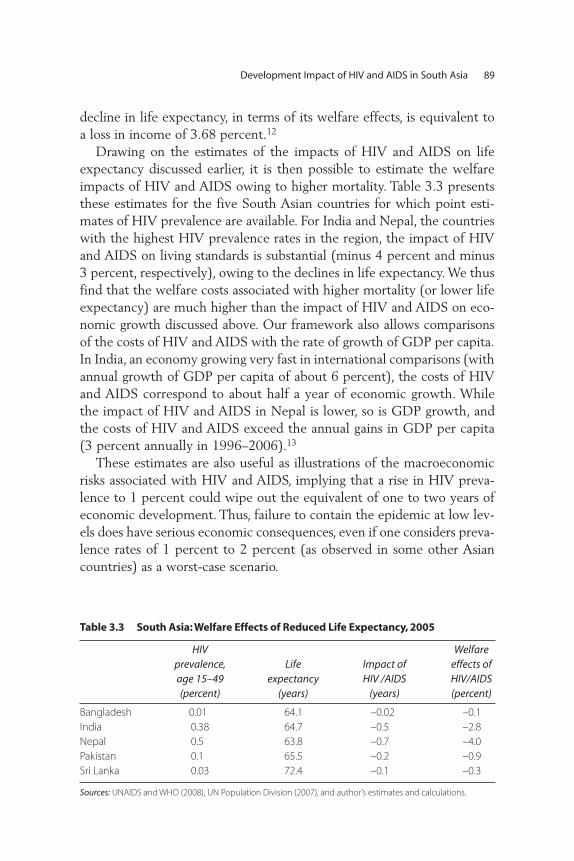
decline in life expectancy, in terms of its welfare effects, is equivalent toa loss in income of 3.68 percent.12
Drawing on the estimates of the impacts of HIV and AIDS on lifeexpectancy discussed earlier, it is then possible to estimate the welfareimpacts of HIV and AIDS owing to higher mortality. Table 3.3 presentsthese estimates for the five South Asian countries for which point esti-mates of HIV prevalence are available. For India and Nepal, the countrieswith the highest HIV prevalence rates in the region, the impact of HIVand AIDS on living standards is substantial (minus 4 percent and minus3 percent, respectively), owing to the declines in life expectancy. We thusfind that the welfare costs associated with higher mortality (or lower lifeexpectancy) are much higher than the impact of HIV and AIDS on eco-nomic growth discussed above. Our framework also allows comparisonsof the costs of HIV and AIDS with the rate of growth of GDP per capita.In India, an economy growing very fast in international comparisons (withannual growth of GDP per capita of about 6 percent), the costs of HIVand AIDS correspond to about half a year of economic growth. Whilethe impact of HIV and AIDS in Nepal is lower, so is GDP growth, andthe costs of HIV and AIDS exceed the annual gains in GDP per capita(3 percent annually in 1996–2006).13
These estimates are also useful as illustrations of the macroeconomicrisks associated with HIV and AIDS, implying that a rise in HIV preva-lence to 1 percent could wipe out the equivalent of one to two years ofeconomic development. Thus, failure to contain the epidemic at low lev-els does have serious economic consequences, even if one considers preva-lence rates of 1 percent to 2 percent (as observed in some other Asiancountries) as a worst-case scenario.
Development Impact of HIV and AIDS in South Asia 89
Table 3.3 South Asia: Welfare Effects of Reduced Life Expectancy, 2005
HIV prevalence,age 15–49(percent)
Life expectancy
(years)
Impact ofHIV /AIDS
(years)
Welfareeffects of HIV/AIDS(percent)
Bangladesh 0.01 64.1 –0.02 –0.1
India 0.38 64.7 –0.5 –2.8
Nepal 0.5 63.8 –0.7 –4.0
Pakistan 0.1 65.5 –0.2 –0.9
Sri Lanka 0.03 72.4 –0.1 –0.3
Sources: UNAIDS and WHO (2008), UN Population Division (2007), and author’s estimates and calculations.

Summary of FindingsThere are two main findings we draw from our discussion of the aggre-gate effects of HIV. First, the welfare effects, in the specific sense of thecost of increased mortality, are by no means small, corresponding to theequivalent of one-half to one year of economic growth in India andNepal. In an adverse scenario, which has HIV prevalence rising to 1 per-cent, the welfare costs could rise to the equivalent of one to two years ofeconomic growth. Second, most of the welfare costs are associated withthe direct health impact of HIV (we focus on mortality), whereas theimpact on economic growth or income per capita appears minor in SouthAsia. This finding is important as it means that the response to HIV andAIDS will not be complicated by any macroeconomic repercussions.
However, in terms of understanding the impact of the epidemic onsociety, designing policies to address the impact, and implementing theresponse to HIV and AIDS, the broad measures of the size of the impactcarry little information. To this end, it is important to gain a better under-standing of who is affected by the epidemic. Further, we need to under-stand how the epidemic affects key development goals (for example, inthe areas of poverty reduction, education, and gender, in addition to thedirect health impact); we will turn to this issue next.
Beyond Aggregate Measures of the Impact of HIV and AIDS
As noted above, much of the economic development impact of HIV andAIDS cannot be captured by the aggregate measures presented above.First, the impact is uneven. The impacts are concentrated in and can bevery severe for the households directly affected by HIV and AIDS. Thisis a situation, in terms of welfare effects or policy implications, verydifferent from a setting in which the adverse impacts are distributedevenly. Second, the ability of households to cope with the economicimpact of illness (for example, regarding the costs of care and treat-ment or the need to compensate for the loss of a breadwinner) dif-fers according to socioeconomic status. Third, HIV and AIDSparticularly affect certain population groups (for example, orphans);also, a low economic status of women can translate into increased vul-nerabilities regarding the risk of infection or the economic consequencesof infection or widowhood. Finally, access to prevention and treatmentmay differ across population groups. While this is an issue that is clearlyrelevant here, we take it up later in the context of our discussion of theresponse to HIV and AIDS.
90 Haacker
Impact and CopingOur analysis proceeds in two steps. First, we discuss some of the directimpacts, focusing on household income, health, and stigma. Second, weaddress how households cope with the demands associated with an HIVinfection, looking at caregiving, increased medical expenditures, and thefinancing of any additional household needs (or of income shortfalls asso-ciated with HIV and AIDS). Owing to data limitations, most of our dis-cussion in this section draws on two studies of the household-levelimpacts of HIV and AIDS in India (Das and others 2006, and Pradhanand others 2006), with some additional pieces of information added,where available. Two key aspects of the impact of HIV and AIDS—theimplications of orphanhood and access to treatment, are treated in dedi-cated sections below.
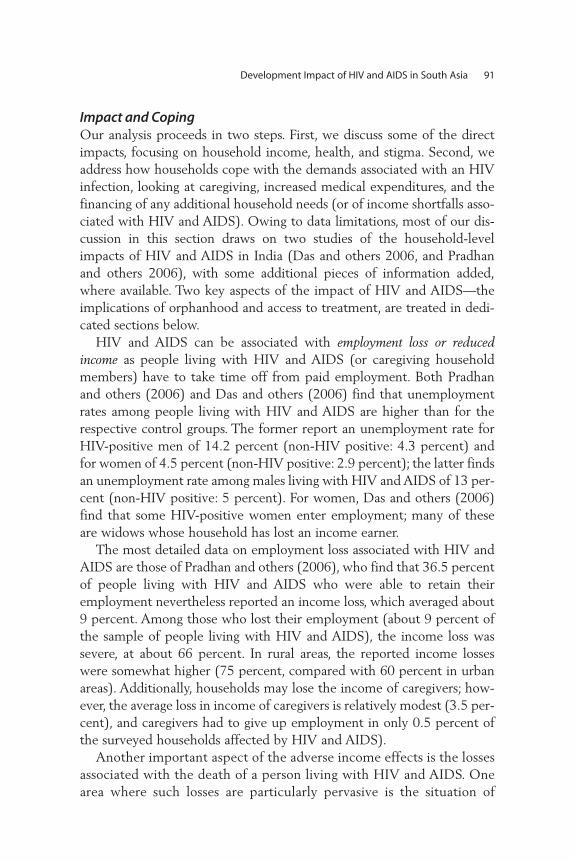
HIV and AIDS can be associated with employment loss or reducedincome as people living with HIV and AIDS (or caregiving householdmembers) have to take time off from paid employment. Both Pradhanand others (2006) and Das and others (2006) find that unemploymentrates among people living with HIV and AIDS are higher than for therespective control groups. The former report an unemployment rate forHIV-positive men of 14.2 percent (non-HIV positive: 4.3 percent) andfor women of 4.5 percent (non-HIV positive: 2.9 percent); the latter findsan unemployment rate among males living with HIV and AIDS of 13 per-cent (non-HIV positive: 5 percent). For women, Das and others (2006)find that some HIV-positive women enter employment; many of theseare widows whose household has lost an income earner.
The most detailed data on employment loss associated with HIV andAIDS are those of Pradhan and others (2006), who find that 36.5 percentof people living with HIV and AIDS who were able to retain theiremployment nevertheless reported an income loss, which averaged about9 percent. Among those who lost their employment (about 9 percent ofthe sample of people living with HIV and AIDS), the income loss wassevere, at about 66 percent. In rural areas, the reported income losseswere somewhat higher (75 percent, compared with 60 percent in urbanareas). Additionally, households may lose the income of caregivers; how-ever, the average loss in income of caregivers is relatively modest (3.5 per-cent), and caregivers had to give up employment in only 0.5 percent ofthe surveyed households affected by HIV and AIDS).
Another important aspect of the adverse income effects is the lossesassociated with the death of a person living with HIV and AIDS. Onearea where such losses are particularly pervasive is the situation of
Development Impact of HIV and AIDS in South Asia 91

HIV-positive widows. As noted in Pradhan and others (2006), widowsaccount for a substantial share of women living with HIV and AIDS; thisstudy also reports that about half of the households headed by widowshave an annual income of less than Rs. 20,000, compared to about one-sixth of other households affected by HIV and AIDS, and 10 percent ofthe households not affected by HIV and AIDS. However, as this studydoes not provide more information on the composition of householdsheaded by widows, it is difficult to interpret these findings. Das and oth-ers (2006) report much lower income for households headed by widowscompared to households with widowers.
The medical aspects of HIV and AIDS are largely beyond the scope ofthe present study. In an economic development context, Das and others(2006) provide some indicators of the negative impact of HIV on healthindicators such as the body mass index or an index intended to measurethe extent of morbidity, and also discuss indicators based on subjectivewell-being, and provide estimates of the welfare costs of such declines inthe heath of affected individuals, based on a compensating variation (seefigure 3.4 on a similar example of the concept, in the context of our discus-sion of the welfare implications of increased mortality). Pradhan and others(2006) report data on the incidence of episodes of illness and the types ofillnesses affecting people living with HIV and AIDS in their sample.
An additional component of the adverse effects of HIV and AIDS isthe stigma associated with it, and both Das and others (2006) and Pradhanand others (2006) provide some evidence for its relevance for assessingthe impacts of HIV and AIDS on affected individuals and households.According to Pradhan and others (2006), about 10 percent of respon-dents living with HIV and AIDS reported being “treated differently orbadly.” Among these, the most common forms of stigma are neglect andisolation (about two-thirds), verbal abuse, children’s isolation, or beingsocially excluded (about one-third each, multiple responses possible).About 2 percent of respondents were asked to vacate their housebecause of their HIV status. Regarding discrimination at the workplace,only about one-quarter of respondents disclosed their HIV status there,and about 40 percent of these reported some form of stigmatization(most commonly denial of promotion, refusal of loan, isolation, or namecalling). Among those who did not disclose their HIV status at the work-place (three-quarters of respondents), concern about losing their jobplayed an important role. Similarly, Das and others report for their sam-ple that about three-quarters of people living with HIV and AIDS didnot disclose their HIV status to family and friends, and 85 percent did
92 Haacker

020406080100
GD
P p
er c
apit
a, 2
005
(US$
)
Fig
ure
3.4
.1(C
ou
ntr
ies
wit
h H
IV p
reva
len
ce <
1 p
erce
nt)
Fig
ure
3.4
.2(C
ou
ntr
ies
wit
h H
IV p
reva
len
ce <
3 p
erce
nt)
Fig
ure
3.4
.3(C
ou
ntr
ies
wit
h H
IV p
reva
len
ce <
1 p
erce
nt)
Fig
ure
3.4
.4(A
ll co
un
trie
s)Fi
gu
re 3
.4.5
(All
cou
ntr
ies)
Fig
ure
3.4
.6(A
ll co
un
trie
s)
020406080100
GD
P p
er c
apit
a, 2
005
(US$
)
access to antiretroviraltreatment, end-2006
(percent)
access to antiretroviraltreatment, end-2006
(percent)
access to antiretroviraltreatment, end-2006
(percent)
access to antiretroviraltreatment, end-2006
(percent)
access to antiretroviraltreatment, end-2006
(percent)
access to antiretroviraltreatment, end-2006
(percent)
020406080100 H
IV/A
IDS-
rela
ted
aid
per
cap
ita,
200
5 (U
S$)
020406080100 H
IV/A
IDS-
rela
ted
aid
per
cap
ita,
200
5 (U
S$)
020406080100
acce
ss t
o a
nte
nat
al c
are
(per
cen
t)
020406080100
020
0040
0060
0080
00
020
0040
0060
0080
0010
000
1200
0
05
1015
20
05
1015
2025
020
4060
8010
0
020
4060
8010
0ac
cess
to
an
ten
atal
car
e (p
erce
nt)
Fig
ure
3.4
Acc
ess
to T
reat
men
t an
d K
ey D
evel
op
men
t In
dic
ato
rs
Sour
ces:
IMF
(20
07
), O
ECD
(20
07
), an
d W
HO
, UN
AID
S, a
nd
UN
ICEF
(20
07
).
Not
e:D
ata
po
ints
re
lati
ng
to
So
uth
Asi
an c
ou
ntr
ies
are
sh
ow
n in
bo
ld.
93

not disclose it at the workplace, out of concerns about negative conse-quences for themselves or their family.
While it is clear from our discussion of the income effects of HIV andAIDS that many households experience shortfalls in income, which insome cases can be very significant, HIV and AIDS is also associated withan increased demand for health services, and increased household expen-ditures on care and treatment. According to Pradhan and others (2006),medical expenditures account for 11 percent of total expenditure of HIVand AIDS-affected households, as compared with 3 percent for house-holds not affected by HIV and AIDS. This comparison, however, under-states the impact of HIV and AIDS as households affected by HIV andAIDS increase their total expenditure as well. When measured againstexpenditure of the non-HIV and AIDS control group, the increase there-fore comes out somewhat more pronounced (9.4 percent rather than 8percent). The findings by Das and others (2006) are broadly in line withthese findings.
Regarding medical expenditures, one key aspect is the financing ofantiretroviral treatment, and Pradhan and others (2006) provide somedata on different channels of access to ART and the associated costs.More than half of the respondents with access to antiretroviral treatment(about 15 percent of the respondents living with HIV and AIDS) receiveit at government hospitals, and an additional 5 percent through NGOs.With monthly costs of antiretroviral treatment through private providersbetween Rs. 1,141 (through chemist shops) and Rs. 1,669 (through pri-vate nursing homes or doctors), and the latter exceeding total monthlyhousehold expenditure for many households affected by HIV and AIDS,government facilities (Rs. 246) and NGOs (Rs. 547) clearly are the onlymodes of provision of antiretroviral treatment accessible to a large shareof people living with HIV and AIDS. Also, it is important to bear in mindthat—reflecting that only 15 percent of people living with HIV andAIDS among the respondents receive treatment—the reported increasesin medical expenditures largely reflect the pre-ART stage of HIV andAIDS, and likely understate the eventual impact of HIV and AIDS onmedical expenditures.
As incomes shrink while the need for expenditures on care and treat-ment increases, households affected by HIV and AIDS frequently borrowor dissave by selling off or drawing down household assets. Pradhan andothers (2006) observe that 46 percent of households affected by HIV andAIDS borrow, but only 27 percent in the control group, with a modestlyhigher average borrowing.Among households that borrowed, the amount
94 Haacker

borrowed was higher for households affected by HIV and AIDS (Rs.10,992, as compared with Rs. 9,167 for households not affected by HIVand AIDS). Regarding savings, their data illustrate the asymmetric eco-nomic impact of HIV and AIDS according to income category, specifi-cally the adverse impact of HIV and AIDS for the two lowest incomecategories for which they report data. For income between Rs. 20,001 andRs. 30,000, the savings rate declines by about 10 percentage points; forlower-income households, the decline in the savings rate is about 24 per-cent (table 3.4).14
OrphansBeyond those infected, one population group that is seriously affected byHIV and AIDS is children of people living in HIV and AIDS-affectedhouseholds and orphans. While there is little information regarding thespecific situation of children orphaned by AIDS, especially in countrieswith low HIV prevalence rates (all countries in South Asia), we can alsodraw some relevant information from studies analyzing the situation ofchildren orphaned by AIDS in general. However, one issue that is partic-ularly relevant for AIDS orphans is the high rate of children who have lostboth parents in this group, reflecting high rates of coinfection among cou-ples, which tends to exacerbate the adverse impacts of orphanhood.
The situation of children orphaned by AIDS has been recognized as acore challenge in the context of the international response to HIV andAIDS (see for example, UNAIDS/WHO 2006a). However, estimates ofthe impact of HIV and AIDS on orphan rates are not available for SouthAsian countries. To obtain a best available estimate of the impact ofHIV and AIDS on orphan rates, we therefore have to draw on evidencefrom other countries, or draw some inferences from other demographicindicators such as mortality rates.
Development Impact of HIV and AIDS in South Asia 95
Table 3.4 Household Savings by Income Category
Household income category
Non-HIV Households Households Affected by HIV
Householdsavings (Rs)
Savings rate (%)
Householdsavings (Rs)
Savings rate (%)
Up to 20,000 –51 –0.3 –3,197 –23.4
20,001–30,000 361 1.4 –2,087 –8.3
30,001–41,000 1693 4.8 –358 –1.0
41,001–84,000 5906 10.2 2637 4.6
84,001 and above 26,801 21.3 35,123 24.7
Source: Pradhan and others 2006.

Regarding cross-country evidence, a number of countries in southernAfrica,15 before the arrival of HIV and AIDS, had similar mortality pro-files as the countries in South Asia we focus on, and estimates of theimpact of HIV and AIDS on orphan rates are available for these countries.For these countries, an HIV prevalence rate of 20 percent could translateinto a share of orphans among the young population (ages 0–17) of morethan 10 percent. For countries like India or Nepal (HIV prevalence 0.4 to0.5 percent), this would translate into an increase in orphan rates of 0.2–0.3percentage points, which compares to an underlying orphan rate of about9 percent.
However, there are two principal shortcomings to this comparison.First, the increase in orphan rates in southern Africa does not show the fullimpact yet, as mortality among working-age adults has been increasingover the last decade. More substantially, even if one accepts that the demo-graphics of the respective countries (in South Asia vs. southern Africa)allow this kind of comparison, the nature of the epidemic differs very sig-nificantly between the regions, with important implications for the linkbetween increasing adult mortality and orphan rates. Most important, andreflecting differences in risk behavior, HIV prevalence among women ismuch lower than for men (as evident from the low share of women amongpeople living with HIV and AIDS; see table 3.1). Additionally, adversehealth conditions may affect fertility, and—especially for men—certaintypes of risk behavior (men having unprotected sex with men, injectingdrug use) may be negatively correlated with the propensity to procreate.In order to estimate the number of orphans, it is also necessary to accountfor the number of children who have lost both parents.
Specifically, we make the following assumptions: (1) We calculate the(increased) likelihood of becoming a maternal orphan by age, based on theaverage increase in mortality among females at age 20–49. (2) We calcu-late the likelihood of becoming a paternal orphan, but cap the increase inparental mortality at twice the increase in maternal mortality.16 (3) To esti-mate the total number of orphans by age, we add up maternal and pater-nal orphans, adjusting for an assumed share of children who have lost bothparents among AIDS orphans of one-quarter.17 (4) To calculate theincrease in the share of orphans among the young population (ages 0–17),we apply weights to each year, in line with the rate of population growth.(5) Finally, we subtract 10 percent from the total to account for highermortality among children who have contracted HIV from their mother.
96 Haacker

In this scenario, we find that HIV and AIDS could result in an increasein the number of orphans of about 0.4 percent of the young populationin India. By age 17, about 0.9 percent of the young population will haveexperienced orphanhood owing to HIV and AIDS. The estimates forNepal are similar; while estimated HIV prevalence is higher, the share ofwomen among people living with HIV and AIDS is lower, and higherpopulation growth also mitigates the increase in the orphan rate.
Besides income effects, another dimension of increased risk on theindividual level is the increased risk of orphanhood and its implicationsfor individual welfare at a young age and beyond. In addition to the directeffects of losing a parent, orphanhood can have numerous economicrepercussions. One immediate concern is that orphanhood may be asso-ciated with a deterioration in material living standards during childhoodif orphans live in poorer households. For paternal orphans, Ainsworth andFilmer (2006), in one of the few studies covering Asia and not only Sub-Saharan Africa, find that in about two-thirds of the surveys covered bytheir study, orphans are concentrated in poorer households. Maternalorphans also tend to live in poorer countries, while there is considerablevariation across countries. The greatest variation occurs for two-parentorphans, who frequently live in richer households. However, they notethat the countries with the highest concentration of two-parent orphansamong the poor are Asian (Laos, Indonesia, and the Philippines).
The second main channel that has been studied relatively widelythrough which orphanhood can affect living standards is access to edu-cation. Table 3.5 reports the findings from Ainsworth and Filmer(2006) on enrollment rates for orphans and nonorphans. At least forthe first four studies shown, orphanhood is associated with substan-tially lower enrollment rates, with a difference between enrollment ratesfor nonorphans and two-parent orphans between 9 percent and 27percent, and paternal or maternal orphans somewhere in between.18
The literature points at various reasons for the apparent link betweenorphanhood and educational status or attainment. While enrollmentrates are usually correlated with household income, the link betweenorphanhood and household income is not clear in many countries (seeabove). Other factors that could have a bearing on orphan rates includethe degree to which the household head and an orphan living in thehousehold are related,19 or the nonmonetary aspects of the relationshipbetween parents and children.20
Development Impact of HIV and AIDS in South Asia 97

Table 3.5 also illustrates some of the difficulties involved in analyz-ing the effects of orphanhood. Especially for two-parent orphans, thenumber of observations is relatively low. In Cambodia, about 1 percentof 7- to 14-year-olds covered were two-parent orphans. In other Asiancountries, the proportion is (sometimes much) lower. As a consequence,the differences between orphans and nonorphans sometimes come outinsignificant.21
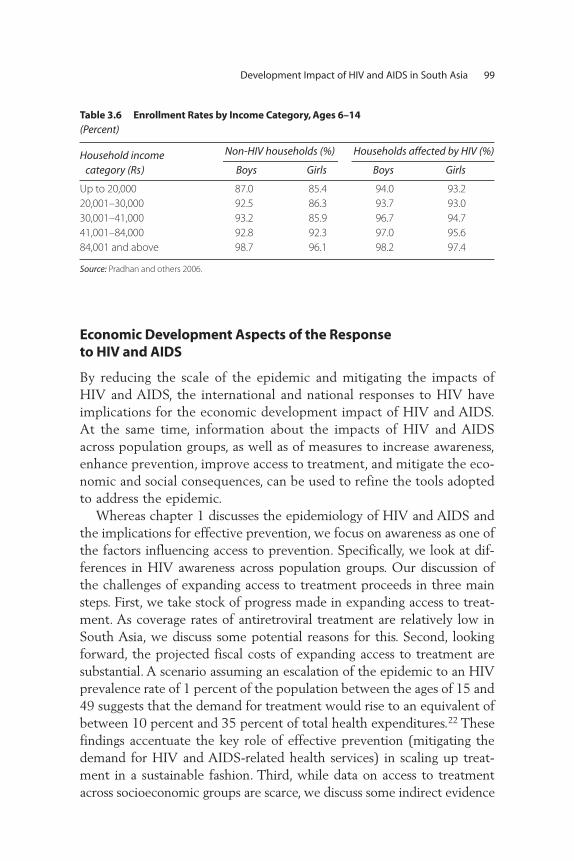
Both of the key studies we draw on in this section also provide someinformation on the status of orphans in households affected by HIV andAIDS in India. Das and others (2006) report on school attendance amonghouseholds affected by HIV and AIDS. They find that school attendancerates for children of widows or widowers living with HIV and AIDS areabout 15 percentage points lower than for households not affected byHIV and AIDS. Additionally, schooling expenditures per child in widow-led households are about one-third lower than for widower-led house-holds or households with both parents alive. Pradhan and others (2006)differentiate children by gender and household income category (table 3.6).Whereas enrollment rates are virtually the same for high-income house-holds affected or not affected by HIV and AIDS, enrollment rates are 7–8percentage points lower for the lowest income category. The table alsoprovides some evidence regarding a differential impact by gender— forthe income groups between Rs. 20,000 and Rs. 41,000, the decline inenrollment rates is more pronounced for girls.
98 Haacker
Table 3.5 Access of Orphans to Education, Six Countries
Samplesize
(Numberof 7- to 14-year-olds)
Householdswith at
least oneorphan
(Percent)
Enrollment rate of 7- to14-year-olds by orphan status (Percent)
Parentsalive
Paternalorphan
Maternalorphan
Two-parentorphan
Cambodia (2000) 16,437 8.1 77.4 71.9 64.2 58.5
Indonesia (1997) 29,513 n.a. 90.5 87.1 80.3 80.9
Indonesia (2002) 24,991 2.5 92.4 85.4 87.9 82.3
Lao PDR (2000) 8,953 4.5 74.6 64.7 65.6 48.0
Mongolia (2000) 5,327 4.8 71.2 73.6 70.6 87.5
Philippines (1999) 6,856 4.1 83.6 79.1 79.2 81.8
Vietnam (2000) 7,434 2.6 90.9 86.0 75.8 71.4
Source: Ainsworth and Filmer 2006.
Note: For orphans’ enrollment rates, italics indicate that enrollment rates are not statistically significantly different
from the nonorphan rate at the 5 percent level.
Economic Development Aspects of the Response to HIV and AIDS
By reducing the scale of the epidemic and mitigating the impacts ofHIV and AIDS, the international and national responses to HIV haveimplications for the economic development impact of HIV and AIDS.At the same time, information about the impacts of HIV and AIDSacross population groups, as well as of measures to increase awareness,enhance prevention, improve access to treatment, and mitigate the eco-nomic and social consequences, can be used to refine the tools adoptedto address the epidemic.
Whereas chapter 1 discusses the epidemiology of HIV and AIDS andthe implications for effective prevention, we focus on awareness as one ofthe factors influencing access to prevention. Specifically, we look at dif-ferences in HIV awareness across population groups. Our discussion ofthe challenges of expanding access to treatment proceeds in three mainsteps. First, we take stock of progress made in expanding access to treat-ment. As coverage rates of antiretroviral treatment are relatively low inSouth Asia, we discuss some potential reasons for this. Second, lookingforward, the projected fiscal costs of expanding access to treatment aresubstantial. A scenario assuming an escalation of the epidemic to an HIVprevalence rate of 1 percent of the population between the ages of 15 and49 suggests that the demand for treatment would rise to an equivalent ofbetween 10 percent and 35 percent of total health expenditures.22 Thesefindings accentuate the key role of effective prevention (mitigating thedemand for HIV and AIDS-related health services) in scaling up treat-ment in a sustainable fashion. Third, while data on access to treatmentacross socioeconomic groups are scarce, we discuss some indirect evidence
Development Impact of HIV and AIDS in South Asia 99
Table 3.6 Enrollment Rates by Income Category, Ages 6–14 (Percent)
Household income category (Rs)
Non-HIV households (%) Households affected by HIV (%)
Boys Girls Boys Girls
Up to 20,000 87.0 85.4 94.0 93.2
20,001–30,000 92.5 86.3 93.7 93.0
30,001–41,000 93.2 85.9 96.7 94.7
41,001–84,000 92.8 92.3 97.0 95.6
84,001 and above 98.7 96.1 98.2 97.4
Source: Pradhan and others 2006.

on access to treatment across population groups, looking at—amongother factors—access to antenatal care.
Distributional Aspects on Access to Information about HIV In addition to the ability to cope with the economic consequences of HIVand AIDS (discussed above) and access to treatment, knowledge andaccess to prevention services are key factors that affect an individual’s orhousehold’s vulnerability to HIV and AIDS. As spending on preventionmeasures or other inputs to prevention programs cannot easily be attrib-uted to individuals, an analysis of the socioeconomic dimension of accessto prevention primarily relies on outputs to prevention programs, forexample, changes in sexual and injecting risk behavior such as condomuse and use of clean needles.
While not an ideal indicator in terms of measuring the success of pre-vention efforts (as it does not necessarily translate into behavior change),data on knowledge about the sexual transmission of HIV are interesting inthe context of our discussion of the socioeconomic aspects of HIV andAIDS, as data on knowledge are available across certain socioeconomic cat-egories and across countries. Lacking data on access to and use of preven-tion services or of behavior change by income, our discussion will thereforefocus on knowledge about HIV across economic quintiles. Table 3.7 sum-marizes available data on knowledge about sexual transmission of HIV andAIDS for Bangladesh, India, and Nepal, and also reports data on knowledgeabout HIV prevention from the recently completed 2005–2006 NationalFamily Health Survey for India. We find a fairly regular pattern of HIVawareness by socioeconomic status across countries, with HIV awareness inthe lowest wealth quintile only a fraction of the level of awareness in thehighest quintile. Second, there are large differences between men andwomen, with average HIV awareness among women only about 50 percentto 60 percent of the level of awareness among men. Moreover, the “wealthgap” and the “gender gap” tend to reinforce each other—by far the lowestlevels of awareness are recorded for women in the lowest wealth quintile;and the gap between the highest and lowest quintile is much higher forwomen. One possible explanation for these gaps is access to education. Inthe countries covered, the patterns of HIV awareness resemble data onschool completion rates, and studies differentiating by years of schooling(such as International Institute for Population Science (IIPS) 2007; seelower panel of table 3.7) find a similar pattern by level of education.
To understand how differences in HIV awareness, risk behavior, andother factors translate into a socioeconomic profile of HIV and AIDS
100 Haacker

across the population, we would ideally be able to draw on the results ofpopulation studies identifying households and individuals affected byHIV and AIDS and those not affected, and compare the respective groups.Hopefully, this will be possible for India when the full dataset of the2005–2006 National Family Health Survey is released. Until then, themain data sources are surveys that compare households affected by HIVand AIDS with unaffected households in the same area.While this approachis geared toward identifying household impacts of HIV and AIDS, it con-tains little information on the composition of the population living withHIV and AIDS, because the sample is confined to households that havebeen identified because they receive some HIV-related medical services,and thus are not representative of the entire population living with HIVand AIDS.
A few conclusions regarding susceptibility can nevertheless be drawnfrom these studies. For example, they illustrate the differences in riskbehavior between men and women. While married men most commonly
Development Impact of HIV and AIDS in South Asia 101
Table 3.7 HIV Awareness across Population Groups(Percent)
Knowledge about sexual transmission of HIV
Average Lowest 2nd 3rd 4th Highest
Urban(Average)
Rural(Average)
Bangladesh (2004)
Men 51.5 27.5 36.6 47.6 59.8 78.4 69.7 45.7
Women 31.6 9.7 17.0 26.4 40.2 64.2 51.7 25.7
India (1998/99)
Women 25.3 4.6 8.7 19.3 33.6 59.6 62.8 48.5
Nepal (2001)
Men 63.4 49.8 55.8 60.5 64.1 84.2 n.a. n.a.
Women 28.9 10.9 19.1 23.8 33.6 59.6 64.3 49.5
Knowledge that consistent condom use can reduce chance of acquiring HIV
AverageNo
education <8 years 8–9 years>=10years
Urban(Average)
Rural(Average)
India (2006)
Men 68.1 33.9 62.8 82.0 93.2 85.6 59.5
Women 34.7 12.5 34.9 57.6 81.0 56.3 25.1
Sources: Gwatkin and others 2007a, 2007b, and 2007c, and IIPS 2007.
Note: For Nepal (2001), the numbers included in Gwatkin and others (2007c) for rural vs. urban HIV awareness
are inconsistent with the aggregates, as the average for both urban and rural HIV awareness is higher than the
average for the aggregate.
Wealth Quintile

acquire HIV from other sexual partners, women frequently becomeinfected by their husbands. In surveys of households affected by HIV andAIDS, this results in high rates of coinfection (both partners infected) andin high rates of HIV-positive widows, whereas the numbers of HIV-positive widowers is generally low. This is most likely explained by aninfection pattern whereby the husband acquires HIV earlier and—in manycases—passes it on to the spouse. For example, Das and others (2006)report that “in 54 percent of the ‘currently married’ families affected byHIV and AIDS, both adults are infected with HIV, while in 42 percent ofthem only the male adult is infected, and in only 6 percent of cases onlythe female adult is infected,” and that 76 percent of household heads whowere “ever married” (largely widows and widowers) are female. Similarly,Pradhan (2006) finds that 36 percent of women living with HIV andAIDS are widowed, but only 4 percent of the men are widowers.
Another key dimension of differences in susceptibility to HIV and AIDSare groups engaging in high-risk behaviors, such as sex workers and theirclients, men who have sex with men, and injecting drug users and theirpartners. While much of the literature regarding prevention strategiesfocuses on such vulnerable groups (see Wilson 2007), we have little infor-mation on the socioeconomic profile of these population groups, as theyare not easily accessible using standard survey techniques. While they aresome obvious linkages among HIV and AIDS, the propensity to engage inhigh-risk behavior, and development outcomes (most obviously for thelink between prostitution and poverty), we unfortunately cannot providean adequate discussion owing to data limitations.
The Challenge of Expanding Access to TreatmentAccess to care and treatment has the potential to mitigate the health andeconomic impacts of HIV and AIDS. However, access to treatment isuneven across and within countries.To the extent that access to treatmentis positively correlated with key development indicators, it may exacer-bate inequalities in living standards. At the same time, expanding accessto treatment represents a substantial logistical and financial challenge.With these basic considerations in mind, we will proceed along the fol-lowing lines. First we discuss the current situation in terms of access totreatment, and the scale of the challenge of expanding treatment. Whilethe data situation is very weak, we then provide some conjectures regard-ing the determinants of access to treatment within countries.
Table 3.8 summarizes the available data on access to treatment in SouthAsia. Generally, access to treatment is low in an international context.
102 Haacker

WHO, UNAIDS, and UNICEF (2007) estimate that the coverage rate forlow- and middle-income countries had risen to 28 percent as of the endof 2006; for Asia, they report an average coverage rate of 19 percent. If anadjustment is made for the revised estimates for India, the estimated cov-erage rate would rise to 31 percent globally and 33 percent for Asia. Formost countries in South Asia, the coverage rates attained so far are muchlower; only for India is the upper range of the estimates for treatmentaccess in the vicinity of the global average. There are two sets of factorsthat may help explain the low rates of access to treatment in South Asia—limited economic or health sector capacities, and the composition of peo-ple in need of treatment.
In this regard, we explore several indicators for the capacities of SouthAsian economies, or their health sectors, to address the demand forincreased health services associated with HIV and AIDS (figure 3.4).First, high levels of GDP per capita indicate both the availability of pub-lic financial resources to address increasing demand for health servicesassociated with HIV and AIDS, but also a higher capacity among resi-dents to privately pay for some of the costs of treatment, at least for part
Development Impact of HIV and AIDS in South Asia 103
Table 3.8 Access to Antiretroviral Treatment in South Asia
HIVprevalence,end of 2007
(ages 15–49)(Percent)
Estimatednumber of
peoplerequiring
treatment,end of 2007
Estimatednumber of
peoplereceiving
treatment,end of 2007
Antiretroviraltreatmentcoverage,
end of 2007(Percent)
Antiretroviraltreatmentcoverage,
end of 2005(Percent)
Afghanistan <0.01 n.a. 0 n.a. n.a.
Bangladesh 0.01 2,400 170 7 1
Bhutan 0.09 <100 18 n.a. n.a.
India 0.34 n.a. 158,000 n.a. 16
Maldives n.a. n.a. 1 n.a. 0
Nepal 0.5 20,000 1,400 7 1
Pakistan 0.10 20,000 600 3 2
Sri Lanka 0.03 780 107 14 6
Memorandum Items
China 0.08 190,000 35,000 19 25
Thailand 1.4 250,000 153,000 61 60
Myanmar 0.7 76,000 11,000 15 7
Source: WHO (2006a); UNAIDS and WHO (2008); WHO, UNAIDS, and UNICEF (2006); and WHO, UNAIDS, and
UNICEF (2008).
Note: The percent of people in India receiving ART comes from author’s calculations, based on WHO, UNAIDS,
and UNICEF (2006), making adjustments for subsequent revisions to estimated HIV prevalence.

of the population. Second, a country’s response to HIV may benefit fromexternal aid, including for scaling up access to treatment. We thereforeillustrate the correlation between HIV and AIDS-related aid and accessto treatment. Third, we look at the link between access to treatment andaccess to antenatal care as an indicator for the coverage rate of basic healthservices. Finally, as the situation regarding constraints to scaling up maydiffer very significantly across high- and low-prevalence countries, we showthe data for all countries where the data are available, and also for thesubset of countries with an HIV prevalence rate lower than 1 percent.
Figure 3.4 illustrates the correlation of access to antiretroviral treat-ment with these development indicators. The data on access to treatmentare based on the Progress Report by WHO, UNAIDS, and UNICEF (2007),and include all countries where point estimates on access to treatmentwere available (for South Asia: Bangladesh, Nepal, Pakistan, and Sri Lanka),plus India, where a point estimate for access to treatment was constructedfrom the midpoint estimates for people requiring and receiving treatmentreported in table 3.8.
Our findings include the following:
• South Asian economies are among the economies with the lowest lev-els of GDP per capita among countries with low HIV prevalence, andalso feature comparatively low rates of access to treatment within thisgroup. However, GDP per capita is not a convincing determinant of alow level of access to treatment in South Asia, as many low-incomecountries with higher levels of HIV prevalence (in the full sample)feature rates of access that are much higher than those attained inSouth Asia.23
• There is no indication that differences in access to external aid mayexplain the relatively low levels of access to treatment in South Asia.For both the low-prevalence countries and the full sample, access totreatment in South Asia is comparatively low relative to countries re-ceiving similar levels of external aid.
• Our data indicate that low access to treatment in South Asia is relatedto the low capacity of health systems in the region. Four of the SouthAsian countries are among the bottom five countries in terms of accessto antenatal care for the low-prevalence sample, and they are amongthe bottom 10 countries for the full sample. Especially among thelow-prevalence sample, access to treatment is positively correlatedwith the rate of access to antenatal care.
104 Haacker

• However, the case of Sri Lanka, with a very high level of antenatalcare, but an extremely low rate of access to treatment, amply illus-trates that limited capacities of health services only partly explain thelow levels of treatment in South Asia. At the same time, the exampleof Cambodia (with access to antenatal care of 38 percent, but accessto treatment at 83 percent) shows that low capacities in basic healthservices need not be an insurmountable obstacle to attaining high cov-erage rates of antiretroviral treatment.
The findings from our discussion of the correlation between access totreatment and key development indicators are confirmed by an econo-metric analysis, based on the full sample.24 Eq. (4) suggests that anincrease in HIV prevalence of 1 percentage point translates into a treat-ment coverage rate that is lower by 1.1 percentage points, that a differ-ence in GDP per capita of US$1,000 is associated with a difference intreatment access of 7 percentage points, that an additional US$1 in exter-nal aid per capita corresponds to a treatment access rate that is 2.9 per-centage points higher; and a rate of access to antenatal care that is 1percentage point higher translates into a treatment coverage rate that is0.3 percentage points higher. As in our more informal discussion, the lat-ter factor emerges as the most important one in terms of explaining dif-ferences in access to treatment in South Asia and other regions.
(4)
The Costs of TreatmentIn light of the findings of the previous section, estimates of the costs of scal-ing up of antiretroviral treatment should be treated with caution, as scalingup takes place in the context of national health systems, and as the capaci-ties of these systems in terms of financial resources, human resources, or theeffectiveness of the health sector, may complicate the tasks of scaling up, ormay pose constraints that cannot easily be overcome by additional financialresources only.
Nevertheless, estimates of the costs of scaling up provide importantinformation relevant for planning national responses to HIV. Most directly,it is important for budgeting to know the financial implications of anygiven target for the coverage rate of antiretroviral treatment. Second,
TREAT HIV GDPPC= − − ⋅ + ⋅
+− −6 0 1 11 0 007
2 90
0 5 2 4 6 9. . .
.
( . ) ( . )
**
( . )
***
(( . )
***
( . )
**. ,
. .
6 9 2 2
2 25
0 3
0 49
⋅ + ⋅
=
AIDPC ANCCARE
with R
Development Impact of HIV and AIDS in South Asia 105

relating the required funding to overall health expenditure provides anadditional indicator for the scale of the national response to HIV in thespecific national context. Third, a comprehensive scaling up is normallyassociated with a sustained increase in the number of people requiringtreatment (as survival rates for patients receiving treatment rise, whileadditional people living with HIV and AIDS reach the stage at whichthey also require treatment). To ensure the viability of the national treat-ment program in the future, it is therefore important to project the num-ber of people who will participate in a treatment program or requiretreatment, and to ensure that the required resources (human, financial,drugs, and so on) are provided.
In line with international developments, the costs of treatment—mostdecisively, the prices of antiretroviral drugs—have fallen in Asia over thelast years.Table 3.9 summarizes some of the latest available data.Allowingfor some data collection and publication lag (the table quotes only recentstudies published in 2006), these estimates suggest that the costs of anti-retroviral treatment in low- and middle-income countries in Asia werearound US$400–600 per year in 2004. To illustrate the progress made inimproving the affordability of these drugs over the last years, in China, thecosts were as high as US$10,000 in 2001 and US$4,000–5,000 in 2002.
To understand the full financial implications of expanded access totreatment, it is necessary also to account for the costs of administering thedrugs and monitoring the treatment. More comprehensive cost estimatesare available only for a subset of countries, suggesting an annual cost ofaround US$400. In the absence of estimates of the total costs of treatment
106 Haacker
Table 3.9 The Costs of Antiretroviral Treatment(Annual Costs, per Patient, in U.S. dollars)
Costs of drugsCosts of
monitoring, etc. Total
Cambodia 350 — —
China 400 — —
India 340 — —
India 397 420 817
Indonesia 600 — —
The Philippines 456–576 407 863–983
Sources: Morineau and others 2006 for Cambodia; Ma and others 2006 for China; Priya and others 2006 and
Gupta, Trivedi, and Kandamuthan 2006 for India; Gunawan, Kosen, and Simms 2006 for Indonesia; and Monzon
and Poblete 2006 for the Philippines.

for a wider set of countries, we will use this estimate throughout, using anindicative estimate of US$800 for the annual costs of treatment perpatient across countries.26 There are two principal uncertainties regardingthis estimate. First, the prices of drugs or other supplies (for example, CD4test kits) may fall, reducing the costs of treatment.27 Second, drug resist-ance or other treatment failure may result in an increasing demand formore expensive (“second-line”) drug combinations, especially as the num-ber of patients who have been on antiretroviral treatment for some timeincreases. The average unit costs of treatment may therefore increase.
Based on these estimates, we provide three scenarios for the actual orpotential costs of treatment (see table 3.10). Scenario 1 represents anestimate of the current cost of treatment, based on the latest estimatesof the numbers of people receiving treatment as of the end of 2006(from WHO, UNAIDS, and UNICEF (2007)). Scenario 2 presents thehypothetical costs of providing treatment to all people living with HIVand AIDS requiring treatment as of the end of 2006; that is, it corre-sponds to a coverage rate of treatment of 100 percent. Looking forward,one point that needs to be taken into account in estimating the poten-tial costs of a comprehensive treatment program is that the number ofpeople living with HIV and AIDS is endogenous (see Over 2004).Owing to reduced mortality and increased life expectancy, an expansionof treatment, controlling for other factors, is associated with an increasein the number of people living with HIV and AIDS and, even more pro-nounced, an increase in the number of people requiring treatment. Forthis reason, we report both estimates of the short-run costs (of provid-ing treatment to all patients requiring it as of the end of 2006) and esti-mates of the longer-term costs.
Specifically, Scenario 2 makes the following assumptions: (1) It takes thenumber of people living with HIV and AIDS as given (as reported in table3.1). (2) Regarding the immediate costs of a scenario with full access totreatment, it assumes that 20 percent of people living with HIV and AIDSrequire treatment.28 (3) Regarding the longer term, it assumes that—as aconsequence of a comprehensive treatment program—the number of peo-ple living with HIV and AIDS would rise by 80 percent, and that 60 per-cent of the people living with HIV and AIDS in this scenario receivetreatment. The scenario is based on the assumption that life expectancy inthe absence of treatment is 10 years after infection, that patients wouldrequire treatment after 7 years, and that treatment extends the lifespan by8 years (that is, 11 years after initiation of treatment).29
Development Impact of HIV and AIDS in South Asia 107

Tab
le 3
.10
Exp
and
ing
Acc
ess
to A
nti
retr
ovi
ral T
reat
men
t
HIV
pre
vale
nce,
end
of 2
006
(age
s15
–49,
perc
ent)
GD
P pe
r cap
ita,
2006
(US$
)
Tota
l hea
lth
expe
ndit
ure,
2004
(Per
cent
of G
DP)
Scen
ario
1(im
pact
)(im
pact
)(lo
nger
term
)(im
pact
)(lo
nger
term
)
Ban
gla
de
sh0
.01
44
51
3.1
0.0
00
10
.00
30
.01
50
.20
81
.12
6
Ind
ia0
.36
79
75
.00
.01
0.0
50
0.2
71
0.1
26
0.6
83
Ne
pal
0.5
33
95
.60
.00
40
.13
50
.72
80
.28
01
.51
2
Paki
stan
0.1
18
30
2.2
0.0
00
10
.01
20
.06
30
.11
90
.64
4
Sri L
anka
0.0
41
,35
54
.30
.00
02
0.0
03
0.0
17
0.0
82
0.4
45
Sour
ce:I
MF
(20
07
), U
NA
IDS
(20
06
), W
HO
(20
07
), an
d a
uth
or’s
est
imat
es
and
pro
ject
ion
s.
Not
e:Es
tim
ate
s fo
r A
fgh
anis
tan
, Bh
uta
n, o
r M
ald
ive
s ar
e n
ot
sho
wn
, as
po
int
est
imat
es
of H
IV p
reva
len
ce a
re n
ot
avai
lab
le fo
r th
ese
co
un
trie
s.
108
Cos
ts o
f Tre
atm
ent (
Perc
ent o
f GD
P)
Scen
ario
2Sc
enar
io 3

Scenario 3 is built in the same way as Scenario 2, but assumes thatunderlying HIV prevalence among the population between the ages of15 and 49 rises to 1 percent in all countries (plus the increase in HIVprevalence owing to longer survival times because of improved access totreatment). Estimating what would represent a credible adverse scenarioregarding the evolution of the HIV epidemic(s) in the region is beyondthe scope of this paper; our “1 percent” scenario is motivated simply byproviding a common indicator for the vulnerability of the respectivecountries’ health sectors to an escalation of the epidemic, “normalizing”the estimates with respect to the level of HIV prevalence.
We find that the current costs of providing treatment to people livingwith HIV and AIDS are modest both from a fiscal perspective and rela-tive to total health expenditures. Based on the numbers of patientsreceiving treatment as of the end of 2006, the costs were highest inIndia, at 0.01 percent of GDP, corresponding to 0.2 percent of totalhealth expenditures. If treatment coverage were to rise to 100 percent,the costs of treatment in India would rise to 0.05 percent of GDP, andto 0.27 percent of GDP in the longer run (about 5 percent of totalhealth expenditure). In Nepal, the country with the highest HIV preva-lence rate and the lowest level of GDP per capita, the costs would bemore substantial, eventually rising to 0.7 percent of GDP, and about 10percent of total health expenditure.This analysis of the longer-term costsalso accentuates the issue of sustainability of treatment programs, as thelong-term costs come out about five times higher than at initiation of theprogram. Finally, Scenario 3 provides some indication of the implicationsof a hypothetical escalation of the epidemic(s) to a prevalence rate of 1percent. In four countries (Bangladesh, Nepal, Pakistan, and Sri Lanka),the demand for treatment would exceed the equivalent of 5 percent oftotal health expenditure early on, and—in a comprehensive treatmentscenario—would eventually rise to between 10 percent and 35 percentof total health expenditure.
Distributional Aspects of Access to TreatmentAs we have argued above (in our discussion of socioeconomic impacts ofHIV and AIDS), it is important to understand the impact of HIV andAIDS across population groups in order to fully grasp the developmentimpact. This basic conjecture also applies to access to treatment, and ourdiscussion here continues the earlier analysis of characteristics of house-holds affected by HIV and AIDS and differences in the impact of HIVand AIDS across population groups. One principal obstacle to an analysis
Development Impact of HIV and AIDS in South Asia 109

of the distributional aspects of access to antiretroviral treatment is lack ofsocioeconomic data on people receiving antiretroviral treatment. As astarting point, we therefore discuss socioeconomic differences in access tohealth services for which some cross-country data are available for SouthAsia (antenatal care visits to a medically trained person). Our discussionthen closes with a review of some evidence regarding differences in accessto treatment across population groups, focusing on differences by genderand access to treatment for injecting drug users (an important groupamong people living with HIV and AIDS in many South Asian countries).
Our choice of antenatal care visits to a medically trained person as anindicator for access to health services across population groups has beenmotivated by several considerations. One important aspect is data avail-ability, as this is an indicator that has consistently been included in majorhealth surveys across countries. Also, HIV and AIDS-related health serv-ices are typically delivered in larger health facilities rather than clinicscatering only to people affected by HIV and AIDS. The data on antena-tal care—as they carry some information on access to health facilities ingeneral—may therefore provide a proxy for access to HIV and AIDS-related services. Antenatal care is also associated with antiretroviral treat-ment for prevention of mother-to-child transmission of HIV, and—thoughless directly—with access to antiretroviral treatment for adults, as tests atantenatal clinics may result in the detection of an infection. One primaryshortcoming of this indicator, in the context of South Asia, is that antena-tal care is utilized by women, whereas the majority of people living withHIV and AIDS are men. Table 3.11 summarizes data on antenatal carevisits for Bangladesh, India, and Nepal.
We find a fairly regular pattern of antenatal care visits across countries.First, there are substantial differences in access across wealth quintiles. Inthis regard, India is the most equitable country, with access for the high-est quintile about double the access for the lowest quintile, while the cor-responding factor is higher than three for Bangladesh. Second, differencesin the quality of services reinforce inequalities in overall access. While thewealthiest quintile predominantly draws on the services of a doctor, thepoorer quintiles frequently (in the case of Nepal predominantly) onlyhave access to a nurse or trained midwife. Third, controlling for wealth,there are gaps in access to services between the urban and rural popula-tions, especially for the lower wealth quintiles.30
Another potential dimension of inequities in access to treatmentregards differences by gender. While this is an important aspect of thesocioeconomic impacts of HIV and AIDS, access to treatment seems to
110 Haacker

Development Impact of HIV and AIDS in South Asia 111
Table 3.11 Antenatal Care Visits to a Medically Trained Person (Percent)
Wealth Quintile
Average Lowest 2nd 3rd 4th Highest
Bangladesh (2004) 48.8 24.9 38.6 48.8 60.6 81.1
to doctor 31.3 12.3 18.9 26.8 42.0 65.6
to nurse or trained
midwife 17.5 12.6 19.7 22.0 18.6 15.5
Rural 43.0 24.1 37.0 46.7 59.3 74.2
Urban 71.0 33.9 52.9 62.0 66.7 85.7
India (1998/99) 65.7 44.1 55.3 68.6 80.3 92.8
to doctor 49.3 26.9 37.0 48.6 65.1 83.3
to nurse or trained
midwife 16.5 17.2 18.3 20.0 15.2 9.5
Rural 59.8 43.5 54.2 67.3 78.5 90.1
Urban 86.4 64.6 74.1 76.2 83.4 94.1
Nepal (2001) 48.6 30.4 37.9 50.8 57.5 79.5
to doctor 16.6 6.2 8.5 12.7 18.5 48.2
to nurse or trained
midwife 31.9 24.2 29.4 38.0 39.0 31.3
Rural 46.1 30.4 37.7 50.8 56.7 75.9
Urban 80.9 n.a. (51.8) (49.7) 77.4 85.8
Source: Gwatkin and others 2007a, 2007b, and 2007c.
Note: Numbers in brackets “indicate the absence of adequate observations to produce acceptably reliable values”
(Gwatkin 2007c).
be fairly even across sexes, with a slight advantage for women in mostcountries. For Asia overall, WHO, UNAIDS, and UNICEF (2007) findthat women account for 39 percent of people receiving antiretroviraltreatment, which is higher than their share in the population of peopleliving with HIV and AIDS (32 percent). The only South Asian countryfor which these data are available is India, with a share of women amongpeople living with HIV and AIDS of 39 percent, while they account for33 percent of people receiving treatment.
Finally, one factor that may be relevant regarding inequities in accessto treatment in South Asia is the role of injecting drug users. Aceijas(2006) reports that they accounted for 1.4 percent of people receivingtreatment in India at the end of 2004. Given that injecting drug use isconsidered the main factor in the spread of HIV in northeast India, andan important factor in other areas, this rate is certainly much lower thanthe share of injecting drug users among people living with HIV andAIDS. Thus, this factor points at the possibility that difficulties involved

in providing treatment to high-risk populations contribute to low ratesof access to treatment.
Summary and Conclusions
The picture that emerges regarding the economic development impactsof HIV and AIDS is complex; key findings include the following:
• The impacts of HIV and AIDS on GDP per capita are small. For India,the level effect on GDP per capita (–0.16 percent) corresponds to theequivalent of a one-off loss of about 1.5 weeks of GDP growth, andthe slowdown in population growth implies a slowdown GDP growthof 0.02 percentage points through 2015, and a smaller decline lateron. (Some factors, for example, regarding human capital accumula-tion, may exacerbate the negative impacts in the longer run, but wehave no data suitable for quantifying these effects at present.)
• Using a simple model that evaluates the direct welfare costs of increas-ing mortality, we find that these welfare costs are substantial, account-ing for 3 percent to 4 percent of GDP in India and Nepal, the countrieswith the highest prevalence rates in the region.
• HIV awareness is substantially lower for the lower wealth quintiles.Within quintiles, awareness is lower for women and for rural households.
• In a household study on India, 36.5 percent of people living with HIVand AIDS who were able to retain their employment nevertheless report-ed an income loss, which averaged about 9 percent. Among those wholost their employment (about 9 percent of the sample of people livingwith HIV and AIDS), the income loss was severe, at about 66 percent.
• The ability to cope with the financial effects of HIV and AIDS dif-fers strongly across wealth quintiles. For the lowest wealth quintile,Pradhan and others (2006) report savings rates of –23 percent forhouseholds affected by HIV and AIDS, as opposed to 0 percent for thenon-HIV group.
• Based on household data from India, we find that the situation of HIV-positive widows is worse than for other people living with HIV andAIDS, probably reflecting the status of widows in general. As manywomen living with HIV and AIDS are widows (reflecting an infectionpattern whereby women frequently are infected by their husbands,who acquire the virus through various forms of risky behavior), thismeans that HIV and AIDS does have a disproportionate economicimpact on women.
112 Haacker

• In India and Nepal, the number of orphans will increase by about0.4 percent. By age 17, about 0.9 percent of the young population willhave experienced orphanhood owing to HIV and AIDS.
• We find access to antiretroviral treatment (about 20 percent in India,and less than 10 percent in the other countries) in the region to be lowin an international context. In many countries in the region, one keyfactor that appears to limit progress in scaling up is the low capacityof national health systems, as well as less support from internationalinitiatives (countries in other regions with low capacity and weak sys-tems have higher ART coverage).
• Using largely circumstantial evidence (for example, access to otherforms health services), we find indications for inequities in access tohealth services across socioeconomic groups. To the extent that theseinequities also extend to access to antiretroviral treatment, they exac-erbate the disproportionate impact on poorer population groups.
One point that needs emphasizing is the lack of data on the socioeco-nomic dimension of HIV and AIDS in South Asia, especially beyondIndia. Our discussion of the impacts of HIV and AIDS largely rests onsurveys matching households affected by HIV and AIDS with a controlgroup; while this may represent a best-available approach, it is problem-atic because it rests on first identifying households affected by HIV andAIDS, which means that the sample largely consists of people living withHIV and AIDS who receive some kind of HIV and AIDS-related medicalattention, and who likely are not representative of the population affectedby HIV and AIDS. At least for India, the recently completed 2005–2006National Family Health Survey may provide some improved insightsregarding the socioeconomic dimension of HIV and AIDS.Along the samelines, our knowledge of the extent and determinants of access to anti-retroviral treatment is very limited, beyond estimates of the overall num-ber of people receiving it on a national level.
In terms of policy implications and a research agenda, the key findingsfrom our analysis (data permitting) relate to the socioeconomic profile ofthe epidemic. In terms of the susceptibility to HIV, as well as the impli-cations for living standards, we find that the vulnerability to and the impactof the epidemic differs strongly across population groups by wealth, educa-tion, and gender. This is an important finding toward understanding theimpacts of the epidemic, as many of the implications of HIV and AIDSin the context of attaining the Millennium Development Goals arisefrom these discrepancies across population groups. At the same time, our
Development Impact of HIV and AIDS in South Asia 113

findings highlight the complexities of the response to HIV, as evident,for example, from our findings regarding the linkages of access to treat-ment and the strength of health systems, or the apparent relationshipbetween access to education and HIV awareness.
Notes
1. This comparison is based on age-standardized estimates of mortality fromWHO (2006c). AIDS-related mortality for India was scaled in line withupdated estimates of HIV prevalence and mortality for this country.
2. A different approach would involve obtaining such coefficients based on thelarger set of countries for which estimates of the impact of HIV and AIDS areavailable. We have therefore run regressions, using estimates for the 62 coun-tries covered by UN Population Division (2007), to obtain more preciseapproximations for the underlying demographic model that could be used tofill in the blanks. However, we adopt the simpler approach because HIVprevalence explained most of the variation in key indicators in these regres-sions (typically, around 95 percent), the role of interactions with other vari-ables is limited, and because the data set of 62 countries, including countrieswith very different demographic profiles compared to the South Asian coun-tries we focus on, may be less representative of the South Asian countries(excluding India) than India is.
3. While adjusting for the overestimates of the scale of the epidemic by scalingthe estimated demographic impacts accordingly, we are not able to disentan-gle the effects that the corresponding underestimate of the coverage rate oftreatment had on the estimated indicators of the demographic impact of HIVand AIDS.
4. More recent surveys of the available literature, for example, UNAIDS (2007)and Coffie and others (2007), suggest somewhat longer survival periods.
5. Haacker (2004b) provides an overview; Bloom and others (2004) discuss thisand other approaches and draw some inferences regarding the impact of HIVand AIDS in Asia.
6. This assumes a direct effect productivity of 0.05 percent, in the interior of therange quoted. The multiplier effect (taking A to the power (1/(1–α); seeequation (2)) increases the direct effect to about 0.08 percent.
7. Similar to our simple analysis, many studies of the economic impacts of HIVand AIDS in various African countries find large declines in GDP (relative toa baseline scenario), but much smaller declines in GDP per capita. In otherwords, the slowdown in GDP is dominated by a decline in population growth.
8. For example, Shantayanan and Nabi (2006) do not identify HIV and AIDSamong the challenges to sustaining growth in South Asia. Some earlier
114 Haacker

studies, such as Eberstadt (2002), predicted a more significant impact onlonger-term growth, but on the basis of demographic scenarios that havenot borne out.
9. A finer point is that the impact of HIV and AIDS may not be fully capturedin national income accounts, for example, when commercial sex work takesplace in the informal sector.
10. A note is in order regarding the role of surviving dependents, especially chil-dren, who are not included in the above presentation, but could well be cap-tured in the individual’s welfare function by adding a term describing theappropriately weighted welfare of an individual’s offspring to eq. [(3)]. Thiswould not yield fundamentally different results, especially when the individ-ual expects that his or her children would be affected by an epidemic likeHIV in a similar fashion.
11. As the compensating variation, in our context, is always larger than the equiv-alent variation, it is important to make clear which measure is used. If we donot state so explicitly, all our estimates of welfare costs of HIV and AIDSrelate to the equivalent variation.
12. This estimate is motivated by empirical studies analyzing the link betweenwage differentials and differences in mortality risk across occupations. Thefact that the “conversion factor” is higher than one reflects risk aversion andthe declining marginal utility of consumption. Philipson and Soares (2005),drawing on similar sources, use a somewhat lower value (about 2.9, obtainedas the inverse of the consumption elasticity of the utility function of 0.346quoted in their study).
13. An alternative approach that is sometimes used values the economic losses tohouseholds based on earnings lost owing to premature death. Under certainassumptions (full employment, fully integrated labor market), the earningslost are equal to the accumulated losses to GDP over time owing to a prema-ture death (but substantially understate the individual costs of the risk of pre-mature mortality according to the micro-based framework we apply). Usingthis approach, the Asian Development Bank and UNAIDS (2004a, 2004b)estimated that the cost of HIV and AIDS amounted to US$13.7 billion in2004, corresponding to about US$17,000 per AIDS death.
14. The declines in the savings rate may be larger than reported in table 3.4, as itis not clear whether household borrowing is factored in.
15. For example, Botswana, Namibia, or South Africa.
16. The assumed cap on paternal mortality is consistent with the scant evidencesuggesting high rates of coinfection among couples, which would not allow forlarge differences in HIV prevalence between parent couples. Alternatively,this adjustment is consistent with an assumption that men engaging in high-risk behavior may have a lower propensity to procreate.
Development Impact of HIV and AIDS in South Asia 115

17. A rate of double orphans among AIDS orphans of one-quarter is lowerthan in countries for which estimates exist (essentially, Sub-Saharan Africa,where double orphans account for about one-third of AIDS orphans).However, the differences in male vs. female HIV prevalence imply a lowershare of double orphans.
18. These findings are similar to estimates by Case, Paxson, and Ableidinger(2002) for Sub-Saharan Africa.
19. On this issue, see Case and Paxson (2006), or Case, Paxson, and Ableidinger(2002); however, both studies are dealing with Sub-Saharan Africa.
20. See Gertler, Levine, and Martinez (2006) for a study using data from Indonesia.
21. For example, the studies quoted for Mongolia and Vietnam only have 24 and11 observations, respectively, for two-parent orphans.
22. The range primarily reflects differences in GDP per capita across countries,although differences in health spending across countries also play a role (seetable 3.10).
23. The upper panel of figure 3.4 also illustrates another aspect of the correlationbetween HIV and AIDS and GDP per capita regarding South Asia.The SouthAsian economies are among the few low-income economies that have beensuccessful in containing HIV prevalence at levels below 1 percent.
24. See Haacker (2008) for more details.
25. Standard errors in parentheses. Three and two stars indicate coefficients sig-nificant at the 1 and 5 percent confidence levels, respectively.
26. As the costs of monitoring include personnel costs, they may differ acrosscountries in line with different levels of income and, on a macroeconomiclevel, GDP per capita. However, GDP per capita for most countries shown iswithin or close to the range spanned by India and the Philippines (aboutUS$500–US$1,000), so these estimates probably are not unreasonable formost low- and low-middle-income countries in the region.
27. Das and others (2006) provide a discussion of the quantitative impact ofchanges in prices of antiretroviral drugs and CD4 test kits.
28. Depending on the state of the epidemic, the share of people requiring treat-ment may differ across countries. For example, in the context of an escalatingepidemic, following a rise in HIV prevalence, the share of people living withHIV and AIDS requiring treatment would be relatively low. Using a commonbenchmark for the share of PLWH requiring treatment neutralizes this short-term effect on our cost estimates.
29. These assumptions are inspired by UNAIDS 2007, and Coffie and others 2007.
30. This finding about the urban/rural differential is in line with findingsreported in Pradhan and others (2006), who report that 17.7 percent of thepeople living with HIV and AIDS they surveyed were receiving antiretro-viral treatment in urban areas, as compared to 10.3 percent in rural areas.
116 Haacker

(As the sample includes people living with HIV and AIDS already identifiedand receiving some kind of medical attention, the share in this group receiv-ing treatment is much higher than for the general population).
References
Aceijas, Carmen, and others. 2006. “Antiretroviral Treatment for Injecting DrugUsers in Developing and Transitional Countries 1 Year Before the End of the‘Treating 3 Million by 2005. Making it Happen. The WHO Wtrategy’ ‘3by5’.”Addiction 101 (9): 1246–53.
Ainsworth, Martha, and Deon Filmer. 2006. “Inequalities in Children’sSchooling: AIDS, Orphanhood, Poverty, and Gender.” World Development 34(6): 1099–1128.
Asian Development Bank and UNAIDS (Joint United Nations Programme onHIV/AIDS). 2004a. Asia-Pacific’s Opportunity: Investing To Avert an HIV/AIDSCrisis. Manila, the Philippines and Geneva, Switzerland: Asian DevelopmentBank and UNAIDS.
———. 2004b. “Socio-Economic Impact of HIV/AIDS in Asia and the Pacific:Current and Future Scenario.” Study Series, Paper No. IV, AsianDevelopment Bank and UNAIDS, Manila, the Philippines and Geneva,Switzerland.
Bloom, David E., and others. 2004. Asia’s Economies and the Challenge of AIDS.Manila, the Philippines: Asian Development Bank.
Bloom, David E., and Peter Godwin, eds. 1997. The Economics of HIV/AIDS—TheCase of South and South East Asia. Oxford and New York: Oxford UniversityPress.
Case, Anne, and Christina Paxson. 2006. “The Care and Future of Orphans inAfrica.” Presented at Amsterdam Institute for International Developmentworkshop on “The Economic Consequences of HIV/AIDS,” December.
——— and Joseph Ableidinger. 2002. “Orphans in Africa,” Working Paper No.9213, National Bureau of Economic Research, Cambridge, MA.
Coffie, Patrick Ahuatchi, Raoul Moh, Didier Koumavi Ekouevi, and FrançoisDabis. 2007. Survival of HIV-infected Adults and Children on AntiretroviralTherapy in Low- and Middle-Income Countries. Bordeaux, France: Institut deSanté Publique, Epidémiologie et Développement (ISPED) and UniversitéVictor Segalen—Bordeaux.
Commission on AIDS in Asia. 2008. “Redefining AIDS in Asia—Crafting anEffective Response.” Report of the Commission on AIDS in Asia, OxfordUniversity Press, New Delhi, India.
Crafts, Nicholas, and Markus Haacker. 2002. “Welfare Implications of HIV/AIDS.”Working Paper 03/118, International Monetary Fund, Washington, DC.
Development Impact of HIV and AIDS in South Asia 117

———. 2004. “Welfare Implications of HIV/AIDS.” In Macroeconomics ofHIV/AIDS, ed. M. Haacker, 182–197. Washington, DC: InternationalMonetary Fund.
Das, Sanghamitra, Abhiroop Mukhopadhyay, and Tridip Ray. 2006. “TowardsMeasuring the Economic Cost of HIV/AIDS: The Indian Experience.”Unpublished manuscript, Indian Statistical Institute, Delhi Centre, Delhi, India.
Devarajan, Shantayanan, and Ijaz Nabi. 2006. Economic Growth in South Asia:Promising, Un-equalizing, ...Sustainable? Washington, DC: World Bank.
Eberstadt, Nicholas. 2002. “The Future of AIDS.” Foreign Affairs 81 (6): 22–45.
Gertler, Paul, David Levine, and Sebastian Martinez. 2006. “The Presence andPresents of Parents: How Parental Death and Disability Affects Children.” Paperpresented at Amsterdam Institute for International Development workshop on“The Economic Consequences of HIV/AIDS,” December. Amsterdam.
Gunawan, Suriadi, Soewarta Kosen, and Chris Simms. 2006. “Indonesia.” In TheHIV Pandemic—Local and Global Implications, ed. Eduard Beck and others,317–332. Oxford and New York: Oxford University Press.
Gupta, Indrani, Mayur Trivedi, and Subodh Kandamuthan. 2006. “An Analysis ofRecurrent Costs of the Free ART Programme of the Government of India.”Discussion Paper No. 18, South Asian Human Development Sector, WorldBank, Washington, DC.
Gwatkin, Davidson R., and others. 2007a. India—Socio-Economic Differences inHealth, Nutrition, and Population. Washington, DC: World Bank.
Gwatkin, Davidson R., and others. 2007b. Bangladesh—Socio-Economic Differencesin Health, Nutrition, and Population. Washington, DC: World Bank.
Gwatkin, Davidson R., and others. 2007c. Nepal—Socio-Economic Differences inHealth, Nutrition, and Population. Washington, DC: World Bank.
Haacker, Markus, 2007. “Financing the Response to HIV/AIDS: Some Fiscal andMacroeconomic Considerations.” Unpublished manuscript, based on presen-tation at conference on HIV/AIDS Interventions in Developing Countries,Harvard School of Public Health, Boston, September 13–15, 2006.
Haacker, Markus. 2004. “HIV/AIDS: The Impact on the Social Fabric and theEconomy.” In The Macroeconomics of HIV/AIDS, ed. Markus Haacker, 41–95Washington, DC: International Monetary Fund.
International Institute for Population Sciences (IIPS). 2007. “2005–2006 NationalFamily Health Survey (NFHS-3)—National Fact Sheet India (ProvisionalData)” IIPS, Deonar, Mumbai, India.
Jamison, Dean T., Jeffrey D. Sachs, and Jia Wang. 2001. “The Effect of the AIDSEpidemic on Economic Welfare in Sub-Saharan Africa.” Working Paper SeriesNo.WG1:13, Commission on Macroeconomics and Health, World HealthOrganization, Geneva, Switzerland.
118 Haacker

Lopez, Alan D., Colin D. Mathers, Majid Ezzati, Dean T. Jamison, and ChristopherJ.L. Murray. 2006. Global Burden of Disease and Risk Factors. Washington, DC:World Bank.
Monzon, Ofelia T., and Roderick E. Poblete. 2006. “The Philippines.” In The HIVPandemic—Local and Global Implications, ed. Eduard Beck and others. Oxfordand New York: Oxford University Press.
Morineau, Guy, and others. 2006. “Cambodia.” In The HIV Pandemic—Local andGlobal Implications, ed. Eduard Beck and others, 270–281. Oxford and NewYork: Oxford University Press.
National Institute of Public Health (NIPH), National Institute of Statistics(NIS), and ORC Macro. 2007. Cambodia Demographic and Health Survey2005. Phnom Penh, Cambodia, and Calverton, MD: NIPH, NIS, and ORCMacro.
National AIDS Control Organisation (NACO). 2007. HIV Sentinel Surveillanceand HIV Estimation, 2006. New Delh, India: NACO.
Ojha, Vijay P., and Basanta K. Pradhan. 2006. The Macro-Economic and SectoralImpacts of HIV and AIDS in India—A CGE Analysis. New Delhi, India:United Nations Development Programme.
Over, Mead. 2004. “Impact of the HIV/AIDS Epidemic on the Health Sectors ofDeveloping Countries.” In The Macroeconomics of HIV/AIDS, ed. MarkusHaacker, 311–344. Washington, DC: International Monetary Fund.
Over, Mead, Peter Heywood, Julian Gold, Indrani Gupta, Subhash Hira, and ElliotMarseille. 2006. HIV/AIDS Treatment and Prevention in India—Modeling theCost and Consequences. Washington, DC: World Bank.
Philipson, Thomas J., and Rodrigo R. Soares. 2005. “The Economic Cost of AIDS inSub-Sahran Africa: A Reassessment.” In Health and Economic Growth: Findingsand Policy Implications, ed. Guillem López-Casasnovas, Berta Rivera, and LuisCurrais, 315–36. Cambridge, MA: MIT Press.
Pradhan, Basanta K., Ramamani Sundar, and Shalabh K. Singh. 2006. Socio-Economic Impact of HIV and AIDS in India. New Delhi, India: United NationsDevelopment Programme.
Pradhan, Basanta K., Ramamani Sundar, and Shalabh K. Singh. 2006. Gender Impactof HIV and AIDS in India. New Delhi, India: United Nations DevelopmentProgramme.
Priya, R., and others. 2006. “India.” In The HIV Pandemic—Local and GlobalImplications, ed. Eduard Beck and others, 300–16. Oxford and New York:Oxford University Press.
Shao-Jun, Ma, and others. 2006. “China.” In The HIV Pandemic—Local and GlobalImplications, ed. Eduard Beck and others, 282–99. Oxford and New York:Oxford University Press.
Development Impact of HIV and AIDS in South Asia 119

Sundar, Ramamani. 2005. “The Household Impact of HIV/AIDS on the Educationof Children—A Study of HIV High Prevalence States of India.” Paper presentedat XXV International Population Conference, Tours, France, July 18–23.
UNAIDS (Joint United Nations Programme on HIV/AIDS). 2007. “ImprovingParameter Estimation, Projection Methods, Uncertainty Estimation, andEpidemic Classification.” Report of a meeting of the UNAIDS Reference Groupon Estimates, Modeling and Projections held in Prague, Czech Republic, Nov.29–Dec. 1.
UNAIDS (Joint United Nations Programme on HIV/AIDS) and World HealthOrganization (WHO). 2006a. 2006 Report on the Global AIDS Epidemic.Geneva, Switzerland: UNAIDS and WHO.
UNAIDS (Joint United Nations Programme on HIV/AIDS) and World HealthOrganization (WHO). 2006b. AIDS Epidemic Update—December 2006Geneva, Switzerland: UNAIDS and WHO.
UNAIDS (Joint United Nations Programme on HIV/AIDS), National AIDSControl Organisation (NACO), and World Health Organization (WHO).2007. “2.5 Million People in India Living with HIV, According to NewEstimates.” Press Release, July 6.
UNAIDS (Joint United Nations Programme on HIV/AIDS), United NationsChildren’s Fund (UNICEF), and U.S. Agency for International Development(USAID). 2004. Children on the Brink 2004. Geneva, Switzerland, New York,and Washington: UNAIDS, UNICEF, and USAID.
United Nations Population Division. 2007a. World Population Prospects: The 2006Revision—Highlights. New York: United Nations.
United Nations Population Division. 2007b. World Population Prospects: The 2006Revision Population Database. New York: United Nations.
World Health Organization (WHO). 2006a. Progress on Global Access to HIVAntiretroviral Therapy—A Report on “3 by 5” and Beyond. Geneva, Switzerland:WHO.
———. 2006b. India—Epidemiological Fact Sheet on HIV/AIDS and SexuallyTransmitted Infections. Geneva, Switzerland: WHO.
———. 2006c. “Death and DALY Estimates for 2002 by Cause for WHOMember States.” Geneva, Switzerland. http://www.who.int/healthinfo/bod/en/ index.html.
———. 2007. World Health Statistics 2007. Geneva, Switzerland: WHO.
———. Regional Office for South-East Asia. 2007. HIV/AIDS in the South-EastAsia Region. New Delhi, India: WHO Regional Office for South-East Asia.
World Health Organization (WHO), Joint United Nations Programme onHIV/AIDS (UNAIDS), and United Nations Children’s Fund (UNICEF). 2008.Towards Universal Access—Scaling up Priority HIV/AIDS Interventions in the
120 Haacker

Health Sector. Geneva, Switzerland, and New York: WHO, UNAIDS, andUNICEF.
World Health Organization (WHO), Joint United Nations Programme onHIV/AIDS (UNAIDS), and United Nations Children’s Fund (UNICEF).2006. Towards Universal Access—Scaling up Priority HIV/AIDS Interventionsin the Health Sector. Geneva, Switzerland, and New York: WHO, UNAIDS,and UNICEF.
Development Impact of HIV and AIDS in South Asia 121


Introduction
According to the latest available estimates, there are currently about2.5 million people living with HIV or AIDS in India, corresponding to aHIV prevalence rate of 0.36 percent for the population ages 15–49 (IIPS2007). While HIV prevalence thus remains relatively low, there are sev-eral factors that are unique to India’s HIV epidemic, and need to be takeninto account when assessing the impact of HIV and AIDS. (1) The scaleof the epidemic and patterns of infection differ across states, and evenbetween neighboring districts (see Wilson, this volume).Together with thefact that some of these states and districts are larger than many Africancountries affected by HIV and AIDS, this illustrates the complexities ofthe response to HIV and AIDS in India. (2) Of the two types of HIVvirus—a slow-progressing one and a fast-progressing one that kills withinsix to nine years without any antiretroviral therapy—the latter type ofvirus is the predominant one in India. (3) India is a predominantly poorcountry with low levels of nutrition and high exposure to various typesof bacteria and viruses, including tuberculosis—factors that exacerbatethe morbidity and mortality of HIV and AIDS.
Economic Cost of HIV and AIDS
in India
Sanghamitra Das, Abhiroop Mukhopadhyay, and Tridip Ray
123
C H A P T E R 4
Against this background, our study of the economic costs of HIV andAIDS in India relates to two different strands of literature on the eco-nomic implications of HIV and AIDS.
• Studies estimating the aggregate economic impact of HIV and AIDS.The most important approaches under this heading are (1) studiesfocusing on the impacts on GDP or GDP per capita, and (2) studiesestimating welfare costs, which are defined more broadly, includingby making explicit allowance for the impacts of HIV and AIDS onmortality.
• Studies focusing on the household-level effects of HIV and AIDS.Findings from such studies frequently accentuate not only the highcosts of HIV and AIDS to the affected households and individuals, butalso differences in the vulnerability to and the impacts of HIV acrosspopulation groups.
Our study draws from and builds on both of these strands of literature. Interms of the theoretical framework, it is related to prior studies using anexplicit utility framework to capture the welfare costs of increased mortal-ity (see the discussion by Haacker, this volume). One important shortcom-ing of these approaches is that they put strong emphasis on the welfareeffects of increased mortality, while estimates of the impacts of HIV andAIDS based on household surveys typically suggest a much more compleximpact on the well-being of household members.
Meanwhile, much of the evidence of the impacts of HIV and AIDSobtained from household surveys is indirect. One reason for this is that,owing to the generally low HIV prevalence in South Asia, household stud-ies include few questions that offer direct insights regarding the impactsof HIV and AIDS. For example, much of our understanding of the impli-cations of HIV and AIDS on orphanhood or widowhood derives fromstudies focusing on the status of orphans and widows in general, but arenot specific to HIV and AIDS.
Our study provides added value relative to both of these strands ofliterature. First, we offer a theoretical framework that captures more ofthe richness of the impacts of HIV and AIDS evident from householdsurveys. A key aspect of the impacts of HIV and AIDS in this frameworkis the impact on “mental health” (as opposed to physical health), whichwe measure based on survey responses regarding the subjective well-being of respondents. Second, our survey is designed from the outset to
124 Das, Mukhopadhyay and Ray

capture the multiple impacts of HIV and AIDS. In addition to data on theeconomic impacts and consequences of HIV and AIDS (income, medicalexpenditure, wealth), we obtain measures of the impact of HIV and AIDSon both mental health and physical health.
The chapter is organized as follows. We start out by discussing in moredetail the context of our chapter in terms of the available studies of theeconomic impacts of HIV and AIDS in terms of the impacts on growth,GDP, or income, and in terms of the broader welfare effects (typicallyfocusing on increased mortality). Additionally, we also introduce some ofthe literature from which our notion of “mental health” draws. This sec-tion is followed by a summary of our findings from a survey of householdsaffected by HIV and AIDS. This is followed by an outline of the model usedto analyze the costs of HIV and AIDS to the households affected, and asection describing the process of estimating the costs of HIV and AIDS andpresenting our findings. A concluding section closes the chapter.
Context
Most of the studies projecting the impact of HIV and AIDS on the growthrate of per capita GDP use some version of the neoclassical growth modeland typically estimate declines of 0.5 percent to 1.5 percent, even for theworst affected countries with more than 20 percent HIV prevalencerates.1 For countries like India, with an HIV prevalence rate of less than0.5 percent, this translates into very small effects of HIV and AIDS ongrowth (see Haacker, this volume). Somewhat differently, Young (2005)emphasizes the decline of fertility associated with the HIV epidemic.Using South African data, he estimated that the positive effects of lowerpopulation growth on real wages would be strong enough to offset otheradverse effects.
A growing body of relatively recent literature (see, for example, Ferreiraand Pessoa 2003; Bell, Devarajan, and Gersbach 2004, 2006; Corrigan,Gloom, and Mendez 2004, 2005) emphasizes the transmission of humancapital across generations and concludes that by disrupting the mechanismthat drives the process of the transmission of knowledge and abilities fromone generation to the next, the AIDS epidemic will result in a substantialslowdown of economic growth. Part of the analysis relies on the dynamicimplication of the mechanism that AIDS lowers investment in humancapital of children since “. . . the expected pay-off ( from this investment)depends on the level of premature mortality among the children when they
Economic Cost of HIV AND AIDS in India 125

attain adulthood” (see Bell, Devarajan, and Gersbach 2006, page 59; ouritalics). This mechanism may be applicable for high-prevalence countriessuch as South Africa, but is not quite relevant for India, with a prevalencerate of just 0.36 percent and where there are many other compelling rea-sons for not sending children to school. Overall, it thus appears likely thatthe adverse impacts of HIV and AIDS on economic growth or GDP percapita in India will remain limited.
A different approach estimated the welfare impacts of HIV and AIDSas a decline in the utility that can be derived from a consumption streamover the lifetime of an individual. Using this type of model, Crafts andHaacker (2003, 2004) find that the primary impact of HIV and AIDSarises from its impacts on mortality (reducing the expected duration ofthe lifetime consumption stream). For India, Haacker (this volume), usingthis approach, estimates that the annual welfare costs of HIV and AIDSamount to around 3 percent of GDP, much higher than any estimates ofthe impact of HIV and AIDS on GDP.2
However, this approach is also not very well suited to capture the com-plexities and the implications of the impacts of HIV and AIDS at thehousehold level. The most significant household survey regarding theimpacts of HIV and AIDS in India to date is the one by Pradhan and oth-ers (2006, also discussed by Haacker, this volume). Their findings high-light the adverse impacts of HIV and AIDS in particular on householdsin poorer wealth quintiles and on widows affected by HIV and AIDS.More generally (not specific to India), studies using household data finda considerable impact of HIV and AIDS on income, consumption, andchildren’s education. Booysen and Bachmann (2002) find that the declinein per capita income in HIV households in South Africa is 40 percent to50 percent. while the fall in per capita food expenditure is 20 percent to30 percent. In Indonesia, Gertler et al. (2003) find that death of a malein his prime is associated with a 27 percent reduction in mean per capitahousehold consumption. Many studies have reported a negative impactof HIV and AIDS on children’s schooling. Deininger et al. (2003) showthat foster children were at a distinct disadvantage in both primary andsecondary school attendance before introduction of universal primaryeducation. Gertler et al. (2003) find that orphans are less likely to startschool and more likely to drop out. Yamano and Jayne (2005) and Evansand Miguel (2005) find the negative impact of adult mortality on schoolattendance of children to be more severe in poor households.
Finally, we provide some background that motivates our interest inintegrating mental health in the evaluation of the welfare costs of HIV
126 Das, Mukhopadhyay and Ray

and AIDS. Most directly, counselors and doctors working with HIVpatients in India are unanimous in their opinion that the psychologicaland emotional costs on the HIV patients and their families are enormous.The medical science literature has long appreciated this aspect of termi-nal illnesses (see, for example, Emanuel et al. 2000; Grunfeld et al. 2004for some recent work). In social sciences, this is related to an emergingbody of literature on happiness and mental well-being (see, among oth-ers, Easterlin 1974, 2003; Blanchflower and Oswald 2004, 2007; Clarkand Oswald 1997; Frey and Stulzer 2002; Gilbert 2006; Graham 2007;Helliwell 2006; Kahneman et al. 2006; Layard 2005; Lucas et al. 2004;Smith et al. 2005; Ubel et al. 2005). The mental well-being research isproven to be well suited in situations with limited information on welfareeffects of unemployment, divorce, smoking, and so on. This approach canbe used to evaluate effects of HIV and AIDS on significant fear of earlydeath and stigma.While researchers have worked in painstaking details toinvestigate the determinants of happiness and mental well-being (see, forexample, Andres 2004; Blanchflower and Oswald 2004, 2007; Case andDeaton 2006; Helliwell 2006), very little research has been done to quan-tify the value of mental health.3 Given the importance of the psycholog-ical and emotional costs, the HIV experience in India gives us this uniqueopportunity to integrate mental health in welfare evaluation and to quan-tify its significance in welfare loss of the family.
A Survey of Households Affected by HIV and AIDS
In light of the low level of HIV prevalence in the population, oursampling process involves identifying households affected by HIVand AIDS through networks of physicians. The control group of “non-HIV households” is based on interviews of households from similarlocations (villages, residential clusters). This process and other issuesregarding the sampling process are discussed among our considerationsregarding data collection. The presentation of our findings then pro-ceeds in two steps. First, we present data on socioeconomic characteris-tics of individuals and families affected by HIV and AIDS. Second, wediscuss our findings regarding variables included in the survey to serveas indicators of the impact of HIV and AIDS, such as measures of phys-ical health, mental health, or the impact of HIV and AIDS on thehousehold’s labor supply and income. Our discussion is rounded outby a presentation of several case studies of households affected byHIV and AIDS (box 4.1).
Economic Cost of HIV AND AIDS in India 127

128 Das, Mukhopadhyay and Ray
Box 4.1
Case Studies of Financial Impact of HIV and AIDS
Case 1. Both adults HIV-positive (time since detection: 1 month). The sur-
veyed patient is a 28-year-old woman from Jamalpur, U.P., who has been diag-
nosed with HIV a month ago. She had studied up to eighth grade and her husband
up to ninth grade. She is a housewife and is getting herself treated in a free gov-
ernment clinic in Delhi. She spends about three days on the trip to Delhi to get her
medicines. Her husband, who used to own a truck and drive it, was also diagnosed
with HIV a couple of months ago and was probably the source of her infection. He
used to earn about Rs. 15,000 a month, but recently, due to recurring fever,
has been unable to work any more. The patient recently had a stomach surgery at
the cost of Rs. 30,000 in a private hospital. The family has sold their truck for only
Rs. 50,000. Jewelery valued at Rs. 7,000 has been sold out of the stock valued at
Rs. 9000. Their entire personal savings of Rs. 10,000 has been spent, and the patient’s
husband has borrowed Rs. 10,000 from one of his siblings. The couple lives in a
joint family with his parents in their ancestral home. Currently her father-in-law,
with an income of Rs. 4,000–5,000 per month, provides for their living expenses.
The family has cut down on their food, clothing, and entertainment expenses.
Case 2. Both adults HIV-positive (time since detection: 2 months): The pa-
tient is a 37-year-old man in Orissa who owns a tea stall, and three months ago
used to earn Rs. 4,000 per month. He has five years of schooling, while his wife
has four years of schooling. He has been suffering from TB for six months and
was diagnosed with AIDS two months ago. His wife has also been detected with
HIV, but has no symptoms. Her ex-husband died of TB. The patient thinks that he
got infected during tattooing, but he may have contracted the infection from his
wife, who in turn had the virus transmitted from her ex-husband. The family lives
in an ancestral house. They have spent Rs. 12,000 on testing and medicines in
the last three months. Currently, the family income is zero, whereas the medical
bill is Rs. 7,000 per month. The patient firmly believes that with good medicines
he will recover fast and go back to work. The monthly household expenses of Rs.
9,300 are being paid by his brothers. It is not clear how long it is feasible for this
transfer to continue.
Case 3. HIV-positive widow (time since detection: 1 year): The patient is a
40-year-old illiterate widow living in Delhi. She lives with her two sons’ families.
She owns the house she lives in, but her sons pay for her living expenses. The
family income is only Rs. 4,000 per month, and, not surprisingly, the family did
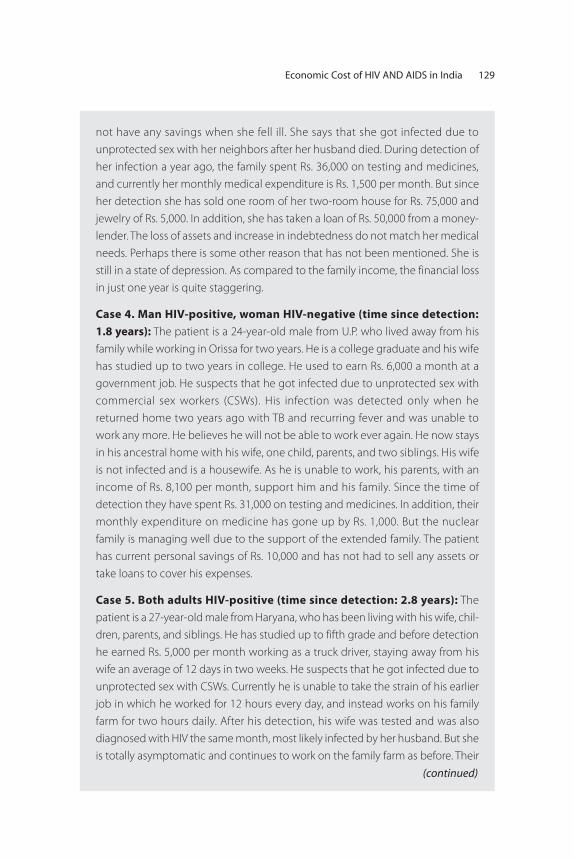
Economic Cost of HIV AND AIDS in India 129
not have any savings when she fell ill. She says that she got infected due to
unprotected sex with her neighbors after her husband died. During detection of
her infection a year ago, the family spent Rs. 36,000 on testing and medicines,
and currently her monthly medical expenditure is Rs. 1,500 per month. But since
her detection she has sold one room of her two-room house for Rs. 75,000 and
jewelry of Rs. 5,000. In addition, she has taken a loan of Rs. 50,000 from a money-
lender. The loss of assets and increase in indebtedness do not match her medical
needs. Perhaps there is some other reason that has not been mentioned. She is
still in a state of depression. As compared to the family income, the financial loss
in just one year is quite staggering.
Case 4. Man HIV-positive, woman HIV-negative (time since detection:
1.8 years): The patient is a 24-year-old male from U.P. who lived away from his
family while working in Orissa for two years. He is a college graduate and his wife
has studied up to two years in college. He used to earn Rs. 6,000 a month at a
government job. He suspects that he got infected due to unprotected sex with
commercial sex workers (CSWs). His infection was detected only when he
returned home two years ago with TB and recurring fever and was unable to
work any more. He believes he will not be able to work ever again. He now stays
in his ancestral home with his wife, one child, parents, and two siblings. His wife
is not infected and is a housewife. As he is unable to work, his parents, with an
income of Rs. 8,100 per month, support him and his family. Since the time of
detection they have spent Rs. 31,000 on testing and medicines. In addition, their
monthly expenditure on medicine has gone up by Rs. 1,000. But the nuclear
family is managing well due to the support of the extended family. The patient
has current personal savings of Rs. 10,000 and has not had to sell any assets or
take loans to cover his expenses.
Case 5. Both adults HIV-positive (time since detection: 2.8 years): The
patient is a 27-year-old male from Haryana, who has been living with his wife, chil-
dren, parents, and siblings. He has studied up to fifth grade and before detection
he earned Rs. 5,000 per month working as a truck driver, staying away from his
wife an average of 12 days in two weeks. He suspects that he got infected due to
unprotected sex with CSWs. Currently he is unable to take the strain of his earlier
job in which he worked for 12 hours every day, and instead works on his family
farm for two hours daily. After his detection, his wife was tested and was also
diagnosed with HIV the same month, most likely infected by her husband. But she
is totally asymptomatic and continues to work on the family farm as before. Their
(continued)

130 Das, Mukhopadhyay and Ray
Box 4.1 (Continued)
family income is Rs. 3,300 per month. Their loss of income due to HIV is Rs. 5,000
per month. He has spent a total of Rs. 3,850 on his medicines and testing. As a
result of low income they have to curtail their monthly expenditure on food and
clothing by Rs. 140, but have increased medical expenditure from nothing to Rs.
600. His father now pays Rs. 1,000 per month. In addition, the family has borrowed
Rs. 50,000 from a moneylender at a monthly interest rate of 2 percent, which they
believe they would be able to pay off in the coming two years. But given that they
are barely surviving with their current income, it is not clear how they will man-
age to do so.
Case 6. Man HIV-positive, woman HIV-negative (time since detection:
5 years): The patient is a 41-year-old male from Orissa who lived away from his
family in Surat working as a factory worker. He was diagnosed with HIV five years
ago. He worked for 12 hours a day, 7 days a week, and made Rs. 3,000 per month.
Both husband and wife have studied up to third grade. Since his detection he
lives with his family in Vishakhapatnam (closer to Orissa than Surat), where he and
his wife sell snacks. His wife is not HIV positive. Earlier his wife did not work. Their
family income is now only Rs. 1,600 per month. In the five years since his detec-
tion, the family has sold Rs. 35,000 worth of jewelery, and spent their entire
personal savings of Rs. 20,000. In addition, they have also borrowed Rs. 40,000
from a moneylender at a monthly interest rate of 2 percent for treatment.
Source: Authors’ study.
Considerations Regarding Data CollectionTo better understand the social and economic impact of HIV and AIDSfor the individuals affected and their households, and—ultimately—toarrive at estimates of the economic cost of HIV and AIDS in India, weneed a data set describing the socioeconomic characteristics of house-holds affected by HIV and AIDS, as well as corresponding data for a con-trol group not affected by HIV and AIDS. In some countries with highprevalence rates of HIV and AIDS (for example, South Africa, with anestimated HIV prevalence of 19 percent of the population ages 15–49),such data are usually obtained by adding questions regarding the HIV sta-tus or the impact of HIV and AIDS to household surveys. The sameapproach does not work well in India, especially for a survey specificallydesigned to capture the impacts of HIV and AIDS, as obtaining responses
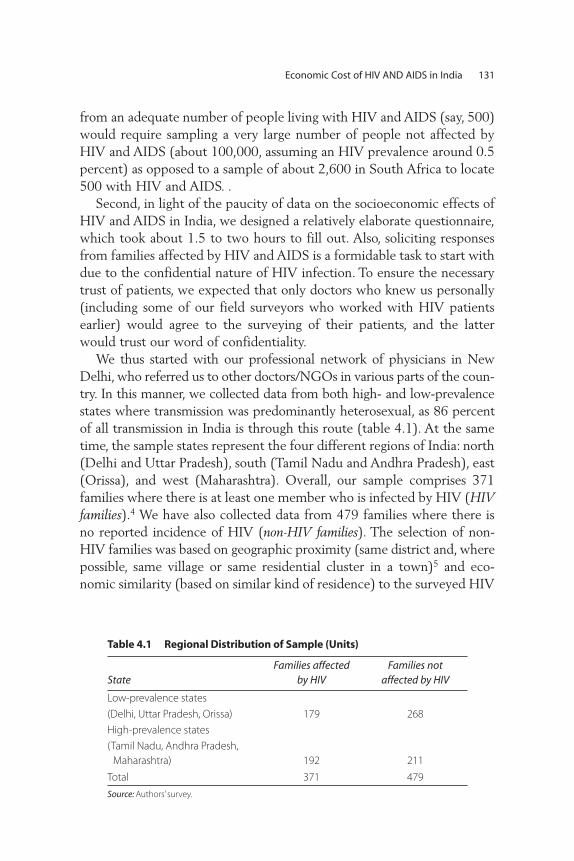
Economic Cost of HIV AND AIDS in India 131
Table 4.1 Regional Distribution of Sample (Units)
StateFamilies affected
by HIVFamilies not
affected by HIV
Low-prevalence states
(Delhi, Uttar Pradesh, Orissa) 179 268
High-prevalence states
(Tamil Nadu, Andhra Pradesh,
Maharashtra) 192 211
Total 371 479
Source: Authors’ survey.
from an adequate number of people living with HIV and AIDS (say, 500)would require sampling a very large number of people not affected byHIV and AIDS (about 100,000, assuming an HIV prevalence around 0.5percent) as opposed to a sample of about 2,600 in South Africa to locate500 with HIV and AIDS. .
Second, in light of the paucity of data on the socioeconomic effects ofHIV and AIDS in India, we designed a relatively elaborate questionnaire,which took about 1.5 to two hours to fill out. Also, soliciting responsesfrom families affected by HIV and AIDS is a formidable task to start withdue to the confidential nature of HIV infection. To ensure the necessarytrust of patients, we expected that only doctors who knew us personally(including some of our field surveyors who worked with HIV patientsearlier) would agree to the surveying of their patients, and the latterwould trust our word of confidentiality.
We thus started with our professional network of physicians in NewDelhi, who referred us to other doctors/NGOs in various parts of the coun-try. In this manner, we collected data from both high- and low-prevalencestates where transmission was predominantly heterosexual, as 86 percentof all transmission in India is through this route (table 4.1). At the sametime, the sample states represent the four different regions of India: north(Delhi and Uttar Pradesh), south (Tamil Nadu and Andhra Pradesh), east(Orissa), and west (Maharashtra). Overall, our sample comprises 371families where there is at least one member who is infected by HIV (HIVfamilies).4 We have also collected data from 479 families where there isno reported incidence of HIV (non-HIV families). The selection of non-HIV families was based on geographic proximity (same district and, wherepossible, same village or same residential cluster in a town)5 and eco-nomic similarity (based on similar kind of residence) to the surveyed HIV
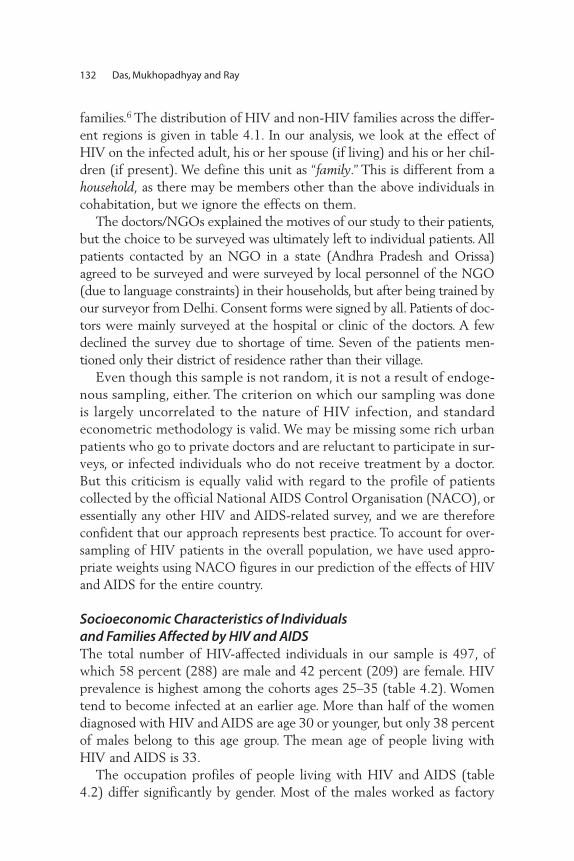
families.6 The distribution of HIV and non-HIV families across the differ-ent regions is given in table 4.1. In our analysis, we look at the effect ofHIV on the infected adult, his or her spouse (if living) and his or her chil-dren (if present). We define this unit as “family.” This is different from ahousehold, as there may be members other than the above individuals incohabitation, but we ignore the effects on them.
The doctors/NGOs explained the motives of our study to their patients,but the choice to be surveyed was ultimately left to individual patients. Allpatients contacted by an NGO in a state (Andhra Pradesh and Orissa)agreed to be surveyed and were surveyed by local personnel of the NGO(due to language constraints) in their households, but after being trained byour surveyor from Delhi. Consent forms were signed by all. Patients of doc-tors were mainly surveyed at the hospital or clinic of the doctors. A fewdeclined the survey due to shortage of time. Seven of the patients men-tioned only their district of residence rather than their village.
Even though this sample is not random, it is not a result of endoge-nous sampling, either. The criterion on which our sampling was doneis largely uncorrelated to the nature of HIV infection, and standardeconometric methodology is valid. We may be missing some rich urbanpatients who go to private doctors and are reluctant to participate in sur-veys, or infected individuals who do not receive treatment by a doctor.But this criticism is equally valid with regard to the profile of patientscollected by the official National AIDS Control Organisation (NACO), oressentially any other HIV and AIDS-related survey, and we are thereforeconfident that our approach represents best practice. To account for over-sampling of HIV patients in the overall population, we have used appro-priate weights using NACO figures in our prediction of the effects of HIVand AIDS for the entire country.
Socioeconomic Characteristics of Individuals and Families Affected by HIV and AIDSThe total number of HIV-affected individuals in our sample is 497, ofwhich 58 percent (288) are male and 42 percent (209) are female. HIVprevalence is highest among the cohorts ages 25–35 (table 4.2). Womentend to become infected at an earlier age. More than half of the womendiagnosed with HIV and AIDS are age 30 or younger, but only 38 percentof males belong to this age group. The mean age of people living withHIV and AIDS is 33.
The occupation profiles of people living with HIV and AIDS (table4.2) differ significantly by gender. Most of the males worked as factory
132 Das, Mukhopadhyay and Ray
workers, or in certain types of services.7 We highlight this here because ofthe increasing concern of HIV being spread among migrant laborers. Mostof the factory workers and auto/bus drivers belong to this group. AmongHIV-affected females in our sample, about 60 percent were housewives,while the next biggest group is agricultural laborers. The high share offemale agricultural laborers may reflect that these are frequently spousesof migrant workers, suggesting one way in which the HIV virus enters therural economy, that is, through migrant workers infecting their spouseswhen they visit home.
The average years of schooling among HIV-infected males is 10.3 years,while the average years of schooling among males in the control group is8.4 years. The corresponding figures for females are 5.46 years and 5.2years, respectively.While the PLWHA (people living with HIV and AIDS)in our sample are not very educated, it is interesting to note that the levelof education among males is higher than that in the control group.
Additionally, our data capture the amount of time passed since a per-son was diagnosed with HIV, varying from less than a month to sevenyears (table 4.3). Consistent with our findings regarding the composi-tion of “ever-married” households (mostly female or female-led, sug-gesting that in many cases of coinfection, males die first), we see that
Economic Cost of HIV AND AIDS in India 133
Table 4.2 Age Distribution and Occupation of HIV-infected Individuals (Percent)
Age range Male FemaleOccupation (before being
diagnosed with HIV) Male Female
Agricultural laborer 4 10
0–5 2 2 Unskilled worker 6 6
6–10 0.7 1 Truck driver 6 0
11–14 0.4 0.4 Auto/taxi/car/bus driver 10 0
15–18 0.8 0.0 Industry and factory worker 26 3
19–24 7 16 Hotel staff 3 0
25–30 27 32 Business owner 3 0
31–35 33 20 Petty shop owner 4 3
36–40 20 11 Housewife 0 60
41–45 11 2 Student 4 2
46–49 3 1 Other services 5 2
50+ 5 2 Unemployed 5 3
TOTAL 100 100 Other occupations 24 10
Total 100 100
Source: Authors’ survey. Data may not add up to 100 due to rounding.

among people living with HIV and AIDS, males are—on average—infected earlier than women.
Table 4.4 shows the various kinds of family structures in our data. Oursample includes “currently married” families where both adults are alive,never-married families (unmarried males or females) and “ever-married”families (widows, widowers, separated, and divorced). The higher propor-tion of ever-married families among HIV families is in most cases a conse-quence of death of an adult due to HIV and AIDS.8 Our data point at theimportant role of coinfection between couples—in 54 percent of the “cur-rently married” families affected by HIV and AIDS, both adults are infectedwith HIV and AIDS, while in 42 percent of them, only the male adult isinfected, and in only 6 percent of cases only the female adult is infected. Aone-member family is “male” or “female,” depending on the gender of theonly adult member. Of the never-married HIV “families” 84 percent aremale, while 76 percent of the ever-married families are female.These cross-sectional data also provide some pointers regarding the dynamics of infec-tion and coinfection between couples, as they are consistent with a patternin which HIV in many cases is acquired first by a male, who then passes thevirus on to his wife.
There are 1,418 children in our sample, of whom 1,189 are less than18 years of age. The average number of such children per HIV family
134 Das, Mukhopadhyay and Ray
Table 4.3 Time since HIV Detection
Age range Total Males Females
Less than or equal to 6 months 30 28 34
7 months – 1 year 17 17 17
1–2 years 17 17 17
2–4 years 26 28 24
4–7 years 10 12 8
Total 100 100 100
Source: Authors’ survey. Data may not add up to 100 due to rounding.
Table 4.4 Distribution of Households by Family Type (Percent)
Family type HIV Non-HIV
Currently married 61 71
Never married 14 22
Ever married 25 7
Total 100 100
Source: Authors’ survey. Data may not add up to 100 due to rounding.

(among families who have children) is 2.16, while the average number ofsuch children per non-HIV family is 2.22. We assume that parents makedecisions for children who are 18 years old or younger, and that childrenolder than 18 are able to make decisions for themselves. For obvious rea-sons, schooling decisions are considered only for children of age 6 andolder. The total number of such children is 892. Among HIV families, theaverage number of such children is 1.9, while the corresponding numberfor non-HIV families is 2.1.
Indicators of the Impact of HIV and AIDSWhile the preceding section focused on indicators of the socioeconomicstructure of families and individuals affected by HIV and AIDS, thepresent section discusses findings regarding variables that capture theimpacts of HIV and AIDS on health, well-being, and the economic sta-tus of those affected.
Physical health status (H). The survey asked a number of questions onthe occurrence of common symptoms of infection (fever, diarrhea, coughand cold, loss of appetite, general body ache, headache), and regardingsome diseases and symptoms that are seen more often in HIV patientsthan non-HIV, such as tuberculosis, oral ulcers, and genital ulcers.The ref-erence period for the above symptoms was the last three months.9
Given the symptoms, we enlisted an expert on HIV and AIDS assess-ment and treatment at a government antiretroviral treatment (ART) clinic,who assigned a numerical index based on the symptoms for all of the HIVand non-HIV respondents.This study uses that index as a measure of mor-bidity. The index ranges from 1 to 11, with 11 being the healthiest and 1being the worst health. Where possible, we also tried to measure heightand weight of individuals to be able to calculate a body mass index (BMI),which is commonly used as a measure of physical health. We also askedHIV patients to recall their normal weight before HIV detection, but inmany cases where we felt the patient was not sure we did not record hisor her weight. Table 4.5 summarizes various health indices by gender andHIV status.
Our data suggest a moderate decline in BMI following detection, anda lower BMI for people living with HIV and AIDS relative to the non-HIV group. However, none of these differences are statistically significantat a 5 percent confidence level. The health index based on morbidity issignificantly lower for HIV individuals as compared to that of non-HIVindividuals (t value of 16.5; significant at 1 percent under the alternative
Economic Cost of HIV AND AIDS in India 135

hypothesis that non-HIV morbidity is higher). In our sample, the morbid-ity of HIV males is significantly higher than that of HIV females, whichmay reflect that usually husbands are infected earlier.
Since our analysis is at the family level, we construct the average healthof a family by taking the mean over the health of existing adults in thefamily. This controls for the different number of adults in families. Thus,as expected, HIV families have lower physical health as compared to non-HIV families.
Mental health (M). Indicators of mental health (IMH) are based on self-reported occurrence of some feelings in a reference period by the respon-dent and spouse (for married respondents). Questions on feelings wereasked using the questions in Case and Deaton (2006).The following state-ments were made and the respondents were asked if in the last 15 days thefeeling captured by each statement occurred “hardly ever, sometimes,most of the time, or never.”
• I felt that I could not stop feeling miserable, even with the help of myfamily and friends.
• I felt depressed.• I felt sad.• I cried a lot.• I did not feel like eating; my appetite was poor.• I felt everything I did was an effort.• My sleep was restless.
136 Das, Mukhopadhyay and Ray
Table 4.5 Health Indices
Age rangeHealth index
(Current)Body mass index:
BHD*Body mass index:
Current
HIV
Male 7.8 (1.8) 20.26 (2.95) 19.04 (3.03)
Female 8.6 (1.9) 21.67 (5.72) 19.76 (3.72)
Average family 8.5 (1.5)
Non-HIV
Male 10.3 (1.1) n.a. 20.78 (3.61)
Female 10.5 (0.9) n.a. 20.90 (4.29)
Average family 10.3 (0.8) n.a.
Source: Authors’ survey.
Note: Standard errors in parentheses.
* Based on a smaller sample.

The ranking of mental health was obtained by assigning a number toeach answer: “never” was given 4 points, “hardly ever” 3 points, “some-times” 2 points, and “most of the time” 1 point. Using these values, weconstructed two indices: The minimum of the points across all questionsanswered by the respondent and, where present, by his or her spouse(denoted IMH1 in table 4.6). This is the Rawlsian “maximin” criterionand is consistent with basic axioms regarding aggregation (Sen 1986). Itdoes not rely on cardinality (as an average would have), and gives equalimportance to all questions. It does, however, assume comparability ofthis ordinal measure across different subjects.To check if this makes a bigdifference, we also consider another index (denoted IMH2 in table 4.6)which is similar in its Rawlsian flavor but uses responses to only onequestion: “I felt depressed.”
Table 4.6 summarizes the distribution, with higher values of the indexindicating a higher level of mental health. It is clear that the distributionof IMH1 as well as IMH2 for non-HIV families always dominates the dis-tribution for HIV families. Thus, non-HIV families are mentally better offwhichever index one considers.
Presence of stigma. What makes HIV different from many other diseasesis the fear of stigma. In our sample, there are a large number of individu-als who have not disclosed their infection to either their household mem-bers or their neighbors or their friends or at their workplace. Table 4.7summarizes the proportion of HIV-positive individuals who have not dis-closed their HIV status. This information is available only for the mainrespondent with HIV of the family. In cases where spouses are HIV pos-itive we do not have the necessary stigma information for each separately.
It is apparent that patients generally avoid telling people outside theirimmediate household about their HIV infection. However, it could be
Economic Cost of HIV AND AIDS in India 137
Table 4.6 Mental Health: Relative Frequency (Percent)
HIV families Non-HIV families
IMH1 IMH2 IMH1 IMH2
“Most of the time” (1) 82.43 57.77 37.74 5.76
“Sometimes” (2) 14.05 28.34 17.82 15.57
“Hardly ever” (3) 3.24 7.36 24.95 23.67
“Never” (4) 0.27 6.54 19.50 55.01
Source: Authors’ survey.

argued that this is merely a personal choice and not because of fear of dis-crimination. In our sample, among those who chose not to tell some ofthe above list of people, 64 percent reported that they did not do sobecause of one of the following reasons:
• They would think I was a person with bad moral values.• They would force me to leave the community.• My family would get a bad name.• They would reject my whole family.
Thus the fear of stigma is not unfounded.
Labor supply. Our data regarding the employment status of people liv-ing with HIV and AIDS illustrate the impact of HIV and AIDS, but alsothe differences in the socioeconomic status of men and women. Table 4.8shows that, for an employed HIV-positive male, the probability ofbecoming unemployed upon the HIV-positive status being detected andthe workplace finding out is 20 percent. While some of that is offset bymales who have gained employment since being diagnosed with HIV, thedata point to a negative impact of HIV and AIDS on employment.Similarly, the sample unemployment rate among males living with HIVand AIDS (13 percent) is much higher than the rate of 5 percent for thisgroup before being diagnosed with HIV (table 4.8). The picture forwomen is different: 21 of the 132 women living in families with HIV andAIDS who were unemployed or housewives before detection subse-quently gained employment. One key factor behind this appears to be theloss of an income earner in the family, as 13 of these 21 women were wid-ows.
Table 4.9 shows a similar picture. As expected, the health status ofnon-HIV males supplying labor outside the household is higher than formales living with HIV and AIDS, as well as for the non-HIV males whodo not supply labor outside of the household. While the causality behindthis correlation may run either way, we note that the gap between those
138 Das, Mukhopadhyay and Ray
Table 4.7 HIV Patients Who Do Not Disclose Their Infection (Percent)
Not disclosed to household members 25
Not disclosed to neighbors 74
Not disclosed to friends 72
Not disclosed at the workplace 85
Source: Authors’ survey.

supplying labor and those who don’t is much higher for people livingwith HIV and AIDS, suggesting that the impaired health status is causingthe withdrawal from the labor market. For women, the health status ofthe group not supplying labor outside the household is somewhathigher than for those supplying labor outside the household, especiallyfor women living with HIV and not supplying labor. This may reflectthat the group not supplying labor is dominated by women fromwealthier households, who withdraw from the labor market voluntarilyand are in a better position to cope with the impact of the epidemic.
The effect of HIV can also be observed in terms of the quality of laborthat is supplied. Table 4.10 highlights the self-reported effects on concen-tration during work and on problem-solving abilities. While in the shortrun these may not affect the wage earnings of the employed, they defi-nitely affect their productivity and hence will affect the economy. Since
Economic Cost of HIV AND AIDS in India 139
Table 4.8 Transition in Employment Status Following HIV Diagnosis (Percent)
Probability of Changing Status to:
Status before HIV diagnosis; Employed Unemployed Housewife
Employed
Males 80 20 0
Females 90 8 2
Unemployed
Males 7 93 0
Females 29 71 0
Housewife
Nonwidow 11 0 89
Widow 35 0 65
Proportion of people living with HIV
and AIDS by different status 74 15 11
Source: Authors’ survey.
Table 4.9 State of Health by HIV Status and Gender (index)
Non-HIV HIV
Male labor supply is positive 10.34 (0.97) 8.09 (1.72)
Male labor supply is zero 10.08 (1.66) 7.02 (2.03)
Female labor supply is positive 10.45 (0.99) 8.53 (1.75)
Female labor supply is zero 10.57 (0.82) 8.72 (2.00)
Source: Authors’ survey.
Note: Standard errors in parentheses. For details on the definition of the health index, see the discussion of the
physical health status and table 4.5 above.

we do not explicitly model the production sector, we are not able to cap-ture this effect here.
Morbidity may also affect the quantity of labor supplied, but there arealso other factors that could play a role. For example, individuals couldchoose to supply labor based on wages; however, a simple correlationbetween wages and labor supply may be misleading if education levelssort individuals into various occupations, and a well-paying job comeswith more certain employment and therefore more days of work.
For working males, we therefore check if the number of days of workin a week depends on the wage per day after controlling for their occu-pation, education, health status, the number of members in the family,and a dummy indicating whether the male is HIV-positive. We find thatonly the occupation dummies are significant (see appendix B, table B.1,for estimation results). This suggests that, conditional on being able towork, individuals cannot choose the number of days of work. This is con-sistent with the common notion of India being a labor-surplus economy.Hence, for the rest of the analysis, we take the labor days of males asexogenous with respect to wages.10
Effects on children. Does HIV in families affect school attendance? Toanswer this question, we measure the proportion of children in the agegroup 6–18 in a family (multiplied by the schooling expenditure on themto adjust for the quality of schooling) attending school. It seems thatwhile both parents are alive, there is no big impact of HIV on schoolattendance. However, it is clear from the data on one-parent families thatthere are significant effects on school attendance when one parent isdead. From table 4.11 below, we can see that financial resources cannotbe one of the reasons. This reflects the long-run adverse impact of HIVon human capital development.
Income, expenditure, and external funding. In order to obtain an impres-sion of the forms the financial impacts of HIV and AIDS on families may
140 Das, Mukhopadhyay and Ray
Table 4.10 Indicators for Impact of HIV and AIDS on Labor Productivity (Percent)
Employed HIV patients who said “concentration/attention in
daily work” had declined after HIV detection
54
HIV patients who said “speed in problem solving and decision
making” had declined after HIV detection
56
Source: Authors’ survey.

take, box 4.1 discusses a few cases in some detail. The first two casesexamine the impacts around the time of an HIV diagnosis; the other fourare spread out over the sample time span since HIV diagnosis. Most of thefamilies covered in box 4.1 experienced a loss in income following theHIV diagnosis, an increase in medical expenditures, and a curtailing innonmedical expenditures. In four of the six cases, the families receivedsupport from relatives. In many cases, the increased financial needs(owing to lower income and higher expenditures) were financed by liqu-idating family assets or borrowing from family or moneylenders.
Table 4.12 summarizes the income and expenditure profiles of fami-lies affected by HIV and AIDS, as well as those of the control group. Inmany cases, it is not possible to “translate” family support, the sale ofassets, or borrowing into monthly financial flows. Our summary tabletherefore captures such flows only indirectly under the heading “dissav-ing/financial support,” in terms of the excess of household expenditureover incomes.11
Per capita incomes of the HIV and non-HIV families are not signifi-cantly different from each other. Families headed by widows have thelowest income. In comparing married families with HIV and familiesheaded by widows, it is interesting to note that while income falls forboth families, per capita consumption does not. The main reason for thisis likely the rather large amounts of net external funding.
Outline of the Model
The measurement of the economic cost of HIV and AIDS for India isbased on a model given in detail in Das, Mukhopadhyay, and Ray (2007).This section sketches out the main arguments of that paper. The unit ofanalysis is the nuclear family, consisting of a man, woman, and their chil-dren. All economic decisions of the family, including the decisions for thechildren, are taken by the adult members. The family maximizes its utility
Economic Cost of HIV AND AIDS in India 141
Table 4.11 HIV and AIDS and Children’s Enrollment
School attendance,ages 6–18 (Percent)
Quality-adjusted attendance
Families affected by HIV and AIDS
Widow 73 71
Widower 75 106
Currently Married 93 152
Source: Authors’ survey.

by allocating consumption expenditure (c), spending on children’s educa-tion, and medical expenditure, with a utility function of the form
u = a logc + b log(1 + M) + g log(1 +SC . Ps) (1)
for families with school-age children, and
u = a logc + b log(1 + M). (2)
for families without school-age children. Expenditure on children’sschooling is defined as the product of per capita schooling expenditureSC and the proportion of school-going children PS.
12 We observe that a
142 Das, Mukhopadhyay and Ray
Table 4.12 Per Capita Inflow and Outflow of Funds (rupees per month)
HIV Non-HIV
Family typeSample average (standard
errors in parentheses) t values*
Currently Married
Income 930 (1,116) 1,109 (1,121) 1.87
Consumption expenditure 760 (721) 690 (764) 1.10
Medical expenditure 190 (276) 69 (186) 5.80
Schooling expenditure 40 (75) 37 (56) 0.51
Dissaving/Financial support 60 (913) –312 (1,039) 4.5
Never Married
Income 2,054 (3,156) 2,171 (2,510) 0.23
Consumption expenditure 2,664 (1,873) 2,123 (1,556) 1.77
Medical expenditure 1,675 (7,069) 237 (578) 1.44
Dissaving/Financial support 2,285 (7,639) 188 (2,594) 1.89
Ever Married (Widows)
Income 541 (1,314) 178 (224) 2.28
Consumption expenditure 753 (831) 419 (285) 2.70
Medical expenditure 159 (272) 29 (41) 3.75
Schooling expenditure 25 (55) 18 (34) 0.65
Dissaving/Financial support 396 (1,134) 288 (439) 0.61
Ever Married (Widowers)
Income 1,375 (2,264) 1,969 (2,033) 0.68
Consumption expenditure 706 (663) 901 (798) 0.59
Medical expenditure 349 (550) 254 (472) 0.43
Schooling expenditure 56 (78) 6 (11) 2.51
Dissaving/Financial support –264 (1,207) –808 (1,351) 0.96
Source: Authors’ survey.
Note: Standard errors in parentheses.
*The t-value relates to the one-sided test with a null hypothesis H0: |Mean
1– Mean
2| = 0 and an alternate hypoth-
esis HA: |Mean
1– Mean
2| > 0. Bold type indicates that H
0is rejected at the 5% level.

significant proportion of families in our sample (48 percent) do not haveany children. We assume that these families do not put any weight onchildren’s education, and hence maximize their utility only with respectto consumption and medical expenditure. Medical expenditure (md)enters the households’ utility function indirectly as it affects the level ofmental health (M), which is determined by
M = d0 + d1. md + d2
. H + d3HIV + l . X. (3)
Specifically, the link between medical expenditure and mental healthmay reflect the positive effect on expected future health for a given levelof current health. Other key factors affecting mental health are the stateof physical health H and whether a household is affected by HIV andAIDS (captured by an HIV dummy), as well as other household charac-teristics captured by the vector X (such as wealth, employment status,age, and gender) used in the recent literature on mental health and sub-jective well-being.13
Estimating the Costs of HIV and AIDS
In all our estimated equations we have pooled the relevant HIV and non-HIV samples. Since we have oversampled the former, we put low weightson those observations and higher weights on the non-HIV observations, soas to be representative of the Indian population (for details see Das et al.).The weights are computed using the overall prevalence data of the IIPS(2007) and the gender composition that is available from the NationalAIDS Control Organisation’s last annual report.
We first estimate the mental health technology for all types of fami-lies for both indices of mental health—minimum mental health based onresponses to all questions (IMH1), and minimum mental health based onthe question “I felt depressed” (IMH2). Note that our mental health dataare in discrete form, whereas the utility function uses a continuousmeasure. We easily obtain a continuous measure from the underlyinglatent variable obtained by estimating the mental health equation byordered probit, which is appropriate for our observed ordered discretemeasure of mental health. This is what we use in our utility function andempirical analysis below.
For both IMH1 and IMH2, better current health leads to better mentalhealth. As hypothesized, controlling for health or HIV status, the higherthe medical expenditure, the higher is mental health.This is an important
Economic Cost of HIV AND AIDS in India 143

result for our model. We also find that HIV infection affects mentalhealth negatively, irrespective of which measure one chooses. For the restof the analysis, we report the results based on the mental health measureIMH1 as it is a comprehensive measure based on all questions asked relat-ing to mental health.
Given the continuous mental health measure, we then estimate theparameters of the optimum conditions of utility maximization separatelyfor families with and without school-age children. In each case we poolHIV and non-HIV families. These estimates pin down our indirect utilityfunctions for the families. Then the impact of the HIV epidemic at thefamily level is calculated by comparing the indirect utility functions ofthe families affected by HIV and AIDS with those of families notaffected. To distinguish among different types of families, we representthe status of a family by the vector (i,j), with i representing the maleadult, and j the female adult. The markers i or j can take the values +, –, 0,or na to indicate whether the respective family member is HIV-positive(+), HIV-negative (–), deceased (0), or not available for unmarried, one-adult families. The position of na is determined by the missing gender inthe family adult vector.
Let V (i, j)(S) denote the indirect utility function when the family HIVstatus is (i,j), as defined above.14 The loss to the country then is:
where m(i, j) stands for the measure of families with HIV status (i, j). Tocalculate the amount that would be required to compensate a family forthe losses associated with HIV and AIDS, we introduce the parameter t todenote the hypothetical transfer that is needed to equate the indirect util-ity of a given type of HIV family with the reference non-HIV family. Inother words, the monetary equivalent of the loss to the family (i,j) is givenby the transfer (t (i,j)) measuring the compensating variation to the family(i, j) and is defined by:
V (i, j)(S|t) = V (–,–)(S|0)–15.
Our findings are summarized in figure 4.1 and table 4.13. First, in termsof the direct impacts of HIV on mental health, we find that most of thereduced mental health can be attributed to impaired physical health(table 4.5) and to the HIV dummy, which may capture the implicationsfor future health as well as some of the economic repercussions discussed
V S V S d i, ji,j
i,j
( ) (
( )
( ) ( ) ( )− − −( )∫ , ) ,⋅ μ
144 Das, Mukhopadhyay and Ray

above. The impact of HIV and AIDS can therefore be summarized as acontraction in the combinations of mental health on one hand, andspending on consumption and schooling on the other hand, which canbe attained by the household, with the shift from A to D in figure 4.1representing this direct impact. As a consequence of this shift, the house-hold, after reallocating its expenditures, may find itself at point B, repre-senting a lower level of utility than before. To return to its previous levelof utility, it would require a transfer corresponding to the distancebetween points B and C (compensating variation).16
Economic Cost of HIV AND AIDS in India 145
Figure 4.1 Estimating the Cost of HIV/AIDS
mental health(M)
AC
B
D
spen
din
g o
n c
on
sum
pti
on
and
sch
oo
ling
Source: Authors’ calculation.
Table 4.13 Losses by Family Types
Utility loss (per family per month):
IMH1 (Rs)
Utility loss (per family per month):
IMH2 (Rs)
Loss from transfers(per family per
month) (Rs)
Currently Married
Only male HIV 85,727 89,631 1,363
Only female HIV 68,502 83,658 574
Both HIV 91,663 101,266 1,327
Ever Married
Widow HIV 94,394 106,063 2,214
Widower HIV 78,764 61,808 901
Never Married
Males 86,324 61,039 2,084
Females 87,148 99,655 2,134
Source: Authors’ estimates.

Table 4.13 reports the money equivalent of welfare losses in the firsttwo columns for both measures of mental health, in terms of the compen-sating variation illustrated in figure 4.1. We use a married non-HIV familyas the reference group because being a widow, a widower, or unmarriedcan be a consequence of HIV infection. The losses for each category areweighed by the sample proportions of families with children and withoutchildren to calculate the current loss to each kind of family.
Table 4.13 shows that in the case of “currently married” families, the loss(using either measure), as expected, is greatest when both members areHIV positive.The highest loss among all family types occurs for widows liv-ing with HIV and AIDS or widow-led families. For this group, the adverseimpacts of HIV and AIDS are exacerbated by a drop in family income.
In the last column of table 4.13, we report the losses associated withdissaving for each type of family (again with married non-HIV families asthe reference group). These are positive because of lower savings orbecause of increases in money transfers from relatives. We treat these aslosses as they represent reductions in the material wealth of the respectivehouseholds due to loss of labor income and increased medical expendi-ture. These losses are the highest for the unmarried families and widows.
In order to obtain estimates of the costs of HIV and AIDS for all of India,we need to “scale up” our family-level estimates. However, we only haveestimates of the total number of males and females living with HIV andAIDS in India, but no breakdown across the different types of “HIV” fami-lies listed above.We therefore use our estimates to impute the loss for malesand females in our sample, and then impute estimates for India, assumingthat the distribution of various family types is the same as in our data. Tothis end, we first compute the loss to each family (depending on its type).For married couples with one infected member, widow, widowers, andunmarried individuals, we ascribe the whole loss to the infected member.For married couples where both members are infected, we split the lossequally between both members. We then add up all the losses for our sam-ple, and derive the loss per male and per female. We then scale these up inproportion to the number of HIV-positive males and females in India.
The total loss (using IMH1) per month is Rs. 67,601 for a male livingwith HIV and AIDS and Rs. 65,120 for a female (the respective figuresusing IMH2 are Rs. 76,986 for males and Rs. 84,272 for females). Basedon a total number of 1.55 million males and 950,000 females living withHIV and AIDS in India,17 this implies that the loss to the male popula-tion living with HIV and AIDS in India (using IMH1) is Rs. 104.78 billionper month, and that for the female population is Rs. 61.86 billion per
146 Das, Mukhopadhyay and Ray

month, adding up to a total of Rs. 166.64 billion per month. The totalannual cost of HIV and AIDS per year, with 0.36 percent of the popula-tion affected, comes out at Rs. 1,999.8 billion (7 percent of GDP), whichis more than the annual health expenditure of Rs. 1,356 billion (2004) forall ailments in India!
One obvious point of comparison for our findings is the literature esti-mating the costs of increased mortality. Haacker (this volume) summa-rizes this literature, and estimates these costs at about 3 percent of GDPfor India (based on the most recent data on HIV prevalence), a similarorder of magnitude (though somewhat lower) as our estimates. While itmay be tempting, on the face of it, to add up these estimates of theimpacts of increased mortality and our findings of the costs of HIV andAIDS based on mental health, the two approaches overlap more thanit appears at first sight. First, mortality-based estimates such as the onesdiscussed and applied by Haacker are based on valuations of mortalityrisks implied by data on wages and professional mortality risks. However,these underlying estimates do not generally separate the adverse effects ofthe possibility of premature death and the expectation of a period of sick-ness; the estimated impacts of the welfare effects of increased mortalitytherefore also capture an increased expectation of sickness. Second, ourestimates of mental health likely also capture the expectation of a pre-mature death. Against this background, the fact that the two differentapproaches return broadly similar estimates of the costs of HIV andAIDS is encouraging.18
Concluding Remarks
Using primary household data, we estimate household utility functionparameters that measure the relative importance of consumption, school-ing of children, and mental and physical health effects of HIV and AIDSin India. Since mental health is not directly observable, we first computean ordinal measure based on a series of questions following Case andDeaton (2006). Then we use an ordered probit model to obtain a contin-uous measure, which is then used to estimate the parameters of the fam-ily utility function.The welfare loss due to HIV is then obtained using theprinciple of willingness to pay to come up to the utility level of non-HIVmarried families, used as the benchmark.
We find that mental health effects are far more important than the effectof consumption or children’s schooling in determining utility and the totalwelfare loss per month.The total annual loss for the entire country exceeds
Economic Cost of HIV AND AIDS in India 147

India’s annual health expenditure in 2004 and is 7 percent of GDP. Thishuge magnitude is not surprising as it includes private valuation of one’sown life, as well as the loss from stigma. The additional loss due to lossof labor income and increased medical expenditure measured by theexternal transfers account for 5 percent of the country’s health expendi-ture and 0.23 percent of GDP. Given that the HIV incidence rate is only0.36 percent in India, these losses are quite staggering. Further, theselosses are an underestimate since they do not take into account the long-term fall of transfers from relatives, borrowing, and sale of assets, andbecause we do not have any orphaned children in our sample.
148 Das, Mukhopadhyay and Ray
Annex 4.1 Summary Statistics
Mean Std Dev.
Per capita monthly consumption (c ) 1,019 1,189
Education (PS. SC) 70 170
Medical expenditure (md) 591 2,748
Family size (N) 2.9 1.38
Average physical health of family (H) 8.5 1.44
Maximum time span (ts) 2.07 1.71
Square of max time span (ts2) 7.23 9.5
Wealth (W) 18,634 50,168
Age of child 11.6 3.5
Square of age of child 136 82
Average years of schooling of family
members (E ) 5.72 3.9
Number of children in family 3.04 1.42
Health of male member (Hm
) 9.35 1.87
Age of male member (Am
) 29 14
Education of male member (Em
) 8.4 4.5
Number of school-age children (ns) 1.04 1.24
Number of children under 6 years (np) 0.34 0.63
Education of female member (Ef) 5.2 4.5
Family resides in north India (DNORTH
) 0.52 0.49
Family has female adult member (DFEM
) 0.80 0.39
Patient lives in a joint family (DJOINT
) 0.63 0.48
Family has at least one unemployed adult
(DUNEMP
) 0.12 0.32
Average age of adult members (Av_age) 32.4 8.7
Square of average age of adult members
(Av_age2) 1125 659
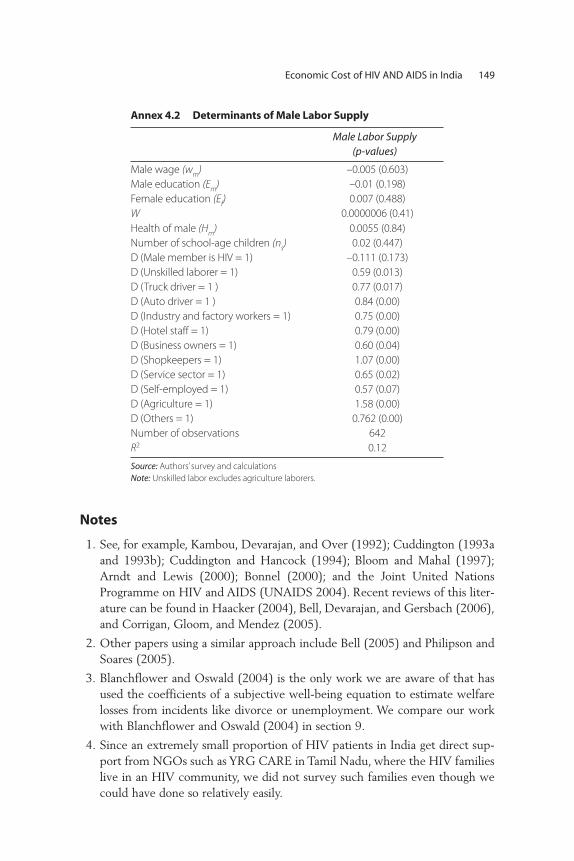
Notes
1. See, for example, Kambou, Devarajan, and Over (1992); Cuddington (1993aand 1993b); Cuddington and Hancock (1994); Bloom and Mahal (1997);Arndt and Lewis (2000); Bonnel (2000); and the Joint United NationsProgramme on HIV and AIDS (UNAIDS 2004). Recent reviews of this liter-ature can be found in Haacker (2004), Bell, Devarajan, and Gersbach (2006),and Corrigan, Gloom, and Mendez (2005).
2. Other papers using a similar approach include Bell (2005) and Philipson andSoares (2005).
3. Blanchflower and Oswald (2004) is the only work we are aware of that hasused the coefficients of a subjective well-being equation to estimate welfarelosses from incidents like divorce or unemployment. We compare our workwith Blanchflower and Oswald (2004) in section 9.
4. Since an extremely small proportion of HIV patients in India get direct sup-port from NGOs such as YRG CARE in Tamil Nadu, where the HIV familieslive in an HIV community, we did not survey such families even though wecould have done so relatively easily.
Economic Cost of HIV AND AIDS in India 149
Annex 4.2 Determinants of Male Labor Supply
Male Labor Supply (p-values)
Male wage (wm
) –0.005 (0.603)
Male education (Em
) –0.01 (0.198)
Female education (Ef) 0.007 (0.488)
W 0.0000006 (0.41)
Health of male (Hm
) 0.0055 (0.84)
Number of school-age children (ns) 0.02 (0.447)
D (Male member is HIV = 1) –0.111 (0.173)
D (Unskilled laborer = 1) 0.59 (0.013)
D (Truck driver = 1 ) 0.77 (0.017)
D (Auto driver = 1 ) 0.84 (0.00)
D (Industry and factory workers = 1) 0.75 (0.00)
D (Hotel staff = 1) 0.79 (0.00)
D (Business owners = 1) 0.60 (0.04)
D (Shopkeepers = 1) 1.07 (0.00)
D (Service sector = 1) 0.65 (0.02)
D (Self-employed = 1) 0.57 (0.07)
D (Agriculture = 1) 1.58 (0.00)
D (Others = 1) 0.762 (0.00)
Number of observations
R2
642
0.12
Source: Authors’ survey and calculations
Note: Unskilled labor excludes agriculture laborers.

5. In Delhi and Maharashtra, HIV patients were surveyed in the hospitals. Wehave home addresses of all these patients except seven for whom we haveonly the district. Hence in most cases it was feasible to sample non-HIV fam-ilies from the same neighborhoods. In a few exceptions, the non-HIV familieswere sampled from neighborhoods with similar wealth levels in the same dis-tricts as the patients.
6. Since the data have not been collected to calculate prevalence, the propor-tions of HIV to non-HIV families should not be used to deduce prevalence.
7. We do not report current occupation data here as that is endogenous. Whilewe do not use recall data for most of our analysis as it is unreliable, it isunlikely that the occupation before HIV detection will be misreported.Hence we use this part of the recall data.
8. While in many cases widows do not list AIDS as the reason for death of theirspouse, they mention diseases like TB, which make it likely that the spousedid suffer from HIV but it was not detected.
9. We are aware that health experts are in favor of much shorter referenceperiods, for example last 15 days. We extended the period to pick up thefact that PLWHA do, on the average, have higher morbidity but go throughperiods of “normal” health and so we wanted a long enough period to pickup this difference.
10. It appears unreasonable to assume that in mainstream Indian society, notworking is a choice for males, and only 6 percent of males not infected withHIV (who are less health constrained than those living with HIV and AIDS)do not work. Female labor supply is ignored because, as seen in table 4.2, 65percent of them did not work before HIV detection in the family, and after itonly a few do so.
11. Apart from labor income, in some cases, there are rental incomes, which weadd to calculate total income of a family.
12. Proportion seems to be the right weight rather than the total number.Multiplying with the total number has the undesirable property that it givesundue advantage to having more children. We focus on the quality of a rep-resentative child.
13. While medical expenditures can be considered to improve health, poor healthtriggers higher medical expenditures. Consequently, medical expenditure andcurrent health are negatively correlated in our sample. With our data set, weare not able to disentangle these two effects and therefore treat the currentstate of health as predetermined.
14. Here S stands for all the exogenous variables in the model: S = (Y, H, N, ns,W, ts, DHIV, DFEM, DJOINT, Av_age).
15. We do not differentiate between the equivalent variation (an income lossequivalent to the welfare loss associated with the impacts of HIV and AIDS
150 Das, Mukhopadhyay and Ray

on economic status, physical health, and mental health) and the compensat-ing variation (a transfer that would return the household to the same utilitylevel as it enjoyed before the onset of HIV and AIDS, because the log-linearstructure of the utility function, coupled with the linear mental health speci-fication, mean that these two measures coincide.
16. Differences in the composition of households would change the shape of theindifference curves in figure 4.1. As we find that such changes have a minorimpact on our findings, figure 4.1, for illustrative purposes, abstracts fromthis effect.
17. This assumption is in line with the latest estimates of the total number of peo-ple living with HIV and AIDS in India (2.5 million), while assuming the samebreakdown by sex as NACO.
18. Another reference point is the literature attempting to quantify subjectivewell-being. For example, Blanchflower and Oswald (2004) estimate large fig-ures for welfare loss associated with adverse events. For example, they esti-mate that a typical individual in the United States or Britain would needUS$100,000 per annum to compensate for the loss in well-being resultingfrom divorce. The corresponding figure for job loss for an average male isUS$60,000 per annum.
References
Arndt, C., and J.D. Lewis. 2000. “The Macro Implications of HIV/AIDS in SouthAfrica: A Preliminary Assessment.” South African Journal of Economics 68 (5):856–87.
Andres, A.R. 2004. “Determinants of Self-reported Mental Health Using theBritish Household Panel Survey.” Journal of Mental Health Policy andEconomics 7(3): 99–106.
Bell, C. 2005. “Estimating the Costs of Sickness and Premature Adult Mortality.”Mimeo, South Asia Institute, University of Heidelberg, Heidelberg, Germany.
Bell, C., S. Devarajan, and H. Gersbach. 2004. “Thinking about the Long-RunEconomic Costs of AIDS.” In The Macroeconomics of HIV/AIDS, ed. MarkusHaacker, 96–133 Washington, DC: International Monetary Fund.
Bell, C., S. Devarajan, and H. Gersbach. 2003. “The Long-run Economic Costs ofAIDS: Theory and an Application to South Africa.” Policy Research WorkingPaper No. 3152, World Bank, Washington, DC.
Blanchflower, D.G., and A.J. Oswald. 2004. “Well-being over Time in Britain andthe USA.” Journal of Public Economics 88 (7-8): 1359–86.
Blanchflower, D.G., and A.J. Oswald. 2007. “Is Well-being U-shaped over the LifeCycle?” Working Paper No. 12935, National Bureau of Economic Research,Cambridge, MA.
Economic Cost of HIV AND AIDS in India 151

Bloom, D.E., and A.S. Mahal. 1997. “Does the AIDS Epidemic ThreatenEconomic Growth?” Journal of Econometrics 77 (1): 105–24.
Bonnel, R. 2000. “HIV/AIDS and Economic Growth:A Global Perspective.” SouthAfrican Journal of Economics 68 (5): 820–55.
Booysen, F. le R., and M. Bachmann. 2002. “HIV/AIDS, Poverty and Growth:Evidence from a Household Impact Study Conducted in the Free StateProvince, South Africa.” Paper presented at the annual conference of theCentre for the Study of African Economies, Oxford, March 18–19.
Case, A., and A. Deaton. 2006. “Health and Well-Being in Udaipur and SouthAfrica.” Working paper, Princeton University, Princeton, N.J.
Clark,A., and A. Oswald. 1997. “Happiness and Economic Performance.” EconomicJournal 107 (445): 1815–31.
Corrigan, P., G. Glomm, and F. Mendez. 2005. “AIDS Crisis and Growth.” Journalof Development Economics 77 (1): 107–24.
Corrigan, P., G. Glomm, and F. Mendez. 2004. “AIDS, Human Capital andGrowth.” Mimeo, Working Paper Series, Social Science Research Network.
Crafts, N., and M. Haacker. 2004. “Welfare Implications of HIV/AIDS.” In TheMacroeconomics of HIV/AIDS, ed. Markus Haacker, 182–97 Washington, DC:International Monetary Fund.
Cuddington, J.T. 1993a. “Modeling the Macroeconomic Effects of AIDS with anApplication to Tanzania.” World Bank Economic Review 7 (2): 173–89.
Cuddington, J.T. 1993b. “Further Results on the Macroeconomic Effects of AIDS:The Dualistic Labor-Surplus Economy.” World Bank Economic Review 7 (3):403–17.
Cuddington, J.T., and J.D. Hancock. 1994. “Assessing the Impact of AIDS on theGrowth Path of the Malawian Economy.” Journal of Developing Economics 43(2): 363–68.
Das, Sanghamitra, Abhiroop Mukhopadhyay, and Tridip Ray. 2007. “NegativeReality of the HIV Positives: Integrating Mental Health in Welfare Evaluation.”processed (Delhi: Indian Statistical Institute). Working paper, unpublished,Indian Statistical Institute, Delhi, India.
Deininger, K., M. Garcia, and K. Subbarao. 2003. “AIDS-Induced Orphanhood asa Systemic Shock: Magnitude, Impact and Program Interventions in Africa.”World Development 1201–20.
Easterlin, R. 1974. “Does Economic Growth Improve the Human Lot? SomeEmpirical Evidence.” In Nations and Households in Economic Growth, ed.P. David and M. Reder, 89–125. New York: Academic Press.
Easterlin, R. 2003. “Explaining Happiness.” Proceedings of the National Academy ofSciences 100 (19): 11176–83.
152 Das, Mukhopadhyay and Ray

Emanuel, E.J., D.L. Fairclough, J. Slutsman, and L.L. Emanuel. 2000. “UnderstandingEconomic and other Burdens of Terminal Illness: The Experience of Patientsand their Caregivers.” Annals of Internal Medicine 132 (6): 451–59.
Evans, D., and E. Miguel. 2005. “Orphans and Schooling in Africa: A LongitudinalAnalysis.” Working Paper No. C05–143, Centre for International andDevelopment Economics Research, University of California, Berkeley, CA.
Ferreira, C.P., and S. Pessoa. 2003. “The Long-Run Impact of AIDS.” Mimeo,Graduate School of Economics, Fundacao Getulio Vargas, Rio de Janeiro, Brazil.
Frey, B.S., and A. Stulzer. 2002. Happiness and Economics. Princeton, N.J.:Princeton University Press.
Gertler, P., S. Martinez, D. Levine, and S. Bertozzi. 2003. “Losing the Presenceand Presents of Parents: How Parental Death Affects Children.” Unpublishedworking paper. Gilbert, D. 2006. Stumbling on Happiness. New York: AlfredA Knopf.
Graham, C. 2008. “The Economics of Happiness.” In The New Palgrave Dictionaryof Economics, 2nd ed., ed. S. Durlauf and L. Blume.
Grunfeld, E., D. Coyle, T. Whelan, J. Clinch, L. Reyno, C.C. Earle, A. Willan,R. Viola, M. Coristine, T. Janz, and R. Glossop. 2004. “Family CaregiverBurden: Results of a Longitudinal Study of Breast Cancer Patients andtheir Principal Caregivers.” Canadian Medical Association Journal 170(12): 1795–1801.
Helliwell, J.F. 2006. “Well-being, Social Capital and Public Policy: What’s New?”Economic Journal 116 (510): C34–C45.
International Institute for Population Sciences (IIPS). 2007. “2005–2006 NationalFamily Health Survey (NFHS-3)—National Fact Sheet India (ProvisionalData).” IIPS, Deonar, Mumbai, India.
Kahneman, D., A.B. Krueger, D. Schkade, N. Schwarz, and A.A. Stone. 2006.“Would You be Happier if You were Richer? A Focusing illusion.” Science 312(5782): 1908–10.
Kambou, G., S. Devarajan, and M. Over. 1992. “The Economic Impact of AIDS inan African Country: Simulations with a General Equilibrium Model forCameroon.” Journal of African Economies: 1 (1): 109–30.
Layard, R. 2005. Happiness: Lessons from a New Science. London: Allen Lane.
Lucas, R.E., A.E. Clark, Y. Georgellis, and E. Diener. 2004. “Unemployment Altersthe Set Point for Life Satisfaction.” Psychological Science 15 (1): 8–13.
McDonald, S., and J. Roberts. 2006. “AIDS and Economic Growth: A HumanCapital Approach.” Journal of Development Economics 80 (1): 228–50.
National AIDS Control Organisation (NACO). Various years. Annual Reports.New Delhi: NACO. http://www.nacoonline.org/
Economic Cost of HIV AND AIDS in India 153

Pradhan, Basanta K., Ramamani Sundar, and Shalabh K. Singh. 2006. Socio-Economic Impact of HIV and AIDS in India. New Delhi, India: United NationsDevelopment Programme.
Sen, A. 1986. “Social Choice Theory.” Handbook of Mathematical Economics. 2nded., vol. 3, ed. K.J. Arrow and M.D. Intriligator, 1073–181. North Holland:Elsevier.
Smith, D.M., M. Langa, M.U. Kabeto, and P.A. Ubel. 2005. “Health, Wealth andHappiness.” Psychological Science 16 (9): 663–66.
Ubel, P.A., G. Loewenstein, and C. Jepson. 2005. “Disability and Sunshine: CanHedonic Predictions be Improved by Drawing Attention to Focusing Illusionsor Emotional Adaptation?” Journal of Experimental Psychology 11 (2): 111–23.
Yamano, T., and T.S. Jayne. 2005. “Working-Age Adult Mortality and PrimarySchool Attendance in Rural Kenya.” Economic Development and CulturalChange 53 (3): 619–53.
Young, A. 2005. “The Gift of the Dying: The Tragedy of Aids and the Welfare ofFuture African Generations.” Quarterly Journal of Economics 120 (2): 423–66.
154 Das, Mukhopadhyay and Ray