Embed Size (px)
Citation preview

1
The economic case for investing in the UK defence industry
Final Report
August 2009
Oxford Economics 121, St Aldates, Oxford, OX1 1HB
℡: 01865 268900, �: 01865 268904 �: www.oxfordeconomics.com
www.geoeconomics.com

2
Economic case for investing in the UK defence industry
Contents
1. Executive summary.................................. .................................................................................... 3
2. Introduction....................................... ............................................................................................ 5
2.1. Establishing an economic case ............................................................................................. 5 2.2. Defining the UK defence industry .......................................................................................... 6 2.3. Report structure ..................................................................................................................... 8
3. The UK defence industry in 2006.................... ............................................................................ 9
3.1. Trends.................................................................................................................................... 9 3.2. The defence sector as a part of the UK economy ............................................................... 12 3.3. An indication of future prospects ......................................................................................... 13
4. Monetary impact .................................... ..................................................................................... 14
4.1. The channels of economic impact ....................................................................................... 14 4.2. Gross output impact............................................................................................................. 14 4.3. Returns to the Exchequer .................................................................................................... 16 4.4. Summary.............................................................................................................................. 18
5. Labour market impact ............................... ................................................................................. 21
5.1. Jobs supported .................................................................................................................... 21 5.2. Skill levels ............................................................................................................................ 22 5.3. Summary.............................................................................................................................. 23
6. Potential losses ................................... ....................................................................................... 26
6.1. Capital intensity ................................................................................................................... 26 6.2. Summary.............................................................................................................................. 27
7. A rapid return?.................................... ........................................................................................ 30
7.1. Capacity ............................................................................................................................... 30
8. Long-term benefits ................................. .................................................................................... 32
8.1. Export intensity .................................................................................................................... 32 8.2. R&D intensity ....................................................................................................................... 33 8.3. Summary.............................................................................................................................. 35
9. The regional distribution of the defence sector.... .................................................................. 37
10. Conclusion ......................................... ......................................................................................... 45

3
Economic case for investing in the UK defence industry
1. Executive summary
The defence industry is a major part of the UK econ omy…
• In 2006 defence industry turnover, captured in the SIC codes associated with the manufacture of defence goods, amounted to £22 billion, larger than the UK’s air transport, pharmaceuticals and steel industries, directly employing 160,000 people, throughout the UK’s aerospace, shipbuilding, motor vehicle, weapons manufacture, electrical components and machine tools sectors.
• UK Government spending accounts for three-quarters of defence orders, with Government defence procurement supporting 135,000 jobs.
… with significant linkages to the rest of the econom y and above average tax contributions…
• A £100 million investment in the defence industry generates an increase in gross output of £227 million, and increases Exchequer revenues by £11.5 million. This means the industry has an output multiplier of 2.3, ranking it above the median of the sectors considered. This reflects both a strong UK based supply chain and a relatively high wage level paid to workers
• The additional tax contributions that would be made by the UK defence industry to the Exchequer, as a result of a notional increase in demand, are also comfortably above average for the economy as a whole.
… strong job creation characteristics …
• For every job created in the defence industry, 1.6 jobs are created elsewhere in the economy. A £100 million investment in the defence industry will create 1,885 jobs throughout the UK economy, 726 of which will be in the defence industry.
• The number of jobs across the entire economy created by a £100 million investment in the defence sector is the 12th largest when compared to 26 other sectors examined by this study.
• However, this result should also be viewed within the context of the types of skills the industry helps to promote. The defence industry itself has a highly-skilled workforce , with 39 percent of workers holding a NVQ level 4 equivalent qualification or higher; a similar level to the UK’s banking and finance, telecommunications, and insurance and pensions sectors, ranking the defence sector 8th in the economy.
• 71 percent direct and indirect employment gains from the procurement of defence equipment are located in these six ‘lagging’ regions.
… high levels of investment…
• The UK defence industry has a capital intensity of 36 percent, higher than the motor vehicle and steel industries, and the economy as a whole.
• Against 26 other sectors, representing the rest of the UK economy, the defence sector ranks 13th in terms of capital intensity.

4
Economic case for investing in the UK defence industry
…capacity to expand…
• According to both the CBI and EUROSTAT surveys on industrial trends the defence industry in the UK is currently running below capacity.
• Due to the irregular nature of its demand, the defence sector is accustomed to increasing production rapidly in order to meet client procurement targets.
• This study found that of the eleven sectors for which capacity data were available, the defence sector ranked 3rd.
…and the ability to bring future benefits to the UK economy
• The UK defence industry has a large research and development programme. In 2007, the industry spent 4 percent of its turnover on R&D (and this figure was over 8 percent in the previous two years).
• Evidence suggests that R&D output from the defence sector creates substantial spillover benefits, external to the private benefits received by the patent holders.
• Exports equate to 22 percent of defence turnover in the UK, more than banking and finance, and computers and software. Several defence products are currently being developed by UK companies which have a high export potential
• When compared to other sectors in the economy, the defence industry is the 13th largest exporter in relative terms.
Overall, the defence sector provides a substantial range of benefits to the UK economy and is well positioned to promote balanced growth
• Our analysis has found that relative to other sectors of the economy, the defence sector provides a strong balance of benefits accruing from a notional £100 million investment.
• Although the defence industry does not rank first in any of the measures studied, it performs significantly well in each category, giving it the third highest average ranking out of the 27 sectors studied.
• However, once capacity is taken into account, the defence sector moves into first place, owing to its ability to increase production in response to any investment, allowing benefits to be enjoyed in the immediate, medium and long terms.
• These results for defence should be placed in the context of the broader economy. While immediate impacts are necessary to help the economy exit recession, any investment must also take into account its possible longer term impacts , through its support of R&D and industries with export potential. To be effective an investment needs to be aimed at industries that can absorb an increase in demand.

5
Economic case for investing in the UK defence industry
2. Introduction This report was commissioned by the Defence Industries Council to investigate the economic case for increasing investment in the UK defence sector as a means of stimulating the UK economy. This report has been prepared by Oxford Economics.
The main purpose of the UK Defence Industry is to support the UK’s policy in terms of its role in the world. However, within this context the question always arises as to how much it contributes to National Wealth and ‘at the margin’ how much to invest. It is not in this reports remit to consider the “right level” of expenditure to support the need of the nation and its appropriate allies, but rather to assess whether increased investment in defence would be positive (and more so than investment in other sectors) for the economy in the current economic climate. The UK entered recession in the last quarter of 2008, with GDP expected to fall by 4.7 percent with around 1 million jobs lost in 2009 according to Oxford Economics’ July 2009 forecasts. Although GDP is expected to recover modestly in 2010 and employment in 2011, there is uncertainty about the speed of the recovery. Throughout the world Governments have taken many measures to reduce the impact of the recession, ranging from reducing interest rates and indirect taxes, with the intension of stimulating private demand, to providing bail outs directly to industries. An additional method of stimulating the economy which is being considered is to increase, or bring forward, Government consumption. The United States has been pursuing a significant investment in public works as a way of increasing employment and demand in the construction sector, with the notion that once additional jobs are created these workers will stimulate the economy further through the spending of their wages. This study considers the economic rationale for increasing (or bringing forward) UK Government procurement from the UK defence industry as a method of stimulating the UK economy.
2.1. Establishing an economic case
The approach adopted in this study is to consider the relative economic benefits arising from an increase in investment in different parts of the economy. We present a series of measures, including:
• GDP impact. The effect of a one-off increase in Government investment in a sector on the whole economy; this metric is generated through the comparison of output multipliers, which capture the indirect (supply chain) and induced (consumers spending their wages) effects, in different sectors of the economy.
• Returns to the Exchequer. The direct impact of the increase in Government investment on taxation revenues, through Income Tax, National Insurance contributions, and Corporation Tax.
• Number of jobs supported/created. The number of jobs that will be supported or created as a result of the increase in Government investment.
• Number of high-skilled jobs supported/created. The percentage of each sector’s workforce who are measured as NVQ level 4 equivalent and above.
• Research and Development (R&D) intensity. Measured as R&D spending as a percentage of turnover; this metric captures the longer term benefit from Government support, as returns to R&D often take many years to materialise.
• Export intensity. Sectors that are export intensive may bring long-term benefits to the UK economy as the products they develop now can provide a future income stream as they are sold abroad.

6
Economic case for investing in the UK defence industry
• Capital intensity. The net capital stock of a sector as a percentage of turnover; this provides an indication of the capital losses that might be incurred if the sector was to suffer irreversible damage during the current recession.
• Capacity. This captures sectors that are operating below capacity, and would, therefore, be able to deliver a timely return for the Government’s investment.
To effectively present an economic case for increasing Government investment in the UK defence industry it is necessary to not only calculate the above metrics for the defence sector, but also to provide sector comparisons. The comparison sectors have been chosen to cover the majority of the UK’s manufacturing and service industries, and have been defined using Office for National Statistics’ Standard Industrial Classifications.
2.2. Defining the UK defence industry
The sectors referred to throughout this report are defined at the two-digit Standard Industrial Classification (SIC) level, however, the defence industry in the UK is spread across numerous sectors as defined by two-digit SIC, with no direct defence data available. To quantify the impact of the defence industry this study has defined the sector according to 2006/07 expenditure levels by the Ministry of Defence within UK manufacturing.
Table 2-1 presents Ministry of Defence’s UK expenditure in 2006/07 by industry. The definition of the defence industry used in this study is formulated by considering the relative importance of the manufacturing sectors highlighted in Table 2-1 to MoD procurement (i.e. our definition for defence is a weighted combination of aerospace, weapons manufacturing, ship building etc with the weights given by MoD procurement in 2006/07).

7
Economic case for investing in the UK defence industry
Table 2-1 Ministry of Defence UK expenditure by sec tor 2006/07 Share Weighting
SIC Sector £million % % Total Ministry of Defence UK Expenditure 16,490 100% A, B, C Agriculture, Fishing and Mining - 0% D Manufacturing, excluding those industries itemised below 1,640 10%
29.6 Weapons & Ammunition 1,080 7% 17% 30 Data Processing Equipment 50 0% 1% 31 Other Electrical Engineering 200 1% 3% 32 Electronics 1,000 6% 16% 33 Precision Instruments 600 4% 9%
34, 35.2, 35.4, 35.5 Motor Vehicles & Parts 300 2% 5% 35.1 Shipbuilding & Repairing 1,150 7% 18% 35.3 Aircraft & Spacecraft 1,960 12% 31%
Subset total 6,340 38% 100% E Electricity, Gas & Water 280 2% F Construction 1,380 8% G Wholesale, Retail & Repair of Motor Vehicles 230 1%
55 Hotels & Restaurants 230 1% 60.1 Transport via railways 70 0%
60.2,60.3 Other Land Transport (incl. via pipelines) 20 0% 61,62,63 Water, Air and Auxiliary/freight supply transportation 450 3%
64 Post & Courier Services 10 0% 64.2 Telecommunications 330 2%
J, K, L, M, N, O, P
Financial Services, Business Activities, Education, Health, & Other Service Activities excluding those industries itemised below 3,4 2,880 17%
70, 71 Real Estate & Renting 1,500 9% 72 Computer Services 1,110 7%
Source: Oxford Economics/DASA
As Table 2-1 shows, there are other sectors where the Ministry of Defence expenditure is large, and which are not included in Oxford Economics’ definition of defence; the most notable are construction and real estate and renting. Extending the coverage would allow the Oxford Economics definition to cover more of the defence sector; however, their inclusion may be misleading due to the lack of disaggregation in the DASA data. For example, it is not possible to isolate the part of SIC 74 which contains parts of QinetiQ, instead only the aggregation of ‘Financial services, business activities, education, health, and other service activities’. Adding this broad category to the definition would mean including the MoD’s purchase of, for example, accountancy services which would take the definition away from the type of defence procurement that is central to this study.
It should be noted that expenditure recorded within the definition used by this study includes long-term platform support in any one year, and associated services and logistics.

8
Economic case for investing in the UK defence industry
2.3. Report structure
The rest of this report is structured as follows:
Chapter 3 provides a brief overview of the defence industry in 2006;
Chapters 4-8 provide the evidence for the economic rationale for increasing Government expenditure on defence in the UK compared to other sectors as a means to stimulate the UK economy. Each of the metrics outlined in the Introduction will be examined and comparisons with the rest of the economy made;
Chapter 9 discusses the regional distribution of the defence sector; and
Chapter 10 summarises the economic case for increased Government investment in the UK defence industry as a means of stimulating the UK economy.

9
Economic case for investing in the UK defence industry
3. The UK defence industry in 2006 1
3.1. Trends
Historically, the main driver of the UK defence industry2 has been Ministry of Defence (MoD) expenditure. As Figure 3-1 shows, MoD expenditure3 in the UK defence industry has accounted for between 75 and 78 percent of total industry turnover in the period 2001-20064. At the same time, the absolute level5 of MoD expenditure in the UK defence industry has increased from £17 billion in 2001 to £22 billion in 2006. During 2006, MoD expenditure on equipment amounted to £11.7 billion, and was split between capital expenditure on equipment (£5.1 billion), equipment support (£3.8 billion) and R&D (£2.7 billion) (DASA 2008).
Over the same five-year period, UK defence exports have also demonstrated an increase in absolute value, from £4.2 billion in 2001 to £4.7 billion in 2006 (Figure 3-2). However, the value of exports has fallen since 2004, although preliminary data for 2007 suggests a significant increase in UK defence equipment export earnings (to £2 billion)6.
Figure 3-3 and 3-4 display a breakdown of UK defence exports for 2006, by type of equipment and by destination7. Figure 3-3 clearly shows the domination of aircraft sales in total UK defence exports, with guided weapons and missiles the second largest export group. No warships were exported in 2006, however, as mentioned above, three Offshore Patrol Vessels were exported in 2007, giving warships a 37 percent share of 2007 UK defence exports. NATO members and other European countries were the primary consumers of UK defence exports, accounting for £914 million of the 2006 total defence
1 2006 was chosen as the year for reviewing the defence industry as this was the most recent year for which all data are available. 2 Unlike the rest of this report, this section defines defence in accordance with all MoD expenditures in the UK. This is due to the absolute nature of the data involved, and the impracticality of weighting level data. 3 Ministry of Defence data are drawn from DASA (2008) UK Defence Statistics. DASA notes that the data it presents does not fulfil ONS quality criteria. 4 With the exception of R&D and export, all defence data are provided in financial years (beginning April 1st). For simplicity, this study has taken data in financial years as the previous calendar year’s data. For example, data for 2006/7 is taken as 2006. 5 Current prices. 6 DASA reports that this increase is a direct result of the overseas delivery of three Offshore Patrol Vessels. 2007 data were only available from DASA for equipment exports, additional aircraft and equipment exports data were not available. 7 DASA only provides disaggregated data for the total equipment exports, as shown in Figure 2, rather than total defence exports.
Key Points
• Ministry of Defence is the main consumer of UK defence output, accounting for approximately three-quarters of total UK defence output.
• The UK defence industry directly employs 160,000 people, with a further 145,000 jobs
supported through the defence industry’s UK based supply chain.
• In the UK economy, only the pharmaceutical industry spends more than the defence industry on research and development activities.
• Oxford Economics forecast that the defence industries will be particularly hard hit by the
current recession.

10
Economic case for investing in the UK defence industry
equipment exports of £1.4 billion8. Other important consumers of UK defence exports include countries from Asia and the Far East, as well as the Middle East and North Africa.
8 Data available for 2007 show a significant change in the destination of UK defence exports, with Asia and the Far East becoming the primary consumer, accounting for £1 billion of a total £2 billion exports.
£0
£5,000
£10,000
£15,000
£20,000
£25,000
2001 2002 2003 2004 2005 2006
MoD UK expenditure UK defence exports
Millions
Source : Oxford Economics/DASA
Figure 3-2 UK defence exports, by type Figure 3-1 UK defence sector turnover
Armoured fighting vehicles
6%
Aircraft64%
Warships0%
Guns, & small arms6%
Guided weapons &
missiles18%
Ammunition0%
Optical equip & training simulators
6%
Source : Oxford Economics/DASA
NATO & other Europe
67%
Asia & Far East19%
L America & Carribean
0%
Middle East & N Africa
13%
Other Africa1%
Source : Oxford Economics/DASA
Figure 3-4 UK defence equipment exports 2006, by destination
Figure 3-3 UK defence equipment exports 2006, by type
£0
£1,000
£2,000
£3,000
£4,000
£5,000
£6,000
2001 2002 2003 2004 2005 2006
Equipment Additional aircraft equipment and services
Millions
Source : Oxford Economics/DASA

11
Economic case for investing in the UK defence industry
In 2006 the UK defence industry covered by this report9 directly employed 160,000 staff in a wide range of sectors, including the manufacture of aircraft, shipping, and weapons and ammunition, as well as construction, computer services and telecommunications. Of this number, MoD spending supported 135,000 jobs, with 80,000 jobs supported by MoD equipment expenditure and 55,000 jobs supported by MoD non-equipment expenditure. The export of UK defence goods supported 25,000 jobs in 2006. These numbers are slightly lower than the previous five-year period, when direct defence employment peaked at 170,000 in 2003-5 (Figure 3-5).
The wider impact of the UK defence industry in 2006 was such that 145,000 jobs were supported throughout the UK based supply chains of the defence industry. Therefore, in total, the UK defence industry supported 305,000 jobs in the UK in 2006 (Figure 3-6).
9 As outlined above, this report does not capture the defence industry in its entirety, and therefore some findings may differ from those reported elsewhere.
0
20
40
60
80
100
120
140
160
180
2001 2002 2003 2004 2005 2006
MoD expenditure Exports
Thousands
Source : Oxford Economics/DASA
0
20
40
60
80
100
120
140
160
2001 2002 2003 2004 2005 2006
MoD expenditure Exports
Thousands
Source : Oxford Economics/DASA
Figure 3-6 Indirect employment in the UK defence sector
Figure 3-5 Direct employment in the UK defence sector
Figure 3-7 UK defence sector R&D spending
£0
£500
£1,000
£1,500
£2,000
£2,500
£3,000
1997 1999 2001 2003 2005 2007
Millions
Source : Oxford Economics/BIS
12
Economic case for investing in the UK defence industry
The UK aerospace and defence industry10 spent £2.4 billion on research and development (R&D) in 200611. R&D was conducted by 24 defence companies with BAE Systems accounting for 52 percent of total defence R&D spend. The UK aerospace and defence industry’s R&D spend in 2006 represented over 8 percent of sales – higher than nearly all other industries in the UK (the notable exception being pharmaceuticals). As Figure 3-7 shows, 2005 represented the high point of a significant increase in defence R&D expenditure from 1997. However, the period post-2005 has seen defence expenditure on R&D fall, slightly at first in 2006, but significantly in 2007 to a level equivalent to that seen in 2000 (to just over 4% of sales). A significant segment of this fall can be explained by the change in the reporting of R&D spending by BAE Systems to the Department of Business, Innovation and Skills (BIS). Pre-2007 BAE Systems reported Ministry of Defence funded R&D as its own, while other defence companies did not. In 2007, BAE Systems reporting methods came into line with other defence companies and excluded R&D activities funded by the UK Government.
3.2. The defence sector as a part of the UK economy
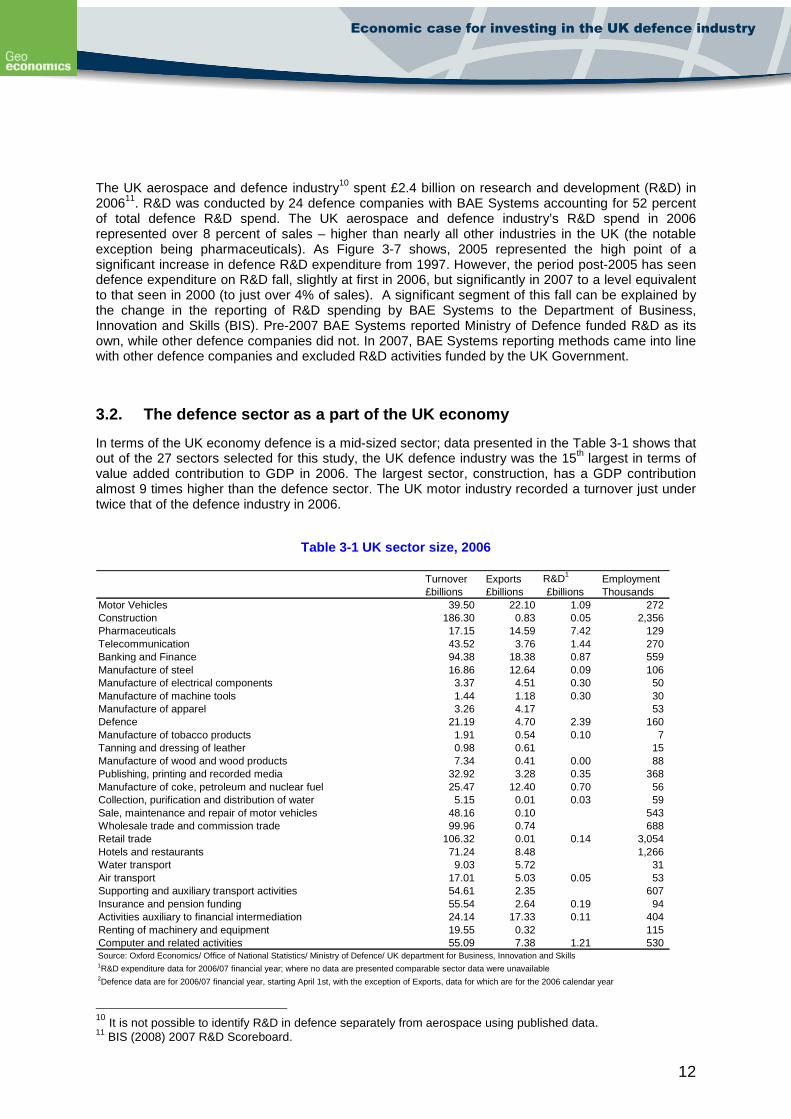
In terms of the UK economy defence is a mid-sized sector; data presented in the Table 3-1 shows that out of the 27 sectors selected for this study, the UK defence industry was the 15th largest in terms of value added contribution to GDP in 2006. The largest sector, construction, has a GDP contribution almost 9 times higher than the defence sector. The UK motor industry recorded a turnover just under twice that of the defence industry in 2006.
Table 3-1 UK sector size, 2006
10 It is not possible to identify R&D in defence separately from aerospace using published data. 11 BIS (2008) 2007 R&D Scoreboard.
Turnover Exports R&D1 Employment£billions £billions £billions Thousands
Motor Vehicles 39.50 22.10 1.09 272 Construction 186.30 0.83 0.05 2,356 Pharmaceuticals 17.15 14.59 7.42 129 Telecommunication 43.52 3.76 1.44 270 Banking and Finance 94.38 18.38 0.87 559 Manufacture of steel 16.86 12.64 0.09 106 Manufacture of electrical components 3.37 4.51 0.30 50 Manufacture of machine tools 1.44 1.18 0.30 30 Manufacture of apparel 3.26 4.17 53 Defence 21.19 4.70 2.39 160 Manufacture of tobacco products 1.91 0.54 0.10 7 Tanning and dressing of leather 0.98 0.61 15 Manufacture of wood and wood products 7.34 0.41 0.00 88 Publishing, printing and recorded media 32.92 3.28 0.35 368 Manufacture of coke, petroleum and nuclear fuel 25.47 12.40 0.70 56 Collection, purification and distribution of water 5.15 0.01 0.03 59 Sale, maintenance and repair of motor vehicles 48.16 0.10 543 Wholesale trade and commission trade 99.96 0.74 688 Retail trade 106.32 0.01 0.14 3,054 Hotels and restaurants 71.24 8.48 1,266 Water transport 9.03 5.72 31 Air transport 17.01 5.03 0.05 53 Supporting and auxiliary transport activities 54.61 2.35 607 Insurance and pension funding 55.54 2.64 0.19 94 Activities auxiliary to financial intermediation 24.14 17.33 0.11 404 Renting of machinery and equipment 19.55 0.32 115 Computer and related activities 55.09 7.38 1.21 530
2Defence data are for 2006/07 financial year, starting April 1st, with the exception of Exports, data for which are for the 2006 calendar year
Source: Oxford Economics/ Office of National Statistics/ Ministry of Defence/ UK department for Business, Innovation and Skills1R&D expenditure data for 2006/07 financial year; where no data are presented comparable sector data were unavailable

13
Economic case for investing in the UK defence industry
In 2006 the UK defence industry was the 11th largest exporter, accounting for 3 percent of total exports for the selected sectors. UK defence exports in 2006 were similar in value to those of the electrical components and apparel industries, but were almost £10 billion less than UK pharmaceutical industry exports.
As with sector size, the UK defence industry is mid-sized in terms of direct employment, with the 160,000 jobs supported placing the sector 13th out of the 27 sectors examined.
3.3. An indication of future prospects
Oxford Economics’ Industry Forecasts for summer 2009, detail the future prospects for the aerospace sector, which represents a significant section of the UK defence industry12. Overall aerospace output (commercial and defence) is forecast to fall by 6.34 percent during 2009, by 9.2 percent in 2010, by 4.8 in 2011, and pick up thereafter.
By contrast, as Figure 3-8 shows, UK GDP is forecast to contract by 4.7 percent in 2009, before recovering in 2010.
12 The Oxford Economics’ sectoral model does not provide a forecast for defence industry in isolation.
Figure 3-8 Output growth
-15%
-10%
-5%
0%
5%
10%
15%
20%
25%
30%
2005 2006 2007 2008 2009 2010 2011
Annual Growth
Source : Oxford Economics
GDP
Aerospace output
Forecast
14
Economic case for investing in the UK defence industry
4. Monetary impact
4.1. The channels of economic impact
There are three key channels through which an industry makes a contribution to the UK economy. These are:
• Direct impacts – employment and activity in the sector itself.
• Indirect impacts – employment and activity supported down the supply chain, as a result of a sector’s companies purchasing goods and services from UK suppliers. This includes, for example, jobs supported through the demand for inputs; the maintenance and repair of outputs; advertising; and a wide variety of activity in the business services sector (legal, accountancy, IT etc).
• Induced impacts – employment and activity supported by the consumer spending of those employed in the sector or in its supply chain. This helps to support jobs in UK industries that supply these purchases, and includes jobs in retail outlets, companies producing consumer goods and in a range of service industries.
4.2. Gross output impact
The scale of the economic impact of the Government investment within a given sector on the rest of the economy can be assessed by looking at gross output multipliers. By augmenting sectoral supply and use data released by the UK Office for National Statistics in 2006, Oxford Economics has been able to generate estimates for UK sector multipliers for 200613. Sector multipliers make it possible to determine the indirect and induced economic impacts of an increase in Government investment in a particular sector; the differences between sectors reflect:
• their import intensity;
• the strength of their UK based supply chain; and
• the wages paid by the sector.
A notional increase of £100 million in Government expenditure in the defence industry would generate a gross economic impact of £227 million – i.e. the multiplier is 2.3 (see Table 4-1). Of this, the indirect (supply chain) multiplier is 1.7 and the induced multiplier is 0.5.
13 The latest sector multiplier tables produced for the UK by the Office for National Statistics are from 1995.
Key Points
• The UK defence economy has a gross output multiplier of 2.3, ranking it above the median of the sectors considered. This reflects both a strong UK based supply chain and a relatively high wage level paid to workers.
• The additional contributions that would be made by the UK defence industry to the
Exchequer, as a result of a notional increase in demand, are comfortably above average for the economy as a whole.
15
Economic case for investing in the UK defence industry
It should be acknowledged that there is the potential for lags in the receipt of benefits from increased investment in the defence sector, due mainly to the time needed to ‘gear up’ for platform development. However, this ‘gearing up’ is only the result of a lumpy procurement process. If procurement was carried out on a rolling basis, lags could be minimised.
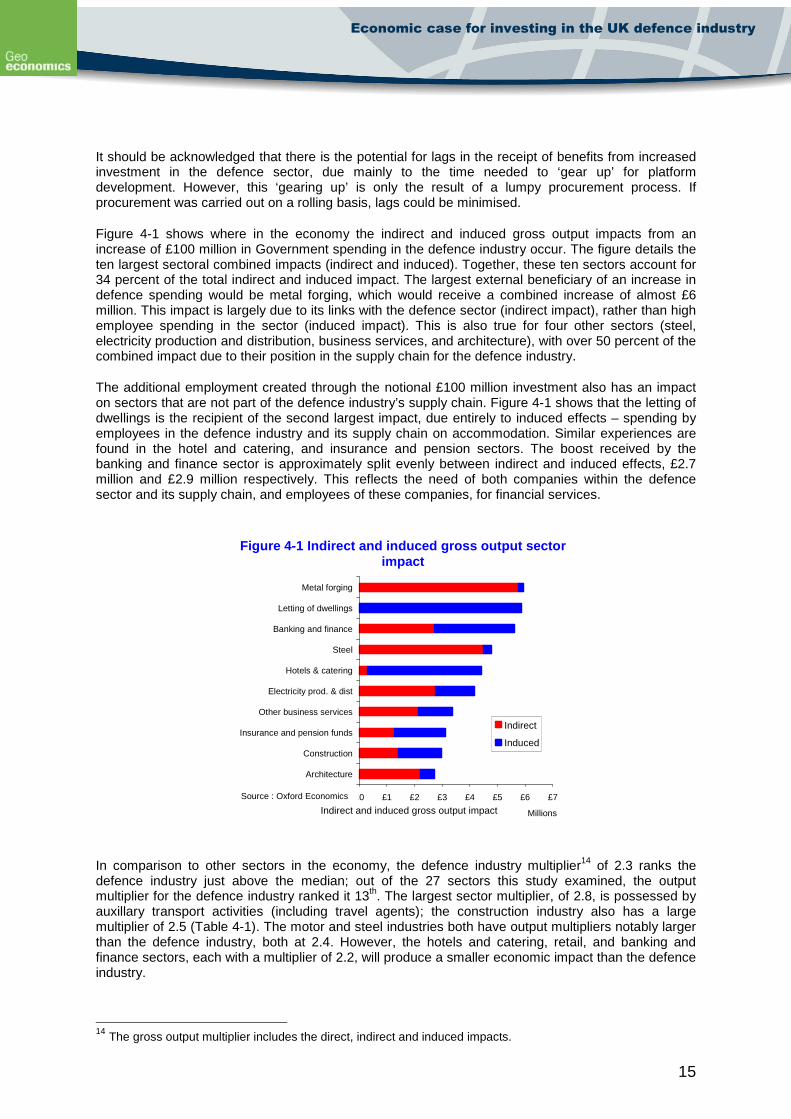
Figure 4-1 shows where in the economy the indirect and induced gross output impacts from an increase of £100 million in Government spending in the defence industry occur. The figure details the ten largest sectoral combined impacts (indirect and induced). Together, these ten sectors account for 34 percent of the total indirect and induced impact. The largest external beneficiary of an increase in defence spending would be metal forging, which would receive a combined increase of almost £6 million. This impact is largely due to its links with the defence sector (indirect impact), rather than high employee spending in the sector (induced impact). This is also true for four other sectors (steel, electricity production and distribution, business services, and architecture), with over 50 percent of the combined impact due to their position in the supply chain for the defence industry.
The additional employment created through the notional £100 million investment also has an impact on sectors that are not part of the defence industry’s supply chain. Figure 4-1 shows that the letting of dwellings is the recipient of the second largest impact, due entirely to induced effects – spending by employees in the defence industry and its supply chain on accommodation. Similar experiences are found in the hotel and catering, and insurance and pension sectors. The boost received by the banking and finance sector is approximately split evenly between indirect and induced effects, £2.7 million and £2.9 million respectively. This reflects the need of both companies within the defence sector and its supply chain, and employees of these companies, for financial services.
In comparison to other sectors in the economy, the defence industry multiplier14 of 2.3 ranks the defence industry just above the median; out of the 27 sectors this study examined, the output multiplier for the defence industry ranked it 13th. The largest sector multiplier, of 2.8, is possessed by auxillary transport activities (including travel agents); the construction industry also has a large multiplier of 2.5 (Table 4-1). The motor and steel industries both have output multipliers notably larger than the defence industry, both at 2.4. However, the hotels and catering, retail, and banking and finance sectors, each with a multiplier of 2.2, will produce a smaller economic impact than the defence industry.
14 The gross output multiplier includes the direct, indirect and induced impacts.
Figure 4-1 Indirect and induced gross output sector impact
£0 £1 £2 £3 £4 £5 £6 £7
Architecture
Construction
Insurance and pension funds
Other business services
Electricity prod. & dist
Hotels & catering
Steel
Banking and finance
Letting of dwellings
Metal forging
Millions
Indirect
Induced
Indirect and induced gross output impact
Source : Oxford Economics

16
Economic case for investing in the UK defence industry
Table 4-1 Sector multipliers Sector Multiplier Sector Multiplier Auxiliary transport activities 2.8 Machine Tools 2.3 Water transport 2.7 Apparel 2.2 Insurance and pensions 2.6 Hotels and catering 2.2 Construction 2.5 Retail trade 2.2 Wholesale trade 2.5 Banking and Finance 2.2 Auxiliary financial intermediation 2.4 Renting of machinery 2.1 Motor Vehicles 2.4 Tobacco products 2.1 Air transport 2.4 Coke and petroleum 2.1 Publishing 2.4 Pharmaceuticals 2.1 Steel 2.4 Telecommunication 2.1 Computers and software 2.3 Leather goods 2.0 Wood and wood products 2.3 Electrical components 2.0 Defence 2.3 Water distribution 1.8 Sale and repair of vehicles 2.3 Median 2.3 Source: Oxford Economics/ONS
4.3. Returns to the Exchequer
An increase in Government investment within any sector will also generate some payback to the Exchequer in the form of higher tax receipts. These additional revenues are accrued through Income Tax paid by employees, National Insurance contributions made by employees and employers, and Corporation Tax paid by companies15.
The calculations made by this study examine the additional tax that would be paid by each sector following a notional £100 million increase of demand in that sector16. The additional Income Tax generated by the investment is calculated by using the UK Office for National Statistics’ 2008 Annual Survey of Hours and Earnings to determine the mean annual salary for an employee within a given sector. By combining these earnings data with tax allowances and bands, and the number of jobs directly created, or supported, by the Government investment17 it is possible to estimate the total income tax receipts. A similar process allows National Insurance contributions to be estimated. To calculate the additional Corporation Tax directly generated by the Government investment we estimate the additional profits generated and apply current Corporation Tax rates to these (we use a simple assumption that half of the companies in a sector pay at the higher rate of 29 percent).
Adding these tax receipts together, the direct taxation impact from a £100 million increase in Government procurement from the UK defence sector amounts to £11.5 million. Figure 4-2 displays a breakdown of the additional direct taxation impact for the defence sector. National Insurance contributions make up the smallest slice of additional taxation generated, amounting to just over £2.5 million. Corporation Tax paid by defence companies is the largest contributer to direct taxation, inputing £4.7 million; defence sector employees’ Income Tax payments contribute £4.2 million to the taxation impact.
Placed in the context of the entire economy, the direct taxation impact of investment in the defence industry is the 12th largest of the 26 sectors considered by this study18. The UK’s retail and 15 Further tax revenues will be generated by various indirect taxes. 16 This does not include the impact of indirect and induced effects on taxation throughout the rest of the supply chain. For example, increased spend on machine tools would ultimately generate additional activity and employment within the machine tools industry, which would generate further tax revenues. 17 For more detail on the calculation of the number of jobs directly generated, or supported, by the Government investment see Jobs supported. 18 The manufacture of leather goods sector was not included in taxation comparisons as no salary data were available from the Office for National Statistics.

17
Economic case for investing in the UK defence industry
construction sectors returned two of the highest direct taxation impacts, at £16.2 million and £15.4 million respectively. Table 4-2 shows that the defence industry generates significantly more taxation revenue than the steel and apparel industries, which record additional revenues of £8.2 million and £9.4 million respectively. However, the defence industry falls below the revenues generated by the banking and finance (£14 million) and hotels and catering (£12.6 million) sectors.
£0
£1
£1
£2
£2
£3
£3
£4
£4
£5
£5
Income Tax National Insurance Corporation Tax
Mill
ions
Direct taxation
Source : Oxford Economics/ONS
Figure 4-2 Defence sector additional direct taxatio n earnings

18
Economic case for investing in the UK defence industry
Table 4-2 Sector additional taxation earnings
Sector Income Tax
National Insurance
Corporation Tax Total
£millions £millions £millions £millions Retail trade 5.6 3.7 6.9 16.2 Auxiliary financial intermediation 6.9 3.1 5.8 15.8 Construction 5.6 3.4 6.4 15.4 Publishing 5.2 3.2 5.9 14.3 Sale and repair of vehicles 5.1 3.2 5.9 14.2 Machine Tools 5.1 3.1 5.8 14.0 Banking and Finance 5.7 2.9 5.4 14.0 Wood and wood products 4.6 2.9 5.4 12.9 Hotels and catering 4.3 2.9 5.4 12.6 Computers and software 4.6 2.6 4.9 12.1 Air transport 4.4 2.7 4.9 12.0 Defence 4.2 2.5 4.7 11.5 Wholesale trade 4.1 2.5 4.6 11.2 Electrical components 3.7 2.3 4.2 10.2 Apparel 3.3 2.1 4.0 9.4 Auxiliary transport activities 3.3 2.0 3.8 9.2 Water distribution 3.2 2.0 3.7 8.9 Steel 3.0 1.8 3.4 8.2 Telecommunication 2.7 1.6 3.0 7.2 Pharmaceuticals 2.5 1.5 2.9 6.9 Motor Vehicles 2.1 1.3 2.4 5.9 Insurance and pensions 2.1 1.3 2.3 5.7 Renting of machinery 2.0 1.2 2.3 5.5 Tobacco products 1.9 1.0 1.9 4.8 Water transport 1.3 0.8 1.5 3.6 Coke and petroleum 1.2 0.6 1.2 3.0 Leather goods n/a n/a n/a n/a Median 3.9 2.4 4.4 10.2 Source: Oxford Economics/ONS/HMRC
4.4. Summary
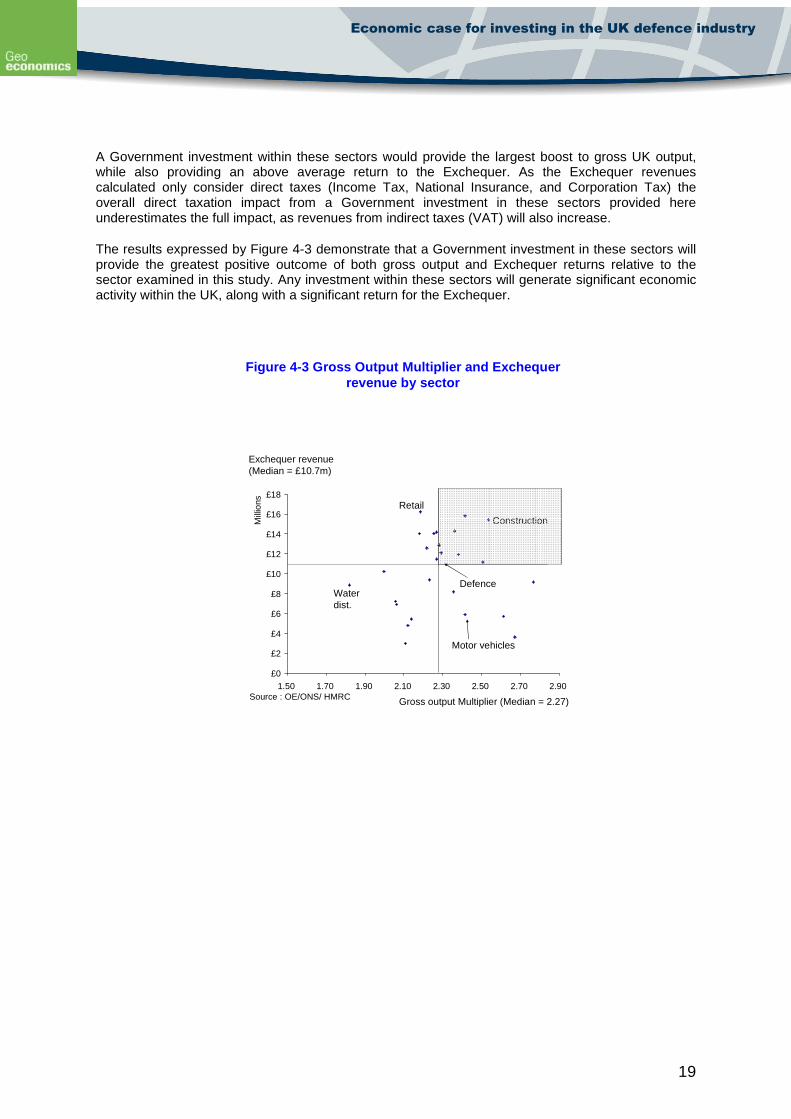
Figure 4-3 presents an overview of the monetary impact of an increase in Government expenditure by sector. The horizontal and vertical lines within the figure represent the sample medians of the output multiplier and Exchequer revenue generated by a notional £100 million investment in each sector, respectively. The shaded quarter of the figure represents the area where a sector’s output multiplier and Exchequer revenue are above the sample medians.
From the figure, it can be ascertained that there are ten sectors that possess an output multiplier and Exchequer revenue greater than the sample medians. These sectors are: construction, machine tools, defence, wood and wood products, publishing, sale and repair of motor vehicles, wholesale trade, air transport, activities auxiliary to financial services, and computer and software.
19
Economic case for investing in the UK defence industry
A Government investment within these sectors would provide the largest boost to gross UK output, while also providing an above average return to the Exchequer. As the Exchequer revenues calculated only consider direct taxes (Income Tax, National Insurance, and Corporation Tax) the overall direct taxation impact from a Government investment in these sectors provided here underestimates the full impact, as revenues from indirect taxes (VAT) will also increase.
The results expressed by Figure 4-3 demonstrate that a Government investment in these sectors will provide the greatest positive outcome of both gross output and Exchequer returns relative to the sector examined in this study. Any investment within these sectors will generate significant economic activity within the UK, along with a significant return for the Exchequer.
Figure 4-3 Gross Output Multiplier and Exchequer revenue by sector
£0
£2
£4
£6
£8
£10
£12
£14
£16
£18
1.50 1.70 1.90 2.10 2.30 2.50 2.70 2.90
Mill
ions
Source : OE/ONS/ HMRC
DefenceWaterdist.
Retail
Motor vehicles
Construction
Exchequer revenue (Median = £10.7m)
Gross output Multiplier (Median = 2.27)

20
Economic case for investing in the UK defence industry
Case study: The Case study: The Type 45 Destroyer
The Type 45 Destroyer, produced by BVT, is the world’s most advanced warship, providing the Royal Navy’s primary anti-air warfare capability over the next 30 years. The MoD originally envisaged a fleet of 12 Type 45s, however this was reduced to first 8, and finally to 6, with ships to be delivered between 2006 and 2010, at a cost of £5 billion (which has since risen to £6.46 billion).
The production of the Type 45 Destroyer is split into blocks, with blocks constructed in the Govan, Scotstoun, and Portsmouth shipyards. The results of a Fraser of Allander (2008) study of the economic impact of the BAE shipyards on the Clyde can be used to illustrate the impact of Type 45 procurement on the Scottish economy. Using Scottish input-output tables, the study found that the BAE shipyards at Govan and Scotstoun had an output multiplier of 1.55, indicating that for every £1 million of output produced by the shipyards, the Scottish economy produced £1.55 million in output. Furthermore, the study found that for every job in the shipyards, 1.68 jobs were supported elsewhere in the Scottish economy.
BVT note that the anti-aircraft system on the Type 45’s will be the most advanced in the world in terms of the number of targets it can engage and the number of missiles it can address simultaneously. The Type 45’s Principal Anti-Air Missile System (PAAMS) jointly developed with France and Italy they combine this with the UK-developed SAMPSON radar to allow the Type 45’s to optimise their capabilities. Apart from Scotland, work on the project has taken place in Portsmouth (which has been responsible for through life support) and Filton (Bristol), the main project office. The highly skilled engineering and project management capabilities required for the project have therefore been spread across the country. Such skills are also transferable to and from other sectors of the economy. For example some BVT senior management have come from backgrounds in the power industry and have indicated the potential for knowledge transfer from the project back to this industry as well as others such as the oil industry.
The PAAMS (which accounts for some £3.5 billion of the Type 45’s total cost) is supported by suppliers from a variety of EU countries, though it should be noted that UK-developed components developed for the project are also present on French and Italian warships. Of the remaining £3.0 billion in platform value, BVT indicate that some 80% is sourced from UK based suppliers.
Development of the Type 45 involved hundreds of draftsmen. 3D modelling, tested in the UK, was extensively used for the project and there are potential future applications of such modelling to the oil industry.
The engineering specifications developed for the Type 45 have involved the development of innovative solutions and new skills and techniques and academic/industry collaborations. For example the Universities of Newcastle and Strathclyde combined with BVT to help develop the high tensile but light steel demanded by project requirements. The huge volume of optical fibre and cabling and computer control systems required for the project required the active involvement of the supply chain. This involvement has further developed “backwards and forwards” transferable skills with applications in the power industry, including areas such as wind turbines, and information technology (broadband and computer control systems). contributing to the maintenance and further development of the UK’s high technology skills base.
As organisations such as BVT face the challenge of the “lumpy” nature of domestic orders for projects such as the Type 45. The Type 45 itself will have an effective development path of some 30 years from conception to delivery of the last vessel. Accordingly, BVT has been active in exporting the skills acquired in the Type 45 to markets such as Oman and Trinidad and Tobago.
The robust nature of the Type 45’s product design has been a benefit in such export markets, which look to long term survivability criteria.

21
Economic case for investing in the UK defence industry
5. Labour market impact
5.1. Jobs supported
An increase in demand within a sector will result in an increase in the number of workers required to fulfil this demand both directly (i.e. within that sector) and outside the sector. Therefore, any investment made in a sector will increase employment both within the recipient sector and other sectors of the economy19.
By making use of ONS data on sectoral labour productivity, the direct employment effect of a notional £100 million investment in a sector can be calculated. The indirect and induced employment effects are established by combining the indirect and induced output impacts on each sector with profitability and productivity data.
A notional £100 million Government investment in the UK defence industry would support 1,885 jobs in the UK economy. The direct employment impact of this investment is 726 jobs supported in the defence industry. Indirectly, the investment would support 589 jobs throughout the defence industry’s supply chain. Finally, the jobs supported in the defence industry and its supply chain would support a further 570 jobs in the rest of the economy through the spending of their wages and salaries.
In terms of the overall economy, the number of jobs supported by an investment in the defence industry places the industry 12th in comparison to the number of jobs created by a similar investment in 26 other sectors (Table 5-1). The highest ranking sectors are those with either low productivity, high gross value-added to turnover ratios, strong UK supply chains, or a combination of all three; the top three sectors for jobs supported are retail (4,099 jobs – low productivity), hotels and catering (3,424 jobs – a combination of all three), and construction (2,658 jobs – strong UK supply chain). The sectors that support the fewest jobs are those with the highest productivity levels; an investment in pharmaceuticals supports 1,315 jobs, of which only 394 jobs are a direct effect of the investment. The jobs supported by an investment in the defence sector are well split between the sector itself (direct), its supply chain (indirect), and the rest of the economy (induced).
19 In this sense jobs that are supported are either currently filled jobs that would be made redundant without the extra investment, or jobs that are created as a result of the extra investment.
Key Points
• A notional £100 million increase in demand in the defence industry would create an additional 1,885 jobs in the UK. In relation to the other sectors in the economy, this ranks the defence industry above the median of sectors considered.
• The defence industry is a highly-skilled one; with a greater share of workers educated to
at least NVQ 4 equivalent than the average.
• The combined labour market impact of an increase in defence demand is such that the defence industry is one of just seven sectors that have above average job creation and skill levels.

22
Economic case for investing in the UK defence industry
Table 5-1 Sector employment impacts Sector Direct Indirect Induced Total Retail trade 2,929 563 606 4,099 Hotels and catering 2,321 538 564 3,424 Construction 1,105 980 573 2,658 Wood and wood products 1,279 734 540 2,553 Apparel 1,293 625 588 2,506 Sale and repair of vehicles 1,270 558 611 2,439 Leather goods 1,472 547 369 2,389 Auxiliary transport activities 680 898 716 2,295 Machine Tools 1,093 555 630 2,278 Publishing 987 676 609 2,271 Wholesale trade 799 789 642 2,230 Defence 726 589 570 1,885 Computers and software 553 576 711 1,840 Air transport 679 618 505 1,802 Insurance and pensions 272 968 546 1,785 Auxiliary financial intermediation 447 587 718 1,752 Banking and Finance 535 521 644 1,700 Water transport 311 752 619 1,683 Electrical components 799 450 430 1,679 Motor Vehicles 401 736 492 1,629 Steel 609 592 425 1,627 Renting of machinery 499 508 559 1,566 Telecommunication 358 445 528 1,331 Water distribution 593 401 332 1,326 Pharmaceuticals 394 424 497 1,315 Tobacco products 199 609 468 1,277 Coke and petroleum 115 316 215 645 Median 679 587 564 1,831 Source: Oxford Economics/ONS
5.2. Skill levels
It is not only the number of jobs that should be considered important, but also the types of jobs; the skill level of the jobs supported is of importance if the UK is to maintain a highly-skilled economy.
Using data from the Office for National Statistics’ Labour Force Survey (LFS), it is possible to determine the percentage of jobs in each sector that are highly skilled. We define high-skilled as being people possessing at least NVQ level 4, or equivalent, qualification. This includes bachelor’s degrees, diplomas in nursing and teaching, doctorates, as well as other higher education qualifications that are below degree level.
Table 5-2 shows the top ten ranked sectors in terms of the percentage of highly-skilled jobs in each sector20. 39 percent of the jobs in the UK defence sector are classified as high-skilled, ranking the sector 8th out of the 27 sectors examined by this study. The detailed engineering, design and research required for the production of defence products, such as the Type 45 destroyer, is the primary driver of demand for skilled labour in the defence industry. As a result the defence industry can be
20 Due to the small sample size of the Labour Force Survey results often fluctuate significantly. To counter this Oxford Economics used an average of the previous 8 quarters’ results.

23
Economic case for investing in the UK defence industry
considered to be part of the UK’s knowledge economy21, and any decline in the sector will impact on the UK’s future competitiveness.
Table 5-2 Percentage of jobs highly skilled Sector Highly Skilled Sector Highly Skilled Computers and software 61% Motor Vehicles 24% Pharmaceuticals 58% Steel 21% Water distribution22 46% Leather goods 21% Coke and petroleum 45% Auxiliary transport activities 21% Banking and Finance 42% Apparel 20% Insurance and pensions 39% Wholesale trade 20% Telecommunication 39% Tobacco products 20% Defence 39% Renting of machinery 18% Auxiliary financial intermediation 39% Retail trade 15% Air transport 38% Construction 15% Water transport 36% Hotels and catering 14% Publishing 35% Wood and wood products 14% Electrical components 34% Sale and repair of vehicles 9% Machine Tools 32% Median 32% Source: Oxford Economics/ONS
5.3. Summary
The overall impact of an investment on the labour market is summarised in Figure 5-1, with the horizontal and vertical lines representing, respectively, the sample median number of jobs created by a notional £100 million investment in each sector and the percentage of these jobs that are highly-skilled. As with the labour market impact, the shaded quarter represents the area in which sectors have jobs creation and percentage highly-skilled workers above the respective sample medians.
21 The knowledge economy is defined as “one in which the generation and exploitation of knowledge has come to play the predominant part in the creation of wealth. It is not simply about pushing back the frontiers of knowledge; it is also about the most effective use and exploitation of all types of knowledge in all manner of economic activity” (DTI Competitiveness White Paper 1998).
Figure 5-1 Sector job creation and skill levels
0
0.1
0.2
0.3
0.4
0.5
0.6
0.7
0 1,000 2,000 3,000 4,000 5,000
Highly skilled (Median =32%)
Source : Oxford Economics
Defence
Computers & Software
Retail
Pharmaceuticals
Publishing
Jobs created (Median = 1,689)

24
Economic case for investing in the UK defence industry
The figure shows that there are seven sectors in which a notional £100 million investment would create an above-average number of jobs, of which the percentage that are highly-skilled is also above average. The seven sectors that fall into this category are: banking and finance, defence, publishing, air transport, insurance and pensions, activities auxiliary to financial services, and computers and software. In the current economic climate, the support of jobs and the maintenance of a skilled workforce are of paramount importance. Our research has shown that these seven sectors respond to any investment by supporting a greater number and higher-skill level of jobs than the other sectors examined in this study. Aside from the individuals employed and the sectors in which they spend their wages, the other beneficiary of any investment would be the UK’s knowledge economy, which would gain from the increased number of skilled workers active in the UK.
22 The high level of skilled workers in Water distribution is notable, however this is probably the result of how work is classified. For example, workers maintaining water pipes may fall into the construction category.

25
Economic case for investing in the UK defence industry
Case study: Armoured Fighting Vehicles The UK Defence Industrial Strategy (DIS) outlines the future role of the UK’s armed forces, emphasising the need for the Army to maintain a force that possesses higher levels of deployability, mobility, firepower and protection than currently held. The DIS presents expanding the UK’s fleet of Armoured Fighting Vehicles (AFVs) as the ideal solution to this new requirement. The UK has rapidly consolidated its domestic AFV industry, as competitive forces and shrinking UK MoD funding have forced companies to seek synergies with each other. To ensure that the UK MoD can get best value for money and continued improvement, Land Systems and the MoD have signed an AFV Partnering Agreement, which provided MoD with an increase level of transparency in the business and allows industry to inform MoD on the impacts of policy and programmes. The Future Rapid Effect System (FRES) represents the MoD’s strategy to procure 3,000 AFVs (valued at approximately £14 billion), in three broad categories, heavy, utility and reconnaissance, replacing the Saxon, CVR and FV 430 series of vehicles. The FRES programme is designed to secure the highest level of systems engineering skills, resources and capabilities within the UK. In the time since its conception, the FRES programme has experienced delays. Contact with General Dynamics indicates that prior to these delays, 150 staff had been dedicated to FRES, with 350 suppliers signed up in the UK in 2006-07,including many new suppliers. Had FRES not been delayed, General Dynamics estimates that up to 700 jobs would have been created by 2014-15. Skills in forming and cutting armoured steel and support for specialised engine and gearbox maintenance would have been developed along with the development of specialised camera and data bus systems. These skill sets and knowledge may also have had spin-off applications to the broader civilian economy. For example, the advanced, lightweight and high-performance camera system held the potential for applications within security systems. Likewise, had FRES not been delayed the program would have promoted a variety of labour force skills. General Dynamics estimates that of the 700 potential employees 300-400 would have been engineers, with 300, involved in the build. Workers involved in the build would have been former car industry workers in many cases. A further 100 would have been involved in the direct supply chain, with long run contracts being put in place for lead items. Current UK exports of AFVs have been restricted by the specific nature of the MoD’s requirements, and it is only in cases when an agreement is sponsored by the UK Government (e.g. exporting to Oman) that the product is exportable. A further restriction is the quality and capability of the products created in the UK means that the market for exporting is reduced due to the limited number of countries able to afford such items. In addition, these countries often have their own defence providers who are able to offer a substitute product, or are protected for the interests of economic or security interests. The FRES family of vehicles may offer products that will address a number of export programmes in the near future, although, as indicated, the ability of the UK defence industry to put a mature product forward is dependent upon the timeliness of the MoD decision-making.

26
Economic case for investing in the UK defence industry
6. Potential losses
6.1. Capital intensity
Labour is not the only factor of production in which companies may have made significant investment – we also need to consider the capital intensity of a sector. A sector with a high level of capital intensity (here defined as the ratio of net capital stock to turnover), is a sector which devotes a considerable amount of its turnover to developing productive capacity. Therefore, any decline in a capital intensive industry may mean a permanent loss of productive capability for the UK economy.
The Office for National Statistics supplies capital stock data in the Capital Stocks, Capital Consumption and Non-Financial Balance Sheets, and sector turnover data is also supplied by the Office for National Statistics in the Annual Business Inquiry. Two caveats must be attached to the capital stock data used in this study. First, difficulties occur measuring capital stocks for service industries; therefore the accuracy of service sector data cannot be assured. Second, the capital stock data provided by the Office for National Statistics is not disaggregated down to the two-digit SIC level used in this study. To counter this, Oxford Economics has augmented the capital stock data to a two-digit SIC level by establishing relative shares based on turnover data.
Table 6-1 Sector capital intensity
The UK defence sector has a capital intensity of 36 percent of turnover; this reflects the need to build sizable construction facilities and maintain significant amounts of equipment (e.g. the BAE facilities on
Key Points
• Sectors that invest the most in capital and labour present the largest potential for losses if they fail. Supporting these sectors will ensure that the UK’s productive capacity is not severely diminished by the recession.
• Relative to the rest of the economy, the defence industry has a capital intensity level just
above the median.
• When capital intensity and skill levels are combined, the defence industry is one of eight sectors which are liable to create the largest losses to the UK if they fail in the recession.
Sector Capital intensity Sector Capital intensity Water distribution 139% Motor Vehicles 33% Renting of machinery 131% Steel 28% Air transport 95% Machine Tools 27% Hotels and catering 94% Wood and wood products 25% Water transport 88% Sale and repair of vehicles 19% Auxiliary transport activities 85% Retail trade 18% Telecommunication 78% Coke and petroleum 17% Pharmaceuticals 55% Wholesale trade 16% Leather goods 52% Computers and software 15% Apparel 45% Construction 13% Electrical components 43% Insurance and pensions 0% Publishing 41% Auxiliary financial intermediation 0% Defence 40% Banking and Finance n/a Tobacco products 33% Median 34%Source: Oxford Economics/ONS

27
Economic case for investing in the UK defence industry
the Clyde) to produce defence products. This ranks the industry as the 13th most capital intensive sector of the 27 sectors considered by this study. Some sectors are intrinsically capital intensive due to their nature, and it is no surprise that the distribution of water, the renting of machinery and air transport are the three most capital intensive sectors under study. The defence sector performs well in comparison to the UK’s motor and steel industries, which have capital intensities of 33 and 28 percent respectively (Table 6-1). However, it performs less well against pharmaceuticals and telecommunications. The high level of capital intensity of telecommunications reflects the large amount of capital engaged in the fixed line communications network.
6.2. Summary
Within the production process firms invest in capital, in terms of buildings and equipment, and labour, through training. Figure 6-1 presents the capital intensity and skill levels of the sectors considered in this study. Within the figure the shaded quarter represents the areas in which sectors can be classed as those in which largest relative investments in the factors of production have been made – they have above-average capital intensities and above-average skill levels.
The figure shows that eight sectors could be deemed to make above-average investments in their factors of production, relative to their overall size. The eight sectors are: pharmaceuticals, water distribution, defence, telecommunications, electrical components, publishing, water transport and air transport. By making the largest relative investments in capital and labour, these sectors perform a significant role in increasing the UK’s factors of production and its overall productive capacity. Any investment made in these sectors will increase the UK’s productive capacity at a relatively higher rate, and more balanced (between capital and skills) than the other sectors considered in this study. Alternatively, if any of these sectors were to suffer significant damage as a result of the recession, the ability of the UK economy to build its productive capacity would be diminished.
Figure 6-1 Sector skill levels and capital intensit y
0%
10%
20%
30%
40%
50%
60%
70%
0.0% 20.0% 40.0% 60.0% 80.0% 100.0% 120.0% 140.0%
Highly skilled (median = 32%
Source : Oxford Economics/ONS Capital intensity (Median = 34.3%)
Defence
Pharmaceuticals
Waterdistribution
Hotels & restaurants
Computers
Telecomms

28
Economic case for investing in the UK defence industry
Case study: Typhoon air-to-ground Background The Typhoon is a multi-role combat fighter that will replace the Jaguar and the Tornado F3 in providing increased performance and flexibility. The Typhoon is being manufactured jointly between companies from Germany, Italy, Spain and the UK; Rolls-Royce and BAE Systems have been awarded approximately 37.5 percent of the total work share. Originally designed primarily, but not exclusively, for air superiority, the Typhoon programme is split into three Tranches, with Tranche 2 and Tranche 3 to include the comprehensive air-to-ground package (236 aircraft across the four nations). Furthermore, all of the RAF’s 55 Tranche 1 aircraft are being retrofitted to have air-to-ground capabilities. The air-to-ground capability provides the Typhoon with the capacity to change role mid-flight, increasing flexibility. As global defence budgets are squeezed, Governments are focusing on fewer but more capable and flexible, multi-role platforms, such as the Typhoon. Investments made Significant investments have been made in order to produce Typhoon in the UK, both in capital equipment, and research and development. BAE Systems reports that £98.3 million has been invested in manufacturing facilities for the Typhoon, in addition to previous investments amounting to £319 million. Although data on R&D expenditure within the Typhoon are company sensitive, the technological benefits that can be associated with the Typhoon programme hint at significant investment levels. Wider technology benefits from the Typhoon include carbon fibre technology, super plastic forming and fusion bonding, modular avionics, the flight control system, and aero-engine technology. Furthermore, technology spillovers from the Typhoon have entered civil aircraft, and motor vehicle industries. The Typhoon programme is also contributing to the creation of a range of modern business practices which are being applied throughout the supply chain23. Production The first two Tranches of the Typhoon programme (comprising of 384 aircraft) have been contracted, with the National Audit Office placing a unit cost of £69.3 million for each of the UK’s Typhoon order (146 aircraft). The negotiations for the final Tranche of the programme are currently ongoing. The number of man-hours required for producing a Typhoon aircraft is company sensitive, however BAE Systems estimates that the Typhoon programme supports 8,000 jobs within BAE, and a further 100,000 throughout the four nations24. The work force required for developing the Typhoon is highly-skilled, with special expertise required in a wide range of fields including aerodynamics, flight control systems, mission systems, software, structural airframes, avionics, electromagnetics, systems integration, through life support, safety engineering, and human cockpit integration. The Typhoon programme is developing new production and business processes, creating employees who are highly skilled and have the flexibility to be transferred to future programmes within the aerospace industry, as well as the motor vehicle and electronics industries. A previous study by Oxford Economics25 estimates that BAE Systems is responsible for over 30 percent of employment in knowledge-intensive production in central Lancashire and 12 percent across the North West of England.
23 Hartley, K (2008) The Industrial And Economic Benefits Of Eurofighter Typhoon 24 Hartley, K (2008) 25 Oxford Economics (2006) The Economic Contribution of BAE Systems to the UK in 2006.

29
Economic case for investing in the UK defence industry
Supply chain There are approximately 150 tier one and tier two suppliers on the Typhoon programme across the four partner nations, with 28 of the 48 tier one suppliers based in the UK. Many of the companies included within the supply chain are medium sized enterprises, whose work on the Typhoon programme will ensure that a sound industrial base is maintained. The indirect employment impact of BAE Systems as a whole on the UK is 46,000 jobs, with every 10 BAE jobs in the North West supporting 13 jobs indirectly. Exports The Typhoon programme currently has two export customers (nations not including the four partner nations): Austria (15 aircraft with deliveries beginning in 2007) and Saudi Arabia (72 aircraft, delivery commencing in 2009). In addition current export campaigns include Romania, Greece, Turkey, Switzerland, India and Japan. Capacity The current lead time for Typhoon production is 4 years, meaning that any investments made now in Tranche 3 will deliver the first aircraft in 2013. Current plans show the first Tranche 3 aircraft leaving major units in the first half of 2012, based on an annual production rate of 60 aircraft being maintained. Future Prospects All Typhoons in current and future production will be air-to-ground capable, and this capability will be enhanced over time in line with customer requirements. Retention of the current work force will be driven by the volume and timing of the Tranche 3 order, as well as other factors, including aircraft capability requirements, how BAE Systems executes support contracts, and export orders. If the full Tranche 3 suite of 236 aircraft are ordered across the four nations (including 88 for the UK) at the expected capability levels, the current BAE Systems employment levels on Typhoon should be maintained. Any delay or reduction in order volume or capability may impact on employment levels, in addition to the erosion of the current skills base. Furthermore, BAE Systems would not be able to undertake the required level of R&D activity in support of the Typhoon, impacting on exports and other aircraft programmes. Finally, BAE Systems would not be able to employ the next generation of engineers, and the indigenous engineering capability that supports the UK’s aerospace industry would be lost. A Tranche 3 production order will enable BAE Systems to price exports, and is therefore crucial to future export activity. Due to the Typhoon being a highly capable weapons system, and a symbol of military and political intent, Government support is required to promote exports.

30
Economic case for investing in the UK defence industry
7. A rapid return?
7.1. Capacity
Given the importance in the current economic climate of an investment package having immediate impacts, a crucial factor that must be considered when assessing whether an economic case exists for the Government to increase its procurement from a sector is whether the sector will be able to deliver the items procured (and hence the economic impact) in a timely manner. To assess this ability it is necessary to examine the capacity of a sector.
This study considers two capacity measures: the CBI firms working below capacity measure, and the EUROSTAT capacity utilisation measure. Due to the small sample size of the CBI survey, the result produced can vary significantly depending on the responses of just one company, therefore to counter this we have used an average value for the past 4 quarters to measure capacity with the CBI measure. For the EUROSTAT measure the most recent, January 2009, value is used. Unfortunately, capacity information is only available for 7 of the sectors examined in this study26.
Given the questions asked by each survey, the CBI survey measures the percentage of firms operating below capacity and the EUROSTAT survey measures the current level of capacity utilised, a high CBI value and a low EUROSTAT value suggest the sector has spare capacity. This area is represented graphically as the shaded area in Figure 7-1.
26 The seven sectors are defence, apparel, motor vehicles, pharmaceuticals, electrical components, steel, and machine tools.
Key Points
• In order for an increase in Government procurement to have an immediate impact on the economy a sector must have sufficient spare capacity to absorb the additional demand.
• Combining two different capacity measures, the defence industry ranks as the industry
most able to absorb additional demand.
Figure 7-1 Sector capacity
72%
74%
76%
78%
80%
82%
84%
86%
88%
90%50% 60% 70% 80% 90% 100%
Source : OE/EUROSTAT/CBI Firms working below capacity (Median = 74%)
Capacity utilisation (%) (Median = 80.9%)
Apparel
Defence
Pharmaceuticals
Motor VehiclesSteel
Machine tools
Electrical components

31
Economic case for investing in the UK defence industry
As Figure 7-1 shows, the combined results for the capacity level of the defence industry present a strong case that the defence industry has the capacity to rapidly deliver. The average of the past 4 quarter CBI Industry surveys found that 84 percent of all defence companies reported that they were operating below capacity, a finding that was only surpassed by Motor Vehicles and Apparel, which reported 90 and 86 percent, respectively, of firms operating under capacity. The latest findings of the EUROSTAT industry survey show that the defence industry is operating at 73.1 percent of capacity, a figure lower than all of the other sectors presented. In combination, these findings show that the defence industry is in a position where it should be able to rapidly absorb additional demand, providing timely economic returns to procurements. The presence of spare capacity could be seen as an indication of inefficiency. However, any sector which relies on un-even and large orders inevitably needs to keep spare capacity to cope with the sudden influx of demand that stems from these orders. The defence industry is a good example of a sector that does not experience constant demand. As seen above, the MoD is the largest single consumer of defence goods, and places large orders in an irregular manner.
32
Economic case for investing in the UK defence industry
8. Long-term benefits
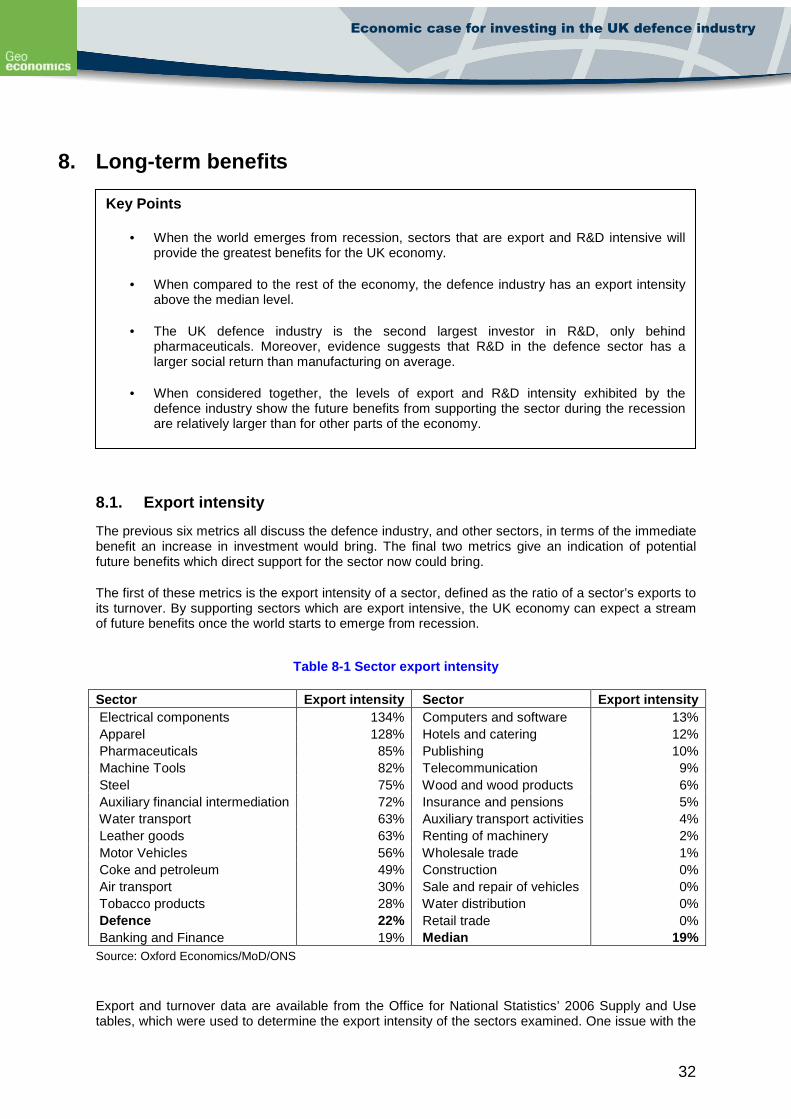
8.1. Export intensity
The previous six metrics all discuss the defence industry, and other sectors, in terms of the immediate benefit an increase in investment would bring. The final two metrics give an indication of potential future benefits which direct support for the sector now could bring.
The first of these metrics is the export intensity of a sector, defined as the ratio of a sector’s exports to its turnover. By supporting sectors which are export intensive, the UK economy can expect a stream of future benefits once the world starts to emerge from recession.
Table 8-1 Sector export intensity Sector Export intensity Sector Export intensity Electrical components 134% Computers and software 13% Apparel 128% Hotels and catering 12% Pharmaceuticals 85% Publishing 10% Machine Tools 82% Telecommunication 9% Steel 75% Wood and wood products 6% Auxiliary financial intermediation 72% Insurance and pensions 5% Water transport 63% Auxiliary transport activities 4% Leather goods 63% Renting of machinery 2% Motor Vehicles 56% Wholesale trade 1% Coke and petroleum 49% Construction 0% Air transport 30% Sale and repair of vehicles 0% Tobacco products 28% Water distribution 0% Defence 22% Retail trade 0% Banking and Finance 19% Median 19% Source: Oxford Economics/MoD/ONS
Export and turnover data are available from the Office for National Statistics’ 2006 Supply and Use tables, which were used to determine the export intensity of the sectors examined. One issue with the
Key Points
• When the world emerges from recession, sectors that are export and R&D intensive will provide the greatest benefits for the UK economy.
• When compared to the rest of the economy, the defence industry has an export intensity
above the median level.
• The UK defence industry is the second largest investor in R&D, only behind pharmaceuticals. Moreover, evidence suggests that R&D in the defence sector has a larger social return than manufacturing on average.
• When considered together, the levels of export and R&D intensity exhibited by the
defence industry show the future benefits from supporting the sector during the recession are relatively larger than for other parts of the economy.

33
Economic case for investing in the UK defence industry
data that needs to be brought to attention is the export intensity values for the Apparel and Electrical Components sector, which are both greater than 100 percent. An export intensity value above 100 percent suggests that the industry is engaged in re-exporting finished products, this is not unusual as importers may use the UK as a gateway to the European Union. However, the scale of this possible re-exporting in the data is surprising.
The defence industry’s27 export intensity of 22 percent ranks 13th out of the sectors under comparison, slightly higher than banking and finance (19 percent) and slightly below tobacco products (28 percent) (Table 8-1). Pharmaceuticals, steel and motor vehicles all record export intensities greater than the defence sector, at 85, 75 and 56 percent respectively. It should also be noted that electrical components which tops the list is also likely to include defence manufacturers exporting electrical equipment.
8.2. R&D intensity
The final metric used in this study is the level of research and development (R&D) activities conducted by a sector. Alongside a high-skilled workforce, R&D is central to the UK’s knowledge economy, therefore sectors engaging in a high level of R&D compared to turnover (the sector’s R&D intensity) are crucial to the maintenance and enhancement of the UK knowledge economy. By supporting these sectors, the Government will ensure that the UK continues to produce world-leading R&D.
The UK’s Department for Business, Innovation and Skills (BIS) details R&D intensity as a percentage of sales for all but one of the sectors examined in this study28. Oxford Economics has used the latest, 2007, R&D intensity values provided by BIS29 as its metric of R&D intensity. It is worth noting that BIS reported that there have been changes in the method of calculation in recent years. Therefore it is difficult to compare results between years. In addition the Scoreboard results for any one year should be only used as a broad comparator.
The UK’s defence industry30 possesses a high level of R&D intensity, with R&D activities amounting to 4 percent of sales (down from over 8% in the previous 2 years). Such a high intensity of R&D is not surprising; often the products produced by the UK defence industry are world-leading, relying on the creation new technologies. In comparison to other UK sectors, the defence industry falls behind only pharmaceuticals and computers and software (Table 8-2). The gap between defence R&D intensity and that of pharmaceuticals’ R&D intensity (15 percent) is expected, due to the development intensive nature of the pharmaceutical sector. The conclusion that can be drawn from Table 8-2 is that the defence industry is a central part of the UK’s knowledge economy.
27 As the only accurate export data available for the defence industry are provided by DASA, the definition of defence industry used here is consistent with that used by DASA. 28 The sector not included is Hotels and Catering. 29 It should be noted that the BIS measure of R&D intensity does not take into account the location of the R&D activity. For example, R&D expenditure may be recorded in UK accounts but conducted in another country. Furthermore, it does not include R&D activities funded by the UK Government. 30 Aerospace and defence combined as it is not possible to identify R&D separately from company data.

34
Economic case for investing in the UK defence industry
Table 8-2 Sector R&D intensity Sector R&D intensity Sector R&D intensity Pharmaceuticals 15% Steel 1% Computers and software 7% Construction 0% Defence 4% Coke and petroleum 0% Motor Vehicles 4% Sale and repair of vehicles 0% Electrical components 3% Wholesale trade 0% Telecommunication 2% Retail trade 0% Publishing 2% Water transport 0% Machine Tools 2% Air transport 0% Apparel 1% Auxiliary transport activities 0% Leather goods 1% Renting of machinery 0% Tobacco products 1% Wood and wood products 0% Insurance and pensions 1% Water distribution n/a Auxiliary financial intermediation 1% Hotels and catering n/a Banking and Finance 1% Median 1% Source: Oxford Economics/BIS
A previous study by Oxford Economics conducted an econometric analysis of the spillovers from R&D expenditure by sector31. This study examined the private and social returns to R&D spending32 created by R&D activity in seven sectors, selected due to their high levels of R&D activity33. The analysis performed and the results generated (Table 8-3) in this study add a further dimension by which to consider the impact R&D by each sector has on the economy. By taking the aerospace sector as being indicative of the defence industry, it is possible to conclude that the low level of private return from R&D spending found in the defence industry suggests a weaker system of patenting than, for example, the chemicals sector. The defence sector creates a high level of spillover return, 59 percent of any R&D expenditure, placing the defence industry comfortably second out of the sectors studied. The combination of private and spillover returns lead R&D activities in the defence sector to generate a social return of 69 percent, second only to precision equipment (72 percent).
Table 8-3 Overall long-run impact from an increase in UK R&D by sector
Private return % Spillover return % Social return % Aerospace 10% 59% 69% Machinery and equipment 6% 0% 6% Motor vehicles 12% 0% 12% Radio and television equipment 20% 34% 54% Chemicals (inc pharma) 25% 40% 65% Precision equipment 8% 64% 72% Manufacturing 18% 29% 47% Source: Oxford Economics (2006)
31 Oxford Economics (2006) Econometric Analysis of R&D Spillovers by sector. 32 The private return to R&D spending is the boost to each sector’s productivity that results from its own R&D spending; the social return to R&D spending is the boost to whole-economy productivity that results from each sector’s R&D spending. The difference between the social and the private returns to R&D spending is the spillover benefit of each sector’s R&D spending. 33 The seven sectors studied were: aerospace, machinery and equipment, motor vehicles, radio and television equipment, chemicals (including pharmaceuticals), precision equipment, and general manufacturing.

35
Economic case for investing in the UK defence industry
In terms of this study, these results demonstrate that any R&D activities that the defence industry undertakes (as indicated by aerospace) as a result of an increase in Government investment would provide a greater boost to economy-wide productivity than an equivalent investment in other sectors.
Figure 8-1 Sector export and R&D intensity
8.3. Summary
Industries that are export and R&D intensive will provide significant benefits to the UK economy once the world moves out of recession. Figure 8-1 presents the export and R&D intensities of the various sectors considered by this study. Sectors located within the shaded quarter are above average in both their export and R&D intensities, and will, therefore, provide significant benefits to the UK economy in the future. The figure shows that nine sectors are located within the shaded quarter, and can be designated as providing above-average potential future benefits. The nine sectors are: motor vehicles, pharmaceuticals, electrical components, machine tools, apparel, defence, tobacco products, leather goods, and auxiliary financial activities. The strength of these sectors once the UK emerges from recession will play a significant part in determining the future benefits that are accrued from exports and R&D activities. If these sectors emerge weakened from the recession resources that could be devoted to generating benefits for the UK, through R&D and exports, may instead have to be used to rebuild capacity and international competitiveness. Therefore Government support for these sectors can reduce the losses to future export and R&D benefits that might occur due to the recession.
0%
20%
40%
60%
80%
100%
120%
140%
160%
0% 2% 4% 6% 8% 10% 12% 14% 16%
Export Intensity (Median =19%)
Source : Oxford Economics/BERR/ONS R&D intensity (median =1.1%)
Pharmaceuticals
Computers & software
Electrical components
Apparel
Defence
Motor vehicles
TelecommsBanking

36
Economic case for investing in the UK defence industry
Case study: The Lynx Family of Helicopters
The Lynx helicopter was originally produced by Westland Helicopters, now AgustaWestland, a Finmeccanica subsidiary. It first entered service in the 1970s with both the Army and the Royal Navy. Since then, developments of the original Lynx in terms of engines, blade and tail rotor technology and structural design have made it one of the UK’s best selling aircraft in export markets with 422 sold to 16 countries. Its roles include anti-submarine warfare, reconnaissance, medical evacuations, attack, troop transport and logistic support. With this backdrop of success, development of the Lynx family continues at AgustaWestland’s Yeovil plant.
The “Future Lynx” – now known as the Wildcat – is a completely new aircraft. It embraces the latest design and engineering techniques. In particular, the use of monolithic machining has seen the re-designed fuselage part-count reduced by 80% compared with its predecessors. Equally, 3-D digital modelling has allowed for fast, accurate assembly. Wildcat also offers more advanced digital avionics and integrated mission equipment than its predecessors. The MoD placed a £1 billion order for the Future Lynx in 2006, with through-life support being in addition to this cost. The Wildcat is due to enter operational service with the Army in 2014 and with the Royal Navy in 2015.
The potential for export sales of the naval version of the Wildcat is currently being pursued. In the past, the role of “home market backing” has been particularly critical in making export sales. The fact that the Lynx family has seen service with the Royal Navy in operational theatres from the Falklands to the Gulf has provided a strong indicator of quality to potential export markets.
The Wildcat programme currently employs some 850 people across the UK. The continuation of domestic production means that deep understanding of the aircraft and its systems remains on-shore and is continually being developed. As a result, this expertise can be applied to optimising aircraft availability to the front line and in providing rapid upgrade to meet unexpected operational challenges. Such flexibility can sometimes be lost with a reliance on imports. For example, the Chinook Mk 3 is still being retro-fitted to fly in accordance with UK regulations, while imported software of “unknown provenance” can be an issue for other platforms.
Recent technological innovations associated with Wildcat include the use of highly advanced rotor blades, which allow for increased performance, the use of cutting-edge sensor equipment allowing for improved vision in dusty and dark conditions and e-scan radar. The blade technology has clear applications to civil aviation, while the sensor technology could find applications in roles such as air ambulance services. E-scan radar also has a variety of potential applications, such as the identification of small craft for border protection and law enforcement roles. Such innovations, and their export potential, would likely be lost to the UK in the absence of the Wildcat programme.
The existence of high technology aerospace programmes has also allowed for indirect spill-over, such as the development of a field training programme for the Army in the use of the Bowman radio. AgustaWestland personnel have also advised on disaster management training for organisations such as the NHS. There have also been developments in supply chain management associated with Wildcat. Integrated operational support schemes have been formed in conjunction with suppliers. There has been a move to embed suppliers within teams and towards a risk-sharing approach, consistent with the Defence Industrial Strategy.
Domestic support for programs such as Wildcat is increasingly important for systems as well as the platform itself. For example, the provision of high foreign content on a helicopter can often require foreign authorisation if export sales are to be made. So, if integrated packages are not developed domestically, there may be a loss of export market flexibility and possibly of exports themselves.
The move to through-life support for Wildcat also requires the maintenance of core competencies within the UK. Through-life support also tends to favour domestic sourcing of components. For example, equipment upgrades become much more difficult if a UK capability is not maintained, as there is often a mismatch between foreign requirements and domestic markets.

37
Economic case for investing in the UK defence industry
9. The regional distribution of the defence sector
Within this sub-section we identify the regional distribution of the defence sector, using the ‘production’ based definition outlined in earlier sections. We estimate the regional distribution of this sector as a whole and also the combination of direct and indirect employment generated by additional defence spending.
To estimate employment in the defence sector for regions and their constituent local authorities we use the Ministry of Defence’s accounts of the value of their purchases classified by SIC (2003) codes (UK Defence Statistics, 2008). For each of these codes the proportion of business turnover represented by MoD purchases is calculated. This is taken as an initial estimate of the proportion of employment within that code reported by the Annual Business Inquiry (2007) that is directly contributed by defence activities.
To allow for export activity and to reconcile these initial employment estimates with the MoD’s estimates of employment generated by their equipment purchases and from export activity within the firms involved in defence equipment procurement, the total employment distributed over the SIC (2003) codes is adjusted to match the MoD’s estimates of direct employment generated by their purchases combined with additional export activity (105,000 jobs overall).
The map in Figure 9-1 shows the contribution of the defence sector to total employment in local authorities throughout Britain. Within the map, the importance of defence activities to a significant number of local economies in the South West of England, South Wales and parts of North West England is clear.
Key Points
• In a significant number of local authorities, particularly in the South East and South West of England, more than one in ten manufacturing jobs are directly generated by defence sector activities.
• Within England, 64 percent of the estimated employment of the defence sector falls within
the six ‘lagging regions’ whose economic performance the government is committed to improving as part of its Public Service Agreement (PSA 7).
• 71 percent direct and indirect employment gains from the procurement of defence
equipment are located in these six ‘lagging’ regions.

38
Economic case for investing in the UK defence industry
Figure 9-1 Estimated defence industry employment in production activities (per thousand total jobs)

39
Economic case for investing in the UK defence industry
Figure 9-2 Estimated defence industry employment in production activities (percentage of manufacturing jobs)

40
Economic case for investing in the UK defence industry
Given the ‘production’ focus of the definition of defence activities used in this study, a more focused view of the contribution of the defence sector to manufacturing employment in local economies can be seen in Figure 9-2. Within the local authorities with the darkest shading on the map, more than one in ten manufacturing jobs are associated with direct employment in defence activities. Once again, the importance of defence to economies in the South West, South Wales and the North West can be seen, but, in addition, the important contribution of defence to manufacturing employment in an arc of local areas to the north and west of London becomes clearer, as does its contribution to economies in Central Scotland.
The contribution of defence-related production activities to manufacturing employment within Government Office Regions can be seen in Figure 9-3. Its importance to the South West regional economy is clear – nearly one in twelve manufacturing jobs in the region are estimated to fall directly within the defence sector. In the South East (outside Greater London) it is also a significant contributor to the region’s manufacturing base.
The Policy Context
A key arena for considering the contribution of the defence sector to ‘regional balance’ within the country is the government’s repeated commitment to reducing the gap in prosperity and growth between the ‘core’ of southern England and the rest of the country.
At the regional level, the government has focused on two objectives in its Regional Economic Performance Public Service Agreement (PSA). The latest version, PSA Delivery Agreement 734, sets out the dual objectives of:
• Improving the economic performance of all English regions
• Reducing the gap in economic growth rates between regions
34 HM Government (2007) PSA Delivery Agreement 7, http://www.hm-treasury.gov.uk/media/5/E/pbr_csr07_psa7.pdf
Figure 9-3 Regional distribution of estimated defen ce employment (% in manufacturing jobs)
0.0 2.0 4.0 6.0 8.0 10.0
London
Yorkshire and The Humber
West Midlands
East Midlands
North East
Wales
East
North West
Scotland
South East
South West
Source : Geoeconomics Percentage

41
Economic case for investing in the UK defence industry
PSA Delivery Agreement 7, announced in October 2007, is the joint responsibility of HM Treasury, the Department for Communities and Local Government, and the Department for Business, Enterprise and Regulatory Reform. The government’s latest evaluation of progress towards the PSA objectives – and its proposals to strengthen local and regional governance in economic policy – was published in the July 2007 Review of Sub-National Economic Development and Regeneration (“the Review”)35.
The Review indicated that the objective of reducing the gap in growth rates between regions would be met if the difference in growth rates between the three regions with above average GVA/head (London, South East, and East of England) and all remaining English regions was smaller in the period 2003 to 2012 than it was between 1990 and 2002.
It is the task of Regional Development Agencies within each Government Office Region to develop and implement policies that will achieve this objective. The strategies of virtually all of the RDA’s – particularly those in the South West, Midlands and the North - include the support of manufacturing activity as a key route to raising productivity, generating innovation and securing a globally competitive economic base for their regions.
A typical view is contained in the manufacturing policy statement of Advantage West Midlands – the RDA with responsibility for the West Midlands Region.
“Manufacturing is a key part of the business theme in the West Midlands
Economic Strategy. It is one of the region’s major strengths and is essential
for its future prosperity and we must build on it. It is the most productive of
the major sectors and the biggest creator of wealth. It accounts 27 percent
of regional Gross Value Added and generates GVA/employee 30 percent
above the regional average. It is a major contributor to productivity growth
and a lead driver of innovation.” Advantage West Midlands
Although the effects of the current recession on the structure of economic activity both nationally and regionally are still uncertain, it is likely that manufacturing will be seen in many regional economic strategies as an important counter-balance to over-reliance on the job generating capacity of finance and business services.
The manufacturing ‘problem’, however, in many regional economies is that it is a substantial and continuing source of job losses. This is clear in Figure 9-4. In the years between 2000 and 2008 the West Midlands lost 180,000 manufacturing jobs while the North West lost about 130,000. The forecasts for the period from 2008 to 2020 suggest that further substantial job losses should be expected. Jobs generated or safeguarded by the defence sector will play an important part in offsetting the downward trajectory of manufacturing employment.
35 HM Treasury, Department for Business Enterprise and Regulatory Reform, Department for Communities and Local Government (2007) Review of sub-national Economic Development and Regeneration, http://www.hm-treasury.gov.uk/media/9/5/subnational_econ_review170707.pdf

42
Economic case for investing in the UK defence industry
They will do it strongly in the regions identified by the government as those whose levels of employment and productivity need to be improved in order to ‘catch up’ levels of prosperity in the southern core. Almost two thirds (64 percent) of estimated jobs in the manufacturing part of the defence sector fall in these targeted regions within England.
Table 9-1 Proportion (%) of employment in compariso n manufacturing sectors falling in PSA 7 target regions
Defence Apparel Pharmaceuticals Steel Machine
tools Electrical
components Motor
vehicles
PSA7 ‘Target
Regions’ 64 71 55 80 77 60 77
Rest of England 36 29 45 20 23 40 23
Alongside the manufacturing sectors used as comparators earlier in the report, the distribution of defence employment between the PSA7 target regions and the rest of the country shows a moderate level of concentration in the targeted regions. It clearly has a stronger contribution to these target regions than pharmaceuticals, with its strong South Eastern concentrations, but is less concentrated in the North and Midlands than steel, machine tools and motor vehicles.
Figure 9-4 Regional distribution of actual job losses (2000 to 2008) and forecast job losses (2008 to 2020) in manufacturing
0 50 100 150 200
North East
Wales
South West
Yorkshire & Humber
Scotland
Eastern
Greater London
East Midlands
South East
North West
West Midlands
Forecast
Actual
Job lossesSource : Geoeconomics

43
Economic case for investing in the UK defence industry
Table 9-2 Proportion (%) of employment in compariso n non-manufacturing sectors falling in PSA 7 target regions
Defence Telecommunications Construction Banking and
Finance
PSA7 ‘Target Regions’ 64 44 61 44 Rest of England 36 56 39 56
A much greater difference is apparent, however, when the regional distribution of defence employment is compared with the non-manufacturing activities, and particularly the key services of Telecommunications and Banking and Finance. Both of these show a significantly higher level of concentration in the ‘core’ area of London and the greater south east area with a correspondingly smaller share of jobs in the targeted regions.
Estimated regional distribution of direct and indir ect employment
This section of the report considers the regional impact of both direct and indirect employment generated by an additional £100 million of spending on defence equipment within the national economy. National gains in manufacturing activity are allocated to regions by their share of estimated defence employment within the sectors used in the underlying input-output analysis. The level of resolution of these sectors differs slightly from that used in the MoD’s report of their procurement expenditure which has a small effect on the regional balance of defence employment reported in Table 9-1 above.
Figure 9-5 shows the regional shares of the total direct employment effects of the £100m expenditure. The South East and South West are, once again, the most prominent regions, followed by the North West. Figure 9-6, however, shows the gains from indirect employment generation. The key difference between the two charts is the change in the position of the West Midlands. The strength of that region’s position as a component supplier means that its share of indirect employment generation arising from the £100m initial expenditure is approximately twice as large as its share of direct effects.
This has important implications for the balance of total employment gains between the PSA 7 target regions and the rest of the country. If both direct and indirect employment gains from the purchasing of defence equipment are combined, 71 percent of gains within England fall in the six ‘lagging regions’ whose economic performance the government is committed to improving. These regions contain only 56 percent of total employment.

44
Economic case for investing in the UK defence industry
.
To sum up: in a significant number of local authorities, particularly in the South West and South East of England, more than one in ten manufacturing jobs are directly generated by the production activities of the defence sector.
Within England, 64 percent of the estimated employment of the defence sector falls within the six ‘lagging regions’ whose economic performance the government is committed to improving as part of its Public Service Agreement (PSA 7).
If both direct and indirect employment gains from the purchasing of defence equipment are combined, 71 percent of gains within England fall in these six ‘lagging regions’. These regions contain only 56 percent of total employment.
Figure 9-5 Regional shares of direct employment gai ns (%)
Figure 9-6 Regional shares of indirect employment g ains (%)
0 5 10 15 20 25
London
North East
Yorkshire and The Humber
Wales
West Midlands
East Midlands
Scotland
East
North West
South West
South East
PercentageSource : Geoeconomics
0 5 10 15 20
London
North East
Wales
Scotland
East
East Midlands
Yorkshire and The Humber
South West
North West
South East
West Midlands
PercentageSource : Geoeconomics

45
Economic case for investing in the UK defence industry
10. Conclusion
The previous chapters have presented four rationales, using eight measures, for the Government to support a sector: the monetary impact, the labour market impact, the potential losses, the future benefits, and the capacity of a sector to fulfil orders rapidly. While each of these rationales can be used to argue for increased Government support, a comprehensive economic case for increased support must take account of all measures simultaneously. When considering the overall economic case a decision must be made as to whether any measures have greater importance than others. In this study we believe that no measure can be seen as being more important than another, and therefore we treat each measure equally.
To assess the economic case of each sector we have devised a system of ranking, which utilises the average ranking of a sector for seven measures: GDP multiplier, jobs supported, share of employment that is highly-skilled, the R&D intensity, the export intensity, the taxation revenues, and the capital intensity. The capacity measure used in this study is not included in calculating the average ranking due to the small number of sectors for which it is available.
Table 10-1 presents the rankings for each sector for each measure; 1 indicates the sector ranks 1st, and 27 ranks 27th. The outcome of the table is that the strongest economic case (excluding capacity considerations) for increasing Government investment in order to stimulate the economy can be made for the publishing, machine tools and defence sectors, as these sectors have the three lowest average rankings (10.1, 10.4 and 10.6 respectively). However, once capacity is taken into account, the case for supporting the defence sector is strengthened, as it has greater spare capacity than the other sectors.
This study has examined a wide range of benefits which can accrue from an increase in Government investment within a sector. While immediate impacts are necessary to help the economy exit recession, any investment must also take into account its possible longer term impacts, through its support of R&D and export intensive industries. To be effective an investment needs to be aimed at industries that can absorb an increase in demand; if an industry is running at full capacity the increased investment will merely add to future orders, and any immediate benefits from investment will be lost. As a result investments need to be targeted in such a way that their positive impact is balanced between short term and long-run benefits, and a sector has the capacity to ensure that its benefits are felt immediately and are not delayed until capacity becomes available.
Key Points
• For a comprehensive case all measures must be considered together.
• The UK defence industry performs well in all measures relative to other sectors without ranking first in any measure.
• When all measures are considered together, the defence industry presents a powerful
case for Government support relative to other sectors of the economy. In particular, the industry is a substantial investor in R&D and supports a significant number of highly skilled jobs.

46
Economic case for investing in the UK defence industry
Table 10-1 Economic case overview
Ran
k
GD
P
Mul
tiplie
r
Jobs
su
ppor
ted
% H
ighl
y sk
illed
R&
D
inte
nsity
Exp
ort
inte
nsity
Dire
ct
Taxa
tion
Cap
ital
inte
nsity
Ave
rage
R
ank
(exc
ludi
ng
capa
city
)
Cap
acity
Publishing 1 9 10 12 7 17 4 12 10.1 6Machine Tools 2 15 9 14 8 4 6 17 10.4 7Defence 3 13 12 8 3 13 12 13 10.6 3Air transport 4 8 14 10 17 11 11 3 10.6 n/aActivities auxiliary to financial intermediation 5 6 16 9 11 6 2 25 10.7 n/aComputers & software 6 11 13 1 2 15 10 23 10.7 n/aApparel 7 16 5 19 9 2 15 10 10.9 3Pharmaceuticals 8 23 25 2 1 3 20 8 11.7 6Water transport 9 2 18 11 17 7 25 5 12.1 n/aSupporting & auxiliary transport activities 10 1 8 18 17 21 16 6 12.4 n/aBanking and Finance 11 19 17 5 14 14 7 n/a 12.7 n/aElectrical components 12 26 19 13 5 1 14 11 12.7 9Motor Vehicles 13 7 20 15 4 9 21 15 13.0 5Construction 14 4 3 24 16 24 3 24 14.0 n/aHotels and restaurants 15 17 2 25 26 16 9 4 14.1 n/aSteel 16 10 21 16 15 5 18 16 14.4 9Leather 17 25 7 17 9 8 27 9 14.6 7Insurance and pensions 18 3 15 6 11 20 22 25 14.6 n/aTelecommunication 19 24 23 7 6 18 19 7 14.9 n/aRetail trade 20 18 1 23 17 27 1 20 15.3 n/aWholesale trade 21 5 11 20 17 23 13 22 15.9 n/aWood products 22 12 4 26 25 19 8 18 16.0 n/aSale of motor vehicles 23 14 6 27 17 25 5 19 16.1 n/aDistribution of water 24 27 24 3 26 26 17 1 17.7 n/aManufacture of coke, etc 25 22 27 4 17 10 26 21 18.1 7Renting of machinery 26 20 22 22 17 22 23 2 18.3 n/aTobacco 27 21 26 21 11 12 24 14 18.4 7Rank 1=first, 27=last