Embed Size (px)
Citation preview

The Economic Consequences of Being Denied an Abortion*
Sarah Miller† Laura R. Wherry‡ Diana Greene Foster§
May 12, 2021
Abstract
Restrictions on abortion are pervasive, yet relatively little is known about the financial and eco-nomic impact of being denied an abortion on pregnant women who seek one. This paper evaluatesthe economic consequences of being denied an abortion on the basis of the gestational age of thepregnancy. Our analysis relies on new linkages to administrative credit report data for participantsin the Turnaway Study, the first study to collect high-quality, longitudinal data on women receivingor being denied a wanted abortion in the United States. Some women had pregnancies close to thefacility’s gestational age limit, but below it, and received a wanted abortion (Near Limit Group).A second group of women had pregnancies just over the facility’s gestational age limit and wereturned away without receiving an abortion (Turnaway Group). We link study participants to tenyears of credit report data including several years prior to their recruitment into the study. Usingthese data, we compare differences in credit report outcomes for the two groups of women overtime using an event study design. We find that the trajectories for these outcomes are similar forthe two groups of women prior to the abortion encounter. However, following their visit to theabortion provider, we find evidence of a large and persistent increase in financial distress for thewomen who were denied an abortion that is sustained for several years. Being denied an abortionincreases the amount of debt 30 days or more past due by 78 percent and increases negative publicrecords, such as bankruptcies and evictions, by 81 percent. We conduct additional analyses thatuse a regression discontinuity design to compare outcomes for women just above and just belowthe gestation limit at each clinic and find results that are consistent with the event study analyses.We explore the mechanisms behind these findings by taking advantage of existing survey data col-lected for the study participants and compare the effects sizes we document to those experienced bysimilar women following a “typical” birth. Our results highlight important financial and economicconsequences of restrictions on abortion access.
*We would like to thank Ted Joyce, Jason Lindo, Heather Royer, and David Slusky, and seminar participants at theASHEcon and ASSA annual meetings, Harvard University, NBER Summer Institute, and the University of Michigan fortheir helpful comments. We also thank Cathleen Kelmar for her help in linking to Experian records. This study was sup-ported by research and institutional grants from the Wallace Alexander Gerbode Foundation, the David and Lucile PackardFoundation, The William and Flora Hewlett Foundation, and an anonymous foundation. The authors thank Jasmine Powell,Elizabeth Gonzalez, and Rana Barar for study coordination and management. Laura Wherry also gratefully acknowledgesnon-financial support from the California Center for Population Research at UCLA, which receives core support (R24-HD041022) from the Eunice Kennedy Shriver National Institute of Child Health and Human Development.
†University of Michigan Ross School of Business and NBER. Email: [email protected]‡New York University Robert F. Wagner Graduate School of Public Service. Email: [email protected]§University of California, San Francisco. Email: [email protected]

In the United States, restrictions on access to abortion are pervasive. States enforce a variety of reg-
ulations such as banning abortions after a certain gestational age of the pregnancy, requiring women
to receive state-written information about abortion, imposing a waiting period to receive an abortion,
and requiring parental consent for minors seeking abortion. In addition, some states have detailed
requirements on the manner and setting in which an abortion is permitted. These include bans of the
“telemedicine” prescribing of abortion medication, requirements that providers have admitting priv-
ileges to local hospitals, and detailed structural standards that must be met by the facility providing
the abortion (Nash et al., 2013). These regulations effectively reduce access to abortions by limiting
the definition of qualifying pregnancies and reducing the number of available providers. In addition,
the prevalence of these restrictions is increasing over time: between 2011 and 2017, 401 such restric-
tions were enacted, more than double the 189 that had been enacted in the entire preceding decade
(Nash et al., 2013, 2018). Recent research shows that these regulations appear to substantially decrease
access to and use of abortions.1 However, despite the prevalence of such restrictions, the impact of
these laws on the women for whom these restrictions bind is not well understood.
This paper provides the first causal evidence on the economic and financial consequences of being
denied an abortion by linking new high quality administrative data to data on women who sought,
but did not all obtain, abortions at facilities across the U.S. It builds on the Turnaway Study, which
is a unique source of longitudinal data from the field of public health on women’s experiences when
denied an abortion due to gestational limits. The study recruited women seeking abortions at 30
different clinics in 21 states. Each of these clinics had the latest abortion gestation limit within 150
miles, making it difficult for women to receive abortions elsewhere if denied based on a gestational
limit. The study collaborated with participating clinics to enroll women who were above the gestation
limit (by up to 3 weeks) for each clinic, and were turned away without receiving the abortion they
sought (we refer to these women as the “Turnaway” group). The majority of these women, 68 percent,
ended up giving birth; 32 percent either obtained abortions elsewhere or experienced a miscarriage
or stillbirth.2 Other women who were within the gestation limit, but only by up to two weeks, and
received a wanted abortion were recruited as a comparison group (the “Near Limit” group). The
Study surveyed these two groups of women over a five year period, as well as a group of women who
sought and received abortions early in their pregnancies (during the first 14 weeks) for an additional
1See, e.g. Colman et al. (2011); Fischer et al. (2018); Grossman et al. (2014); Lindo et al. (2019); Quast et al. (2017); Venatorand Fletcher (2019) and Section 1 for further discussion.
2These percentages are based on all women in the Turnaway Study for whom we have follow-up information about theoutcome of the pregnancy. For some women, no such follow-up information is available.
1

point of comparison.
We take advantage of the success of the Turnaway Study in identifying and recruiting this hard to
reach population and link the study participants to ten years of credit report data. These data contain
high-quality administratively collected information that may be used to study financial health. They
allow us to observe measures of financial stress such as lateness in paying bills, having bills sent to
collection agencies, and serious adverse financial events like evictions and bankruptcies. They also
allow us to observe markers of financial self-sufficiency and resiliency, such as taking out a mortgage
or having access to a reserve of credit.
This new linkage to administrative data offers important advancements over previous studies
using the Turnaway Study data. First, we are able to link the study participants to credit report data
that predate the abortion encounter when they were recruited into the study. This allows us to observe
the women’s trajectories of financial outcomes both before and after the pregnancy. In the original
study, no data from prior to the abortion encounter was available, making it impossible to assess
whether the Near Limit group had similar trends in outcomes prior to the pregnancy. Using our newly
linked data, we are able to test the validity of the Near Limit group as an appropriate comparison
group for women who were denied an abortion by comparing the evolution of pre-study outcomes for
the two groups of women. In addition, having both pre- and post-data on financial well-being allows
us to document the change in individual well-being resulting from the abortion denial for women in
the Turnaway group by including individual fixed effects in our regression models.
Second, this longitudinal administrative data allow us to apply several “causal inference” tech-
niques common to economics to analyze Turnaway study data for the first time. Previous studies
with the Turnaway data largely relied on cross-sectional comparisons across the Turnaway and Near
Limit group, which could be confounded by differences in these groups that predated the abortion
encounter. Using these new data, we estimate an “event study” design that accounts for fixed dif-
ferences across the Near Limit and Turnaway groups. We supplement this main approach by taking
advantage of detailed information on gestational age at the time of the abortion encounter with a
regression discontinuity (RD) design that compares outcomes for women just above and below the
abortion gestation limit at each clinic. These approaches account for any systematic differences in
the two groups of women even prior to the abortion or abortion denial, which could not fully be
addressed in previous Turnaway studies due to data limitations.
Finally, our use of administrative data increases our sample size substantially relative to the origi-
2

nal Turnaway Study and avoids any selection concerns that result from survey non-response. Because
we only require information collected when women were initially recruited into the study to per-
form the linkage, we are able to observe outcomes for women who later opted not to participate in
Turnaway Study survey interviews. This is particularly important when observing long-term out-
comes. While 85 percent of those enrolled in the study completed the first survey, by the end of the
5-year study period only 58 percent responded (Foster et al., 2018). In addition, by using adminis-
trative records rather than self-reported information to study these outcomes, we avoid concerns of
non-random misreporting of economic outcomes often observed in survey data.3
Just as insights and methods from economics may serve to further advance findings from the
Turnaway Study, our use of rich and detailed data on the experiences of women seeking abortion can
increase our understanding of the impact of abortion policy in the field of economics. To date, studies
of the impact of abortion restrictions within economics have relied on aggregated, state- or county-
level data for analysis, without information on which women actually sought, and were denied, an
abortion. Since these women represent only a small fraction of the total population in any given year,
such studies are limited in their power to detect the effects of abortion restrictions on outcomes other
than childbirth or abortion itself. Furthermore, the small number of studies that do attempt to analyze
the impact of abortion restrictions on outcomes other than birth and abortion rates tend to focus on
child outcomes (e.g. Bitler and Zavodny, 2002, 2004). Since women who are denied abortions represent
only a small fraction of the total population in any given year, such studies are limited in their power
to detect the effects of restrictions on downstream outcomes.4 However, better understanding the
effects of restricted access to reproductive health care for this population is important: women who
are close to the cutoff of being denied versus being provided an abortion are exactly the population
most likely to be affected by additional restrictions on access to abortion care at the margin. As local,
state, and federal government actors continue to weigh policies that reduce women’s ability to access
abortion, understanding the impact of such policies on this vulnerable group is critical.
In our main event study approach, we find that, prior to the pregnancy, financial outcomes in
the Near Limit and Turnaway groups evolved very similarly. However, around the time of the birth,
3For example, in a Turnaway Study of socioeconomic outcomes, Foster et al. (2018) found that women living at homewith their parents were less likely to know their household income.
4According to the Centers for Disease Control and Prevention surveillance data, the abortion rate for 2015 was 11.8abortions per 1,000 women aged 15-44, or 1.18 percent of women of reproductive age. Even when focusing on effects amongbirth cohorts, the frequency of abortions relative to births is low (188 abortions per 1,000 live births, see Jatlaoui et al., 2018).In addition, it is likely that a much smaller number of women (and births) are affected by abortion restrictions of the typedescribed above.
3

women in the Turnaway group experienced much higher rates of financial problems, increasing a
summary measure of financial distress by approximately one tenth of a standard deviation. We find
that abortion denial resulted in increases in the amount of debt 30 days or more past due of $1,750, an
increase of 78 percent relative to their pre-birth mean, and in negative “public records” on the credit
report such as bankruptcy, evictions, and tax liens, of about 0.07 additional records, or an increase of
81 percent. These effects are persistent over time, with elevated rates of financial distress observed the
year of the birth and for the entire 5 subsequent years for which we observe the women. Our point
estimates also suggest that being denied an abortion may reduce credit access and self-sufficiency,
particularly in the years immediately following the birth, although these estimates are not always
statistically significant.
In additional analyses, we implement a regression discontinuity (RD) design that compares out-
comes for women just above and below the abortion gestation limit at each clinic. As described later,
complicating factors affect the timing of when women seek abortions; for instance, the rules around
gestation limits are often opaque and women may be unaware of both the cutoffs and the precise
dating of their pregnancy. This suggests that women who seek abortions just above and below gesta-
tion limits might be otherwise very similar. In support of this, we find no evidence of discontinuities
in observable characteristics, or for our outcomes of interest prior to the abortion encounter, at the
gestational cutoff. We do, however, find results consistent with the event study design: we observe
an increase in financial distress following the birth for those women who just met the criteria for an
abortion denial. These effects are largest during the year of the birth and the following three years,
although the confidence intervals for these estimates tend to be large due to their reliance on a small
number of data points around the gestational cutoff.
We also conduct exploratory analyses that use the longitudinal Turnaway Study survey data to
better understand the mechanisms underlying these financial effects, drawing on survey outcomes
originally published in Foster et al. (2018). The Turnaway Study recruited participants at the time
of the abortion encounter, so pre-encounter survey data are unavailable. However, we are able to
examine changes in survey outcomes over time from the initial survey interview, which occurred ap-
proximately one week after the abortion encounter. We implement a difference-in-differences analysis
using these data for our specific study sample. We find that women in the Turnaway group often
cared for an additional child without experiencing an increase in personal or household income. As a
result, their income as a percent of the Federal Poverty Level (FPL) fell over time relative to the Near
4

Limit group. Women in the Turnaway group did not appear to move in with male partners and were
less likely to live with adult family (such as parents or grandparents) or roommates after the initial
interview compared to the Near Limit group; instead, they experienced increases in the incidence of
living alone with a child or children. While we find evidence that public support (via the WIC pro-
gram) increased for the Turnaway relative to Near Limit group in the first year following the birth,
we do not find significant increases in receipt of other public benefits and only marginally significant,
modest increases in the amount of child support received. In sum, our analysis of the survey data
is consistent with abortion denials resulting in greater parental obligations for women without ob-
vious corresponding increases in support from the government, family members, or male partners,
providing some context for the higher financial stress documented in our analysis.
We also explore how the financial stress for women in the Turnaway group who give birth com-
pares to the experience following a “typical” birth among women of similar socioeconomic status. We
do this by examining how financial outcomes change among women in the Near Limit group who
obtained an abortion but went on to give birth later in the study period. We find evidence suggesting
that the financial distress associated with a new baby is greater for women who were denied an abor-
tion and carried an unwanted pregnancy to term than what may generally be experienced by women
with similar socioeconomic characteristics after a birth. This analysis suggests that births occurring
after an abortion denial carry additional economic penalties over and above what is typically expe-
rienced by disadvantaged women when they have a new child, and that greater access to abortion
services and more optimally timed births may result in fewer adverse economic consequences.
Together these analyses offer strong evidence that being denied an abortion has large and persis-
tent negative effects on measures of financial well-being. These results highlight important financial
and economic consequences of restrictions on abortion access. Given that the women affected tend to
be disproportionately low-income, these effects may serve to further reinforce or exacerbate existing
economic inequalities.
1 Background
While abortions are infrequent events when compared to births (e.g. there were 188 abortions per
1,000 live births in 2015, see Jatlaoui et al., 2018), they are not infrequent when observed over the full
length of a woman’s reproductive years. Projections based on the current abortion rate estimate that
nearly 1 in 4 women in the U.S. is expected to have an abortion during her reproductive years (Jones
5

and Jerman, 2017).5 The majority of abortions are surgical procedures (73.1 percent in 2015), although
just over one-quarter (26.8 percent) are nonsurgical abortions that occur at up to 10 weeks of gestation
(Jatlaoui et al., 2018). Nonsurgical abortions use medications to terminate the pregnancy, but require
that a woman know that she is pregnant and receive abortion services early in her pregnancy.6
1.1 Abortion Restrictions and the Women Affected
Women seeking abortions, and abortion providers, face a variety of restrictions in most states. Until
recently, most restrictions involved who could receive an abortion or introduced additional require-
ments for women seeking abortion, such as mandatory waiting periods, counseling, or parental no-
tification and consent laws for minors.7 While there have been a number of studies examining the
effects of mandatory waiting periods or additional barriers to receipt for minors,8 there has been less
attention paid to the consequences of gestational limits for the provision of abortion services.
Yet, gestational limits are among the most prevalent restriction for women seeking abortion ser-
vices; 43 states have gestational limits in place that ban abortions for most women after a certain point
in their pregnancy (Kaiser Family Foundation, 2019). Twenty states ban abortion at the point of fetus
“viability,” which is typically understood to range from 22 to 24 gestation weeks and is determined
on an individual basis at the discretion of the patient’s physician. In contrast, another 20 states have
adopted bans that specify limits from 20 to 24 weeks. An additional 13 states have attempted to ban
abortion earlier in pregnancy or at any time during pregnancy, but these changes have been stopped
by court order (Guttmacher Institute, 2019).9 In addition, each abortion facility sets its own gestational
5Based on data on receipt at abortion clinics, this is likely an underestimate since it does not include abortions obtainedoutside of the formal medical system (Foster, 2017).
6For context, gestation length is measured from the date of women’s last menstrual period with an average menstrualcycle length of 28 days, but ranging from 21 to 45 days. Therefore, women may be unaware that they are pregnant until the6th week of pregnancy or much later if they do not experience symptoms.
7As policies regulating providers have become more common (i.e.“supply-side” regulations), a new literature examinesthe consequences for access to abortion providers and abortion receipt. These papers have primarily focused on the in-troduction of a series of stringent regulations for abortion providers in Texas and document sizeable decreases in abortionrates (see Colman et al., 2011; Fischer et al., 2018; Grossman et al., 2014; Lindo et al., 2019; Quast et al., 2017). More recently,Venator and Fletcher (2019) examine the closure of clinics in Wisconsin under increased provider regulation and find fewerabortions and increased birth rates. Kelly (2019) studies reduced clinic capacity following new regulations for abortionproviders in Pennsylvania and finds evidence of delays in abortion receipt as a result. In some cases, the law changes beingstudied also include restrictions on the patients seeking abortions (i.e. “demand-side” regulations) but the papers in thisliterature often focus on the supply-side components.
8See, for example Bitler and Zavodny (2001); Blank et al. (1996); Colman et al. (2008); Colman and Joyce (2009); Girmaand Paton (2013); Joyce and Kaestner (1996, 2000, 2001); Joyce et al. (2006); Joyce (2010); Levine (2003), for studies of theeffects of the restrictions on abortion timing and receipt and birth rates. A related strand of literature has examined theeffects of changes in public funding for abortion and finds decreased abortion rates under more restrictive funding (see e.g.Blank et al., 1996; Levine et al., 1996).
9All of these gestation lengths are in terms of weeks since the date of the women’s last menstrual period. In addition,there are exceptions for the life and health of the woman, also at the discretion of the patient’s physician. In addition to thestate rules described here, two other states have attempted to ban abortion at 20 weeks and 22 weeks, but these changes
6

limits based on a variety of factors, including physician training and staff comfort (Foster et al., 2013).
This can make it difficult for a woman seeking a later abortion to locate a provider willing to perform
the service.
Descriptive studies document that the women most likely to be affected by these types of bans are
a particularly vulnerable population. A survey of women in Georgia who had an abortion at or after
20 weeks just prior to implementation of a 20-week abortion ban found that over one-half were black,
more than three-fourths were single, and most did not have education beyond high school (Roberts
et al., 2015). In the Turnaway Study, the majority of the women presenting for an abortion with ges-
tational ages close to facility gestational limits had incomes below the poverty line and reported that
they did not have enough money to make ends meet (Foster et al., 2018).
Although the reasons why women seek abortions are complex, interviews with abortion seekers
often find that financial or material concerns and timing are among the most important considerations,
with many women indicating that having a child would interfere with their education or livelihood
(e.g. Biggs et al., 2017; Finer et al., 2005). In addition, women with lower levels of education, and
perhaps more financial difficulties, are more likely to seek an abortion later in the pregnancy (Jones
and Finer, 2012). While a number of factors are associated with delays in seeking abortion, the most
common reasons given are later recognition of pregnancy and the amount of time needed to decide
and make arrangements for the abortion (Finer et al., 2006).10 Women receiving abortions during the
second trimester report a logistical reason (such as difficulty finding an abortion provider or referral
to another clinic) as the primary factor that caused their delay (Drey et al., 2006); they are also more
likely to have concerns about raising the money to cover the cost of the abortion (Finer et al., 2006).
Finally, informational barriers may also contribute to delays in seeking care. Evidence indicates
that women are often not aware of clinic gestational limits for abortion or may be confused about limits
(e.g. Assifi et al., 2016; Lara et al., 2015). This may be exacerbated in states with laws on the books that
are not currently enforced due to ongoing litigation (Tavernise, 2019). Furthermore, women often do
not have accurate dating information regarding their pregnancy since ultrasound methods are used
by providers to determine gestation length.
have also been stopped. See additional details in Guttmacher Institute (2019).10Nearly half of pregnancies in the U.S. are unplanned (Finer and Zolna, 2016); therefore, not knowing one is pregnant is
a common experience among women with irregular periods, those who do not have pregnancy symptoms, and those whohave health conditions that mask pregnancy such as having recently given birth (Drey et al., 2006).
7
1.2 Existing Evidence on Economic Effects of Abortion Policy
Being denied a wanted abortion has the potential to impact the economic and financial security of
individuals in numerous ways. If being denied an abortion results in a woman delaying an abortion
she later obtains, the cost of that abortion may be higher. In some cases, the cost differential between
abortions obtained earlier versus later in the pregnancy can be substantial (Lindo and Pineda-Torres,
2019).11
If the woman is not able to obtain an abortion, she faces additional medical costs associated with
prenatal care, birth, and postpartum recovery, as well as potential lost wages for time missed from
work. There is also a well-documented large and persistent decline in earnings that women experience
on average following the birth of a child (e.g. Adda et al., 2017; Agüero and Marks, 2008; Kleven et al.,
2019; Sandler and Szembrot, 2019), in addition to the many other costs associated with child-rearing,
which typically exceed $9,000 for a family with moderate income (Lino et al., 2017). While social
supports may offset some of these expenses, it may still be the case that denying a woman access to
a wanted abortion could have large, negative, and long-lived effects on her financial and economic
well-being.
Another relevant literature focuses on the effects of motherhood timing on women’s human capi-
tal and career outcomes. A number of these papers find that fertility delay for teenagers (e.g. Ashcraft
et al., 2013; Fletcher and Wolfe, 2009; Klepinger et al., 1999; Schulkind and Sandler, 2019) and women
in their 20s and 30s (Miller, 2011) improves education or labor market outcomes, although the esti-
mates are sometimes modest in size.
Very few studies have examined the economic consequences for women who are denied an abor-
tion or who carry an unwanted pregnancy to term. An older literature focused on abortion legalization
in the 1970s suggests that access to abortion may have important effects on women’s human capital at-
tainment and economic outcomes. Angrist and Evans (2000) document increased rates of high school
graduation, college attendance, and employment for black women under state laws increasing abor-
tion access during this time period. In addition, a number of studies examine changes in childhood
living circumstances for the children born following abortion legalization. For instance, Gruber et al.
(1999) find that the children born after legalization lived in better economic conditions; for instance,
11The median cost of an early medication abortion in 2011-2012 was $500 and a 10-week abortion procedure was $495(Jerman and Jones, 2014). Later first trimester and second trimester abortion procedures can range from $500 to $3,000 ormore (Cowles, 2018). In addition, later abortions require a longer period for the procedure to be performed and for recovery,which may lead to additional expenses in the form of time off of work or child care. There may also be travel-relatedexpenses depending on the location of the provider.
8
they were less likely to live in poverty or receive cash welfare.12 This finding indicates that fewer
disadvantaged women were selecting into parenthood following abortion legalization, but does not
provide any information on how this change affected their economic outcomes or career trajectories.13
A large body of evidence from studies of expanded access to contraception also indicates that
there may be important consequences for women’s outcomes. Many of these studies examine the
effects of increased legal access to the birth control pill in the 1960s and 1970s and document delayed
marriage and increased educational attainment, employment, and earnings among young women as
a result (e.g. Bailey, 2006; Bailey et al., 2012; Goldin and Katz, 2002; Hock, 2008). However, more recent
work by Myers (2017) indicates that it might be the legalization of abortion, rather than access to the
pill, driving the findings in these studies.14 A recent survey of the evidence suggests that the mixed
findings on the magnitude of the pill’s effects may be due, at least in part, to difficulty defining state
policies that were enforced during the period of study and differing interpretations across researchers
(Bailey and Lindo, 2017).
Part of the challenge with this prior body of work and its interpretation is that it estimates the
effects of changes in access to contraception or abortion services under federal or state policies among
women who are expected to be affected (e.g. women of reproductive age). However, these studies
are unable to identify the individual women who are actually denied an abortion or whose use of
contraception changes as a result of these policies. Thus, the authors must rely on cohort-level changes
in women’s outcomes that are associated with the particular policy change or diffusion of birth control
technology being studied. Given that different policy or access changes that affect a woman’s use of
reproductive health services can happen simultaneously,15 and that only a relatively small share of
the female population may actually be affected, this can make it difficult to pinpoint effects that occur
12Ananat et al. (2009) follow these cohorts into young adulthood and show further evidence of improved outcomes. Inaddition, Bitler and Zavodny (2002, 2004) find evidence of decreased child maltreatment following abortion legalization.Donohue and Levitt (2001), Joyce (2004), and Joyce (2009) examine the question of whether the change in the compositionof births following abortion legalization led to lower rates of crime. More recently, Sun (2019) focuses on the older siblingsborn just prior to abortion legalization who then experienced smaller family sizes in areas with abortion service roll-out. Hefinds evidence of better living circumstances and significant improvements in the long-term outcomes for these children,with gains in both human capital attainment and economic self-sufficiency as adults.
13However, follow up work has examined the effects on fertility over the lifespan, indicating that the reduction in birthswas permanent for many women (i.e. they remained childless and did not just delay childbearing, see Ananat et al., 2007).
14Joyce (2013) also argues that the legalization of abortion is a potentially important confounder in this literature, althoughBailey et al. (2013) discusses how findings tied to increased access to the pill in Bailey et al. (2012) and Bailey (2006) are robustto analyses that address this criticism.
15Examples of this include abortion legalization and state liberalization of access to the birth control pill (Joyce, 2013);changes in multiple types of state abortion restrictions including Medicaid funding restrictions, parental involvement lawsand mandatory delay laws (Bitler and Zavodny, 2001); and, the enactment of new state regulations of abortion providerscoupled with cuts in public funding for family planning services, as recently seen in Texas (Fischer et al., 2018) and Wisconsin(Venator and Fletcher, 2019).
9

at the individual level.
1.3 Evidence from the Turnaway Study
The Turnaway Study offers a unique opportunity to overcome these data challenges. Data from this
study allows researchers to follow women who are actually seeking abortions, allowing a direct ex-
amination of the relevant women rather than relying on comparisons across broad groups such as
cohorts or states. The focus of the study was women who were denied an abortion due to facility ges-
tational limits (Turnaway group). In addition to successfully identifying and recruiting these women
to participate, another innovation of the study was the construction of a suitable comparison group
by recruiting women seeking and receiving abortions at gestational lengths just below facility limits
(Near Limit group). Data on a wide range of outcomes were collected for study participants one week
after the abortion encounter and then every six months over a five-year period.
Using the survey data, the study team documented important differences in the well-being of
women in the Turnaway group compared to the Near Limit group, many of which persisted over the
study period. This body of work finds that women who were turned away by the abortion clinics
experienced worse mental health in the short-run (Biggs et al., 2017); poorer physical health among
those who gave birth, including two maternal deaths (Gerdts et al., 2016; Ralph et al., 2019) and in-
creased risk of physical violence from the man involved in the pregnancy (Roberts et al., 2014), when
compared to women in the Near Limit group who received abortions. Researchers also documented
worse economic outcomes following the abortion denial for women in the Turnaway group, including
higher rates of poverty, lower employment, and greater use of public assistance both in the short-term
(6 months following the service denial) and over a longer time horizon (4 years later) (Foster et al.,
2018). We present a more detailed overview of the Turnaway Study in Miller et al. (2020).
These studies provide some of the first evidence on the potential short- and long-term economic,
health, and social consequences of being denied a wanted abortion. However, without information
on the relative trajectories of these outcomes prior to the abortion encounter, an inherent limitation of
the Turnaway Study is the inability to rule out pre-existing differential trends across the two groups of
women. There were also initial differences between the Turnaway and Near Limit study participants
at the time of the abortion encounter: women in the Turnaway group were slightly younger, less likely
to be employed, and had fewer children. They also discovered their pregnancies at later gestational
ages than women in the Near Limit group (Upadhyay et al., 2014). While the analyses described above
10

adjusted for these observed differences, such differences could be related to unobserved differences
in characteristics, such as family or partner support, which affect outcomes related to health and well-
being and cannot be easily controlled for. In addition, these analyses were necessarily limited to an
increasingly small and selected subgroup of participants who responded to the Turnaway Study’s
follow-up surveys over time.
Our study builds on these initial results by linking Turnaway Study participants to high-quality
administrative, longitudinal data that includes information on financial outcomes from even prior
to the pregnancy. These linkages allow us to assess the validity of using women from the Near Limit
group as a comparison for the Turnaway group by examining whether outcomes evolved similarly for
the two groups prior to the abortion encounter, which was not possible with the original study data.
In addition, we are able to trace out the impacts of an abortion denial without relying on a selected
sample of survey respondents. In sum, the Turnaway Study provided an important first look at the
economic consequences of an abortion denial. By linking this pathbreaking study of a difficult-to-
reach population with large-scale administrative data, we are able to greatly expand our knowledge
base on this understudied question.
2 Data and Outcomes
2.1 Data and Sample Construction
Our analysis relies on a new source of data that links individual-level information from the Turnaway
Study to longitudinal credit report data. The Turnaway Study recruited women seeking abortions in
30 abortion facilities across the United States between 2008 and 2010 in order to survey them about
their experiences.16 Facilities with the latest abortion gestational limit (i.e. highest number of gestation
weeks at which an abortion could be performed) within 150 miles were selected to partner with the
Turnaway research team to recruit women to participate in the study. The research team sought to
represent many different geographic areas in the country, while prioritizing locations with earlier
gestation limits (see further details in Dobkin et al., 2014). The clinics’ gestational limits ranged from
10 weeks to the end of the second trimester of pregnancy (the end of week 26), with most falling
during the second trimester (weeks 14-26).
The study recruited women age 15 and older whose pregnancies exhibited no known fetal anoma-
16Note that recruitment to the study occurred in the wake of the Great Recession; our results may therefore be moregeneralizable to periods of similar macroeconomic conditions.
11
lies and who spoke either English or Spanish.17 If the gestational age of the pregnancy, as measured by
an ultrasound, was no more than two weeks below the gestational age limit of the clinic, these women
were considered part of the Near Limit group. If the gestational age was up to three weeks above
the gestational age limit of the clinic, such that they were not permitted to obtain the abortion, the
women were considered to be part of the Turnaway group. There were 536 and 292 women in each
of these groups, respectively. Among women approached, a very similar percent of the Turnaway
group and Near Limit group consented to participate in the study (41 and 42 percent respectively, see
Dobkin et al. (2014)). Figure 1 shows the distribution of the gestational ages of the pregnancy for the
Turnaway group who were denied an abortion (dark blue) and at the time of the abortion for the Near
Limit group (light blue).18 The distribution of gestational ages for the Near Limit group overlaps sig-
nificantly with the Turnaway group, although it is shifted to the left; i.e., on average, the Near Limit
group is seeking abortions at earlier points in the pregnancy than the Turnaway group.
While all women in the Near Limit group obtained an abortion, the converse is not true for the
Turnaway group. Through the Turnaway Study surveys, we observe follow-up information regard-
ing the outcome of the pregnancy for 217 of the 292 women in our Turnaway group sample.19 Among
these 217 women, 32 percent reported either obtaining an abortion elsewhere or experiencing a mis-
carriage or stillbirth. The remaining 68 percent carried the pregnancy to term. In our analysis, we
examine the impact of the abortion denial for all women in the Turnaway group, regardless of the
outcome of the pregnancy.20
To conduct our analysis, we estimate how outcomes change over time for women in the Turnaway
group relative to the Near Limit group. We do this by defining a variable “event time” to capture
the number of years relative to the time a woman gave birth (for those in the Turnaway group who
gave birth) or would have given birth (for those in the Near Limit group or those in the Turnaway
group who had an abortion, miscarried, or whose pregnancy outcome is unobserved). For example,
a woman in the Turnaway group who gave birth after service denial would have event time equal
17One woman whose home address was outside of the United States was excluded from our analysis.18This histogram shows the values for women in the main sample used in this paper, who were successfully matched to
credit records and meet the sample criteria described in this Section.19Women for whom we do not have information about the pregnancy outcome include 61 women who did not complete
the initial Turnaway Study survey, as well as 14 women who were pregnant when they responded to the initial survey butdid not respond to any subsequent surveys.
20In addition to presenting average effects for the Turnaway group, a previous version of this paper also presented impliedtreatment effects for women who carried their pregnancies to term. We have removed this analysis due to the strongunderlying assumption that only women who carry their pregnancies to term may be affected by an abortion denial. Westill provide some discussion of this type of interpretation in our results section, however.
12

to -1 in the 12 months preceding the birth, event time=0 during the month of the birth and the next
11 months, event time=1 in the 12 months after that, etc. Similarly, for those in the Turnaway group
who had an abortion, miscarried, or had an unknown pregnancy outcome, and for those in the Near
Limit group, we define event time relative to the year in which they would have given birth on the
basis of the gestational age of the pregnancy, assuming a 40 week pregnancy. That is, event time=0 in
the month they would have given birth and the following 11 months, event time=1 in the 12 months
following, etc.21 For simplicity, throughout the manuscript we refer to event time=0 as the birth year.
We link study participants to annual Experian credit report data for 2006 through 2016. This range
allows us to see event times up to 3 years prior to the birth (or counterfactual birth), the year of the
birth, and five years after the birth year for all participants.22 To link to the Experian database, we
used a “double blind” matching method that masked actual participants in the Turnaway Study by
including approximately 50,000 randomly-selected women between the ages of 15 and 44, purchased
from a marketing firm, in the data file sent to Experian to be matched. This “masking” sample pre-
vented analysts at Experian from identifying who in our data actually sought abortions, providing an
additional layer of data security to Turnaway Study participants.
The Experian credit report data include records for all individuals with any credit line, public
record, or third party collection reported to the credit reporting agency; however, not all Turnaway
Study participants were matched to the data. There are a couple of reasons why this might occur.
The first is if the individual has never opened a credit account or had a collection or debt-related
court record in their name. Since this is most likely to be true for dependents, we only include study
participants who were at least 20 years old in event period zero, although we show that the results are
robust to including women of all ages.
A second reason that a match may not occur is if the linking variables are not sufficient to establish
a match. We matched study participants based on name, year of birth, and address.23 However, if the
credit reporting agency does not have the address provided by the woman on file (e.g., if she provided
a temporary address to the study that was not included in her Experian address history), we may not
successfully match her to the Experian data even if she does have a credit record. About 82.0 percent
21We could also use the 40-week rule to define the birth year for those in the Turnaway group who gave birth. We choose,however, to use the actual birth year since we have this information.
22Since we only observe earlier event times for a small number of women who enrolled in the study at the end of thestudy period, and later event times for a small number of women who were first to enroll in the study, we exclude eventperiods outside of this range from our analysis.
23Note that Experian keeps records on previously used names and aliases, so name changes due to marriage should notin principle be an impediment to successfully matching a woman to Experian’s database.
13
of women in the Near Limit group were successfully matched to a credit record in at least one year,
higher than the 76.3 percent of the Turnaway group who were matched in at least one year. Both
match rates were slightly lower than those in the random “masking” sample of women who were also
age 20 and older, of whom 84.7 percent were matched. In general, these match rates are comparable
or better than those in other studies that have matched to credit reports using name and address (e.g.
Finkelstein et al., 2012; Humphries et al., 2019), but lower than those generally reported in studies that
included social security number as a match variable (e.g. Miller and Soo, 2018; Miller et al., 2018).
We are able to use survey data collected by the original Turnaway Study to better understand
who was successfully matched to the credit database. We observe that 83 percent (483) of the 581
matched participants, and 77 percent (110) of the 143 unmatched participants, completed an initial
telephone survey as part of the study. These surveys were completed approximately one week after
having sought the abortion. Within both the Turnaway and the Near Limit groups, those who were
not matched to credit records tended to be somewhat more likely to have lower levels of educational
attainment. Within the Turnaway group, those not matched were more likely to be in poverty and
employed part time, were older, and were more likely to receive Food Stamps (see Table 1). Since
our analyses necessarily only include individuals that are successfully linked to the credit report data,
this suggests that the effects of an abortion denial that we estimate may not necessarily represent the
experiences of the most disadvantaged members of the Turnaway group. For instance, it is possible
that the economic consequences for the unmatched group might be even larger given their higher
rates of disadvantage reported in the initial Turnaway Study survey.
Match rates for both the Turnaway and the Near Limit groups also increased over time as partic-
ipants aged (see Appendix Figure A1). This is consistent with a general trend of the establishment of
credit at older ages. However, when we examine differential match rates for the two groups in event
time, we observe that match rates tend to increase in the Turnaway group relative to the Near Limit
group in the post-period (see Appendix Figure A2). Events that could lead to a higher match rate
include establishment of credit (i.e. open credit account), a creditor reporting delinquency on bills, or
a public record event, such as an eviction, bankruptcy, or court judgement (e.g. being ordered to pay
child support or having wages garnished by a creditor). In order to isolate the impact of the abortion
denial from changes in the matched sample composition over the study period, we limit the analytic
sample to women who had a record with the credit agency prior to the birth year.24
24The flow chart in Appendix Figure A3 demonstrates how each of these sample inclusion criteria affects our final sample
14

Our estimates of the effects of an abortion denial will therefore be limited to the effects among
women who already had credit records. This may miss important effects on women who are not in this
sample, however. To further explore this, in sensitivity analyses, we conduct alternative analyses in
which we either assume that women without credit records in the pre-period have zero delinquencies
or credit cards, or we impute group-specific average values for the missing outcomes. Our results are
very similar under both of these alternative approaches.
In addition, our results are specific to the financial consequences experienced by women for whom
gestational limits affect their ability to get an abortion. With its focus on this set of women, the Turn-
away study captures a different population as compared to the broader population of abortion seek-
ers. For example, compared to respondents to a Guttmacher survey of abortion patients (Jerman et al.,
2016), members of the Turnaway group in our analysis sample are more likely to have a high school
degree education or less (45.3 percent in our study vs. 11.8 percent of abortion patients); are slightly
less likely to be Black (26.7 vs 29.3 percent) and more likely to be white (40.2 vs. 36.6 percent); and are
less likely to be married (9.3 vs 14.8 percent). These differences reflect the fact that women who seek
abortions later in the pregnancy tend to have different characteristics, but may also reflect differences
in who chose to participate in the Turnaway Study vs. the Guttmacher survey.
2.2 Credit Report Outcomes
The credit report data contain information on a wide range of outcomes related to a consumer’s fi-
nancial well-being and creditworthiness and have been used in a variety of contexts to measure the
impact of different programs and events on a household’s financial situation. Measures of financial
distress drawn from credit reports are highly positively correlated with other adverse events such
as evictions and health shocks, and negatively correlated with consumption, access to income sup-
ports, and health insurance coverage (Deshpande et al., 2019; Dobkin et al., 2018; Gross et al., 2020;
Hu et al., 2018; Humphries et al., 2019). We may therefore consider deteriorating financial markers to
correspond to declines in other welfare-relevant measures of well-being.
We focus on four outcomes that indicate financial problems and four outcomes that suggest fi-
nancial independence or access to credit. In the first category, we include the amount of debt sent to
a third party collection agency. This debt includes unpaid medical or utility bills, or severely delin-
quent credit card debt that has been sold to a third party. In addition to the debt in collections, we
also examine debt that is 30 days or more past due on open accounts. This is debt that is delinquent
size.
15

but has not yet been sold to a third party, and would include, for example, unpaid credit card bills.
We next include the number of “public records” from courts as a measure of serious financial dis-
tress. These records include any incident in which a credit interaction required an intervention via the
court system–including actions such as bankruptcies, tax liens, or evictions.25 Finally, we include an
indicator that a participant has a credit score at or below 600, which is considered “subprime.”26
In the second category, measuring access to credit, we include the total amount of credit available
on all credit cards (i.e., how much credit remains usable on all of the consumer’s cards before hitting
the cards’ limits). More credit available indicates a greater cushion in case the consumer is faced
with an unexpected expense. We also include an indicator that the consumer has a mortgage and an
indicator that her credit score is in the “prime” (greater than 660) category.27 Finally, we include the
credit score itself in this category.28
In order to improve power, we combine these outcomes into two broad indices, a “financial dis-
tress index” and a “credit access index” by subtracting from each individual’s value the mean of that
outcome observed in the Near Limit group and dividing by the standard deviation of that outcome in
the Near Limit group. We then average these standardized values across all outcomes. If credit score
is missing, outcomes based on this variable are excluded; all other outcomes are always non-missing
as long as the woman is matched to the credit record. This gives us a summary measure that we can
use to test whether the entire category of outcomes was affected.29 Since the outcomes are equally
weighted in these indices, however, they can potentially mask changes in individual outcomes if av-
eraged with no effects or potentially opposite-signed effects on other outcomes. For this reason, we
also present estimates for the individual components.
Table 2 presents summary statistics for the Near Limit and Turnaway groups at baseline, prior
to the (counterfactual) birth year. We also show the same statistics for the women recruited into the
25Experian claims to have comprehensive public records, which it purchases from a third party vendor (although creditorsalso directly report bankruptcies to Experian). However, Experian has been accused of not promptly removing judgmentsthat have been appealed through the courts system or vacated (e.g., because the borrower paid back the lender); see e.g. thecourt case Clark vs Experian Information Solutions Inc. So, it is possible the credit record includes some erroneous or “stale”public records.
26We use the Vantage score to measure credit score, which is similar to the FICO credit score and is used by all three majorcredit reporting agencies.
27Note that 601 to 660 is considered “near prime,” see Experian (2015).28Outcomes such as the total amount of debt (revolving or installment), or the number of credit lines, are ambiguous
with regards to consumer welfare because they reflect both lenders’ willingness to supply credit as well as the participant’sdemand for credit. We have therefore avoided analyzing, for example, total debt or the number of credit lines as an outcome,and attempted to focus on outcomes with clear positive (credit score) or negative (delinquency) interpretations.
29The use of summary indices with equally weighted components to combine related outcomes and limit the number ofstatistical tests follows the approach taken in many other recent empirical studies, including Bailey et al. (2020); Barr andGibbs (2019); Hoynes et al. (2016); Kling et al. (2007).
16

study who received an abortion during the first trimester, for the purpose of comparison. We report
the mean, standard deviations, and median values of these baseline characteristics. The mean values
tend to be higher than the median values and in some cases they are substantially higher. This is due
to the skewed distribution of financial data, in which a small number of individuals have very high
levels of debt and delinquencies. Most financial characteristics are not significantly different across
the Near Limit and the Turnaway groups in the pre-period. The only exception is that women in the
Turnaway group are significantly less likely to have a mortgage. In contrast, both the Turnaway and
Near Limit groups have higher amounts of debt in third party collections, lower credit scores, less
credit available (on average), are less likely to have a mortgage (on average), and more likely to have
a “subprime” credit score (on average) when compared to the First Trimester group.
3 Empirical approach
For our main analysis, we examine how outcomes change over time for women in the Turnaway
group relative to the Near Limit group using the “event time” variable that measures the number of
years since the birth (for those in the Turnaway group who gave birth) or the number of years since
the woman would have given birth (for those in the Near Limit group, and those in the Turnaway
group who obtained abortions elsewhere, miscarried, or whose pregnancy outcome is unobserved).
Event time is equal to zero in the year of the birth or counterfactual birth. Since our credit data are
observed from 2006 to 2016, and since Turnaway participants were mostly enrolled in 2009 and 2010,
we observe at least 3 years of pre-birth outcomes, outcomes during the year of the birth, and at least
5 years of post-birth outcomes for all participants. We use this 9 year period over which we observe
outcomes for all participants in our analysis.
Figure 2 plots our primary outcome variables – the financial distress index (panel a) and the credit
access index (panel b) – by this event time measure. Similar plots for the components of these indices
may be found in Appendix Figures A4 and A5. Prior to the birth, women in the Turnaway and
Near Limit groups had very similar outcomes related to financial distress. These outcomes diverge
beginning in the year of the birth, with an increase in financial problems observed among women in
the Turnaway group and fairly stable outcomes in the Near Limit group. We also see similar trends
in access to credit across the two groups (panel b), with a relative decrease in access to credit for the
Turnaway group occurring around the time of the birth. This difference in access to credit, however,
appears to close after three years.
17

We formally test for the patterns presented in Figure 2 using an event study model that com-
pares changes in financial outcomes for the Near Limit group to changes in the same outcomes in the
Turnaway group before and after the birth or counterfactual birth. We estimate the regression
Yit =5
∑y=−3y 6=−1
βyTurnawayi × I(t− t∗i = y) + γy I(t− t∗i = y) + δi + εit. (1)
In this model, we include event time indicators, I(t− t∗i = y), that denote time relative to the birth, t∗i ,
for each individual i. Our estimates of interest are the coefficients on interaction terms for these event
time indicators and an indicator that the participant was in the Turnaway group. These estimated co-
efficients, β̂y, measure the change in the relative outcome in year y for the Turnaway group compared
to the Near Limit group. The year immediately preceding the birth or counterfactual birth, y = −1, is
the reference year. We include individual fixed effects (δi) in the model and robust standard errors are
clustered at the individual level.30
Ideally, the estimated coefficients β̂y would be close to 0 for event years preceding the birth, and
then diverge only after the birth if there were effects of the abortion denial. This would imply that
the outcomes for the Turnaway and Near Limit groups evolved similarly prior to the birth and lend
credence to the assumption that the trajectory of outcomes for the two groups would have been similar
in the absence of the abortion denial. Note that any fixed (or level) differences in outcomes between
the two groups are controlled for with the individual fixed effect; a simple comparison of means across
the Turnaway and Near Limit groups without such an individual fixed effect may overstate the impact
of an abortion denial given the pre-birth differences between these groups.31
We also estimate a differences-in-differences (DD) version of model (1) that replaces the event
time indicators with a single post dummy for the year of birth and all years after. The effect of the
abortion denial for the Turnaway group is estimated from an interaction of this post dummy and an
indicator variable for the Turnaway group, providing a summary measure of the impact of abortion
denial in all of the post-birth years:
Yit = βDDTurnawayi × Postt + β2Postt + δi + εit. (2)
30In our robustness section, we also conduct inference clustering at the level of the clinic.31We illustrate this in Appendix Table A1, which shows differences across the Turnaway and Near Limit groups using
only the post-period data. This comparison overstates the impact of an abortion denial on some outcomes, such as thepresence of a mortgage, for which there were meaningful pre-birth differences across the groups.
18

The estimated coefficient β̂DD captures the average change in outcomes for the Turnaway group rela-
tive to the Near Limit group after the abortion encounter.
In addition to the main models described above, we also present results from several alternative
sample definitions and specifications. First, we conduct additional analyses in which we include
individuals even if they did not have a match prior to the birth year. We include these observations
by re-defining our dependent variable to assume that women who do not match to credit records in
the pre-period have zero delinquencies, no mortgage, and no credit cards in these unmatched years.
We then estimate the impact of abortion denial for this larger sample. Second, rather than assume
that individuals without credit report matches have no financial activity in these years, we impute the
average value for their group (Turnaway or Near Limit) for each outcome and year. Third, we include
those who were under age 20 during the birth year and re-estimate our model using women of all
ages. In addition to these alternative sample and variable definitions, we also conduct inference in
our main analysis in an alternative way where we cluster our robust standard errors at the level of the
clinic, rather than at the individual level. Next, we include calendar year fixed effects in the model to
control for any secular changes in outcomes over time. We then assess the sensitivity of our estimates
to outliers by re-coding observations in continuous variables that are above the 99th percentile of the
outcome distribution or below the 1st percentile to these percentiles (i.e., “winsorizing” continuous
variables). The influence of outliers may be particularly relevant in credit data, given the skewed
distribution of financial outcomes. Next, we estimate an alternative specification that includes controls
for changes in local economic conditions for both the Turnaway and Near Limit groups. We include a
control for the state unemployment rate in each year, and also interact this unemployment rate with
the indicator that the participant is in the Turnaway group.
Finally, we also examine whether allowing for a differential pre-trend for the Turnaway group
affects the results in our event study model, following e.g. Gross et al. (2020). We implement this
by including a linear term for the number of years relative to the birth/counterfactual birth for the
Turnaway group that equals 0 in all years for the Near Limit group. We then estimate our event study
model (1) including this term but omitting the pre-birth event study coefficients.
4 Results
We report the event study coefficients, β̂y of equation (1), for the delinquency and access indices in
Figure 3. The first graph (a) shows the effects of being denied an abortion on the financial distress
19

index, which combines all delinquency outcomes into a single summary measure. Prior to the birth,
outcomes of the Turnaway group and the Near Limit group had similar trajectories. Beginning in the
year of the birth (year=0), however, we see a jump in markers of financial distress in the Turnaway
group relative to the Near Limit group of between 0.10 and 0.20 standard deviations. Financial distress
remains elevated in the Turnaway group over the entire post-period, although the coefficient estimates
are only significant at the 10 percent level during the final two years. Nonetheless, the pattern of
coefficients indicates that financial delinquencies remain high over the 6 years following the birth.
Graph (b) shows the effect of abortion denial on measures related to access and use of credit. The
coefficients on event years immediately following the birth are negative, indicating worse access for
the Turnaway group with declines on the order of 0.05 standard deviations, but are not statistically
significant. Starting three years after the birth year, the coefficients are close to zero, indicating no
difference between the Turnaway and Near Limit group.
Similar event study figures for the components of these indices are found in Appendix Figures A6
and A7. In terms of financial distress measures (Appendix Figure A6), the post-birth coefficients are
consistently positive (indicating worse outcomes) for the subprime credit score, the amount past due,
and the number of public records, although the individual year coefficients are imprecisely estimated
and only significant for public records (years 0-4) and amount past due (year 3). The amount of
debt at third party collection agencies shows a less sustained pattern, with positive coefficients in the
years immediately following the birth, but coefficients closer to zero starting in year 3; all of these
coefficients have wide confidence intervals.
Among individual components of the access index (Appendix Figure A7), we see no evidence of
an effect on the probability of having a mortgage or credit available, but a decrease in credit scores; the
Turnaway group is less likely to be in the “prime” credit score range during the three years following
the birth (although only statistically significant in the latter two years). Differences in this measure of
creditworthiness appear to close by the third year after the birth year with coefficient estimates close
to zero.
We present the DD estimates of equation (2) in Table 3. The first row presents estimates from our
main model for outcomes related to financial distress and delinquency, while row two presents results
for measures related to access to credit and financial self sufficiency. In the first column of Table 3, we
see that outcomes related to financial distress increase by about one tenth of a standard deviation
among the Turnaway group in the post period, as compared to the Near Limit group. This effect is
20

statistically significant at the 5 percent level.
If we assume that the effect is driven entirely by women who subsequently give birth, we can
re-scale this estimate by the fraction of women in the Turnaway group who gave birth. Among those
with known pregnancy outcomes, this fraction is 68 percent in our sample. This scaling would there-
fore imply that financial delinquencies increased by 0.15 standard deviations among those who gave
birth as a result of the abortion denial (0.102/0.68). However, as discussed earlier, there are reasons
to expect financial repercussions even among those women who did not give birth, such as higher
expenses related to finding an abortion elsewhere, time missed from work, or productivity losses. For
this reason, we focus our attention on the reduced form estimates measured for all Turnaway group
members.
We examine the components of the index in the subsequent columns. We find that the Turnaway
group experienced significant increases in the amount of debt 30 days or more past due of $1,749.7,
a 78 percent increase relative to their pre-pregnancy mean. The number of public records, such as
bankruptcies, tax liens, evictions, and other court judgements, significantly increases in the Turnaway
group by 0.065, or 81 percent.32 We observe positive effects of being denied an abortion on the prob-
ability of having a subprime credit score and the amount in collections, although these effects are not
statistically significant.33
We also examine how being denied an abortion changed the probability that a woman in our
sample had particularly high or low amounts of debt past due or in collections. We construct indi-
cator variables that the individual has debt past due or collections in each quartile of the pre-birth
distribution of our sample and use these indicators as outcome variables. The results are reported
in Appendix Table A3. We find that being denied an abortion significantly reduced the probability a
woman had $0 in collections. Other estimated effects are not statistically significant.
We present our estimates related to access to credit in the second row of Table 3. Although we
observe a negative point estimate for our overall DD coefficient, suggesting that the Turnaway group
experienced decreases in credit access relative to the Near Limit group following the birth, it is small
32In the Appendix, we separate public records into bankruptcies, tax liens, and all other court judgments, which are themost detailed categories permitted by our data. Although less precisely estimated, the results for the total number of publicrecords appear to be driven by tax liens and judgments. See Appendix Table A2.
33Evaluating the impact of an abortion denial on collections of different types – for example, hospital bills versus util-ity bills – may be useful in determining the source of the financial distress. Unfortunately, such categorizations are onlyavailable in 2011 forward, which is entirely in the “post” period. We present differences across groups in the post periodin Appendix Table A4; these differences are not statistically significant, but point estimates indicate that medical collectionsappear to be higher among the Turnaway group (p=0.17), which would be consistent with medical expenses associated withthe birth and recovery responsible for part of the financial distress effect.
21

and imprecisely estimated. We also do not find any statistically significant estimates of abortion denial
on the components of the access index under the DD model.
4.1 Sensitivity Analyses
To assess the robustness of our results to alternative modeling, sample, and variable definitions, we
present several additional estimates in Tables 4 and 5. In the first row of Table 4, we assume that
women who were not matched to the credit reports have no delinquencies (i.e., have $0 past due and
in collections and no public records) in our analyses of financial distress measures. This allows us
to include the women with no credit report records during the pre-period but observed records in
the post-period in our analysis. With this re-coding, we observe a statistically significant increase in
financial distress of 0.117 standard deviations. We continue to find a significant increase in the amount
of debt 30 days or more past due and an identical estimate for the increase in the number of public
records.
In row 2, we impute the missing values for all participants who had at least one year matched
to the credit records using the average amount observed in each year for members of their group.
When we impute missing values in this way, we continue to see significant increases in indicators of
financial distress of about 0.11 standard deviations, increases in the amount past due of $1,521, and in
public records of 0.058. These analyses (rows 1 and 2) indicate that even with different assumptions
and treatment of missing credit report records during the pre-period, the estimated financial effects of
an abortion denial are robust. In row 3, we show the estimates using women of all ages, rather than
only including those who were at least 20 years old at the time of the birth (or counterfactual birth).
This sample restriction was applied to avoid including the selected group of individuals who were
teenagers in the pre-period and thus less likely to appear in credit report data (see Appendix Figure
A1). The results using women of all ages are very similar to those reported for the main sample. It
remains the case, however, that these estimates are still more representative of older women since
younger women are less likely to have established credit records during the pre-period in order to be
included in this analysis.
We re-estimate our main model but cluster our estimates at the clinic, rather than individual level,
to account for any correlation of the error terms between women visiting the same clinic, in row 4. Our
inference is essentially unchanged by this alternative level of clustering. In row 5, we estimate separate
effects for each clinic and then aggregate these estimates, weighting each clinic-specific estimate by the
22

fraction of the Turnaway group members in our sample at that clinic. Results are similar using this
approach. In row 6, we include year fixed effects in our model, to account for any general trends by
calendar time. The inclusion of these fixed effects does not noticeably affect our results. In row 7, we
winsorize our data to reduce the influence of outliers for continuous variables. This recoding does
not change the results very much, although the coefficient estimates are slightly smaller for some of
the outcomes. Finally, in row 8, we include a control for the state unemployment rate in each year,
and interact this unemployment rate with the indicator that the participant is in the Turnaway group.
Including these variables may help account for any changes in the state’s economic environment, and
also allows for these changes to affect the Turnaway group differently than the Near Limit group. Our
results change very little with the inclusion of these control variables, suggesting that our model is not
picking up, for example, a differential response to local economic conditions by the Turnaway group.
To summarize, across multiple samples, variable definitions, methods of inference, and model
specifications, we find strong evidence that being denied an abortion had large effects on markers of
financial distress, amount of debt past due, and adverse court records.
Table 5 presents the same robustness checks as those in Table 4 but for our measures related
to access. In the first row, we assume that women unmatched in the pre-period have no mortgage
and $0 in available credit during these years, and calculate the access index using these components
only (i.e., we still allow credit score to be missing). Row 2 imputes missing values with group-year
averages for women who do not match in the pre-period, but who match in later years. Rows 3 and 4
make similar sample and inference changes as their counterparts in Table 4. Row 5 aggregates clinic-
specific estimates. Row 6 includes year fixed effects, row 7 winsorizes continuous outcome variables,
and row 8 includes the state unemployment rate and an interaction between the unemployment rate
and the Turnaway indicator in the model. Consistent with the results in Table 3, we do not find
statistically significant effects of being denied an abortion on these outcomes under these alternative
sample, inference, and modeling choices.
Finally, it is important to note that although we do not find evidence that the Turnaway group was
on a worse financial trajectory than the Near Limit group prior to the abortion denial, it may be the
case that such differential trends were present but we do not have sufficient statistical power to detect
them. Following the approach outlined in Roth (2019), we estimate that we can detect a positive linear
pre-trend in the financial distress index of 0.042 or larger with 80 percent power and of 0.017 or larger
with 50 percent power. Even in this worst case scenario, where the largest possible undetectable trend
23

exists, the biases resulting from such undetected trends would not reach the size of our post-period
coefficient estimates until the fourth year after the birth year for the trend estimated with 80 percent
power, and never during the study period for the trend estimated with 50 percent power.34
We further explore whether such a differential trend might be driving our results by estimating an
alternative version of our event study model that explicitly allows a differential pre-trend. We estimate
a version of equation (1) that includes a linear trend for the Turnaway group and omits the pre-birth
event study coefficients, following Gross et al. (2020). The results are reported in Appendix Table
A5. We continue to find higher rates of financial distress among the Turnaway group relative to the
Near Limit group, although the point estimates are somewhat larger than in our main specification.
Consistent with our main results, we do not find evidence for a change in access to credit.
5 Additional Analyses
We conduct a small number of additional analyses to provide more context for our results and to
suggest possible directions for future research. Because of the limitations described along with each
of these analyses, we consider these analyses to be mainly exploratory.
5.1 Regression Discontinuity Model
In addition to our primary event study specification, we take advantage of the sampling design of the
Turnaway Study to implement a regression discontinuity design that compares outcomes for women
just above and below the gestation limit at each clinic. The RD approach aims to compare women who
sought abortions at gestational ages just above or just below the age limit at their clinic. These women
sought abortions at a very similar point in their pregnancy, but were treated differently by providers
because of the gestational cutoff rules. An RD design that estimates level changes that occur at the
cutoff abstracts from any systematic differences related to gestational age, providing an alternative
method to estimate the causal effects of an abortion denial.
There are three important empirical challenges with applying the RD approach in our setting.
First, since RD analyses effectively compare outcomes for individuals on either side of a given cutoff,
this type of approach performs best when large sample sizes are available, which is not the case in
our setting. For this reason, we use parametric regression, which uses all data available, to estimate
the discontinuity at the cutoff (Lee and Lemieux, 2010). We also, however, present estimates using
34We calculate the biases following the formula presented in Roth (2019), which takes into account the additional biasintroduced by passing a pre-test.
24

nonparametric methods (i.e. local linear regression).
Second, gestational age is determined by ultrasound measurement of the fetus under the assump-
tion that its size is consistent with its age. As such, gestational age could be subject to mismeasurement
or even manipulation by the ultrasound technician, which may result in women who are just “below”
the cutoff differing systematically from women just “above” the cutoff. We can evaluate this empiri-
cally by looking at differences in financial outcomes for women just above or below the cutoff in the
years prior to the pregnancy and (counterfactual) birth. For survey respondents, we can also assess
whether there are any differences around the cutoff in other socioeconomic characteristics as mea-
sured one week after the abortion encounter. We also implement a “donut RD” (Barreca et al., 2016)
that aims to limit any bias from possible manipulation by excluding women whose gestational ages
are at the cutoff or within one day of the cutoff.
Third, we do not have information on the exact gestational age cutoff used at each clinic. Between
2008 and 2010, the period during which women were recruited into the Turnaway Study, several sam-
ple clinics changed their cutoffs, and these changes were not documented. In addition, even within
a clinic, the latest age at which an abortion can be performed may vary due to physician availability
or changes in the clinic’s internal rules and practices. Given this lack of precise information on the
relevant cutoff for each woman’s specific clinic encounter, we use a data-driven procedure to estimate
the most common gestational age cutoff used at each site. More details on this procedure are found in
Appendix Section A.
We proceed with the RD analysis addressing each of these limitations as described above. Using
each clinic-specific cutoff (cutoff c), we define the distance to the cutoff for each woman i presenting at
clinic c as gic = gestation daysi − cutoff c. If gic ≥ 0, the woman is likely to be turned away; otherwise,
she is likely to receive the abortion. Although this is a “fuzzy” RD, in the sense that some women
above the cutoff received abortions while some below the cutoff were turned away (due to mismea-
surement of the cutoff, changes in the cutoff over time, or physician discretion), it performs well in
predicting whether a woman was turned away. Appendix Figure A8 shows the fraction of women
who were turned away at each day of gestation relative to the estimated clinic-specific cutoff. There
is a large increase of about 85 percentage points at the estimated cutoff.
Using this estimated cutoff, we implement the RD analysis in two ways. First, we estimate a
simple parametric regression that includes a linear trend in days from the cutoff that is allowed to
vary on either side of the cutoff and an indicator variable that a woman’s pregnancy is at or over the
25

estimated gestational week cutoff for the clinic. Specifically, we estimate:
Yict =β0 + β11(gic ≥ 0) + β2gic + β31(gic ≥ 0)× gic + εict. (3)
Second, we estimate a local linear regression using the Fuji et al. (2009) optimal bandwidth selec-
tor. This method has the advantage that it puts more weight on data points closer to the cutoff when
estimating the discontinuity. The tradeoff is reduced precision since fewer data points may be used
in its estimation and the fact that this method is less suited for discrete running variables such as ges-
tation age, which is measured in days (Cattaneo et al., 2020). In all analyses, we cluster the standard
errors at the individual level.35
We first present RD plots for each event year relative to the birth/counterfactual birth year (again
we refer to this as "birth year" for simplicity). Appendix Figure A10 plots the financial distress index
by days of gestation relative to the estimated clinic-specific cutoff. Note that we center the figures
at zero, indicating the cutoff of the relevant clinic for each individual, but that the estimated cutoff
age varies by clinic. Panels (a)-(c) show the difference at the cutoff during the three years prior to the
birth. If women close to the cutoff differ systematically for reasons other than the abortion denial,
we might expect to see discontinuities in these pre-pregnancy years. However, we do not see any
evidence of differences at the cutoff prior to the birth year. We further probe whether there are baseline
differences across the gestational age cutoff using data from the initial Turnaway Study survey for
those who responded. We find no evidence of systematic variation at the cutoff on these dimensions
(see Appendix Table A6 and Figure A9).36
Panel (d) of Appendix Figure A10 shows the difference in the financial distress index at the cutoff
in the year of the birth, and panels (e)-(i) show the differences in the years following the birth. In the
first three years following the birth there appears to be a discontinuity at the cutoff, with women who
were turned away experiencing relatively higher rates of financial distress. This difference becomes
less apparent in years 4 and 5, consistent with the patterns documented in the plot of the data by
event time in Figure 2. Similar results for the access index are presented in Appendix Figure A11. The
figures associated with this outcome are fairly noisy and the patterns are less clear.
35Note that our standard errors may somewhat overstate our precision since we must infer the clinic-level cutoffs.36In addition, we run an alternative specification that estimates the difference in the discontinuity over the pre- and post-
periods. This “RD-DID” analysis accounts for any pre-existing differences in outcomes at the cutoff. Further details on thisanalysis and the results, which are consistent with those presented in the main RD analysis, may be found in AppendixSection B.
26

When we run the regression analyses, we pool years to increase precision. Motivated by the
pattern observed in Figure 2, we estimate the RD model in four time periods. In the first row of
Appendix Table A7, we show the RD estimate pooling observations for one, two, or three years prior to
the birth. Consistent with the figure, we do not find a statistically significant discontinuity in financial
distress at the cutoff in this pre-birth period. In row 2, we present the RD estimates using observations
from the year of the birth. In this year, we see a statistically significant increase in the financial distress
index in the linear model, but not in the local linear regression specification. For observations one
to two years after the birth year, reported in row 3, we observe significant increases in the financial
distress measure in the parametric linear (p ≤ 0.05) and local linear (p ≤ 0.10) regression models.
These estimates indicate that financial distress increased by between 0.18 and 0.19 standard deviations
during these years. This increase is slightly larger to that estimated under the event study model in
Figure 3 during these years. In row 4, we see a marginally significant increase in financial distress
(p ≤ 0.10) during the period three to five years following the birth year under the parametric model
but not under the local linear model. We do not find significant differences at the cutoff in our access
measure during any of the time periods. The results for both indices are similar if we drop women
whose gestational age is at or close to the cutoff (i.e. a “donut” RD). See Table A8 in the Appendix.
These RD estimates are broadly consistent with the patterns presented in Figures 2 and 3. Credit
report outcomes were similar for the two groups of women prior to the birth but financial outcomes
worsened for the Turnaway group after the birth, with the most pronounced effects appearing in the
year of the birth and the two years immediately following the birth year.
5.2 Exploration of Mechanisms from the Turnaway Study Follow-Up Surveys
To better understand the economic circumstances of these women and clarify the mechanisms under-
lying our findings, we turn to additional data collected in the Turnaway Study. In the initial survey
interview conducted one week after being denied an abortion, the majority of women in our sample in
the Turnaway group were unmarried (83 percent), already had children (61 percent), and were unem-
ployed (48 percent). Many were living with adult family members and few with a spouse or partner.
More than 43 percent reported that they did not have enough money to cover housing, transportation,
and food at least “most of the time.” This suggests that women in the Turnaway group were already
economically vulnerable prior to any additional financial consequences experienced as a result of the
abortion denial.
27
We conduct an exploratory analysis of how survey outcomes evolved for these women in our
sample relative to the Near Limit group.37 The outcomes examined here were analyzed previously in
Foster et al. (2018), but we conduct our own analysis in order to limit the data to respondents included
in our main credit report sample (i.e. those who were matched to the credit record data for at least
one year in the pre-period and who meet our age restrictions). Conducting our own analysis of the
Turnaway data allows us to produce estimates that are the most relevant and comparable to our credit
report results, although they differ somewhat from those presented in Foster et al. (2018), which used
the entire sample of survey respondents and focused on the subset of women in the Turnaway group
who carried their pregnancies to term. The analysis in Foster et al. (2018) also used different statistical
methods, making their estimates not directly comparable to those presented here.
Because women were first interviewed one week after the abortion encounter, we have both
pre- and post-data available for the birth (or counterfactual birth) and are able to estimate our main
difference-in-differences specification (equation 2). However, in contrast to the credit report data, we
are not able to evaluate whether pre-birth trends are similar across the Near Limit and Turnaway are
limited to one observation period prior to the birth. In addition, a fairly large percent of respondents
in our sample (24 percent at baseline) did not provide household income information, resulting in
smaller sample sizes for this outcome. Because of these limitations, we consider our analysis in this
subsection to be exploratory. We present yearly estimates, analogous to the event study coefficients,
in Appendix Figures A12-A13 and difference-in-differences estimates in Appendix Tables A9-A10.
Consistent with Foster et al. (2018), we do not find strong evidence that monthly household in-
come fell for the Turnaway group relative to the Near Limit group after the birth. However, because
household size increased among Turnaway group respondents, their income as a percent of the FPL
fell significantly, by about 28 percentage points. By year 4 after the birth year, this difference in in-
come relative to FPL across the Near Limit and Turnaway Group appears to have closed (panel c of
Appendix Figure A12).
We do not find evidence of changes in employment (panel d), but do find an increase in the receipt
of public benefits. Specifically, we see that receipt of WIC increased significantly in the Turnaway
group relative to the Near Limit group (panel e), with most of the increased receipt occurring in the
37The sample for this analysis is necessarily restricted to women who responded to the Turnaway Study surveys. Whenwe re-run our analysis for the subgroup of women who continued to respond the Turnaway surveys until the end of the5-year study, our point estimates are similar to what we find when using the full sample, although imprecisely estimateddue to the much smaller sample size. We believe this highlights one of the advantages of our administrative data: that itallows us to have larger sample sizes because it does not rely on continued individual participation.
28

year of the birth. We do not find statistically significant changes in TANF or food stamp receipt (panels
e and g), although the estimated coefficients are positive for both of these outcomes, suggesting that
use of these public programs may have increased as well. In addition, we are unable to examine
changes in benefit amounts with the data available. Our point estimates suggest that child support
payments to women in the Turnaway group increased following the abortion denial by about $20 per
month in the years following the birth year, but these effects are not statistically significant (panel h of
Figure A12). Finally, we do not find a significant change in the share of women reporting they do not
have enough money "most of the time" (panel i), although the point estimate is positive, indicating an
increase in this measure.
We also see that the Turnaway group experienced significant changes in their living situation
relative to the Near Limit group (Appendix Figure A13 and Table A10). Following the birth, the
Turnaway group was no more likely than the Near Limit group to be living with a male partner
and significantly more likely to be living alone with her child or children. The yearly estimates also
suggest that the Turnaway group was somewhat less likely to be living with adult family or non-
family roommates than the Near Limit group (panels b and e of Appendix Figure A12).
Taken together, these results suggest that women who were denied abortions needed to care for
an additional child without experiencing increases in income or support from male partners. Women
in the Turnaway group may have experienced higher housing costs, in addition to the expenses as-
sociated with a new baby, as they became less likely to live with family or roommates following the
birth. Increased participation in public programs, in the form of higher levels of WIC receipt, was
also short lived. Such patterns likely drive the patterns of the inability to meet financial obligations
documented in our credit report analysis.
5.3 Heterogeneous Effects by State Policy Environment
Next, we examine heterogeneity in the effect of an abortion denial based on the generosity of the social
safety net in the state in which the woman resided at the time she sought an abortion.38 To characterize
state safety net generosity, we examine the income threshold at which a household can gain eligibility
for Temporary Aid to Needy Families (TANF). The federal government provides funding for this
cash assistance program for low-income families to states who determine their own eligibility criteria
for the program. We characterize states as “high generosity” if they allow TANF receipt at household
38Note that although participating clinics were only in 21 states, more than 21 states are represented in this analysisbecause some women traveled to a different state to seek an abortion.
29

incomes of 50.8 percent of the Federal Poverty Level or higher, corresponding to the average eligibility
threshold observed in our data.39 The results are presented in Appendix Table A11. Women who live
in low generosity states experience significant increases in financial distress following an abortion
denial. We do not find a significant effect among women residing in high generosity states, although
the point estimate is still positive indicating higher financial distress. In addition, the difference in
coefficients is not statistically significant (p=0.18).
This result suggests that the financial impact of abortion denial may vary according to the state
policy environment. At the same time, we note that high and low generosity states differ on many
dimensions other than TANF eligibility. For example, in our data, Turnaway group members who
reside in high generosity states are denied abortions at significantly later gestational ages, indicating
that these states permit abortions to occur later in the pregnancy. Differences in abortion restrictions
and other state policies not included in this analysis may also be relevant in understanding the larger
effects observed in the low generosity states.
5.4 Comparison to Subsequent Pregnancies in Near Limit Group
By affecting a woman’s ability to receive or not receive an abortion, gestational limits may remove the
option for women to have no children, in addition to changing the timing of when they have a child.
Notably, only 25 percent of women in the Near Limit group who received a wanted abortion went
on to have a child during the 5-year study period. In addition, prior research has documented that
access to abortion has effects on completed fertility rather than just delaying childbearing; abortion
legalization led to an increase in the share of women remaining childless (Ananat et al., 2007).
While acknowledging this, it may still be of interest to know whether the financial distress experi-
enced by the Turnaway group around the time of the birth was similar to that experienced by women
with similar socioeconomic status giving birth after more wanted pregnancies. It may be the case that
the burden experienced by the Turnaway group is particularly high when compared to an alternative
where women are able to more optimally time childbearing. Such a comparison is difficult because,
to our knowledge, there is no comprehensive data linking information on socioeconomic status, birth
timing and wantedness, and credit report information. Even if such data existed, it would be difficult
to match the Turnaway group to “equally” disadvantaged childbearing women since women seek-
39Classification based on state eligibility rules in July 2008 drawn from Zedlewski and Golden (2010). States classified as“low generosity” are AL, AR, AZ, CO, DE, FL, GA, ID, IL, IN, KS, MA, MD, MO, MS, MT, NC, NJ, OR, PA, SC, TX and WV.States classified as “high generosity” are AK, CA, CT, IA, KY, ME, MI, ND, NM, NV, NY, OH, OK, SD, TN, VA, WA, and WI.Results are similar if we instead use the median (42 percent of the FPL) as the cutoff between “high generosity” and “lowgenerosity” states.
30
ing abortion may vary on unobservable or difficult-to-measure dimensions such as partner, family, or
community support.
To shed light on this comparison, we conduct an exploratory analysis using members of the Near
Limit group who gave birth in the five years following their abortion. This analysis takes advantage
of information on subsequent births collected by the Turnaway Study follow-up surveys. These births
represent a mix of wanted and unwanted births that is likely more representative of a “typical” birth
among women in our sample, which we are able to compare to the explicitly unwanted births ob-
served for the Turnaway group.40 Similar to our analysis of the Turnaway women, we restrict the
sample to women in the Near Limit group who had a follow-up birth, were at least 20 years old in the
year they gave birth, and had a match to the credit reporting agency database prior to the birth. We
emphasize that this is exploratory as only 97 Near Limit participants had an observed birth over this
period and meet our sample criteria. However, this sample does give us the opportunity to explore
how financial outcomes change around childbirth for a sample of women with similar socioeconomic
status as the Turnaway group, but whose birth did not necessarily result from an abortion denial.
Since we only observe most women for a limited time after their subsequent birth, which tended
to occur between 1 and 3 years following their abortion, we define our follow up period in this analysis
as the four years following the birth. We continue to define the pre-period as the three years prior to
birth, to follow our approach in the main analysis for Turnaways. As a comparison group, we use
Near Limit participants who did not give birth. We estimate the following model:
Yit =3
∑y=−3y 6=−1
βy I(t− t†i = y) + νt + δi + εit. (4)
Here, t†i is the year in which the Near Limit participant gives birth, νt are calendar year fixed effects,
and δi are individual fixed effects. The coefficients on the event study indicators, βy, show how finan-
cial outcomes changed for the Near Limit group who gave birth relative to the time trend experienced
by Near Limit participants who did not give birth, as captured by νt. Robust standard errors are
clustered by individual.
The results are presented in Appendix Figure A14. To facilitate comparison, we add the event
time estimates for the Turnaway group, re-scaled by the fraction of women in the Turnaway group
40On the London Measure of Unplanned Pregnancy, for which higher values (out of a maximum score of 12) indicatemore planned births, subsequent children born to the Near Limit group scored a 6.8, while births to the Turnaway groupfollowing the abortion denial scored a 2.8 (Foster et al., 2018).
31

who gave birth; these estimates are plotted with a solid green line.41 The estimates of βy from the
Near Limit model described in equation (4) are plotted with a dashed blue line. The point estimates
on the effect of financial distress for subsequent Near Limit births are smaller than those observed
among the Turnaway group and are not statistically significant (panel a). In addition, the confidence
intervals on the estimates for the Near Limit births do not include the coefficient estimates for the
Turnaway group. We see no evidence of a change in credit access following the subsequent births of
the Near Limit group with coefficient estimates very close to zero.
These results suggest that births that occurred following a subsequent pregnancy result in less
financial distress than those that occur after an abortion denial. In addition, this may be an underesti-
mate of any difference in the financial effects between wanted and unwanted births, given that some
of these subsequent births likely resulted from unplanned or unwanted pregnancies.42 However, we
note that the confidence intervals of the two estimates do overlap, making it difficult to draw strong
conclusions from this exercise.
6 Conclusion
Restrictions on abortion are common with 63 new state laws aimed at restricting abortion access im-
plemented in 2017 alone (Nash et al., 2018). Despite the fact that such laws are pervasive, we have
little data documenting how being denied an abortion affects the financial and economic well-being
of women. This paper provides the first evidence on this topic using longitudinal data that allows us
to observe women both before and after the abortion denial. We link high-quality administrative data
from credit reports to participants in the Turnaway Study. These data allow us to compare the trajec-
tory of outcomes for women who were denied (Turnaway group) versus received wanted abortions
(Near Limit group) on the basis of state and facility gestational limits.
We find evidence that being denied an abortion has large and persistent negative effects on a
woman’s financial well-being. Women denied an abortion experience a significant increase in finan-
cial distress during the year that they give birth (or, in some cases, would have given birth since some
of them received an abortion elsewhere or miscarried), compared to their counterparts who received
a wanted abortion. Unpaid debts that are 30 or more days past due more than double in size, and the
41For the purpose of this re-scaling, we apply the birth rate (68 percent) for the Turnaway group calculated among thoseindividuals with observed pregnancy outcomes.
42Our rescaling of the Turnaway estimates assumes, however, that all financial effects are concentrated among the womenwho gave birth. This could lead to potentially overstating the difference between wanted and unwanted births if the finan-cial consequences were shared more equally among women in the Turnaway group who did and did not give birth.
32
number of public records, which include negative events such as evictions and bankruptcies, increases
substantially. This financial impact extends throughout our sample period, with negative effects ob-
served up to four years after the birth year. While we do not find as strong of evidence of changes
in the financial independence of these women, as measured through markers of credit access such as
having a mortgage, we do find that the women who were denied an abortion were significantly less
likely to have a prime credit score in the two years following the birth.
The size of the effects are substantial when compared to effects documented in other settings.
While the women in our study differ from the populations analyzed in other settings, estimates based
on other interventions could still provide a useful benchmark for what size of effects we might expect.
For example, the impact of being denied an abortion on collections is as large as the effect of being
evicted (Humphries et al., 2019) and the impact on unpaid bills is several times larger than the effect of
losing health insurance (Argys et al., 2019). Although imprecisely estimated in our setting, it appears
that denying a woman an abortion reduces her credit score by more than the impact of a health shock
resulting in a hospitalization (Dobkin et al., 2018) or being exposed to high levels of flooding following
Hurricane Harvey (Billings et al., 2019).
We can draw additional insights into the mechanisms behind these changes from the Turnaway
Study follow-up surveys. Using survey data from Foster et al. (2018), but implementing our sample
criteria and empirical approach, we find that women’s household income as a percent of the FPL fell
for the Turnaway group relative to the Near Limit group after the birth or counterfactual birth. At
the same time, women in the Turnaway group did not experience significant relative increases in the
probability of living with a male partner and, if anything, experienced decreases in the probability of
living with adult family, such as parents, or other adult roommates. Instead, women in the Turnaway
group became more likely to live alone with her child or children. The Turnaway group experienced
relative increases in the use of WIC in the year of the birth and small, marginally statistically signif-
icant increases in the amount of child support received each month. In sum, while women’s family
obligations and need for resources increased following the abortion denial, they did not appear to
experience increases in support from male partners, adult family, or the government to sufficiently
offset these responsibilities, possibly driving the inability to meet financial obligations documented in
our credit report analysis.
While acknowledging that abortion restrictions affect a woman’s ability to decide not to have
any children, in addition to the timing of such children, we also explore whether the financial con-
33

sequences observed for births following an abortion denial are similar to those observed after a birth
that results from a typical pregnancy. To do this, we use information for women in the Near Limit
group who received a wanted abortion but who later became pregnant and gave birth. These women
have similar socioeconomic characteristics to the Turnaway group. These births were a mixed of
planned and unplanned births more similar to a “typical” birth experienced in this population, rather
than an explicitly unwanted birth such as those experienced by the Turnaway group. Among these
subsequent births, we find that the financial consequences of giving birth are less severe, although
our confidence intervals are large and we cannot reject that the effects are the same as those for the
Turnaway group who gave birth. However, this exploratory analysis suggests that more wanted or
optimally timed births may have fewer economic consequences.
Our study indicates that laws that impose gestational limits for abortion result in worse financial
and economic outcomes for the women who are denied an abortion. For the women who carry their
pregnancies to term (the vast majority in our sample), there are likely to be important implications for
the well-being of their offspring. There is a large literature documenting the importance of the early
life environment for health and achievement over the life course. In particular, evidence indicates that
human capital development under age 5 can have large long-term impacts (Currie and Almond, 2011).
Given that we observe significant financial distress for the women who were turned away during this
period, there may be negative consequences for children’s basic needs and other investments during
this critical period. Providing some evidence for this, the Turnaway Study documented that women
from the Turnaway group who carried their pregnancies to term experienced worse bonding with
their child than women who received an abortion and later had a subsequent child. Children of the
Turnaway mothers also lived in households with lower income levels and were less likely to have
money to cover their basic living expenses than these other subsequent children (Foster et al., 2018).43
There are several implications for public policy. If policymakers wish to avoid the adverse eco-
nomic consequences documented here, one option would be to relax laws that impose a gestational
limit for abortion. At clinics for which these laws are binding, increasing gestational age limits would
allow more women to be served. At the same time, several clinics choose gestational age limits that
are below those legally allowed, due to clinicians’ training, availability, or preference. Increasing the
43The Turnaway Study also documents potential impacts for the other children of these women: the children that womenalready had at the time of seeking an abortion fare worse in terms of achieving developmental milestones and living ineconomic security when their mothers were denied, rather than receiving a wanted abortion (Foster et al., 2019). Also,women in the Turnaway group that carried the pregnancy to term were less likely to have subsequent pregnancies, andwere less likely to express that they intended to become pregnant again in the future, compared to the Near Limit group(Upadhyay et al., 2019).
34

number of clinicians available to perform these services (for example, by reducing the regulatory bur-
dens imposed on abortion providers) may help alleviate these supply side constraints.
An alternative approach is to craft policies that make it less likely that women will seek abortions
at later gestational ages. We can again benefit from the data collected by the Turnaway Study to iden-
tify barriers to women seeking abortions earlier in their pregnancies (Upadhyay et al., 2014). The ma-
jority of women in the Near Limit (67 percent) and Turnaway (58 percent) study groups named travel
and procedure costs as a reason for their delay in seeking an abortion. Reports of other common bar-
riers include administrative and logistical problems related to insurance coverage for the procedure,
not knowing where to get care, and not knowing how to get to a provider. Public insurance does not
cover abortion services in most cases and some private plans are prohibited from covering abortion
under state restrictions.44 These responses also suggest that increasing the availability of abortion
providers and the affordability of the procedure may help to reduce delays in seeking care. However,
other reasons that may be more difficult to address are women not recognizing their pregnancy (re-
ported by 43 percent of women in the Near Limit group and 48 percent of women in the Turnaway
group), or difficulty deciding whether to have an abortion (44 percent and 40 percent, respectively).
And, given that the current trend has been for state laws to lower gestational limits, with recent efforts
to ban abortions as early as 6 weeks or even throughout the entire pregnancy (Guttmacher Institute,
2019), it seems likely that the number of women being denied a wanted abortion in the U.S. will only
continue to grow over time.
44The Hyde Amendment bans federal funding for abortion except in cases of life endangerment, rape, and incest. Somestates choose to cover abortions under their Medicaid programs using their own funds (Salganicoff et al., 2020). In addition,some states regulate whether abortion services may be covered by private plans that are not self-insured, or for plansparticipating in the ACA marketplaces (Salganicoff et al., 2019).
35

Figure 1: Histogram of Gestational Age of Pregnancy at Time of Abortion Receipt or Denial
8 9 10 11 12 13 14 15 16 17 18 19 20 21 22 23 24 25 26 27 28 290.00
0.05
0.10
0.15
0.20
Weeks of Gestation
Fra
ctio
n of
Sam
ple
Near Limit
Turnaway
Note: These figures display histograms of the distribution of the sample for the Turnaway and Near Limitgroup based on the gestational age of the pregnancy at the time of abortion denial (in the case of the Turnawaygroup) and abortion receipt (in the case of the Near Limit group).
36

Figure 2: Financial Outcomes Relative to Event Time, by Group
−2 0 2 4
−0.
15−
0.05
0.05
0.15
Event Time
Fin
anci
al D
istr
ess
Inde
x
●
●
●
●
●
●
●
●
●
● TurnawayNear Limit
(a) Financial Distress Index
−2 0 2 4
−0.
15−
0.05
0.05
Event Time
Acc
ess
Inde
x
●
●
●●
●
●
●
●
●
● TurnawayNear Limit
(b) Credit Access Index
Note: These figures show the average value of the financial distress index (panel a) and the credit access index(panel b) by year for the Turnaway and Near Limit groups in the main sample. See text for more information.
Figure 3: Effect of an Abortion Denial on Financial Outcomes: Event Study
−2 0 2 4
−0.
050.
050.
150.
25
Event Time
Effe
ct S
ize
●
●
●
●
●●
●
● ●
●
●
●
●
●●
●
● ●
(a) Financial Distress Index
−2 0 2 4
−0.
2−
0.1
0.0
0.1
Event Time
Effe
ct S
ize
●●
●
●
● ●
●● ●
●●
●
●
● ●
●● ●
(b) Credit Access Index
Note: These figure reports coefficients from the estimation of Equation (1) for the financial distress index(panel a) and the credit access index (panel b). The coefficients represent the change in each outcome forTurnaway group members relative to Near Limit group members in the three years before and six years afterthe time of birth or counterfactual birth, as compared to the year immediately prior to this event. See text formore information.
37

Tabl
e1:
Init
ialS
urve
yM
easu
res
Acr
oss
Mat
ched
/Unm
atch
ed(S
urve
yR
espo
nden
tsO
nly)
Out
com
eN
ear
Lim
itTu
rnaw
ayM
atch
edU
nmat
ched
Diff
.(St
d.Er
r)M
atch
edU
nmat
ched
Diff
.(St
d.Er
r)H
SEd
ucat
ion
orLe
ss0.
480
0.61
4-0
.134
(0.0
64)*
*0.
453
0.70
0-0
.247
(0.0
84)*
**M
arri
ed0.
081
0.11
40.
033
(0.0
41)
0.09
3(0
.292
)0.
175
(0.3
85)
0.08
2(0
.064
)Fu
llTi
me
Empl
oyed
0.35
70.
257
0.10
0(0
.059
)*0.
267
0.27
5-0
.008
(0.0
80)
Part
Tim
eEm
ploy
ed0.
219
0.15
70.
062
(0.0
49)
0.23
30.
050
0.18
3(0
.049
)***
Enou
ghM
oney
0.55
30.
514
0.03
8(0
.066
)0.
570
0.45
00.
120
(0.0
89)
InPo
vert
y0.
555
0.62
0-0
.065
(0.0
75)
0.52
90.
774
-0.2
45(0
.091
)***
Age
atSu
rvey
25.6
26.7
-1.1
(0.8
)24
.827
.2-2
.4(1
.0)*
*R
ecei
ved
WIC
0.15
30.
143
0.01
0(0
.046
)0.
160
0.22
5-0
.065
(0.0
73)
Rec
eive
dTA
NF
0.11
70.
129
-0.0
11(0
.044
)0.
127
0.20
0-0
.073
(0.0
69)
Rec
eive
dFo
odSt
amps
0.34
50.
257
0.08
8(0
.059
)0.
400
0.57
5-0
.175
(0.0
88)*
*Bl
ack
0.30
30.
200
-0.1
03(0
.054
)*0.
267
0.30
00.
033
(0.0
81)
Whi
te0.
357
0.38
60.
028
(0.0
64)
0.42
00.
275
-0.1
45(0
.082
)*La
tina
0.19
20.
243
0.05
1(0
.056
)0.
187
0.27
50.
088
(0.0
78)
Oth
erR
ace
0.14
70.
171
0.02
4(0
.049
)0.
127
0.15
00.
023
(0.0
63)
#In
divi
dual
s33
370
150
40
Not
e:T
his
tabl
epr
esen
tsm
eans
for
outc
ome
vari
able
sob
serv
edin
the
init
ials
urve
yof
the
Turn
away
Stud
yfo
rbo
thth
ose
mat
ched
and
notm
atch
edto
the
cred
itre
cord
s.Th
ese
stat
isti
csar
edr
awn
from
the
com
plet
eTu
rnaw
aySt
udy
sam
ple,
incl
udin
gth
ose
youn
ger
than
age
20at
the
year
ofth
ebi
rth.
Ast
eris
ksin
dica
test
atis
tica
llysi
gnifi
cant
diff
eren
ces
betw
een
the
mat
ched
and
unm
atch
edsa
mpl
ew
ithi
nea
chgr
oup:
***
p<0.
01,*
*p<
0.05
,*p<
0.1.
38

Tabl
e2:
Base
line
Sam
ple
Cha
ract
eris
tics
:Mea
n,M
edia
n,an
dSt
anda
rdD
evia
tion
Firs
tTri
mes
ter
Nea
rLi
mit
Turn
away
Diff
b/w
Turn
away
and
Mea
nSt
dD
evM
edM
ean
Std
Dev
Med
Mea
nSt
dD
evM
edFi
rstT
rim
este
rN
ear
Lim
itD
elin
quen
cyO
utco
mes
:C
olle
ctio
ns($
)2,
112
3,34
368
12,
391
4,02
482
92,
887
4,92
484
177
5(3
88)∗∗
496
(385
)A
mou
ntPa
stD
ue($
)10
,037
64,1
830
2,96
813
,655
177
2,23
65,
159
298
-7,8
01(3
,701
)∗∗
-732
(544
)Pu
blic
Rec
ords
0.14
0.51
0.00
0.12
0.43
0.00
0.08
0.33
0.00
-0.0
6(0
.03)∗
-0.0
4(0
.03)
Subp
rim
eC
redi
tSco
re0.
740.
441.
000.
830.
381.
000.
840.
361.
000.
11(0
.03)∗∗∗
0.01
(0.0
3)
Acc
ess
Out
com
es:
Prim
eC
redi
tSco
re0.
130.
340.
000.
060.
250.
000.
070.
250.
00-0
.07
(0.0
2)∗∗∗
0.00
1(0
.02)
Cre
ditS
core
560.
1586
.85
547
532.
1877
.94
520
529.
9077
.82
519
-30.
25(7
.32)∗∗∗
-2.2
9(6
.27)
Cre
ditA
vaila
ble
($)
1,98
010
,649
079
85,
215
069
93,
607
0-1
,281
(722
)∗-9
9(3
45)
Any
Mor
tgag
e0.
110.
320.
000.
070.
260.
000.
030.
180.
00-0
.08
(0.0
2)∗∗∗
-0.0
39(0
.02)∗∗
#M
atch
edIn
dx
Year
Obs
.2,
165
3,35
01,
565
#M
atch
edIn
divi
dual
s24
638
318
0
Not
es:T
his
tabl
epr
esen
tsde
scri
ptiv
est
atis
tics
for
outc
ome
vari
able
sas
obse
rved
inth
eye
ars
prio
rto
the
birt
hor
coun
terf
actu
albi
rth
year
.The
sest
atis
tics
are
draw
nfr
omth
epr
imar
yan
alys
issa
mpl
e,as
desc
ribe
din
the
text
.The
final
two
colu
mns
show
the
diff
eren
cebe
twee
nth
eTu
rnaw
aygr
oup
and
the
Firs
tTri
mes
ter
grou
pan
dN
ear
Lim
itgr
oup
resp
ecti
vely
.Ast
eris
ksin
dica
test
atis
tica
llysi
gnifi
cant
diff
eren
ces:
***
p<0.
01,*
*p<
0.05
,*p<
0.1.
39

Table 3: Effect of an Abortion Denial on Financial Outcomes: Difference-in-Differences
Financial Distress Index Collections Public Records Amount Past Due Subprime
Post × Turnaway 0.102** 202.46 0.065** 1,749.7** 0.010(0.045) (529.56) (0.026) (702.47) (0.023)
Pre-Period Turnaway Mean 2887 0.08 2236 0.84
Credit Access Index Prime Credit Score Any Mortgage Available Credit Credit Score
Post × Turnaway -0.009 -0.014 0.006 297.30 -4.857(0.054) (0.018) (0.016) (490.03) (5.191)
Pre-Period Turnaway Mean 0.065 0.033 698.72 529.9
Notes: N=4,914. Analyses use 2006-2016 Experian credit report files for Turnaway and Near Limit sample ofwomen age 20 and older the year of the birth or counterfactual birth. Sample is restricted to women who hada credit report record prior to the birth or counterfactual birth. All regression models include individual fixedeffects and an indicator that event time≥0. Robust standard errors are clustered by individual. Significancelevels: *=10%, **=5%, ***=1%. Pre-birth mean for Turnaway mothers reported in bottom row.
Table 4: Alternative Specifications: Financial Distress Measures
Financial Distress Index Collections Public Records Amount Past Due Subprime
Pre-Period Missings as Zero 0.117** 196.58 0.064*** 1,687.25** 0.010N=5,076 (0.047) (508.095) (0.025) (676.75) (0.023)
Missings Imputed 0.110** 202.19 0.058** 1,521.36** 0.016N=5,207 (0.048) (485.84) (0.024) (645.46) (0.022)
All Ages 0.096** 185.04 0.062** 1,667.68** 0.008N=5,150 (0.043) (511.13) (0.025) (678.28) (0.023)
Cluster by Clinic 0.102** 202.46 0.065*** 1,749.69*** 0.010N=4,914 (0.044) (529.56) (0.023) (611.057) (0.023)
Aggregated Clinic-Level Regressions 0.089** 38.62 0.061** 1,696.24** 0.009N=4,914 (0.044) (531.78) (0.025) (713.80) (0.023)
Include Year FE 0.102** 190.13 0.066** 1,760.53** 0.010N=4,914 (0.040) (529.69) (0.026) (704.37) (0.023)
Winsorize Continuous Outcomes 0.087** 79.81 0.064** 967.38* 0.010N=4,914 (0.040) (351.12) (0.023) (527.50) (0.023)
Include Turnaway × Unemployment 0.093** 91.71 0.059** 1,759.91** 0.010N=4,914 (0.046) (557.47) (0.027) (689.47) (0.026)
Notes: Analyses use 2006-2016 Experian credit report files for Turnaway and Near Limit sample of women. Eachrow shows results for a different sample or model specification. All regression models include individual fixedeffects and an indicator that event time≥0. Robust standard errors are clustered by individual. Significancelevels: *=10%, **=5%, ***=1%. Pre-birth mean for Turnaway mothers reported in bottom row.
40
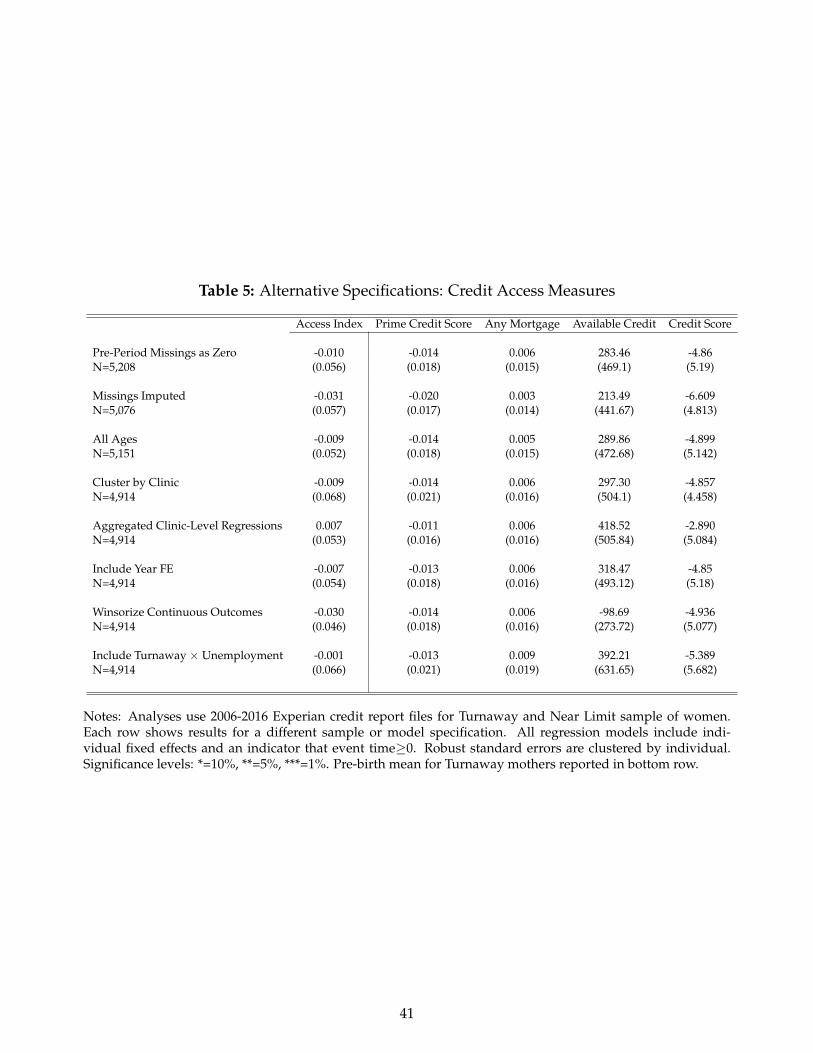
Table 5: Alternative Specifications: Credit Access Measures
Access Index Prime Credit Score Any Mortgage Available Credit Credit Score
Pre-Period Missings as Zero -0.010 -0.014 0.006 283.46 -4.86N=5,208 (0.056) (0.018) (0.015) (469.1) (5.19)
Missings Imputed -0.031 -0.020 0.003 213.49 -6.609N=5,076 (0.057) (0.017) (0.014) (441.67) (4.813)
All Ages -0.009 -0.014 0.005 289.86 -4.899N=5,151 (0.052) (0.018) (0.015) (472.68) (5.142)
Cluster by Clinic -0.009 -0.014 0.006 297.30 -4.857N=4,914 (0.068) (0.021) (0.016) (504.1) (4.458)
Aggregated Clinic-Level Regressions 0.007 -0.011 0.006 418.52 -2.890N=4,914 (0.053) (0.016) (0.016) (505.84) (5.084)
Include Year FE -0.007 -0.013 0.006 318.47 -4.85N=4,914 (0.054) (0.018) (0.016) (493.12) (5.18)
Winsorize Continuous Outcomes -0.030 -0.014 0.006 -98.69 -4.936N=4,914 (0.046) (0.018) (0.016) (273.72) (5.077)
Include Turnaway × Unemployment -0.001 -0.013 0.009 392.21 -5.389N=4,914 (0.066) (0.021) (0.019) (631.65) (5.682)
Notes: Analyses use 2006-2016 Experian credit report files for Turnaway and Near Limit sample of women.Each row shows results for a different sample or model specification. All regression models include indi-vidual fixed effects and an indicator that event time≥0. Robust standard errors are clustered by individual.Significance levels: *=10%, **=5%, ***=1%. Pre-birth mean for Turnaway mothers reported in bottom row.
41
References
Adda, J., C. Dustmann, and K. Stevens (2017, April). The Career Costs of Children. Journal of Political
Economy 125(2), 293–337.
Agüero, J. M. and M. S. Marks (2008). Motherhood and Female Labor Force Participation: Evidence
from Infertility Shocks. The American Economic Review 98(2), 500–504.
Ananat, E. O., J. Gruber, and P. Levine (2007). Abortion Legalization and Life-Cycle Fertility. The
Journal of Human Resources 42(2), 375–397.
Ananat, E. O., J. Gruber, P. B. Levine, and D. Staiger (2009). Abortion and Selection. The Review of
Economics and Statistics 91(1), 124–136.
Angrist, J. D. and W. N. Evans (2000). Schooling and Labor Market Consequences of the 1970 State
Abortion Reforms. Research in Labor Economics 18, 75–113.
Argys, L. M., A. I. Friedson, M. M. Pitts, and D. S. Tello-Trillo (2019, October). Losing Public Health
Insurance: TennCare Disenrollment and Personal Financial Distress. Technical Report Working
Paper 2017-6a, Federal Reserve Bank of Atlanta.
Ashcraft, A., I. Fernández-Val, and K. Lang (2013). The Consequences of Teenage Childbearing: Con-
sistent Estimates When Abortion Makes Miscarriage Non-random. The Economic Journal 123(571),
875–905. _eprint: https://onlinelibrary.wiley.com/doi/pdf/10.1111/ecoj.12005.
Assifi, A. R., B. Berger, Ö. Tunçalp, R. Khosla, and B. Ganatra (2016, March). Women’s Awareness and
Knowledge of Abortion Laws: A Systematic Review. PLOS ONE 11(3), e0152224.
Bailey, M. J. (2006). More Power to the Pill: The Impact of Contraceptive Freedom on Women’s Life
Cycle Labor Supply. The Quarterly Journal of Economics 121(1), 289–320.
Bailey, M. J., M. Guldi, and B. J. Hershbein (2013). Further Evidence on the Internal Validity of the
Early Legal Access Research Design. Journal of Policy Analysis and Management 32(4), 899–904.
Bailey, M. J., B. Hershbein, and A. R. Miller (2012, July). The Opt-In Revolution? Contraception and
the Gender Gap in Wages. American Economic Journal: Applied Economics 4(3), 225–254.
42

Bailey, M. J., H. W. Hoynes, M. Rossin-Slater, and R. Walker (2020, April). Is the Social Safety Net
a Long-Term Investment? Large-Scale Evidence from the Food Stamps Program. Working Paper
26942, National Bureau of Economic Research. Series: Working Paper Series.
Bailey, M. J. and J. M. Lindo (2017, September). Access and Use of Contraception and Its Effects on Women’s
Outcomes in the United States, Volume 1. Oxford University Press.
Barr, A. and C. R. Gibbs (2019, October). Breaking the Cycle? Intergenerational Effects of an Anti-
Poverty Program in Early Childhood. Technical Report 19-141, Annenberg Institute at Brown Uni-
versity.
Barreca, A. I., J. M. Lindo, and G. R. Waddell (2016). Heaping-Induced Bias
in Regression-Discontinuity Designs. Economic Inquiry 54(1), 268–293. _eprint:
https://onlinelibrary.wiley.com/doi/pdf/10.1111/ecin.12225.
Biggs, M. A., U. D. Upadhyay, C. E. McCulloch, and D. G. Foster (2017, February). Women’s Men-
tal Health and Well-being 5 Years After Receiving or Being Denied an Abortion: A Prospective,
Longitudinal Cohort Study. JAMA Psychiatry 74(2), 169–178.
Billings, S. B., E. Gallagher, and L. Ricketts (2019, May). Let the Rich Be Flooded: The Unequal Impact
of Hurricane Harvey on Household Debt. SSRN Scholarly Paper ID 3396611, Social Science Research
Network, Rochester, NY.
Bitler, M. and M. Zavodny (2001, November). The effect of abortion restrictions on the timing of
abortions. Journal of Health Economics 20(6), 1011–1032.
Bitler, M. and M. Zavodny (2002, April). Child Abuse and Abortion Availability. American Economic
Review 92(2), 363–367.
Bitler, M. P. and M. Zavodny (2004, June). Child Maltreatment, Abortion Availability, and Economic
Conditions. Review of Economics of the Household 2(2), 119–141.
Blank, R. M., C. C. George, and R. A. London (1996). State Abortion Rates: The Impact of Policies,
Providers, Politics, Demographics, and Economic Environment. Journal of Health Economics 15, 513–
553.
43

Cattaneo, M. D., R. Titiunik, and G. Vazquez-Bare (2020, June). The Regression Discontinuity De-
sign. In Handbook of Research Methods in Political Science and International Relations, pp. 835–857. Sage
Publications. arXiv: 1906.04242.
Colman, S., S. Colman, and T. Joyce (2011). Regulating Abortion: Impact on Patients and Providers in
Texas. Journal of Policy Analysis and Management 30(4), 775–797.
Colman, S. and T. Joyce (2009, June). Minors’ Behavioral Responses to Parental Involvement Laws:
Delaying Abortion Until Age 18. Perspectives on Sexual and Reproductive Health 41(2), 119–126.
Colman, S., T. Joyce, and R. Kaestner (2008, October). Misclassification Bias and the Estimated Effect
of Parental Involvement Laws on Adolescents’ Reproductive Outcomes. American Journal of Public
Health 98(10), 1881–1885.
Cowles, C. (2018, November). What to Know About the Cost of an Abortion.
Currie, J. and D. Almond (2011). Human capital development before age five. In Handbook of Labor
Economics, Volume 4, pp. 1315–1486. Elsevier.
Deshpande, M., T. Gross, and Y. Su (2019, March). Disability and Distress: The Effect of Disability
Programs on Financial Outcomes. Technical Report w25642, National Bureau of Economic Research.
Dobkin, C., A. Finkelstein, R. Kluender, and M. J. Notowidigdo (2018, February). The Economic
Consequences of Hospital Admissions. American Economic Review 108(2), 308–352.
Dobkin, L. M., H. Gould, R. E. Barar, M. Ferrari, E. I. Weiss, and D. G. Foster (2014, January). Imple-
menting a Prospective Study of Women Seeking Abortion in the United States: Understanding and
Overcoming Barriers to Recruitment. Women’s Health Issues 24(1), e115–e123.
Donohue, III, J. J. and S. D. Levitt (2001). The Impact of Legalized Abortion on Crime. Quarterly Journal
of Economics 116(2), 379–420.
Drey, E. A., D. G. Foster, R. A. Jackson, S. J. Lee, L. H. Cardenas, and P. D. Darney (2006, January).
Risk Factors Associated With Presenting for Abortion in the Second Trimester:. Obstetrics & Gyne-
cology 107(1), 128–135.
Experian (2015, January). VantageScore 3.0. Technical report, Experian Information Solutions, Inc.
44

Finer, L. B., L. F. Frohwirth, L. A. Dauphinee, S. Singh, and A. M. Moore (2005). Reasons U.S. Women
Have Abortions: Quantitative and Qualitative Perspectives. Perspectives on Sexual and Reproductive
Health 37(3), 110–118.
Finer, L. B., L. F. Frohwirth, L. A. Dauphinee, S. Singh, and A. M. Moore (2006, October). Timing of
steps and reasons for delays in obtaining abortions in the United States. Contraception 74(4), 334–344.
Finer, L. B. and M. R. Zolna (2016, March). Declines in Unintended Pregnancy in the United States,
2008–2011. New England Journal of Medicine 374(9), 843–852.
Finkelstein, A., S. Taubman, B. Wright, M. Bernstein, J. Gruber, J. P. Newhouse, H. Allen, and
K. Baicker (2012, July). The Oregon Health Insurance Experiment: Evidence from the first year.
The Quarterly Journal of Economics Advance Access.
Fischer, S., H. Royer, and C. White (2018, November). The impacts of reduced access to abortion
and family planning services on abortions, births, and contraceptive purchases. Journal of Public
Economics 167, 43–68.
Fletcher, J. M. and B. L. Wolfe (2009, March). Education and Labor Market Consequences of Teenage
Childbearing Evidence Using the Timing of Pregnancy Outcomes and Community Fixed Effects.
Journal of Human Resources 44(2), 303–325.
Foster, D. G. (2017, November). Dramatic Decreases in US Abortion Rates: Public Health Achievement
or Failure? American Journal of Public Health 107(12), 1860–1862.
Foster, D. G., M. A. Biggs, S. Raifman, J. Gipson, K. Kimport, and C. H. Rocca (2018, November).
Comparison of Health, Development, Maternal Bonding, and Poverty Among Children Born After
Denial of Abortion vs After Pregnancies Subsequent to an Abortion. JAMA Pediatrics 172(11), 1053.
Foster, D. G., M. A. Biggs, L. Ralph, C. Gerdts, S. Roberts, and M. M. Glymour (2018, January). Socioe-
conomic Outcomes of Women Who Receive and Women Who Are Denied Wanted Abortions in the
United States. American Journal of Public Health 108(3), 407–413.
Foster, D. G., L. M. Dobkin, and U. D. Upadhyay (2013, January). Denial of abortion care due to
gestational age limits. Contraception 87(1), 3–5.
45

Foster, D. G., S. E. Raifman, J. D. Gipson, C. H. Rocca, and M. A. Biggs (2019, February). Effects of Car-
rying an Unwanted Pregnancy to Term on Women’s Existing Children. The Journal of Pediatrics 205,
183–189.e1.
Fuji, D., G. Imbens, and K. Kalyanaraman (2009, September). Notes for Matlab and Stata Regression
Discontinuity Software.
Gerdts, C., L. Dobkin, D. G. Foster, and E. B. Schwarz (2016, January). Side Effects, Physical Health
Consequences, and Mortality Associated with Abortion and Birth after an Unwanted Pregnancy.
Women’s Health Issues 26(1), 55–59.
Girma, S. and D. Paton (2013, December). Does Parental Consent for Birth Control Affect Underage
Pregnancy Rates? The Case of Texas. Demography 50(6), 2105–2128.
Goldin, C. and L. F. Katz (2002). The Power of the Pill: Oral Contraceptives and Women’s Career and
Marriage Decisions. Journal of Political Economy 110(4), 730–770.
Gross, T., M. J. Notowidigdo, and J. Wang (2020, April). The Marginal Propensity to Consume over
the Business Cycle. American Economic Journal: Macroeconomics 12(2), 351–384.
Grossman, D., S. Baum, L. Fuentes, K. White, K. Hopkins, A. Stevenson, and J. E. Potter (2014, Novem-
ber). Change in abortion services after implementation of a restrictive law in Texas. Contracep-
tion 90(5), 496–501.
Gruber, J., P. Levine, and D. Staiger (1999). Abortion Legalization and Child Living Circumstances:
Who is the Marginal Child? Quarterly Journal of Economics 114(1), 263–291.
Guttmacher Institute (2019, October). State Bans on Abortion Throughout Pregnancy.
Hock, H. (2008). The Pill and the College Attainment of American Women and Men. SSRN Electronic
Journal.
Hoynes, H., D. W. Schanzenbach, and D. Almond (2016, April). Long-Run Impacts of Childhood
Access to the Safety Net. American Economic Review 106(4), 903–934.
Hu, L., R. Kaestner, B. Mazumder, S. Miller, and A. Wong (2018, July). The Effect of the Patient
Protection and Affordable Care Act Medicaid Expansions on Financial Wellbeing. Journal of Public
Economics 163(99-112).
46

Humphries, J. E., N. S. Mader, D. I. Tannenbaum, and W. L. van Dijk (2019, August). Does Evic-
tion Cause Poverty? Quasi-Experimental Evidence from Cook County, IL. Working Paper 26139,
National Bureau of Economic Research.
Jatlaoui, T. C., M. E. Boutot, M. G. Mandel, M. K. Whiteman, A. Ti, E. Petersen, and K. Pazol (2018,
November). Abortion Surveillance — United States, 2015. MMWR. Surveillance Summaries 67(13),
1–45.
Jerman, J. and R. K. Jones (2014, July). Secondary Measures of Access to Abortion Services in the
United States, 2011 and 2012: Gestational Age Limits, Cost, and Harassment. Women’s Health Is-
sues 24(4), e419–e424.
Jerman, J., R. K. Jones, and T. Onda (2016, May). Characteristics of U.S. Abortion Patients in 2014 and
Changes Since 2008. Technical report, Guttmacher Institute, New York.
Jones, R. K. and L. B. Finer (2012, June). Who has second-trimester abortions in the United States?
Contraception 85(6), 544–551.
Jones, R. K. and J. Jerman (2017, October). Population Group Abortion Rates and Lifetime Incidence
of Abortion: United States, 2008–2014. American Journal of Public Health 107(12), 1904–1909.
Joyce, T. (2004). Did Legalized Abortion Lower Crime? The Journal of Human Resources 39(1), 1–28.
Joyce, T. (2009, February). A Simple Test of Abortion and Crime. Review of Economics and Statistics 91(1),
112–123.
Joyce, T. (2010, September). Parental Consent for Abortion and the Judicial Bypass Option in Arkansas:
Effects and Correlates. Perspectives on Sexual and Reproductive Health 42(3), 168–175.
Joyce, T. (2013). How Important Was the Pill to Women’s Economic Well-Being? If Roe V. Wade Were
Overturned, How Might Society Change? Journal of Policy Analysis and Management 32(4), 879–887.
Joyce, T. and R. Kaestner (1996). State reproductive policies and adolescent pregnancy resolution: the
case of parental involvement laws. Journal of Health Economics 15, 579–607.
Joyce, T. and R. Kaestner (2000). The Impact of Mississippi’s Mandatory Delay Law on the Timing of
Abortion. Family Planning Perspectives 32(1), 4–13.
47

Joyce, T. and R. Kaestner (2001, March). The Impact of Mandatory Waiting Periods and Parental
Consent Laws on the Timing of Abortion and State of Occurrence among Adolescents in Mississippi
and South Carolina. Journal of Policy Analysis and Management 20(2), 263–282.
Joyce, T., R. Kaestner, and S. Colman (2006). Changes in Abortions and Births and the Texas Parental
Notification Law. The New England Journal of Medicine, 8.
Kaiser Family Foundation (2019, June). States with Gestational Limits for Abortion. Technical report.
Kelly, A. M. (2019, November). When Capacity Constraints Bind: Evidence from Reproductive Health
Clinic Closures. Texas A&M University Working Paper.
Klepinger, D., S. Lundberg, and R. Plotnick (1999). How Does Adolescent Fertility Affect the Human
Capital and Wages of Young Women? The Journal of Human Resources 34(3), 421–448.
Kleven, H., C. Landais, and J. E. Søgaard (2019, October). Children and Gender Inequality: Evidence
from Denmark. American Economic Journal: Applied Economics 11(4), 181–209.
Kling, J. R., J. B. Liebman, and L. F. Katz (2007). Experimental Analysis of Neighborhood Ef-
fects. Econometrica 75(1), 83–119. _eprint: https://onlinelibrary.wiley.com/doi/pdf/10.1111/j.1468-
0262.2007.00733.x.
Lara, D., K. Holt, M. Peña, and D. Grossman (2015, December). Knowledge of Abortion Laws and
Services Among Low-Income Women in Three United States Cities. Journal of Immigrant and Minority
Health 17(6), 1811–1818.
Lee, D. S. and T. Lemieux (2010, June). Regression Discontinuity Designs in Economics. Journal of
Economic Literature 48(2), 281–355.
Levine, P. B. (2003, September). Parental involvement laws and fertility behavior. Journal of Health
Economics 22(5), 861–878.
Levine, P. B., A. B. Trainor, and D. J. Zimmerman (1996). The Effect of Medicaid Abortion Funding
Restrictions on Abortions, Pregnancies and Births. Journal of Health Economics 15, 555–578.
Lindo, J., C. Myers, A. Schlosser, and S. Cunningham (2019). How Far is Too Far? New Evidence on
Abortion Clinic Closures, Access, and Abortions. Journal of Human Resources (an_). type: dataset.
48

Lindo, J. M. and M. Pineda-Torres (2019, September). New Evidence on the Effects of Mandatory
Waiting Periods for Abortion. Working Paper 26228, National Bureau of Economic Research.
Lino, M., K. Kuczynski, N. Rodriguez, and T. Schap (2017, March). Expenditures on Children by Fam-
ilies, 2015. Miscellaneous Report No. 1528-2015, United States Department of Agriculture, Center
for Nutrition Policy and Promotion.
Miller, A. R. (2011). The effects of motherhood timing on career path. Journal of Population Eco-
nomics 24(3), 1071–1100.
Miller, S., L. Hu, R. Kaestner, B. Mazumder, and A. Wong (2018, September). The ACA Medicaid
Expansion in Michigan and Financial Health. Working Paper 25053, National Bureau of Economic
Research.
Miller, S. and C. K. Soo (2018, September). Do Neighborhoods Affect Credit Market Decisions of Low-
Income Borrowers? Evidence from the Moving to Opportunity Experiment. Working Paper 25023,
National Bureau of Economic Research.
Miller, S., L. R. Wherry, and D. G. Foster (2020, May). What Happens After an Abortion Denial? A
Review of Results from the Turnaway Study. American Economic Association Papers & Proceedings.
Myers, C. K. (2017). The Power of Abortion Policy: Reexamining the Effects of Young Women’s Access
to Reproductive Control. Journal of Political Economy 125(6), 2178–2224.
Nash, E., R. Benson Gold, A. Rowan, G. Rathburn, and Y. Vierboom (2013, December). Laws Affecting
Reproductive Health and Rights: 2013 State Policy Review. Technical report, Guttmacher Institute,
New York, NY.
Nash, E., R. B. Gold, L. Mohammed, Z. Ansari-Thomas, and O. Cappello (2018, January). Policy
Trends in the States, 2017. Technical report, Guttmacher Institute, New York, NY.
Quast, T., F. Gonzalez, and R. Ziemba (2017, March). Abortion Facility Closings and Abortion Rates
in Texas. Inquiry : A Journal of Medical Care Organization, Provision and Financing 54.
Ralph, L. J., E. B. Schwarz, D. Grossman, and D. G. Foster (2019, June). Self-reported Physical Health
of Women Who Did and Did Not Terminate Pregnancy After Seeking Abortion Services: A Cohort
Study. Annals of Internal Medicine.
49

Roberts, S. C., M. A. Biggs, K. S. Chibber, H. Gould, C. H. Rocca, and D. G. Foster (2014, December).
Risk of violence from the man involved in the pregnancy after receiving or being denied an abortion.
BMC Medicine 12(1), 144.
Roberts, S. C. M., H. Gould, and U. D. Upadhyay (2015, August). Implications of Georgia’s 20-Week
Abortion Ban. American Journal of Public Health 105(8), e77–e82.
Roth, J. (2019, July). Pre-test with Caution: Event-study Estimates After Testing for Parallel Trends.
Harvard University Working Paper.
Salganicoff, A., L. Sobel, and A. Ramaswamy (2019, July). Coverage for Abortion Services in Medi-
caid, Marketplace Plans, and Private Plans. Technical report, Henry J. Kaiser Family Foundation,
Washington, DC.
Salganicoff, A., L. Sobel, and A. Ramaswamy (2020, January). The Hyde Amendment and Coverage
for Abortion Services. Technical report, Henry J. Kaiser Family Foundation, Washington, DC.
Sandler, D. and N. Szembrot (2019). Maternal Labor Dynamics: Participation, Earnings, and Em-
ployer Changes. Denter for Economic Studies Working Paper No. CES 19-33, U.S. Census Bureau,
Washington, DC.
Schulkind, L. and D. H. Sandler (2019, February). The Timing of Teenage Births: Estimating the Effect
on High School Graduation and Later-Life Outcomes. Demography 56(1), 345–365.
Sun, S. (2019). Less is More: How Family Size in Childhood Affects Long-Run Human Capital and
Economic Opportunity. Working Paper, 50.
Tavernise, S. (2019, May). ‘The Time is Now’: States Are Rushing to Restrict Abortion, or to Protect It.
The New York Times.
Upadhyay, U. D., E. A. Aztlan-James, C. H. Rocca, and D. G. Foster (2019, January). Intended Preg-
nancy after Receiving vs. Being Denied a Wanted Abortion. Contraception 99(1), 42–47.
Upadhyay, U. D., T. A. Weitz, R. K. Jones, R. E. Barar, and D. G. Foster (2014, September). Denial of
Abortion Because of Provider Gestational Age Limits in the United States. American Journal of Public
Health 104(9), 1687–1694.
50

Venator, J. and J. Fletcher (2019, October). Undue Burden Beyond Texas: An Analysis of Abortion
Clinic Closures, Births, And Abortions in Wisconsin. Working Paper 26362, National Bureau of
Economic Research.
Zedlewski, S. and O. Golden (2010, February). Next Steps for Temporary Assistance for Needy Fami-
lies. Brief 11, The Urban Institute, Washington, DC.
51

The Economic Consequences of Being Denied an Abortion
Appendix
Sarah Miller Laura R. Wherry Diana Greene Foster
This appendix provides further details and additional results to supplement those presented in
the main text. Details on match rates by participant age and differential match rates by study group are
reported in Figures A1 and A2. Analytic sample inclusion criteria are found in Figure A3; each column
represents a step in the sample inclusion criteria process and shows the number of observations that
meet this and all previous inclusion criteria. Plots of the summary index components are reported
in Figures A4 and A5. These plots are analogous to those presented in Figure 2 in the main text,
but for component outcomes. Table A1 shows estimates calculated relying on post-period data only.
Table A2 further breaks down the components of public records, while Table A3 shows changes in
the distribution of collections and amount past due. Table A4 shows collection amounts by type of
collection. Table A5 shows event study estimates when a differential “pre-trend” is included in the
model.
Tables A6-A11 and Figure A8-A14 present results from additional analyses described in the text.
Tables A6-A8 and Figures A8-A11 show the results for the regression discontinuity analysis. Figure A8
shows the change in the fraction of women turned away at each estimated clinic cutoff. Figure A9 and
Table A6 report checks for discontinuities across the gestational age cutoff for women who responded
to the baseline survey. Figures A10-A11 and Table A7 present the results of the RD analysis, while
results for a “donut” RD that drops women with gestational ages equal to or within one day of the
cutoff are in Table A8. More details on our estimation of the clinic-specific gestational age cutoffs are
below in Section A. Table A11 runs the main analysis by state groups defined using the generosity
of state welfare programs. Figure A14 shows the results for the analysis that compares outcomes for
subsequent births of the Near Limit group to the Turnaway births.
A Estimation of Clinic-Specific Gestational Age Cutoffs
Over the period of the Turnaway Study, several clinics changed their policies regarding the latest
gestational age at which they would provide an abortion. These policy changes were not recorded.
Furthermore, clinic policies could change on a day-to-day basis depending on the availability of
52

providers. In order to estimate an RD model using gestational age, we must first estimate the most
likely gestational age at each clinic. To do this, we implement a simple RD model for each site that
estimates the probability that a woman was turned away at different gestation week cutoffs. Our can-
didate cutoffs include the earliest cutoff at which we observe a woman being turned away (which may
be a fraction of gestational weeks–e.g., 16 weeks and 5 days) and all possible cutoffs at round num-
bers of weeks (i.e. not fractions of weeks) within the entire distribution of gestational ages of women
turned away from that given clinic. We estimate a linear RD model that identifies the change in the
likelihood of being turned away among all participants in the Near Limit and Turnaway groups at the
clinic at each of these cutoffs with an indicator variable for women with pregnancies of gestational age
at or above the cutoff. It includes a running variable measuring distance in gestational age from the
cutoff and we allow the slope to vary before and after the cutoff. This model is estimated separately
for each clinic and for all possible cutoffs. We select the clinic-specific cutoff using the largest t-statistic
associated with this indicator variable across all candidate cutoffs. Note that only one cutoff is chosen
per clinic, the cutoff that performs best (i.e. generates the largest t-statistic) at predicting Turnaway
status.
B Additional “RD-DD” Analysis
In addition to our main RD analysis, we also estimate an alternative “RD-DD” specification that dif-
ferences the discontinuity observed at the gestational age cutoff before and after the birth year in the
linear parametric model. To do this, we pool all years, including those prior to the birth, and estimate:
Yict =βRD,DD1(gic ≥ 0)× Postt + β11(gic ≥ 0) + β2gic + β31(gic ≥ 0)× gic+ (5)
β4Postt × gic + β5Postt × 1(gic ≥ 0)× gic + εict.
Here, the coefficient βRD,DD provides the difference in the discontinuity estimated before the birth
year (Postt = 0), and in the year of the birth and later (Postt = 1). In this way, the analysis uses pre-
period data to control for any pre-existing differences in outcomes at the cutoff. As in all RD models,
we cluster the standard errors at the individual level.
We present estimates for the RD-DD model in the last row of Table A7. This model estimates the
difference in the parametric linear RD estimate before and after the birth year. Estimates generated
from this model are consistent with the previous event study and RD results: we find large and statis-
53

tically significant increases in financial distress associated with abortion denial but little evidence of
change in the credit access index.
54

Figure A1: Fraction Not Matched by Age for Near Limit (Light Blue) and Turnaway Group(Dark Blue)
0.00
0.25
0.50
0.75
16 17 18 19 20 21 22 23 24 25 26 27 28 29 30 31 32 33 34 35 36 37 38 39 40
Age
Fra
ctio
n N
ot M
atch
ed
Note: This bar chart shows the fraction of the Near Limit (light blue) and Turnaway Group (dark blue) who arenot matched to the credit report data at each age we observe them.
55

Figure A2: Changes in Probability of Not Matching to Credit Reporting Agency Data byEvent Year
−2 0 2 4
−0.
06−
0.02
0.02
0.06
Event Time
Effe
ct S
ize ●
●●
●
●
● ● ●●
●
●●
●
●
● ● ●●
Note: This event study figures shows estimates of equation (1) where the dependent variable equals 1 if thewoman did not match to the credit reporting data in that year. Note that this estimation includes those with nopre-period match to the credit reporting data.
Figure A3: Sample Size by Inclusion Criteria
TurnawaySample:292
TurnawaySample:222
TurnawaySample:191
TurnawaySample:180
NearLimitSample:536
NearLimitSample:430
NearLimitSample:403
NearLimitSample:383
InitialSample MatchedtoCreditReportinAnyYear
AtLeastAge20YearofBirth(Final
Sample)
MatchedtoCreditReportinPre-Period
Note: This flow chart demonstrates how sample sizes change for each sample inclusion criteria for theTurnaway (top) and Near Limit (bottom) groups.
56

Figure A4: Financial Distress Component Outcomes Relative to Event Time, for the Turn-away Group (Green) and Near Limit Group (Blue)
−2 0 2 4
0.75
0.80
0.85
0.90
Event Time
Sub
prim
e
●●
●
●●
●
●
●
●
(a) Subprime
−2 0 2 4
2000
3000
4000
Event Time
Col
lect
ions
● ●
●
●
●
●
●●
●
(b) Collections
−2 0 2 4
0.06
0.08
0.10
0.12
0.14
Event Time
Pub
lic R
ecor
ds
●
●
●
●
●
●●
●
●
(c) Public Records
−2 0 2 4
1500
2500
3500
4500
Event Time
Am
ount
Pas
t Due
● ●
●●
●
●
●
●
●
(d) Past Due
Note: This figure plots average outcomes relative to event time for the Turnaway group (green with circlepoints) and the Near Limit group (blue with triangle points).
57

Figure A5: Access Component Outcomes Relative to Event Time, for the Turnaway Group(Green) and Near Limit Group (Blue)
−2 0 2 4
0.04
0.06
0.08
0.10
0.12
Event Time
Prim
e C
redi
t Sco
re
●
●
●
●
●
●
●
●
●
(a) Prime Credit Score
−2 0 2 4
520
530
540
550
560
Event Time
Cre
dit S
core
●
●
●
●
● ●
●
●
●
(b) Credit Score
−2 0 2 4
0.01
0.03
0.05
0.07
Event Time
Any
Mor
tgag
e
●
●
● ● ●
●
●
●
●
(c) Mortgage
−2 0 2 4
400
600
800
1000
1200
Event Time
Ava
ilabl
e C
redi
t
●●
●
●
●
●
●
●
●
(d) Credit Card Credit Available
Note: This figure plots average outcomes relative to event time for the Turnaway group (green with circlepoints) and the Near Limit group (blue with triangle points).
58

Figure A6: Event Study Coefficients: Financial Distress Component Measures
−2 0 2 4
−10
000
1000
2000
Event Time
Effe
ct S
ize
●
● ●●
● ●
●
● ●●
● ●●
● ●
●
● ●
(a) Collections
−2 0 2 4
−0.
050.
000.
050.
10
Event Time
Effe
ct S
ize ●
●
●
●
●●
●
●●
●
●
●
●
●●
●
●●
(b) Subprime Credit Score
−2 0 2 4
−40
00−
2000
020
0040
00
Event Time
Effe
ct S
ize
●
●
●
● ●
●
●
●
●
●
●
●
● ●
●
●
●
●
(c) Amount Past Due
−2 0 2 4
−0.
100.
000.
050.
100.
150.
20
Event Time
Effe
ct S
ize
●
●●
●
●
●
●●
●
●
●●
●
●
●
●●
●
(d) Public Records
Note: These figures report coefficients from the estimation of Equation (1) for the specified outcome. Thecoefficients represent the change in the outcome for Turnaway group members relative to Near Limit groupmembers in the three years before and six years after the time of birth or counterfactual birth, as compared tothe year immediately prior to this event. See text for more information.
59

Figure A7: Event Study Coefficients: Access Component Measures
−2 0 2 4
−0.
040.
000.
020.
04
Event Time
Effe
ct S
ize
●●
●●
●
●
●
● ●
●●
●●
●
●
●
● ●
(a) Any Mortgage
−2 0 2 4
−15
00−
500
050
010
00
Event Time
Effe
ct S
ize
●
●
●
●●
● ● ● ●
●
●
●
●●
● ● ● ●
(b) Credit Available
−2 0 2 4
−20
−10
010
20
Event Time
Effe
ct S
ize
●
●
● ●
●●
●●
●
●
●
● ●
●●
●●
●
(c) Credit Score
−2 0 2 4
−0.
10−
0.05
0.00
0.05
Event Time
Effe
ct S
ize
●
●
●
●
● ●
● ● ●●
●
●
●
● ●
● ● ●
(d) Prime Credit Score
Note: These figures report coefficients from the estimation of Equation (1) for the specified outcome. Thecoefficients represent the change in the outcome for Turnaway group members relative to Near Limit groupmembers in the three years before and six years after the time of birth or counterfactual birth, as compared tothe year immediately prior to this event. See text for more information.
60

Figure A8: Change in Fraction Turned Away Relative to Estimated Clinic Cutoff
0.2
.4.6
.81
-40 -20 0 20Gestation Age (Days)
Note: This figure shows the fraction of women who were turned away at each day relative to the estimatedclinic-specific cutoff. Points represent means of the gestation age-specific denial rate. The lines are fitted valuesfrom a regression that includes a linear trend in gestational age and a dummy for gestation ages greater than orequal to the cutoff age.
61

Figure A9: RDD Graphs for Characteristics at Baseline Survey0
.2.4
.6.8
1
-30 -20 -10 0 10 20Gestation Age (Days)
(a) High School Education or Less
0.2
.4.6
.81
-30 -20 -10 0 10 20Gestation Age (Days)
(b) Unmarried
0.2
.4.6
.8
-30 -20 -10 0 10 20Gestation Age (Days)
(c) Full Time Employed
0.1
.2.3
.4.5
-30 -20 -10 0 10 20Gestation Age (Days)
(d) Part Time Employed
0.2
.4.6
.81
-30 -20 -10 0 10 20Gestation Age (Days)
(e) Enough Money
2426
2830
32
-30 -20 -10 0 10 20Gestation Age (Days)
(f) Age at Birth or CounterfactualBirth
0.1
.2.3
.4
-30 -20 -10 0 10 20Gestation Age (Days)
(g) Received WIC
0.1
.2.3
.4.5
-30 -20 -10 0 10 20Gestation Age (Days)
(h) Received TANF
0.2
.4.6
.81
-30 -20 -10 0 10 20Gestation Age (Days)
(i) Received Food Stamps
Note: For each characteristics, points represent means for each gestation age relative to the cutoff. The lines arefitted values from a regression that includes a linear trend in gestational age and a dummy for gestation agesgreater than or equal to the cutoff age.
62

Figure A10: RDD Graphs By Event Time, Outcome: Financial Distress Index-1
-.50
.51
-30 -20 -10 0 10 20Gestation Age (Days)
(a) Event time= -3
-.20
.2.4
.6.8
-30 -20 -10 0 10 20Gestation Age (Days)
(b) Event time= -2
-.50
.51
1.5
-30 -20 -10 0 10 20Gestation Age (Days)
(c) Event time= -1
-.20
.2.4
.6
-30 -20 -10 0 10 20Gestation Age (Days)
(d) Event time= 0 (Year of Birth)
-.20
.2.4
-30 -20 -10 0 10 20Gestation Age (Days)
(e) Event time=1
-.4-.2
0.2
.4.6
-30 -20 -10 0 10 20Gestation Age (Days)
(f) Event time=2
-1-.5
0.5
-30 -20 -10 0 10 20Gestation Age (Days)
(g) Event time=3
-.50
.51
-30 -20 -10 0 10 20Gestation Age (Days)
(h) Event time=4
-1-.5
0.5
-30 -20 -10 0 10 20Gestation Age (Days)
(i) Event time=5
Note: For each outcome, points represent means for each gestation age relative to the cutoff. The lines are fittedvalues from a regression that includes a linear trend in gestational age and a dummy for gestation ages greaterthan or equal to the cutoff age.
63

Figure A11: RDD Graphs By Event Time, Outcome: Credit Access Index-.6
-.4-.2
0.2
.4
-40 -20 0 20Gestation Age (Days)
(a) Event time= -3
-.50
.51
-40 -20 0 20Gestation Age (Days)
(b) Event time= -2
-.4-.2
0.2
.4.6
-40 -20 0 20Gestation Age (Days)
(c) Event time= -1
-.4-.2
0.2
.4
-40 -20 0 20Gestation Age (Days)
(d) Event time= 0 (Year of Birth)
-.4-.2
0.2
.4
-40 -20 0 20Gestation Age (Days)
(e) Event time=1
-.50
.5
-40 -20 0 20Gestation Age (Days)
(f) Event time=2
-.50
.5
-40 -20 0 20Gestation Age (Days)
(g) Event time=3
-.50
.51
1.5
-40 -20 0 20Gestation Age (Days)
(h) Event time=4
-.50
.51
1.5
-40 -20 0 20Gestation Age (Days)
(i) Event time=5
Note: For each outcome, points represent means for each gestation age relative to the cutoff. The lines are fittedvalues from a regression that includes a linear trend in gestational age and a dummy for gestation ages greaterthan or equal to the cutoff age.
64

Figure A12: Exploring Mechanisms with Survey Data: Economic Outcomes
−1 0 1 2 3 4
−40
0−
200
020
040
0
Event Time
Effe
ct S
ize
●
●
●
●
●
●
●
●
●
●
●
●
(a) Personal Income
−1 0 1 2 3 4
−10
00−
500
050
0
Event Time
Effe
ct S
ize ●
●
●
●
●
●●●
●
●
●
●
(b) Household Income
−1 0 1 2 3 4
−0.
8−
0.6
−0.
4−
0.2
0.0
0.2
0.4
Event Time
Effe
ct S
ize
●
● ●
●●
●
●
● ●
●●
●
(c) Income Relative to FPL
−1 0 1 2 3 4
−0.
15−
0.05
0.05
0.15
Event Time
Effe
ct S
ize
●
●
●
●
●
●
●
●
●
●
●
●
(d) Employed
−1 0 1 2 3 4
−0.
10.
00.
10.
20.
3
Event Time
Effe
ct S
ize
●
●
●
●
●
●
●
●
●
●
●
●
(e) Receives WIC
−1 0 1 2 3 4
−0.
10−
0.05
0.00
0.05
0.10
Event Time
Effe
ct S
ize
●
●
● ●
●
●●
●
● ●
●
●
(f) Receives TANF
−1 0 1 2 3 4
−0.
15−
0.05
0.05
0.15
Event Time
Effe
ct S
ize
●
●
● ●
●
●
●
●
● ●
●
●
(g) Receives Food Stamps
−1 0 1 2 3 4
−40
−20
020
4060
80
Event Time
Effe
ct S
ize
●●
●
●
●
●
●●
●
●
●
●
(h) Child support
−1 0 1 2 3 4
−0.
100.
000.
100.
20
Event Time
Effe
ct S
ize
●
●
●
●
●
●
●
●
●
●
●
●
(i) Not enough money “most of thetime” or more
Note: These figures report coefficients from a variant of Equation (1) estimated with available data for thespecified outcome. The coefficients represent the change in the outcome for Turnaway group members relativeto Near Limit group members in the one year before and five years after the time of birth or counterfactualbirth, as compared to the year immediately prior to this event. See text for more information.
65

Figure A13: Exploring Mechanisms with Survey Data: Living Situation
−1 0 1 2 3 4
−0.
100.
000.
100.
20
Event Time
Effe
ct S
ize
●
●
●●
●●
●
●
●●
●●
(a) Living with Male Partner
−1 0 1 2 3 4
−0.
20−
0.10
0.00
0.10
Event Time
Effe
ct S
ize ● ●
●
● ●
●
● ●
●
● ●
●
(b) Living with Adult Family
−1 0 1 2 3 4
−0.
10.
00.
10.
2
Event Time
Effe
ct S
ize
●
●
●
●
●
●
●
●
●
●
●
●
(c) Living Alone withChild/Children
−1 0 1 2 3 4
−0.
15−
0.10
−0.
050.
000.
05
Event Time
Effe
ct S
ize ●
●●
●
●
●
●
●●
●
●
●
(d) Living Alone
−1 0 1 2 3 4
−0.
15−
0.10
−0.
050.
000.
05
Event Time
Effe
ct S
ize
●
●
●●
●
●
●
●
●●
●
●
(e) Living with (Non-Family)Roommates
Note: These figures report coefficients from a variant of Equation (1) estimated with available data for thespecified outcome. The coefficients represent the change in the outcome for Turnaway group members relativeto Near Limit group members in the one year before and five years after the time of birth or counterfactualbirth, as compared to the year immediately prior to this event. See text for more information.
66

Figure A14: Effect of Turnaway Births (Green) relative to Near Limit Subsequent Births (Blue)
−3 −2 −1 0 1 2 3
−0.
2−
0.1
0.0
0.1
0.2
0.3
0.4
Event Time
Effe
ct S
ize
●
●
●●
●●
●
●
●
●
●
●●
●
●
●
●●
●●
●
●
●
●
●
●●
●
(a) Financial Distress Index
−3 −2 −1 0 1 2 3
−0.
4−
0.2
0.0
0.2
0.4
Event Time
Effe
ct S
ize
●
● ●
●●
●
●
●
●●
●
● ●
●
●
● ●
●●
●
●
●
●●
●
● ●
●
(b) Credit Access Index
Note: These figures show estimates of coefficients βy (from equations 1 and 4) among the Turnaway group (insolid green) and the Near Limit group who gave birth following their abortion (in dashed blue). Coefficientsfor the Turnaway group are scaled by the fraction of women in this group who gave birth (68%). 95 percentconfidence intervals are also plotted.
67

Table A1: Comparison of Turnaway and Near Limit in Post-Period Only
Financial Distress Index Collections Public Records Amount Past Due SubprimeDifference between 0.092** 697.973 0.032 911.562* 0.023Turnaway & Near Limit (0.046) (514.520) (0.022) (509.502) (0.026)
Access Index Index Prime Credit Score Any Mortgage Available Credit Credit ScoreDifference between -0.063 -0.015 -0.033* 178.575 -8.833Turnaway & Near Limit (0.055) (0.017) (0.018) (401.481) (5.443)N: 3,353
Notes: Analysis shows a simple difference in means across Turnaway and Near Limit groups in the post-birthor post-counterfactul birth period using a sample of women age 20 and older in the year of the birth or counter-factual birth. Sample is restricted to women who had a credit report record prior to the birth or counterfactualbirth. Robust standard errors are clustered by individual. Significance levels: *=10%, **=5%, ***=1%.
Table A2: Analysis by Type of Public Record
Tax Liens Bankruptcies JudgementsPost × Turnaway 0.025 (0.010)** 0.008 (0.011) 0.038 (0.024)Pre-Period Turnaway Mean: 0.007 0.018 0.069N: 4,914
Notes: Analyses use 2006-2016 Experian credit report files for Turnaway and Near Limit sample of women age20 and older in the year of the birth or counterfactual birth. Sample is restricted to women who had a creditreport record prior to the birth or counterfactual birth. All regression models include individual fixed effectsand an indicator that event time≥ 0. Robust standard errors are clustered by individual. Significance levels:*=10%, **=5%, ***=1%.
Table A3: Effect of an Abortion Denial on Distribution of Collections and Amount Past Due
Collections: $0 $1 - $732 $733-$2994 $2995-$19648Quartile 1 Quartile 2 Quartile 3 Quartile 4
Post × Turnaway -0.082** 0.025 0.001 0.056(0.033) (0.029) (0.035) (0.036)
N 4,914 4,914 4,914 4,914
Past Due: $0 $1 - $160 $161-$1311 $1312-$41044Quartile 1 Quartile 2 Quartile 3 Quartile 4
Post × Turnaway -0.023 0.003 0.009 0.010(0.033) (0.013) (0.030) (0.032)
N 4,914 4,914 4,914 4,914
Notes: Analyses use 2006-2016 Experian credit report files for Turnaway and Near Limit sample of women age20 and older in the year of the birth or counterfactual birth. Sample is restricted to women who had a creditreport record prior to the birth or counterfactual birth. Outcome variables are indicators that collections or pastdue balance take a value in the ranges specified, 0 otherwise. All regression models include individual fixedeffects and an indicator that event time≥ 0. Robust standard errors are clustered by individual. Significancelevels: *=10%, **=5%, ***=1%.
68

Table A4: Collection Amounts by Types of Collection (only available in “post” period)
Turnaway Near Limit P-value of DifferenceMedical collections $1733.99 $1262.44 0.176Retail collections $242.37 $211.32 0.543Utility collections $491.05 $434.99 0.360Banking or financial collections $303.02 $344.22 0.743
Notes: Table presents mean collection balances by type of collection for the years 2011 forward. Previous yearsare unavailable. Third column denotes p-value associated with the difference in means across the Turnawayand Near Limit groups.
Table A5: Alternative Event Study Specifications
Financial Distress Index Access IndexBaseline With Linear “Pre Trend” Baseline With Linear “Pre-trend”
Year=-3 0.077 (0.059) – -0.026 (0.056) –Year=-2 0.025 (0.043) – -0.010(0.039) –Year=-1 – – – –Birth Year 0.110 (0.037)*** 0.153 (0.052)*** -0.025 (0.038) -0.039 (0.051)Year=1 0.154 (0.047)*** 0.234 (0.085)*** -0.067 (0.048) -0.094 (0.081)Year=2 0.173 (0.061)*** 0.292 (0.119)** -0.067 (0.059) -0.107 (0.109)Year=3 0.126 (0.060)** 0.282 (0.144)* -0.001 (0.065) -0.053 (0.136)Year=4 0.116 (0.064)* 0.311 (0.174)* 0.014 (0.073) -0.052 (0.166)Year=5 0.119 (0.067)* 0.352 (0.203)* 0.019 (0.075) -0.060 (0.194)
Note: This table presents event study coefficients estimating the impact of being turned away on financialdistress (Columns 1 and 2) and access to credit (Columns 3 and 4). See text for details. Significance levels:*=10%, **=5%, ***=1%.
Table A6: Regression Discontinuity Estimates in Initial Survey Responses (Survey Respon-dents Only)
Parametric Linear LLRHS Education or Less -0.022 (0.082) -0.155 (0.122)Single 0.011 (0.067) 0.054 (0.085)Full Time Employed -0.053 (0.076) -0.153 (0.137)Part Time Employed 0.161 (0.103) 0.057 (0.066)Enough Money 0.112 (0.080) 0.23 (0.132)Age at birth 0.201 (0.810) 1.038 (1.316)Received WIC 0.067 (0.058) 0.064 (0.076)Received TANF -0.062 (0.052) -0.069 (0.072)Received Food Stamps 0.181 (0.122) 0.158 (0.079)**
Note: Table shows RD estimates of outcome variables listed in each row. These outcome variables wererecorded on the initial survey that participants completed approximately one week after the abortionencounter. Significance levels: *=10%, **=5%, ***=1%.
69

Tabl
eA
7:R
egre
ssio
nD
isco
ntin
uity
Esti
mat
es
Fina
ncia
lDis
tres
sIn
dex
Acc
ess
Inde
xPa
ram
etri
cLi
near
LLR
Para
met
ric
Line
arLL
RN
Tim
eR
elat
ive
toBi
rth/
Cou
nter
fact
ualB
irth
Thr
eeto
one
year
spr
ior
tobi
rth
0.01
1(0
.076
)0.
103
(0.1
09)
-0.0
57(0
.116
)-0
.031
(0.1
34)
1,55
5Ye
arof
birt
h0.
169
(0.0
84)*
*0.
123
(0.1
08)
-0.1
25(0
.103
)-0
.047
(0.1
04)
557
One
totw
oye
ars
afte
rbi
rth
year
0.19
5(0
.086
)**
0.17
6(0
.100
)*-0
.105
(0.1
18)
-0.1
05(0
.105
)1,
117
Thr
eeto
five
year
saf
ter
birt
hye
ar0.
150
(0.0
87)*
0.04
6(0
.107
)0.
027
(0.1
33)
0.00
3(0
.110
)1,
669
Reg
ress
ion
Dis
cont
inui
ty/D
iffer
ence
inD
iffer
ence
sM
odel
RD
-DD
Effe
ct0.
157
(0.0
74)*
*N
/A0.
015
(0.0
79)
N/A
4,89
8
Not
e:Th
ista
ble
pres
ents
RD
esti
mat
esof
the
impa
ctof
bein
gtu
rned
away
onfin
anci
aldi
stre
ss(C
olum
ns1
and
2)an
dac
cess
tocr
edit
(Col
umns
3an
d4)
.Se
ete
xtfo
rde
tails
.Sig
nific
ance
leve
ls:*
=10%
,**=
5%,*
**=1
%.
70

Tabl
eA
8:“D
onut
”R
DEs
tim
ates
,Exc
lude
Ges
tati
onal
Age
sat
the
Cut
off
Fina
ncia
lDis
tres
sIn
dex
Acc
ess
Inde
xPa
ram
etri
cLi
near
LLR
Para
met
ric
Line
arLL
RN
Dro
pG
esta
tion
alA
ges:
Equa
lCut
off
+/-1
Day
Equa
lCut
off
+/-1
Day
Equa
lCut
off
+/-1
Day
Equa
lCut
off
+/-1
Day
Equa
lCut
off
+/-1
Day
Tim
eR
elat
ive
toBi
rth/
Cou
nter
fact
ualB
irth
Thre
eto
one
year
s-0
.011
-0.0
190.
027
0.02
8-0
.080
-0.0
780.
022
-0.0
141,
452
1,39
9pr
ior
tobi
rth
(0.0
85)
(0.0
92)
(0.1
24)
(0.1
59)
(0.1
25)
(0.1
37)
(0.1
61)
(0.1
40)
Year
ofbi
rth
0.22
3**
0.21
9*0.
244*
0.24
2-0
.117
-0.1
190.
077
-0.1
0952
050
1(0
.110
)(0
.119
)(0
.135
)(0
.150
)(0
.120
)(0
.135
)(0
.178
)(0
.168
)O
neto
two
year
saf
ter
birt
h0.
249*
*0.
287*
*0.
202
0.35
1*-0
.073
-0.0
870.
055
-0.0
451,
043
1,00
5(0
.110
)(0
.118
)(0
.163
)(0
.190
)(0
.140
)(0
.156
)(0
.209
)(0
.233
)Th
ree
tofiv
eye
ars
afte
rbi
rth
0.21
6*0.
265*
*0.
143
0.34
10.
095
0.09
00.
400.
079
1,55
81,
502
(0.1
19)
(0.1
29)
(0.2
02)
(0.2
24)
(0.1
59)
(0.1
77)
(0.2
39)
(0.3
18)
Reg
ress
ion
Dis
cont
inui
ty/D
iffer
ence
inD
iffer
ence
sM
odel
RD
-DD
Effe
ct0.
239*
*0.
284*
**N
/AN
/A0.
084
0.07
4N
/AN
/A4,
573
4,40
7(0
.099
)(0
.105
)(0
.099
)(0
.105
)
Not
e:Th
ista
ble
pres
ents
RD
esti
mat
esof
the
impa
ctof
bein
gtu
rned
away
onfin
anci
aldi
stre
ss(C
olum
ns1
thro
ugh
4)an
dac
cess
tocr
edit
(Col
umns
5th
roug
h8)
wit
hw
omen
wit
hge
stat
iona
lage
sat
orw
ithi
non
eda
yof
the
cuto
ffdr
oppe
dfr
omth
eda
ta,a
sno
ted
inth
eco
lum
nhe
adin
g.Si
gnifi
canc
ele
vels
:*=
10%
,**=
5%,*
**=1
%.
71

Tabl
eA
9:Ex
plor
ing
Mec
hani
sms
wit
hSu
rvey
Dat
a:Ec
onom
icO
utco
mes
Pers
onal
Hou
seho
ldIn
com
eR
elat
ive
Empl
oyed
Rec
eive
sW
ICR
ecei
ves
TAN
FIn
com
eIn
com
eto
FPL
Post×
Turn
away
-60.
72-1
06.5
1-0
.276
**0.
001
0.08
0**
0.02
1(7
3.92
)(1
82.2
1)(0
.123
)(0
.047
)(0
.041
)(0
.036
)
Pre-
Peri
odTu
rnaw
ayM
ean
917.
9619
28.9
31.
330.
556
0.15
40.
126
N3,
797
3,19
13,
191
3,94
73,
947
3,94
7
Rec
eive
sFo
odSt
amps
Chi
ldSu
ppor
tInc
ome
Not
Enou
ghM
oney
Post×
Turn
away
0.01
619
.92
0.03
9(0
.039
)(1
4.05
)(0
.047
)
Pre-
Peri
odTu
rnaw
ayM
ean
0.40
619
.90
0.44
2N
:3,
947
3,94
73,
947
Not
es:A
naly
ses
use
11w
aves
ofTu
rnaw
aySt
udy
surv
eyda
tafo
rsa
mpl
eof
wom
enag
e20
and
olde
rth
eye
arof
the
birt
hor
coun
terf
actu
albi
rth.
Sam
ple
isre
stri
cted
tow
omen
who
had
acr
edit
repo
rtre
cord
prio
rto
the
birt
hor
coun
terf
actu
albi
rth
inor
der
tom
atch
sam
ple
crit
eria
inm
ain
anal
ysis
.A
llre
gres
sion
mod
els
incl
ude
indi
vidu
alfix
edef
fect
san
dan
indi
cato
rth
atev
ent
tim
e≥0.
Rob
ust
stan
dard
erro
rsar
ecl
uste
red
byin
divi
dual
.Si
gnifi
canc
ele
vels
:*=1
0%,*
*=5%
,***
=1%
.Mea
nfo
rTu
rnaw
aym
othe
rsat
base
line
surv
ey(1
to2
wee
ksaf
ter
abor
tion
enco
unte
r)re
port
edin
bott
omro
w.
72

Table A10: Exploring Mechanisms with Survey Data: Living Situation
Alone with Child With Male With Adult With Room AlonePartner Family Mates
Post × Turnaway 0.106*** 0.039 -0.051 -0.064** -0.024(0.041) (0.043) (0.044) (0.028) (0.028)
Pre-Period Turnaway Mean 0.406 19.90 0.442
N: 3,947 3,947 3,947 3,947 3,947Notes: Analyses use 11 waves of Turnaway Study survey data for sample of women age 20 and older the yearof the birth or counterfactual birth. Sample is restricted to women who had a credit report record prior to thebirth or counterfactual birth in order to match sample criteria in main analysis. All regression models includeindividual fixed effects and an indicator that event time≥0. Robust standard errors are clustered by individual.Significance levels: *=10%, **=5%, ***=1%. Mean for Turnaway mothers at initial survey (approximately 1 weekafter abortion encounter) reported in bottom row.
Table A11: Heterogeneous Effects for High Versus Low TANF Generosity States
Full Sample High Generosity States Low Generosity States
Financial Distress IndexPost × Turnaway 0.102** 0.036 0.150**
(0.045) (0.054) (0.066)Credit Access IndexPost × Turnaway -0.009 0.065 -0.065
(0.054) (0.061) (0.082)
N: 4,914 2,158 2,756
Notes: Analyses use 2006-2016 Experian credit report files for Turnaway and Near Limit sample of women age20 and older the year of the birth or counterfactual birth. Sample is restricted to women who had a creditreport record prior to the birth or counterfactual birth. All regression models include individual fixed effectsand an indicator that event time≥0. Robust standard errors are clustered by individual. Significance levels:*=10%, **=5%, ***=1%.
73