Embed Size (px)
Citation preview
Master thesis
The economic consequences of natural disasters
An empirical study to the effect of natural disasters on economic growth
Erasmus University Rotterdam
Erasmus School of Economics
Department of Economics
Supervisor: Dr. E.M. Bosker
Name: Gerard Baak
Exam number: 331574
Email address: [email protected]

2
CONTENT
1. INTRODUCTION----------------------------------------------------------------------------------------- 4
2. EXISTING LITERATURE ------------------------------------------------------------------------------- 7
3. THEORETICAL AND CONCEPTUAL FRAMEWORK -------------------------------------------- 10
3.1. THE SOLOW AND ENDOGENOUS GROWTH MODELS ................................................................................................ 10
3.2. CONCEPTUAL FRAMEWORK ............................................................................................................................... 12
Table 1 Average costs of natural disasters (1980 – 2012) .................................................................................. 12
Figure 1 Conceptual framework ......................................................................................................................... 13
4. DATA ---------------------------------------------------------------------------------------------------- 15
4.1. NATURAL DISASTERS ........................................................................................................................................ 15
Table 2 Natural disaster types ............................................................................................................................ 15
4.2. MEASUREMENTS OF THE DISASTERS .................................................................................................................... 16
4.3. DATA SOURCES OTHER VARIABLES ....................................................................................................................... 17
4.4. ENDOGENEITY ISSUES ....................................................................................................................................... 19
4.5. DESCRIPTIVE STATISTICS .................................................................................................................................... 20
5. METHODOLOGY -------------------------------------------------------------------------------------- 22
6. RESULTS ------------------------------------------------------------------------------------------------ 24
6.1. ALL TYPES OF DISASTERS ................................................................................................................................... 24
6.1.1. Agricultural, industrial and service per capita growth ...................................................................... 24
Table 10 All disaster types and GDP p.c. growth ................................................................................................ 25
6.2. DIFFERENT TYPES OF DISASTERS .......................................................................................................................... 26
Table 11 all disaster types and agricultural growth ............................................................................................ 26
6.2.1. Droughts ............................................................................................................................................ 26
Table 13 Different disaster types (measurement total population affected) ..................................................... 28
6.2.2. Floods ................................................................................................................................................ 28
6.2.3. Earthquakes ....................................................................................................................................... 29
6.2.4. Storms ............................................................................................................................................... 30
6.3. INSTRUMENTAL VARIABLES ................................................................................................................................ 31
6.4. INTERACTION WITH INSTITUTIONAL AND STRUCTURAL CHARACTERISTICS ..................................................................... 32
Graph 1 Interaction with GDP p.c. ...................................................................................................................... 33
Graph 2 Interaction with Aid p.c. ........................................................................................................................ 34
7. CONCLUSION ------------------------------------------------------------------------------------------ 35
8. LITERATURE ------------------------------------------------------------------------------------------ 37
9. APPENDIX ---------------------------------------------------------------------------------------------- 39
Table 3 Descriptive Statistics .............................................................................................................................. 39
Table 4 Correlation matrix of all disaster types .................................................................................................. 40
Table 5 Correlation matrix of different disaster types – population affected .................................................... 40
Table 6 Correlation matrix of different disaster types – number of disasters .................................................... 40
Table 7 Correlation matrix control variables ...................................................................................................... 40
3
Scatterplot 1 Natural disasters and economic growth (1980-2012) ................................................................... 41
Scatterplot 2 Natural disasters and agricultural growth (1980-2012) ................................................................ 42
Table 8 Countries in the sample ......................................................................................................................... 43
Table 9 All disaster types and total economic growth ........................................................................................ 45
Table 12 Different disaster types measured with population affected (without controls) ................................ 45
Table 14 Different disaster types measured with people killed (without controls) ........................................... 46
Table 15 Different disaster types measured with people killed (controls) ......................................................... 46
Table 16 Different disaster types measured with economic damage (without controls) .................................. 47
Table 17 Different disaster types measured with economic damage (controls) ................................................ 47
Table 18 Different disaster types measured with the number of disasters (without controls) ......................... 48
Table 19 Different disaster types measured with the number of disasters (controls) ....................................... 49
Table 20 TSLS regressions all disaster types and GDP p.c. growth ..................................................................... 50
Table 21 TSLS regressions all disaster types and agricultural growth ................................................................. 51
Table 22 TSLS regressions different disaster types and economic growth ......................................................... 52
Table 23 Interaction terms with GDP p.c., Polity Index and Aid inflow p.c. ....................................................... 53
4
1. Introduction
This paper empirically investigates what the impact is of natural disasters on economic
growth. The relevance of this topic emerges in the Copenhagen Consensus 2012. This
expert panel of economists put natural disasters on the challenging list of the biggest
problems in the world. Also the Intergovernmental Panel on Climate Change (IPCC) focus
on extreme weather and climate events and the implications of these events for the society
and a sustainable development in the world. There are regularly news items of natural
disasters. Recently, the typhoon Haiyan ravaged the Philippines. In the summer of 2013,
floods in Central Europe had cost eleven people their lives. In addition, shipping was
shutting down because of the sharp rise in the water level (Huiskamp, 2013). Big natural
disasters occurred in recent years. The tsunami in Haiti in 2010, which took the lives of
roughly 222.570 people; In Japan there was an earthquake with 390.000 victims in 2011.
Flooding in Bangladesh has brought enormous suffering. Undoubtedly, the magnitude and
frequency of certain types of natural disasters depends upon the location of the country.
Given the location, the question remains what the effect is on the macro economy. If there
is an effect, how can you explain that this effect is different across the world? This paper
tries to give an answer to these questions.
Empirically, my work is related to a number of other papers who attempt to uncover the
link between natural disasters and economic growth. There is empirical evidence that
natural disasters have a negative effect on overall GDP growth in the short run (Noy, 2009).
Splitting up natural disasters to subtypes results in a significant effect of climatic natural
disasters on GDP growth (Skidmore & Toya, 2002; Raddatz, 2007, 2009; Loayza et al,
2012). However, disasters like floods and droughts have a positive respectively negative
significant effect on agricultural growth (Loayza et al, 2012).
Building on this literature, this paper contributes in several ways. First, I use a different
approach in the measurement of natural disasters; I measure besides the size of population
affected, killed and the economic damage, the number of disasters controlling for the
country size. I measure all of them in one-year periods. Secondly, I combine some of the
empirical approaches; I split GDP per capita growth up in agricultural, industrial and
service growth. I also contribute by adding interaction terms of institutional variables as
5
discussed in Noy (2009). I use interaction terms with GDP p.c., the Polity index and Aid
inflows p.c. Thirdly, I use the number of disasters as an instrument for the consequences of
disasters.
This paper answers the main question in several sub questions:
(1) Do natural disasters have a negative effect on short run economic growth?
(2) How does this effect differ when I split up GDP per capita growth?
(3) What is the effect of institutional and structural characteristics of countries in this
relationship?
The first sub question will on the one hand test the effect of all types of natural disasters
together on GDP per capita growth. On the other hand, I will test the effect of different
types of natural disasters on GDP per capita growth. The second question will investigate
this effect on agricultural, industrial and service value added per capita growth. The third
question will estimate the effect of factors like democracy, income per capita and aid
inflows in interaction with the natural disaster measurements. This makes it possible to
examine why some countries experience higher losses when there occurred natural
disasters. Because extreme events will have greater impacts on sectors with closer links to
climate, such as water, agriculture and food security, forestry, health and tourism (IPCC
report, p. 16), I use panel least squares with fixed effects to eliminate the impact of time
independent factors.
The following major conclusions emerge. First, there is a consistent negative short run
effect of natural disasters on GDP p.c. growth. The disaster measurement total population
affected gives the best estimates. Observing the effect on different sectors, the agricultural
sector is most sensitive to natural disasters. Second, amongst the types of disasters
droughts appears to be the most significant one. However, storms have the greatest impact
on economic growth. Thirdly, using the number of disasters as instrumental variable for
the consequence measurements of natural disasters, gives less information that supports
the hypothesis that natural disasters have a negative effect on economic growth. Finally,
both GDP and aid inflow per capita mitigate the negative effects of natural disasters.
6
The paper proceeds as follows. In section 2, I start with a discussion of the existing
literature. In section 3, I discuss the theoretical framework with the expected results. I also
describe the ways in which disasters could affect economic growth. Section 4 contains the
description of the data and the measurement of the variables. I proceed with the estimation
framework in section 5. The empirical results are discussed in section 6, and section 7
concludes.
7
2. Existing literature
In their survey, Cavallo & Noy (2010) give an overview of the literature that examine the
aggregate impact of natural disasters. They distinguish between short run (usually up to
three years) and long run (anything beyond five years) indirect effects of disasters. The
first study that focuses on the short run is of Albala-Bertrand (1993), who collected data for
26 countries with 28 disasters for the 20-year period 1960-1979. He found that there was
no fall in GDP and in the GDP growth rate when there were natural disasters. Also inflation
does not changed but agricultural output increased. The methodology used was a before-
after statistical analysis where the immediate two pre-disasters years, t-2 and t-1, were
taken as reference (Albala-Bertrand, p.62). A second important study is of Skidmore & Toya
(2002) who examined the long run growth effects of natural disasters in 89 countries for
the period 1960 to 1990. They found climatic disasters correlated with higher rates of
human capital accumulation, an increase in total factor productivity and economic growth.
However, they found no significant correlation between disasters and long term physical
capital accumulation. Geological disasters like earthquakes had also no significant effect.
Their reasoning is that, if disasters reduce the expected return of physical capital there will
be less physical capital investment. On the other side, there will be a relative higher return
to human capital, which increases investments in human capital (Skidmore & Toya, 2002).
That stimulates the update of the existing capital stock with the adaptation of new
technologies. They give this as an explanation why there is a significant increase in total
factor productivity and why there are positive output growth rates. The paper of Skidmore
& Toya provides some useful insights but there are also shortcomings. Not explained is why
climatic disasters have a positive effect on GDP growth.
Two papers explicitly take account of natural disasters as an external shock. First, Noy and
Nualski (2007) focus on the growth dynamics of countries that deal with natural disasters.
Referring to the neo-classical Solow model and the contributions of the endogenous growth
model they examine the impact of a natural disaster shock on the growth path of countries.
Their sample contains 98 countries in the period 1975 – 2000, dividing in five, 5-year
intervals. Estimation methods are panel fixed effects and generalized methods of moments
(GMM). In their results they show that a negative shock to the stock of human capital
8
decreases the growth rate of GDP. However, negative shocks to physical capital do not have
a significant effect on the long run GDP growth rate. Secondly, Raddatz (2007) investigates
natural disasters in external shocks in 40 low-income countries. For a small fraction of
these shocks natural disasters explain the output volatility (measured as GDP per capita) in
these countries. He finds a negative association of 2 percent between climatic disasters and
the output volatility. Geological disasters have no significant effect on GDP per capita
volatility.
A paper close to Raddatz (2007) is of Noy (2009), who describes institutional and
structural factors that could determine the impact of natural disasters on GDP growth. His
sample consists of 109 countries for the period 1970-2003. Interesting is that he uses
interaction terms of the natural disaster measurement and the following variables:
illiteracy, institutional strength, GDP per capita, government consumption, exports and
tropics.1 He finds that countries with a higher level of illiteracy will experience more
negative effects of a natural disaster than countries with a lower level of illiteracy (Noy,
2009). In addition, institutional strength and higher GDP per capita are associated with
significant lower costs of disasters (Noy, 2009). Furthermore, government consumption
and a higher degree of openness to trade prevent countries from negative effects of natural
disasters on the economy. However, location in the tropics does not significantly reduce
GDP growth. The paper of Noy (2009) only uses economic damage as a measurement for
natural disasters in their main analyzes. The reason therefore is that variables constructed
with the number of people affected or killed are not significant in their estimations. He also
looks to financial conditions such as the level of foreign exchange reserves that significantly
prevent a spillover of natural disasters in the macro economy. However, he does not split
up the disaster measurements in categories though it is likely that different types of
disasters have different effects on GDP growth.
Using again a panel of low-income countries, the paper of Raddatz (2009) builds on his
previous work, Raddatz (2007). He estimates vector autoregression models (VAR) and
concludes that climatic disasters reduce real GDP per capita by at least 0.6 percent.
1 Except the data for tropics the source of all those variables is from the World Bank.
9
Droughts have the most important impact on GDP per capita, with losses of 1 percent.
Smaller and poorer countries are more vulnerable to climatic disasters. In addition, most of
the costs realized in the year the disaster occurred. However, Raddatz (2009) uses GDP per
capita as dependent variable instead of GDP per capita growth. Another approach is of
Hochrainer (2009) who looks to the counterfactuals of the evolution of GDP. The approach
is comparing the situation that the disaster would not have occurred versus the observed
GDP. He compares both evolutions in a time-period up to five years after the disaster event.
On average, disasters lead to negative consequences on GDP growth.
Recently, the paper of Loayza et al (2012) contributes to the existing literature by splitting
up aggregate GDP growth in agricultural, industrial and service per capita growth. They
find that different types of natural disasters affect the economy in different ways: droughts
have a negative significant effect on agricultural growth; floods have a positive significant
effect on agricultural growth. While moderate disasters can have a positive effect on certain
sectors severe disasters usually, have negative effects on economic growth. Another
conclusion is that natural disasters have more impact on developing economies than on
developed economies. Loayza et al (2012) organize their data in five-year periods. The
reason therefore is that in this way reconstruction efforts can work their way through the
economy. An annual frequency analysis is beyond the scope of their paper but will be done
in the empirics of this paper. As disaster measurement, they use the number of people
affected. In their robustness tests they also use the number of people killed, the total
economic damage is not used.
In summary, the described literature show different results about the effect of natural
disasters on economic growth. For the short run, there is consensus that there is a negative
relationship between natural disasters and GDP per capita growth. This effect is mainly
driven by climatic disasters. This is interesting because the IPCC believe that through global
warming there occur more of these types of disasters. For the long run, the results are
largely inconclusive. Cavallo & Noy (2010) give as a possible reason the difficulty of
constructing appropriate counterfactuals. Loayza et al (2012) take a different approach in
using not only overall GDP per capita growth as the dependent variable.
10
3. Theoretical and conceptual framework
From the previous section, it is obvious that this study belongs to the economic growth
literature. It examines what happens to economic growth when there are exogenous
natural disaster shocks. Therefore, I will in this section first refer to the standard growth
theories in economics and explore the theoretical predictions of these models. Secondly, I
examine and make visible the possible ways through which natural disasters could affect
economic growth.
3.1. The Solow and endogenous growth models
In explaining economic growth, the Solow growth model is the starting point for almost all
analyses of growth. The model views technical progress and savings as exogenous, and thus
not explained by the model. The principal conclusion is that the accumulation of physical
capital cannot account for either the vast growth over time in output per person or the vast
geographic differences in output per person (Romer, p. 8). Using a Cobb-Douglas
production function with the inputs capital, labor and knowledge, you can explain
theoretically the behavior of the output in the economy (usually in the form of output per
unit of effective labor). 2 The outcome of the model is, under some assumptions, that the
economy converges to a balanced growth path: A situation in which each variable of the
model is growing at a constant rate.3 But due to different causes the economy could move
away from this steady state. Here the occurrence of a natural disaster comes in. This will
have several implications for the growth path in the economy: First, the capital stock could
decrease, which is likely the case with geologic types of disasters.4 This results in an
increase in the marginal returns of capital because capital becomes relatively scarce. That
in turn increases capital accumulation and leads to output growth. However, when the
amount of the effective labor force in the economy decreases relatively more than that
capital decreases, growth decelerates.
Another possibility is that there are after a disaster event rebuilding investments in capital.
These investments bring the capital stock back to the original level, with the advantage of
2 Combining labor and knowledge gives the effectiveness of labor. 3 The model’s critical assumption is that the production function has constant returns to scale in capital and effective labor. That is, doubling the quantities of capital and effective labor doubles the amount produced. 4 I assume that the natural disaster destroys physical capital more than effective labor.

11
an update of the existing capital stock by new technologies. This is in the literature called
the Schumpeterian tradition of ‘creative destruction’. In that case, there would be a positive
growth impulse after a natural disaster. However, as discussed in Hallegatte et al (2007)
those investments often take a long time to implement. Which is especially the case for
developing economies where there are bad reconstruction capacities to manage the
resources to the destroyed areas (Loayza et al, 2012). The rebuilding activities however
give an explanation why studies focusing on the long term such as Skidmore and Toya
(2002) generally find positive effects of natural disasters.
According to endogenous growth theories, human capital is the important factor of
economic growth. In the Solow model, the only other determinant of output other than
capital, named ‘effective labor’, is taken as exogenous. The endogenous growth model of
Romer (1990) consists of two sectors: goods producing sector and a research and
development (R&D) sector. In the R&D sector is investment in the stock of knowledge
(Romer, p. 103). In this model, there are two endogenous variables: capital and knowledge.
Including human capital in the theoretical model explains economic growth by human
capital accumulation. Individuals invest in human and physical capital and the amount of
human capital in the past has a positive effect on the accumulation of human capital in the
future. What is the effect of natural disasters in this model?
Disasters could decrease the human capital stock by migration of skilled workers or
reduction in school achievements of children. In the case of droughts and hunger, disasters
affect child development negatively (Alderman et al, 2006). Endogenous growth models
would predict a permanent decline in the growth rate when there is no human capital
accumulation. Skidmore and Toya (2002) give the possibility that physical and human
capital are substitutable. In that case, an increase in the risk of capital destruction leads to
an increase in investments in human capital. This in turn leads to positive output growth
rates. They mention also the possibility of an update of the existing capital stock after a
natural disaster. This increases the expenditures in R&D and leads to a human capital
accumulation which results in positive output growth.
12
3.2. Conceptual framework
The classical growth models use aggregate production functions. However, it is likely that
there is a different effect of natural disasters on labor or capital intensive sectors. For
example, droughts reduce the water availability that is an important input for the
agricultural sector. Droughts and heat waves also lead to famines, which can decrease the
labor force. Droughts can have less impact on capital. Earthquakes mainly destroy
buildings and therefore they can have more impact on capital-intensive sectors. Floods can
stimulate agricultural growth through the channel of collection of irrigation water; Storms
can decrease agricultural growth by destruction of properties or harvests. Storms can also
stimulate the reconstruction of buildings and hence leads to industrial growth. Besides all
these different effects on sectors in the economy there are also other factors who can affect
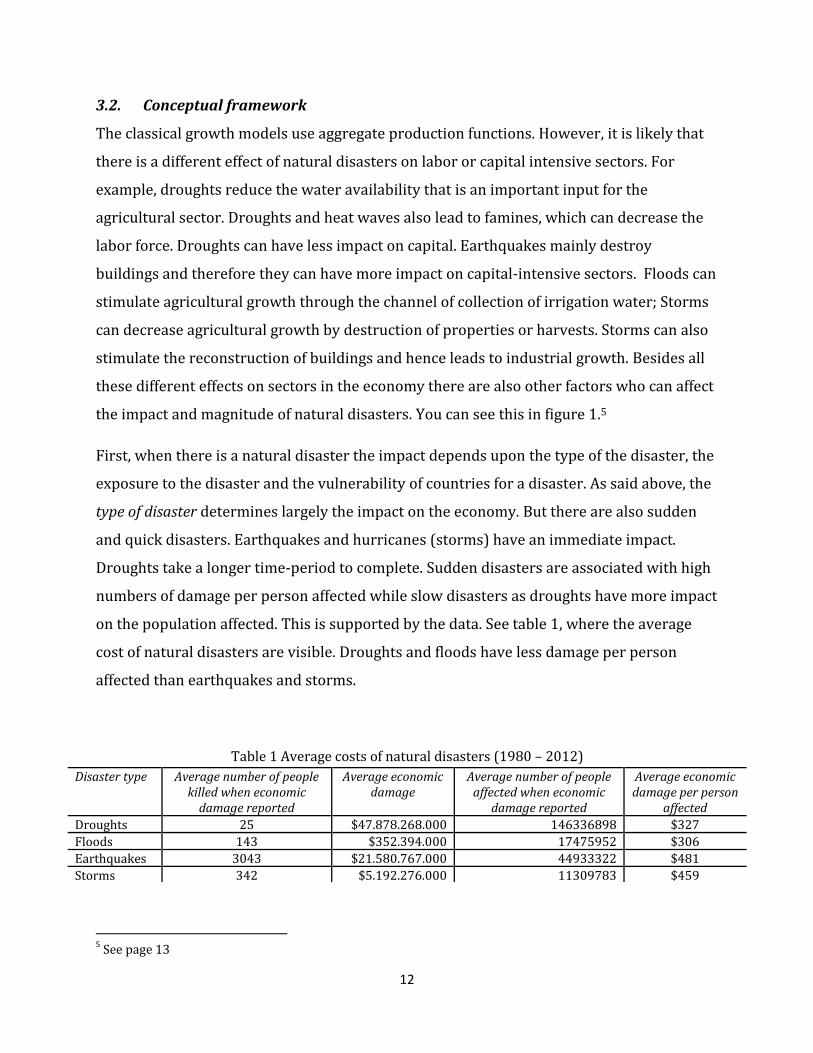
the impact and magnitude of natural disasters. You can see this in figure 1.5
First, when there is a natural disaster the impact depends upon the type of the disaster, the
exposure to the disaster and the vulnerability of countries for a disaster. As said above, the
type of disaster determines largely the impact on the economy. But there are also sudden
and quick disasters. Earthquakes and hurricanes (storms) have an immediate impact.
Droughts take a longer time-period to complete. Sudden disasters are associated with high
numbers of damage per person affected while slow disasters as droughts have more impact
on the population affected. This is supported by the data. See table 1, where the average
cost of natural disasters are visible. Droughts and floods have less damage per person
affected than earthquakes and storms.
5 See page 13
Table 1 Average costs of natural disasters (1980 – 2012)
Disaster type Average number of people killed when economic
damage reported
Average economic damage
Average number of people affected when economic
damage reported
Average economic damage per person
affected
Droughts 25 $47.878.268.000 146336898 $327
Floods 143 $352.394.000 17475952 $306
Earthquakes 3043 $21.580.767.000 44933322 $481
Storms 342 $5.192.276.000 11309783 $459
13
In the next section, I will come back how I take account of the type of disaster in the
construction of the variables.
Secondly, there is the exposure to a disaster. Under exposure the IPCC report sums up the
presence of people; livelihoods, infrastructure or economic assets that can be affected.
Think of an urbanized area that is exposed to more damage to capital than a rural area.
Thirdly, there is the vulnerability as a set of factors that determine the impact of disasters.
Vulnerability contains the environmental, social, economic and physical factors that give
countries more risks for negative impacts of disasters. Think of the lack in government and
community capacities to deal with disasters. Here also wealth and education play a role.
Rapid and unplanned urbanization in hazardous areas, government failures and the
scarcity of livelihood options for the poor are things the IPCC mentioned under
vulnerability (IPCC report, p. 67). There is a link between exposure and vulnerability, in the
sense that a high exposure makes countries also more vulnerable to disasters. But
vulnerability is more; there are also institutional factors which can make countries less
robust in dealing with disasters.
Figure 1 Conceptual framework
Natural disaster
• Type of disasters • Exposure to disaster • Vulnerablility of the country
Direct effects (stocks)
• On physical structures and livestocks (capital) → Damage • On human populations (labor) → People affected / killed
Indirect effects (flows)
• Aid and remittances flows • Reconstructions efforts • Health and nutrition •Insurance benefits
Economic growth
14
I make a distinction between the impact of disasters on capital and labor. Impact on capital
will be associated with damage and destructions. The impact on labor can lead to affected
people or deaths. Capital and labor impact can of course take place simultaneously. I
consider in table 1 only the people affected and killed conditional on economic damage. I
do this because it is likely that a natural disaster is associated with any damage.
Furthermore, I make a distinction between direct effects (stocks) and indirect effects
(flows). The effects in the short run are direct effects but, as I mentioned already, there is
the possibility of indirect effects. This is the possibility, also discussed by Albala-Bertrand,
that high levels of direct effects can lead to, for example, aid and remittances flows. These
flows can affect economic growth. However, not every disaster has these indirect effects. It
is likely that it will be the case with big natural disasters with high impacts on capital and
labor. Other indirect effects I refer to are high scale impacts on health and nutrition (for
example as a result of severe droughts) and reconstructions. High damages to capital will
lead to new construction of capital. There is the possibility of implementation of new
technologies. Because this paper measures in one-year periods, I capture all the short-term
(direct) effects. By including aid inflow per capita, I pay attention to possible indirect
effects.
In summary, a natural disaster that decreases the capital stock and or labor force leads
both in the Solow and in the endogenous growth model to a decrease in the output growth
rate. If there are successful reconstructions in physical capital or an increase in the human
capital stock (new technologies), there could be a positive effect on output growth.
However, this effect is more likely to appear in the long term. There are different ways how
natural disasters affect economic growth. The data used in this paper contains both direct
and indirect estimates of capital and labor losses. In the following section this will be
further explored.
15
4. Data
4.1. Natural disasters
Consistent with other empirical work the data on natural disasters is obtained from the
Emergency Disasters Database (EM-DAT) of the Centre for Research on the Epidemiology
of Disasters (CRED). This disaster database is one of the most complete and accurate in his
field and widely used in comparable research. Information of disasters is compiled from
various sources including UN agencies, nongovernmental organizations, insurance
companies, research institutes and press agencies.6 An event enters the database as a
disaster when one of the following criteria is full-filled: ten or more people reported are
killed, 100 or more people reported are affected, declaration of a state of emergency or a
call for international assistance.
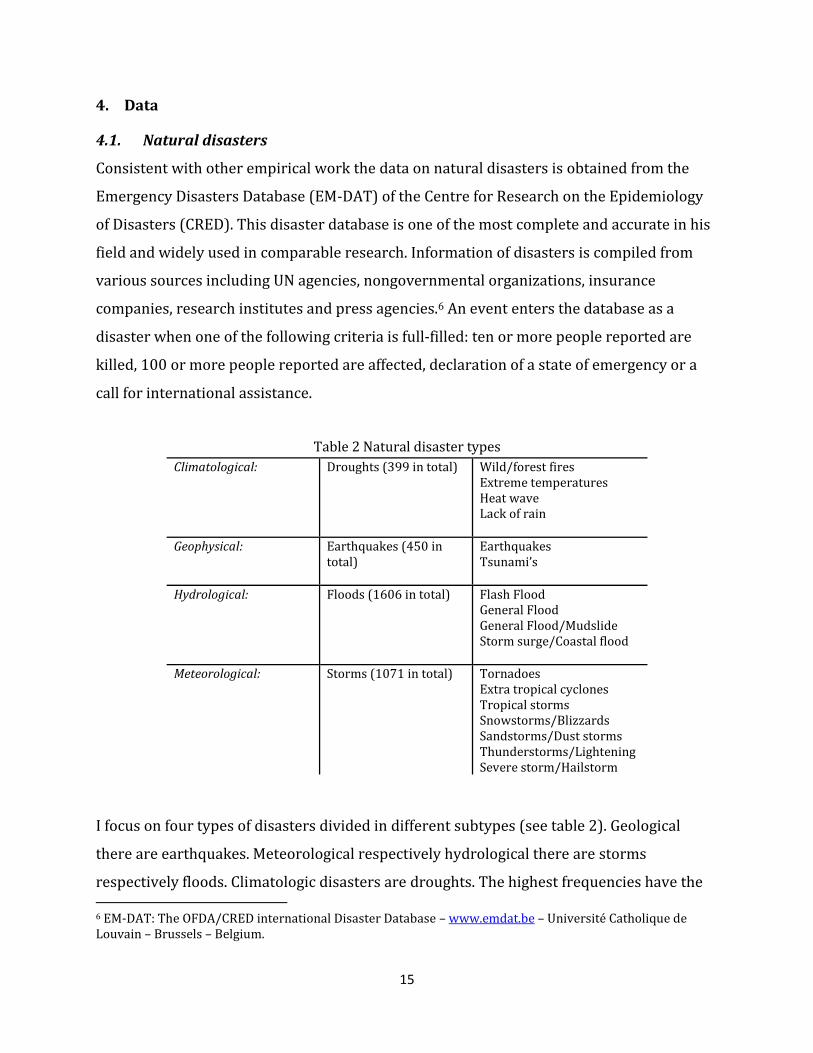
Table 2 Natural disaster types
Climatological: Droughts (399 in total) Wild/forest fires Extreme temperatures Heat wave Lack of rain
Geophysical: Earthquakes (450 in total)
Earthquakes Tsunami’s
Hydrological: Floods (1606 in total) Flash Flood General Flood General Flood/Mudslide Storm surge/Coastal flood
Meteorological: Storms (1071 in total) Tornadoes Extra tropical cyclones Tropical storms Snowstorms/Blizzards Sandstorms/Dust storms Thunderstorms/Lightening Severe storm/Hailstorm
I focus on four types of disasters divided in different subtypes (see table 2). Geological
there are earthquakes. Meteorological respectively hydrological there are storms
respectively floods. Climatologic disasters are droughts. The highest frequencies have the 6 EM-DAT: The OFDA/CRED international Disaster Database – www.emdat.be – Université Catholique de Louvain – Brussels – Belgium.
16
meteorological and hydrological disasters. In table 5 and 6, the correlations between the
different disaster types are reported (see appendix). The database contains also
information on the event name, the location (usually given in provinces, districts or places),
the region in the country and the continent. Furthermore, the data contains the day, month
and year in which the disaster starts and ends.
4.2. Measurements of the disasters
There are three measurements of the consequences of disasters: the number of total people
affected, people killed and the amount of economic damage. Killed are the persons
confirmed as dead and persons missing and presumed as dead. Total people affected are
people who are injured, homeless or otherwise affected. These are people requiring
immediate assistance during a period of emergency; it also includes displaced or evacuated
people. Homeless are the people needed immediate assistance for shelter. Injured are
people suffering from physical injuries, trauma or an illness, requiring medical treatment
as a direct result of a disaster. The amount of damage reported consists of direct and
indirect damage in US dollar amount. It contains for example reconstruction and insurance
payments. Other examples are damages to infrastructure, housing and crops. Besides these
three measurements in the database, I also construct a measurement of the total number of
natural disasters per country per year. I divide this measurement by the total land area
(per 1000 km2). Data of the land area is obtained from the World Bank. In table 4, the
correlation between the different disaster measurements is reported (see appendix). As is
visible the correlation between total population affected and economic damage is 0.410.
How a disaster affects economic growth in a year is likely to depend upon the magnitude of
a disaster and the time the event took place in a year (Noy, 2009). Therefore, in correcting
for the magnitude I divide the size of population affected or killed by the last year total
population size. Economic damage is corrected by dividing through last year’s GDP level.
Furthermore, I assume that an event that occurs in January have more effect on that year
GDP per capita growth than an event occurred in December (which is more likely to effect
next year’s GDP growth). I therefore use the following rate: (12- event month)/ 12, to
correct for event time. This implies that the size of the affected population is multiplied by
6/12 if an event took place in June. In equation (1) the final measurement of population
17
affected is visible (called total population affected). There, population affectedi,jt is the
number of people affected in country i, by disaster j, in year t. Total populationi,t-1 is the
total last year population size. The left hand side of the equation represents the aggregate
sum of all disasters (of type j) in year t. When I examine the relationship with all disaster
types, I delete subscript j in the equation. To makes interpretation easier I multiply the
measurement by 100 percent.7
I use the same formula for the people killed:
When I measure economic damage I divide by total GDPi, t-1:
I correct the number of disasters with the land area:
4.3. Data sources other variables
I use four dependent variables. First, I use the growth rate of real GDP per capita. The data
on GDP per capita comes from the World Bank. Furthermore, I use measures of the growth
rate of real per capita value added in the agricultural, industrial and service sector. These
sector growth rates are obtained by dividing the value added of each sector by the total
population size. All the dependent variables are measured in annual growth rates. One
7 This makes the interpretation: a one-unit increase is a 1 percent increase in the ratio.
18
problem was the lack of data of the dependent variables. Especially in African countries,
this was the case. Another point was the declaration of independency of some states during
the period.
Consistent with other studies I include some control variables. These are trade openness
(as percentage of GDP); government burden (general government final consumption
expenditure as percentage of GDP); inflation (consumer price index, annual percentage
change) and foreign direct investment (FDI, net inflows as percentage of GDP). I use for
education the gross rate of enrollment in secondary school. This is the ratio of the number
of students in secondary school to the number of people of the corresponding school age. I
also include the annual percentage growth of gross capital formation. Furthermore, I
include the log of GDP per capita. They are all obtained from the World Bank.
As discussed in the previous section the impact of disasters on human lives and the
economic damages can depend on exposure (the size of the population in the affected
area), the vulnerability of the area and the type of the natural disasters. I therefore include
interaction terms of institutional and structural variables in the analysis. I do this in a way
similar to Noy (2009).8 As a measurement for institutions, I use a democracy variable from
Polity 4. This variable has a range from -10 to 10, where the lowest value indicates an
autocratic country and the highest value a full democracy. I assume that if a country is
more democratic, it will be more open for political institutions. Furthermore, I include GDP
per capita, assuming that richer countries have more money available for protection
against natural disasters. The correlation between the Polity index and GDP p.c. is 0.517,
therefore including both leads to multicollinearity problems. Therefore, I include them
separately.
To measure the indirect effects of natural disasters I include a variable measuring the aid
inflow per capita. I compose this variable by summing up the aid inflows of the United
Nations Development Program (UNDP), United Nations Refugee Agency (UNHCR), World
Food Program (WFP) and World Health Organization (WHO). From their websites, it
8 How I will do this shall be explained in section 5.
19
becomes clear that all these organizations help countries in times of disasters.9
Furthermore, observing the data confirms that when there are disasters in a country there
are more aid inflows than the years without disaster events. I divide the total of the aid
inflows by the total population size in the countries. The data of this variable comes from
the World Bank.
4.4. Endogeneity issues
Because a natural disaster is an exogenous event, I have the advantage of no endogeneity.
Whether or not a country experienced a disaster is exogenous and does not depend on the
state of the economy. Natural disasters are not related to other factors determining output
growth; this gives a good estimate of the causal effect of natural disasters on economic
growth. Because I use a growth model I include for comparison the already mentioned
control variables in the analysis. But in fact there is no omitted variable bias because there
is no relationship between natural disasters and other factors determining economic
growth. Thus, the covariance between natural disasters and those other factors is zero.
However, the consequences of natural disasters could possibly be endogenous. Economic
damage may rise with income. Wealthier countries have more physical capital to damage.
This is a problem of endogeneity, namely reverse causality. Also the number of people
affected could decrease with a rise in income. Thus low income countries are likely to have
more people affected due to the lack of spending money on safety. While wealthier
countries are able to take more safety precautions. Here also reverse causality is the
problem. The paper of Kahn (2005) had show that the death toll from natural disasters
decreases with economic development. Finally, there could be an exaggeration of the data
in developing countries of reasons of international assistance. The possible problem of
reverse causality, is however not likely because economic growth has no causal effect on
natural disasters. There is no empirical work that gives a significant estimate of GDP
growth on natural disaster occurrence. The study of Kahn (2005) rejects the hypothesis
that richer nations experience fewer disaster shocks.
9 They pay attention to the typhoon Haiyan in the Philippines.
20
If there are problems of measurement error in natural disasters, I get an underestimation
(a bias towards zero) of the effect of disasters on GDP growth. This is possible because the
data of natural disasters is gathered from various data sources; also there could be an
improving trend in recording disasters over time. This makes it more difficult to find the
causal effect of disaster on growth. But, if I find anything I will also find it when
appropriately addressing measurement error. The other possibility is measurement error
in the dependent variable. But only if the measurement error in the output is related to
natural disasters I get a bias. The likelihood of this is very small, so I do not care about this
possibility.
I use an instrumental variable analysis (IV) to correct for the mentioned endogeneity issues
(see section 6.3). IV can solve all the endogeneity issues if there is a good instrument. The
instrument I use is the measurement of section 4.2 (equation 4) which was the number of
disasters over the total land area per 1000 km2. It is likely that the number of disasters
affect economic growth only by affecting the consequences of disasters. Thus, the number
of disasters is only related to economic growth through the consequences, affected, killed
and economic damage. I just mention that the first stage results show the expected positive
estimate (see also section 6.3). However, the F statistic is not bigger than 10.10
4.5. Descriptive statistics
There are 159 countries in the sample (see table 8, appendix). In table 3 (see appendix) the
descriptive statistics are visible. GDP per capita growth has 4771 observations, for most of
the country’s GDP per capita growth was available. This changes when I use the other three
dependent variables. The service sector has the lowest number of observations (3960). Of
the control variables education and the gross capital formation has the lowest number of
observations.
As is visible in table 3, there is difference between the means of the disaster types.
Droughts and storms have the highest means of population affected. Storms have the
highest means of economic damage, followed by earthquakes and floods. Storms also have
the highest number of disasters. Population killed is for all the disaster types a variable
10 That the F statistic bigger is than 10 is a rule of thumb.
21
with low values, the reason is that the number of persons killed is in general small.11 From
all disasters together, population affected has the highest mean (0.838), followed by
economic damage (0.289).
Observing the maximums of the disasters measurements is interesting. Total population
affected and economic damage have maximums of 117.597 and 152.214, both are from
storms. This means that the ratio shown in paragraph 4.2 is higher than 100 percent, the
size of the population affected or economic damage is more than the size of last year’s
population or last year’s GDP level. In Albania was a drought that leads to 100.161 percent
people affected in 1989. In the next year, 1990, there was a negative growth of -10.5
percent and there was a negative growth of -29.6 percent in 1991. In Samoa was over three
years a negative growth: in 1990 -5.08 percent, in 1991, -3.02 percent and in 1992, -0.98
percent. Likely, this is related to the 152 percent economic damage caused by storms in
1990. These storms also leads to 101.4 percent people affected. Another example is the
earthquake in Haiti in 2010, the event behind the maximum of 113 percent economic
damage. There was a negative GDP p.c. growth of -6.64 percent. However, in 2011 there
was a positive growth of 4.23 percent. I investigated that the amount that the aggregate aid
organizations (UNDP, UNHCR, WFP and WHO) transfer to Haiti in 2010 was $13.3 million.
The number of population affected was 34.4 percent and 2 percent of the population was
killed.
To give an impression about the relationship between the average GDP per capita growth
and the average of total population affected I make a scatter plot, visible in scatter-plot 1
(see appendix). This graph is an overview for the period 1980 – 2012 and thus not
representative for the real estimations. However, as is visible there are countries with
negative GDP p.c. growth and high levels of population affected such as NER, ZMB, ZWE,
KIR and MDG.12 An obvious outlier in this graph is China (CHN). In scatter-plot 2 (See
appendix), I give the relationship between the average of the population affected and the
agricultural per capita growth. Obvious difference with graph 1 is that there are more
countries with a negative output per capita growth. Again, Albania is an outlier.
11 Dividing by total population size makes the coefficient very small. 12 For the complete list of country names of these abbreviations, see appendix table 8.

22
5. Methodology
This paper is interested in the estimation of : the change of GDP p.c. growth as a result of
a one unit change in the disaster variable. I specify the following estimation equation:
Where is equal to the output p.c. growth rate, specified for GDP, agriculture, industry
and service p.c. growth. The country specific intercept is and the period specific
intercept is . The disaster coefficient is for disaster in country i, by disaster type j, in
year t. is the coefficient for the initial output p.c. in logs. is a vector of control
variables; is the error term which consists of country-specific, unobserved factors.
To estimate the effect of different types of disasters I use coefficients for the disaster types:
droughts, floods, earthquakes and storms.
To estimate the institutional effects ( ), I use an interaction term captured by the
coefficient . I also include the direct effect of .
The regression method is Panel least squares. I include both cross section and period fixed
effects. The White cross-section covariance method is used to correct for autocorrelation
and heteroskedasticity.13 Using fixed effects gives the advantage of controlling for
unobserved time independent factors that could affect the impact of disasters on economic
growth. Those factors, like geographical location, can influence the occurrence of disasters.
Examples are the earthquakes in Japan due to plate tectonics and boundaries. Another
example is droughts in Sub Saharan Africa due to closeness to the equator.
Additional to Panel least squares I estimate a Two Stage Least Squares (TSLS) regression.
As explained in section 4.4 I use the number of disasters as an instrument for the
consequences of disasters. The two stages are (also valid for the economic damage):
13
I use this option in Eviews, which is equal to cross section clustered standard errors in Stata.
23
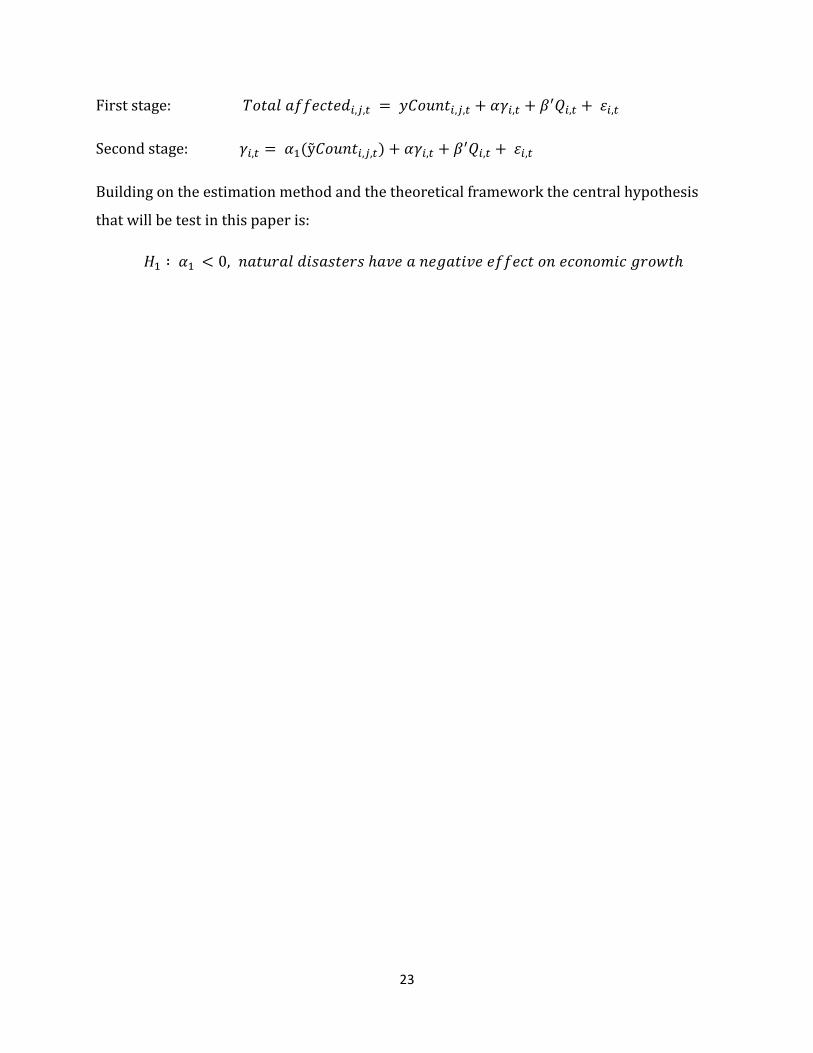
First stage:
Second stage:
Building on the estimation method and the theoretical framework the central hypothesis
that will be test in this paper is:
24
6. Results
This section will first deal with the estimations of all types of disasters together on
economic growth (GDP p.c. and the different sectors). Second, I will present the empirical
findings regarding the different disaster types. Thirdly, I will change the estimation method
to instrumental variables. Fourthly, I include the interaction terms in the analysis.
6.1. All types of disasters
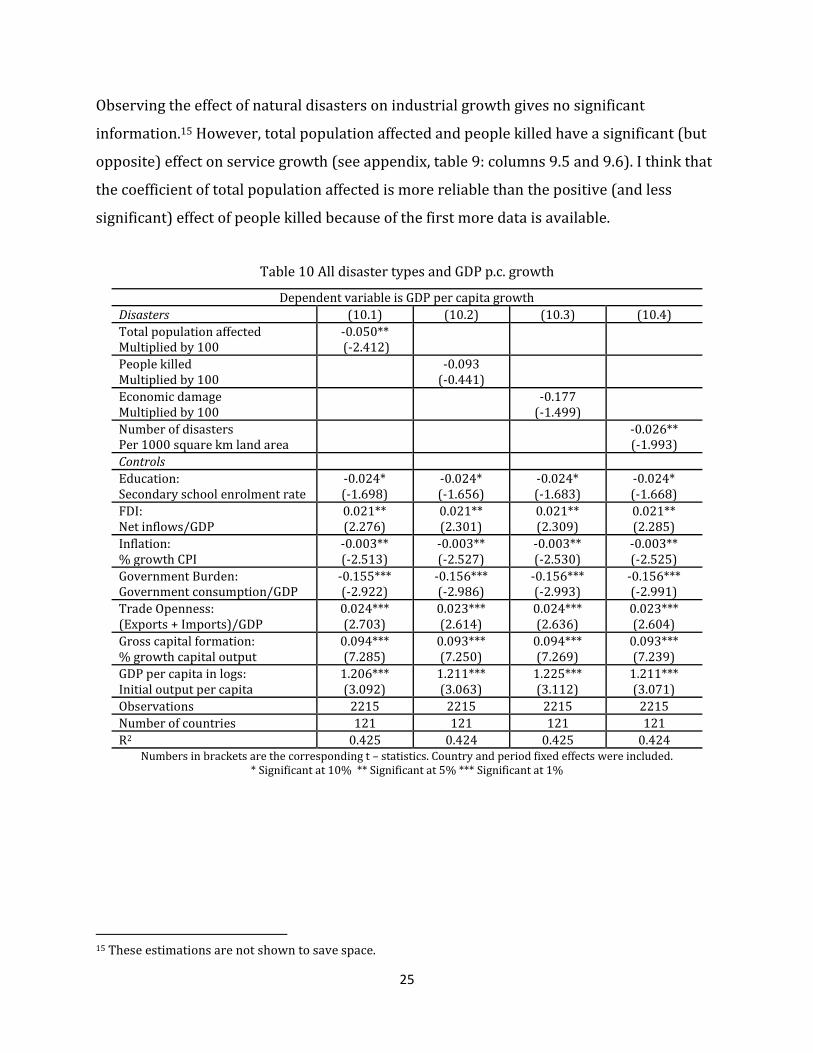
Table 10 reports the estimations of the aggregate impact of disasters on GDP p.c. growth.14
Two regressions show a significant relationship between disasters and economic growth:
the percentage of the population affected, column (10.1), and the number of disasters,
column (10.4). Note that all the disaster coefficients have a negative sign. The coefficient of
population affected indicates a decrease of 5 percent in GDP p.c. growth when there is a
one-unit increase in the ratio, which is a 1 percent increase. The interpretation of the
number of disasters (column 10.4) is quite different: A rise of one-unit in the ratio indicates
that there is one additional disaster in an area of 1000 km2. This results in a decrease of 2.6
percent in the GDP p.c. growth rate. Not significant are people killed and economic damage.
From table 9 (see appendix) you can see that without control variables these disaster
measurements are significant and report negative coefficients.
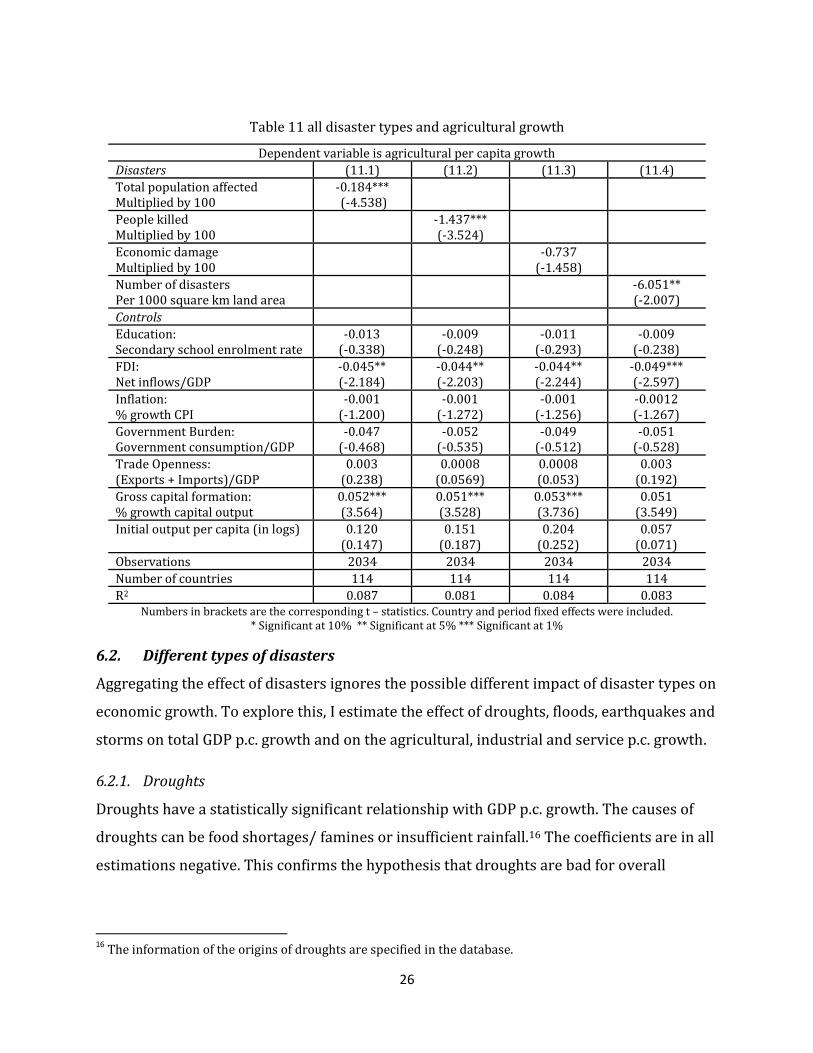
6.1.1. Agricultural, industrial and service per capita growth
Besides the effect of natural disasters on total GDP p.c. growth, I also investigate the effect
on agricultural, industrial and service p.c. growth. A part of the results is presented in table
11. Agricultural growth is most sensitive to natural disasters: A one-unit rise in the ratio of
total population affected leads to a decrease of 18.4 percent in agricultural p.c. growth (see
column 11.1). This is a bigger and more significant effect than the effect in column 10.1.
People killed (column 11.2) and the number of disasters (column 11.4) have significant
coefficients of -1.437, respectively, -6.051. Only economic damage has no significant effect
on agricultural p.c. growth.
14 See next page.
25
Observing the effect of natural disasters on industrial growth gives no significant
information.15 However, total population affected and people killed have a significant (but
opposite) effect on service growth (see appendix, table 9: columns 9.5 and 9.6). I think that
the coefficient of total population affected is more reliable than the positive (and less
significant) effect of people killed because of the first more data is available.
Table 10 All disaster types and GDP p.c. growth
Dependent variable is GDP per capita growth
Disasters (10.1) (10.2) (10.3) (10.4)
Total population affected Multiplied by 100
-0.050** (-2.412)
People killed Multiplied by 100
-0.093
(-0.441)
Economic damage Multiplied by 100
-0.177
(-1.499)
Number of disasters Per 1000 square km land area
-0.026** (-1.993)
Controls
Education: Secondary school enrolment rate
-0.024* (-1.698)
-0.024* (-1.656)
-0.024* (-1.683)
-0.024* (-1.668)
FDI: Net inflows/GDP
0.021** (2.276)
0.021** (2.301)
0.021** (2.309)
0.021** (2.285)
Inflation: % growth CPI
-0.003** (-2.513)
-0.003** (-2.527)
-0.003** (-2.530)
-0.003** (-2.525)
Government Burden: Government consumption/GDP
-0.155*** (-2.922)
-0.156*** (-2.986)
-0.156*** (-2.993)
-0.156*** (-2.991)
Trade Openness: (Exports + Imports)/GDP
0.024*** (2.703)
0.023*** (2.614)
0.024*** (2.636)
0.023*** (2.604)
Gross capital formation: % growth capital output
0.094*** (7.285)
0.093*** (7.250)
0.094*** (7.269)
0.093*** (7.239)
GDP per capita in logs: Initial output per capita
1.206*** (3.092)
1.211*** (3.063)
1.225*** (3.112)
1.211*** (3.071)
Observations 2215 2215 2215 2215
Number of countries 121 121 121 121
R2 0.425 0.424 0.425 0.424 Numbers in brackets are the corresponding t – statistics. Country and period fixed effects were included.
* Significant at 10% ** Significant at 5% *** Significant at 1%
15 These estimations are not shown to save space.
26
6.2. Different types of disasters
Aggregating the effect of disasters ignores the possible different impact of disaster types on
economic growth. To explore this, I estimate the effect of droughts, floods, earthquakes and
storms on total GDP p.c. growth and on the agricultural, industrial and service p.c. growth.
6.2.1. Droughts
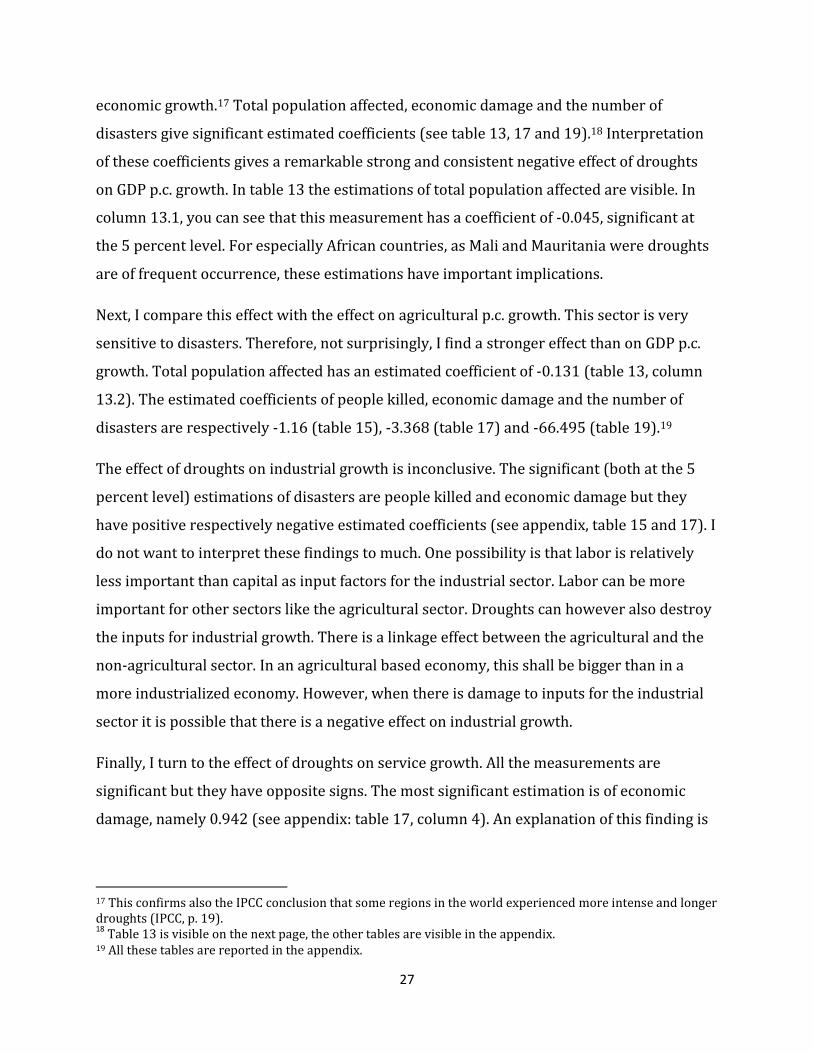
Droughts have a statistically significant relationship with GDP p.c. growth. The causes of
droughts can be food shortages/ famines or insufficient rainfall.16 The coefficients are in all
estimations negative. This confirms the hypothesis that droughts are bad for overall
16
The information of the origins of droughts are specified in the database.
Table 11 all disaster types and agricultural growth
Dependent variable is agricultural per capita growth
Disasters (11.1) (11.2) (11.3) (11.4)
Total population affected Multiplied by 100
-0.184*** (-4.538)
People killed Multiplied by 100
-1.437*** (-3.524)
Economic damage Multiplied by 100
-0.737
(-1.458)
Number of disasters Per 1000 square km land area
-6.051** (-2.007)
Controls
Education: Secondary school enrolment rate
-0.013 (-0.338)
-0.009 (-0.248)
-0.011 (-0.293)
-0.009 (-0.238)
FDI: Net inflows/GDP
-0.045** (-2.184)
-0.044** (-2.203)
-0.044** (-2.244)
-0.049*** (-2.597)
Inflation: % growth CPI
-0.001 (-1.200)
-0.001 (-1.272)
-0.001 (-1.256)
-0.0012 (-1.267)
Government Burden: Government consumption/GDP
-0.047 (-0.468)
-0.052 (-0.535)
-0.049 (-0.512)
-0.051 (-0.528)
Trade Openness: (Exports + Imports)/GDP
0.003 (0.238)
0.0008 (0.0569)
0.0008 (0.053)
0.003 (0.192)
Gross capital formation: % growth capital output
0.052*** (3.564)
0.051*** (3.528)
0.053*** (3.736)
0.051 (3.549)
Initial output per capita (in logs) 0.120 (0.147)
0.151 (0.187)
0.204 (0.252)
0.057 (0.071)
Observations 2034 2034 2034 2034
Number of countries 114 114 114 114
R2 0.087 0.081 0.084 0.083 Numbers in brackets are the corresponding t – statistics. Country and period fixed effects were included.
* Significant at 10% ** Significant at 5% *** Significant at 1%
27
economic growth.17 Total population affected, economic damage and the number of
disasters give significant estimated coefficients (see table 13, 17 and 19).18 Interpretation
of these coefficients gives a remarkable strong and consistent negative effect of droughts
on GDP p.c. growth. In table 13 the estimations of total population affected are visible. In
column 13.1, you can see that this measurement has a coefficient of -0.045, significant at
the 5 percent level. For especially African countries, as Mali and Mauritania were droughts
are of frequent occurrence, these estimations have important implications.
Next, I compare this effect with the effect on agricultural p.c. growth. This sector is very
sensitive to disasters. Therefore, not surprisingly, I find a stronger effect than on GDP p.c.
growth. Total population affected has an estimated coefficient of -0.131 (table 13, column
13.2). The estimated coefficients of people killed, economic damage and the number of
disasters are respectively -1.16 (table 15), -3.368 (table 17) and -66.495 (table 19).19
The effect of droughts on industrial growth is inconclusive. The significant (both at the 5
percent level) estimations of disasters are people killed and economic damage but they
have positive respectively negative estimated coefficients (see appendix, table 15 and 17). I
do not want to interpret these findings to much. One possibility is that labor is relatively
less important than capital as input factors for the industrial sector. Labor can be more
important for other sectors like the agricultural sector. Droughts can however also destroy
the inputs for industrial growth. There is a linkage effect between the agricultural and the
non-agricultural sector. In an agricultural based economy, this shall be bigger than in a
more industrialized economy. However, when there is damage to inputs for the industrial
sector it is possible that there is a negative effect on industrial growth.
Finally, I turn to the effect of droughts on service growth. All the measurements are
significant but they have opposite signs. The most significant estimation is of economic
damage, namely 0.942 (see appendix: table 17, column 4). An explanation of this finding is
17 This confirms also the IPCC conclusion that some regions in the world experienced more intense and longer droughts (IPCC, p. 19). 18
Table 13 is visible on the next page, the other tables are visible in the appendix. 19 All these tables are reported in the appendix.
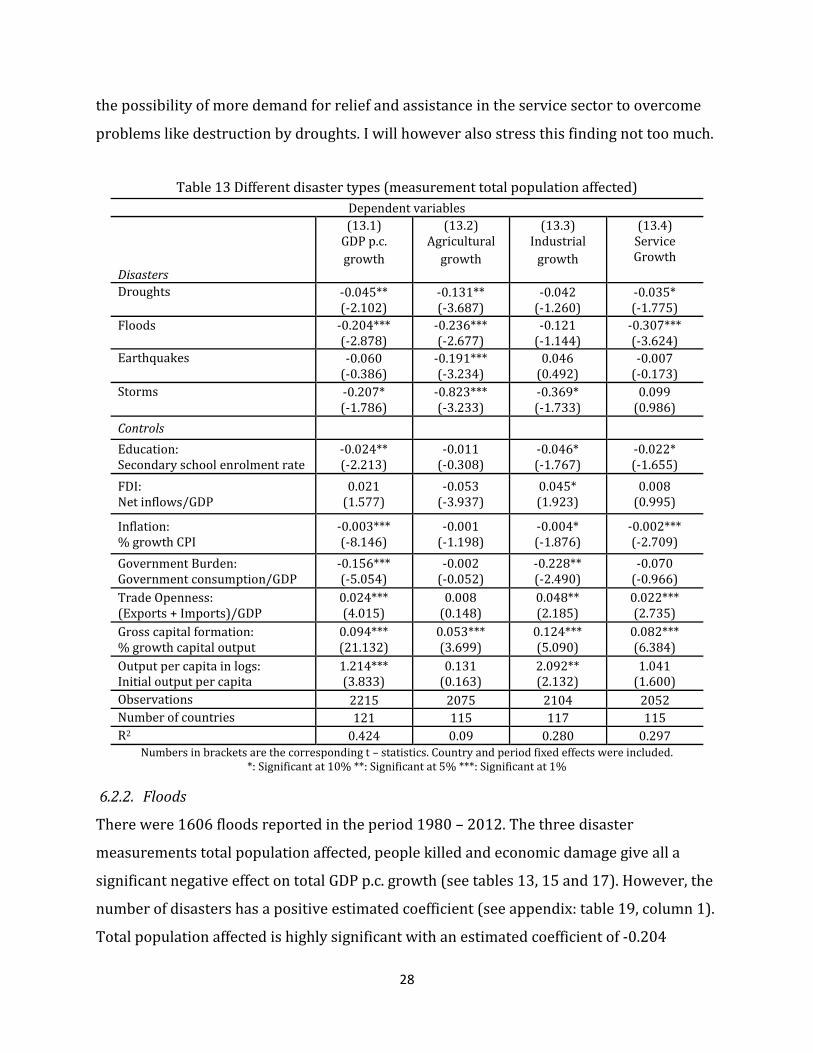
28
the possibility of more demand for relief and assistance in the service sector to overcome
problems like destruction by droughts. I will however also stress this finding not too much.
Table 13 Different disaster types (measurement total population affected)
Dependent variables
Disasters
(13.1) GDP p.c.
growth
(13.2) Agricultural
growth
(13.3) Industrial
growth
(13.4) Service Growth
Droughts -0.045** (-2.102)
-0.131** (-3.687)
-0.042 (-1.260)
-0.035* (-1.775)
Floods -0.204*** (-2.878)
-0.236*** (-2.677)
-0.121 (-1.144)
-0.307*** (-3.624)
Earthquakes -0.060 (-0.386)
-0.191*** (-3.234)
0.046 (0.492)
-0.007 (-0.173)
Storms -0.207* (-1.786)
-0.823*** (-3.233)
-0.369* (-1.733)
0.099 (0.986)
Controls
Education: Secondary school enrolment rate
-0.024** (-2.213)
-0.011 (-0.308)
-0.046* (-1.767)
-0.022* (-1.655)
FDI: Net inflows/GDP
0.021 (1.577)
-0.053 (-3.937)
0.045* (1.923)
0.008 (0.995)
Inflation: % growth CPI
-0.003*** (-8.146)
-0.001 (-1.198)
-0.004* (-1.876)
-0.002*** (-2.709)
Government Burden: Government consumption/GDP
-0.156*** (-5.054)
-0.002 (-0.052)
-0.228** (-2.490)
-0.070 (-0.966)
Trade Openness: (Exports + Imports)/GDP
0.024*** (4.015)
0.008 (0.148)
0.048** (2.185)
0.022*** (2.735)
Gross capital formation: % growth capital output
0.094*** (21.132)
0.053*** (3.699)
0.124*** (5.090)
0.082*** (6.384)
Output per capita in logs: Initial output per capita
1.214*** (3.833)
0.131 (0.163)
2.092** (2.132)
1.041 (1.600)
Observations 2215 2075 2104 2052
Number of countries 121 115 117 115
R2 0.424 0.09 0.280 0.297 Numbers in brackets are the corresponding t – statistics. Country and period fixed effects were included.
*: Significant at 10% **: Significant at 5% ***: Significant at 1%
6.2.2. Floods
There were 1606 floods reported in the period 1980 – 2012. The three disaster
measurements total population affected, people killed and economic damage give all a
significant negative effect on total GDP p.c. growth (see tables 13, 15 and 17). However, the
number of disasters has a positive estimated coefficient (see appendix: table 19, column 1).
Total population affected is highly significant with an estimated coefficient of -0.204
29
(column 13.1). The coefficient of people killed is also highly significant, but have an
extremely high coefficient of -138.133 (column 15.1). Not surprisingly because a rise of 1
percent in the size of the population killed over the total population is exceptional.
Economic damage has an estimated coefficient of -0.811 (column 17.1), which is also a big
negative effect on economic growth. In short, floods have a negative effect on total GDP p.c.
growth.
Intuitively you would expect that floods have a significant effect on agricultural growth.
Total population affected indeed has a strong, negative and significant effect of -0.236
(column 13.2). The coefficient of people killed is again extremely high, as was also the case
with total GDP p.c. growth.20 The other two measurements, economic damage and the
number of disasters, give no notable significant information.21
The effect of floods on industrial growth is unclear. I find in the baseline results significant
effects for people killed, (see appendix: table 14, column 3) and economic damage, (see
appendix: table 16, column 3). However, when I include controls, the significance
disappears. The service sector is sensitive to the consequences of floods: Both total
population affected and economic damage have highly significant estimates.22
6.2.3. Earthquakes
Earthquakes are sometimes in the news for the enormous consequences they could have.
However, studies who explore the effect on economic growth fail to find any significant
relationship.23 I have found some remarkable results:
First, people killed shows in the baseline results and with controls a significant effect on
GDP p.c. growth (see appendix, table 14 and 15). This is in line with the fact that
earthquakes are the type of the disasters with the highest mean of people killed.24 It is
therefore more realistic that the ratio of people killed would rise with 1 percent. This is
also visible in the estimated coefficient of -10.426 in table 15 column 1 (see appendix).
20 The coefficient in the relation with agricultural growth has a value of -261.757. 21 Only the baseline result of economic damage gives a significant result, see appendix: table 16 column 2. 22 See table 13 column 4 and in the appendix table 17 column 4. 23 See the literature section in this paper. 24 See appendix table 3, where I report a mean of 0.00046.
30
Besides people killed the other measurements have only significant estimates in the
baseline results.25
Secondly, I find that the coefficient of population affected has a (highly significant) effect on
agricultural p.c. growth. I find an estimated coefficient of -0.191, which indicates a decrease
of 19.1 percent in agricultural p.c. growth if there is an increase with 1 percent in the ratio
of total population affected (see table 13, column 13.2). I mentioned that also the numbers
of disasters have a significant but positive effect on agricultural growth (see appendix, table
18).
Thirdly, I cannot found any effect of earthquakes on industrial growth. Furthermore, the
effect of earthquakes on the service sector is weak. The only significant variable is the
number of disasters. I find a positive estimated coefficient of 47.514 (see appendix: table
19, column 4). Realize that this coefficient implicates that there is one additional
earthquake in an area of 1000 km2. Probably the story behind this great positive effect is
the boost in government and foreign aid operations.
In short, the disaster measurement, people killed, is in the case of earthquakes a reliable
variable. This gives a negative effect on total GDP p.c. growth. Furthermore, the ratio of
population affected indicates a negative effect on agricultural p.c. growth. That the number
of disasters shows significant results will I not stress too much because of the possibility
that this measurement has only his effect through the consequence variables (I use this
measurement also as an instrumental variable).
6.2.4. Storms
Storms have destroying power on harvest and buildings. From the descriptive statistics,
you can see that both population affected and economic damage have high means and big
maximum values.
The reported effect on GDP p.c. growth in table 13 is again negative and significant. This is
also the case with people killed in table 15, column 1 (see appendix). Remarkable is that
the effect on agricultural p.c. growth is much bigger than the effect on total GDP p.c.
growth: total population affected has an estimated coefficient of -0.823 (column 13.2). I
25 See appendix, table 12 for total population affected, table 16 for economic damage and table 18 for the number of disasters.
31
think an important factor that plays a role is the insurance possibility. One of the data
sources in EM-DAT are insurance companies. Damage of storms is by insurers (normally)
covered under the insurance policy. Farmers will insure their properties when there is a
high risk of storms.
You can see column 13.3 that storms are the only disaster type that has a significant effect
on industrial growth. This finding confirms the facts about the destroying power of storms
on the industrial sector. Possible and realistic is also that heavy storms hinder industrial
traffic and activity.
Looking to the results of the service sector, I find no significant effect of storms. The signs
of the estimated coefficients of total population affected and economic damage are positive,
while the two other measurements have negative signs.26 I think storms are a type of
disasters that the service sector can quite easily manage.
6.3. Instrumental variables
As already mentioned in section 4.4 there are possible endogeneity problems concerning
the used consequence measurements of natural disasters. I therefore use the number of
disasters as an instrument for total population affected and economic damage. I exclude
people killed from the IV regressions because it shows no significant first stage results.
Panel A of table 20 reports the two-stage least squares estimates of the two variables of
interest (see appendix). Both shows no significant effect, while the coefficient of economic
damage is greater than the one of population affected.
The first-stage regressions (reported in Panel B) reports positive significant effects on the
disaster measurements affected (column 20.1) and damage (column 20.2). The number of
disasters has a significant effect on total population affected: the coefficient is significant at
the 5 percent level. The effect on population affected is stronger than on economic damage.
This is in line with the descriptive statistics reported in table 20: the mean of population
affected is bigger than the one of economic damage. The table also reports diagnostic
statistics on weak instruments. The F-statistic for both first-stage regressions is not above
26 See table 13, column 13.4 for total population affected and in the appendix table 15 for people killed, table 17 for economic damage and table 19 for the number of disasters.
32
the threshold of 10 suggested by Staiger and Stock (1997). Therefore, the used instrument
is not as strong as expected.
In addition, I look to the two-stage results of disasters on agricultural growth (see
appendix: table 21, panel A). In column 21.2, you see that there is one significant effect:
economic damage has a coefficient that is significant at the 10 percent level. The coefficient
of population affected has a coefficient of -4.177 but is still not significant.
Investigating the effect of disasters on industrial and service p.c. growth gives no significant
results. The effect of natural disasters on industrial growth show only positive coefficients
while the effect on service growth appears to be negative.
In table 22 (see appendix) the two-stage results of different disaster types are reported. As
is visible the sign of the disaster types is different: Storms always have a negative sign
while floods and earthquakes have positive signs. The effect on agricultural p.c. growth is
greater than on overall GDP p.c. growth. Droughts have a very significant coefficient in
column 22.3, were the disaster types are measured in economic damage. Droughts were
the type of natural disasters that was already significant in section 6.2.1: I report in that
section a coefficient of -3.368. The other types of disasters show no significant estimations.
In short, using a TSLS technique gives less significant results than the previous Panel Least
Squares estimations. However, the findings confirm that disasters have the biggest impact
on agricultural growth. Droughts show a significant impact on that sector.
6.4. Interaction with institutional and structural characteristics
One of the most important indicators of welfare is the amount of GDP p.c. An interesting
question is of the impact of disasters on economic growth would be less in countries with a
higher GDP p.c. level, better institutions or high aid inflow. In this section, I use interaction
terms to analyze the impact of disasters in relation with welfare, institutions and aid
inflows. First, I use GDP p.c. in interaction with natural disasters. Thereafter I use the Polity
Index and finally I introduce a measurement for aid inflows. I only interact with some
significant findings from the previous sections. I illustrate the impact with graphs.
In table 23, column 23.1 (see appendix), the reported coefficients confirm the reasoning
that a higher level of GDP p.c. reduces the negative impact of disasters on GDP p.c. growth. I
measure disasters with total population affected: the coefficient of -0.359 is bigger than the
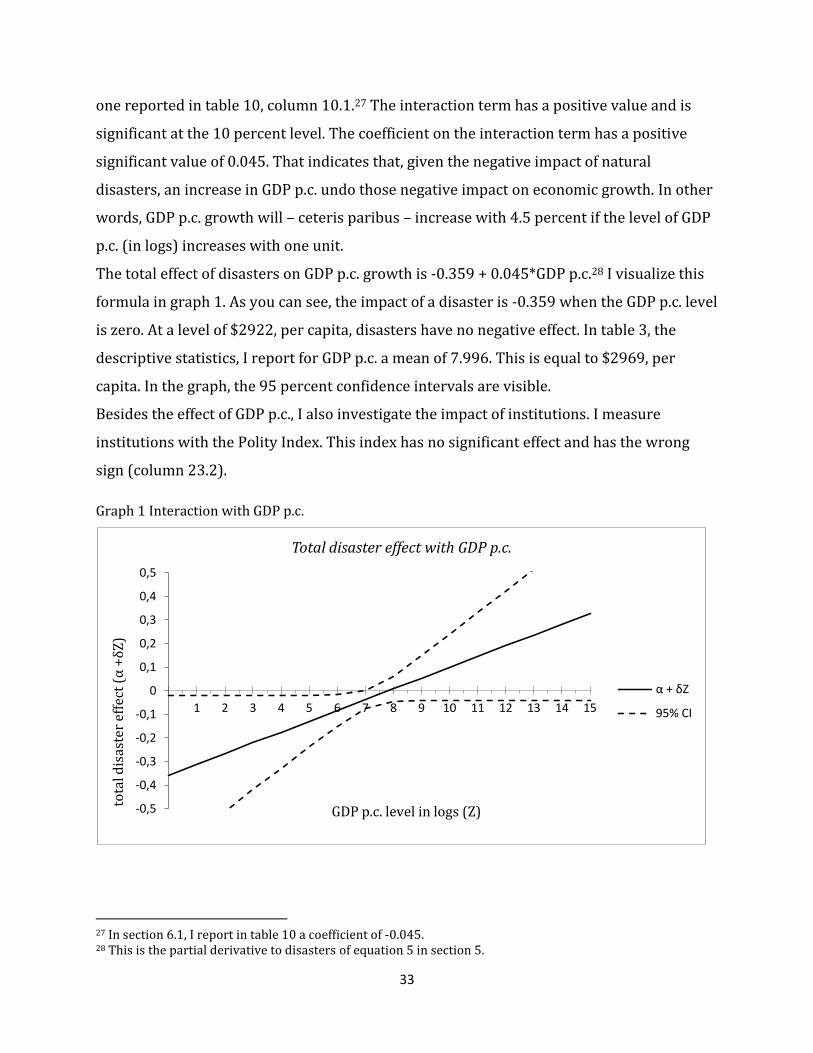
33
one reported in table 10, column 10.1.27 The interaction term has a positive value and is
significant at the 10 percent level. The coefficient on the interaction term has a positive
significant value of 0.045. That indicates that, given the negative impact of natural
disasters, an increase in GDP p.c. undo those negative impact on economic growth. In other
words, GDP p.c. growth will – ceteris paribus – increase with 4.5 percent if the level of GDP
p.c. (in logs) increases with one unit.
The total effect of disasters on GDP p.c. growth is -0.359 + 0.045*GDP p.c.28 I visualize this
formula in graph 1. As you can see, the impact of a disaster is -0.359 when the GDP p.c. level
is zero. At a level of $2922, per capita, disasters have no negative effect. In table 3, the
descriptive statistics, I report for GDP p.c. a mean of 7.996. This is equal to $2969, per
capita. In the graph, the 95 percent confidence intervals are visible.
Besides the effect of GDP p.c., I also investigate the impact of institutions. I measure
institutions with the Polity Index. This index has no significant effect and has the wrong
sign (column 23.2).
Graph 1 Interaction with GDP p.c.
27 In section 6.1, I report in table 10 a coefficient of -0.045. 28 This is the partial derivative to disasters of equation 5 in section 5.
-0,5
-0,4
-0,3
-0,2
-0,1
0
0,1
0,2
0,3
0,4
0,5
1 2 3 4 5 6 7 8 9 10 11 12 13 14 15
tota
l dis
aste
r ef
fect
(α
+δ
Z)
GDP p.c. level in logs (Z)
Total disaster effect with GDP p.c.
α + δZ
95% CI
34
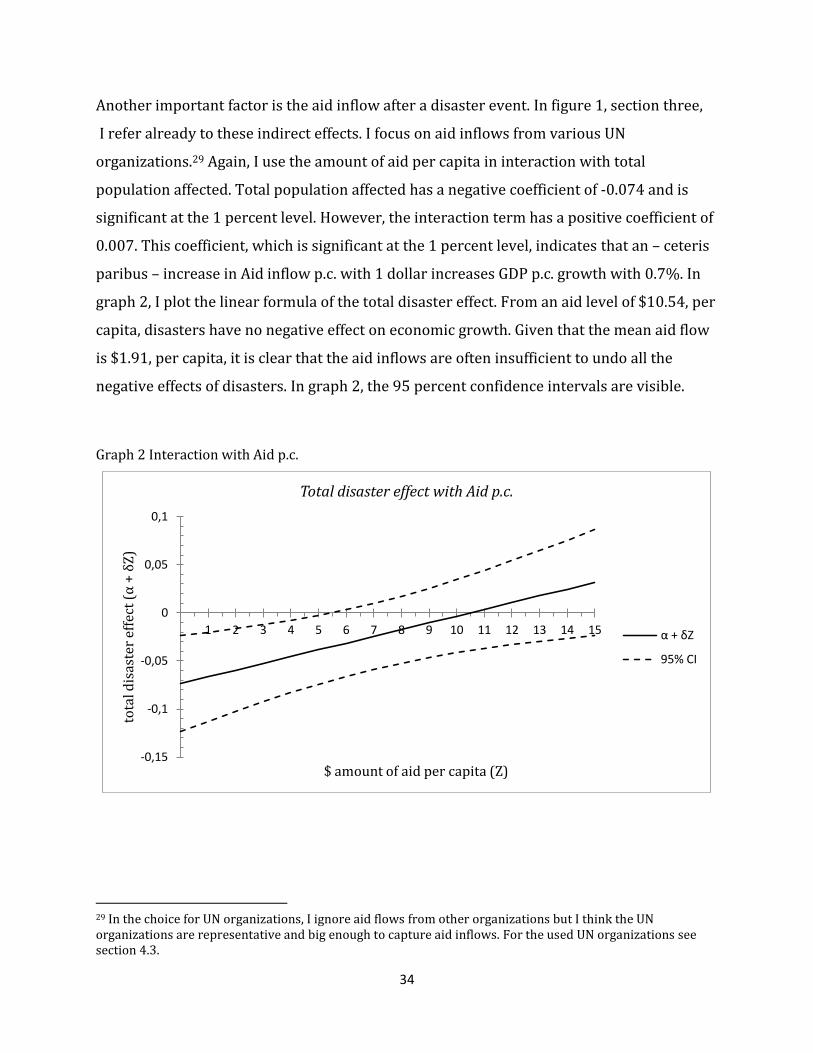
Another important factor is the aid inflow after a disaster event. In figure 1, section three,
I refer already to these indirect effects. I focus on aid inflows from various UN
organizations.29 Again, I use the amount of aid per capita in interaction with total
population affected. Total population affected has a negative coefficient of -0.074 and is
significant at the 1 percent level. However, the interaction term has a positive coefficient of
0.007. This coefficient, which is significant at the 1 percent level, indicates that an – ceteris
paribus – increase in Aid inflow p.c. with 1 dollar increases GDP p.c. growth with 0.7%. In
graph 2, I plot the linear formula of the total disaster effect. From an aid level of $10.54, per
capita, disasters have no negative effect on economic growth. Given that the mean aid flow
is $1.91, per capita, it is clear that the aid inflows are often insufficient to undo all the
negative effects of disasters. In graph 2, the 95 percent confidence intervals are visible.
Graph 2 Interaction with Aid p.c.
29 In the choice for UN organizations, I ignore aid flows from other organizations but I think the UN organizations are representative and big enough to capture aid inflows. For the used UN organizations see section 4.3.
-0,15
-0,1
-0,05
0
0,05
0,1
1 2 3 4 5 6 7 8 9 10 11 12 13 14 15
tota
l dis
aste
r ef
fect
(α
+ δ
Z)
$ amount of aid per capita (Z)
Total disaster effect with Aid p.c.
α + δZ
95% CI
35
7. Conclusion
This paper has investigated the impact of natural disasters on economic growth. The
central hypothesis was that natural disasters have a negative effect on economic growth.
By splitting up economic growth to agricultural, industrial and service p.c. growth, I
followed the study of Loayza et al (2012). However, I explored the one-year period effect
using a different measurement of disasters and a broader sample.30 I also engage the study
of Noy (2009) in using an interaction terms analysis. Building on this and other literature,
several new insights emerge:
First, there is a consistent negative short run effect of all types of natural disasters together
on GDP p.c. growth. The disaster measurement total population affected gives the best
estimates. People killed and economic damage report negative signs but insignificant
estimated coefficients. Observing the effect on different sectors, the agricultural sector is
most sensitive to natural disasters: Besides total population affected, also the number of
disasters per 1000 km2 reports significant information. I have found no consistent negative
effect of all types of natural disasters together on industrial and service p.c. growth.31
Second, amongst the different types of disasters droughts appears to be the most
significant one.32 However, storms show the greatest impact on economic growth. Their
effect is again bigger on the agricultural sector than on overall GDP p.c. growth. The
number of people killed through earthquakes shows a significant negative effect on overall
GDP p.c. growth. Earthquakes have also a highly significant negative estimate on the
agricultural sector, interesting because previous studies fail to find a significant effect of
geologic types of disasters.
Thirdly, using the number of disasters per 1000 km2 as instrumental variable for the
consequence measurements of natural disasters, gives less information that supports the
hypothesis that natural disasters have a negative effect on economic growth. Only droughts
measured in economic damage has a negative, highly significant, effect on agricultural p.c.
growth.
30 The study of Loayza et al (2012) uses a logarithmic measurement of the average disaster cost over a five-year period. 31 This is in line with the study of Loayza et al (2012). 32 The types I distinguish in this study were droughts, floods, earthquakes and storms.

36
Finally, this study explores the impact of institutional and structural characteristics of
countries in the relationship of natural disasters and economic growth. The level of GDP
per capita and aid inflow per capita mitigate the negative effect of natural disasters. For the
average country in the sample, the amount of aid per capita is insufficient to undo the
negative effect of natural disasters. The polity index, measuring the level of democracy was
not significant.
From a policy perspective, this paper gives interesting findings for a better understanding
of the effect of natural disasters on economic growth. The information in this paper
highlights the importance of disaster risk reduction and mitigation. An important area
because through climate change the frequency and magnitude of (climatic-related) natural
disasters increases. Especially the protection of agricultural based economies against
natural disasters is urgent. Furthermore, the impact of droughts should not be
underestimated. This is for example an issue in Africa. Lastly, this study proves the
relevance of aid inflows from charity/UN organizations after a natural disaster event.
This paper is a piece of a broad and important topic. There are many suggestions for
further research. The effect of different disasters types on sectors in the economy requires
further in depth investigation: especially the needed protection in the agricultural sector is
important. Another important issue is what the impact is of the insurance density in
countries with natural disasters. This is nowadays in the Philippines an interesting
question. There are several shortcomings in this study. For example, it can be argued that
using one-year periods is too short to study growth effects. In addition, the less significant
two-stage least squares estimations is an issue. I can only suggest the use of a new
instrument. For example, the wind-speed of storms or the Richter-scale for earthquakes. I
was not able to get these data. It would be interesting to see what the effect of storms and
earthquakes are using these data.

37
8. Literature
Albala-Bertrand, J. M. 1993. Political economy of large natural disasters with special
reference to developing countries. Oxford: Clarendon Press.
Alderman, Harold., John Hoddinott and Bill Kinsey. 2006. Long term consequences of early
childhood malnutrition. Oxford Economic Papers 58 (3), 450-474.
Cavallo, Eduardo and Ilan Noy. 2010. The economics of natural disasters: a survey. IDB
working paper series 124.
Hallegatte, Stéphane., Jean-Charles Hourcade and Patrice Dumas. 2007. Why economic
dynamics matter in assessing climate change damages: illustration on extreme events.
Ecological Economics 68 (3), 330-340.
Hochrainer, Stefan. 2009. Assessing the macroeconomic impacts of natural disasters: Are
there any? Policy Research Working Paper 4968. Washington, DC: World Bank.
Huiskamp, Frank. 2012. ‘Al elf mensen dood door overstromingen Midden-Europa’, NRC-
Handelsblad, June 4, http://www.nrc.nl/nieuws/2013/06/04/inmiddels-elf-mensen-dood-
door-overstromingen-waterpeil-rijn-hoger-dan-verwacht/ (downloaded 10th June 2013).
Kahn, M., 2005. The death toll from natural disasters: the role of income, geography, and
institutions. Review of Economics and Statistics 87 (2), 271–284.
Loayza, Norman V., Eduardo Olaberrial, Jamele Rigolini, and Luc Christiaensen. 2012.
Natural disasters and growth: Going beyond the averages. World Development Vol. 40 (7),
1317-1336.
Noy, Ilan and Aekkanush Nualsri. 2007. What do exogenous shocks tell us about growth
theories? Working Papers, Santa Cruz Center for International Economics, No. 07-16.
Noy, Ilan. 2009. The macroeconomic consequences of natural disasters. Journal of
development economics 88 (2), 221-231.
Raddatz, Claudio. 2007. Are external shocks responsible for the instability of output in the
low income countries? Journal of Development Economics 84, 155–187.
38
---. 2009. The wrath of God: Macroeconomic costs of natural disasters. Policy Working
Research Paper 5039. Washington, DC: World Bank.
Romer, Paul M. 1990. Endogenous technological change. Journal of Political Economy 98 (5),
p. S71-S102.
Romer, David. 2012. Advanced Macroeconomics, fourth edition. New York: McGraw-Hill.
Skidmore, Mark, and Hideki Toya. 2002. Do natural disasters promote long run growth?
Economic Inquiry 40 (4), 664-687.
Staiger, Douglas and James H. Stock. 1997. Instrumental Variables Regression with Weak
Instruments. Econometrica 65, 557-586.
IPCC, 2012: Managing the risks of extreme events and disasters to advance climate change
adaptation. A special report of Working groups I and II of the Intergovernmental Panel on
Climate Change. Cambridge University Press, Cambridge, UK, and New York, NY, USA, 582
pp.
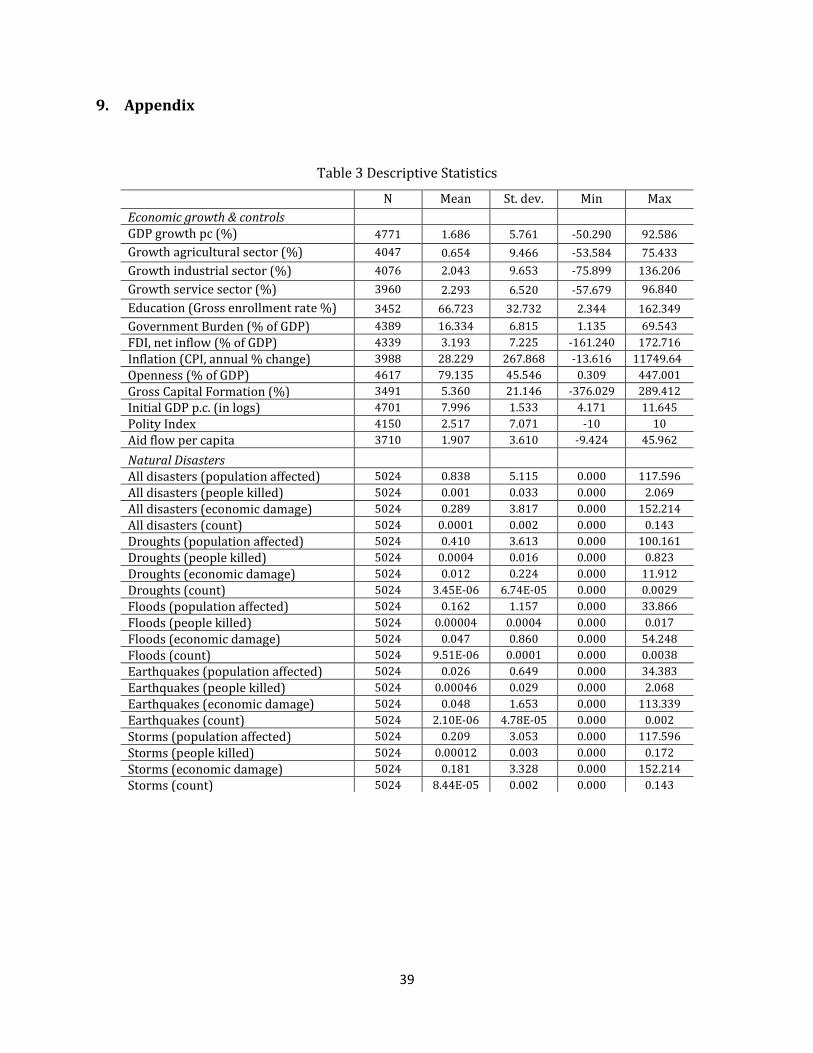
39
9. Appendix
Table 3 Descriptive Statistics
N Mean St. dev. Min Max
Economic growth & controls GDP growth pc (%) 4771 1.686 5.761 -50.290 92.586
Growth agricultural sector (%) 4047 0.654 9.466 -53.584 75.433
Growth industrial sector (%) 4076 2.043 9.653 -75.899 136.206
Growth service sector (%) 3960 2.293 6.520 -57.679 96.840
Education (Gross enrollment rate %) 3452 66.723 32.732 2.344 162.349
Government Burden (% of GDP) 4389 16.334 6.815 1.135 69.543
FDI, net inflow (% of GDP) 4339 3.193 7.225 -161.240 172.716
Inflation (CPI, annual % change) 3988 28.229 267.868 -13.616 11749.64
Openness (% of GDP) 4617 79.135 45.546 0.309 447.001
Gross Capital Formation (%) 3491 5.360 21.146 -376.029 289.412
Initial GDP p.c. (in logs) 4701 7.996 1.533 4.171 11.645
Polity Index 4150 2.517 7.071 -10 10
Aid flow per capita 3710 1.907 3.610 -9.424 45.962
Natural Disasters
All disasters (population affected) 5024 0.838 5.115 0.000 117.596
All disasters (people killed) 5024 0.001 0.033 0.000 2.069
All disasters (economic damage) 5024 0.289 3.817 0.000 152.214
All disasters (count) 5024 0.0001 0.002 0.000 0.143
Droughts (population affected) 5024 0.410 3.613 0.000 100.161
Droughts (people killed) 5024 0.0004 0.016 0.000 0.823
Droughts (economic damage) 5024 0.012 0.224 0.000 11.912
Droughts (count) 5024 3.45E-06 6.74E-05 0.000 0.0029
Floods (population affected) 5024 0.162 1.157 0.000 33.866
Floods (people killed) 5024 0.00004 0.0004 0.000 0.017
Floods (economic damage) 5024 0.047 0.860 0.000 54.248
Floods (count) 5024 9.51E-06 0.0001 0.000 0.0038
Earthquakes (population affected) 5024 0.026 0.649 0.000 34.383
Earthquakes (people killed) 5024 0.00046 0.029 0.000 2.068
Earthquakes (economic damage) 5024 0.048 1.653 0.000 113.339
Earthquakes (count) 5024 2.10E-06 4.78E-05 0.000 0.002
Storms (population affected) 5024 0.209 3.053 0.000 117.596
Storms (people killed) 5024 0.00012 0.003 0.000 0.172
Storms (economic damage) 5024 0.181 3.328 0.000 152.214
Storms (count) 5024 8.44E-05 0.002 0.000 0.143
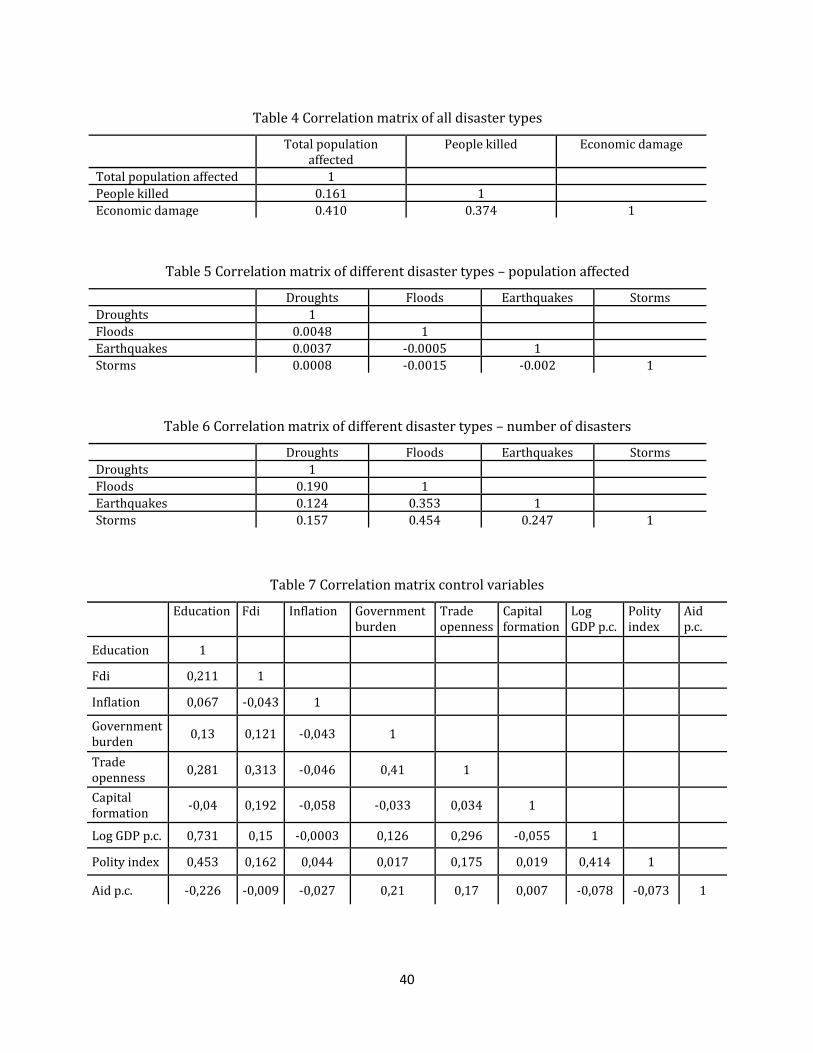
40
Table 4 Correlation matrix of all disaster types
Total population affected
People killed Economic damage
Total population affected 1
People killed 0.161 1
Economic damage 0.410 0.374 1
Table 5 Correlation matrix of different disaster types – population affected
Droughts Floods Earthquakes Storms
Droughts 1
Floods 0.0048 1
Earthquakes 0.0037 -0.0005 1
Storms 0.0008 -0.0015 -0.002 1
Table 6 Correlation matrix of different disaster types – number of disasters
Droughts Floods Earthquakes Storms
Droughts 1
Floods 0.190 1
Earthquakes 0.124 0.353 1
Storms 0.157 0.454 0.247 1
Table 7 Correlation matrix control variables
Education Fdi Inflation Government burden
Trade openness
Capital formation
Log GDP p.c.
Polity index
Aid p.c.
Education 1
Fdi 0,211 1
Inflation 0,067 -0,043 1
Government burden
0,13 0,121 -0,043 1
Trade openness
0,281 0,313 -0,046 0,41 1
Capital formation
-0,04 0,192 -0,058 -0,033 0,034 1
Log GDP p.c. 0,731 0,15 -0,0003 0,126 0,296 -0,055 1
Polity index 0,453 0,162 0,044 0,017 0,175 0,019 0,414 1
Aid p.c. -0,226 -0,009 -0,027 0,21 0,17 0,007 -0,078 -0,073 1

41
Sc
atte
rplo
t 1
Nat
ura
l dis
aste
rs a
nd
eco
no
mic
gro
wth
(1
98
0-2
01
2)
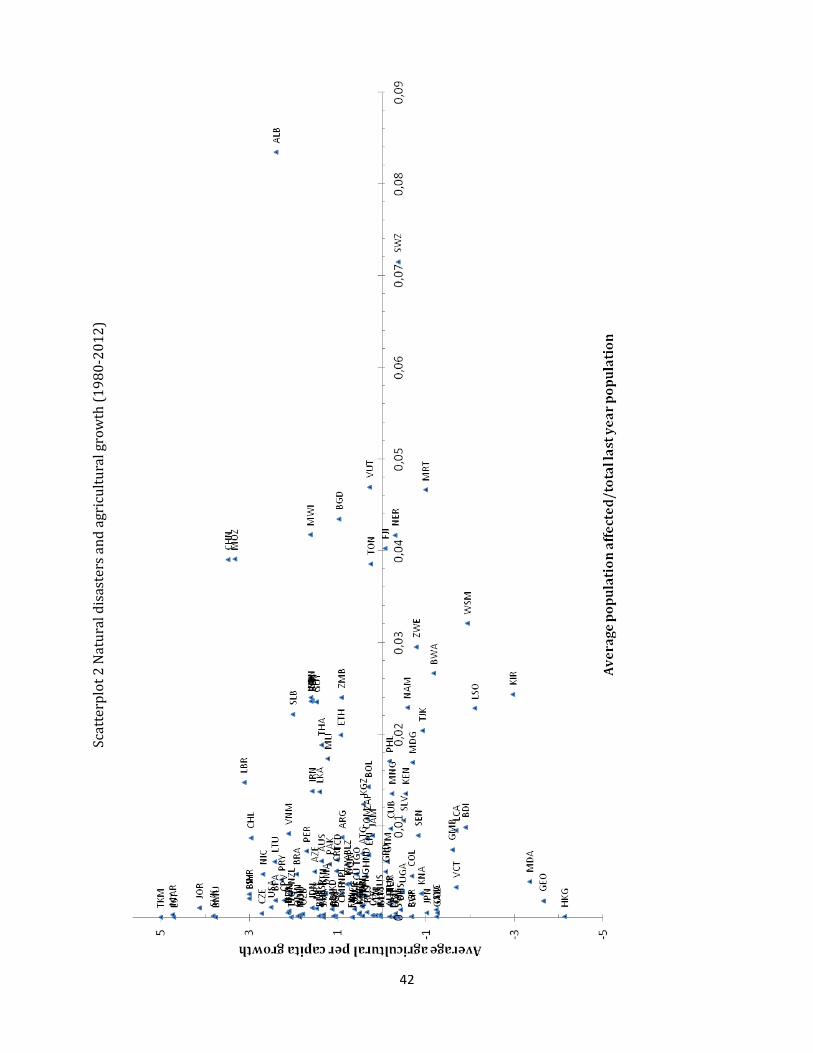
42
Sc
atte
rplo
t 2
Nat
ura
l dis
aste
rs a
nd
agr
icu
ltu
ral g
row
th (
19
80
-20
12
)

43
Table 8 Countries in the sample
Country Code Country Code
Albania ALB
Lithuania LTU
Algeria DZA
Luxembourg LUX
Antigua and Barbuda ATG
Macao MAC
Argentina ARG
Macedonia FRY MKD
Australia AUS
Madagascar MDG
Austria AUT
Malawi MWI
Azerbaijan AZE
Malaysia MYS
Bahamas BHS
Mali MLI
Bangladesh BGD
Mauritania MRT
Belarus BLR
Mauritius MUS
Belgium BEL
Mexico MEX
Belize BLZ
Micronesia Fed States FSM
Benin BEN
Moldova MDA
Bermuda BMU
Mongolia MNG
Bhutan BTN
Montenegro MNE
Bolivia BOL
Morocco MAR
Bosnia-Hercegovenia BIH
Mozambique MOZ
Botswana BWA
Myanmar MMR
Brazil BRA
Namibia NAM
Brunei Darussalam BRN
Nepal NPL
Bulgaria BGR
Netherlands NLD
Burkina Faso BFA
New Zealand NZL
Burundi BDI
Nicaragua NIC
Cameroon CMR
Niger NER
Canada CAN
Nigeria NGA
Cape Verde Is CPV
Norway NOR
Central African Rep CAF
Oman OMN
Chad TCD
Pakistan PAK
Chile CHL
Panama PAN
China P Rep CHN
Papua New Guinea PNG
Colombia COL
Paraguay PRY
Comoros COM
Peru PER
Zaire/Congo Dem Rep COD
Philippines PHL
Congo COG
Poland POL
Costa Rica CRI
Portugal PRT
Cote d\'Ivoire CIV
Puerto Rico PRI
Cuba CUB
Romania ROU
Cyprus CYP
Russia RUS
Czech Rep CZE
Rwanda RWA
Denmark DNK
Samoa WSM
44
Dominica DMA
Saudi Arabia SAU
Dominican Rep DOM
Senegal SEN
Ecuador ECU
Luxembourg LUX
Egypt EGY
Seychelles SYC
El Salvador SLV
Sierra Leone SLE
Eritrea ERI
Slovakia SVK
Estonia EST
Slovenia SVN
Ethiopia ETH
Solomon Is SLB
Fiji FJI
South Africa ZAF
Finland FIN
Spain ESP
France FRA
Sri Lanka LKA
Gabon GAB
St Kitts and Nevis KNA
Gambia The GMB
St Lucia LCA
Georgia GEO
St Vincent and the Grenadines VCT
Ghana GHA
Sudan SDN
Greece GRC
Suriname SUR
Grenada GRD
Swaziland SWZ
Guatemala GTM
Sweden SWE
Guinea Bissau GNB
Syrian Arab Rep SYR
Guyana GUY
Tajikistan TJK
Haiti HTI
Thailand THA
Honduras HND
Timor-Leste TLS
Hong Kong (China) HKG
Togo TGO
Iceland ISL
Tonga TON
India IND
Trinidad and Tobago TTO
Indonesia IDN
Tunisia TUN
Iran Islamic Rep IRN
Turkey TUR
Israel ISR
Turkmenistan TKM
Italy ITA
Uganda UGA
Jamaica JAM
Ukraine UKR
Japan JPN
United Kingdom GBR
Jordan JOR
United States USA
Kazakhstan KAZ
Uruguay URY
Kenya KEN
Uzbekistan UZB
Kiribati KIR
Vanuatu VUT
Korea Rep KOR
Venezuela VEN
Kyrgyzstan KGZ
Viet Nam VNM
Latvia LVA
Zambia ZMB
Lesotho LSO
Zimbabwe ZWE
Liberia LBR
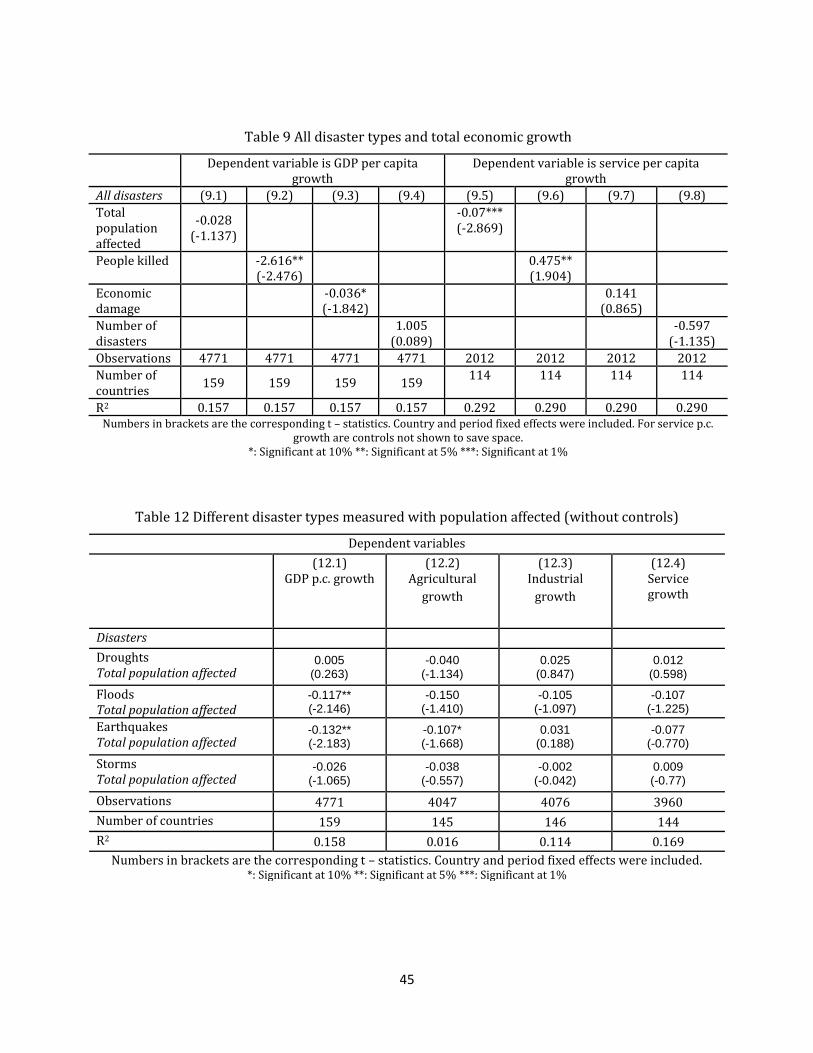
45
Table 9 All disaster types and total economic growth
Dependent variable is GDP per capita growth
Dependent variable is service per capita growth
All disasters (9.1) (9.2) (9.3) (9.4) (9.5) (9.6) (9.7) (9.8)
Total population affected
-0.028 (-1.137)
-0.07*** (-2.869)
People killed
-2.616** (-2.476)
0.475**
(1.904)
Economic damage
-0.036* (-1.842)
0.141
(0.865)
Number of disasters
1.005
(0.089)
-0.597
(-1.135)
Observations 4771 4771 4771 4771 2012 2012 2012 2012
Number of countries
159 159 159 159 114 114 114 114
R2 0.157 0.157 0.157 0.157 0.292 0.290 0.290 0.290 Numbers in brackets are the corresponding t – statistics. Country and period fixed effects were included. For service p.c.
growth are controls not shown to save space. *: Significant at 10% **: Significant at 5% ***: Significant at 1%
Table 12 Different disaster types measured with population affected (without controls)
Dependent variables
(12.1) GDP p.c. growth
(12.2) Agricultural
growth
(12.3) Industrial
growth
(12.4) Service growth
Disasters
Droughts Total population affected
0.005 (0.263)
-0.040 (-1.134)
0.025 (0.847)
0.012 (0.598)
Floods Total population affected
-0.117** (-2.146)
-0.150 (-1.410)
-0.105 (-1.097)
-0.107 (-1.225)
Earthquakes Total population affected
-0.132** (-2.183)
-0.107* (-1.668)
0.031 (0.188)
-0.077 (-0.770)
Storms Total population affected
-0.026 (-1.065)
-0.038 (-0.557)
-0.002 (-0.042)
0.009 (-0.77)
Observations 4771 4047 4076 3960
Number of countries 159 145 146 144
R2 0.158 0.016 0.114 0.169
Numbers in brackets are the corresponding t – statistics. Country and period fixed effects were included. *: Significant at 10% **: Significant at 5% ***: Significant at 1%
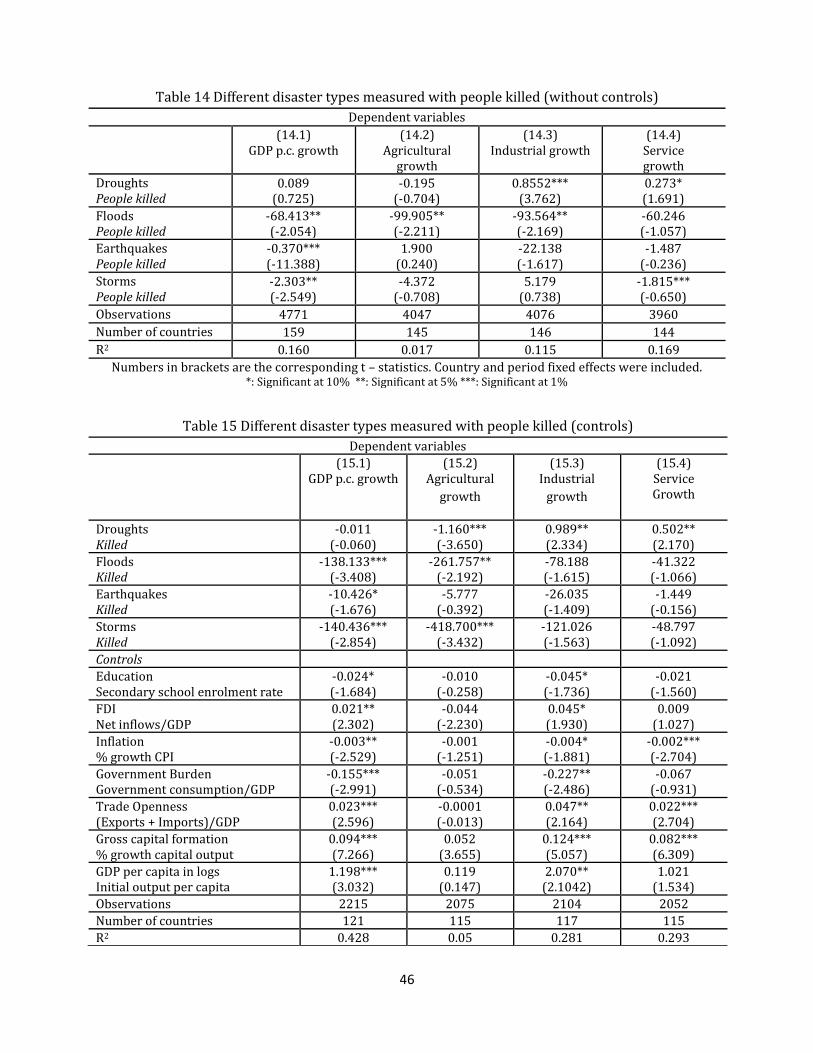
46
Table 14 Different disaster types measured with people killed (without controls)
Dependent variables
(14.1) GDP p.c. growth
(14.2) Agricultural
growth
(14.3) Industrial growth
(14.4) Service growth
Droughts People killed
0.089 (0.725)
-0.195 (-0.704)
0.8552*** (3.762)
0.273* (1.691)
Floods People killed
-68.413** (-2.054)
-99.905** (-2.211)
-93.564** (-2.169)
-60.246 (-1.057)
Earthquakes People killed
-0.370*** (-11.388)
1.900 (0.240)
-22.138 (-1.617)
-1.487 (-0.236)
Storms People killed
-2.303** (-2.549)
-4.372 (-0.708)
5.179 (0.738)
-1.815*** (-0.650)
Observations 4771 4047 4076 3960
Number of countries 159 145 146 144
R2 0.160 0.017 0.115 0.169
Numbers in brackets are the corresponding t – statistics. Country and period fixed effects were included. *: Significant at 10% **: Significant at 5% ***: Significant at 1%
Table 15 Different disaster types measured with people killed (controls)
Dependent variables
(15.1) GDP p.c. growth
(15.2) Agricultural
growth
(15.3) Industrial
growth
(15.4) Service Growth
Droughts Killed
-0.011 (-0.060)
-1.160*** (-3.650)
0.989** (2.334)
0.502** (2.170)
Floods Killed
-138.133*** (-3.408)
-261.757** (-2.192)
-78.188 (-1.615)
-41.322 (-1.066)
Earthquakes Killed
-10.426* (-1.676)
-5.777 (-0.392)
-26.035 (-1.409)
-1.449 (-0.156)
Storms Killed
-140.436*** (-2.854)
-418.700*** (-3.432)
-121.026 (-1.563)
-48.797 (-1.092)
Controls
Education Secondary school enrolment rate
-0.024* (-1.684)
-0.010 (-0.258)
-0.045* (-1.736)
-0.021 (-1.560)
FDI Net inflows/GDP
0.021** (2.302)
-0.044 (-2.230)
0.045* (1.930)
0.009 (1.027)
Inflation % growth CPI
-0.003** (-2.529)
-0.001 (-1.251)
-0.004* (-1.881)
-0.002*** (-2.704)
Government Burden Government consumption/GDP
-0.155*** (-2.991)
-0.051 (-0.534)
-0.227** (-2.486)
-0.067 (-0.931)
Trade Openness (Exports + Imports)/GDP
0.023*** (2.596)
-0.0001 (-0.013)
0.047** (2.164)
0.022*** (2.704)
Gross capital formation % growth capital output
0.094*** (7.266)
0.052 (3.655)
0.124*** (5.057)
0.082*** (6.309)
GDP per capita in logs Initial output per capita
1.198*** (3.032)
0.119 (0.147)
2.070** (2.1042)
1.021 (1.534)
Observations 2215 2075 2104 2052
Number of countries 121 115 117 115
R2 0.428 0.05 0.281 0.293
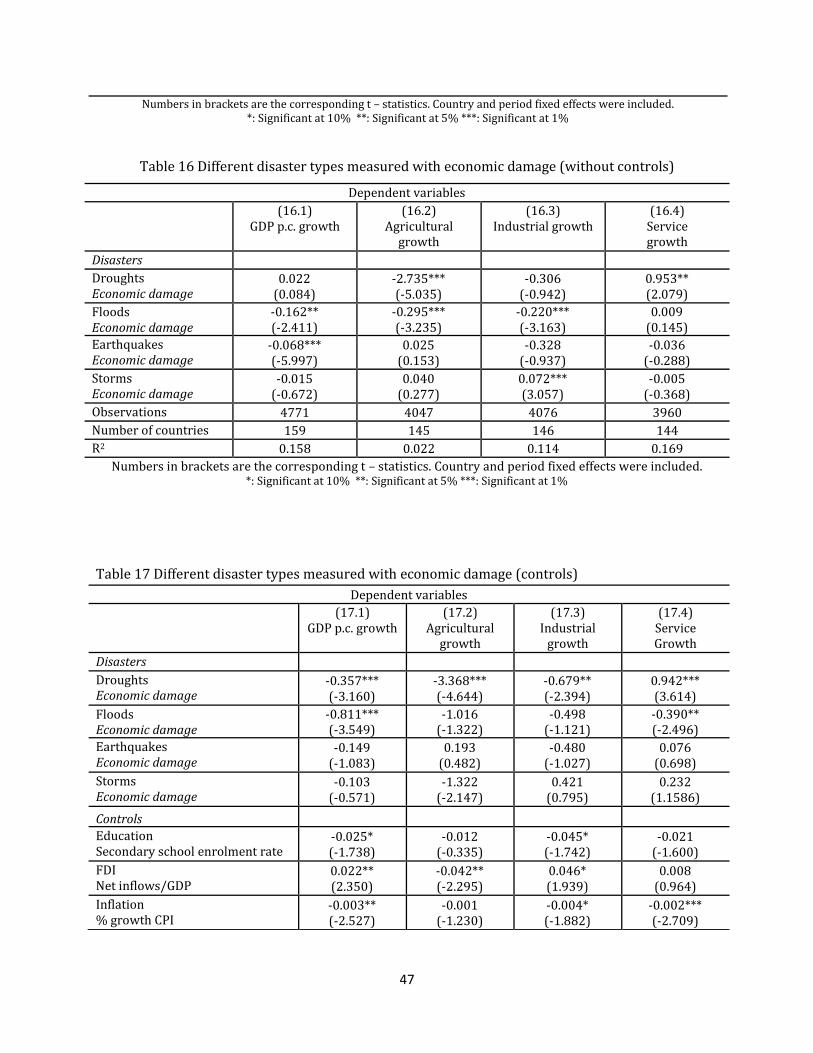
47
Numbers in brackets are the corresponding t – statistics. Country and period fixed effects were included. *: Significant at 10% **: Significant at 5% ***: Significant at 1%
Table 16 Different disaster types measured with economic damage (without controls)
Dependent variables
(16.1) GDP p.c. growth
(16.2) Agricultural
growth
(16.3) Industrial growth
(16.4) Service growth
Disasters
Droughts Economic damage
0.022 (0.084)
-2.735*** (-5.035)
-0.306 (-0.942)
0.953** (2.079)
Floods Economic damage
-0.162** (-2.411)
-0.295*** (-3.235)
-0.220*** (-3.163)
0.009 (0.145)
Earthquakes Economic damage
-0.068*** (-5.997)
0.025 (0.153)
-0.328 (-0.937)
-0.036 (-0.288)
Storms Economic damage
-0.015 (-0.672)
0.040 (0.277)
0.072*** (3.057)
-0.005 (-0.368)
Observations 4771 4047 4076 3960
Number of countries 159 145 146 144
R2 0.158 0.022 0.114 0.169
Numbers in brackets are the corresponding t – statistics. Country and period fixed effects were included. *: Significant at 10% **: Significant at 5% ***: Significant at 1%
Table 17 Different disaster types measured with economic damage (controls)
Dependent variables
(17.1) GDP p.c. growth
(17.2) Agricultural
growth
(17.3) Industrial
growth
(17.4) Service Growth
Disasters
Droughts Economic damage
-0.357*** (-3.160)
-3.368*** (-4.644)
-0.679** (-2.394)
0.942*** (3.614)
Floods Economic damage
-0.811*** (-3.549)
-1.016 (-1.322)
-0.498 (-1.121)
-0.390** (-2.496)
Earthquakes Economic damage
-0.149 (-1.083)
0.193 (0.482)
-0.480 (-1.027)
0.076 (0.698)
Storms Economic damage
-0.103 (-0.571)
-1.322 (-2.147)
0.421 (0.795)
0.232 (1.1586)
Controls
Education Secondary school enrolment rate
-0.025* (-1.738)
-0.012 (-0.335)
-0.045* (-1.742)
-0.021 (-1.600)
FDI Net inflows/GDP
0.022** (2.350)
-0.042** (-2.295)
0.046* (1.939)
0.008 (0.964)
Inflation % growth CPI
-0.003** (-2.527)
-0.001 (-1.230)
-0.004* (-1.882)
-0.002*** (-2.709)
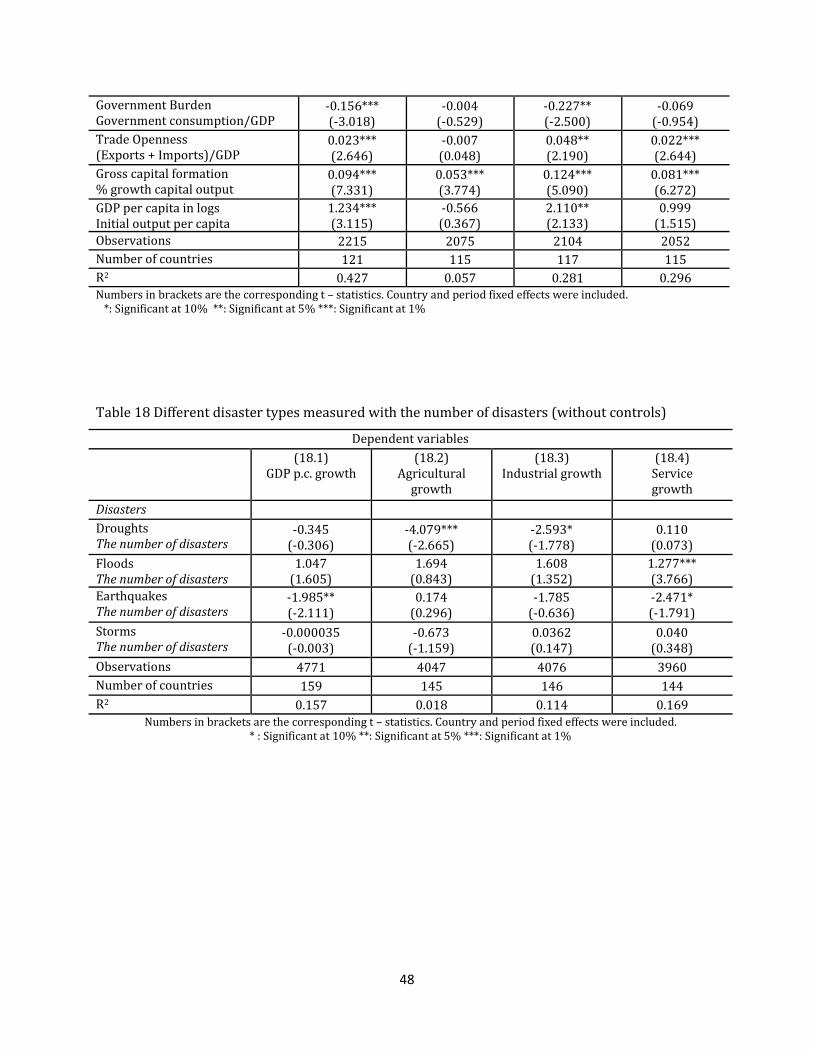
48
Government Burden Government consumption/GDP
-0.156*** (-3.018)
-0.004 (-0.529)
-0.227** (-2.500)
-0.069 (-0.954)
Trade Openness (Exports + Imports)/GDP
0.023*** (2.646)
-0.007 (0.048)
0.048** (2.190)
0.022*** (2.644)
Gross capital formation % growth capital output
0.094*** (7.331)
0.053*** (3.774)
0.124*** (5.090)
0.081*** (6.272)
GDP per capita in logs Initial output per capita
1.234*** (3.115)
-0.566 (0.367)
2.110** (2.133)
0.999 (1.515)
Observations 2215 2075 2104 2052
Number of countries 121 115 117 115
R2 0.427 0.057 0.281 0.296 Numbers in brackets are the corresponding t – statistics. Country and period fixed effects were included. *: Significant at 10% **: Significant at 5% ***: Significant at 1%
Table 18 Different disaster types measured with the number of disasters (without controls)
Dependent variables
(18.1) GDP p.c. growth
(18.2) Agricultural
growth
(18.3) Industrial growth
(18.4) Service growth
Disasters
Droughts The number of disasters
-0.345 (-0.306)
-4.079*** (-2.665)
-2.593* (-1.778)
0.110 (0.073)
Floods The number of disasters
1.047 (1.605)
1.694 (0.843)
1.608 (1.352)
1.277*** (3.766)
Earthquakes The number of disasters
-1.985** (-2.111)
0.174 (0.296)
-1.785 (-0.636)
-2.471* (-1.791)
Storms The number of disasters
-0.000035 (-0.003)
-0.673 (-1.159)
0.0362 (0.147)
0.040 (0.348)
Observations 4771 4047 4076 3960
Number of countries 159 145 146 144
R2 0.157 0.018 0.114 0.169 Numbers in brackets are the corresponding t – statistics. Country and period fixed effects were included.
* : Significant at 10% **: Significant at 5% ***: Significant at 1%
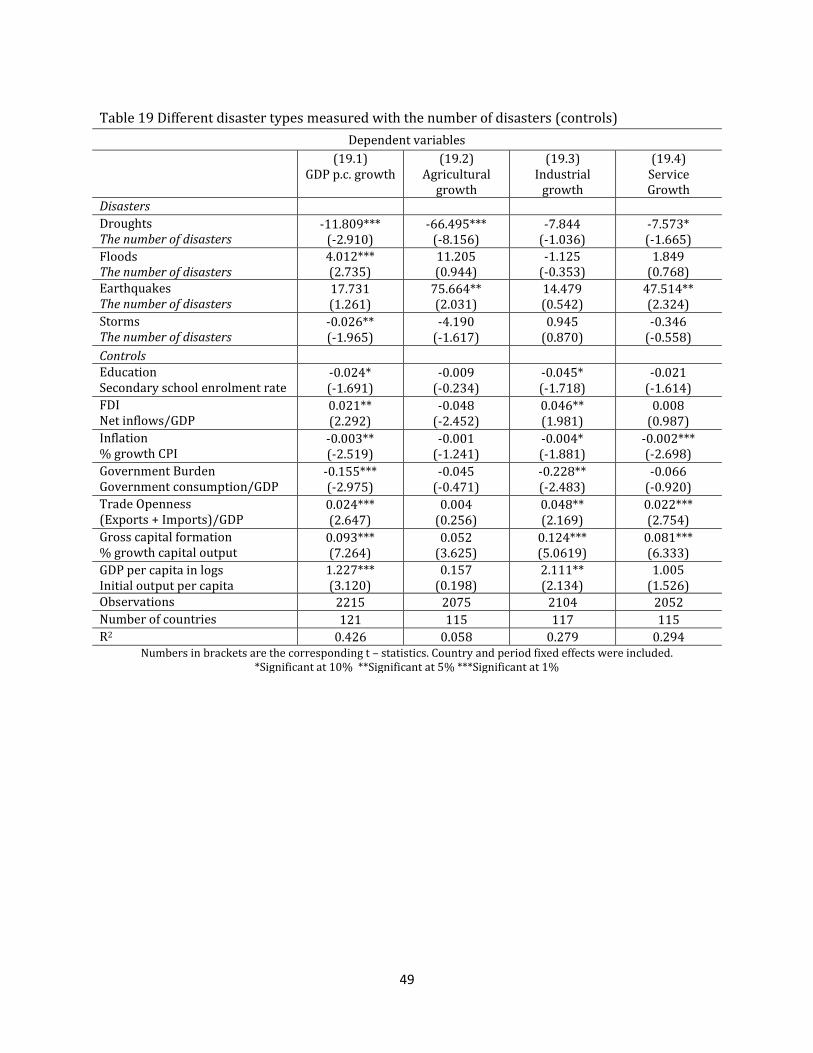
49
Table 19 Different disaster types measured with the number of disasters (controls)
Dependent variables
(19.1) GDP p.c. growth
(19.2) Agricultural
growth
(19.3) Industrial
growth
(19.4) Service Growth
Disasters
Droughts The number of disasters
-11.809*** (-2.910)
-66.495*** (-8.156)
-7.844 (-1.036)
-7.573* (-1.665)
Floods The number of disasters
4.012*** (2.735)
11.205 (0.944)
-1.125 (-0.353)
1.849 (0.768)
Earthquakes The number of disasters
17.731 (1.261)
75.664** (2.031)
14.479 (0.542)
47.514** (2.324)
Storms The number of disasters
-0.026** (-1.965)
-4.190 (-1.617)
0.945 (0.870)
-0.346 (-0.558)
Controls
Education Secondary school enrolment rate
-0.024* (-1.691)
-0.009 (-0.234)
-0.045* (-1.718)
-0.021 (-1.614)
FDI Net inflows/GDP
0.021** (2.292)
-0.048 (-2.452)
0.046** (1.981)
0.008 (0.987)
Inflation % growth CPI
-0.003** (-2.519)
-0.001 (-1.241)
-0.004* (-1.881)
-0.002*** (-2.698)
Government Burden Government consumption/GDP
-0.155*** (-2.975)
-0.045 (-0.471)
-0.228** (-2.483)
-0.066 (-0.920)
Trade Openness (Exports + Imports)/GDP
0.024*** (2.647)
0.004 (0.256)
0.048** (2.169)
0.022*** (2.754)
Gross capital formation % growth capital output
0.093*** (7.264)
0.052 (3.625)
0.124*** (5.0619)
0.081*** (6.333)
GDP per capita in logs Initial output per capita
1.227*** (3.120)
0.157 (0.198)
2.111** (2.134)
1.005 (1.526)
Observations 2215 2075 2104 2052
Number of countries 121 115 117 115
R2 0.426 0.058 0.279 0.294 Numbers in brackets are the corresponding t – statistics. Country and period fixed effects were included.
*Significant at 10% **Significant at 5% ***Significant at 1%
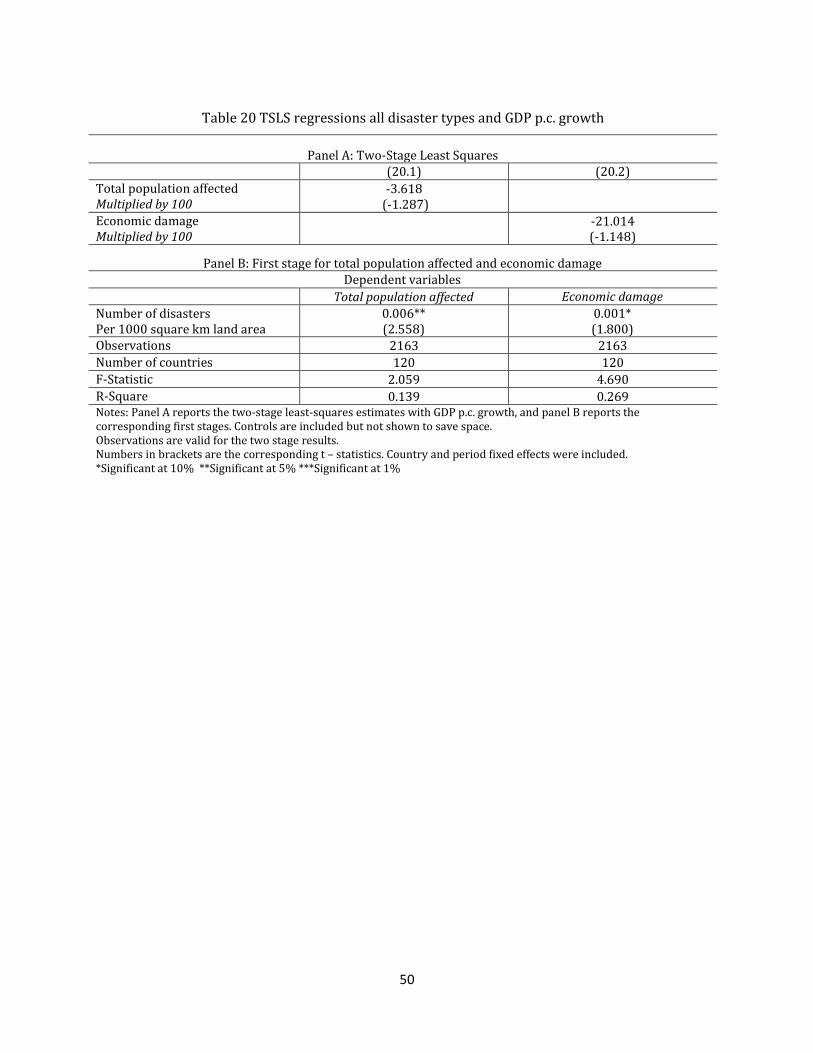
50
Table 20 TSLS regressions all disaster types and GDP p.c. growth
Panel A: Two-Stage Least Squares (20.1) (20.2)
Total population affected Multiplied by 100
-3.618 (-1.287)
Economic damage Multiplied by 100
-21.014
(-1.148)
Panel B: First stage for total population affected and economic damage Dependent variables
Total population affected Economic damage
Number of disasters Per 1000 square km land area
0.006** (2.558)
0.001* (1.800)
Observations 2163 2163
Number of countries 120 120
F-Statistic 2.059 4.690
R-Square 0.139 0.269 Notes: Panel A reports the two-stage least-squares estimates with GDP p.c. growth, and panel B reports the corresponding first stages. Controls are included but not shown to save space. Observations are valid for the two stage results. Numbers in brackets are the corresponding t – statistics. Country and period fixed effects were included. *Significant at 10% **Significant at 5% ***Significant at 1%
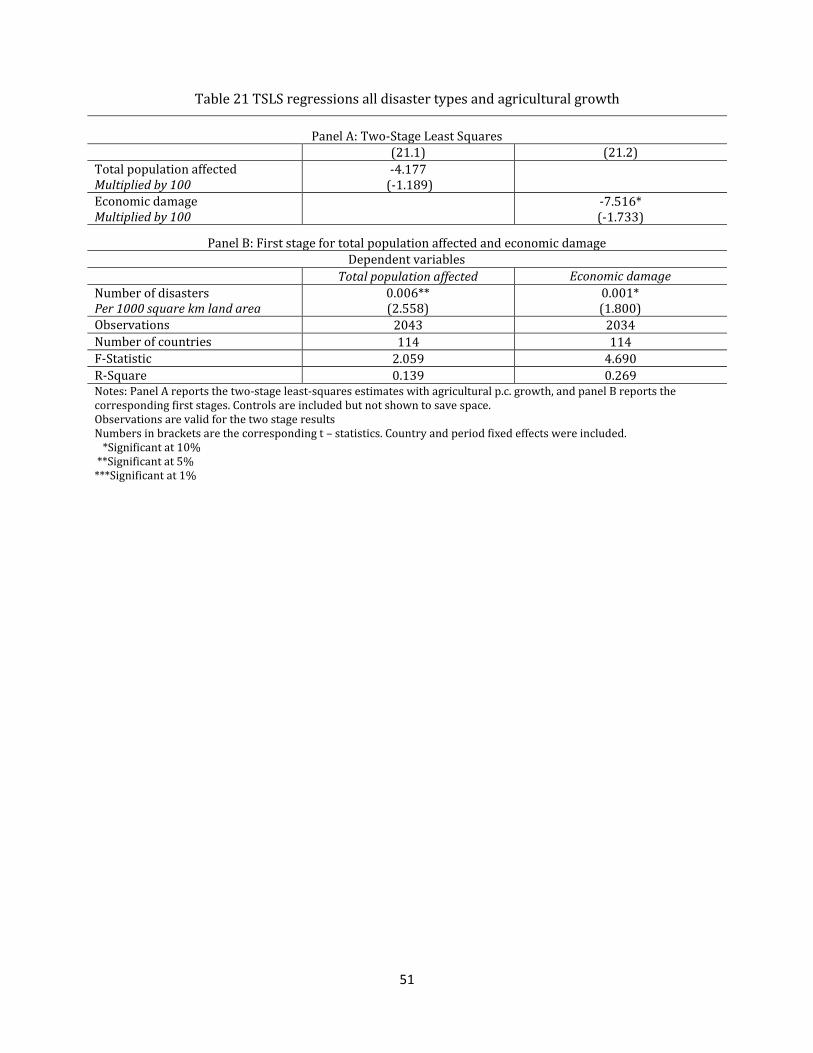
51
Table 21 TSLS regressions all disaster types and agricultural growth
Panel A: Two-Stage Least Squares (21.1) (21.2)
Total population affected Multiplied by 100
-4.177 (-1.189)
Economic damage Multiplied by 100
-7.516*
(-1.733)
Panel B: First stage for total population affected and economic damage Dependent variables
Total population affected Economic damage
Number of disasters Per 1000 square km land area
0.006** (2.558)
0.001* (1.800)
Observations 2043 2034
Number of countries 114 114 F-Statistic 2.059 4.690
R-Square 0.139 0.269 Notes: Panel A reports the two-stage least-squares estimates with agricultural p.c. growth, and panel B reports the corresponding first stages. Controls are included but not shown to save space. Observations are valid for the two stage results Numbers in brackets are the corresponding t – statistics. Country and period fixed effects were included. *Significant at 10% **Significant at 5% ***Significant at 1%
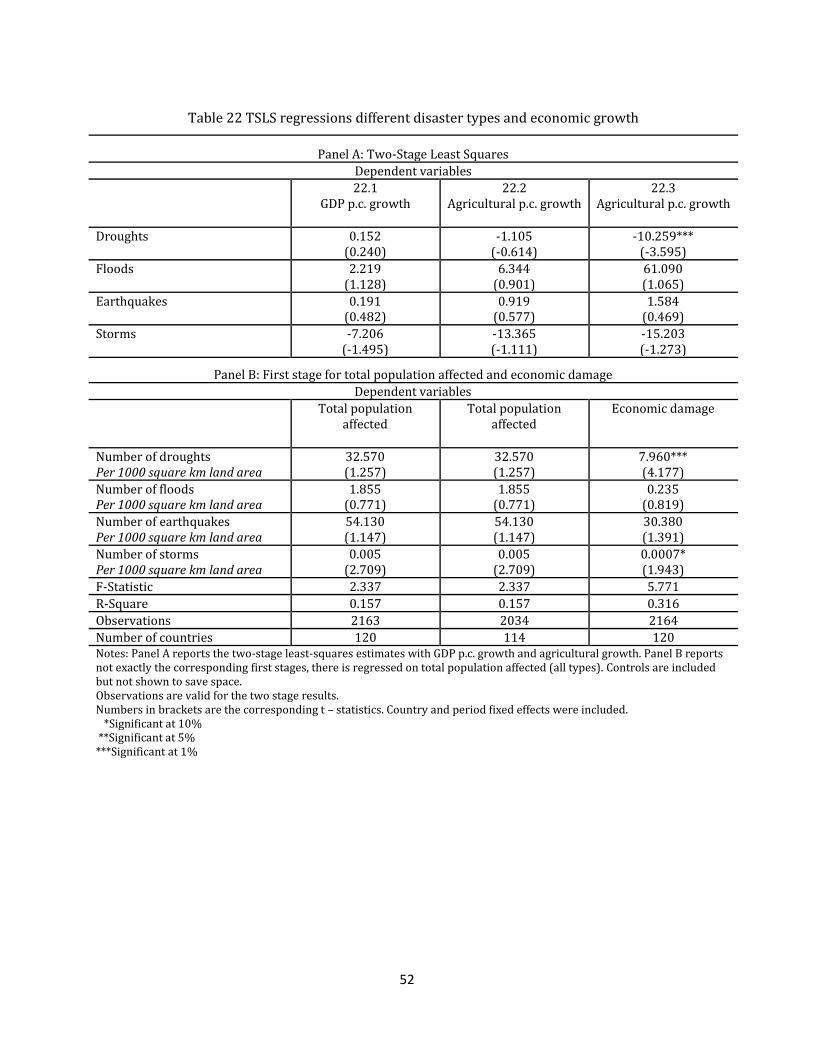
52
Table 22 TSLS regressions different disaster types and economic growth
Panel A: Two-Stage Least Squares
Dependent variables
22.1 GDP p.c. growth
22.2 Agricultural p.c. growth
22.3 Agricultural p.c. growth
Droughts 0.152 (0.240)
-1.105 (-0.614)
-10.259*** (-3.595)
Floods 2.219 (1.128)
6.344 (0.901)
61.090 (1.065)
Earthquakes 0.191 (0.482)
0.919 (0.577)
1.584 (0.469)
Storms -7.206 (-1.495)
-13.365 (-1.111)
-15.203 (-1.273)
Panel B: First stage for total population affected and economic damage
Dependent variables
Total population affected
Total population affected
Economic damage
Number of droughts Per 1000 square km land area
32.570 (1.257)
32.570 (1.257)
7.960*** (4.177)
Number of floods Per 1000 square km land area
1.855 (0.771)
1.855 (0.771)
0.235 (0.819)
Number of earthquakes Per 1000 square km land area
54.130 (1.147)
54.130 (1.147)
30.380 (1.391)
Number of storms Per 1000 square km land area
0.005 (2.709)
0.005 (2.709)
0.0007* (1.943)
F-Statistic 2.337 2.337 5.771
R-Square 0.157 0.157 0.316
Observations 2163 2034 2164
Number of countries 120 114 120 Notes: Panel A reports the two-stage least-squares estimates with GDP p.c. growth and agricultural growth. Panel B reports not exactly the corresponding first stages, there is regressed on total population affected (all types). Controls are included but not shown to save space. Observations are valid for the two stage results. Numbers in brackets are the corresponding t – statistics. Country and period fixed effects were included. *Significant at 10% **Significant at 5% ***Significant at 1%
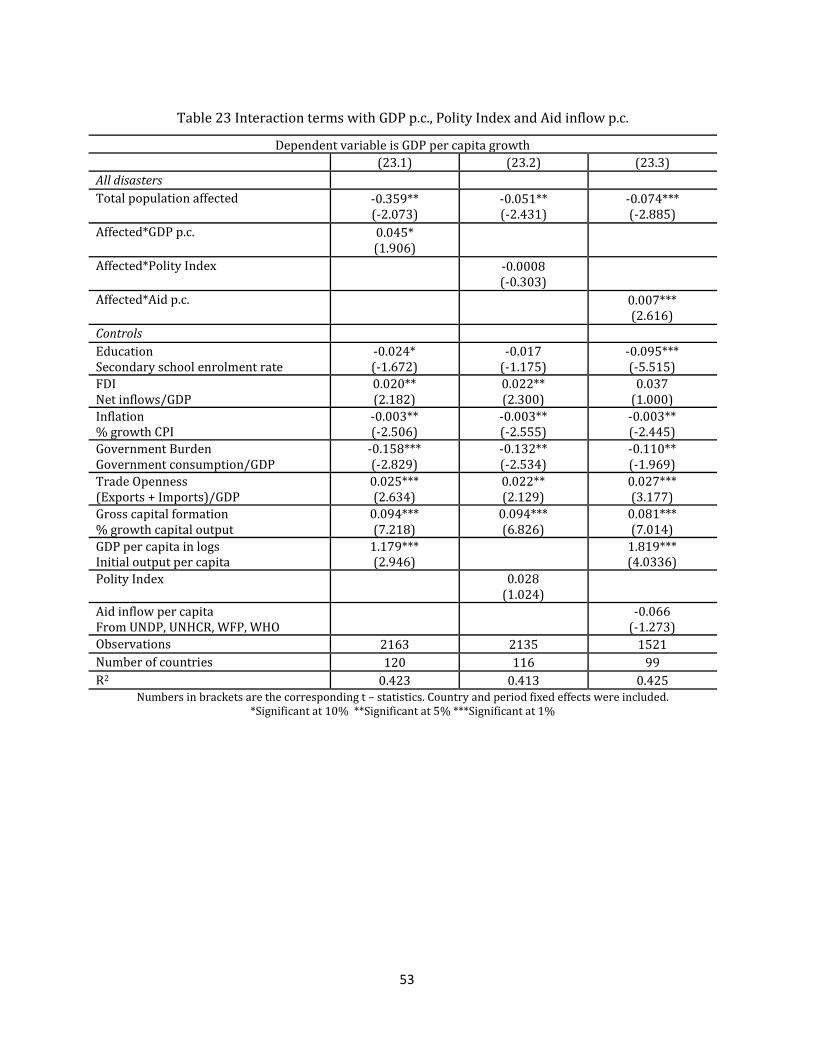
53
Table 23 Interaction terms with GDP p.c., Polity Index and Aid inflow p.c.
Dependent variable is GDP per capita growth
(23.1) (23.2) (23.3)
All disasters
Total population affected -0.359** (-2.073)
-0.051** (-2.431)
-0.074*** (-2.885)
Affected*GDP p.c. 0.045* (1.906)
Affected*Polity Index
-0.0008 (-0.303)
Affected*Aid p.c.
0.007*** (2.616)
Controls
Education Secondary school enrolment rate
-0.024* (-1.672)
-0.017 (-1.175)
-0.095*** (-5.515)
FDI Net inflows/GDP
0.020** (2.182)
0.022** (2.300)
0.037 (1.000)
Inflation % growth CPI
-0.003** (-2.506)
-0.003** (-2.555)
-0.003** (-2.445)
Government Burden Government consumption/GDP
-0.158*** (-2.829)
-0.132** (-2.534)
-0.110** (-1.969)
Trade Openness (Exports + Imports)/GDP
0.025*** (2.634)
0.022** (2.129)
0.027*** (3.177)
Gross capital formation % growth capital output
0.094*** (7.218)
0.094*** (6.826)
0.081*** (7.014)
GDP per capita in logs Initial output per capita
1.179*** (2.946)
1.819*** (4.0336)
Polity Index
0.028 (1.024)
Aid inflow per capita From UNDP, UNHCR, WFP, WHO
-0.066
(-1.273)
Observations 2163 2135 1521
Number of countries 120 116 99
R2 0.423 0.413 0.425 Numbers in brackets are the corresponding t – statistics. Country and period fixed effects were included.
*Significant at 10% **Significant at 5% ***Significant at 1%