Embed Size (px)
Citation preview

THE ECONOMIC IMPACT OF ADVERTISING EXPENDITURES IN THE UNITED STATES
2012 - 2017
A REPORT PREPARED FOR:
The Advertising Coalition
ANALYSIS BY:
IHS Global Insight, Inc.
January 2014

TABLE OF CONTENTS
1. Introduction ............................................................................................................... 1
2. The Impacts of Advertising on Sales and Employment .......................................... 3
Table 1 – Ad Spending Impact on Sales by State (Millions of Dollars)....................................... 7
Table 2 – Ad Spending Impact on Employment by State (Number of Jobs) .............................. 8
Table 3 - Total Output and Employment by State (Millions of Dollars / Number of Jobs) .......... 9
Table 4 - Ad Spending Impact as a Share of State Output in 2012 (Millions of Dollars) ......... 10
Table 5 - Ad Employment Impact as a Share of 2012 Employment (Jobs) .............. 11
3. Potential Losses from a Reduction in Tax Deductibility ...................................... 12
Table 6 – Loss in Ad Spending in 2010 Due to a Reduction in Tax Deductibility (Millions of
Dollars) ...................................................................................................................................... 13
Table 7 – Forecast of Loss in Ad Spending Due to a Reduction in Tax Deductibility
(Millions of Dollars) ............................................................................................................... 13
Table 8 - Forecast of Loss in Ad Employment Due to 20% Reduction in
Deductibility (Number of Jobs) ........................................................................................... 14
Table 9 – Relative Increase in Ad Costs under 3-Year Amortization Tax Regime ... 14
Appendix A: Methodology .......................................................................................... 15
Table 10 - Data Sources ........................................................................................................... 16
Table 11 - Advertising Activities Included in this Report ........................................................... 17
Table 12 - Industry Definitions .................................................................................................. 18
Appendix B: IHS Global Insight Macroeconomic Models ......................................... 22
IHS MODEL OF THE U.S. ECONOMY .................................................................................... 22
IHS REGIONAL ECONOMIC MODELS ................................................................................... 23
IHS US INDUSTRY MODEL ..................................................................................................... 24
IHS US BUSINESS MARKET INSIGHTS ................................................................................. 24
THE IMPLAN MODEL ............................................................................................................... 24
THE ECONOMIC IMPACT OF ADVERTISING
EXPENDITURES IN THE UNITED STATES
January 2014 1 ©2014 IHS
1. Introduction
Advertising stimulates a large amount of sales and jobs in the US economy. Each form of advertising, ranging from direct mail to print to broadcast to internet, helps businesses build brand awareness and communicate the benefits of their products and services to target audiences. The resulting heightened awareness among buyers can shift market share among competing firms, while stimulating economic activity that would not have occurred otherwise. This, in turns, triggers a cascade of economic activity that stimulates job creation and retention throughout the US economy.
The Advertising Coalition commissioned IHS Global Insight, Inc. to conduct a comprehensive assessment of the total economic impact of advertising expenditures across 16 industries, plus government, in each state and Washington, D.C., as well as in each of the four hundred and thirty five Congressional Districts in the United States.
The goal of this study is to quantify the level of sales and employment that are attributable to the stimulative effect of advertising. The increased sales require higher levels of production, which helps create and maintain jobs across every industry, state and Congressional District. IHS assessed the economic impact of advertising along four dimensions1:
Direct Economic Impact: which encompasses, first, the dollars spent on and the jobs dedicated to developing and implementing advertising activities to stimulate demand for products and services in each industry and, second, the sales and jobs accruing to industries that utilize advertising to stimulate demand for their products and services. The type of transaction included in this stage of the impact is exemplified by the sale of a shirt via a company catalog to a consumer or the sale of an insurance policy by an insurance agent from a lead generated through television advertising.
Supplier Economic Impact: encompasses the indirect sales and jobs supported by first level suppliers to those industries that use advertising. The type of transaction included in this stage of the impact is exemplified by the sale of the shirt by a garment manufacturer to the catalog company or the services provided by an accounting firm that audits the books of the insurance company.
Inter-Industry Economic Impact: includes the indirect sales and jobs supported by all the remaining levels of suppliers to the first generation suppliers identified in the supplier economic impact. This level of impact encompasses activity by the cloth, button, thread and sewing equipment manufacturers who are the suppliers to the shirt maker as well as all other products and services that are required to run the textile business.
Induced Consumer Spending: every person that has a direct, supplier or interindustry job also plays the role of consumer in the US economy. They spend a portion of their salaries in the economy on items such as food, consumer goods and services, healthcare and so on. This spending initiates multiple rounds of economic activity, stimulating additional sales and job creation.
1 Discussions of the methodologies used in and econometric modeling conducted for this study
are presented in Appendices A and B.
THE ECONOMIC IMPACT OF ADVERTISING
EXPENDITURES IN THE UNITED STATES
January 2014 2 ©2014 IHS
In summary, we found that, for the forecast period 2012 to 2017:
Every dollar of ad spending will generate, on average, almost $22 of economic output (sales).
Every million dollars of annual ad spending will support 81 American jobs.
In 2012, advertising (ad spending + advertising-related sales) accounted for $5.8 trillion of the $33.8 trillion in US output and supported 21.1 million of the 136.2 million US jobs.
By 2017, advertising will account for $6.8 trillion of $42.3 trillion in US output and support 22.1 million of 146.7 million US jobs.
IHS Global Insight ran an additional simulation to assess the effect of a change in tax policy whereby the portion of ad spending that is tax deductible is decreased from its current 100% to 80%. The simulation results are put forth at the national level and by sixteen broad industry aggregates in Chapter 3. This change in tax deductibility in 2012 would have triggered:
A $19.4 billion loss in ad spending
A loss of $419 billion in additional economic output
A loss of approximately 42,000 jobs directly related to advertising, and
The elimination of an additional 1.6 million American jobs.
The models in this report contain information from several distinct datasets and larger economic models at IHS Global Insight. The forecasts of macroeconomic variables, such as GDP, consumer spending and corporate profits, contained in this report are created in the US Macroeconomic Model. The levels of output and employment by industry are maintained in the US Industry Analysis Model. The state level economic data come from the US Regional Service. Induced impacts were assessed using the IMPLAN model. Appendix B of the report provides descriptions of these models.

THE ECONOMIC IMPACT OF ADVERTISING
EXPENDITURES IN THE UNITED STATES
January 2014 3 ©2014 IHS
2. The Impacts of Advertising on Sales and Employment
In the 2010 edition of this report, IHS Global Insight acknowledged that advertisers had cut spending during the recession, which officially ended in 2009. We predicted that ad spending would rebound to pre-recessionary levels in 2011. Unfortunately, the optimism of 2010 soon faded as the economy struggled to regain strength. The models we used to conduct the current analysis have been updated to reflect a more protracted US economic recovery. As shown in Figure 1, ad spending contracted more quickly than the overall economy in 2008 – 2009. The optimism in early 2010 helped ad spending growth to temporarily outpace the overall economy, only to slow again as that optimism was replaced by the realization that the recovery cycle will be a multi-year period.
Figure 1: Percent Change in Real Ad Spending versus Real GDP
Source: IHS Global Insight
Our updated forecast predicts ad spending will not exceed pre-recessionary levels until 2016 (Figure 2). This is indicative of firms suppressing their ad spending until the economy strengthens and target customers are in a better position to make advertising-influenced purchase decisions.
Figure 2 - Total Advertising Expenditures (Nominal US Dollars)
Source: IHS Global Insight
-15%
-10%
-5%
0%
5%
2008 2009 2010 2011 2012 2013 2014 2015 2016 2017
% change in Real GDP % change in Real Ad Spending
200
225
250
275
300
325
2007 2009 2011 2013 2015 2017
BIl
lio
ns
of
Do
lla
rs
Pre-recession level
THE ECONOMIC IMPACT OF ADVERTISING
EXPENDITURES IN THE UNITED STATES
January 2014 4 ©2014 IHS
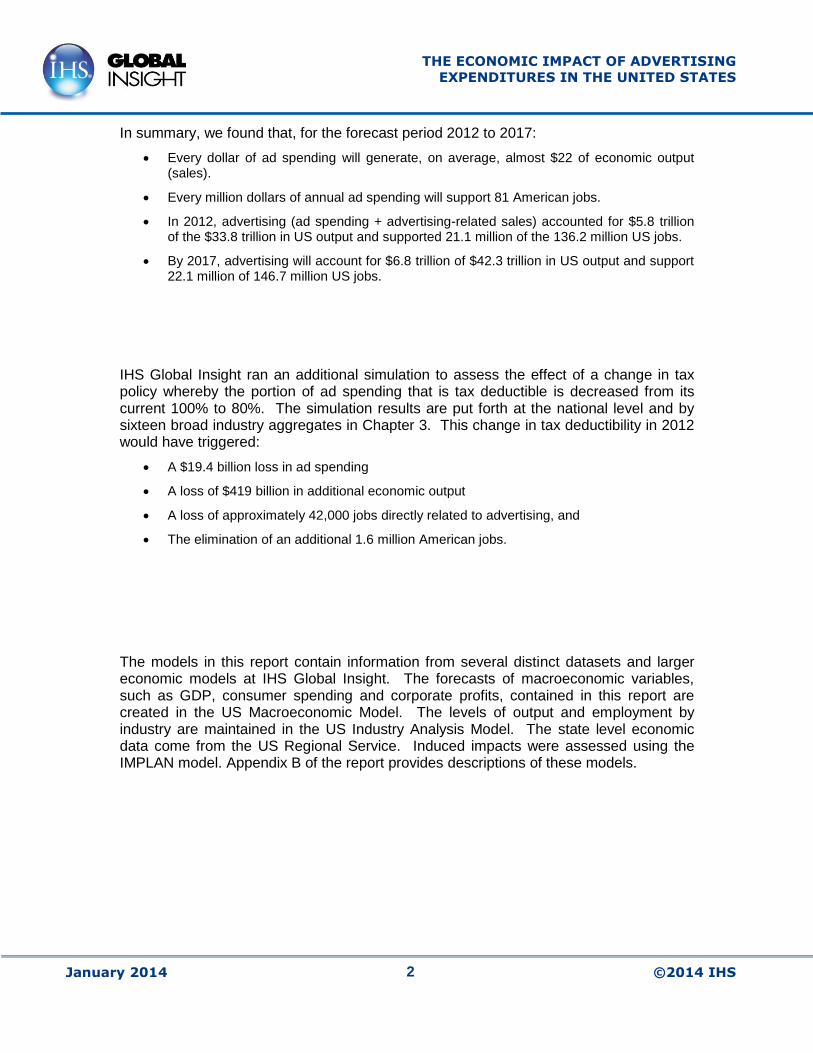
Over the forecast period, advertising employment will remain relatively stable at around 550,000 jobs (Figure 3). The stable employment during a period of lower ad spending underscores that many firms recognize the critical role the advertising staff play in their businesses. Rather than lay-off seasoned ad professionals, many firms will maintain their staffs. Then, as the economy improves, they will be positioned to quickly execute advertising campaigns.
Figure 3 - Total Advertising Employment
Source: IHS Global Insight
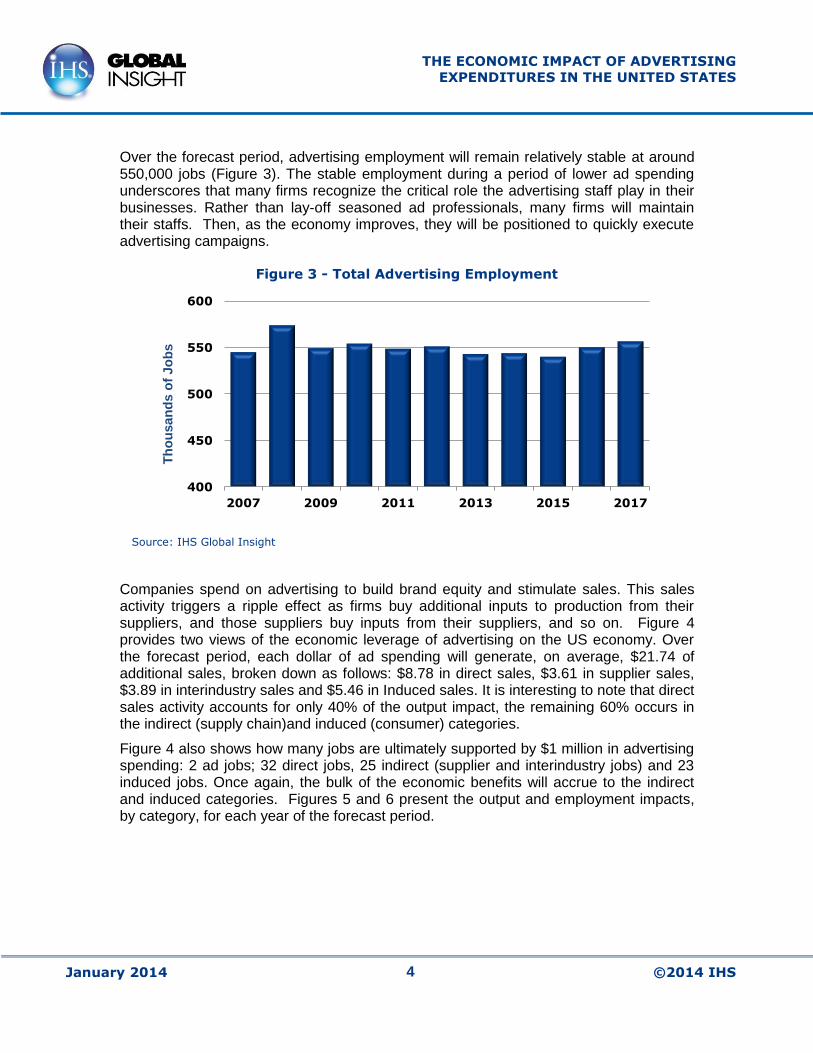
Companies spend on advertising to build brand equity and stimulate sales. This sales activity triggers a ripple effect as firms buy additional inputs to production from their suppliers, and those suppliers buy inputs from their suppliers, and so on. Figure 4 provides two views of the economic leverage of advertising on the US economy. Over the forecast period, each dollar of ad spending will generate, on average, $21.74 of additional sales, broken down as follows: $8.78 in direct sales, $3.61 in supplier sales, $3.89 in interindustry sales and $5.46 in Induced sales. It is interesting to note that direct sales activity accounts for only 40% of the output impact, the remaining 60% occurs in the indirect (supply chain)and induced (consumer) categories.
Figure 4 also shows how many jobs are ultimately supported by $1 million in advertising spending: 2 ad jobs; 32 direct jobs, 25 indirect (supplier and interindustry jobs) and 23 induced jobs. Once again, the bulk of the economic benefits will accrue to the indirect and induced categories. Figures 5 and 6 present the output and employment impacts, by category, for each year of the forecast period.
400
450
500
550
600
2007 2009 2011 2013 2015 2017
Th
ou
sa
nd
s o
f J
ob
s

THE ECONOMIC IMPACT OF ADVERTISING
EXPENDITURES IN THE UNITED STATES
January 2014 5 ©2014 IHS
Figure 4 – The Economic Leverage of Advertising (average, 2012 – 2017)
Figure 5 - Total Economic Impact of Advertising
Source: IHS Global Insight
Sales leveragedby $1 of
Ad Spending
Sales
8.78
Supplier
3.61
Inter-Industry
3.89
Induced5.46
Jobs supported by $ 1million
of Ad Spending
Ad 2
Sales
31Supplier
12
Inter-
Industry13
Induced
23
0
1
2
3
4
5
6
7
2012 2013 2014 2015 2016 2017
TrIllio
ns o
f D
ollars
Ad Expenditures Sales Impact Supplier Sales
Interindustry Sales Induced Sales
THE ECONOMIC IMPACT OF ADVERTISING
EXPENDITURES IN THE UNITED STATES
January 2014 6 ©2014 IHS
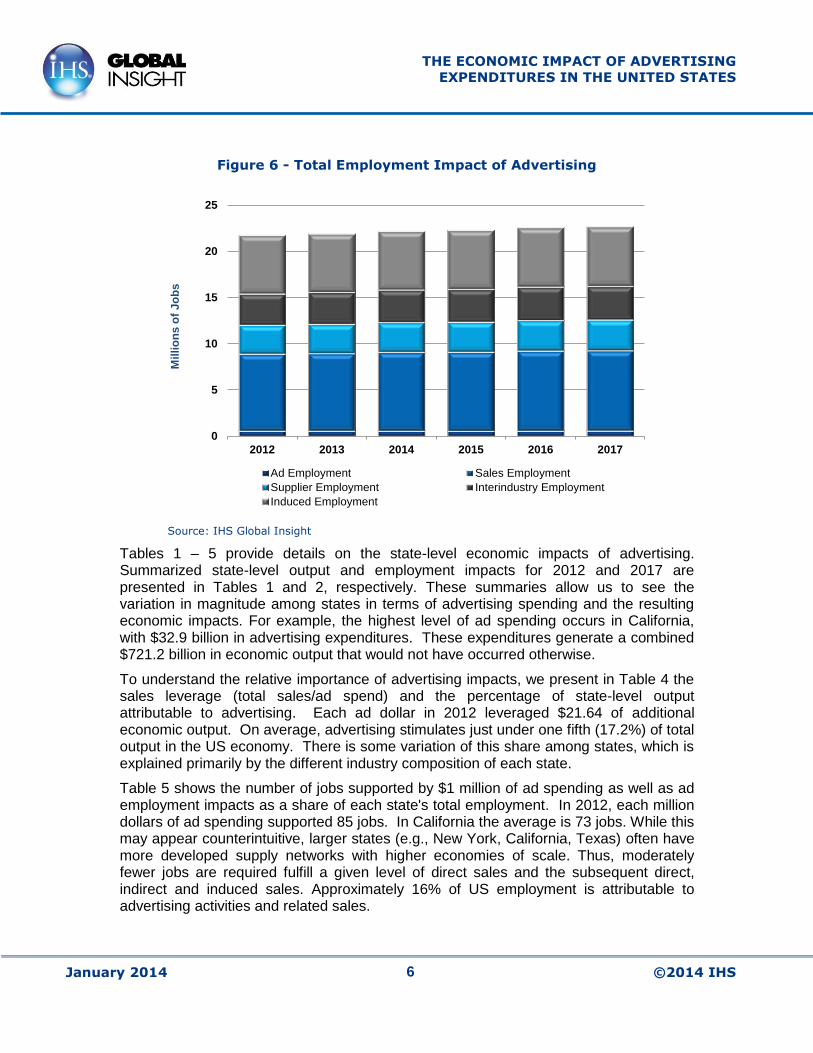
Figure 6 - Total Employment Impact of Advertising
Source: IHS Global Insight
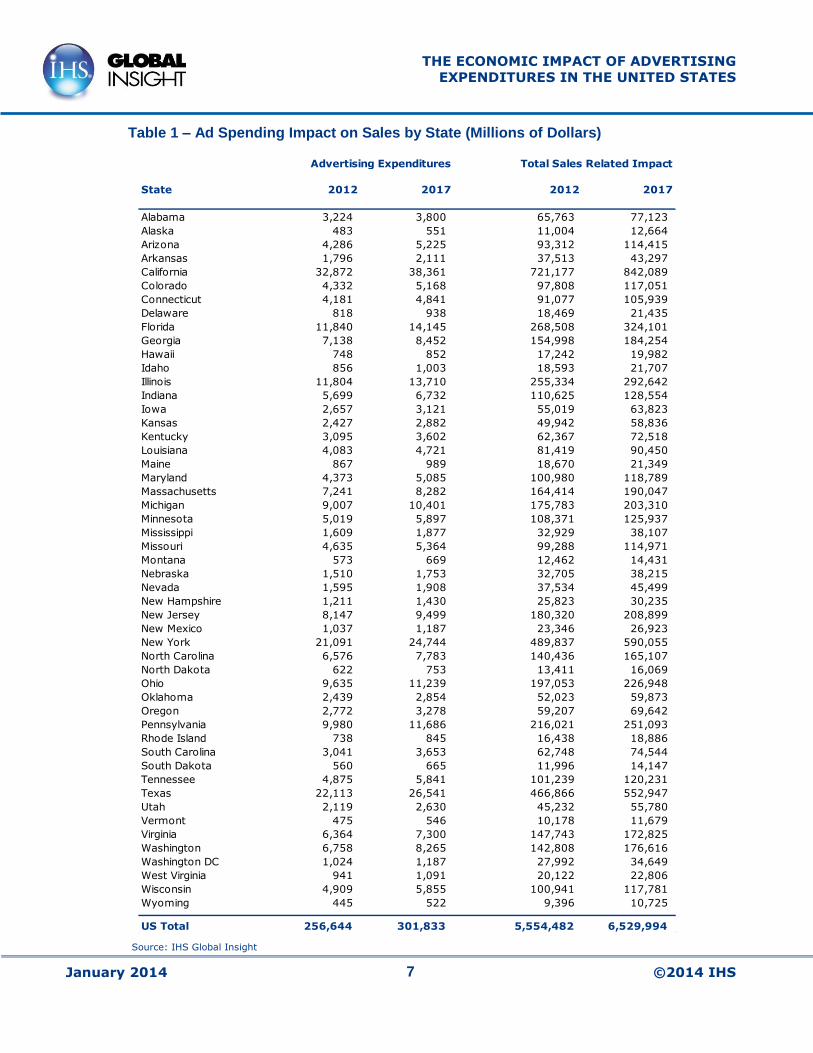
Tables 1 – 5 provide details on the state-level economic impacts of advertising. Summarized state-level output and employment impacts for 2012 and 2017 are presented in Tables 1 and 2, respectively. These summaries allow us to see the variation in magnitude among states in terms of advertising spending and the resulting economic impacts. For example, the highest level of ad spending occurs in California, with $32.9 billion in advertising expenditures. These expenditures generate a combined $721.2 billion in economic output that would not have occurred otherwise.
To understand the relative importance of advertising impacts, we present in Table 4 the sales leverage (total sales/ad spend) and the percentage of state-level output attributable to advertising. Each ad dollar in 2012 leveraged $21.64 of additional economic output. On average, advertising stimulates just under one fifth (17.2%) of total output in the US economy. There is some variation of this share among states, which is explained primarily by the different industry composition of each state.
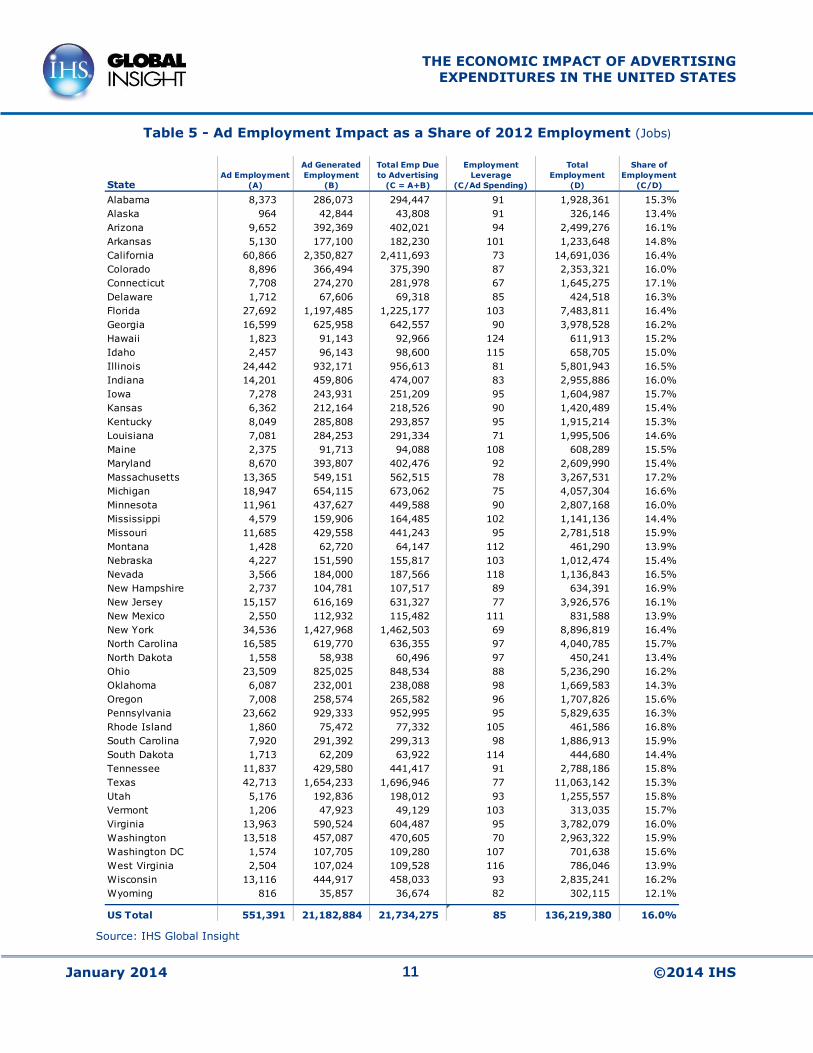
Table 5 shows the number of jobs supported by $1 million of ad spending as well as ad employment impacts as a share of each state's total employment. In 2012, each million dollars of ad spending supported 85 jobs. In California the average is 73 jobs. While this may appear counterintuitive, larger states (e.g., New York, California, Texas) often have more developed supply networks with higher economies of scale. Thus, moderately fewer jobs are required fulfill a given level of direct sales and the subsequent direct, indirect and induced sales. Approximately 16% of US employment is attributable to advertising activities and related sales.
0
5
10
15
20
25
2012 2013 2014 2015 2016 2017
Mil
lio
ns
of
Jo
bs
Ad Employment Sales Employment
Supplier Employment Interindustry Employment
Induced Employment
THE ECONOMIC IMPACT OF ADVERTISING
EXPENDITURES IN THE UNITED STATES
January 2014 7 ©2014 IHS
Table 1 – Ad Spending Impact on Sales by State (Millions of Dollars)
Source: IHS Global Insight
State 2012 2017 2012 2017
Alabama 3,224 3,800 65,763 77,123
Alaska 483 551 11,004 12,664
Arizona 4,286 5,225 93,312 114,415
Arkansas 1,796 2,111 37,513 43,297
California 32,872 38,361 721,177 842,089
Colorado 4,332 5,168 97,808 117,051
Connecticut 4,181 4,841 91,077 105,939
Delaware 818 938 18,469 21,435
Florida 11,840 14,145 268,508 324,101
Georgia 7,138 8,452 154,998 184,254
Hawaii 748 852 17,242 19,982
Idaho 856 1,003 18,593 21,707
Illinois 11,804 13,710 255,334 292,642
Indiana 5,699 6,732 110,625 128,554
Iowa 2,657 3,121 55,019 63,823
Kansas 2,427 2,882 49,942 58,836
Kentucky 3,095 3,602 62,367 72,518
Louisiana 4,083 4,721 81,419 90,450
Maine 867 989 18,670 21,349
Maryland 4,373 5,085 100,980 118,789
Massachusetts 7,241 8,282 164,414 190,047
Michigan 9,007 10,401 175,783 203,310
Minnesota 5,019 5,897 108,371 125,937
Mississippi 1,609 1,877 32,929 38,107
Missouri 4,635 5,364 99,288 114,971
Montana 573 669 12,462 14,431
Nebraska 1,510 1,753 32,705 38,215
Nevada 1,595 1,908 37,534 45,499
New Hampshire 1,211 1,430 25,823 30,235
New Jersey 8,147 9,499 180,320 208,899
New Mexico 1,037 1,187 23,346 26,923
New York 21,091 24,744 489,837 590,055
North Carolina 6,576 7,783 140,436 165,107
North Dakota 622 753 13,411 16,069
Ohio 9,635 11,239 197,053 226,948
Oklahoma 2,439 2,854 52,023 59,873
Oregon 2,772 3,278 59,207 69,642
Pennsylvania 9,980 11,686 216,021 251,093
Rhode Island 738 845 16,438 18,886
South Carolina 3,041 3,653 62,748 74,544
South Dakota 560 665 11,996 14,147
Tennessee 4,875 5,841 101,239 120,231
Texas 22,113 26,541 466,866 552,947
Utah 2,119 2,630 45,232 55,780
Vermont 475 546 10,178 11,679
Virginia 6,364 7,300 147,743 172,825
Washington 6,758 8,265 142,808 176,616
Washington DC 1,024 1,187 27,992 34,649
West Virginia 941 1,091 20,122 22,806
Wisconsin 4,909 5,855 100,941 117,781
Wyoming 445 522 9,396 10,725
US Total 256,644 301,833 5,554,482 6,529,994
Advertising Expenditures Total Sales Related Impact

THE ECONOMIC IMPACT OF ADVERTISING
EXPENDITURES IN THE UNITED STATES
January 2014 8 ©2014 IHS
Table 2 – Ad Spending Impact on Employment by State (Number of Jobs)
Source: IHS Global Insight
State 2012 2017 2012 2017
Alabama 8,373 8,567 286,073 298,606
Alaska 964 957 42,844 45,043
Arizona 9,652 9,970 392,369 422,776
Arkansas 5,130 5,236 177,100 184,956
California 60,866 61,105 2,350,827 2,452,017
Colorado 8,896 9,163 366,494 393,609
Connecticut 7,708 7,529 274,270 275,142
Delaware 1,712 1,717 67,606 69,618
Florida 27,692 28,371 1,197,485 1,280,136
Georgia 16,599 16,880 625,958 663,895
Hawaii 1,823 1,817 91,143 96,404
Idaho 2,457 2,545 96,143 102,457
Illinois 24,442 24,537 932,171 961,449
Indiana 14,201 14,373 459,806 477,401
Iowa 7,278 7,338 243,931 251,019
Kansas 6,362 6,385 212,164 223,078
Kentucky 8,049 8,165 285,808 299,142
Louisiana 7,081 7,003 284,253 289,902
Maine 2,375 2,348 91,713 93,024
Maryland 8,670 8,600 393,807 407,043
Massachusetts 13,365 13,024 549,151 555,250
Michigan 18,947 19,004 654,115 667,911
Minnesota 11,961 12,195 437,627 455,337
Mississippi 4,579 4,702 159,906 168,299
Missouri 11,685 11,694 429,558 445,836
Montana 1,428 1,445 62,720 65,649
Nebraska 4,227 4,289 151,590 159,134
Nevada 3,566 3,676 184,000 195,179
New Hampshire 2,737 2,788 104,781 107,696
New Jersey 15,157 15,016 616,169 633,299
New Mexico 2,550 2,542 112,932 118,082
New York 34,536 34,183 1,427,968 1,466,893
North Carolina 16,585 16,884 619,770 654,153
North Dakota 1,558 1,597 58,938 62,041
Ohio 23,509 23,568 825,025 845,958
Oklahoma 6,087 6,124 232,001 241,685
Oregon 7,008 7,334 258,574 275,670
Pennsylvania 23,662 23,916 929,333 955,484
Rhode Island 1,860 1,830 75,472 76,244
South Carolina 7,920 8,067 291,392 309,119
South Dakota 1,713 1,751 62,209 64,705
Tennessee 11,837 12,209 429,580 455,531
Texas 42,713 43,963 1,654,233 1,769,233
Utah 5,176 5,401 192,836 208,410
Vermont 1,206 1,200 47,923 48,246
Virginia 13,963 13,944 590,524 617,603
Washington 13,518 13,560 457,087 482,853
Washington DC 1,574 1,480 107,705 111,295
West Virginia 2,504 2,506 107,024 109,980
Wisconsin 13,116 13,485 444,917 462,644
Wyoming 816 808 35,857 36,874
US Total 551,391 556,790 21,182,884 22,113,005
Advertising Employment Total Sales Related Employment

THE ECONOMIC IMPACT OF ADVERTISING
EXPENDITURES IN THE UNITED STATES
January 2014 9 ©2014 IHS
Table 3 - Total Output and Employment by State (Millions of Dollars / Number of Jobs)
Source: IHS Global Insight
State 2012 2017 2012 2017
Alabama 415,578 518,924 1,928,361 2,066,489
Alaska 87,448 105,497 326,146 349,521
Arizona 565,078 739,136 2,499,276 2,787,632
Arkansas 245,448 302,422 1,233,648 1,321,717
California 4,234,804 5,287,982 14,691,036 15,844,498
Colorado 592,597 761,352 2,353,321 2,618,599
Connecticut 495,020 619,021 1,645,275 1,726,960
Delaware 107,223 131,662 424,518 453,058
Florida 1,628,623 2,110,449 7,483,811 8,303,841
Georgia 952,314 1,204,438 3,978,528 4,345,420
Hawaii 120,134 148,099 611,913 664,149
Idaho 122,702 152,760 658,705 720,268
Illinois 1,547,018 1,909,930 5,801,943 6,174,011
Indiana 670,742 828,500 2,955,886 3,145,386
Iowa 324,012 402,088 1,604,987 1,703,862
Kansas 305,389 381,782 1,420,489 1,530,183
Kentucky 385,519 477,613 1,915,214 2,055,540
Louisiana 582,946 680,999 1,995,506 2,094,417
Maine 116,517 141,665 608,289 635,141
Maryland 666,632 834,113 2,609,990 2,813,576
Massachusetts 909,452 1,140,931 3,267,531 3,445,974
Michigan 992,261 1,227,073 4,057,304 4,286,913
Minnesota 657,853 822,736 2,807,168 3,014,428
Mississippi 214,484 262,248 1,141,136 1,231,092
Missouri 592,921 733,520 2,781,518 2,976,493
Montana 89,779 110,122 461,290 497,034
Nebraska 201,684 248,868 1,012,474 1,080,647
Nevada 242,978 308,870 1,136,843 1,231,857
New Hampshire 148,404 186,116 634,391 673,038
New Jersey 1,132,464 1,410,140 3,926,576 4,178,343
New Mexico 164,576 200,684 831,588 894,336
New York 2,587,718 3,313,697 8,896,819 9,396,773
North Carolina 869,063 1,094,313 4,040,785 4,409,317
North Dakota 102,126 134,338 450,241 485,158
Ohio 1,196,427 1,463,016 5,236,290 5,527,782
Oklahoma 370,411 457,332 1,669,583 1,778,422
Oregon 379,661 478,810 1,707,826 1,870,403
Pennsylvania 1,346,960 1,670,348 5,829,635 6,193,584
Rhode Island 98,788 122,109 461,586 485,097
South Carolina 382,580 483,612 1,886,913 2,064,581
South Dakota 77,380 97,183 444,680 477,527
Tennessee 615,807 778,653 2,788,186 3,027,643
Texas 3,154,879 3,968,845 11,063,142 12,203,621
Utah 279,211 363,203 1,255,557 1,400,488
Vermont 60,292 73,621 313,035 326,370
Virginia 907,167 1,126,402 3,782,079 4,078,654
Washington 803,549 1,026,966 2,963,322 3,222,547
Washington DC 232,447 283,372 701,638 735,110
West Virginia 151,459 182,996 786,046 830,931
Wisconsin 600,400 748,280 2,835,241 3,035,676
Wyoming 79,318 95,907 302,115 317,050
US Total 33,808,243 42,352,741 136,219,380 146,731,157
Total EmploymentNominal Output

THE ECONOMIC IMPACT OF ADVERTISING
EXPENDITURES IN THE UNITED STATES
January 2014 10 ©2014 IHS
Table 4 - Ad Spending Impact as a Share of State Output in 2012 (Millions of Dollars)
Source: IHS Global Insight
StateAd Spending
(A)
Ad Generated
Sales
(B)
Total Output
Due to
Advertising
(C = A+B)
Sales Leverage
(B/A)
Total
Output
(D)
Share of
Output
(C/D)
Alabama 3,224 65,763 68,988 20.4 415,578.2 16.6%
Alaska 483 11,004 11,487 22.8 87,448.5 13.1%
Arizona 4,286 93,312 97,598 21.8 565,078.1 17.3%
Arkansas 1,796 37,513 39,308 20.9 245,447.5 16.0%
California 32,872 721,177 754,048 21.9 4,234,803.8 17.8%
Colorado 4,332 97,808 102,141 22.6 592,597.2 17.2%
Connecticut 4,181 91,077 95,259 21.8 495,020.0 19.2%
Delaware 818 18,469 19,287 22.6 107,222.9 18.0%
Florida 11,840 268,508 280,349 22.7 1,628,622.5 17.2%
Georgia 7,138 154,998 162,136 21.7 952,313.9 17.0%
Hawaii 748 17,242 17,990 23.0 120,134.3 15.0%
Idaho 856 18,593 19,449 21.7 122,701.9 15.9%
Illinois 11,804 255,334 267,139 21.6 1,547,017.5 17.3%
Indiana 5,699 110,625 116,324 19.4 670,742.3 17.3%
Iowa 2,657 55,019 57,676 20.7 324,011.7 17.8%
Kansas 2,427 49,942 52,369 20.6 305,389.2 17.1%
Kentucky 3,095 62,367 65,462 20.1 385,519.2 17.0%
Louisiana 4,083 81,419 85,503 19.9 582,946.4 14.7%
Maine 867 18,670 19,537 21.5 116,517.4 16.8%
Maryland 4,373 100,980 105,353 23.1 666,631.8 15.8%
Massachusetts 7,241 164,414 171,655 22.7 909,452.3 18.9%
Michigan 9,007 175,783 184,790 19.5 992,260.7 18.6%
Minnesota 5,019 108,371 113,390 21.6 657,852.7 17.2%
Mississippi 1,609 32,929 34,538 20.5 214,484.4 16.1%
Missouri 4,635 99,288 103,923 21.4 592,920.5 17.5%
Montana 573 12,462 13,034 21.8 89,778.7 14.5%
Nebraska 1,510 32,705 34,215 21.7 201,684.3 17.0%
Nevada 1,595 37,534 39,129 23.5 242,978.4 16.1%
New Hampshire 1,211 25,823 27,034 21.3 148,404.3 18.2%
New Jersey 8,147 180,320 188,468 22.1 1,132,464.0 16.6%
New Mexico 1,037 23,346 24,383 22.5 164,576.5 14.8%
New York 21,091 489,837 510,928 23.2 2,587,717.9 19.7%
North Carolina 6,576 140,436 147,013 21.4 869,063.3 16.9%
North Dakota 622 13,411 14,033 21.6 102,126.2 13.7%
Ohio 9,635 197,053 206,689 20.5 1,196,427.4 17.3%
Oklahoma 2,439 52,023 54,462 21.3 370,410.7 14.7%
Oregon 2,772 59,207 61,979 21.4 379,660.6 16.3%
Pennsylvania 9,980 216,021 226,001 21.6 1,346,960.2 16.8%
Rhode Island 738 16,438 17,176 22.3 98,788.4 17.4%
South Carolina 3,041 62,748 65,789 20.6 382,579.9 17.2%
South Dakota 560 11,996 12,557 21.4 77,379.8 16.2%
Tennessee 4,875 101,239 106,113 20.8 615,807.0 17.2%
Texas 22,113 466,866 488,979 21.1 3,154,878.7 15.5%
Utah 2,119 45,232 47,350 21.3 279,210.7 17.0%
Vermont 475 10,178 10,653 21.4 60,292.0 17.7%
Virginia 6,364 147,743 154,107 23.2 907,166.9 17.0%
Washington 6,758 142,808 149,566 21.1 803,549.1 18.6%
Washington DC 1,024 27,992 29,016 27.3 232,447.2 12.5%
West Virginia 941 20,122 21,063 21.4 151,459.0 13.9%
Wisconsin 4,909 100,941 105,850 20.6 600,399.7 17.6%
Wyoming 445 9,396 9,841 21.1 79,317.5 12.4%
US Total 256,644 5,554,482 5,811,126 21.6 33,808,243 17.2%
THE ECONOMIC IMPACT OF ADVERTISING
EXPENDITURES IN THE UNITED STATES
January 2014 11 ©2014 IHS
Table 5 - Ad Employment Impact as a Share of 2012 Employment (Jobs)
Source: IHS Global Insight
StateAd Employment
(A)
Ad Generated
Employment
(B)
Total Emp Due
to Advertising
(C = A+B)
Employment
Leverage
(C/Ad Spending)
Total
Employment
(D)
Share of
Employment
(C/D)
Alabama 8,373 286,073 294,447 91 1,928,361 15.3%
Alaska 964 42,844 43,808 91 326,146 13.4%
Arizona 9,652 392,369 402,021 94 2,499,276 16.1%
Arkansas 5,130 177,100 182,230 101 1,233,648 14.8%
California 60,866 2,350,827 2,411,693 73 14,691,036 16.4%
Colorado 8,896 366,494 375,390 87 2,353,321 16.0%
Connecticut 7,708 274,270 281,978 67 1,645,275 17.1%
Delaware 1,712 67,606 69,318 85 424,518 16.3%
Florida 27,692 1,197,485 1,225,177 103 7,483,811 16.4%
Georgia 16,599 625,958 642,557 90 3,978,528 16.2%
Hawaii 1,823 91,143 92,966 124 611,913 15.2%
Idaho 2,457 96,143 98,600 115 658,705 15.0%
Illinois 24,442 932,171 956,613 81 5,801,943 16.5%
Indiana 14,201 459,806 474,007 83 2,955,886 16.0%
Iowa 7,278 243,931 251,209 95 1,604,987 15.7%
Kansas 6,362 212,164 218,526 90 1,420,489 15.4%
Kentucky 8,049 285,808 293,857 95 1,915,214 15.3%
Louisiana 7,081 284,253 291,334 71 1,995,506 14.6%
Maine 2,375 91,713 94,088 108 608,289 15.5%
Maryland 8,670 393,807 402,476 92 2,609,990 15.4%
Massachusetts 13,365 549,151 562,515 78 3,267,531 17.2%
Michigan 18,947 654,115 673,062 75 4,057,304 16.6%
Minnesota 11,961 437,627 449,588 90 2,807,168 16.0%
Mississippi 4,579 159,906 164,485 102 1,141,136 14.4%
Missouri 11,685 429,558 441,243 95 2,781,518 15.9%
Montana 1,428 62,720 64,147 112 461,290 13.9%
Nebraska 4,227 151,590 155,817 103 1,012,474 15.4%
Nevada 3,566 184,000 187,566 118 1,136,843 16.5%
New Hampshire 2,737 104,781 107,517 89 634,391 16.9%
New Jersey 15,157 616,169 631,327 77 3,926,576 16.1%
New Mexico 2,550 112,932 115,482 111 831,588 13.9%
New York 34,536 1,427,968 1,462,503 69 8,896,819 16.4%
North Carolina 16,585 619,770 636,355 97 4,040,785 15.7%
North Dakota 1,558 58,938 60,496 97 450,241 13.4%
Ohio 23,509 825,025 848,534 88 5,236,290 16.2%
Oklahoma 6,087 232,001 238,088 98 1,669,583 14.3%
Oregon 7,008 258,574 265,582 96 1,707,826 15.6%
Pennsylvania 23,662 929,333 952,995 95 5,829,635 16.3%
Rhode Island 1,860 75,472 77,332 105 461,586 16.8%
South Carolina 7,920 291,392 299,313 98 1,886,913 15.9%
South Dakota 1,713 62,209 63,922 114 444,680 14.4%
Tennessee 11,837 429,580 441,417 91 2,788,186 15.8%
Texas 42,713 1,654,233 1,696,946 77 11,063,142 15.3%
Utah 5,176 192,836 198,012 93 1,255,557 15.8%
Vermont 1,206 47,923 49,129 103 313,035 15.7%
Virginia 13,963 590,524 604,487 95 3,782,079 16.0%
Washington 13,518 457,087 470,605 70 2,963,322 15.9%
Washington DC 1,574 107,705 109,280 107 701,638 15.6%
West Virginia 2,504 107,024 109,528 116 786,046 13.9%
Wisconsin 13,116 444,917 458,033 93 2,835,241 16.2%
Wyoming 816 35,857 36,674 82 302,115 12.1%
US Total 551,391 21,182,884 21,734,275 85 136,219,380 16.0%
THE ECONOMIC IMPACT OF ADVERTISING
EXPENDITURES IN THE UNITED STATES
January 2014 12 ©2014 IHS
3. Potential Losses from a Reduction in Tax Deductibility
Going beyond the analysis presented in Chapter 2, the Advertising Coalition asked IHS Global Insight to assess the potential impacts of a reduction in the tax deductibility of advertising expenses.
It is now the case that a company's advertising expenditures, being expected and necessary business expenses, are fully tax-deductible for the purpose of calculating net income. To address any legislative proposal that might seek to reduce or eliminate the deductibility of advertising expenses, we present in the following tables the industry- and national-level declines in ad spending, ad employment, and related economic activity that would occur if ad spending became only 80%, rather than 100%, deductible.
Put simply, this change would subject 20% of advertising expenditures to the average corporate tax rate for each industry. Table 6 shows the decline in advertising expenditures that this policy would effect. In 2012, ad spending will total just under $257 billion dollars, all of which is currently tax deductible. If this policy change were to take place, approximately $49 billion of that $257 billion would become taxable at the rates shown by industry in Table 6.
The new tax liability would effectively increase the cost of advertising, thereby causing a disincentive for firms to spend additional advertising dollars. The econometric model developed for our analysis shows that every one percent increase in the cost of advertising leads to a 1.2% drop in ad spending. To arrive at the resulting decline in ad spending by industry, we simply multiply the cost increase of the policy change by the price elasticity of ad spending. In the year 2012, the deductibility change would result in ad spending falling by about $20 billion, from $257 billion to $237 billion, or 7.6%.
When we take into account the multiplier effect of ad spending on economic output and employment, the effect of reducing deductibility appears ever more worrisome. Since every dollar of ad spending generates roughly twenty-one dollars of additional output, and every million dollars of ad spending generates over 80 jobs, the effect of a $20 billion decline in ad spending would cause a sizeable portion of economic output and jobs to disappear.
Tables 7 and 8 quantify the decline in ad spending, ad employment, and related output and employment that would result from the 7.7% ad spending decline in 2012, and a corresponding decline in 2017. In 2012, the $20 billion loss in ad spending would lead to a loss of $419 billion in additional economic output, a loss of 42,000 jobs directly related to advertising, and an additional loss of 1.6 million American jobs. Clearly, any modest federal tax revenue benefits from reducing the deductibility of advertising must be carefully weighed against the staggering economic losses that would ensue.

THE ECONOMIC IMPACT OF ADVERTISING
EXPENDITURES IN THE UNITED STATES
January 2014 13 ©2014 IHS
Table 6 – Loss in Ad Spending in 2010 Due to a Reduction in Tax Deductibility (Millions of Dollars)
Source: IHS Global Insight
Table 7 – Forecast of Loss in Ad Spending Due to a Reduction in Tax
Deductibility (Millions of Dollars)
Source: IHS Global Insight
Industry Ad SpendingTaxable
Ad Spending
Corporate
Tax Rate
Ad Spending after
Imposition of Tax
Percent Decline
in Ad Spending
Agriculture, Mining 2,133.0 426.6 33.8% 1,961.41 8.0%
Construction 1,556.3 311.3 33.1% 1,433.72 7.9%
Utilities 1,180.8 236.2 30.9% 1,093.83 7.4%
Wholesale Trade 11,592.5 2,318.5 32.6% 10,693.03 7.8%
Retail Trade 52,747.9 10,549.6 34.0% 48,479.55 8.1%
Transportation 8,161.5 1,632.3 29.5% 7,587.85 7.0%
Food & Beverage Mfg. 9,246.6 1,849.3 32.6% 8,528.49 7.8%
Machinery, Equip, Computer Mfg 17,210.5 3,442.1 32.6% 15,873.80 7.8%
Transportation Equip Mfg 16,475.4 3,295.1 32.6% 15,195.78 7.8%
Other Manufacturing 25,323.1 5,064.6 32.6% 23,356.31 7.8%
Information 21,766.6 4,353.3 30.8% 20,172.72 7.3%
Finance, Insurance, Real Estate 49,248.0 9,849.6 29.9% 45,739.54 7.1%
Education Services 4,255.6 851.1 33.1% 3,920.33 7.9%
Healthcare Services 5,260.1 1,052.0 30.9% 4,872.85 7.4%
Leisure & Hospitality 6,595.7 1,319.1 31.4% 6,102.30 7.5%
Business & Other Services* 21,960.6 2,077.4 32.3% 20,274.15 7.7%
Government 1,929.9 - - 1,929.93 -
256,644.1 48,628.1 32.0% 237,215.56 7.6%
*Taxable Ad Spending reflects adjustment for tax-exempt status of non-profit organizations
Industry 2012 2017 2012 2017
Agriculture, Mining 171.6 197.2 4,505.2 4,782.5
Construction 122.6 215.0 1,637.7 2,253.2
Utilities 86.9 96.5 2,944.8 2,995.9
Wholesale Trade 899.4 1,142.5 11,520.3 12,785.0
Retail Trade 4,268.4 4,881.2 84,770.0 99,655.4
Transportation 573.7 702.6 12,275.5 15,630.8
Food & Beverage Mfg. 718.2 821.1 14,326.4 16,353.0
Machinery, Equip, Computer Mfg 1,336.7 1,644.0 24,805.5 28,336.5
Transportation Equip Mfg 1,279.6 1,463.9 19,178.7 24,057.5
Other Manufacturing 1,966.8 2,726.9 30,429.6 35,444.9
Information 1,593.8 1,682.3 34,909.6 38,547.7
Finance, Insurance, Real Estate 3,508.5 4,037.3 84,177.9 101,505.5
Education Services 335.2 323.4 6,355.5 8,075.9
Healthcare Services 387.3 545.1 14,794.8 17,298.4
Leisure & Hospitality 493.4 514.3 14,386.9 16,059.9
Business & Other Services 1,686.5 1,900.0 57,653.3 68,781.0
Government - - - -
19,428.6 22,893.2 418,671.6 492,563.0
Loss in Ad Spending Total Loss in Sales

THE ECONOMIC IMPACT OF ADVERTISING
EXPENDITURES IN THE UNITED STATES
January 2014 14 ©2014 IHS
Table 8 - Forecast of Loss in Ad Employment Due to 20% Reduction in
Deductibility (Number of Jobs)
Source: IHS Global Insight
IHS also considered a scenario in which advertising expenditures are amortized over a three-year period. Table 9 illustrates the transition from the current tax regime to such an amortization regime, beginning in 2014. By 2016, the transition is complete and, assuming a 35 % corporate tax rate, the relative cost of advertising would remain approximately 1.4% higher than our baseline model. Applying the advertising elasticity concepts previously discussed, IHS would expect advertising expenditures to drop by as much as 1.7%, potentially putting approximately 372 thousand US jobs at risk.
Assessing the economic impacts associated with the dramatic increases to the relative cost of advertising during the transition years of 2014 and 2015, (23% and 12%, respectively) falls outside predictive range of the elasticity models IHS developed for this study. As advertising is vital to stimulating sales, we believe many companies would strive to minimize reductions in ad spend and thereby seek to offset higher ad costs ($63 and $33 billion in 2014 and 2015) by reducing expenditures across a range of areas including, but not limited to, lowering employment levels, delaying hiring plans, cutting capital investment levels, and reducing research and development program funding.
Table 9 – Relative Increase in Ad Costs under 3-Year Amortization Tax
Regime
Industry 2012 2017 2012 2017
Agriculture, Mining 394 383 17,694 17,821
Construction 270 405 8,497 10,358
Utilities 190 180 4,748 4,668
Wholesale Trade 1,930 2,106 13,096 13,525
Retail Trade 9,324 9,183 294,016 306,777
Transportation 1,265 1,326 57,168 68,054
Food & Beverage Mfg. 1,614 1,588 28,558 31,070
Machinery, Equip, Computer Mfg 2,845 3,009 68,569 70,562
Transportation Equip Mfg 2,967 2,903 33,953 35,777
Other Manufacturing 4,280 5,118 59,349 64,655
Information 3,294 2,955 71,847 76,062
Finance, Insurance, Real Estate 7,274 7,169 159,044 154,539
Education Services 689 570 74,747 68,925
Healthcare Services 835 1,011 126,463 130,324
Leisure & Hospitality 1,075 968 192,524 187,904
Business & Other Services 3,523 3,390 381,159 422,072
Government - - - -
41,769 42,263 1,591,430 1,663,093
Total Loss in EmploymentLoss in Ad Employment
2014 2015 2016 2017Baseline Ad Spending (USB$) 270.2 277.0 290.5 301.8
Tax Deductibility (35% Tax Rate)
Current Tax Regime 94.6 96.9 101.7 105.6
Amortization Tax Regime 31.5 63.8 97.7 101.4
Change in Tax Deductibility =
Effective Increase in Ad Costs (US$B) 63.1 33.1 4.0 4.2
Percentage Increase in Ad Costs 23.33% 11.95% 1.36% 1.40%

THE ECONOMIC IMPACT OF ADVERTISING
EXPENDITURES IN THE UNITED STATES
January 2014 15 ©2014 IHS
Appendix A: Methodology
The goal of this study is to estimate and forecast the direct, indirect and induced economic impacts of advertising expenditures on the US economy. Companies in every industry use advertising to establish and reinforce brand awareness, promote their products and services, and, ultimately, stimulate increased revenues. Higher sales levels trigger additional economic activity throughout a company's supply chain, its suppliers' supply chain, and so on. Plus employees of these firms spend portions of their wages in the general economy. These various levels of economic activity lead to enhanced levels of job creation and retention. To quantify the economic impact of advertising expenditures on the US economy, this study:
Estimates the total level of advertising spending in the United States and creates a five year forecast.
Simultaneously allocates advertising spending to every state, Congressional District and to 17 NAICS2-based industry aggregates, based on our knowledge of macroeconomic, industry and regional data.
Estimates sales impacts and employment impacts based on econometric models that quantify the relationship between ad spending and resulting sales.
Computes an iterative algorithm that accounts for the ripple effect of economic activity that happens as the result of advertising spending.
In addition to IHS Global Insight's proprietary databases, the data that is used as inputs to the models come from a variety of publicly available and proprietary sources, as shown in Table 15.
This study does not consider variation among different advertising media (newspaper vs. radio vs. Internet), or between direct advertising and general advertising. Although IHS Global Insight does maintain media-level advertising history and forecasts, the use of these would cloud the main idea of this study, which is the broad economic effect of all advertising media. Table 16 describes the media that make up the history and forecast of advertising spending used in the report.
2 North American Industry Classification System

THE ECONOMIC IMPACT OF ADVERTISING
EXPENDITURES IN THE UNITED STATES
January 2014 16 ©2014 IHS
Table 10 - Data Sources
The IHS Global Insight Group U.S. Macro Service
The IHS Global Insight Group Industry Analysis Service
The IHS Global Insight Group Regional Economics Service
U.S. Bureau of the Census, Census of Agriculture
U.S. Bureau of the Census, Census of Mining
U.S. Bureau of the Census, Census of Construction
U.S. Bureau of the Census, Census of Manufacturing
U.S. Bureau of the Census, Census of Transportation Industries
U.S. Bureau of the Census, Census of Wholesale Trade
U.S. Bureau of the Census, Census of Retail Trade
U.S. Bureau of the Census, Census of Service Industries
U.S. Bureau of the Census, Annual Service Survey
U.S. Bureau of the Census, County Business Patterns
U.S. Bureau of Labor Statistics, Industry Output and Employment Datasets
U.S. Bureau of Labor Statistics, Industry-Occupation Matrices
U.S. Bureau of the Economic Analysis, National Income and Product Accounts
U.S. Bureau of the Economic Analysis, Input-Output Tables of the U.S. Economy
U.S. Bureau of the Economic Analysis, Gross Product Originating by Industry
McCann-Erickson Advertising Expenditures by Medium
Leading National Advertisers/Competitive Media Reports
U.S. Postal Service, Mail Volume and Revenue
U.S. Postal Service, Household Diary Study
Various Professional Associations and Trade Groups
Annual Reports

THE ECONOMIC IMPACT OF ADVERTISING
EXPENDITURES IN THE UNITED STATES
January 2014 17 ©2014 IHS
Table 11 - Advertising Activities Included in this Report
Direct Mail - Direct mail includes all advertising communications through the mail or other delivery service including: cards, card decks, letters, brochures, pamphlets, catalogs, flyers, video tapes, audio tapes, diskettes, and promotional items. This includes all out-sourced and in-house direct mail designed to immediately sell a product or service, identify a lead, or generate store traffic.
Television - Television includes all advertising communications conducted through local, national, or cable TV or radio channels designed to immediately sell a product or service, identify a lead, generate store traffic, or provide information regarding a company or other organization and its products or services.
Radio - Radio includes all advertising communications conducted through local, national, or cable TV or radio channels designed to immediately sell a product or service, identify a lead, generate store traffic, or provide information regarding a company or other organization and its products or services.
Newspaper - Newspaper includes all space advertising, free standing inserts (FSIs), and other advertising inserts in community, local, regional, or national newspapers distributed daily, weekly, monthly, and on Sunday designed to immediately sell a product or service, identify a lead, generate store traffic, or provide information regarding a company or other organization and its products or services.
Magazine - Magazine includes all space advertising, advertising inserts, and "market place" advertisements in periodical publications designed to immediately sell a product or service, identify a lead, generate store traffic, or provide information regarding a company or other organization and its products or services.
Other - Other advertising activity includes all other advertising media including email, internet, displays, "take-one", package inserts, electronic information service (on-line or broadcast), facsimile, kiosks, match books, paperback books, outdoor advertising, Yellow Pages directories designed to immediately sell a product or service, identify a lead, generate store traffic, or provide information regarding a company or other organization and its products or services.

THE ECONOMIC IMPACT OF ADVERTISING
EXPENDITURES IN THE UNITED STATES
January 2014 18 ©2014 IHS
Table 12 - Industry Definitions
The industry data used to allocate advertising spending are calculated from IHS Global Insight's Industry Analysis Service (IAS). The industries are based on the North American Industry Classification System, or NAICS. While the IAS contains data at the six digit NAICS level, we are combining those detailed industries to form broader NAICS sectors that still cover the entire US economy. The17-industry classification scheme shown in Table 11 allows us to account for the robust variation in ad spending among industries, without getting mired in the details of thousands of industries.
While it may appear obvious that advertising stimulates the sales of goods and services – why would companies spend nearly $260B on advertising each year if it did not? – we must still lay out a plausible mechanism for advertising to stimulate a ripple effect of sales and employment. Consider the following characteristics of advertising:
It is a more cost-effective and timely mechanism for distributing information about
prices and beneficial changes in technology and product design than are individual searches for that information.
The wide dissemination of product price information encourages lower prices,
and less variation in prices, as suppliers strive to attract customers.
It may speed the implementation of new technology.
It may encourage greater economies of scale in the production process by
allowing individual firms to attract a wider array of customers.
Advertising provides useful information to consumers in households and businesses -- an important role in a market economy. Advertising's role is to inform and educate
Industry Sector NAICS Codes
Agriculture, Mining 11111X-213115
Construction 23XXXX
Utilities 2211XX - 2213XX, 592XXX
Wholesale Trade 42XXXX
Retail Trade 44XXXX - 45XXXX
Transportation 481XXX - 488XXX; 491XXX - 493XXX
Food & Beverage Mfg. 311XXX - 312XXX
Machinery, Equip, Computer Mfg 333XXX - 335XXX
Transportation Equip Mfg 336XXX
Other Manufacturing 3122XX - 332XXX
Information 511XXX-519XXX
Finance, Insurance, Real Estate 521XXX - 533XXX
Education Services 611XXX - 6243XX
Healthcare Services 6211XX - 6243XX
Leisure & Hospitality 711XXX - 722XXX
Business & Other Services* 541XXX - 561XXX; 811XXX - 813XXX
Government 92, GG

THE ECONOMIC IMPACT OF ADVERTISING
EXPENDITURES IN THE UNITED STATES
January 2014 19 ©2014 IHS
consumers about the choices available to them in the marketplace. Depending on the situation, advertising's purpose may include:
Influencing market share within an industry or product category.
Changing the distribution of spending among substitute products.
Creating awareness of and demand for new products, technologies, and
applications.
Promoting brand image.
Stimulating purchase activity.
We believe that these characteristics of advertising provide a sufficient a priori expectation to justify the strong results of our comprehensive advertising model. As mentioned in the report's introduction, we are quantifying the positive economic impact of advertising on three broad levels: direct, supplier, and inter-industry. A concise definition of each level of impact follows:
Direct Economic Impact: which encompasses, first, the dollars spent on and the jobs
dedicated to developing and implementing advertising activities to stimulate demand for products and services in each industry and, second, the sales and jobs accruing to industries that utilize advertising to stimulate demand for their products and services. The type of transaction included in this stage of the impact is exemplified by the sale of a shirt via a company catalog to a consumer or the sale of an insurance policy by an insurance agent from a lead generated through television advertising.
Supplier Economic Impact: quantifies the indirect sales and jobs supported by first
level suppliers to those industries that use advertising. The type of transaction included in this stage of the impact is exemplified by the sale of the shirt by a garment manufacturer to the catalog company or the services provided by an accounting firm that audits the books of the insurance company.
Inter-industry Economic Impact: includes the indirect sales and jobs supported by
all the remaining levels of suppliers to the first generation suppliers identified in the supplier economic impact. This level of impact encompasses activity by the cloth, button, thread and sewing equipment manufacturers who are the suppliers to the shirt maker as well as all other products and services that are required to run the textile business.
Induced Consumer Spending: every person that has as a direct, supplier or interindustry job also plays the role of consumer in the US economy. They spend a portion of their salaries in the economy on items such as food, consumer goods and services, healthcare and so on. This spending initiates multiple rounds of economic activity, stimulating additional sales and job creation.
As Figure 7 illustrates, the advertising expenditures incurred throughout the economy by businesses in all industries and all geographic areas sets off a chain reaction that (1) generates a net gain in direct sales and jobs due to the promotion of the industries'

THE ECONOMIC IMPACT OF ADVERTISING
EXPENDITURES IN THE UNITED STATES
January 2014 20 ©2014 IHS
products and services, (2) generates indirect sales and jobs among the first level suppliers to those industries that incur the advertising expenditures, and (3) generates indirect sales and jobs among all other levels of economic activity as inter-industry sales ripple throughout the economy.
Figure 7 - Advertising Sets Off a Chain Reaction of Economic Activity
As sales increase in each state and Congressional District and industry as the result of advertising, employers must hire new workers to maintain a certain capital-labor ratio. This ratio will vary depending on each industry's labor- or capital-intensity. For example, the retail sectors will need an additional worker to support each extra $50,000 in sales. On the other hand, an auto manufacturing plant might need, on average, one new worker to support each new $500,000 in sales. These relationships are contained in the IAS databases, and directly applied to the advertising sales impacts in order to estimate employment impacts.
In this section we discuss the results of a statistical model designed to answer the following question: Holding all other factors equal, what percent change in advertising spending would result from a given percent change in the cost of advertising? This model has important policy implications concerning a potential increase in the cost of advertising that would result from reducing or eliminating the federal tax deductibility of ad spending.
The model uses ordinary least squares regression analysis to explain the quarterly percent change in real advertising spending as a linear function of two broad macroeconomic factors, one measure of the overall profitability of business, and the price of advertising relative to the price of other goods and services. The specification of the equation allows us to control for those factors that determine advertising spending, yet still isolate the effect of the driver that is of interest for this study – the relative price of advertising.
First, real consumer spending per capita indicates the overall strength of the
consumer market. This factor provides a broad measure of the potential sales opportunities that can be expected in the marketplace.
Advertising Expenditures
Direct Sales Activity Direct Employment Impact
Supplier Sales Activity Supplier Employment Impact
Interindustry Sales Activity Supplier Employment Impact
Advertising Expenditures
Direct Sales Activity Direct Employment Impact
Supplier Sales Activity Supplier Employment Impact
Interindustry Sales Activity Supplier Employment Impact

THE ECONOMIC IMPACT OF ADVERTISING
EXPENDITURES IN THE UNITED STATES
January 2014 21 ©2014 IHS
Second, the ability of households to actually buy additional goods and services – as
represented by real disposable income per household – provides a useful measure of additional potential sales.
Third, real corporate profits provide a view of the ability of businesses to spend
money on advertising.
Fourth, firms that advertise take into account the cost of advertising relative to other
goods and services that could be purchased.

THE ECONOMIC IMPACT OF ADVERTISING
EXPENDITURES IN THE UNITED STATES
January 2014 22 ©2014 IHS
Appendix B: IHS Global Insight Macroeconomic Models
IHS MODEL OF THE U.S. ECONOMY Econometric models built in the 1950s and 1960s were largely Keynesian income-expenditure systems that assumed a closed domestic economy. High computation costs during estimation and manipulation, along with the underdeveloped state of macroeconomic theory, limited the size of the models and the richness of the linkages of spending to financial conditions, inflation, and international developments. Since that time, however, computer costs have fallen spectacularly; theory has also benefited from four decades of postwar data observation and from the intellectual attention of many eminent economists.
The IHS Model is an econometric dynamic equilibrium growth model. It strives to incorporate the best insights of many theoretical approaches to the business cycle: Keynesian, neoclassical, monetarist, supply-side, and rational expectations. In addition, the IHS Model embodies the major properties of the long-term growth models presented by James Tobin, Robert Solow, Edmund Phelps, and others. This structure guarantees that short-run cyclical developments will converge to robust long-run equilibria.
In growth models, the expansion rate of technical progress, the labor force, and the capital stock determine the productive potential of an economy. Both technical progress and the capital stock are governed by investment, which in turn must be in balance with post-tax capital costs, available savings, and the capacity requirements of current spending. As a result, monetary and fiscal policies will influence both the short- and the long-term characteristics of such an economy through their impacts on national saving and investment.
THE ECONOMIC IMPACT OF ADVERTISING
EXPENDITURES IN THE UNITED STATES
January 2014 23 ©2014 IHS
IHS REGIONAL ECONOMIC MODELS US Regional Model: IHS US Regional Model provides analyses of each state and metropolitan area in the US. Each area is modeled individually and then linked into a national system of macroeconomic and industry forecasts. The models forecast internal growth dynamics and differential business cycle responses for each state and metropolitan area. Our objective is to forecast how regional activity varies, given an economic environment as laid out by IHS US economic forecast and economic and demographic characteristic of a region.
US Regional state forecasting models use US macroeconomic forecast as main driver. State models are econometrically estimated and comprise of a large number of stochastic equations specified to capture economic behavior of the state relative to the national economy. Similarly, metro forecasting models use state forecast as driver and contain stochastic equation that summarizes the behavior of the metro economy relative to the state economy. The list of concepts modeled include demographic details at state level, employment sector detail, GSP sector detail, annual wages by sector, personal income details and other concepts such as retail sales, housing starts, etc. Metro models have similar coverage with fewer details for sectors.
The IHS approach to state models represents a significant departure from most previous multi-regional modeling and forecasting efforts. Most other regional models are constructed as proportions of the U.S. In the IHS system each area is modeled individually and then linked into a national system. Thus, our models do not forecast regional growth as simple proportions of U.S. totals, but focus on internal growth dynamics and state specific business cycle response. This approach is referred to as "top-down bottom-up." It contrasts sharply with pure share (top-down) models, and models which are not linked to a national macroeconomic model (bottom-up), and contains the best of both approaches. Our basic objective is to project how regional activity varies, given an economic environment as laid out by our Macroeconomic and Industry forecasts. Important regional issues are addressed using information about detailed industrial mix, inter-industry and interregional relationships, productivity and relative costs, and migration trends. IHS maintains separate models for 50 states and for Washington DC, as well as for 318 metropolitan areas. The state models have two fundamental characteristics: (1) Each state is modeled individually, with different model structures specified according to the characteristics of the state; and (2) national policy is explicitly captured.
These models are econometrically estimated and contain about 250 or more equations each. Employment by sector and wage rates and income by type of activity, and GSP by sector are modeled in detail. Other coverage includes housing starts, retail sales, consumer price indexes, population by 10 year age groups, the labor force and household employment. The models have the ability to forecast income, wages and GSP in nominal as well as real dollars. The State models have a monthly periodicity, so they are able to capture the full business cycle behavior of the economy, including the timing and amplitude of turning points. Another model characteristic is that they are

THE ECONOMIC IMPACT OF ADVERTISING
EXPENDITURES IN THE UNITED STATES
January 2014 24 ©2014 IHS
policy sensitive — they respond to changes in tax rates, military spending, utility costs, etc. The policy simulation capability can be classified into: (1) how a state/metro economy responds to changes in the national economy resulting from national or international events; and (2) how a state/metro responds to a change in state/city government policy.
IHS US INDUSTRY MODEL IHS US Industry Model is a quarterly econometric model of industry activity in the US economy. It is also designed for forecasting, policy analysis, and simulation studies. This
model is used each month by IHS Global Insight’s economists to provide more detailed industry forecasts of the US economy. It includes over 170 industry sectors (such as steel, aircraft, chemicals, insurance, communications services, etc.) and provides industry metrics such as industry output, prices, profitability, input costs, labor costs, employment, and utilization.
IHS US BUSINESS MARKET INSIGHTS IHS Business Market Insights consists of detailed data and forecasts of employment, the number of business establishments, and the value of output by industry (production), business size, and geographic area. The employment, establishments, and output are developed for 1,000 industries based on detailed NAICS codes as defined by the federal government. Employment by industry is also further delineated into 60 occupational classifications. The data are available for all detailed industries in all states, metropolitan areas, and counties and 75 aggregate industries in all Congressional Districts and ZIP codes in the US. The model is linked to IHS other models to assure consistency for all levels of industry, occupation, and geographic area detail.
THE IMPLAN MODEL Previous studies done on this topic have utilized REMI models for the economic impact analysis. IHS typically uses IMPLAN models and has extensive experience customizing these models to meet our specific analysis needs.
IMPLAN, short for "Impact Analysis for Planning," is a widely-used commercially available model for input/output analysis. MIG is responsible for the production of the IMPLAN data, model and software. Using classic input/output analysis in combination with regional specific social accounting matrices and multiplier models, IMPLAN provides a highly accurate and adaptable model for its users.
Comprehensive and detailed data coverage for the US economy, and the ability to incorporate user-supplied data at each stage of the model building process, provide a high degree of flexibility both in terms of geographic coverage and model formulation. There are two components to the IMPLAN system: the databases and the software. The databases provide information needed to create IMPLAN models, from the US model to state models and down to zip code specific models that can be aggregated to congressional districts. The software performs the calculations and provides an interface for the user to make final demand changes.

THE ECONOMIC IMPACT OF ADVERTISING
EXPENDITURES IN THE UNITED STATES
January 2014 25 ©2014 IHS
The IMPLAN system includes:
A national-level technology matrix, and;
Estimates of sectoral activity for final demand, final payments, industry output and employment.
Input-output accounting describes commodity flows from producers to intermediates and final consumers. The total industry purchases of commodities, services, employment compensation, value added, and imports are equal to the value of the commodities produced.
Purchases for final use (final demand) drive the model. Industries produce goods and services for final demand and purchase goods and services from other producers. These other producers, in turn, purchase goods and services. This buying of goods and services (indirect purchases) continues until leakages from the region (imports and value added) stop the cycle.
These indirect and induced effects (the effects of household spending) can be mathematically derived. The derivation is called the Leontief inverse. The resulting sets of multipliers describe the change of output for each and every regional industry caused by a one dollar change in final demand for any given industry.