Embed Size (px)
Citation preview

The Economic Impact of Caltrain Modernization A Bay Area Council Economic Institute White Paper June 2012

Bay Area Council Economic Institute
201 California Street, Suite 1450 San Francisco, CA 94111
(415) 981-7117 (415) 981-6408 Fax
[email protected] http://www.bayareaeconomy.org
PDF Reading Note
This PDF document includes navigation link features to
facilitate onscreen reading. Click a table of contents entry to
jump directly to that section of the document. Click on the
arrowheads in the lower right corner of each page to move one
page forward or backward.
Cover Illustration: San Jose Station Area
Contents
Executive Summary .................................................................3
Introduction...............................................................................5
About the Caltrain Corridor.......................................................7
Project Description ...................................................................8
Construction Impacts................................................................9
Real Property Value Impacts..................................................16
Findings..................................................................................25
Appendix A: IMPLAN Input-Output Methodology ...................28
Appendix B: Empirical Strategy for Estimating the Impact of Reduced Travel Times on Property Values Near Stations.....31
The Economic Impact of Caltrain Modernization 2

Executive Summary The Caltrain system is a vital part of the Bay Area’s public
transportation system. With service launched by Southern
Pacific in 1863, this commuter railroad has connected com-
munities and guided their growth and development for nearly
150 years. Today, Caltrain provides over 40,000 daily trips, a
number that is growing rapidly along with the fast-growing
technology companies of Silicon Valley, the Peninsula and
San Francisco.
Caltrain has long recognized that its growing passenger levels
cannot be efficiently or economically served with the
conventional diesel equipment that it currently operates, and
since 1999 Caltrain has had official plans to convert to electric
power. With a new commitment of funding from the California
High-Speed Rail Authority, Caltrain believes that by 2019 it
can convert to electric power and install a new advanced train
control system.1 Together, these upgrades compose the
Caltrain Modernization Program which enhances Caltrain
service and supports high speed rail in the future.
1 This funding commitment is subject to legislative budget approval.
Upgrading the system with electric power and an advanced
train control system has both short-run and long-run
economic implications:
In the short run, the sizeable construction expenditures will
provide a significant stimulus to the local economy.
In the long run, the Modernization Program will allow
Caltrain to offer faster trip times and/or more frequent
service, which will have ongoing positive economic effects.
These effects include shorter travel times for passengers,
lessened traffic congestion on Highway 101, employer
access to a larger labor pool, and increased real estate
values near Caltrain stations.
This report addresses the short-term and the long-term
economic implications of installing the upgraded power and
communications systems. Taken together, the construction
benefits along with the long-term benefits would provide
mid-range economic benefits in the state by an estimated
$2.0 billion. These estimates are reached by adding gross
regional product, state and local taxes, increases in residential
property values, increased property tax collections, and the
value of time saved by Caltrain riders.
The Economic Impact of Caltrain Modernization 3

The Economic Impact of Caltrain Modernization 4
Among the specific benefits of the project are the following:
Construction can be expected to add 9,581 full-time
equivalent job-years to the state economy, with the vast
majority (over 90%) being in the Bay Area.
Construction will increase California’s gross state product,
or output, by $951 million.
State and local tax collections will see an increase of $71
million during the construction phase.
Property values near Caltrain can be expected to see an
increase of as much as $1 billion.
These estimates reflect a considerable short-term economic
benefit for the state and the region. Although the Bay Area
economy is recovering better than most economies nation-
wide, this project will directly benefit sectors of the economy
that have been hardest hit by the recession—construction
employment and real estate values.
The long-term benefits are also considerable. The primary
source of these benefits is from increases in residential
property values. Estimates suggest that property values near
Caltrain stations could be increased by as much as $1.0
billion, with accompanying increases in property taxes (over
time) of up to $59 million over a 30 year timeframe. Accounting
for the declines in pollution and noise, net benefits could be as
high as $1.1 billion, including increases in property taxes.
Table 14: Summary Results ($ Millions)
Estimate Range
Economic Benefit Low High Middle
Short-Term Value Added State and Local Taxes
950.671.1
950.671.1
950.6
71.1
Long-Term Property Values Property Taxes Time Savings Environmental Changes
209.712.3
185.315.5
1,012.559.1
370.515.5
611.1
35.7 277.9
15.5
Long-Term Total 422.8 1,457.6
Overall Total 1,444.5 2,479.3 1,961.9
Source: Bay Area Council Economic Institute calculations using IMPLAN system analysis.
There will be further benefits; the Caltrain Modernization
Program will act as a catalyst for local transit-oriented
development and will facilitate the success of the region’s
priority development areas.

Introduction Caltrain provides the primary means of traveling the length of
the San Francisco Peninsula by public transportation. It is a
key component of the Bay Area's transportation infrastructure,
linking San Francisco and Silicon Valley. Its ridership is fore-
cast to increase by 75% over the next 25 years, and it is des-
tined to play a central role in key regional plans for transit,
sustainability or urbanism.2
Caltrain currently provides commuter rail service using con-
ventional diesel locomotives pulling unpowered passenger
cars. By modifying the system to run on electric current and
by upgrading the signal system, the Caltrain Modernization
Program will improve the system's performance, operating
efficiency, capacity, safety and reliability. These improvements
will allow Caltrain to provide an improved passenger experi-
ence with faster trip times and/or more frequent service.
The project will also improve air quality, reduce some noise
disturbances and lower vibration levels near the tracks.
2 For ridership forecast details see U.S. Department of Transportation, Federal Transit Administration, Caltrain Electrification Program, Environmental Assessment/Final Environmental Impact Report (July 2009) 1:3–159.
The Economic Impact of Caltrain Modernization 5

Based on the California High-Speed Rail Authority (CHSRA)
Business Plan (April 2012), the Metropolitan Transportation
Commission has developed an MOU reflecting regional
agreement on leveraging Proposition 1A funding for high-
speed rail with local, state and federal funding to implement
Caltrain’s advanced signal system and electrification projects.
This is the first time that a realistic funding strategy has been
defined for the modernization program envisioned in the Cal-
train 1999 and 2004 strategic plans.
The overall intent of the MOU is to jointly support and pursue
the implementation of a statewide high-speed rail system that
utilizes a blended system and operational model on the peninsula
corridor to support a one-seat ride between San Francisco’s
Transbay Transit Center and Southern California.
The MOU applies specifically to project investments that
upgrade existing rail service and prepare for a future high-
speed train project that is limited to infrastructure necessary to
support a blended system, which will be primarily a two-track
system shared by both Caltrain and high-speed rail as well as
other passenger and freight services.
The blended system comprises several interrelated capital pro-
jects. The early investment projects are the Caltrain Electrifica-
tion Infrastructure and Advanced Signal System projects.
The remaining interrelated capital projects are the Downtown
Extension (DTX) project, the San Jose Diridon Station, the
Millbrae BART/Caltrain Station, and Core Capacity Upgrades to
stations, tunnels, bridges and passing tracks (to be determined),
in addition to other track modifications and rail crossing im-
provements, including grade separations (to be determined).
The funding plan included in the MOU is for the Caltrain
Electrification Infrastructure and Advanced Signal System
projects only. Together these projects make up the Caltrain
Modernization Program, and it is these projects that form the
basis for the analysis of economic impacts in this report.
The economic impacts of the Caltrain Modernization Program
broadly fall into three categories:
local jobs and capital inflows during construction,
changes in real property values, and
the economic value associated with improved service.
Following a brief description of the Caltrain corridor and the
Modernization Program, this report provides estimates of the
economic impact of construction and the effect on real estate
property values, as well as the economic benefits of
improved service.
The Economic Impact of Caltrain Modernization 6

The Economic Impact of Caltrain Modernization 7
About the Caltrain Corridor Built during the peak of the California Gold Rush, the railroad
that is today’s Caltrain serves one of the world’s most eco-
nomically productive regions. From its northern terminus in
San Francisco, Caltrain carries over 40,000 passengers daily
through the heart of Silicon Valley to its southern terminus in
Gilroy. Along its 77-mile route, Caltrain serves some of the
world’s most iconic companies, institutions and communities.
The Caltrain corridor stands out for its exceptional economic
strength. Companies along the corridor account for approxi-
mately one-third of all venture capital investment in the United
States, bringing $11.6 billion to the region in 2011. The region
has the highest concentration of high-tech workers and the
highest average high-tech salaries of any metropolitan area on
earth. Of the Bay Area’s 30 Fortune 500 companies, 24 are
located along the Caltrain corridor, including Apple, Google,
and Intel.
Caltrain serves one of the most diverse and well-educated
populations in the world. Passing through 17 cities across
three counties, Caltrain’s total service area features over
3 million residents and scores of world-class universities and
community colleges in a temperate Mediterranean climate.
These and other factors have incubated businesses,
contributing to the creation and growth of the region’s eco-
nomic clusters in high-tech, biotech, and green energy, keep-
ing unemployment levels along the corridor at 6.75%, signifi-
cantly below the regional rate
(7.93%), and far below state
levels (11%).
Utilizing fossil fuel locomotives,
rail service along the Caltrain
corridor has remained funda-
mentally unchanged since it
first opened in 1863. Caltrain
operators officially proposed
electrifying the line in 1999,
but the project was delayed
indefinitely for lack of funding.
Caltrain estimates that
electrified service will reduce
air pollutants by 90%, lower
energy consumption by 64%,
reduce congestion along
Highway 101, stabilize
operating expenses and push
ridership past 70,000 per day.

Project Description The primary components of the Caltrain Modernization Program
are the replacement of the existing train equipment with Electric
Multiple Unit (EMU) trains, the construction of the associated
power infrastructure and the installation of a new advanced
signal system.
With these investments, Caltrain will have the ability to provide
faster trip times and/or more frequent service. This is primarily
because EMU trains can accelerate and decelerate more quickly
than the existing diesel-powered trains. Because a substantial
portion of each trip is spent accelerating and decelerating
between nearby stations, electrification can result in reductions
in travel time and/or increased service. The new signal system
permits shorter separation between trains, enabling Caltrain to
support higher levels of service in the corridor.
Caltrain is planning to increase service from the current 5 trains
to 6 trains per peak hour per direction. With the increased ser-
vice level plus the enhanced attributes of the modernized sys-
tem and the EMU capabilities of accelerating and decelerating
faster than diesel powered trains, Caltrain will be able to reduce
travel time and/or increase service to stations.
The infrastructure associated with the advanced signal system
is a series of communication equipment installations throughout
the right of way. The overhead contact system (OCS) is com-
posed of two electric conductors above each track, hanging
from poles 30 to 50 feet tall and positioned every 180 to 200
feet. Overbridge barriers will be placed to protect the OCS from
objects thrown off of bridges. The power facilities along the
route include two primary substations, one switching station and
seven paralleling stations. The primary substations are approx-
imately 200 feet by 150 feet in size, the switching station is
approximately 160 feet by 80 feet and the paralleling stations
approximately 80 feet by 40 feet. Power facilities will be placed
mostly within the railroad right-of-way and will be located in
spots that minimize their impact on surrounding land uses.
The Economic Impact of Caltrain Modernization 8

The Economic Impact of Caltrain Modernization 9
Construction Impacts
Costs
The Caltrain Modernization Program is estimated to cost
approximately $1.456 billion.3 Of this amount, roughly $785
million will go toward constructing the infrastructure needed
for electrification, approximately $440 million will fund the
new electric trains and related services, and the remaining
$231 million will go toward installing the new advanced signal
system (Table 1).
Table 1: Breakdown of Costs (in Year-of-Expenditure Dollars)
Project Component Estimated Cost ($ Millions)
Electrification Infrastructure 785
Advanced Signal System 231
EMU Trains 440
Total 1,456
Source: Bay Area Council Economic Institute calculations based on Caltrain data.
3 This figure is expressed in year-of-expenditure dollars.
Of the $1.456 billion total project cost, the majority will be
spent within the Bay Area and will generate local economic
benefits, but a portion is anticipated to be spent outside of the
region. For example, the new EMU trains are unlikely to be
constructed in the Bay Area because there are no American
companies that produce EMU trains. Accordingly, our analysis
begins by deducting from the total project expenditures the
amount that will be spent outside of the Bay Area. The result—
$1.11 billion in year-of-expenditure dollars—is the estimated
amount that will impact the Bay Area and California
economies.
This $1.11 billion expenditure will be spread over several years,
but a complete accounting of these expenditures according to
the year in which they may potentially be made is excessively
complex for this analysis. Instead, we assume that the
expenditures occur in 2014. This assumption will cause the
impact of expenditures made before 2014 to be understated
and will cause the impact of expenditures made after 2014 to
be overstated.4
4 2014 seems a reasonable estimate of the mid-point. See the “Estimated Construction Phasing” table in the U.S. Department of Transportation, Caltrain Electrification Program, Environmental Impact Report, 4-5.

Estimated Impacts
The economic impacts of construction are estimated using a
standard input-output model, which estimates the short-run
impacts of changes in the economy through the use of multi-
pliers.5 In essence, this model takes the average characteris-
tics of the construction industry and estimates the increased
use of resources that the industry would absorb in the event
that there were more demand for construction services. The
estimated impacts of construction are reported below in terms
of employment and output.
5 Specifically, the estimates are derived using the IMPLAN Professional® 3.0 software package. See Appendix A for more information on the IMPLAN model and its assumptions.
Overall, the economic impacts of the Caltrain Modernization
Program are described using three estimate types:
Resulting employment impacts are measured in terms of
full-time equivalent (FTE) job-years generated.6
Resulting output impacts are measured in terms of dollar
value added (a measure of regional gross state product,
similar to national GDP). This value added measurement is
a good reflection of the overall benefits to the local and
state economies.
Resulting economic activity is a representation of the aggre-
gate expenditures generated by the Modernization Program.
The implementation of the Caltrain Modernization Program
does not occur in a vacuum. Rather, each aspect of the Mod-
ernization Program has a ripple effect within the regional and
state economies. These effects are commonly referred to as
“multipliers.” The additional funds that will flow to design spe-
cialists and construction workers will allow them to buy more
equipment; the makers of construction equipment pay salaries
to their employees; and these employees purchase goods
from businesses in their hometowns. Thus the initial injection
6 An FTE job-year is 2,080 hours’ worth of work. Job-years do not represent the number of people a project will employ. One FTE job-year could represent one person employed for 2,080 hours, or two people employed for 1,040 hours each, etc.
The Economic Impact of Caltrain Modernization 10

of funds circulates throughout the economy. Direct impacts in
this context refer to jobs and output generated directly by the
Caltrain Modernization Program; indirect impacts refer to jobs
and output generated by the Modernization Program's input
suppliers; and induced impacts refer to all further removed jobs
and output generated by those directly and indirectly employed
due to their spending on other things like food and housing.
Accordingly, our estimates of the three types of economic
effects—employment, output (value added), and economic
activity—are broken down into direct, indirect and induced
impacts. The employment impacts of construction are further
broken down by region as shown in Table 2. The direct
impacts are assumed to be confined to the nine Bay Area
counties,7 but the indirect and induced impacts spill over into
the rest of California.
7 These counties include San Francisco, San Mateo, Santa Clara, Alameda, Contra Costa, Solano, Sonoma, Napa and Marin.
Employment Impacts
Overall, modernization can be expected to add over 9,500
FTE job-years to the state economy, with the vast majority
(8,809) being in the Bay Area. Benefits to other counties in the
rest of the state amount to 772 FTE job-years, or 8.1% of the
total. Altogether, this represents about 2,400 FTE job-years in
each of the four years of construction.
Table 2: Resulting Employment Impact in California
Region Direct Indirect Induced Total
The Bay Area
4,702 1,315 2,793 8,809
Rest of California
0 333 439 772
All of California
4,702 1,648 3,232 9,581
Source: Bay Area Council Economic Institute calculations using IMPLAN system analysis.
Notes: Employment is measured in full time equivalent (FTE) job-years (2,080 hours per year) and not in specific numbers of positions added to the economy. Rows may not sum to exact totals due to rounding.
The Economic Impact of Caltrain Modernization 11

The following table breaks down the employment impacts by
project component.
Table 3: Resulting Employment Impact by Project Component (FTE Job-Years)
Project Component Direct Indirect Induced Total
Electrification Infrastructure
3,249 1,148 2,207 6,604
Advanced Signal System
1,220 431 829 2,480
EMU Trains 232 69 195 496
Total 4,702 1,648 3,232 9,581
Source: Bay Area Council Economic Institute calculations using IMPLAN system analysis.
Note: Rows and columns may not sum to exact totals due to rounding.
Table 4 breaks down the construction impacts by industry,
using 2-digit North American Industrial Classification System
(NAICS) categories. The largest impacts are for the industries
that are directly affected by the project, namely the
construction industry and the professional, scientific and
technical services industry. The indirect and induced impacts
are more spread out across the spectrum of local industries,
but continue to show a degree of concentration within the two
directly impacted industries.
Table 4: Resulting Employment Impact by Industry
Industry Direct Indirect Induced Total
Ag., Forestry, Fishing and Hunting
0 25 21 45
Mining 0 34 5 39
Utilities 0 4 9 12
Construction 4,469 16 23 4,508
Manufacturing 0 232 82 314
Wholesale Trade 0 79 96 174
Retail Trade 0 174 531 705
Transportation and Warehousing
0 117 89 206
Information 0 36 60 95
Finance and Insurance
0 84 309 392
Real Estate and Rental and Leasing
0 85 164 249
Prof., Sci., and Tech. Services
232 413 150 796
Management of Companies and Enterprises
0 15 19 34
The Economic Impact of Caltrain Modernization 12

Admin. Support and Waste Management Services
0 152 153 305
Educational Services
0 1 149 150
Health Care and Social Assistance 0 0 540 540
Arts, Entertainment, and Recreation
0 16 123 139
Accommodation and Food Services
0 52 351 403
Other Services (except Public Administration)
0 100 312 413
Public Administration
0 15 46 61
Total 4,702 1,648 3,232 9,581
Source: Bay Area Council Economic Institute calculations using IMPLAN system analysis.
Notes: Employment is measured in full time equivalent (FTE) job-years (2,080 hours per year) and not in specific numbers of positions added to the economy. Rows and columns may not sum to exact totals due to rounding.
Job creation stemming from the Modernization Program is
most heavily concentrated in the construction sector. In all,
some 4,500 FTE job-years will be generated in the construction
sector. While this sounds like a large number of workers along
the 51-mile corridor, it is worth noting the proportion of the
created jobs that are likely to be behind the scenes. A break-
down of the Bay Area's construction sector shows about two-
thirds of the workers in Construction and Extraction trades.
More than 11% are in Management, 6% are in Office and
Administrative Support, and another 3.4% are in Business
and Financial Operations.
Many jobs are also created in other sectors due to the ripple
effect in which the construction spending makes its way
through the broader economy. Construction companies
purchase intermediate inputs from other suppliers, creating
jobs in Manufacturing and Wholesale Trade, for example. At
the same time, the incomes of those in the Construction
industry are spent more broadly in other sectors—in particular,
Retail Trade, Health Care and Social Assistance, and
Accommodation and Food Services. Each of these sectors will
experience an increase in employment as a result of the
economic activity generated by the Caltrain Modernization
Program. The figures for Health Care are surprisingly high, but
merely reflect the fact that spending in this sector is equal to
one-fifth of U.S. GDP and it is very labor intensive.
The Economic Impact of Caltrain Modernization 13

Economic Output Impacts
The output impacts of the Caltrain Modernization Program are
also broken down by region, as shown in Table 5. The output
and employment impacts reflect a similar pattern, with the
Bay Area reaping most of the output benefits and roughly
8% of the benefits accruing to the rest of the state. It should
be noted that the figures in Table 5 are for a measure of out-
put that is equivalent to U.S. gross domestic product and
that measures the increase in value added to the economy.
This is roughly the value of increased economic activity that
results from the project less the purchases of intermediate
inputs from outside of the region. While output, or value added,
in the region increases by nearly $951 million, the increase in
aggregate economic activity, the value of all economic trans-
actions associated with the project, is $1.6 billion.
Table 5: Resulting Output Impact in California ($ Thousands)
Region Direct Indirect Induced Total
The Bay Area
448,894 142,253 287,266 878,413
Rest of California
0 32,548 39,595 72,143
All of California
448,894 174,801 326,861 950,556
Source: Bay Area Council Economic Institute calculations using IMPLAN system analysis.
Table 6: Resulting Economic Activity in California ($ Thousands)
Region Direct Indirect Induced Total
The Bay Area
779,791 243,637 444,087 1,467,515
Rest of California
0 66,536 68,072 134,608
All of California
779,791 310,173 512,160 1,602,123
Source: Bay Area Council Economic Institute calculations using IMPLAN system analysis.
The Economic Impact of Caltrain Modernization 14
The following two tables show the economic output and
activity effects broken down by project component rather than
by region. The economic activity benefits are naturally highly

correlated with the expenditure levels for each component
presented in Table 1.
Table 7: Resulting Output Impact by Project Component ($ Millions)
Project Component
Direct Indirect Induced Total
Electrification Infrastructure
308 122 223 653
Advanced Signal System
116 46 84 245
EMU Trains 25 8 20 53
Total 449 175 327 951
Source: Bay Area Council Economic Institute calculations using IMPLAN system analysis. Note: Rows and columns may not sum to exact totals due to rounding.
Table 8: Resulting Economic Activity by Project Component ($ Millions)
Project Component
Direct Indirect Induced Total
Electrification Infrastructure 541 217 350 1,108
Advanced Signal System
203 82 131 416
EMU Trains 36 11 31 78
Total 780 310 512 1,602
Source: Bay Area Council Economic Institute calculations using IMPLAN system analysis.
Impact on State and Local Tax Revenue
Table 9 summarizes the multiplier effects of each project
component in terms of state and local taxes. The construction
firm hired to carry out the work is subject to a variety of taxes,
the income received by workers is taxed and households pay
a variety of taxes. In total, the Caltrain Modernization Program
will generate in excess of $71 million in state and local taxes,
to some extent offsetting the overall cost of the project.
Table 9: Changes in State and Local Business Taxes ($ Thousands)
Project Com-ponent
Employee Compen-sation
Indirect Business Taxes
House-hold Taxes
Corp-orate Taxes
Total
Electrifi-cation Infra-structure
1,302 27,144 17,037 3,158 48,641
Advanced Signal System
489 10,207 6,406 1,187 18,289
EMU Trains 110 2,312 1,527 179 4,128
Total 1,901 39,663 24,970 4,524 71,058
Source: Bay Area Council Economic Institute calculations using IMPLAN system analysis.
The Economic Impact of Caltrain Modernization 15

Real Property Value Impacts The Caltrain Modernization Program is likely to affect property
values and property taxes near Caltrain:
Enhanced service in the form of faster trip times and/or
more frequent service will affect the desirability of
properties near Caltrain stations.
Environmental factors such as improved air quality,
reduced vibration levels and altered noise patterns will
affect properties near the tracks, and new power facilities
may aesthetically impact adjacent properties.
Increases in property values will also have an effect on
overall property tax collections.
These three impacts are discussed in turn in the rest of this section.
The Impact of Enhanced Service on Property Values Near Stations
The Caltrain Modernization Program has the potential to in-
crease property values through the effect of enhanced service
to nearby residences. Because of the faster trip times and/or
more frequent Caltrain service, the homes of nearby residents
will have an improved amenity—the Modernization Program
essentially brings any destination on the Caltrain route a little
bit closer.
The largest effect on property values is estimated to occur for
properties near Caltrain stations; these are the properties
where the residents can most effectively exploit the reduced
travel time or expanded service levels. There is scant literature
providing a reasonable guide as to what might be expected in
terms of changes in property values. The influence of infra-
structure improvements on residential properties is very
dependent on the nature of the infrastructure and the nature
of the local real estate market. Fortunately, the introduction of
the Baby Bullet service in 2004 provides a natural experiment.
The Baby Bullet service introduced express Caltrain service to
a subset of stations along the line. Analyzing differences in the
appreciation of property values near different stations permits
an assessment of the abnormal increase in property values
that accrued to stations with access to Baby Bullet service.8
From this analysis, it appears that a 1 minute reduction in ex-
pected travel time resulting from the introduction of Baby Bullet
service caused assessed property values within 0.25 miles of
a Caltrain station to increase by 1.5% to 2.4%. Below, we
evaluate the change in property values assuming an increase
of 1.5%, the lower bound of possible effects. Because of this 8 See Appendix B for an extended discussion of the methodology.
The Economic Impact of Caltrain Modernization 16

choice, the estimates presented below also represent a lower
bound on the effect—this is one of several steps we take to
keep our estimate conservative (in the sense of underestimat-
ing any positive impacts).
We assume that travel time will be reduced by between 5 and
10 minutes along the full length of the impacted route. Precise
calculation of the expected travel-time reduction at each station
hinges upon the details of Caltrain’s new service schedule,
which has yet to be established. In the absence of this informa-
tion, we allocated the expected travel-time reduction in
proportion to each station’s distance from San Francisco, with
the exception of San Francisco’s 4th and King St., 22nd St. and
Bayshore stations, which were assigned a travel-time reduction
equal to half of the overall reduction.9
Applying the conservative 1.5% gain in property value per
minute of travel-time reduction to the 2011 assessed values of
all residential properties within 0.25 miles of an impacted Cal-
train station, and scaling the effect by the estimated expected
travel-time reductions, we conservatively estimate that follow-
ing the Caltrain Modernization Program, assessed property
values will increase by $209.6 million with a 5 minute time
savings and $419.3 million with a 10 minute time savings.
9 Passengers leaving 4th and King are assumed to travel half the length of the corridor on average, yielding a 2.5 to 5 minute time benefit.
Table 10 breaks down the estimated increase in assessed
property values by county.10
Table 10: Estimated Increase in Residential Property Values ($ Millions)
Estimated Increase in Assessed Value
5 Minute Reduction
in Travel Time 10 Minute Reduction
in Travel Time
County
0–0.25
miles
0.25–0.5
miles Total
0–0.25
miles
0.25–0.5
miles Total
San Francisco
31.3 38.8 70.1 62.6 77.5 140.1
San Mateo 89.3 128.9 218.2 178.5 257.9 436.4
Santa Clara
89.1 128.9 218.0 178.1 257.9 436.0
Total 209.7 296.6 506.3 419.2 593.3 1,012.5
Source: Bay Area Council Economic Institute calculations using county assessor data from various sources.
There are three additional factors that make our estimate more
conservative. First, the 0.25-mile radius around Caltrain sta-
tions that bounds our estimate is an imposed one. Within the
10 College Park station was omitted from the estimate, as it is currently only served by a single train during each weekday rush hour.
The Economic Impact of Caltrain Modernization 17

range of distances considered in previous studies of the effect
of proximity to rail transit on residential property values, 0.25
miles is at the lower end.11 Choosing a 0.25-mile radius re-
duces our estimate of positive impacts because it carries the
implicit assumption that changes in expected travel time do not
affect the value of properties beyond this distance. As it is
likely that the value of properties beyond this distance will also
be positively affected by travel-time reductions, the choice of a
0.25-mile radius makes our estimate more conservative.
The effect on property values between 0.25 and 0.5 miles from
the station was also evaluated. In general, the effect was lower
than for those properties within the 0.25-mile radius. It seems
implausible that the effects would cease at 0.25 miles but likely
that they would decline significantly beyond that range. In
order to get a sense of the understatement of the effects on
property values by excluding properties between 0.25 and 0.5
miles from stations, we assume that the effect on property
values in this range is half that of the inner circle range. With
this assumption, given the significantly larger inventory of
housing in this outer range, despite the smaller effect,
assessed values have the potential to increase by up to $593
million. Combining the inner and outer circles, the overall
increase in residential real estate values is plausibly in excess
of $1.0 billion.
11 A survey of previous literature on the topic can be found in Daniel B. Hess and Tangerine M. Almeida, “Impact of Proximity to Light Rail Rapid Transit on Station-area Property Values in Buffalo, New York," Urban Studies (2007), 44:1041.
Second, our estimate is limited to the effect of travel-time re-
duction on residential properties. In a 2002 study, Berkeley
researchers Robert Cervero and Michael Duncan estimated
the impact of VTA and Caltrain rail services on Santa Clara
County commercial property values.12 They found that being
within 0.25 miles of a VTA stop was associated with a 23%
increase in the value of a typical commercial property, and that
the corresponding figure for a Caltrain station was a whopping
120%. These findings suggest that our estimate with respect
to residential properties alone is an underestimate of the joint
impact on residential and commercial property values near
Caltrain stations.
Third, using the introduction of Caltrain's Baby Bullet service
in 2004 as a means of obtaining our estimate suggests that it
holds in the context of Caltrain ridership around that time.
Caltrain has estimated ridership in 2007 at approximately
33,420 passengers per day and has forecast ridership in 2035
to reach 71,000 passengers per day, conditional on the
12 Robert Cervero and Michael Duncan, “Transit's Value-Added Effects: Light and Commuter Rail Services and Commercial Land Values,” Transportation Research Record 1805, paper no. 02-2273 (2002).
The Economic Impact of Caltrain Modernization 18

Caltrain Modernization Program.13 Inasmuch as travel-time
reductions are linked to assessed property values via the
probability that potential homebuyers are Caltrain riders,
greater ridership in the future implies an even stronger effect
on property values than the one we have estimated. By not
incorporating Caltrain's forecast of greater future ridership—
due to either general increases in ridership or the induced
increase due to Modernization—into our estimate, we are yet
again ensuring a more conservative estimate.
It is important to note that in California, unless a property
changes ownership, its assessed value can only increase by
up to 2% a year because of Proposition 13. This means that
the estimated impacts will not be realized immediately, but
only gradually, as properties change hands. Market values, on
the other hand, may be affected as soon as homebuyers be-
come aware of travel-time reductions.
The most closely related study to ours was produced in June
2011 by Economic & Planning Systems, Inc. (EPS), which was
retained by the City of Palo Alto to estimate the economic im-
pacts of the Caltrain Modernization Program within the city.
Their study puts the impact of improved travel times on the
13 U.S. Department of Transportation, Federal Transit Administration, Caltrain Electrification Program, Environmental Assessment / Final Environmental Impact Report (July 2009) I: table 3.15-5.
assessed value of residential properties in Palo Alto at $34
million, in contrast to the more conservative figure of $6.4
million that our estimates suggest. The difference between the
estimates stems in part from our stricter assumption that the
impacts of travel-time reduction only accrue to properties
within 0.25 miles of a Caltrain station, as opposed to the as-
sumption of a 0.5-mile radius used by EPS. Allowing the range
to expand out to the 0.5 mile radius, our estimates suggest a
potential increase in assessed values of $43 million using their
8 minute assumption, an effect that is larger than the EPS
estimate. The difference also emerges from the fact that our
estimate relies on econometric identification of the effects of
the Caltrain Modernization Program using data from the Bay
Area, whereas the EPS estimate relies on cited estimates of
train station effects estimated using data from New Jersey.14
The estimated increases in property values also have implica-
tions for property tax collections. As indicated, the estimated
increases in assessed property values would not all be real-
ized upon completion of the Modernization Program. Assessed
property values would only be affected as properties turn over.
In time, the increase in values will be reflected in assessed
values, and the 1.25% California property tax rate will apply.
14 The EPS study cites “The ARC Effect: How Better Transit Boosts Home Values and Local Economies,” Regional Plan Association (2010).
The Economic Impact of Caltrain Modernization 19

Were the increases in place in 2011, property taxes would
have been between $4.3 million and $10.0 million higher than
was observed.
The Impact of Environmental Changes on Real Property Values
The Caltrain Modernization Program will affect the route’s
immediate environment in several ways. Replacing diesel
with electric locomotion will prevent direct emissions from
the trains, thereby improving air quality near Caltrain tracks.
It will also reduce vibration levels and reduce engine noise.
On the other hand, the increase in service frequency will
cause safety horns and crossing signal bells to be heard
more frequently. In addition, new power facilities may
aesthetically affect adjacent properties.
To estimate these impacts, we adopt a conservative set of
assumptions put forth by Economic & Planning Systems, Inc.
(EPS) in June 2011, when estimating the economic impacts of
Caltrain Modernization in the city of Palo Alto. The assumptions
are as follows:
Air quality: Reduced emissions will increase the assessed
values of residential properties within 100 feet of the tracks
by 0.5%.
Noise: Reduced engine noise will increase the assessed
values of residential properties within 100 feet of the tracks
by 0.65%, but more frequent horn and signal noise will
roughly offset this impact, yielding a net zero impact.
Vibration: Reduced vibration will increase the assessed
values of residential properties within 100 feet of the tracks
by 1%.
Aesthetics: The assessed values of residential properties
whose view will span new power facilities will be reduced
by 5%. We apply this assumption to all residential
properties within 250 feet of a new power facility.15
15 In instances where there remain several possible alternatives for a power facility's location, we take the average of the effect across the alternative sites.
The Economic Impact of Caltrain Modernization 20

Our estimates of the impact of environmental changes on the
assessed value of residential properties are given in Table 11.
The total estimated impact is a gain of roughly $15.5 million in
assessed values for residential properties. The gain will mostly
accrue to properties in San Mateo and Santa Clara counties.
Table 11: Estimated Impact of Environmental Changes on Assessed Value of Residential Properties ($ Thousands)
Air
Quality Noise Vibration Aesthetics Total
San Francisco County
361 0 722 -119 964
San Mateo County
2,388 0 4,776 -231 6,933
Santa Clara County
2,626 0 5,251 -282 7,595
Total 5,375 0 10,749 -632 15,492
Source: Bay Area Council Economic Institute.
Property Tax Increases
With a projected increase in property values, there will also be
an increase in property tax revenues. Property in California is
taxed at a base rate of 1.25% of the assessed value of the
property. Assessed values in the region will not reflect the
increase in market value of the residences due to the Mod-
ernization Program until the residences are sold. It is at that
time that the assessed values are adjusted upward to reflect
the market value of the property at the time of the sale.
The analysis in the preceding sections suggests that there will
be a significant increase in market values of between $225
million and $1.04 billion, depending on the extent of the time
savings and the range of residences that experience an in-
crease in value. Accordingly, were all of the residences to
change hands immediately, there would be an increase in
property taxes of between $2.7 million and $13.1 million in
the first year of service, and over a 30-year timeframe.
However, not all properties will sell in the first year, nor during
a 30-year timeframe for the elements of the Modernization
Program. Assuming that just 2.5% of properties turn over in an
average year, which implies that 72.5% of the properties will
turnover in 30 years, it is possible to project the present dis-
counted value of future property tax receipts associated with
the project.
The Economic Impact of Caltrain Modernization 21

Table 12 provides such estimates. Between 2014 and 2044, the
assumed effective capital life of the project, property taxes will
increase between $12.3 million and $59.1 million.16 These reve-
nues reflect increases in property taxes that would not be col-
lected, but for the implementation of the Modernization Program.
Table 12: Estimates of Property Tax Revenues Associated with the Modernization Plan ($ Millions)
Minimum Maximum
5 Minute Travel Time Reduction
12.3 24.0
10 minute Travel Time Reduction
29.5 59.1
Source: Bay Area Council Economic Institute calculations using IMPLAN system analysis.
Note: Estimates in the Minimum column include only increased values for properties within 0.25 miles of a Caltrain station. The Maximum column includes increases for properties up to 0.5 miles from a Caltrain station.
16 A relatively aggressive discount factor of 7.5% has been used in developing these estimates. Given the low interest rates on current U.S. Treasuries, it would be reasonable to argue for a lower discount rate. However, 30 years is a long time horizon and current interest rates are not likely to persist indefinitely. This assumption serves to render the estimates in Table 12 quite conservative. These estimates are also based on the figures in Table 10, which are increases applied to 2011 property values. Property values in the year that service begins will likely be higher, as will the accompanying increases as a result of the Modernization Program. This, again, renders the estimate conservative.
Direct Travel-Time Impacts
The Modernization Program will have a direct effect on travel
times for commuter travel and road travel.
Commuter Travel: Faster trip times and/or more frequent
service can reduce wait or travel times for Caltrain
passengers.
Road Travel: Enhanced Caltrain service and greater
frequencies can impose costs on road traffic through
increased crossing frequencies. At the same time,
increased Caltrain ridership can reduce traffic, reducing
traffic congestion.
Commuter Travel-Time Impacts
Not only will those who own residential real estate in the vicin-
ity of Caltrain stations benefit from the Modernization Program,
but those riding Caltrain will experience reduced waits and
shorter travel times. These gains can be estimated by valuing
the potential time savings of passengers. This is accomplished
by developing an estimate of the value of time for passengers
and an estimate of the amount of time saved.
There are a variety of strategies for estimating the value of
time for passengers. The approach taken here is to limit time-
savings benefits to weekday travelers and to use an estimate
The Economic Impact of Caltrain Modernization 22

of average wages for those both working full-time and living in
one of the three counties served by Caltrain. The logic behind
this statistic as an estimate is that for each minute the individ-
ual waits, he or she could either be working or engaged in an
activity that has approximately the same value per minute as a
minute spent working. For this group, average wages in 2008–
2010 were just over $68,000.17 However, a 2010 survey of
Caltrain riders implies that the average Caltrain passenger has
a household income of in excess of $104 thousand and is of
significantly higher average education than is the population
as a whole.18 We have opted to use the average of these two
figures, or $86,000. This implies an average value of a single
minute of just under $0.70.
The amount of time saved can also be estimated, but the
process is more complicated. The first step is to estimate the
level of ridership on an average weekday. For this, data is
taken from a recent report on Caltrain passenger counts.19
From this report, we have estimates of boardings and alight-
ings at each station between the 4th and King St. station and
the Tamien station. Data is not available on specific trips
taken, so it is not possible to count the number of trips
between any two stations. Instead, the boardings at any one
station are assumed to turn into alightings at other stations
along the route in proportion to each station’s overall share of
alightings. This process will overestimate the length of many
trips, but will also understate the length of others. This proce-
dure provides a synthetic set of distinct trips taken on Caltrain
on an average weekday.
17 Calculation by the Bay Area Council Economic Institute from the 2010 American Community Survey 3-Year Estimates. 18 Corey, Canapary & Galanis Research, “October 2010 Caltrain Onboard Study, Supplemental Reports, Ridership Segmentation Report (Peak & Weekend Customers” (March 2011). 19 U.S. Department of Transportation, “Caltrain Annual Passenger Counts: Key Findings” (February 2011), at http://www.caltrain.com/Assets/Stats+and+Reports/Ridership/2011+Caltrain+Ridership+Counts+FINAL.pdf
The time savings on each trip are then estimated by assuming a
savings of 5 to 10 minutes between the 4th and King St. and
Tamien stations (as was done above). The time savings are
assumed to be distributed evenly along each mile of track be-
tween the two stations. Each trip is then shortened by a share of
the 5 or 10 minutes that is equivalent to the share of the dis-
tance traveled between 4th and King and Tamien stations.
Combining the estimates of the value of a minute saved and
the estimate of the time saved for each trip, it is possible to
estimate the total value of time saved for Caltrain passengers.
Estimates suggest that were the elements of the Moderniza-
tion Program in place in 2011, and were the time saved to
have been 5 or 10 minutes along the length of the upgrade,
The Economic Impact of Caltrain Modernization 23
The Economic Impact of Caltrain Modernization 24
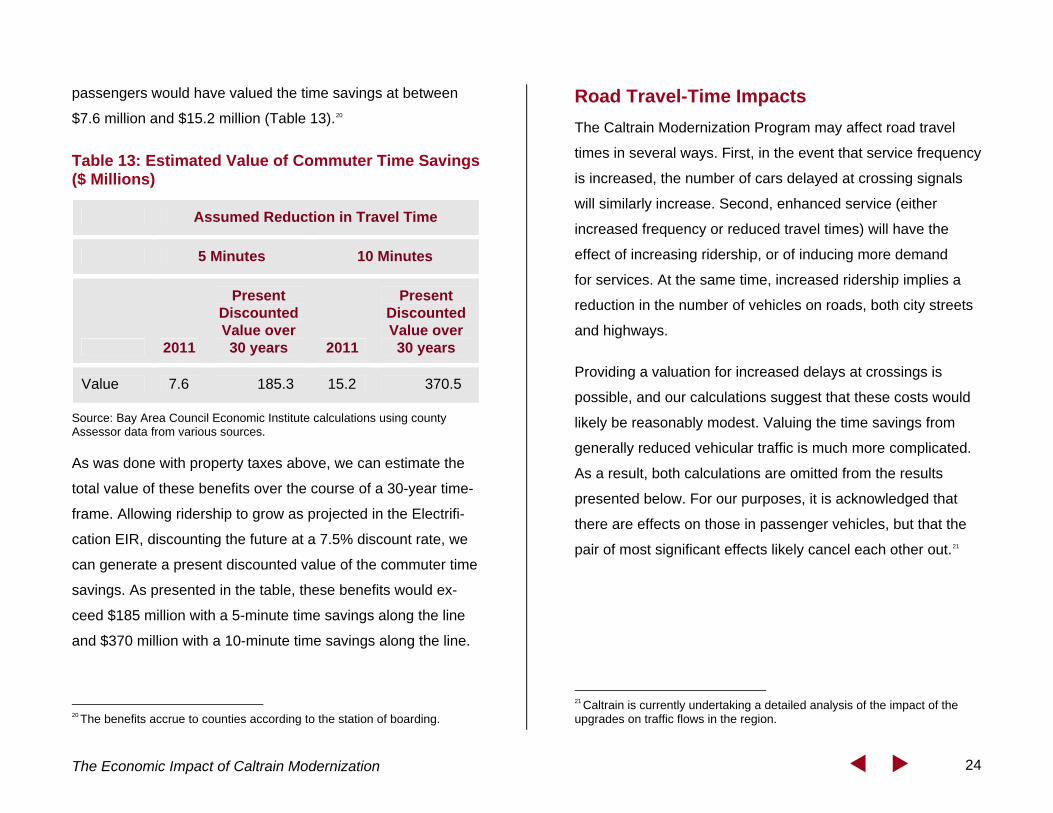
passengers would have valued the time savings at between
$7.6 million and $15.2 million (Table 13).20
Table 13: Estimated Value of Commuter Time Savings ($ Millions)
Assumed Reduction in Travel Time
5 Minutes 10 Minutes
2011
Present Discounted Value over 30 years 2011
Present Discounted Value over 30 years
Value 7.6 185.3 15.2 370.5
Source: Bay Area Council Economic Institute calculations using county Assessor data from various sources.
As was done with property taxes above, we can estimate the
total value of these benefits over the course of a 30-year time-
frame. Allowing ridership to grow as projected in the Electrifi-
cation EIR, discounting the future at a 7.5% discount rate, we
can generate a present discounted value of the commuter time
savings. As presented in the table, these benefits would ex-
ceed $185 million with a 5-minute time savings along the line
and $370 million with a 10-minute time savings along the line.
20 The benefits accrue to counties according to the station of boarding.
Road Travel-Time Impacts
The Caltrain Modernization Program may affect road travel
times in several ways. First, in the event that service frequency
is increased, the number of cars delayed at crossing signals
will similarly increase. Second, enhanced service (either
increased frequency or reduced travel times) will have the
effect of increasing ridership, or of inducing more demand
for services. At the same time, increased ridership implies a
reduction in the number of vehicles on roads, both city streets
and highways.
Providing a valuation for increased delays at crossings is
possible, and our calculations suggest that these costs would
likely be reasonably modest. Valuing the time savings from
generally reduced vehicular traffic is much more complicated.
As a result, both calculations are omitted from the results
presented below. For our purposes, it is acknowledged that
there are effects on those in passenger vehicles, but that the
pair of most significant effects likely cancel each other out.21
21 Caltrain is currently undertaking a detailed analysis of the impact of the upgrades on traffic flows in the region.

Transbay Terminal cross-section. Project Architect: Pelli Clarke Pelli. Rendering courtesy of the Transbay Joint Powers Authority.
Findings The Caltrain Modernization Program is a significant project,
with estimated local expenditures of $1.11 billion in year-of-
expenditure dollars. Accordingly, the expected benefits are
also significant. These benefits come in both the short run—
those associated with the installation and design of the pro-
gram’s components—and the long run—those associated with
improved service provided by Caltrain.
In the short run, the expected employment and output effects
are quite large. Over the course of the four-year project, more
than 9,500 full-time equivalent job-years will be added to the
state economy. Though these jobs are concentrated in the
Construction sector, the demand for products in other sectors,
both through the purchase of construction-related materials
and through the expenditures of the construction workers, will
also increase. Notable among the other industries that benefit
are Retail Trade and Health Care and Social Assistance.
Carrying out the Caltrain Modernization Program would pro-
vide some much-needed relief to local construction workers.
Over the course of the recession, construction employment in
the nine-county Bay Area fell by more than 30%, or roughly
60,000 jobs. Job opportunities in the three Caltrain counties
fell by a similar percentage. It is worth noting that although job
The Economic Impact of Caltrain Modernization 25

opportunities fell relatively uniformly across the region, con-
struction workers are extremely mobile. In an average year,
one-third of all workers employed in construction in the three
Caltrain counties live in some other Bay Area county. Accord-
ingly, it could be anticipated that up to one-third of the con-
struction jobs generated in the three counties will benefit
workers somewhere in the rest of the Bay Area, most likely in
Alameda and Contra Costa counties.
It should be noted that the results here are smaller than many
guideline job generation figures. In particular, American Public
Transportation Association (APTA) reports indicate that
$1 billion in increased construction or infrastructure spending
is likely to create roughly 24,000 jobs. The difference here is in
large part due to the notion of “leakage.”22 The APTA figures
are based on the economic impacts nationwide, while our
numbers are for California alone. Some of the economic activ-
ity resulting from the Caltrain Modernization Program will be
the purchase of materials by those directly involved in imple-
menting the program. Many of these materials will be pro-
duced outside of California and are hence not included in the
economic impact analysis presented in this report. Were we to
report benefits for the nation as a whole, we would see job
gains that are more comparable to the APTA guidelines.
22 See Appendix A for more on the concept of leakage in this context.
Nonetheless, the implementation of the Caltrain Modernization
Program will result in significant economic benefits for the
state: the generation of more than 9,500 full-time equivalent
job-years, an addition of nearly $1 billion to gross state product
in California, $1.6 billion in increased economic activity, and
$71 million in state and local taxes.
In the long run, once these upgrades have been installed, there
are significant benefits both to homeowners near the Caltrain
stations and to those who ride Caltrain. Although there are also
potential negative implications from the visual effects of the new
infrastructure and from increased wait times at rail crossings,
these are more than offset by the positive economic benefits.
In all, our very conservative estimate of these benefits indi-
cates an additional $423 million in long-run benefits. The ac-
tual benefits are likely much larger: this figure could plausibly
be as high as $1.5 billion, in particular, allowing for the very
real possibility that properties further away from stations would
see some appreciation with improved service. Further, this
study has only analyzed the impact on residential properties.
Were commercial properties to be included, the overall bene-
fits would likely be significantly higher.
The Economic Impact of Caltrain Modernization 26

The Economic Impact of Caltrain Modernization 27
Taken together, the quantifiable short-run and long-run bene-
fits resulting from the Caltrain Modernization Program are
significant. With expenditures of $1.11 billion, the following
benefits are likely:
9,581 full-time equivalent job-years of work will be generated.
An infusion of $1.6 billion worth of increased economic
activity will be generated statewide, with most of the
activity occurring in the Bay Area.
Gross state product will be increased in the State of California
by $951 million in construction-related economic benefits.
Improvements in residential real estate values will lead to
at least $210 million, but possibly as much as $1.0 billion.
As much as $71 million in short-run state and local taxes
and as much as $59 million in additional property tax
revenues will be generated.
As much as $370.5 million will be realized in the value of
time savings for Caltrain passengers.
These benefits are substantial, resulting in between $1.4 and
$2.5 billion in economic gain. Where in this range the benefits
lie depends on the extent of time savings for Caltrain
passengers (estimated to be between 5 and 10 minutes for the
entire route) and the distance across which improved service
affects property values. A conservative, yet very reasonable
estimate of the overall benefits is $2.0 billion. Accordingly, the
cost of the upgrades will be more than offset by gains in the
California economy.
Table 14: Summary Results ($ Millions)
Estimate Range
Economic Benefit Low High Middle
Short-Term Value Added State and Local Taxes
950.671.1
950.671.1
950.6
71.1
Long-Term Property Values Property Taxes Time Savings Environmental Changes
209.712.3
185.315.5
1,012.559.1
370.515.5
611.1
35.7 277.9
15.5
Long-Term Total 422.8 1,457.6
Overall Total 1,444.5 2,479.3 1,961.9
Source: Bay Area Council Economic Institute calculations using IMPLAN system analysis.
There are further benefits that will result from upgrading
Caltrain, not the least of which is facilitating growth of transit-
oriented development and facilitating the success of desig-
nated priority development areas. It is widely accepted that
improved public transportation can result in higher density
development near transit stations. There is no reason to
expect the effects of the Caltrain Modernization Program to
be any different.

Transbay Terminal 1939
Appendix A: IMPLAN Input-Output Methodology The IMPLAN modeling system combines the Input-Output
Benchmarks from the U.S. Bureau of Economic Analysis with
other data to construct quantitative models of trade-flow rela-
tionships between businesses, and between businesses and
final consumers. From this data, we can examine the effects of
a change in one or several economic activities in order to pre-
dict its effect on a specific state, regional or local economy
(impact analysis). The IMPLAN input-output accounts capture
all monetary market transactions for consumption in a given
time period. The IMPLAN input-output accounts are based on
industry survey data collected periodically by the U.S. Bureau
of Economic Analysis, and they follow a balanced account
format recommended by the United Nations.
IMPLAN's Regional Economic Accounts and the Social Account-
ing Matrices were used to construct region-level multipliers that
describe the response of the relevant regional economy to a
change in demand or production as a result of the activities and
expenditures related to the Caltrain Modernization Program.
Each industry that produces goods or services generates
demand for other goods and services, and this demand is
multiplied through a particular economy until it dissipates
through “leakage” to economies outside the specified area.
The Economic Impact of Caltrain Modernization 28

IMPLAN models discern and calculate leakage from local, re-
gional and state economic areas based on workforce configu-
ration, the inputs required by specific types of businesses and
the availability of both inputs to production (intermediate prod-
ucts and labor) in the economic area. Consequently, economic
impacts that accrue to other regions or states as a conse-
quence of a change in demand are not counted as impacts
within the particular economic area. This concept of leakage is
central to understanding why estimated economic impacts per
$1 billion might be lower when produced for a regional
economy than is often reported for nationwide studies.
The model accounts for substitution and displacement effects
by deflating industry-specific multipliers to levels well below
those recommended by the U.S. Bureau of Economic Analysis.
In addition, multipliers are applied only to personal disposable
income to obtain a more realistic estimate of the multiplier ef-
fects from increased demand. Importantly, IMPLAN's Regional
Economic Accounts exclude imports to an economic area so
the calculation of economic impacts identifies only those im-
pacts specific to the particular economic area, in this case as
determined and defined by Caltrain. IMPLAN calculates this
distinction by applying the area’s economic characteristics
described in terms of actual trade flows within the area.
Impact studies operate under the basic assumption that any
increase in spending in an industry sector has three effects.
First, there is a direct effect on that industry itself. Second,
there is a chain of indirect effects on all the industries whose
outputs are used by the industry under observation. Third,
there are induced effects that arise when employment in-
creases and household spending patterns are expanded.
Overall economic impact has several aspects. First, there is an
effect on value added—the take-home pay of all the people af-
fected will be supplemented by that amount. Second, there is
an employment effect, with some jobs created in the industry
itself and the others spread throughout the California economy.
Third, there is the output, where the difference between value
added and output is that the former concentrates on people's
paychecks, whereas the latter includes the costs of intermediate
inputs. National income accounting avoids double counting by
excluding the costs of intermediate inputs.
In sum, our analysis using IMPLAN input-output accounts is
based on three important assumptions. First, there are constant
returns to scale. This means that a 10% cut in spending will be
ten times as severe—across every sector in the economy—as
a 1% cut. Second, there are no supply constraints. This means
that any marginal increase in output can be produced without
having to worry about bottlenecks in labor markets, commodity
The Economic Impact of Caltrain Modernization 29

The Economic Impact of Caltrain Modernization 30
markets or necessary imports. This assumption is quite realistic
in a free-market economy like California’s where there is some
unemployment. It is even more reasonable in times of high
unemployment, such as the present economic environment,
because there are many under- and un-utilized resources that
can be activated without detracting from other industries. Third,
the flow of commodities between industries is fixed. This means
that it is not possible to substitute in the short run the many
different inputs that go into the industry in question.
In addition to the fundamental economic effects, the IMPLAN
model also produces estimates of the state and local taxes
that are generated by a project. The following list outlines the
types of taxes generated.
Employee Compensation: Employee Compensation in
the IMPLAN model is the total payroll cost of the employee
paid by the employer. This includes wage and salary, all
benefits (e.g., healthcare and retirement) and employer-
paid payroll taxes (e.g., the employer side of social security
and unemployment taxes).
Indirect Business Taxes (IBT): Prior to the 2003 compre-
hensive National Income and Product Accounts (NIPA)
table revisions, IBT was the name of one of the three com-
ponents of value added. IBT consists of tax and nontax
liabilities that are chargeable to business expenses when
calculating profit-type incomes and certain other business
liabilities to government agencies that are treated like taxes.
Thus, IBT includes taxes on sales, property and production,
but it excludes employer contributions for social insurance
and taxes on income. As part of the NIPA revision, this
component was modified and termed “taxes on production
and imports less subsidies.” The major differences between
the two are attributable to the treatments of subsidies and
non-taxes by the Bureau of Economic Analysis (BEA). In
more general terms, IBT can currently be considered the
combination of excise, sales and property taxes, as well as
fees, fines, licenses and permits.
Household Taxes: This category is the combination of
excise, sales and property taxes, as well as fees, fines,
licenses and permits levied on final users of nondurable
goods and services.
Corporate Taxes: The Corporate Taxes category is the
combination of excise, sales and property taxes, as well as
fees, fines, licenses and permits levied on corporations. A
corporation is a legal entity, created for the purpose of
producing goods or services for the market, that may be a
source of profit or other financial gain to its owner(s); it is
collectively owned by shareholders who have the authority
to appoint directors responsible for its general management.
Appendix B: Empirical Strategy for Estimating the Impact of Reduced Travel Times on Property Values Near Stations
The Difference in Differences (DD) and Triple Difference in Differences (DDD) Methods
The two simplest approaches to estimating the impact of travel-
time changes on property values use either differences in
property values across space or differences in property values
over time.
The first approach is to compare the value of properties near
stations that experienced a change in travel time with properties
near stations that experienced a different change in travel time
(or none at all). Whether the difference in average property val-
ues between these two sets of properties is in fact caused by
the difference in travel-time changes is far from certain. Any
other difference between the two sets of properties—for exam-
ple, the fact that travel-time reductions happened to be greater
in areas that also happened to be more expensive to begin
with—could also explain the difference in property values.
Put simply, any difference between the properties around each
station could be responsible for the difference in their property
values, and attributing this difference solely to their having dif-
ferent travel-time changes requires ruling out an exhaustive list
of alternative explanations. Adequately controlling for such an
exhaustive list is almost never feasible, so when studies use
this approach to infer a causal effect, they can never quite
escape the shadow of doubt.23
The second approach is to compare the value of properties
near stations that experienced a change in travel time before
and after the change occurred. Unfortunately, this approach
suffers from a similar problem, because we can almost never
rule out that some other change that occurred between our
before and after observations is in fact causing the observed
change in property values. For example, if the school district
to which the properties belong improved its record over this
period, this improvement may be responsible for some or all
of the change in property values.24 Put simply, property values
near the different stations may have evolved differently
between our before and after observations. Attributing the
different local property value trajectories solely to the
difference in travel-time changes is difficult to justify.
23 Despite incorporating data from before and after travel-time changes occurred, the method used in the New Jersey study cited by EPS essentially belongs to this approach, and despite including an admirable set of relevant control variables in its regression, the study is still subject to this critique. 24 Even if average test scores adequately capture school district quality and can be controlled for, ruling out an exhaustive list of any other such concurrent changes is almost never feasible.
The Economic Impact of Caltrain Modernization 31

One way of getting around these problems and plausibly argu-
ing that travel-time changes are causing the change in property
values is to combine the two approaches. The hybrid approach
compares the change in property values near stations that ex-
perienced a change in travel time, before and after the change
occurred, with the corresponding change in property values
near stations that experienced a different change in travel time
(or none at all). This approach is referred to as a “difference in
differences” (DD) approach. As long as all other changes that
may have affected property values concurrently with the travel-
time changes were similar for properties near all the stations,
then the effect of all such "other changes" cancels out, and the
difference in differences approach yields an estimate that plau-
sibly captures the causal effect of travel-time changes on prop-
erty values. In practical terms, this means that if we are willing
to assume that property values near the different stations would
have evolved along similar trajectories in the absence of a
change in travel times, then we can attribute any difference
in trajectories of property values to the difference in travel-time
changes. Unfortunately, such an assumption can never be
verified, because we cannot observe the counterfactual world
in which travel times did not change.
Of course, it need not be the case that all other changes af-
fecting property values concurrently with travel-time changes
were similar near the different stations. Reverting to the school
district example, what if properties near stations experiencing
different travel-time changes also belong to different school
districts? In this case, the difference in differences approach
captures both the effect on property values of the difference in
travel-time changes between the stations and of any difference
in the development of the school districts’ influence on prop-
erty values. Fortunately, the difference in differences approach
can be modified to handle this difficulty, albeit at the cost of
added complexity. The modified approach is referred to as a
“triple difference in differences” (DDD) approach.
Even if we are uncomfortable with the difference in differences
assumption that property values near the different stations
would have evolved along similar trajectories in the absence
of a change in travel times, we still have hope. For the set of
properties near each station, we can locate a set of placebo
properties that evolved similarly between our before and after
observations. In this study, for example, we define the set of
properties near each station as those properties within 0.25
miles of the station and we define properties within 0.5 to 0.75
miles of the same station as the corresponding set of placebo
properties. What distinguishes each original set of properties
from its placebo counterpart is that travel time only affects
The Economic Impact of Caltrain Modernization 32

property values in the original set, and not in the placebo set
(hence the term placebo).25
If we are uncomfortable with the difference in differences
assumption, then we believe that using a difference in
differences approach on the original sets of properties near
each station yields an estimate that reflects both the effect of
different travel-time changes on property values across stations,
as well as the confounding effect (read “misleading effect”) of
any other developments that affected property values and that
evolved differently across stations—a wanted and an unwanted
component. In contrast, using the exact same difference in
difference approach on the placebo sets of properties near
each station yields an estimate that reflects only the unwanted
component. Here comes the crux: suppose that in the absence
of a change in travel times the property value trajectories of
each original set of properties and its corresponding placebo
set would have evolved similarly—we ought to be comfortable
making this assumption if we have selected our placebo sets
adequately—then the difference between the difference in
differences estimate for the original sets of properties and
the difference in differences estimate for the placebo sets of
25 In a softer version of this condition, property values in the placebo set may also be affected by travel time, but to a lesser degree than in the original set of properties. Using the softer condition ultimately causes the triple difference in differences approach to underestimate the effect of travel-time changes on property values, making our estimates yet another step more conservative.
properties should reflect only the wanted component. Because
the unwanted component appears in both difference in differ-
ences estimates, it cancels out when we take the difference
between the two, leaving us only with what we want: the causal
effect of travel-time changes on property values.
Application
In this study we estimate the effect of travel-time reductions on
residential property values within 0.25 miles of Caltrain sta-
tions using both the difference in difference (DD) and triple
difference in difference (DDD) methods. In particular, we use
the introduction of Caltrain's Baby Bullet service in June 2004
as source of variation in travel time, and (indirectly) observe
the freshly assessed values of residential properties sold at
arm's length in 2002 and in 2006. We chose the year 2002
because it precedes 2004 but is sufficiently prior to the intro-
duction of the Baby Bullet service that anticipatory effects on
property values are unlikely to be a serious concern. We
chose 2006 because following the initial introduction of the
Baby Bullet service, the frequency of service was increased
several times and the timetables repeatedly updated, with the
last update taking place in August 2005.
The Economic Impact of Caltrain Modernization 33

Formally, we applied the DD method by running the following
linear regression on the full universe of residential properties
within 0.25 miles of a Caltrain station that were last sold in
either 2002 or 2006.
logAVit = α + β1Aftert + β2TTCi + β3AftertTTCi + X’it δ + εit
Here, AVit is the assessed value of residential property i at time
t. Aftert is an indicator variable that equals 1 if t equals 2006
and 0 otherwise (i.e., if t equals 2002). TTCi is the expected
travel-time change, in minutes, at the Caltrain station nearest
property i given the relevant timetables for time 2002 and
2006. Xit is a vector of observed property attributes and εit is an
error term.26 The coefficient of interest is β3, the DD coefficient,
which measures the difference in before and after differences
between properties near stations with different expected
travel-time changes.
We applied the DDD method by running the closely related
following regression on the same population of residential prop-
erties, expanding the area to include properties within a ring with
a radius of 0.5 to 0.75 miles around each Caltrain station.
26 Travel-time changes are measured in expectation because arrival time at the train station is taken to be random, thereby affecting wait time at the station, which is included in travel time.
logAVit = β0 + β1Aftert + β2TTCi + β3AftertTTCi +
(1 – Placeboi) (Υ0 + Υ1Aftert + Υ2TTCi +
Υ3AfteriTTCi) + X’it δ + εit
Here, Placeboi is an indicator variable that equals 1 if property i
is within the 0.5-mile to 0.75-mile ring, and 0 otherwise (i.e., if it
is within 0.25 miles of a Caltrain station). The coefficient of in-
terest is γ3, the DDD coefficient, which measures the difference
in the difference in before and after differences between proper-
ties near stations with different expected travel-time changes,
between properties within 0.25 miles of a Caltrain station and
properties within the placebo 0.5-mile to 0.75-mile ring around
the same Caltrain station. Inasmuch as travel-time changes
affect property values in the placebo rings, the DDD coefficient
picks up an underestimate of the true effect of travel-time
changes within the 0.25-mile radius around the stations.27
Assessed values of residential properties sold at arm’s length
in 2002 and 2006 were not directly observed in our data. We
could, however, directly observe the 2011 assessed value of
all properties in our data. For San Francisco and Santa Clara
counties we could also observe the date of the last arm’s
length transfer of ownership, and for San Mateo County we
27 It is for this reason that the 0.5- to 0.75-mile ring was selected, rather than the closer 0.25- to 0.5-mile ring. The latter would have led to extreme underestimation.
The Economic Impact of Caltrain Modernization 34

could observe the last date of any transfer of ownership and a
descriptor of the transaction, which we used to identify in
which cases the last transfer of ownership was an arm’s length
one. The arm's length distinction is important, because it im-
plies that the next assessment of that property's value was
unconstrained. Because of California's historical Proposition
13, assessed property values can increase by no more than
2% per year, unless an arm's length transfer of ownership
takes place. In order to back out the 2002 and 2006 assessed
values of properties sold at arm's length in those years, we
took the 2011 assessed values, assumed they had been con-
stant since 2007 and that they increased by exactly 2% each
year before then. Imputing lagged values this way roughly
captures the evolution of assessed residential property values
in California over those years.28 Because we only observe the
last arm’s length sale for each property, any single property is
only observed transacting once, either in 2002 or 2006, but not
in both years, so our data consists of repeated cross sections
rather than true panel data.
28 Ignoring any decreases in assessed property values since the onset of the housing crisis in mid-2006 implies that we are underestimating home values in 2002 and in 2006, and therefore any positive effects of travel-time reductions, too, making our estimates more conservative yet again.
Expected travel-time changes were computed using Caltrain's
schedules from April 2001 and August 2005, each of which
spanned (at least) the subsequent calendar year, under sev-
eral assumptions. In particular, expected travel-time changes
were calculated for northbound passengers traveling to the 4th
and King St. station who randomly arrive at their departure
stations with uniform probability between 6:00 a.m. and 9:00
a.m. on a weekday morning and unconditionally board the next
train. The exceptions to this rule were passengers traveling
from 4th and King St., 22nd St. and Bayshore stations, who
were assumed to be traveling southbound to the Palo Alto sta-
tion under otherwise unchanged assumptions. Thus, expected
travel times include both time spent waiting at the station for
the next train and time spent on the train traveling. Table B.1
reports the expected travel times29 before and after the intro-
duction of Baby Bullet trains, as well as the expected travel-
time change.30 As shown by the table, the introduction of bullet
train service in 2004 generated substantial variation across
stations in travel-time change. It is this variation that allows us
29 Passengers’ expected travel times are their average travel times if they have an equal probability of arriving at the given station at any minute between 6:00 and 9:00am on a weekday. Passengers are assumed to board the next available train to their destination. 30 Atherton, Broadway and Paul Ave. stations were active in 2002, but not in 2006. Expected 2006 travel times for these stations were obtained by adding the commute time by car from each of these stations to the nearest Caltrain station active in 2006 to the expected travel times calculated for these active nearby stations.
The Economic Impact of Caltrain Modernization 35

to estimate the impact of changes in service on local real
estate values.
Table B.1: Expected Travel Time Changes by Station (Minutes, on an Average Weekday)
Station
Expected Travel Time 2002
Expected Travel Time 2006
Expected Travel Time
Changes
4th & King 74 51 -23
22nd St. 71 49 -22
Paul Ave. – – –
South San Francisco 33 37 4
Bayshore 39 50 11
San Bruno 43 35 -8
Millbrae 38 35 -3
Broadway – – –
Burlingame 39 44 5
San Mateo 49 43 -6
Hayward Park 55 71 16
Hillsdale 48 40 -8
Belmont 61 73 12
San Carlos 55 57 2
Redwood City 64 62 -2
Atherton – – –
Menlo Park 71 65 -6
Palo Alto 71 54 -17
California Ave. 73 67 -6
San Antonio 79 77 -2
Mountain View 77 71 -6
Sunnyvale 97 79 -18
Lawrence 101 91 -10
Santa Clara 105 92 -13
College Park 116 89 -27
San Jose Diridon 98 84 -14
Tamien 103 107 4
Source: Bay Area Council Economic Institute calculations based on Caltrain data.
The Economic Impact of Caltrain Modernization 36

The Economic Impact of Caltrain Modernization 37
Regression results are reported in the following table.
Table B.2: Difference in Differences (DD) and Triple Difference in Difference (DDD Estimates
DD DDD
(1) (2) (3) (4) (5) (6)
DD or DDD coef. (β3 or γ3) -0.0151*** -0.0202*** -0.0235*** -0.0182*** -0.0189*** -0.0157
-0.0048 -0.005 -0.0058 -0.0052 -0.0055 -0.0065
Unreported β and γ coefs. county-specific
– + + – + +
Controls for property attributes included – – + – – +
San Francisco County + + + + + +
San Mateo County + + – + + –
Santa Clara County + + + + + +
R2 0.997 0.997 0.998 0.996 0.997 0.998
Number of observations 879 879 341 4,765 4,765 2,078
Source: Bay Area Council Economic Institute
Notes: Controls for property attributes include indicators for single family residences, condominiums and apartments, square footage, number of bedrooms, number of baths rounded up to the nearest integer and the lower of years elapsed since construction or since last renovation requiring a permit. Heteroskedasticity robust standard errors in parentheses. ***p<0.01, **p<0.05, *<0.1
As the outcome variable is the log of the assessed property
value, the DD and DDD coefficients can be interpreted as
being approximately percentage changes in assessed property
values. The estimate of the basic DD coefficient (β3) reported
in Column (1) indicates that one added minute of expected
travel time reduces assessed property values by 1.51%, or

conversely that a one minute reduction in expected travel time
increases property values by that amount. Column (2) reports
the estimate from a specification similar to (1), in which the
coefficients on β0, β1 and β2 are allowed to vary by county. In
Column (3), controls are added for property attributes (Xit in
equation (1)). Unfortunately, our data does not include these
variables for San Mateo County, so this specification is
estimated with only San Francisco and Santa Clara County
observations. It is reassuring that these controls do not
drastically alter the results.
Column (4) reports the estimate of the DDD coefficient (γ3),
which is not significantly different from the estimate of the DD
coefficient in Column 1, suggesting that property-value trajec-
tories near the various Caltrain stations are not extremely dif-
ferent. Nevertheless, the DDD exercise is reassuring, and we
take this to be our most preferred point estimate. Allowing all
β and γ coefficients except γ3 to vary by county in Column 5
hardly alters the results. As in Column 3, running a specifica-
tion of (2) that includes controls for property attributes and is
limited to San Francisco and Santa Clara County observations
in Column 6 does not significantly alter results, either. To
summarize, it appears safe to say that, on average, the effect
of travel-time reduction on assessed property values within
0.25 miles of impacted Caltrain stations lies between 1.5%
and 2% of assessed property value.
Several remaining comments are in order:
Our estimate in no way accounts for new residential (or
other) construction for which reduced travel times may be
pivotal. Once again, avoiding this facet of the subject ren-
ders our estimates a shade more conservative, because
the assessed value of properties is implicitly zero until they
are observed.
Our specifications all impose homogeneity of the effect of
travel-time reductions on assessed property values. It is
plausible that this effect varies along the impacted Caltrain
route—for example, it could be different in northern San
Mateo County, in which travel times are relatively short,
compared to Santa Clara County, in which travel times are
substantially longer. Unfortunately, our limited number of
observations does not provide sufficient power to allow the
estimates to vary flexibly by distance from San Francisco or
any related variable. Moreover, imposing this homogeneity
can be viewed as a (very indirect) way of taking into account
that not all travel is in fact to San Francisco, but that some
of it can be local, too, which weakens the motivation for
allowing the effect to vary by distance to San Francisco.
The number of observations within 0.25 miles of a Caltrain
station may appear very small, but one must recall that
The Economic Impact of Caltrain Modernization 38
only residential properties last sold at arm's length in either
2002 or 2006 enter the regression. Most residential prop-
erties within this radius were not sold (let alone at arm's
length) in those years, or have been sold again since then.
The number of observations increases substantially when
the 0.5 to 0.75 ring is added because these rings have a
larger area than a 0.25-mile circle, and also because the
properties closer to Caltrain stations are more likely to
be commercial.
The high levels of explanation (R2) in these regressions
stems from the extremely sharp appreciation of property
values in California between 2002 and 2006, which causes
the Aftert variable to capture an unusually large share of
the variation in assessed values.
Finally, given the structure of our data, our estimates apply
to the assessed value of the subset of properties not sold
since 2006.31 If not having been sold since that time is cor-
related with certain property characteristics, our estimate
applies to properties of that characterization. This is
unlikely to be a matter of any significance.
31 The Aftert variable captures the difference in average assessed property values for the sets of properties sold in 2002 and 2006, including any part of this difference that stems from them being different in their average characteristics.
The Bay Area Council Economic Institute is a partnership of
business with labor, government, higher education and phi-
lanthropy, that works to support the economic vitality and
competitiveness of the Bay Area and California. The
Association of Bay Area Governments is a founder and key
institutional partner. The Economic Institute also supports and
manages the Bay Area Science and Innovation Consortium
(BASIC), a partnership of Northern California’s leading scien-
tific research universities and federal and private research
laboratories. Through its economic and policy research and its
many partnerships, the Economic Institute addresses major
issues impacting the competitiveness, economic development
and quality of life of the region and the state, including infra-
structure, globalization, science and innovation, energy, and
governance. A public-private Board of Trustees oversees the
development of its products and initiatives.
The Economic Impact of Caltrain Modernization 39