Embed Size (px)
Citation preview
The Economic Impact of the Coal Industry in
Pennsylvania March 2014
Prepared for
The Pennsylvania Coal Alliance by the
Pennsylvania Economy League of Greater Pittsburgh 11 Stanwix Street, 17th Floor
Pittsburgh, Pennsylvania 15222
412.281.4783
March 2014
Economic Impact of the Coal Industry in Pennsylvania PELGP March 2014
Disclaimer
The Pennsylvania Economy League of Greater Pittsburgh, LLC. (PELGP) makes no representation, warranty or guarantee regarding the conclusions of this economic impact study. PELGP acknowledges Pennsylvania Coal Alliance shall retain ownership of all materials provided to PELGP during the data collection phase of this project.
Pennsylvania Coal Alliance acknowledges ownership in the final product. The results may be used by the both parties for advocacy, training, statistical, educational and media purposes supporting the importance of and/or impact of the Coal Industry and may not, without the express approval of all parties be sold to any third party or used for any other purpose.
Pennsylvania Coal Alliance shall not take any action that might negatively affect the distinctive quality of, or goodwill associated with, the materials, or adversely affects the reputation of the PELGP and its affiliates
Economic Impact of the Coal Industry in Pennsylvania PELGP March 2014
Executive Summary
The Pennsylvania Coal Alliance is committed to promoting and advancing the Pennsylvania Coal Industry and the economic and social benefit to the employees, businesses, communities and consumers who depend on affordable, reliable and increasingly clean energy from coal. Through aggressive advocacy and education, the Pennsylvania Coal Alliance seeks to influence public policy, public opinion, and the marketplace in support of the coal economy. The organization asked the Pennsylvania Economy League of Greater Pittsburgh, LLC (PELGP) to perform an economic impact study of the Coal Industry in Pennsylvania. This study looks at the I the Co as a baseline year unless otherwise stated.
Measuring the current economic impact of the Coal Industry
Coal Industry, as well . The current jobs within the industry, and many more in the broader economy, would not exist without the activity of the Coal Industry. Similarly, the wages paid to industry employees have an effect on the broader economy, as employees use their compensation to buy goods and services. In this report, PELGP measures the direct, indirect and induced employment created by the Coal Industry as well as the more than $4.1 billion in economic output stimulated by the activity of the industry.
The Coal Industry generates more than 36,100 jobs in Pennsylvania
and induced impacts responsible for:
Approximately 36,187 full- and part-time jobs, about 13,886 of these directly in the Coal Industry. For each direct Coal Industry job an additional 1.61 jobs are generated throughout the state.
Approximately $4.1 billion in economic output created in Pennsylvania, $2.1 billion of this directly by the Coal Industry.
The Coal Industry creates economic value in communities across Pennsylvania, with multiple company locations
The Industry makes substantial capital investments that region by utilizing advanced mining machinery that costs millions of dollars to purchase, operate and maintain while also investing in a multitude of other goods and services.
Pennsylvania has a strong concentration of manufacturers producing machinery and equipment for the industry. Pennsylvania has the largest mining machinery and equipment manufacturing industry in the country, accounting for 24
Economic Impact of the Coal Industry in Pennsylvania PELGP March 2014
Coal is a crucial energy resource In 2011, Pennsylvania produced more than 67 million tons of coal from 463 mines and refuse sites, making it the fourth largest producer of coal in the nation. This coal was shipped to 20 different states. In 2012, over $1.4 billion worth of coal and mining products produced in Pennsylvania were exported abroad, representing a 213 percent increase since 2007.
Coal is used to generate more electricity than any other resource in Pennsylvania, being responsible for about 44 percent of electricity generation. In 2011, Pennsylvania generated 227 million megawatts of electricity, which made it the second largest producer of electricity in the United States and the largest net exporter of electricity among the states.
Economic Impact of the Coal Industry in Pennsylvania PELGP March 2014
Table of Contents
1. Introduction ............................................................................................................................. 1
1.1. Origins of this report ........................................................................................................ 1
1.2 ............................................................ 1
2. Measuring the economic impact of the Coal Industry in Pennsylvania.................................. 2
2.1. Direct, indirect and induced economic impact ................................................................. 4
2.2. Methodology .................................................................................................................... 5
3. The economic impact of the Coal Industry in Pennsylvania .................................................. 6
3.1. Employment ..................................................................................................................... 7
3.2. Total Value Added ........................................................................................................... 8
3.3. Total Value Added: Labor Income................................................................................... 9
3.4. Total Value Added: Other Property Income .................................................................. 10
3.5. Total Value Added: Indirect Business Taxes ................................................................. 10
3.6. Case study: Coal transportation by rail .......................................................................... 11
3.7. Case study: Coal transportation by barge ....................................................................... 12
3.8. Average wages paid by the Pennsylvania Coal Industry ............................................... 12
4. Overview of the Coal Industry .............................................................................................. 14
4.1. Extraction ....................................................................................................................... 14
4.1.1. Production ............................................................................................................... 14
4.1.2. Underground mining ............................................................................................... 16
4.1.3. Surface mining ........................................................................................................ 17
4.1.4. Processing ............................................................................................................... 18
4.1.5. Environmental Legacy Issues ................................................................................. 18
4.1.5.1. Subsidence ........................................................................................................... 18
4.1.5.2. Water quality and reclamation ............................................................................ 19
Economic Impact of the Coal Industry in Pennsylvania PELGP March 2014
4.1.6. Safety ...................................................................................................................... 19
4.2. Transportation ................................................................................................................ 21
4.2.1. Modes of transportation .......................................................................................... 22
4.2.2. International exports ............................................................................................... 23
4.3. End Use .......................................................................................................................... 25
4.3.1. Electricity generation .............................................................................................. 25
4.3.2. Coke production ...................................................................................................... 27
4.3.3. Other industrial, commercial, and institutional uses ............................................... 27
5. Research and development ................................................................................................... 28
Appendix ....................................................................................................................................... 29
A. Change to IMPLAN methodology ..................................................................................... 29
B. Differences in method from national study ....................................................................... 29
Economic Impact of the Coal Industry in Pennsylvania PELGP March 2014 1
1. Introduction
1.1. Origins of this report The Pennsylvania Coal Alliance is committed to promoting and advancing the Pennsylvania Coal Industry and the economic and social benefit to the employees, businesses, communities and consumers who depend on affordable, reliable and increasingly clean energy from coal. Through aggressive advocacy and education, the Pennsylvania Coal Alliance seeks to influence public policy, public opinion, and the marketplace in support of the coal economy. The Pennsylvania Coal Alliance asked the Pennsylvania Economy League of Greater Pittsburgh (PELGP) to perform a study of the economic impact of the coal industry in Pennsylvania. This
2011 as a baseline year, unless otherwise stated. This report builds on research and material prepared by PELGP in a 2010 report on the economic impact of the coal industry for Families Organized to Represent the Coal Economy, Inc. (F.O.R.C.E.).
The Pennsylvania Economy League (PEL) was founded in 1936 by business and civic leaders seeking to improve the quality of government and promote economic development in Pennsylvania. PELGP, a regional branch of PEL, is the public policy research affiliate of the Allegheny Conference on Community Development. PELGP provides research and analysis on
business in the region. With a rich history of civic and community involvement and its emphasis on comparative research and policy analysis, the organization holds a statewide reputation for objectivity, integrity and consensus-building.
1.2 Coal is a combustible black rock composed primarily of carbon and hydrocarbons from compressed plant material that was buried under a large amount of dirt and mud. Over many millions of years, the materials altered to form layers of solid rock. The elements in coal, carbon, hydrogen, and oxygen with smaller amounts of sulfur, nitrogen, phosphorus, and calcium, release energy when they break down during combustion. This makes coal an excellent and abundant source of energy.
Coal has a long history in Pennsylvania, dating back to the mid-18th century. It powered the American Industrial Revolution and helped Pennsylvan s flourish.
Pennsylvania coal is used to generate electricity and in manufacturing processes. It is widely exported to other states and countries. The extraction, processing, transportation and use of coal in Pennsylvania create economic activity that contributes to the economy vitality. This report explores these economic impacts.
Economic Impact of the Coal Industry in Pennsylvania PELGP March 2014 2
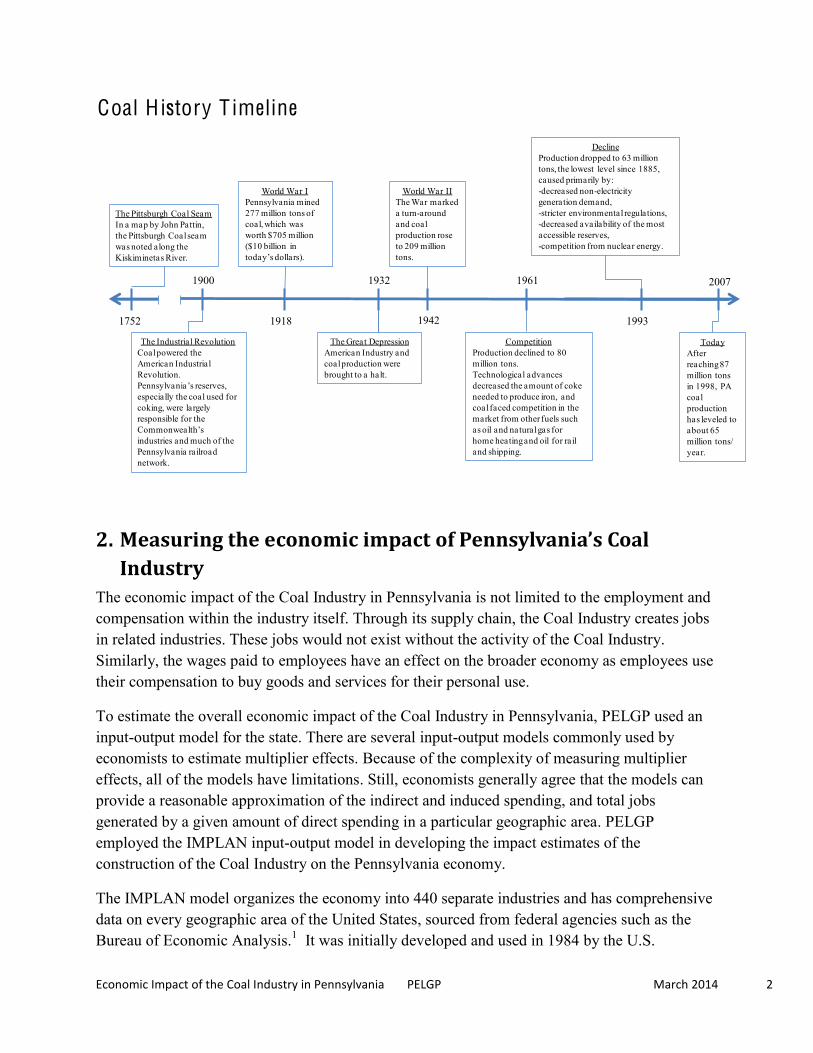
Coal H istory T imeline
2. Measuring the economic impact of Coal Industry
The economic impact of the Coal Industry in Pennsylvania is not limited to the employment and compensation within the industry itself. Through its supply chain, the Coal Industry creates jobs in related industries. These jobs would not exist without the activity of the Coal Industry. Similarly, the wages paid to employees have an effect on the broader economy as employees use their compensation to buy goods and services for their personal use.
To estimate the overall economic impact of the Coal Industry in Pennsylvania, PELGP used an input-output model for the state. There are several input-output models commonly used by economists to estimate multiplier effects. Because of the complexity of measuring multiplier effects, all of the models have limitations. Still, economists generally agree that the models can provide a reasonable approximation of the indirect and induced spending, and total jobs generated by a given amount of direct spending in a particular geographic area. PELGP employed the IMPLAN input-output model in developing the impact estimates of the construction of the Coal Industry on the Pennsylvania economy.
The IMPLAN model organizes the economy into 440 separate industries and has comprehensive data on every geographic area of the United States, sourced from federal agencies such as the Bureau of Economic Analysis.1 It was initially developed and used in 1984 by the U.S.
The Pittsburgh Coal SeamIn a map by John Pattin, the Pittsburgh Coal seam was noted along the Kiskiminetas River.
The Industrial RevolutionCoal powered the American Industrial Revolution.
reserves, especially the coal used for coking, were largely responsible for the
industries and much of the Pennsylvania railroad network.
World War IPennsylvania mined 277 million tons of coal, which was worth $705 million ($10 billion in
The Great DepressionAmerican Industry and coal production were brought to a halt.
World War IIThe War marked a turn-around and coal production rose to 209 million tons.
CompetitionProduction declined to 80 million tons. Technological advances decreased the amount of coke needed to produce iron, and coal faced competition in the market from other fuels such as oil and natural gas for home heating and oil for rail and shipping.
DeclineProduction dropped to 63 million tons, the lowest level since 1885, caused primarily by: -decreased non-electricity generation demand,-stricter environmental regulations,-decreased availability of the most accessible reserves,-competition from nuclear energy.
TodayAfter reaching 87 million tons in 1998, PA coal production has leveled to about 65 million tons/ year.
1752
1900
1918
1932
1942
1961
1993
2007
Economic Impact of the Coal Industry in Pennsylvania PELGP March 2014 3
Department of Agriculture, in conjunction with the University of Minnesota. In 1993, the technology was transferred to a new company, the Minnesota IMPLAN Group, Inc. (MIG, Inc.). Today, their tools are in use by more than 1,000 public and private institutions.
PELGP used the RIMS model in a previous report to determine the employment impact and economic impact of the Coal Industry. The RIMS model was used by the National Mining Association for its analysis. Though PELGP generally uses the IMPLAN model to conduct economic impact reports, the RIMS model was used to stay consistent with the national report. The latest National Mining Association report, released in 2012, switched to an IMPLAN analysis. PELGP considered both methods and decided to use the IMPLAN model for this report, with approval from the Pennsylvania Coal Alliance. In addition to being consistent with the most recent NMA report, the IMPLAN model has other benefits over the RIMS. The IMPLAN model provides a more accurate employment impact because it includes employees contracted by the Coal Industry. The model calculates the total value added to the economy as opposed to the output number reporshare of total state GDP for the analysis year and avoids double counting of inputs.
Economic Impact of the Coal Industry in Pennsylvania PELGP March 2014 4
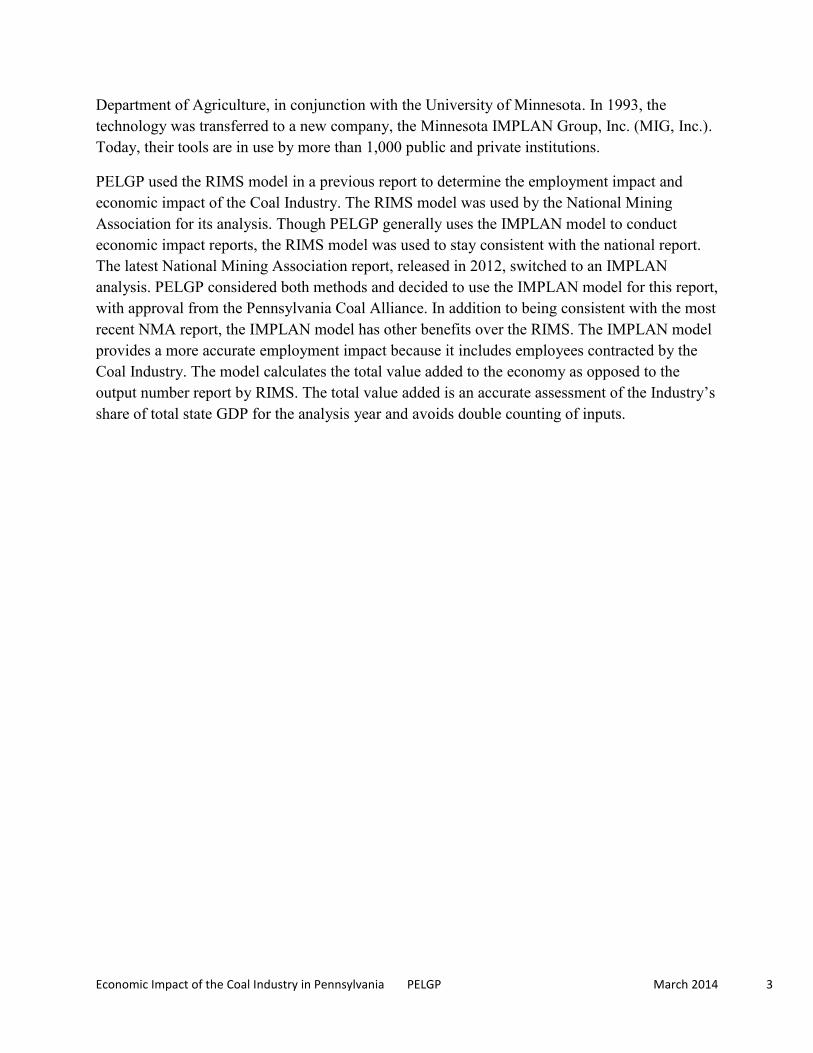
2.1. Direct, indirect and induced economic impact The economic impact of the Coal Industry on the Pennsylvania economy is not limited to the employment and other economic activity directly related to the Coal Industry. Through its supply chain, the Coal Industry creates jobs in related industries, and some of these jobs would not exist without the activity of the Coal Industry. Similarly, the wages paid to employees working in the Coal Industry have an effect on the broader economy as employees use their compensation to buy goods and services.
F igure 1 - The Coal Industry has an impact on the broader economy through indirect and induced spending
The Direct Spending of the Coal Industry in the Pennsylvania economy is the total the industry spends on payroll, goods (such as equipment) and services (such as engineering contracts). The money spent by the Coal Industry in its supply chain is spent again by local businesses. Businesses make their own purchases and pay employees termed Indirect Spending. Employees throughout the supply chain use their salaries and wages to purchase goods and services from other businesses for personal consumption termed Induced Spending. A chain
Direct Impact(Direct E ffect)
Mining Coal
Indi rect Impact(Supply Chain Effect)
Commercial & industrial machinery
manufacturing
Contractors and drillers
Architecture& engineering
services
InsuranceGovernment(inspectors
and permitting)
Rail transportation
Induced Impact (Consumption E ffect)
Food and drink
Housing
Utilities
Entertainment
TravelHigher Education
Barge transportation
Economic Impact of the Coal Industry in Pennsylvania PELGP March 2014 5
reaction of indirect and induced spending continues, with subsequent rounds of additional spending gradually diminished through savings, taxes and expenditures made outside the state. This economic ripple effect is measured by IMPLAN and other input-output economic models, using a series of multipliers to provide estimates of the number of times each dollar of input, or direct spending, cycles through the economy in terms of indirect and induced output, or additional spending, personal income and employment. Figure 1 presents an illustration of some direct, indirect and induced impacts of the Coal Industry.
2.2. Methodology PELGP modeled the impact of the Pennsylvania Coal Industry within Pennsylvania. The Pennsylvania Coal Industry will have economic impacts outside state and Coal Industry companies located outside Pennsylvania will have an impact on the Pennsylvania economy, but for purposes of this analysis, these impacts were not considered. Studies done at the national level on the impact of the Coal Industry on Pennsylvania may not align with these results because of this difference in geographic scope. Additionally, national studies have used a variation on the IMPLAN methodology that results in a greater employment impact. The differences in method and results are discussed in the Appendix. To determine the impact of the Coal Industry in Pennsylvania, PELGP defined the core industry
mining coal IMPLAN industry sector. support activities for other mining were also considered for inclusion, but it was decided that a focused approach more accurately captured the Coal Industry supply chain. The IMPLAN model determines the impact that each industry has on the economy, including employment, total value added, employee compensation, proprietor income and property income. These are defined as follows:
Employment Includes both full- and part-time workers. Total Value Added The contribution of a project to the economy. It is calculated by
taking the sum of the following components: o Labor Income made up of:
Employee Compensation Payroll costs for the industry, including salaries and benefits
Proprietor Income Payments received by self-employed individuals as income, including income received by private business owners
o O ther Investor and Property Owner Income Payments for rents received on properties, royalties from contracts, dividends paid by corporations and corporate profits earned by corporations
o Indirect Business Taxes Includes taxes on sales, property and production but not payroll taxes or end of year income or corporate taxes.
Economic Impact of the Coal Industry in Pennsylvania PELGP March 2014 6
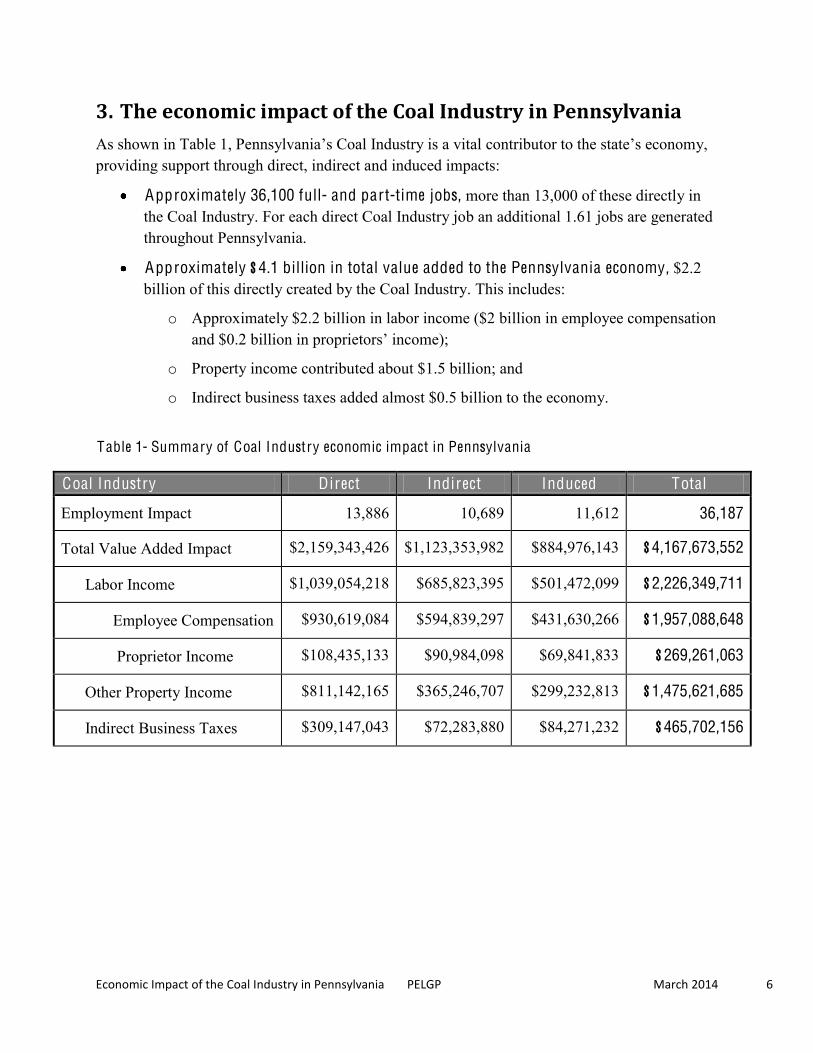
3. The economic impact of the Coal Industry in Pennsylvania As shown in Table 1providing support through direct, indirect and induced impacts:
Approximately 36,100 full- and part-time jobs, more than 13,000 of these directly in the Coal Industry. For each direct Coal Industry job an additional 1.61 jobs are generated throughout Pennsylvania.
Approximately $4.1 billion in total value added to the Pennsylvania economy, $2.2 billion of this directly created by the Coal Industry. This includes:
o Approximately $2.2 billion in labor income ($2 billion in employee compensation and $0.2 );
o Property income contributed about $1.5 billion; and
o Indirect business taxes added almost $0.5 billion to the economy.
Table 1- Summary of Coal Industry economic impact in Pennsylvania
Coal Industry Direct Indirect Induced Total
Employment Impact 13,886 10,689 11,612 36,187
Total Value Added Impact $2,159,343,426 $1,123,353,982 $884,976,143 $4,167,673,552
Labor Income $1,039,054,218 $685,823,395 $501,472,099 $2,226,349,711
Employee Compensation $930,619,084 $594,839,297 $431,630,266 $1,957,088,648
Proprietor Income $108,435,133 $90,984,098 $69,841,833 $269,261,063
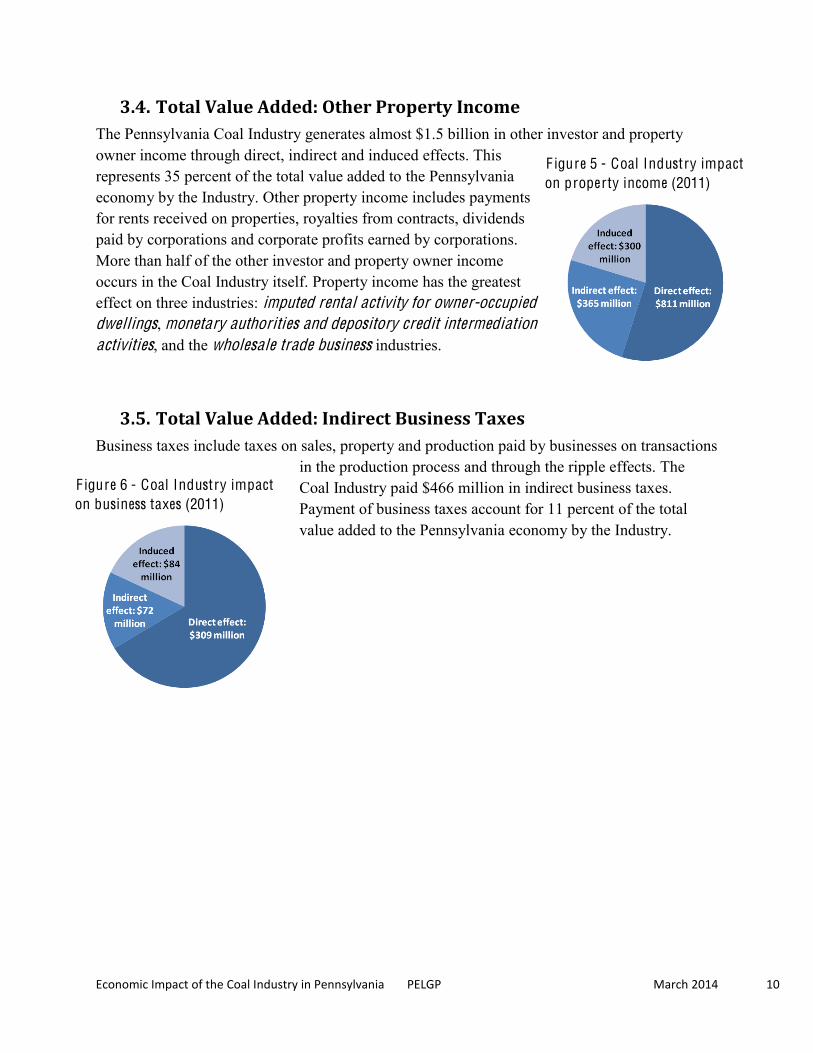
Other Property Income $811,142,165 $365,246,707 $299,232,813 $1,475,621,685
Indirect Business Taxes $309,147,043 $72,283,880 $84,271,232 $465,702,156
Economic Impact of the Coal Industry in Pennsylvania PELGP March 2014 7
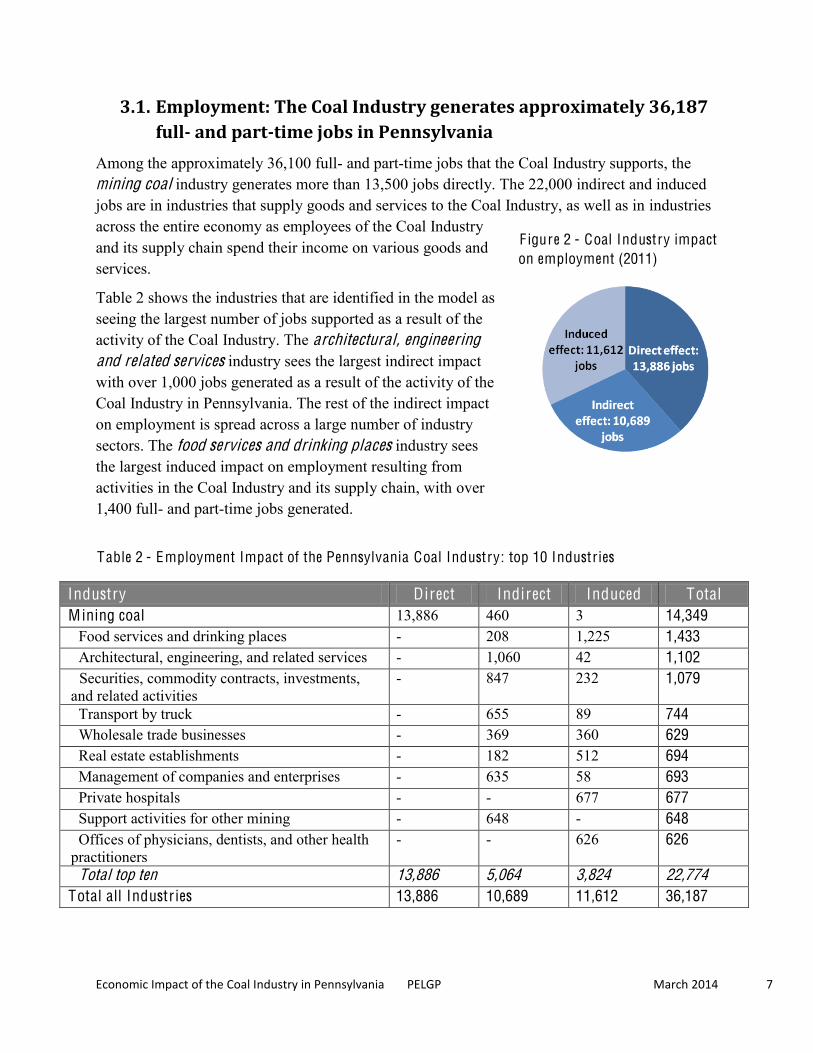
3.1. Employment: The Coal Industry generates approximately 36,187 full- and part-time jobs in Pennsylvania
Among the approximately 36,100 full- and part-time jobs that the Coal Industry supports, the mining coal industry generates more than 13,500 jobs directly. The 22,000 indirect and induced jobs are in industries that supply goods and services to the Coal Industry, as well as in industries across the entire economy as employees of the Coal Industry and its supply chain spend their income on various goods and services.
Table 2 shows the industries that are identified in the model as seeing the largest number of jobs supported as a result of the activity of the Coal Industry. The architectural, engineering and related services industry sees the largest indirect impact with over 1,000 jobs generated as a result of the activity of the Coal Industry in Pennsylvania. The rest of the indirect impact on employment is spread across a large number of industry sectors. The food services and drinking places industry sees the largest induced impact on employment resulting from activities in the Coal Industry and its supply chain, with over 1,400 full- and part-time jobs generated.
Table 2 - Employment Impact of the Pennsylvania Coal Industry: top 10 Industries
Industry Direct Indirect Induced Total M ining coal 13,886 460 3 14,349 Food services and drinking places - 208 1,225 1,433 Architectural, engineering, and related services - 1,060 42 1,102 Securities, commodity contracts, investments, and related activities
- 847 232 1,079
Transport by truck - 655 89 744 Wholesale trade businesses - 369 360 629 Real estate establishments - 182 512 694 Management of companies and enterprises - 635 58 693 Private hospitals - - 677 677 Support activities for other mining - 648 - 648 Offices of physicians, dentists, and other health practitioners
- - 626 626
Total top ten 13,886 5,064 3,824 22,774 Total all Industr ies 13,886 10,689 11,612 36,187
F igure 2 - Coal Industry impact on employment (2011)
Economic Impact of the Coal Industry in Pennsylvania PELGP March 2014 8
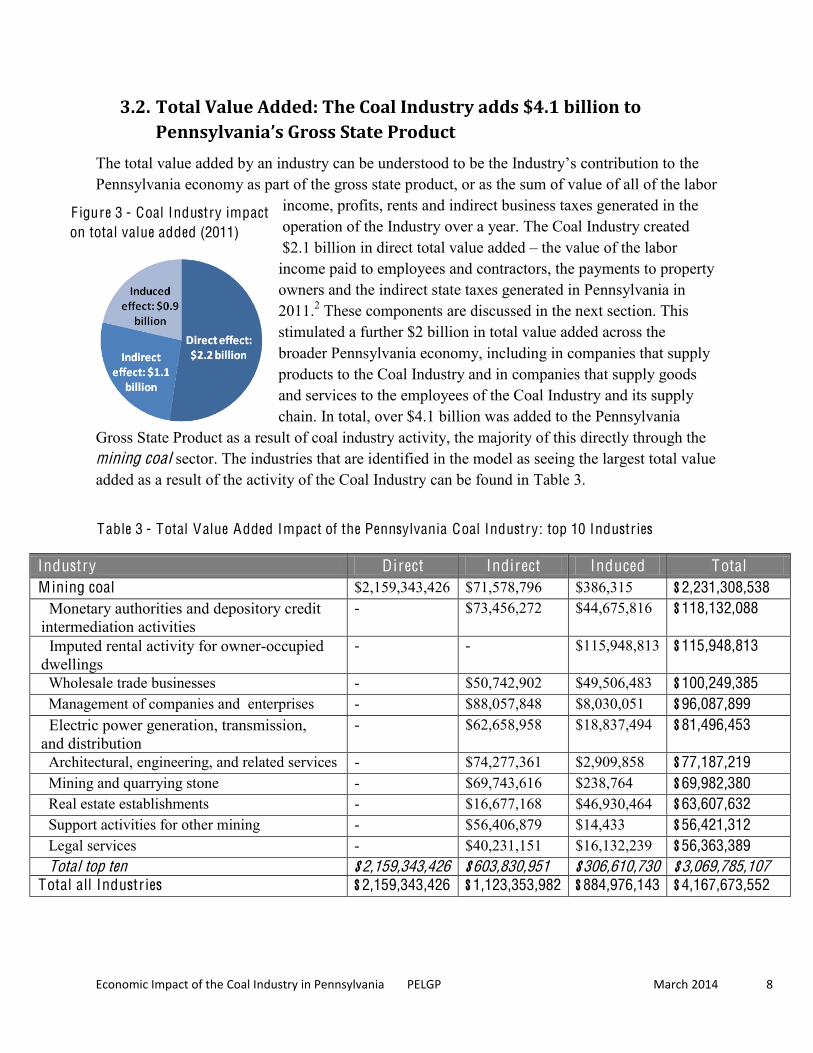
3.2. Total Value Added: The Coal Industry adds $4.1 billion to Pennsylvania
the Pennsylvania economy as part of the gross state product, or as the sum of value of all of the labor
income, profits, rents and indirect business taxes generated in the operation of the Industry over a year. The Coal Industry created $2.1 billion in direct total value added the value of the labor income paid to employees and contractors, the payments to property owners and the indirect state taxes generated in Pennsylvania in 2011.2 These components are discussed in the next section. This stimulated a further $2 billion in total value added across the broader Pennsylvania economy, including in companies that supply products to the Coal Industry and in companies that supply goods and services to the employees of the Coal Industry and its supply chain. In total, over $4.1 billion was added to the Pennsylvania
Gross State Product as a result of coal industry activity, the majority of this directly through the mining coal sector. The industries that are identified in the model as seeing the largest total value added as a result of the activity of the Coal Industry can be found in Table 3.
Table 3 - Total Value Added Impact of the Pennsylvania Coal Industry: top 10 Industr ies
Industry Direct Indirect Induced Total M ining coal $2,159,343,426 $71,578,796 $386,315 $2,231,308,538 Monetary authorities and depository credit intermediation activities
- $73,456,272 $44,675,816 $118,132,088
Imputed rental activity for owner-occupied dwellings
- - $115,948,813 $115,948,813
Wholesale trade businesses - $50,742,902 $49,506,483 $100,249,385 Management of companies and enterprises - $88,057,848 $8,030,051 $96,087,899 Electric power generation, transmission, and distribution
- $62,658,958 $18,837,494 $81,496,453
Architectural, engineering, and related services - $74,277,361 $2,909,858 $77,187,219 Mining and quarrying stone - $69,743,616 $238,764 $69,982,380 Real estate establishments - $16,677,168 $46,930,464 $63,607,632 Support activities for other mining - $56,406,879 $14,433 $56,421,312 Legal services - $40,231,151 $16,132,239 $56,363,389 Total top ten $2,159,343,426 $603,830,951 $306,610,730 $3,069,785,107 Total all Industr ies $2,159,343,426 $1,123,353,982 $884,976,143 $4,167,673,552
F igure 3 - Coal Industry impact on total value added (2011)
Economic Impact of the Coal Industry in Pennsylvania PELGP March 2014 9
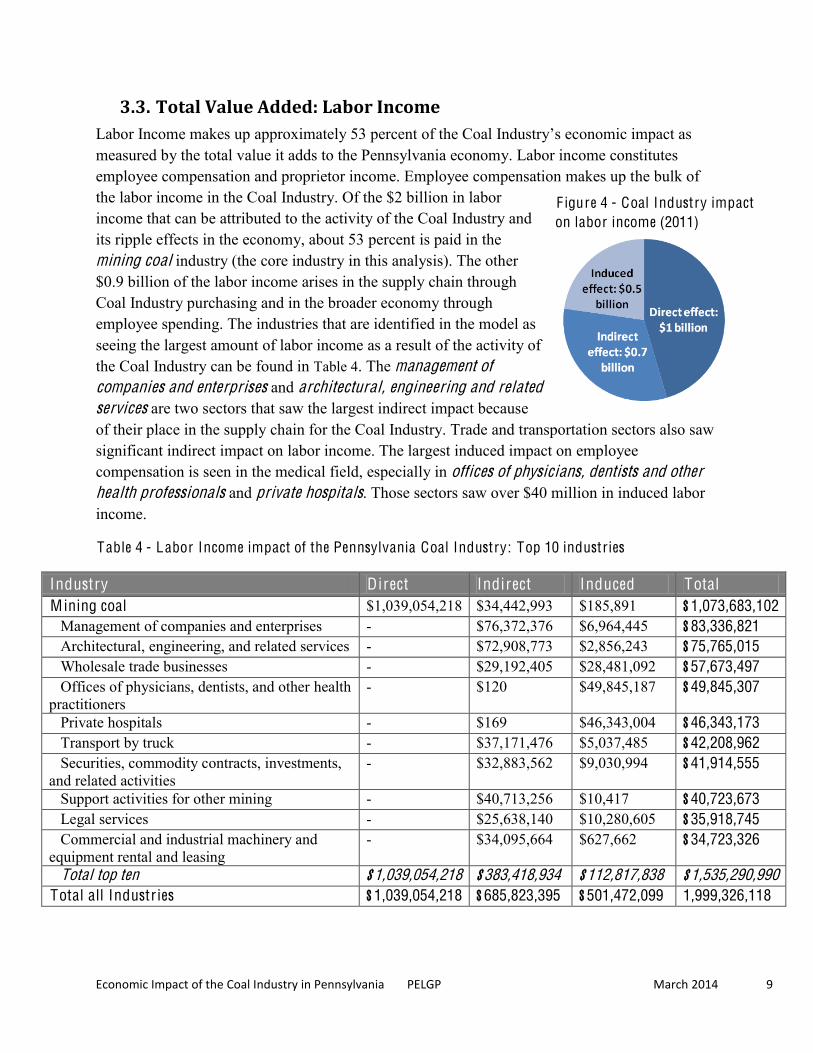
3.3. Total Value Added: Labor Income
measured by the total value it adds to the Pennsylvania economy. Labor income constitutes employee compensation and proprietor income. Employee compensation makes up the bulk of the labor income in the Coal Industry. Of the $2 billion in labor income that can be attributed to the activity of the Coal Industry and its ripple effects in the economy, about 53 percent is paid in the mining coal industry (the core industry in this analysis). The other $0.9 billion of the labor income arises in the supply chain through Coal Industry purchasing and in the broader economy through employee spending. The industries that are identified in the model as seeing the largest amount of labor income as a result of the activity of the Coal Industry can be found in Table 4. The management of companies and enterprises and architectural, engineering and related services are two sectors that saw the largest indirect impact because of their place in the supply chain for the Coal Industry. Trade and transportation sectors also saw significant indirect impact on labor income. The largest induced impact on employee compensation is seen in the medical field, especially in offices of physicians, dentists and other health professionals and private hospitals. Those sectors saw over $40 million in induced labor income.
Table 4 - Labor Income impact of the Pennsylvania Coal Industry: Top 10 industries
Industry Direct Indirect Induced Total M ining coal $1,039,054,218 $34,442,993 $185,891 $1,073,683,102 Management of companies and enterprises - $76,372,376 $6,964,445 $83,336,821 Architectural, engineering, and related services - $72,908,773 $2,856,243 $75,765,015 Wholesale trade businesses - $29,192,405 $28,481,092 $57,673,497 Offices of physicians, dentists, and other health practitioners
- $120 $49,845,187 $49,845,307
Private hospitals - $169 $46,343,004 $46,343,173 Transport by truck - $37,171,476 $5,037,485 $42,208,962 Securities, commodity contracts, investments, and related activities
- $32,883,562
$9,030,994 $41,914,555
Support activities for other mining - $40,713,256 $10,417 $40,723,673 Legal services - $25,638,140 $10,280,605 $35,918,745 Commercial and industrial machinery and equipment rental and leasing
- $34,095,664
$627,662 $34,723,326
Total top ten $1,039,054,218 $383,418,934 $112,817,838 $1,535,290,990 Total all Industr ies $1,039,054,218 $685,823,395 $501,472,099 1,999,326,118
F igure 4 - Coal Industry impact on labor income (2011)
Economic Impact of the Coal Industry in Pennsylvania PELGP March 2014 10
3.4. Total Value Added: Other Property Income The Pennsylvania Coal Industry generates almost $1.5 billion in other investor and property owner income through direct, indirect and induced effects. This represents 35 percent of the total value added to the Pennsylvania economy by the Industry. Other property income includes payments for rents received on properties, royalties from contracts, dividends paid by corporations and corporate profits earned by corporations. More than half of the other investor and property owner income occurs in the Coal Industry itself. Property income has the greatest effect on three industries: imputed rental activity for owner-occupied dwellings, monetary authorities and depository credit intermediation activities, and the wholesale trade business industries.
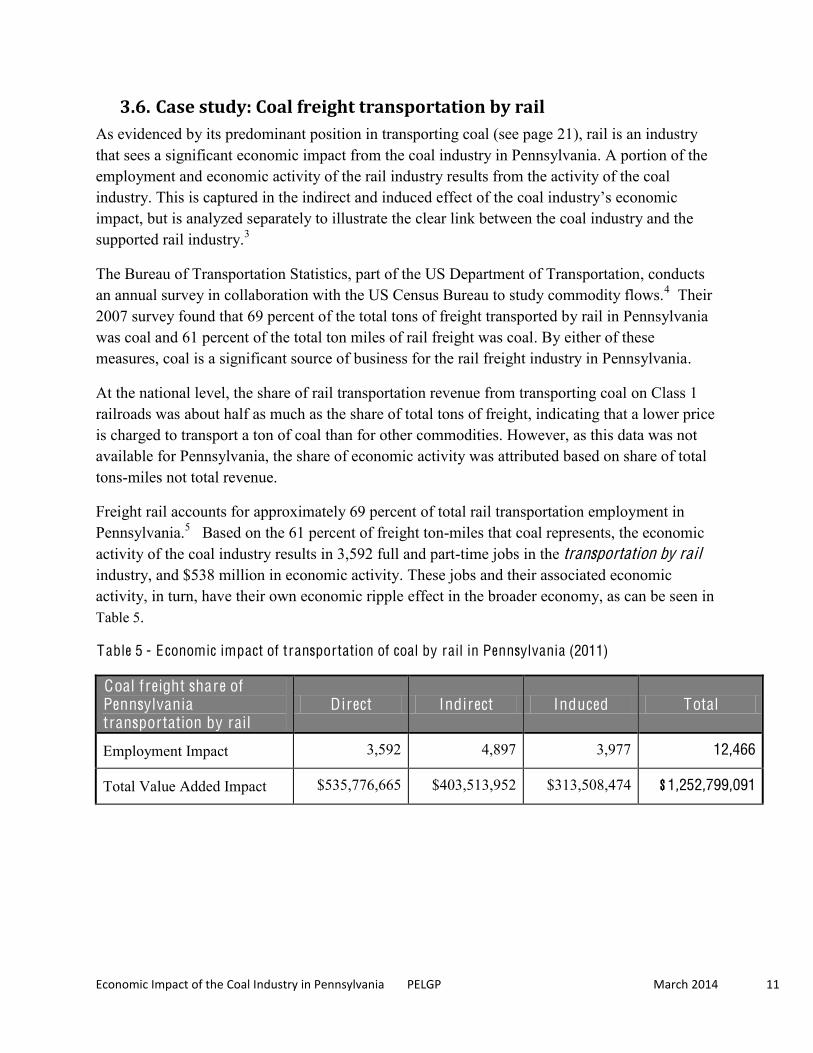
3.5. Total Value Added: Indirect Business Taxes Business taxes include taxes on sales, property and production paid by businesses on transactions
in the production process and through the ripple effects. The Coal Industry paid $466 million in indirect business taxes. Payment of business taxes account for 11 percent of the total value added to the Pennsylvania economy by the Industry.
F igure 5 - Coal Industry impact on property income (2011)
F igure 6 - Coal Industry impact on business taxes (2011)
Economic Impact of the Coal Industry in Pennsylvania PELGP March 2014 11
3.6. Case study: Coal freight transportation by rail As evidenced by its predominant position in transporting coal (see page 21), rail is an industry that sees a significant economic impact from the coal industry in Pennsylvania. A portion of the employment and economic activity of the rail industry results from the activity of the coal industry. This is impact, but is analyzed separately to illustrate the clear link between the coal industry and the supported rail industry.3
The Bureau of Transportation Statistics, part of the US Department of Transportation, conducts an annual survey in collaboration with the US Census Bureau to study commodity flows.4 Their 2007 survey found that 69 percent of the total tons of freight transported by rail in Pennsylvania was coal and 61 percent of the total ton miles of rail freight was coal. By either of these measures, coal is a significant source of business for the rail freight industry in Pennsylvania.
At the national level, the share of rail transportation revenue from transporting coal on Class 1 railroads was about half as much as the share of total tons of freight, indicating that a lower price is charged to transport a ton of coal than for other commodities. However, as this data was not available for Pennsylvania, the share of economic activity was attributed based on share of total tons-miles not total revenue.
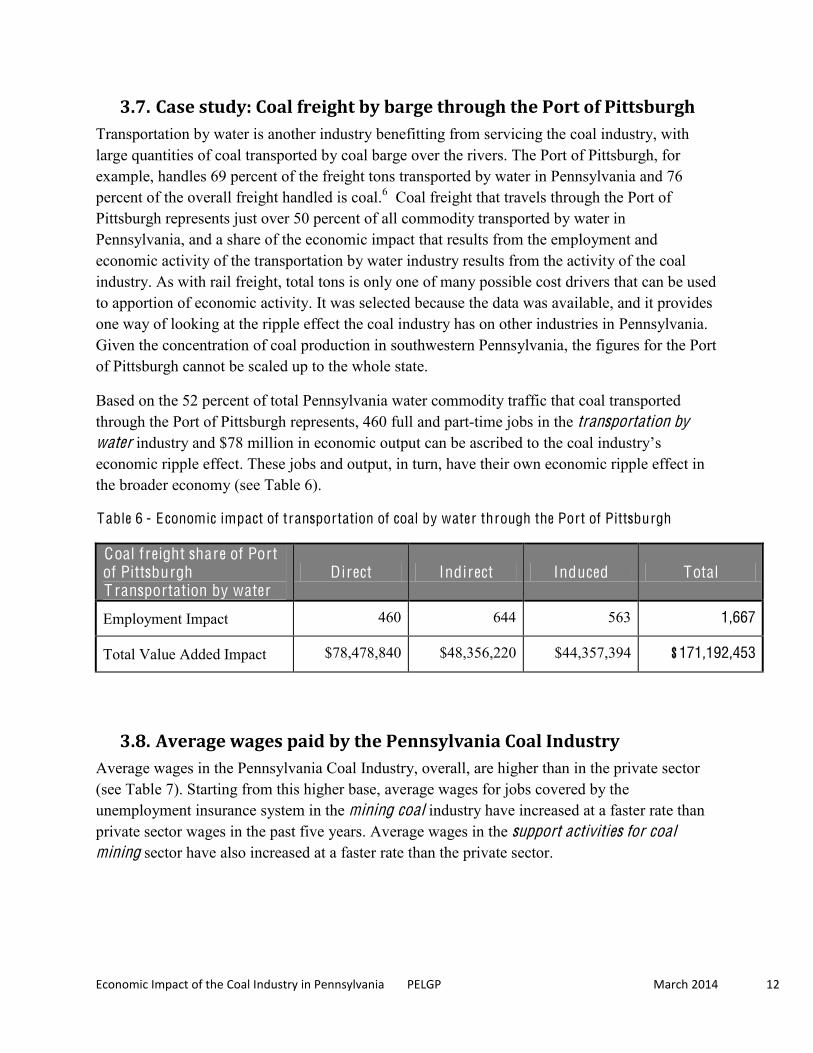
Freight rail accounts for approximately 69 percent of total rail transportation employment in Pennsylvania.5 Based on the 61 percent of freight ton-miles that coal represents, the economic activity of the coal industry results in 3,592 full and part-time jobs in the transportation by rail industry, and $538 million in economic activity. These jobs and their associated economic activity, in turn, have their own economic ripple effect in the broader economy, as can be seen in Table 5.
Table 5 - Economic impact of transportation of coal by rail in Pennsylvania (2011)
Coal freight share of Pennsylvania transportation by rail
Direct Indirect Induced Total
Employment Impact 3,592 4,897 3,977 12,466
Total Value Added Impact $535,776,665 $403,513,952 $313,508,474 $1,252,799,091
Economic Impact of the Coal Industry in Pennsylvania PELGP March 2014 12
3.7. Case study: Coal freight by barge through the Port of Pittsburgh Transportation by water is another industry benefitting from servicing the coal industry, with large quantities of coal transported by coal barge over the rivers. The Port of Pittsburgh, for example, handles 69 percent of the freight tons transported by water in Pennsylvania and 76 percent of the overall freight handled is coal.6 Coal freight that travels through the Port of Pittsburgh represents just over 50 percent of all commodity transported by water in Pennsylvania, and a share of the economic impact that results from the employment and economic activity of the transportation by water industry results from the activity of the coal industry. As with rail freight, total tons is only one of many possible cost drivers that can be used to apportion of economic activity. It was selected because the data was available, and it provides one way of looking at the ripple effect the coal industry has on other industries in Pennsylvania. Given the concentration of coal production in southwestern Pennsylvania, the figures for the Port of Pittsburgh cannot be scaled up to the whole state.
Based on the 52 percent of total Pennsylvania water commodity traffic that coal transported through the Port of Pittsburgh represents, 460 full and part-time jobs in the transportation by water industry and $78 million in economic output can be ascribed to economic ripple effect. These jobs and output, in turn, have their own economic ripple effect in the broader economy (see Table 6).
Table 6 - Economic impact of transportation of coal by water through the Port of Pittsburgh
Coal freight share of Port of Pittsburgh T ransportation by water
Direct Indirect Induced Total
Employment Impact 460 644 563 1,667
Total Value Added Impact $78,478,840 $48,356,220 $44,357,394 $171,192,453
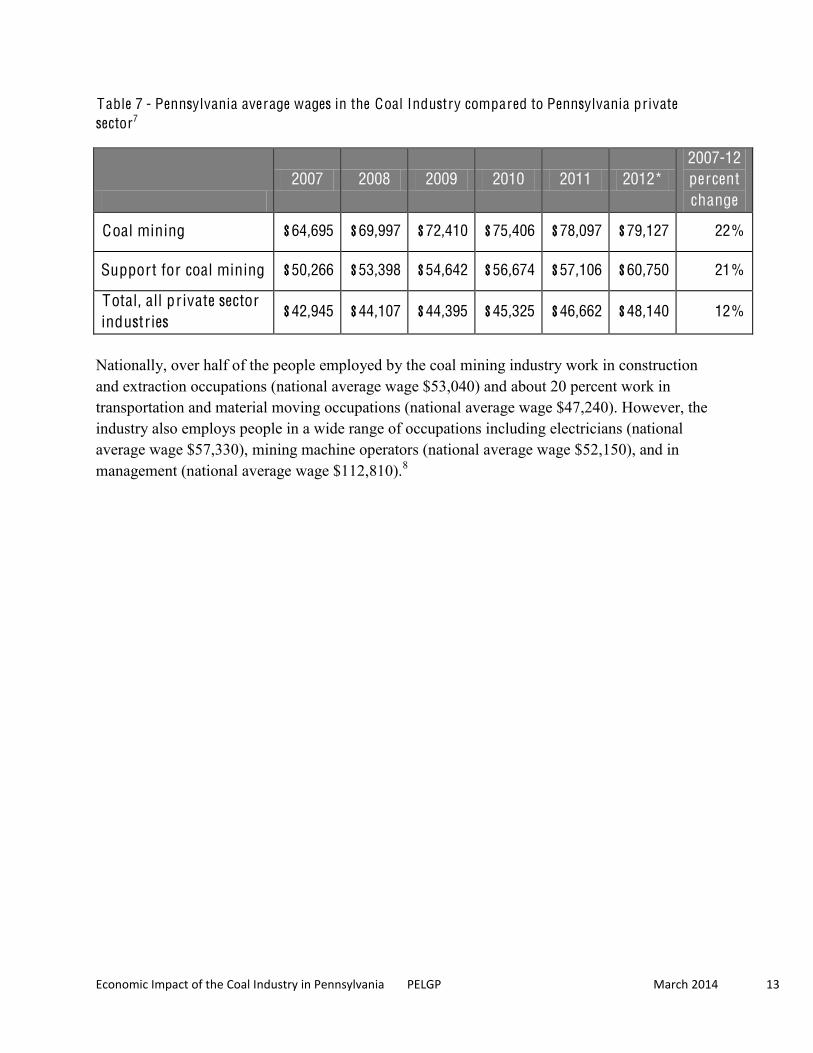
3.8. Average wages paid by the Pennsylvania Coal Industry Average wages in the Pennsylvania Coal Industry, overall, are higher than in the private sector (see Table 7). Starting from this higher base, average wages for jobs covered by the unemployment insurance system in the mining coal industry have increased at a faster rate than private sector wages in the past five years. Average wages in the support activities for coal mining sector have also increased at a faster rate than the private sector.
Economic Impact of the Coal Industry in Pennsylvania PELGP March 2014 13
Table 7 - Pennsylvania average wages in the Coal Industry compared to Pennsylvania private sector7
2007 2008 2009 2010 2011 2012*
2007-12 percent change
Coal mining $64,695 $69,997 $72,410 $75,406 $78,097 $79,127 22%
Support for coal mining $50,266 $53,398 $54,642 $56,674 $57,106 $60,750 21%
Total, all private sector industries
$42,945 $44,107 $44,395 $45,325 $46,662 $48,140 12%
Nationally, over half of the people employed by the coal mining industry work in construction and extraction occupations (national average wage $53,040) and about 20 percent work in transportation and material moving occupations (national average wage $47,240). However, the industry also employs people in a wide range of occupations including electricians (national average wage $57,330), mining machine operators (national average wage $52,150), and in management (national average wage $112,810).8
Economic Impact of the Coal Industry in Pennsylvania PELGP March 2014 14
4. Overview of the Coal Industry
4.1. Extraction
4.1.1. Production A number of different underground and surface methods are used to extract coal. The use of each method is dependent on a number of factors including the surface topography, the nature of the coal seam, property ownership, regulations and the economic characteristics of each location.
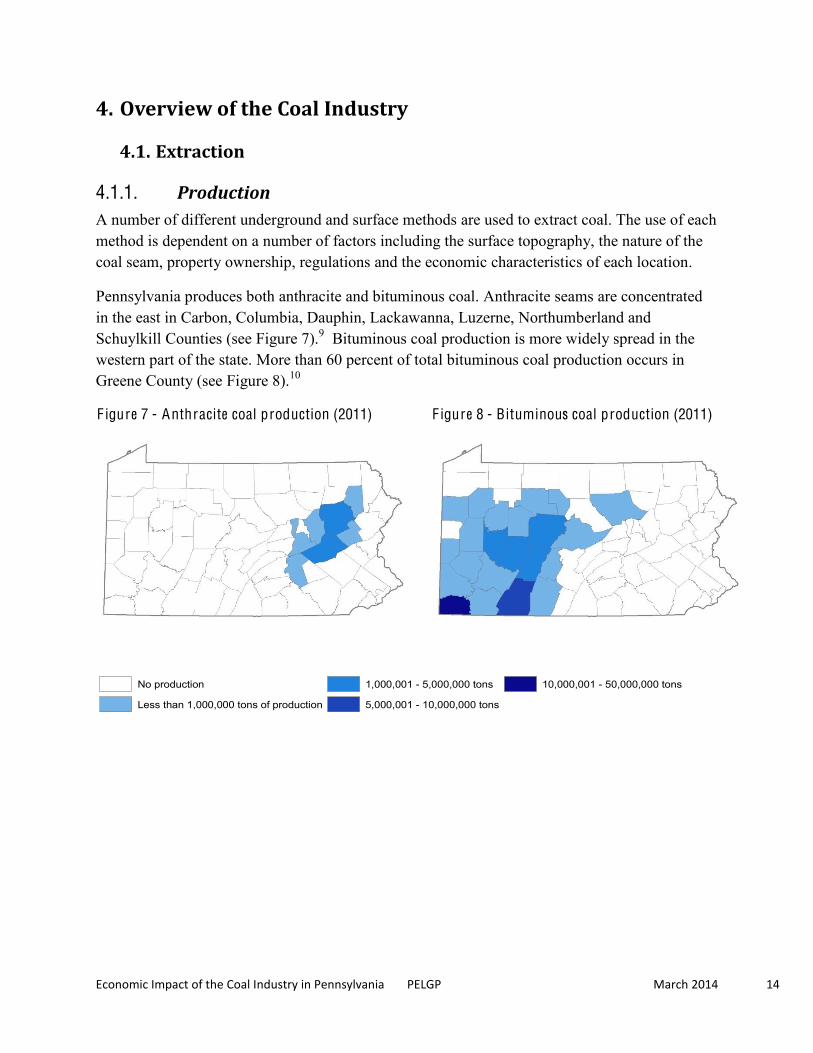
Pennsylvania produces both anthracite and bituminous coal. Anthracite seams are concentrated in the east in Carbon, Columbia, Dauphin, Lackawanna, Luzerne, Northumberland and Schuylkill Counties (see Figure 7).9 Bituminous coal production is more widely spread in the western part of the state. More than 60 percent of total bituminous coal production occurs in Greene County (see Figure 8).10
F igure 7 - Anthracite coal production (2011)
F igure 8 - Bituminous coal production (2011)
LegendNo production
Less than 1,000,000 tons of production
1,000,001 - 5,000,000 tons
5,000,001 - 10,000,000 tons
10,000,001 - 50,000,000 tons
Economic Impact of the Coal Industry in Pennsylvania PELGP March 2014 15
Table 8 - 2011 Coal Production in Pennsylvania
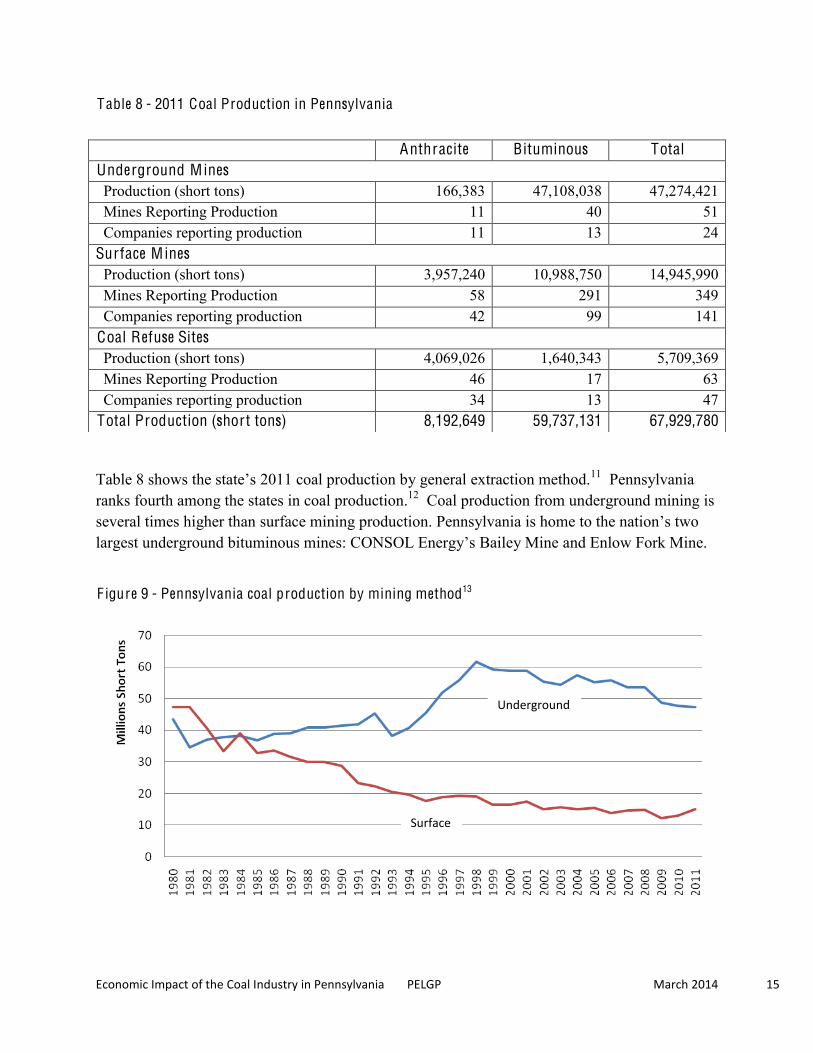
Table 8 shows t 2011 coal production by general extraction method.11 Pennsylvania ranks fourth among the states in coal production.12 Coal production from underground mining is several times higher than surface mining production. Pennsylvania large
F igure 9 - Pennsylvania coal production by mining method13
Anthracite Bituminous Total Underground Mines Production (short tons) 166,383 47,108,038 47,274,421 Mines Reporting Production 11 40 51 Companies reporting production 11 13 24 Surface M ines Production (short tons) 3,957,240 10,988,750 14,945,990 Mines Reporting Production 58 291 349 Companies reporting production 42 99 141 Coal Refuse Sites Production (short tons) 4,069,026 1,640,343 5,709,369 Mines Reporting Production 46 17 63 Companies reporting production 34 13 47 Total Production (short tons) 8,192,649 59,737,131 67,929,780
Underground
Surface
Economic Impact of the Coal Industry in Pennsylvania PELGP March 2014 16
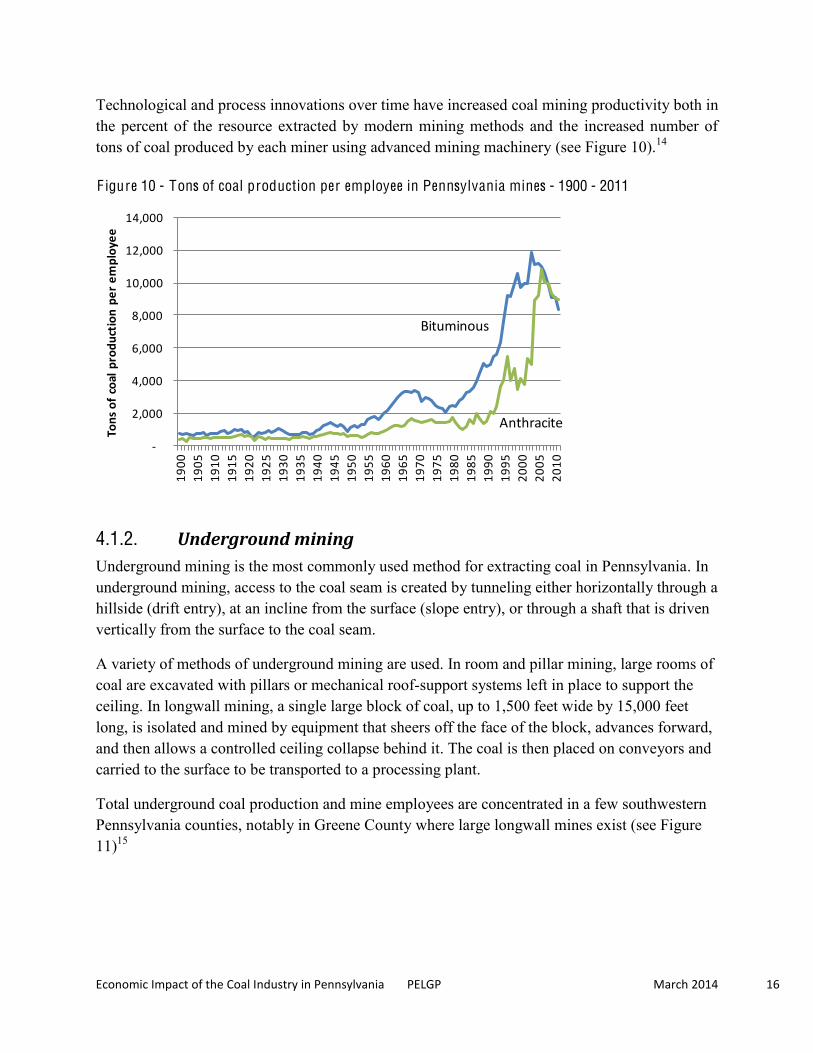
Technological and process innovations over time have increased coal mining productivity both in the percent of the resource extracted by modern mining methods and the increased number of tons of coal produced by each miner using advanced mining machinery (see Figure 10).14
4.1.2. Underground mining Underground mining is the most commonly used method for extracting coal in Pennsylvania. In underground mining, access to the coal seam is created by tunneling either horizontally through a hillside (drift entry), at an incline from the surface (slope entry), or through a shaft that is driven vertically from the surface to the coal seam.
A variety of methods of underground mining are used. In room and pillar mining, large rooms of coal are excavated with pillars or mechanical roof-support systems left in place to support the ceiling. In longwall mining, a single large block of coal, up to 1,500 feet wide by 15,000 feet long, is isolated and mined by equipment that sheers off the face of the block, advances forward, and then allows a controlled ceiling collapse behind it. The coal is then placed on conveyors and carried to the surface to be transported to a processing plant.
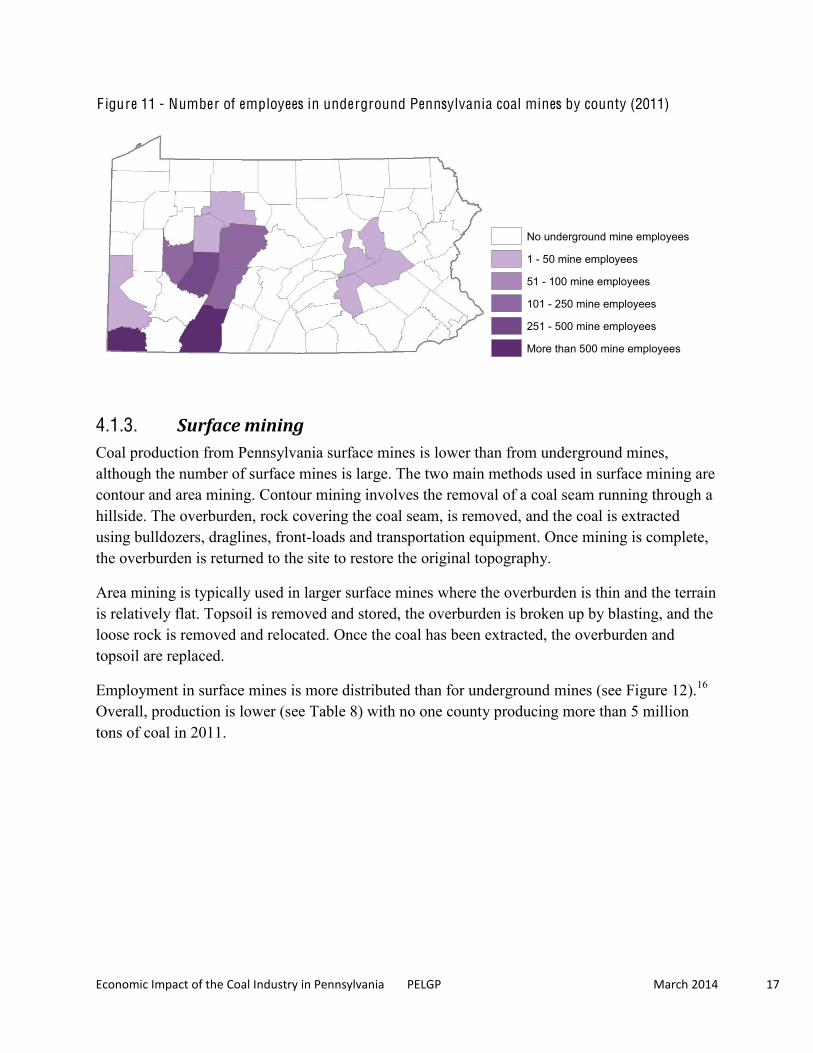
Total underground coal production and mine employees are concentrated in a few southwestern Pennsylvania counties, notably in Greene County where large longwall mines exist (see Figure 11)15
-‐
2,000
4,000
6,000
8,000
10,000
12,000
14,000
1900
1905
1910
1915
1920
1925
1930
1935
1940
1945
1950
1955
1960
1965
1970
1975
1980
1985
1990
1995
2000
2005
2010
Tons of coal production per employee
Bituminous
Anthracite
F igure 10 - Tons of coal production per employee in Pennsylvania mines - 1900 - 2011
Economic Impact of the Coal Industry in Pennsylvania PELGP March 2014 17
F igure 11 - Number of employees in underground Pennsylvania coal mines by county (2011)
4.1.3. Surface mining Coal production from Pennsylvania surface mines is lower than from underground mines, although the number of surface mines is large. The two main methods used in surface mining are contour and area mining. Contour mining involves the removal of a coal seam running through a hillside. The overburden, rock covering the coal seam, is removed, and the coal is extracted using bulldozers, draglines, front-loads and transportation equipment. Once mining is complete, the overburden is returned to the site to restore the original topography.
Area mining is typically used in larger surface mines where the overburden is thin and the terrain is relatively flat. Topsoil is removed and stored, the overburden is broken up by blasting, and the loose rock is removed and relocated. Once the coal has been extracted, the overburden and topsoil are replaced.
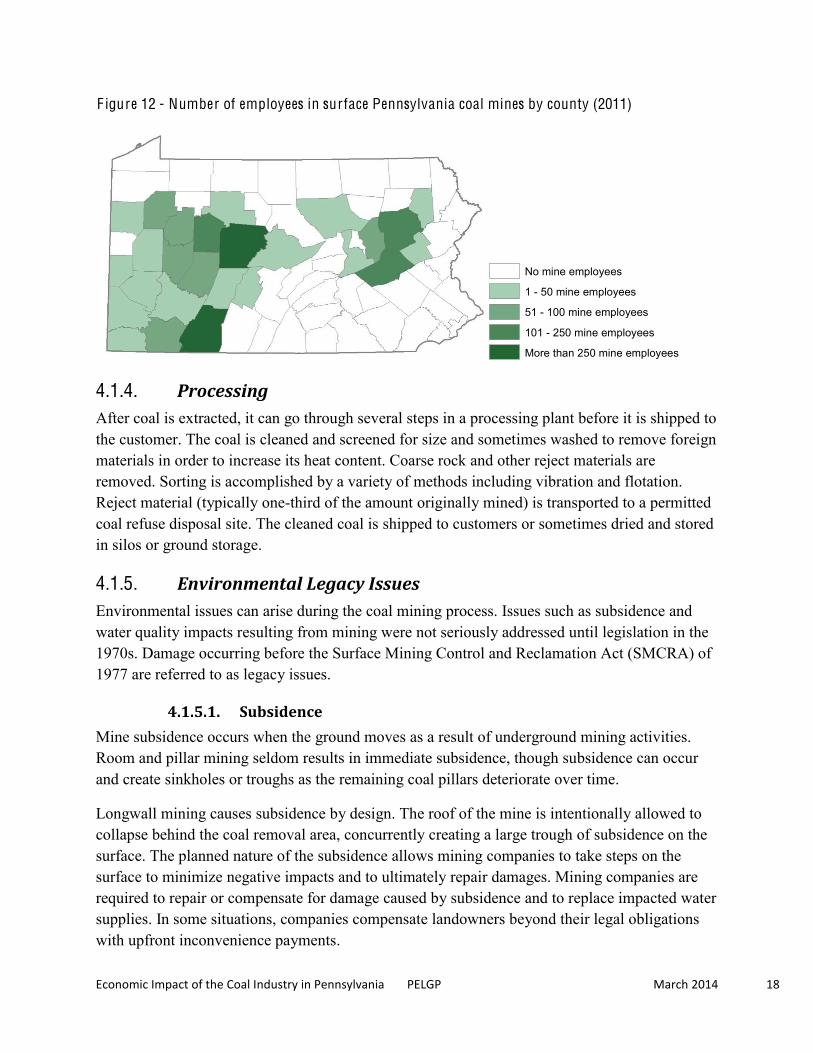
Employment in surface mines is more distributed than for underground mines (see Figure 12).16 Overall, production is lower (see Table 8) with no one county producing more than 5 million tons of coal in 2011.
LegendJoin_UndergroundDEP2011DataNumber of underground mine employees
No underground mine employees
1 - 50 mine employees
51 - 100 mine employees
101 - 250 mine employees
251 - 500 mine employees
More than 500 mine employees
Economic Impact of the Coal Industry in Pennsylvania PELGP March 2014 18
F igure 12 - Number of employees in surface Pennsylvania coal mines by county (2011)
4.1.4. Processing After coal is extracted, it can go through several steps in a processing plant before it is shipped to the customer. The coal is cleaned and screened for size and sometimes washed to remove foreign materials in order to increase its heat content. Coarse rock and other reject materials are removed. Sorting is accomplished by a variety of methods including vibration and flotation. Reject material (typically one-third of the amount originally mined) is transported to a permitted coal refuse disposal site. The cleaned coal is shipped to customers or sometimes dried and stored in silos or ground storage.
4.1.5. Environmental Legacy Issues Environmental issues can arise during the coal mining process. Issues such as subsidence and water quality impacts resulting from mining were not seriously addressed until legislation in the 1970s. Damage occurring before the Surface Mining Control and Reclamation Act (SMCRA) of 1977 are referred to as legacy issues.
4.1.5.1. Subsidence
Mine subsidence occurs when the ground moves as a result of underground mining activities. Room and pillar mining seldom results in immediate subsidence, though subsidence can occur and create sinkholes or troughs as the remaining coal pillars deteriorate over time.
Longwall mining causes subsidence by design. The roof of the mine is intentionally allowed to collapse behind the coal removal area, concurrently creating a large trough of subsidence on the surface. The planned nature of the subsidence allows mining companies to take steps on the surface to minimize negative impacts and to ultimately repair damages. Mining companies are required to repair or compensate for damage caused by subsidence and to replace impacted water supplies. In some situations, companies compensate landowners beyond their legal obligations with upfront inconvenience payments.
LegendJoin_CountySurfaceMining2011DEPNumber of Surface Mine Employees
No mine employees
1 - 50 mine employees
51 - 100 mine employees
101 - 250 mine employees
More than 250 mine employees
Economic Impact of the Coal Industry in Pennsylvania PELGP March 2014 19
The Pennsylvania Department of Environmental Protection (DEP) estimates that more than one million homes sit on abandoned mine sites.17 The Pennsylvania General Assembly recognized this problem and passed legislation in the 1960s to establish a mine subsidence insurance program that provides low cost insurance for homes in the event they are damaged by subsidence. Over $26 million has been paid in homeowner claims .
4.1.5.2. Water quality and reclamation
Large amounts of water are required for coal mining and preparation. While sophisticated programs to regulate and manage water sources and discharges are now in place, impacts from acid mine drainage from 250,000 acres of abandoned mines are a legacy of historical practices.18 , the DEP and federal regulation and legislation, specifically the federal Surface Mining Control and Reclamation Act (SMCRA) of 1977, are working to correct these legacy issues. The estimated cost to reclaim high priority mines (those classified as dangerous to public health or safety) is about $1 billion. The cost to reclaim all of Pennsylvania's abandoned mines is estimated at $15 billion.19 To help fund the reclamation of mine sites abandoned prior to 1977, federal law imposes a severance tax on the active coal mining industry for each ton of coal extracted. Although this money goes into a federally administered fund (the Abandoned Mine Reclamation Fund), it is returned to the states under a statutorily-designed formula to help address abandoned mine land and acid mine discharge problems created before 1977. Since the inception of this tax, Pennsylvania operators alone have paid $526 million into the fund. Because the distribution formula is based on the historical coal production trends that favor states like Pennsylvania with a long heritage of coal mining, Pennsylvania has received an excess of $850 million from the fund. Again, this money must be used towards addressing the past environmental legacy of mining. State and federal regulatory bodies, environmental and conservation groups, and the mining industry are making significant efforts to ameliorate problems from the past. Since 1977, more than 2,000 miles of streams and rivers have been restored, and mine drainage is no longer the leading source of water pollution.20
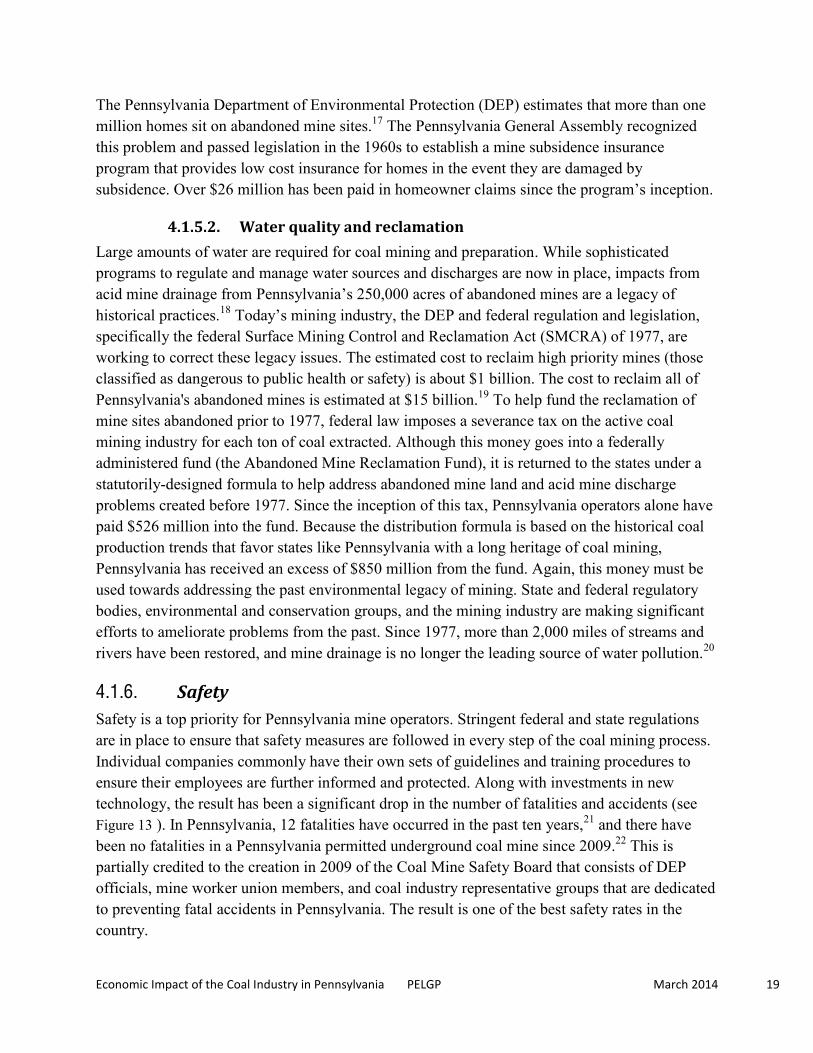
4.1.6. Safety Safety is a top priority for Pennsylvania mine operators. Stringent federal and state regulations are in place to ensure that safety measures are followed in every step of the coal mining process. Individual companies commonly have their own sets of guidelines and training procedures to ensure their employees are further informed and protected. Along with investments in new technology, the result has been a significant drop in the number of fatalities and accidents (see Figure 13 ). In Pennsylvania, 12 fatalities have occurred in the past ten years,21 and there have been no fatalities in a Pennsylvania permitted underground coal mine since 2009.22 This is partially credited to the creation in 2009 of the Coal Mine Safety Board that consists of DEP officials, mine worker union members, and coal industry representative groups that are dedicated to preventing fatal accidents in Pennsylvania. The result is one of the best safety rates in the country.
Economic Impact of the Coal Industry in Pennsylvania PELGP March 2014 20
F igure 13 - PA coal mining fatalities and production f rom 1949 to 2011
Long-latency diseases from workplace exposure can also be a cause of death from the coal mining industry. In 2011, 118 occupational illnesses from work in coal mine and plants, nationally, were reported to the Mine Safety and Health Administration. The majority of these illnesses were disorders associated with repeated trauma, such as bursitis, strains, or noise-induced hearing loss. A more serious disease, coal workers pneumoconiosis, or black lung, is caused from coal dust exposure. This illness, however, is far less prevalent today than in earlier decades: in the most recent decade about two percent of Pennsylvania mineworkers showed evidence of CWP.23 There was one case of dust diseases of the lungs reported to MSHA from
been credited with lowering instances of the disease.
0
20
40
60
80
100
120
140
160
0
20
40
60
80
100
120
140
160
180
1949
1953
1957
1961
1965
1969
1973
1977
1981
1985
1989
1993
1997
2001
2005
2009
Production (Million Short Tons)
Fatalities
Production
Fatalities
Economic Impact of the Coal Industry in Pennsylvania PELGP March 2014 21
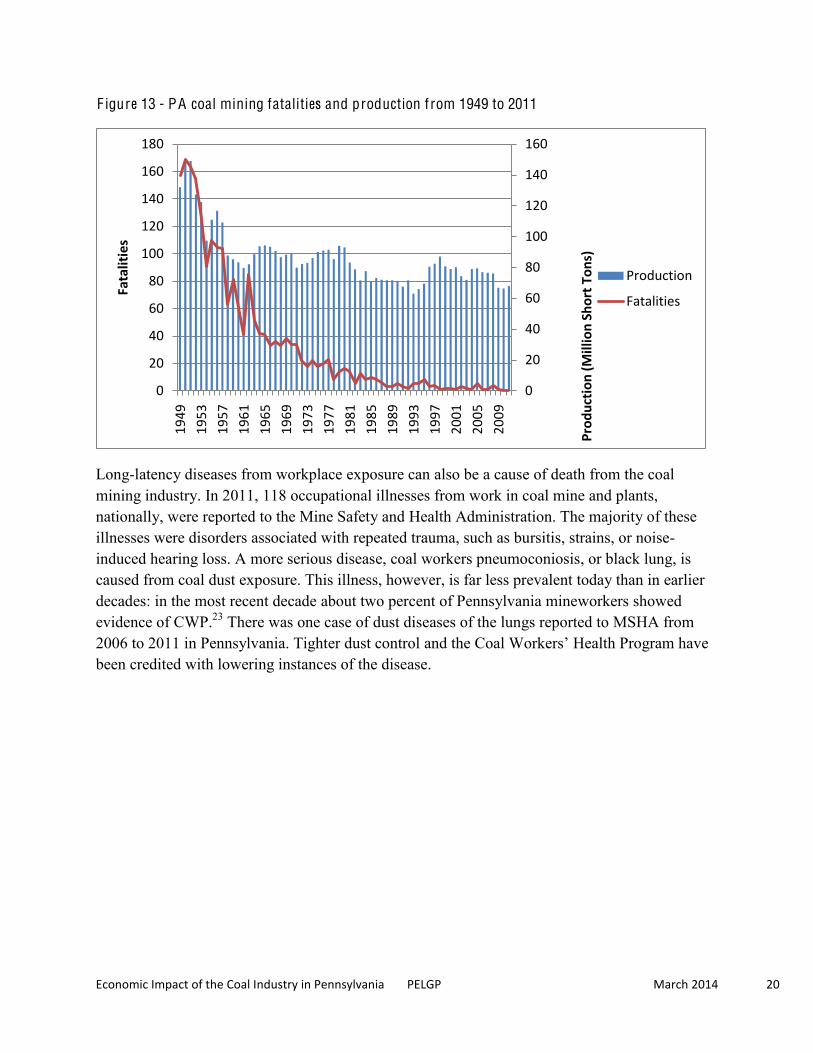
4.2. Transportation Transportation networks are vital to the coal industry. Of the 69 million short tons of coal mined in Pennsylvania in 2011, almost 43 million tons were transported to other locations. About 43 percent of that coal volume was shipped outside of Pennsylvania, much of it to neighboring states (see Table 9).
Table 9 - Top ten destination states for coal distr ibuted from PA in 201124
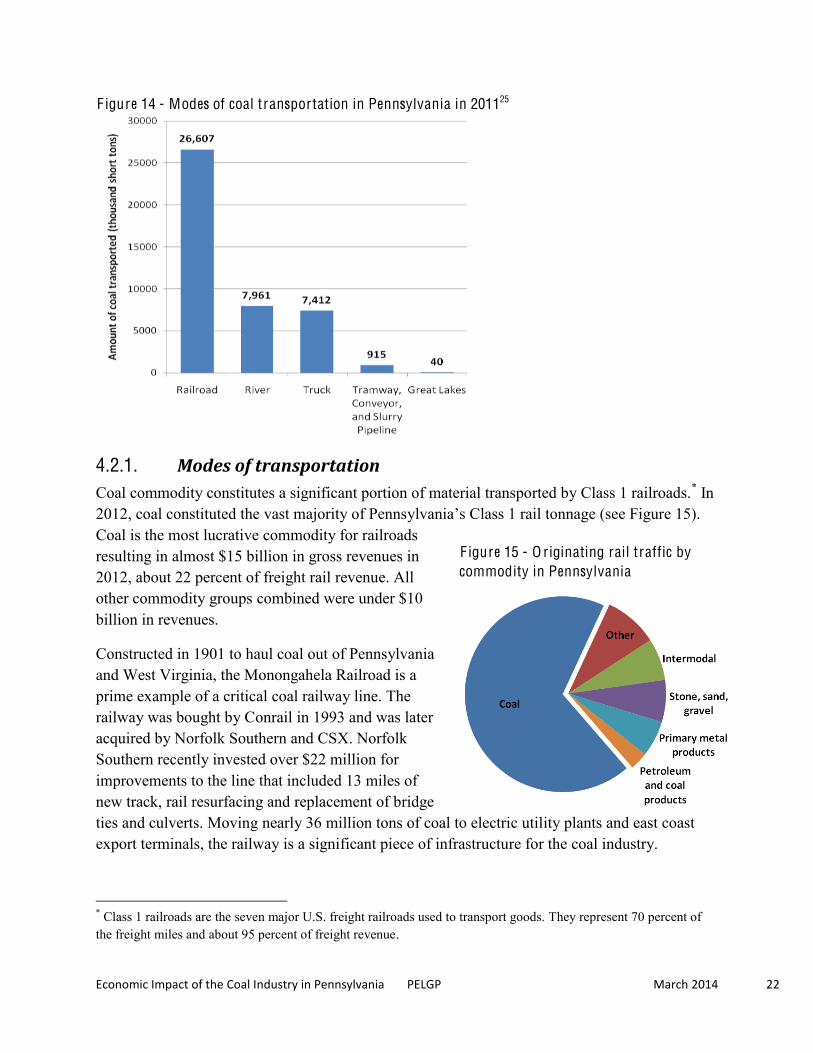
The most common mode for long distance transportation of coal is rail, which accounts for over 60 percent of distribution (see Figure 14). Barges and trucks account for the bulk of the remainder. Tramway, conveyor, and slurry pipelines are used to transport coal short distances. Some of Pennsylvania original railways were built to transport coal. Rivers, particularly the Allegheny, Monongahela, and Ohio, provide economic and efficient shipping within the state, to neighboring states and further south to the Mississippi River.
Top 10 Destination States for PA Coal
Coal Volume (short tons)
Ohio 4,647,786 Maryland 3,356,583 West Virginia 2,910,663 Wisconsin 1,809,658 Indiana 1,512,487 South Carolina 1,413,974 New York 850,013 New Jersey 524,782 New Hampshire 506,696 North Carolina 308,628 Total Domestic Exports 18,587,472
Economic Impact of the Coal Industry in Pennsylvania PELGP March 2014 22
F igure 14 - Modes of coal transportation in Pennsylvania in 201125
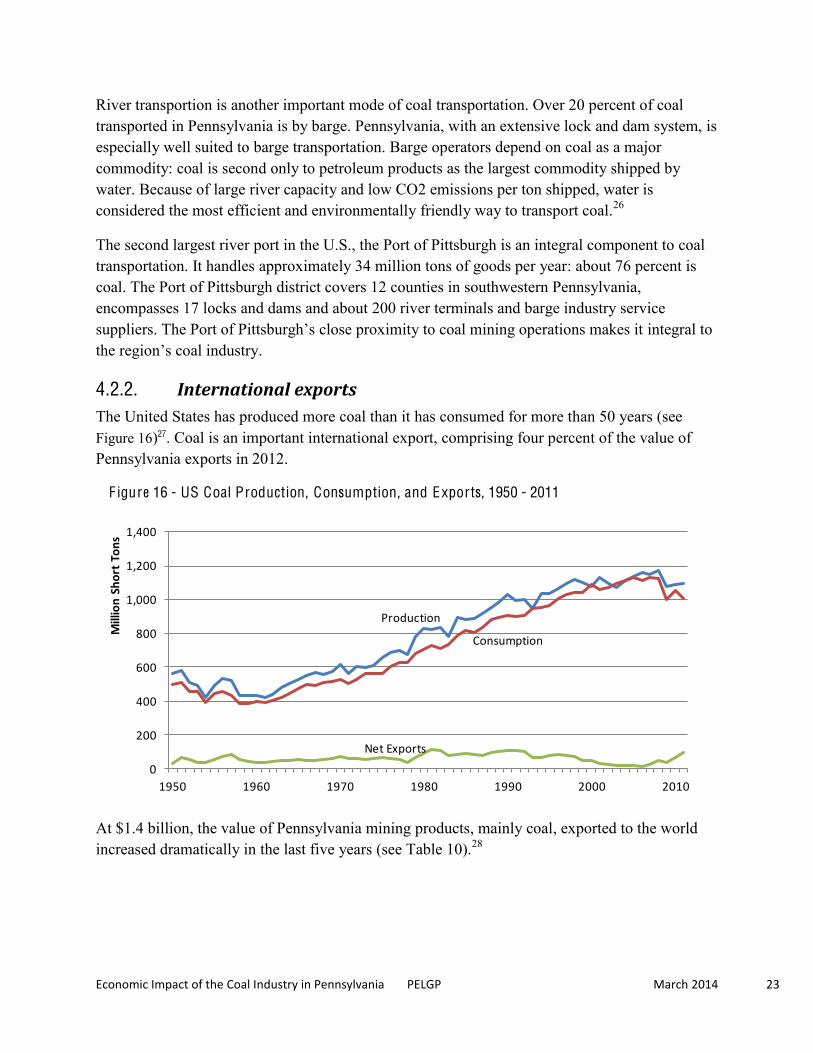
4.2.1. Modes of transportation Coal commodity constitutes a significant portion of material transported by Class 1 railroads.* In 2012, coal constituted the vast majority of Class 1 rail tonnage (see Figure 15). Coal is the most lucrative commodity for railroads resulting in almost $15 billion in gross revenues in 2012, about 22 percent of freight rail revenue. All other commodity groups combined were under $10 billion in revenues.
Constructed in 1901 to haul coal out of Pennsylvania and West Virginia, the Monongahela Railroad is a prime example of a critical coal railway line. The railway was bought by Conrail in 1993 and was later acquired by Norfolk Southern and CSX. Norfolk Southern recently invested over $22 million for improvements to the line that included 13 miles of new track, rail resurfacing and replacement of bridge ties and culverts. Moving nearly 36 million tons of coal to electric utility plants and east coast export terminals, the railway is a significant piece of infrastructure for the coal industry.
* Class 1 railroads are the seven major U.S. freight railroads used to transport goods. They represent 70 percent of the freight miles and about 95 percent of freight revenue.
F igure 15 - O riginating rail traffic by commodity in Pennsylvania
Economic Impact of the Coal Industry in Pennsylvania PELGP March 2014 23
River transportion is another important mode of coal transportation. Over 20 percent of coal transported in Pennsylvania is by barge. Pennsylvania, with an extensive lock and dam system, is especially well suited to barge transportation. Barge operators depend on coal as a major commodity: coal is second only to petroleum products as the largest commodity shipped by water. Because of large river capacity and low CO2 emissions per ton shipped, water is considered the most efficient and environmentally friendly way to transport coal.26
The second largest river port in the U.S., the Port of Pittsburgh is an integral component to coal transportation. It handles approximately 34 million tons of goods per year: about 76 percent is coal. The Port of Pittsburgh district covers 12 counties in southwestern Pennsylvania, encompasses 17 locks and dams and about 200 river terminals and barge industry service suppliers. integral to the coal industry.
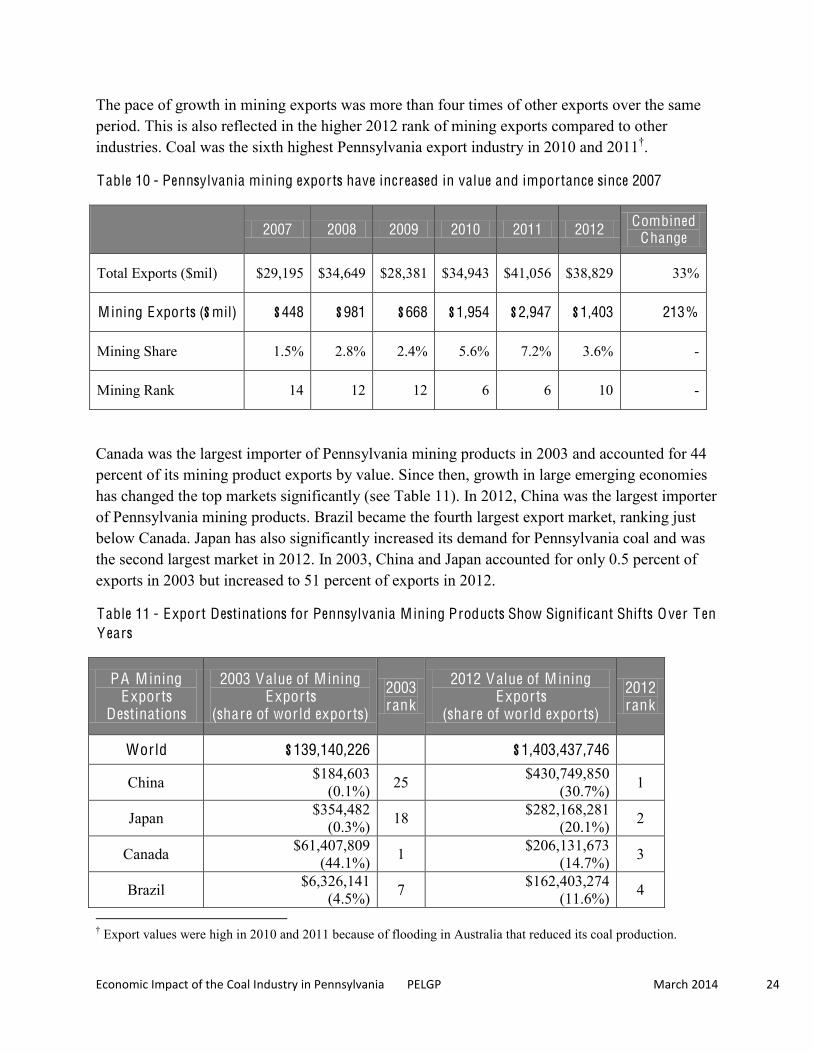
4.2.2. International exports The United States has produced more coal than it has consumed for more than 50 years (see Figure 16)27. Coal is an important international export, comprising four percent of the value of Pennsylvania exports in 2012.
F igure 16 - US Coal Production, Consumption, and Exports, 1950 - 2011
At $1.4 billion, the value of Pennsylvania mining products, mainly coal, exported to the world increased dramatically in the last five years (see Table 10).28
Production
Consumption
Net Exports
0
200
400
600
800
1,000
1,200
1,400
1950 1960 1970 1980 1990 2000 2010
Million Short Tons
Economic Impact of the Coal Industry in Pennsylvania PELGP March 2014 24
The pace of growth in mining exports was more than four times of other exports over the same period. This is also reflected in the higher 2012 rank of mining exports compared to other industries. Coal was the sixth highest Pennsylvania export industry in 2010 and 2011 .
Table 10 - Pennsylvania mining exports have increased in value and importance since 2007
2007 2008 2009 2010 2011 2012 Combined Change
Total Exports ($mil) $29,195 $34,649 $28,381 $34,943 $41,056 $38,829 33%
Mining Exports ($mil) $448 $981 $668 $1,954 $2,947 $1,403 213%
Mining Share 1.5% 2.8% 2.4% 5.6% 7.2% 3.6% -
Mining Rank 14 12 12 6 6 10 -
Canada was the largest importer of Pennsylvania mining products in 2003 and accounted for 44 percent of its mining product exports by value. Since then, growth in large emerging economies has changed the top markets significantly (see Table 11). In 2012, China was the largest importer of Pennsylvania mining products. Brazil became the fourth largest export market, ranking just below Canada. Japan has also significantly increased its demand for Pennsylvania coal and was the second largest market in 2012. In 2003, China and Japan accounted for only 0.5 percent of exports in 2003 but increased to 51 percent of exports in 2012.
Table 11 - Export Destinations for Pennsylvania Mining Products Show Significant Shifts Over Ten Y ears
PA Mining Exports
Destinations
2003 Value of M ining Exports
(share of world exports)
2003 rank
2012 Value of M ining Exports
(share of world exports)
2012 rank
World $139,140,226 $1,403,437,746
China $184,603 (0.1%) 25 $430,749,850
(30.7%) 1
Japan $354,482 (0.3%) 18 $282,168,281
(20.1%) 2
Canada $61,407,809 (44.1%) 1 $206,131,673
(14.7%) 3
Brazil $6,326,141 (4.5%) 7 $162,403,274
(11.6%) 4
Export values were high in 2010 and 2011 because of flooding in Australia that reduced its coal production.
Economic Impact of the Coal Industry in Pennsylvania PELGP March 2014 25
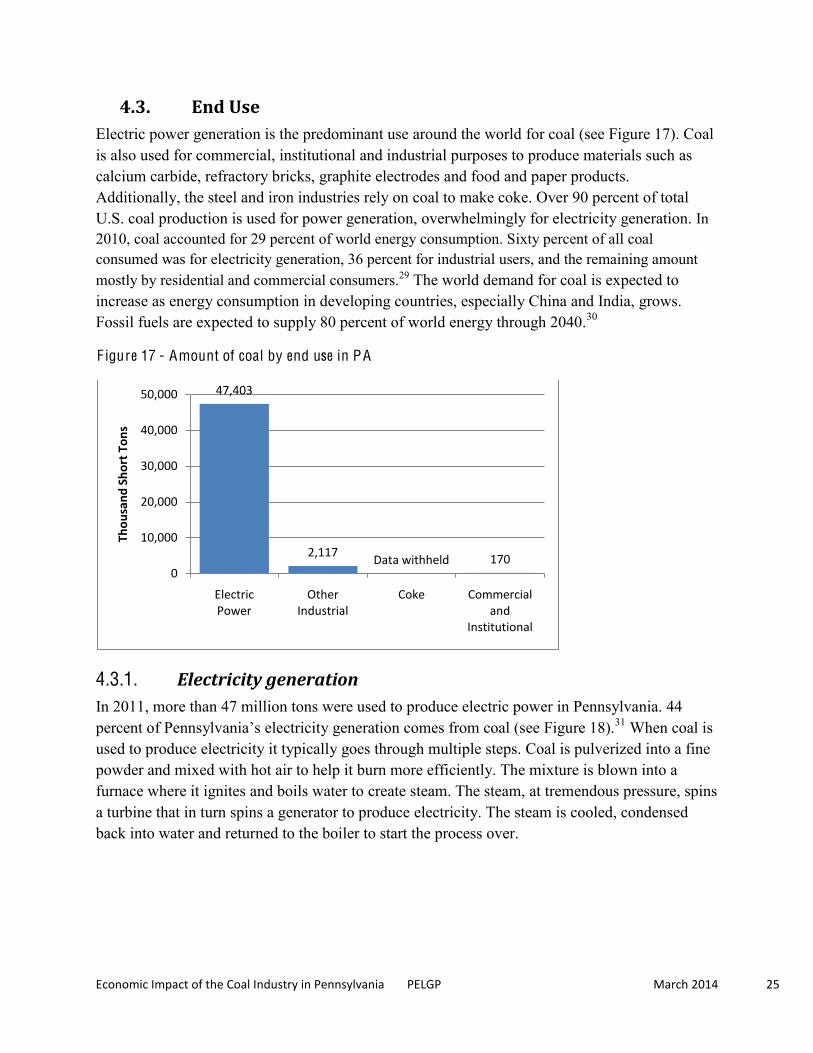
4.3. End Use Electric power generation is the predominant use around the world for coal (see Figure 17). Coal is also used for commercial, institutional and industrial purposes to produce materials such as calcium carbide, refractory bricks, graphite electrodes and food and paper products. Additionally, the steel and iron industries rely on coal to make coke. Over 90 percent of total U.S. coal production is used for power generation, overwhelmingly for electricity generation. In 2010, coal accounted for 29 percent of world energy consumption. Sixty percent of all coal consumed was for electricity generation, 36 percent for industrial users, and the remaining amount mostly by residential and commercial consumers.29 The world demand for coal is expected to increase as energy consumption in developing countries, especially China and India, grows. Fossil fuels are expected to supply 80 percent of world energy through 2040.30
F igure 17 - Amount of coal by end use in PA
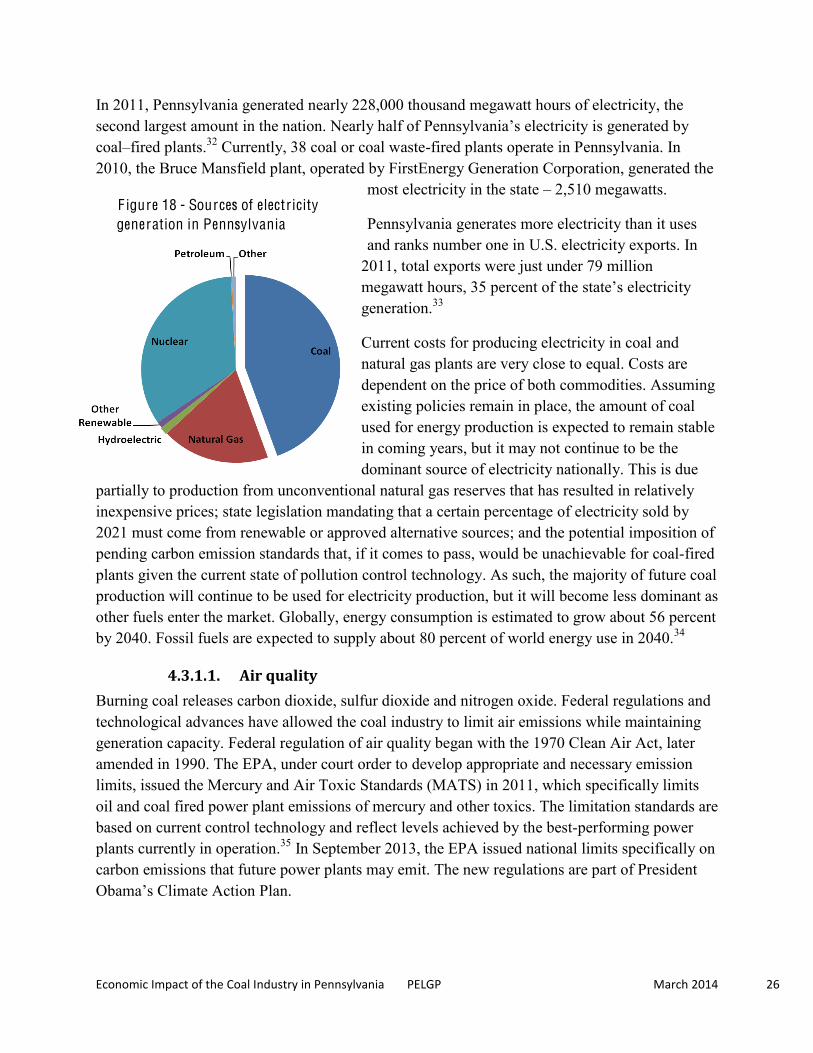
4.3.1. Electricity generation In 2011, more than 47 million tons were used to produce electric power in Pennsylvania. 44
electricity generation comes from coal (see Figure 18).31 When coal is used to produce electricity it typically goes through multiple steps. Coal is pulverized into a fine powder and mixed with hot air to help it burn more efficiently. The mixture is blown into a furnace where it ignites and boils water to create steam. The steam, at tremendous pressure, spins a turbine that in turn spins a generator to produce electricity. The steam is cooled, condensed back into water and returned to the boiler to start the process over.
47,403
2,117Data withheld 170
0
10,000
20,000
30,000
40,000
50,000
ElectricPower
OtherIndustrial
Coke Commercialand
Institutional
Thousand Short Tons
Economic Impact of the Coal Industry in Pennsylvania PELGP March 2014 26
In 2011, Pennsylvania generated nearly 228,000 thousand megawatt hours of electricity, the second largest amount in the nation. Nearly half electricity is generated by coal fired plants.32 Currently, 38 coal or coal waste-fired plants operate in Pennsylvania. In 2010, the Bruce Mansfield plant, operated by FirstEnergy Generation Corporation, generated the
most electricity in the state 2,510 megawatts.
Pennsylvania generates more electricity than it uses and ranks number one in U.S. electricity exports. In
2011, total exports were just under 79 million megawatt hours, 35 percent of the electricity generation.33
Current costs for producing electricity in coal and natural gas plants are very close to equal. Costs are dependent on the price of both commodities. Assuming existing policies remain in place, the amount of coal used for energy production is expected to remain stable in coming years, but it may not continue to be the dominant source of electricity nationally. This is due
partially to production from unconventional natural gas reserves that has resulted in relatively inexpensive prices; state legislation mandating that a certain percentage of electricity sold by 2021 must come from renewable or approved alternative sources; and the potential imposition of pending carbon emission standards that, if it comes to pass, would be unachievable for coal-fired plants given the current state of pollution control technology. As such, the majority of future coal production will continue to be used for electricity production, but it will become less dominant as other fuels enter the market. Globally, energy consumption is estimated to grow about 56 percent by 2040. Fossil fuels are expected to supply about 80 percent of world energy use in 2040.34
4.3.1.1. Air quality
Burning coal releases carbon dioxide, sulfur dioxide and nitrogen oxide. Federal regulations and technological advances have allowed the coal industry to limit air emissions while maintaining generation capacity. Federal regulation of air quality began with the 1970 Clean Air Act, later amended in 1990. The EPA, under court order to develop appropriate and necessary emission limits, issued the Mercury and Air Toxic Standards (MATS) in 2011, which specifically limits oil and coal fired power plant emissions of mercury and other toxics. The limitation standards are based on current control technology and reflect levels achieved by the best-performing power plants currently in operation.35 In September 2013, the EPA issued national limits specifically on carbon emissions that future power plants may emit. The new regulations are part of President
F igure 18 - Sources of electricity generation in Pennsylvania
Economic Impact of the Coal Industry in Pennsylvania PELGP March 2014 27
To meet air toxic requirements, the coal industry has made a number of changes. Companies have opted to use lower sulfur coal, retire underperforming plants and outfit existing coal plants with technology to limit emissions. The most common investment is flue gas desulfurization (FGD) scrubbers that remove sulfur dioxide from emissions. About 58 percent of the electricity generated from coal comes from plants with FGD scrubbers.36 Most recently, the EPA is developing regulations that will limit carbon dioxide emission from existing power plants. The new standards will be issued in June of 2014, with expected state implementation in June of
worries about future regulations have curtailed new coal-fired plant construction. The forthcoming regulations have already impacted existing plants. In October 2013, FirstEnergy deactivated two of its Pennsylvania coal power plants. The company cited current and future environmental regulations and lower demand for electricity as reasons for closure.37
4.3.2. Coke production About two percent of U.S. coal production is used for the steelmaking process. Coal is converted to coke, a process that involves burning off impurities that produced nearly pure carbon. Coke is combined with iron ore and scrap steel and heated into new steel. About 70 percent of all steel produced uses coal in the process.38 The percentage of coal used to manufacture coke in Pennsylvania is not disclosed by the Energy Information Administration due to data confidentiality.
4.3.3. Other industrial, commercial, and institutional uses Coal has industrial, commercial and institutional uses. Industrial use constitutes about five percent of total U.S. coal consumption. Examples of other industries that consume coal are metal producing companies that use coal in combination with coke, as well as the cement, chemical and paper industries. Coal is an important component to the cement industry where it is used as an energy source to heat kilns that melt cement. Fly ash, a coal combustion product, is added to cement mix to create concrete. Byproducts of coal are used to create a number of chemicals. Refined coal tar is used to manufacture chemicals such as creosote oil, naphthalene, phenol and benzene, and ammonia gas recovered from coke ovens is used to manufacture ammonia salts, nitric acid and agricultural fertilizers.39
Commercially and institutionally consumed coal includes residential and commercial coal powered heating units. While historically, it was common to use coal for heating, today this use makes up less than one percent of U.S. coal consumption.
Economic Impact of the Coal Industry in Pennsylvania PELGP March 2014 28
5. Research and Development Pennsylvania is home to two of the largest coal research facilities in the country the National Energy Technology Laboratory (NETL) and CONSOL Energy Research & Development.
gas and oil technologies, contract and project management, analysis of energy systems and international energy issues. Based outside Pittsburgh in South Park, PA, NETL conducts its research through five laboratories South Park; Morgantown, WV; Tulsa, OK; Albany, OR; and Fairbanks, AK. s facilities have core capabilities such as carbon management, computational research, environmental science, fuel cell research, high temperature/pressure science and separations science. The budget for coal research and development was over $400 million in fiscal year 2011. Current coal-related projects include environmental control technologies for existing plants; future power plant technology like coal gasification, advanced turbines, combustion technologies and fuel cells; and clean coal demonstration projects. NETL also runs a carbon sequestration program that plans to provide commercial scale technology for carbon capture/storage beginning in 2020.
Canonsburg-based CONSOL Energy operates the largest private research and development facility in the country devoted exclusively to coal and energy utilization and production. While
operations, it also focuses on energy development, improving energy efficiency and reducing pollution. Specifically, CONSOL is working on the following issues: coal-fueled power plant pollutant emissions reduction, greenhouse gas emissions reduction, waste coal utilization, coal-fired combustion boiler technology and air quality.
Economic Impact of the Coal Industry in Pennsylvania PELGP March 2014 29
Appendix
A. Change to IMPLAN methodology This analysis incorporates a significant change to the IMPLAN methodology. PELGP used a Mine Safety and Health Administration (MSHA) figure 13,886 for direct employment rather than the IMPLAN generated employment figure of 12,057. The MSHA figure includes 8,660 employees that worked directly for coal companies and 5,226 contractors. The IMPLAN statistic is derived from the Bureau of Economic Analysis and Bureau of Labor Statistics. PELGP used the MSHA employment figure because it is reported directly from the mining industry. Additionally, a national study used the MSHA employment number for its analysis.
B. Differences in methodology from national study In the process of conducting this analysis, PELGP learned that a study by the National Mining
had used an IMPLAN analysis to study the effects of the Coal Industry in the U.S. and in all individual states. Its economic impact numbers were significantly different than the PELGP preliminary results. PELGP offers the following explanation to account for the discrepancy in results.
In addition to coal industry workers, the NMA study included transportation workers and support services for coal mining as direct employment jobs. captures some of those jobs as indirect effects. The total number of jobs for those two additional categories was 8,230. The NMA study conducted a complex analysis to derive direct transportation jobs. analysis (and most IMPLAN models) considers transportation jobs after initial production to be downstream effects, and therefore does not include those effects as part of the Coal Industry but rather as transportation jobs. Since those employees are not employed by the Coal Industry;
report does not include them under the direct impact of the Coal Industry
report includes a separate analysis of the rail and water transportation industries regarding coal. The analyses are provided as examples of secondary downstream industries that depend on coal as a source. The NMA study also calculated out of state effects on employment impact. report is restricted to Pennsylvania data.
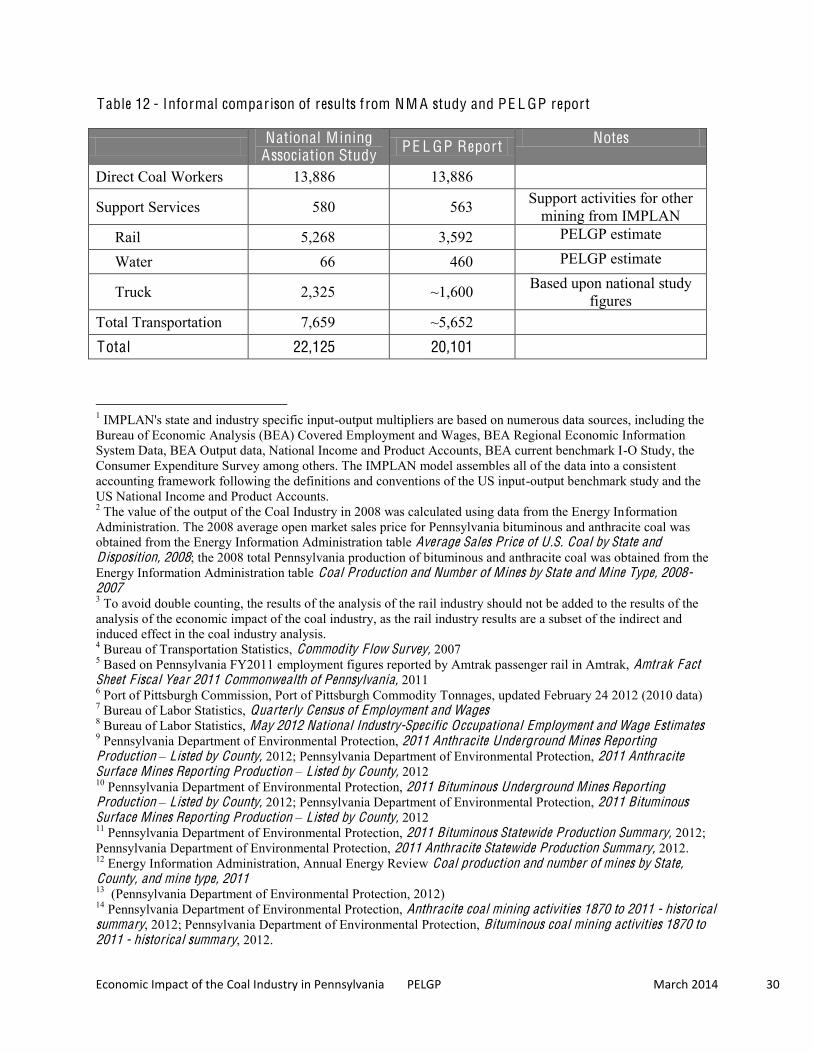
Totaling estimate of rail water and trucking industry jobs and support services yields employment figures that approximate those of the NMA study. The difference is that the PELGP report does not define the jobs beyond direct coal workers as direct. Table 12 outlines
results compared to the NMA study.
The analysis calculated the demand for coal across economic sectors and assigned a dollar amount to that demand.
It used IMPLAN margins to identify the segment of that demand that can be attributed to the transportation sector. It then used the respective industry multipliers to translate the dollar amounts to jobs that represent the transport of coal to intermediate purchasers after mining and processing.
Economic Impact of the Coal Industry in Pennsylvania PELGP March 2014 30
Table 12 - Informal comparison of results f rom NM A study and PE L GP report
National Mining Association Study PE L GP Report Notes
Direct Coal Workers 13,886 13,886
Support Services 580 563 Support activities for other mining from IMPLAN
Rail 5,268 3,592 PELGP estimate
Water 66 460 PELGP estimate
Truck 2,325 ~1,600 Based upon national study figures
Total Transportation 7,659 ~5,652
Total 22,125 20,101
1 IMPLAN's state and industry specific input-output multipliers are based on numerous data sources, including the Bureau of Economic Analysis (BEA) Covered Employment and Wages, BEA Regional Economic Information System Data, BEA Output data, National Income and Product Accounts, BEA current benchmark I-O Study, the Consumer Expenditure Survey among others. The IMPLAN model assembles all of the data into a consistent accounting framework following the definitions and conventions of the US input-output benchmark study and the US National Income and Product Accounts. 2 The value of the output of the Coal Industry in 2008 was calculated using data from the Energy Information Administration. The 2008 average open market sales price for Pennsylvania bituminous and anthracite coal was obtained from the Energy Information Administration table Average Sales Price of U .S. Coal by State and Disposition, 2008; the 2008 total Pennsylvania production of bituminous and anthracite coal was obtained from the Energy Information Administration table Coal Production and Number of Mines by State and Mine Type, 2008-2007 3 To avoid double counting, the results of the analysis of the rail industry should not be added to the results of the analysis of the economic impact of the coal industry, as the rail industry results are a subset of the indirect and induced effect in the coal industry analysis. 4 Bureau of Transportation Statistics, Commodity F low Survey, 2007 5 Based on Pennsylvania FY2011 employment figures reported by Amtrak passenger rail in Amtrak, Amtrak Fact Sheet F iscal Year 2011 Commonwealth of Pennsylvania, 2011 6 Port of Pittsburgh Commission, Port of Pittsburgh Commodity Tonnages, updated February 24 2012 (2010 data) 7 Bureau of Labor Statistics, Quarterly Census of Employment and Wages 8 Bureau of Labor Statistics, May 2012 National Industry-Specific Occupational Employment and Wage Estimates 9 Pennsylvania Department of Environmental Protection, 2011 Anthracite Underground Mines Reporting Production Listed by County, 2012; Pennsylvania Department of Environmental Protection, 2011 Anthracite Surface Mines Reporting Production Listed by County, 2012 10 Pennsylvania Department of Environmental Protection, 2011 Bituminous Underground Mines Reporting Production Listed by County, 2012; Pennsylvania Department of Environmental Protection, 2011 Bituminous Surface Mines Reporting Production Listed by County, 2012 11 Pennsylvania Department of Environmental Protection, 2011 Bituminous Statewide Production Summary, 2012; Pennsylvania Department of Environmental Protection, 2011 Anthracite Statewide Production Summary, 2012. 12 Energy Information Administration, Annual Energy Review Coal production and number of mines by State, County, and mine type, 2011 13 (Pennsylvania Department of Environmental Protection, 2012) 14 Pennsylvania Department of Environmental Protection, Anthracite coal mining activities 1870 to 2011 - historical summary, 2012; Pennsylvania Department of Environmental Protection, Bituminous coal mining activities 1870 to 2011 - historical summary, 2012.
Economic Impact of the Coal Industry in Pennsylvania PELGP March 2014 31
15 Pennsylvania Department of Environmental Protection, 2011 Bituminous Underground Mines Reporting Production Listed by County, 2012; Pennsylvania Department of Environmental Protection, 2011 Anthracite Underground Mines Reporting Production Listed by County, 2012 16 Pennsylvania Department of Environmental Protection, 2011 Bituminous Surface Mines Reporting Production Listed by County, 2012; Pennsylvania Department of Environmental Protection, 2011 Anthracite Surface Mines Reporting Production Listed by County, 2012 17 Department of Environmental Protection, Mine Subsidence Insurance Fund F requently Asked Questions 18 Pennsylvania Department of Environmental Protection, 19 Pennsylvania Department of Environmental Protection, AML Program Information 20 Pittsburgh Tribune-Review January 2013 21 Pennsylvania Department of Environmental Protection, Bituminous Coal Mining Activities 1877 to 2011 - Historical Summary, 2011; Pennsylvania Department of Environmental Protection, Anthracite Coal Mining Activities 1877 to 2011 - Historical Summary, 2011 22 Mine Safety and Health Administration, 2011 Injury Experience Report 23 National Institute for Occupational Safety and Health, Coal Workers' Health Surveillance Program (CWHSP), CWHSP Public Data 1970-2009 24 Energy Information Administration, Annual Coal Distribution Report, November 2012 25 Energy Information Administration, Annual Coal Distribution Report, November 2012 26 The American Waterway Operators, Advantages of Inland Barge Transport: a Smaller Carbon Footprint, 2009 27 Energy Information Administration, Annual Energy Review and Quarterly Coal Report, 2012 28 International Trade Administration, 2012 NAICS Total All Merchandise Exports from Pennsylvania 29 Energy Information Administration, International Energy Outlook 2013, Coal Overview 30 Energy Information Administration, Today in Energy, July 25, 2013 31 Energy Information Administration, Electric Power Monthly, Net Generation by Energy Source, released March 2013 32 Energy Information Administration, Electric Power Annual, Net Generation by State by Sector, released January 30 2013 33 Pennsylvania Treasury, ns, October 9 2013 34 Energy Information Administration, Today in Energy, July 25 2013 35 United States Environmental Protection Agency, Mercury and Air Toxics Standards (MATS) Basic Information 36
Today in Energy December 11 2011 37 FirstEnergy to Deactivate Two Coal-Fired Power Plants in Pennsylvania News Releases, July 9 2013 38 World Coal Association website, Uses of Coal 39 World Coal Association website, Uses of Coal