Embed Size (px)
Citation preview
2014 Calendar YearAdirondacks Focus
The Economic Impact of Tourism in New York
2
State Summary

3
Key trends in 2014
● New York State’s tourism economy expanded in 2014 with 5.4% growth in traveler spending.
● Traveler spending reached a new high of $62.5 billion, which is 18% above the state’s pre-recession peak set in 2008. Key industry data illustrate the industry’s performance:
■ Room demand expanded 4.3% in 2014. And room rates increased 2.6% equating to a total hotel revenue increase of 7.0% according to STR.
■ Passenger counts at all NYS airports increased 3.3% in 2014 with an associated ticket revenue increase of 6.9%.
● Direct tourism employment grew 3.2% to reach a new high in 2014 while associated personal income expanded 4.2%. On both of these measures, tourism outpaced the general economy.
4
Headline results
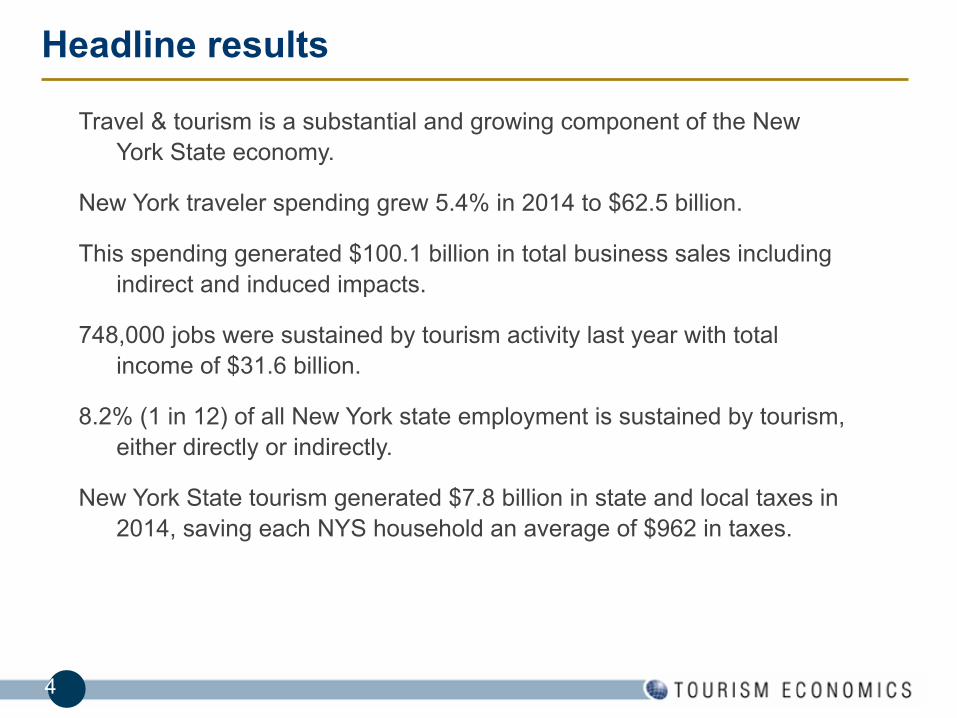
Travel & tourism is a substantial and growing component of the New York State economy.
New York traveler spending grew 5.4% in 2014 to $62.5 billion.
This spending generated $100.1 billion in total business sales including indirect and induced impacts.
748,000 jobs were sustained by tourism activity last year with total income of $31.6 billion.
8.2% (1 in 12) of all New York state employment is sustained by tourism, either directly or indirectly.
New York State tourism generated $7.8 billion in state and local taxes in 2014, saving each NYS household an average of $962 in taxes.
5
Traveler spending growth
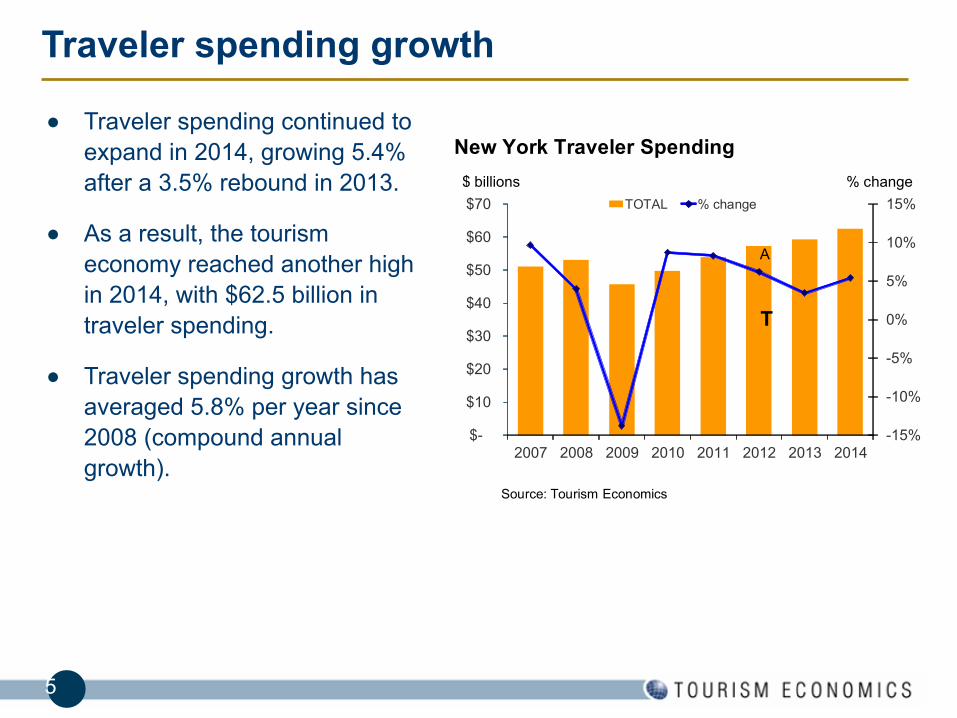
● Traveler spending continued to expand in 2014, growing 5.4% after a 3.5% rebound in 2013.
● As a result, the tourism economy reached another high in 2014, with $62.5 billion in traveler spending.
● Traveler spending growth has averaged 5.8% per year since 2008 (compound annual growth).
-15%
-10%
-5%
0%
5%
10%
15%
$-
$10
$20
$30
$40
$50
$60
$70
2007 2008 2009 2010 2011 2012 2013 2014
TOTAL % change
T
A
New York Traveler Spending
$ billions
Source: Tourism Economics
% change
6
New York State tourism markets
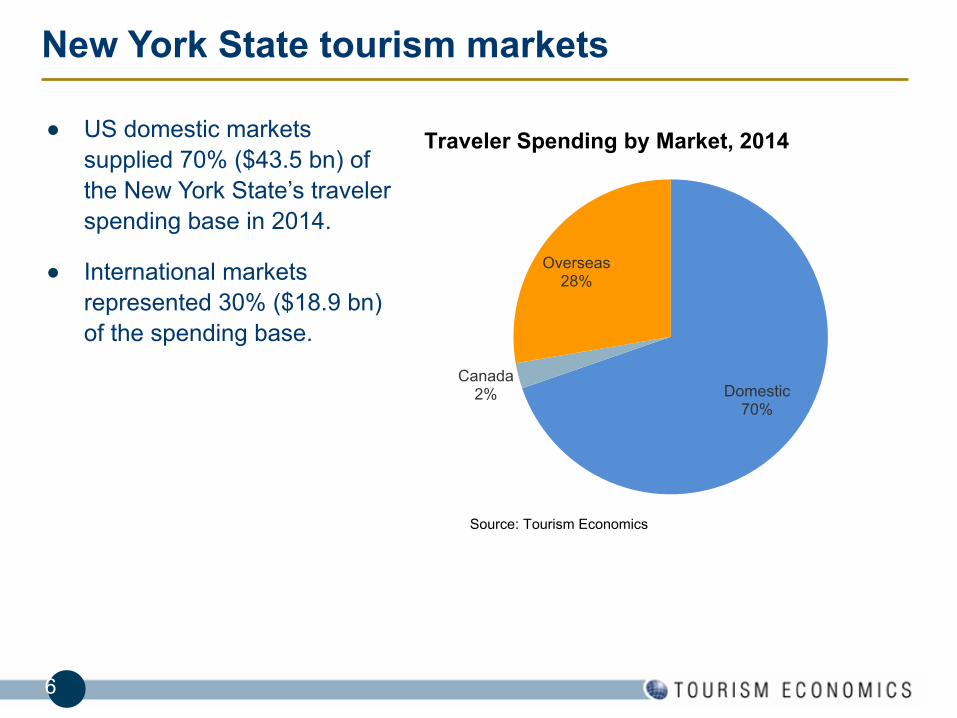
● US domestic markets supplied 70% ($43.5 bn) of the New York State’s traveler spending base in 2014.
● International markets represented 30% ($18.9 bn) of the spending base.
Domestic70%
Canada2%
Overseas28%
Traveler Spending by Market, 2014
Source: Tourism Economics
7
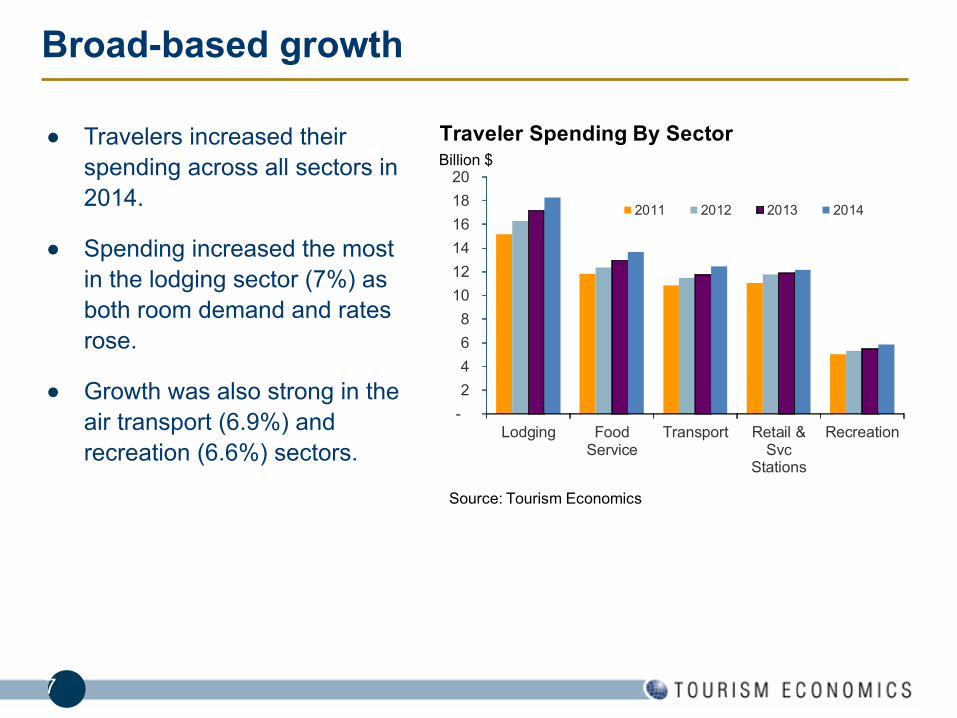
Broad-based growth
● Travelers increased their spending across all sectors in 2014.
● Spending increased the most in the lodging sector (7%) as both room demand and rates rose.
● Growth was also strong in the air transport (6.9%) and recreation (6.6%) sectors.
- 2 4 6 8
10 12 14 16 18 20
Lodging FoodService
Transport Retail &Svc
Stations
Recreation
2011 2012 2013 2014
Traveler Spending By SectorBillion $
Source: Tourism Economics
8
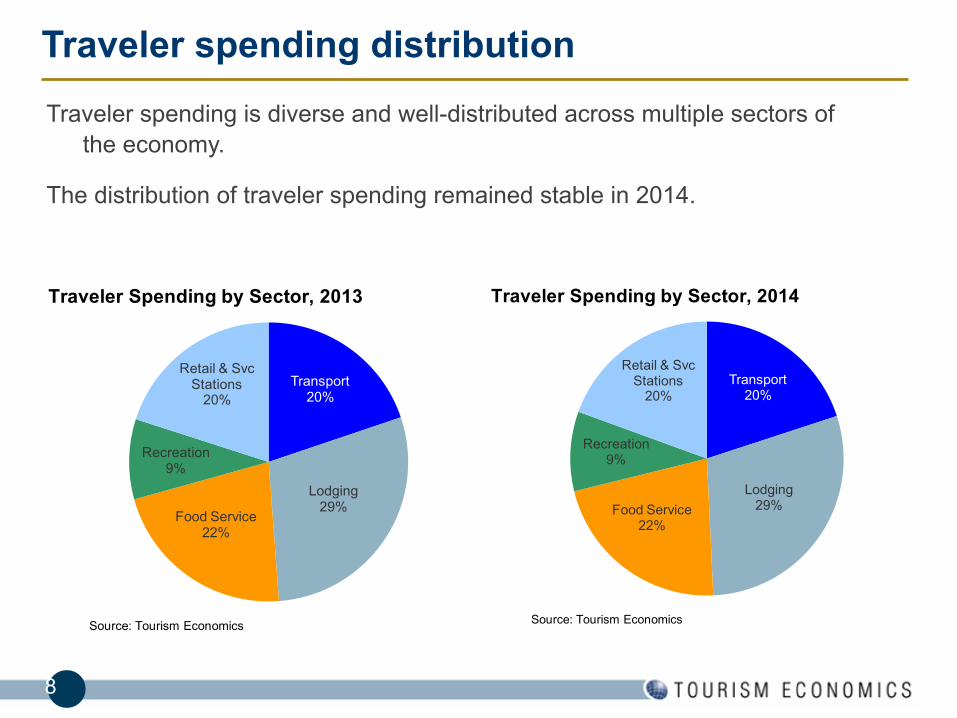
Traveler spending distribution
Traveler spending is diverse and well-distributed across multiple sectors of the economy.
The distribution of traveler spending remained stable in 2014.
Transport20%
Lodging29%
Food Service22%
Recreation9%
Retail & Svc Stations
20%
Traveler Spending by Sector, 2013
Source: Tourism Economics
Transport20%
Lodging29%Food Service
22%
Recreation9%
Retail & Svc Stations
20%
Traveler Spending by Sector, 2014
Source: Tourism Economics
9
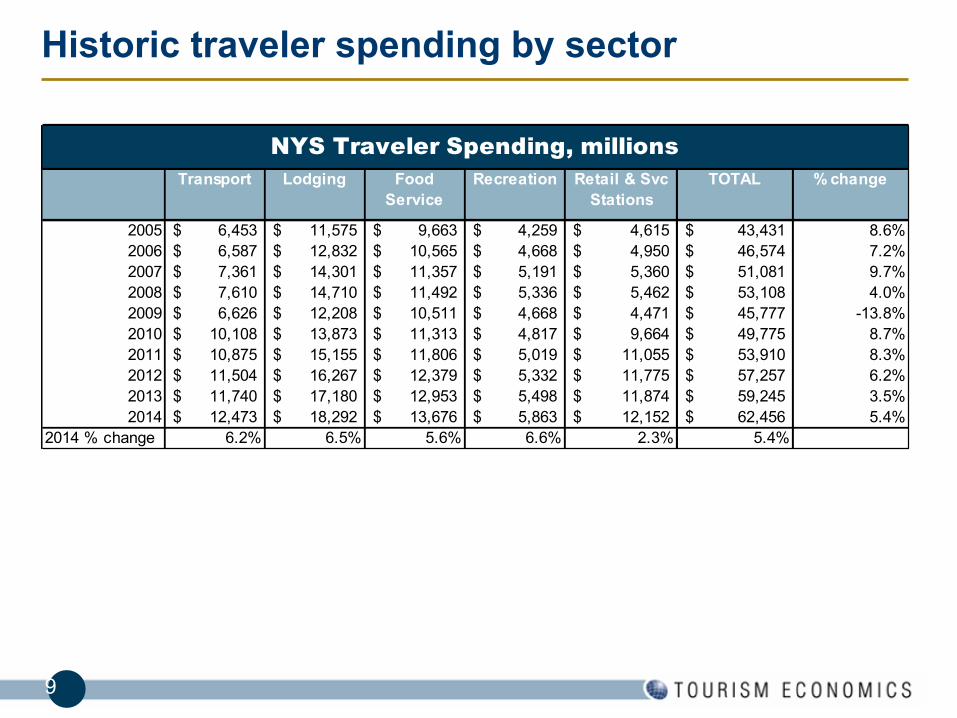
Historic traveler spending by sector
Transport Lodging Food Service
Recreation Retail & Svc Stations
TOTAL % change
2005 6,453$ 11,575$ 9,663$ 4,259$ 4,615$ 43,431$ 8.6%2006 6,587$ 12,832$ 10,565$ 4,668$ 4,950$ 46,574$ 7.2%2007 7,361$ 14,301$ 11,357$ 5,191$ 5,360$ 51,081$ 9.7%2008 7,610$ 14,710$ 11,492$ 5,336$ 5,462$ 53,108$ 4.0%2009 6,626$ 12,208$ 10,511$ 4,668$ 4,471$ 45,777$ -13.8%2010 10,108$ 13,873$ 11,313$ 4,817$ 9,664$ 49,775$ 8.7%2011 10,875$ 15,155$ 11,806$ 5,019$ 11,055$ 53,910$ 8.3%2012 11,504$ 16,267$ 12,379$ 5,332$ 11,775$ 57,257$ 6.2%2013 11,740$ 17,180$ 12,953$ 5,498$ 11,874$ 59,245$ 3.5%2014 12,473$ 18,292$ 13,676$ 5,863$ 12,152$ 62,456$ 5.4%
2014 % change 6.2% 6.5% 5.6% 6.6% 2.3% 5.4%
NYS Traveler Spending, millions
10
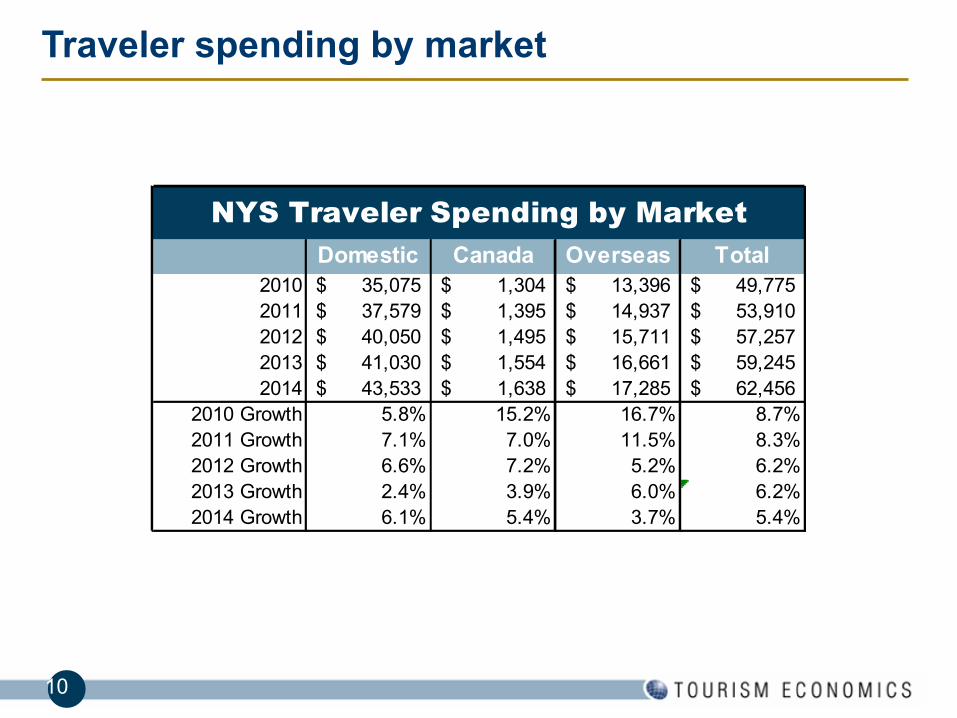
Traveler spending by market
Domestic Canada Overseas Total2010 35,075$ 1,304$ 13,396$ 49,775$ 2011 37,579$ 1,395$ 14,937$ 53,910$ 2012 40,050$ 1,495$ 15,711$ 57,257$ 2013 41,030$ 1,554$ 16,661$ 59,245$ 2014 43,533$ 1,638$ 17,285$ 62,456$
2010 Growth 5.8% 15.2% 16.7% 8.7%2011 Growth 7.1% 7.0% 11.5% 8.3%2012 Growth 6.6% 7.2% 5.2% 6.2%2013 Growth 2.4% 3.9% 6.0% 6.2%2014 Growth 6.1% 5.4% 3.7% 5.4%
NYS Traveler Spending by Market
11
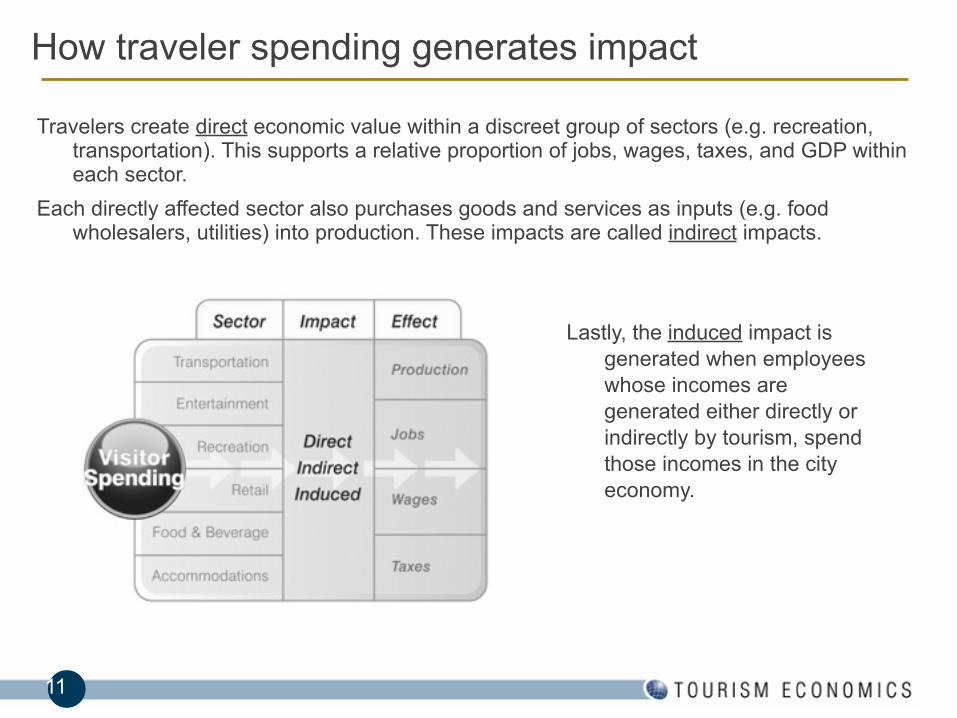
How traveler spending generates impact
Lastly, the induced impact is generated when employees whose incomes are generated either directly or indirectly by tourism, spend those incomes in the city economy.
Travelers create direct economic value within a discreet group of sectors (e.g. recreation, transportation). This supports a relative proportion of jobs, wages, taxes, and GDP within each sector.
Each directly affected sector also purchases goods and services as inputs (e.g. food wholesalers, utilities) into production. These impacts are called indirect impacts.

12
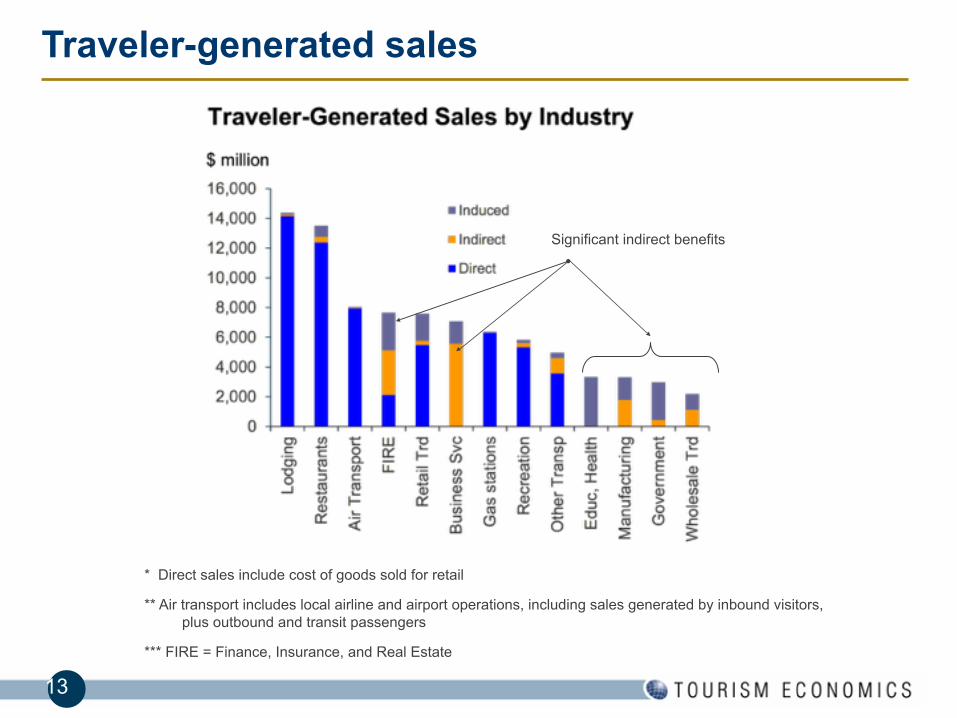
Traveler-generated sales
Including the indirect and induced impacts, traveler spending generated $100.0 billion in business sales in 2014, up 5.0%.
Direct* Indirect Induced Total % changeAgriculture, Fishing, Mining - 406 174 580 4.8%Construction and Utilities - 1,173 560 1,734 4.8%Manufacturing - 1,952 1,623 3,575 4.5%Wholesale Trade - 1,220 1,145 2,365 4.4%Air Transport 8,590 50 64 8,704 6.9%Other Transport 3,883 1,132 392 5,407 4.9%Retail Trade 5,948 311 1,933 8,192 5.0%Gasoline Stations 6,204 12 67 6,282 -0.5%Communications - 1,253 714 1,967 4.7%Finance, Insurance and Real Estate 2,193 3,288 2,704 8,185 4.0%Business Services - 6,078 1,630 7,708 5.0%Education and Health Care - 22 3,522 3,543 3.3%Recreation and Entertainment 5,863 301 243 6,408 6.5%Lodging 16,098 109 130 16,337 7.0%Food & Beverage 13,676 411 809 14,897 5.5%Personal Services - 336 766 1,103 4.0%Government - 466 2,701 3,167 3.6%TOTAL 62,456 18,520 19,178 100,154 5.0%% change 5.4% 5.5% 3.3% 5.0%Note: Direct Sales include cost of goods sold for retail and gasoline stations
Tourism Sales (Output)(US$ Million, 2014)
13
Traveler-generated sales
* Direct sales include cost of goods sold for retail
** Air transport includes local airline and airport operations, including sales generated by inbound visitors, plus outbound and transit passengers
*** FIRE = Finance, Insurance, and Real Estate
Significant indirect benefits
14
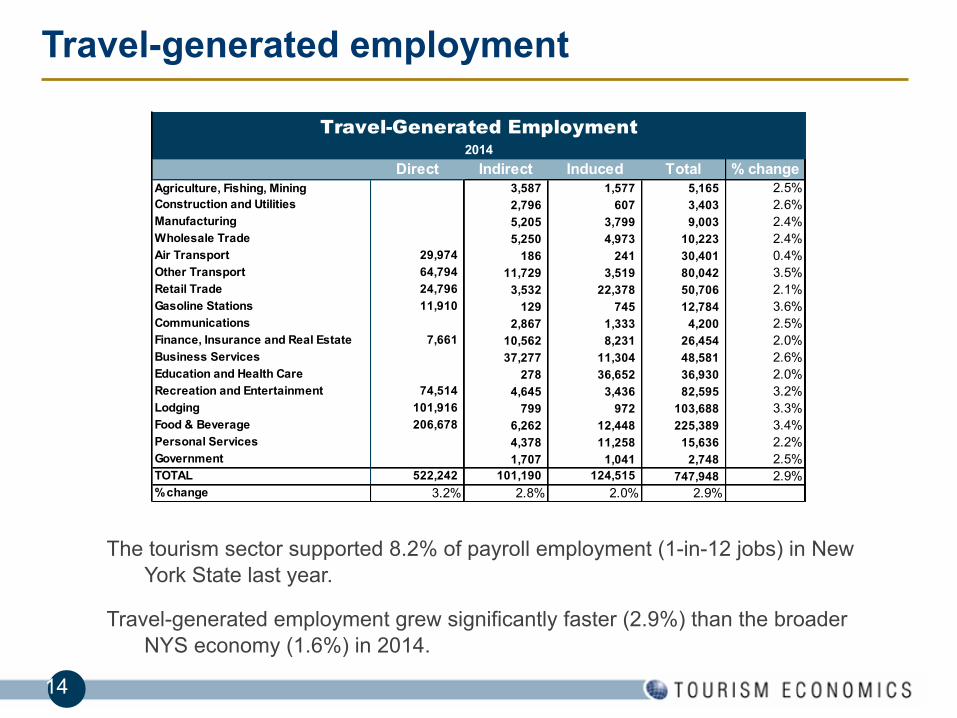
Travel-generated employment
The tourism sector supported 8.2% of payroll employment (1-in-12 jobs) in New York State last year.
Travel-generated employment grew significantly faster (2.9%) than the broader NYS economy (1.6%) in 2014.
Direct Indirect Induced Total % changeAgriculture, Fishing, Mining 3,587 1,577 5,165 2.5%Construction and Utilities 2,796 607 3,403 2.6%Manufacturing 5,205 3,799 9,003 2.4%Wholesale Trade 5,250 4,973 10,223 2.4%Air Transport 29,974 186 241 30,401 0.4%Other Transport 64,794 11,729 3,519 80,042 3.5%Retail Trade 24,796 3,532 22,378 50,706 2.1%Gasoline Stations 11,910 129 745 12,784 3.6%Communications 2,867 1,333 4,200 2.5%Finance, Insurance and Real Estate 7,661 10,562 8,231 26,454 2.0%Business Services 37,277 11,304 48,581 2.6%Education and Health Care 278 36,652 36,930 2.0%Recreation and Entertainment 74,514 4,645 3,436 82,595 3.2%Lodging 101,916 799 972 103,688 3.3%Food & Beverage 206,678 6,262 12,448 225,389 3.4%Personal Services 4,378 11,258 15,636 2.2%Government 1,707 1,041 2,748 2.5%TOTAL 522,242 101,190 124,515 747,948 2.9%% change 3.2% 2.8% 2.0% 2.9%
Travel-Generated Employment2014
15
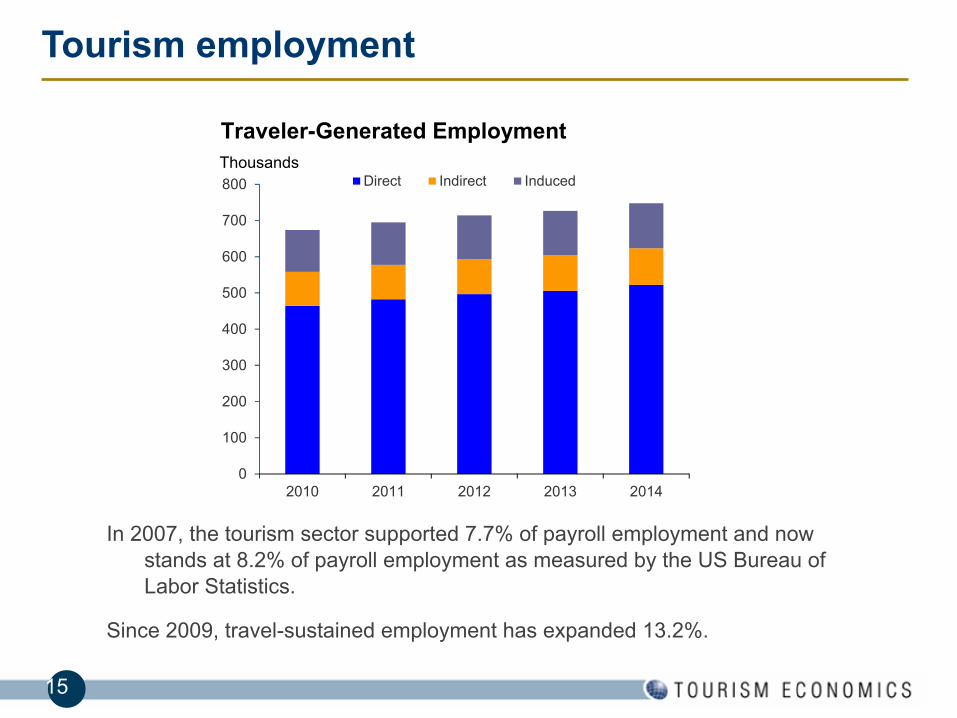
Tourism employment
In 2007, the tourism sector supported 7.7% of payroll employment and now stands at 8.2% of payroll employment as measured by the US Bureau of Labor Statistics.
Since 2009, travel-sustained employment has expanded 13.2%.
0
100
200
300
400
500
600
700
800
2010 2011 2012 2013 2014
Direct Indirect InducedThousands
Traveler-Generated Employment
16
Tourism employment
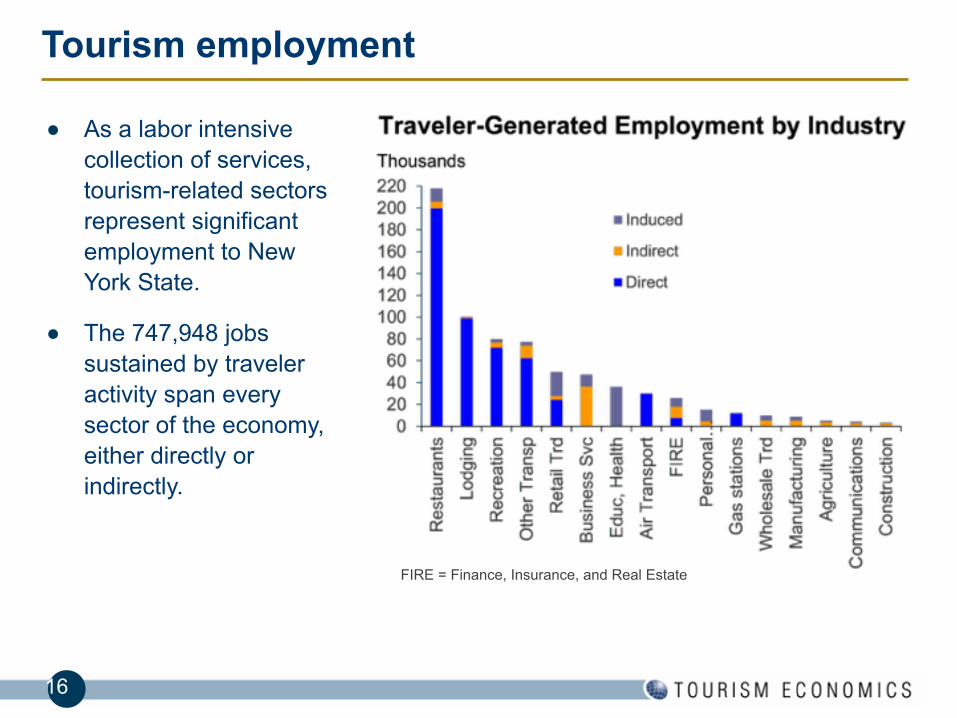
● As a labor intensive collection of services, tourism-related sectors represent significant employment to New York State.
● The 747,948 jobs sustained by traveler activity span every sector of the economy, either directly or indirectly.
FIRE = Finance, Insurance, and Real Estate
17
Tourism employment ranking
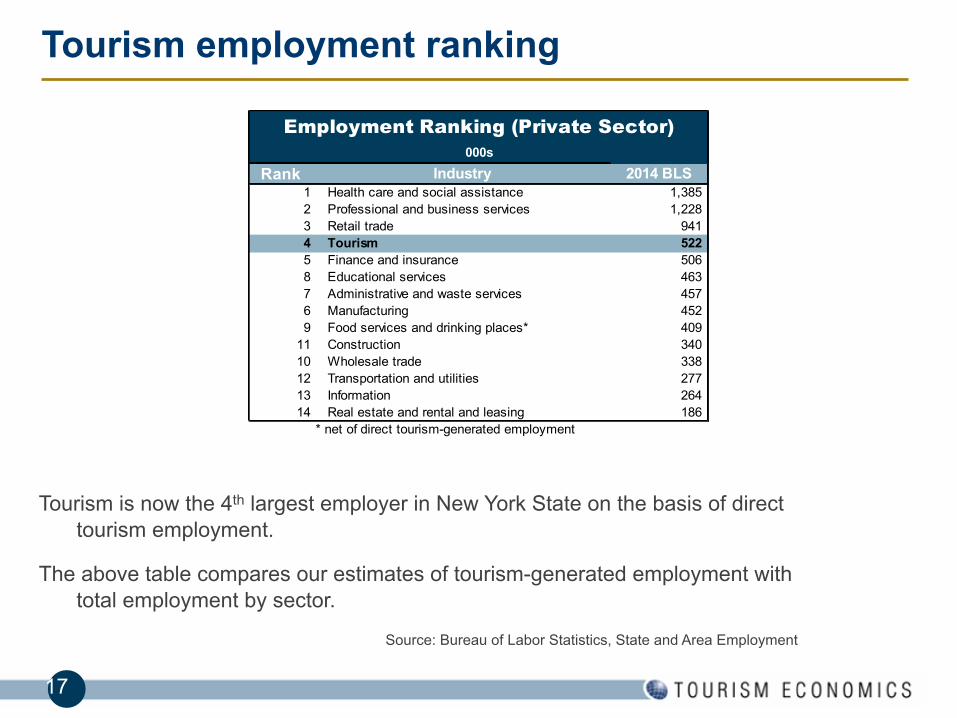
Tourism is now the 4th largest employer in New York State on the basis of direct tourism employment.
The above table compares our estimates of tourism-generated employment with total employment by sector.
Source: Bureau of Labor Statistics, State and Area Employment
Rank Industry 2014 BLS1 Health care and social assistance 1,385 2 Professional and business services 1,228 3 Retail trade 941 4 Tourism 522 5 Finance and insurance 506 8 Educational services 463 7 Administrative and waste services 457 6 Manufacturing 452 9 Food services and drinking places* 409
11 Construction 340 10 Wholesale trade 338 12 Transportation and utilities 277 13 Information 264 14 Real estate and rental and leasing 186
* net of direct tourism-generated employment
Employment Ranking (Private Sector)000s
18
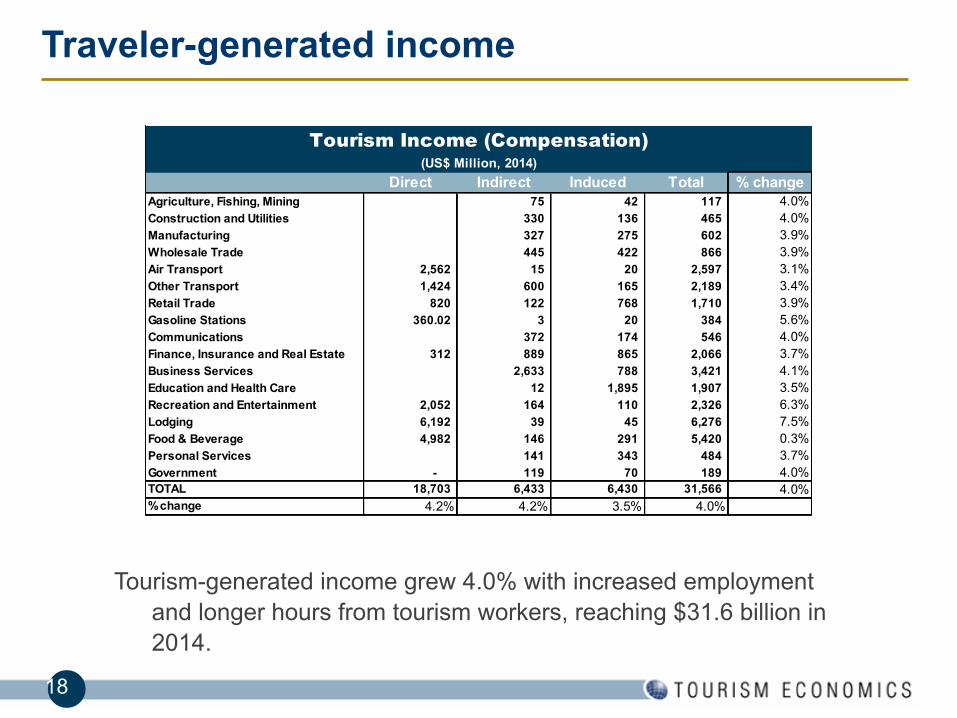
Tourism-generated income grew 4.0% with increased employment and longer hours from tourism workers, reaching $31.6 billion in 2014.
Traveler-generated income
Direct Indirect Induced Total % changeAgriculture, Fishing, Mining 75 42 117 4.0%Construction and Utilities 330 136 465 4.0%Manufacturing 327 275 602 3.9%Wholesale Trade 445 422 866 3.9%Air Transport 2,562 15 20 2,597 3.1%Other Transport 1,424 600 165 2,189 3.4%Retail Trade 820 122 768 1,710 3.9%Gasoline Stations 360.02 3 20 384 5.6%Communications 372 174 546 4.0%Finance, Insurance and Real Estate 312 889 865 2,066 3.7%Business Services 2,633 788 3,421 4.1%Education and Health Care 12 1,895 1,907 3.5%Recreation and Entertainment 2,052 164 110 2,326 6.3%Lodging 6,192 39 45 6,276 7.5%Food & Beverage 4,982 146 291 5,420 0.3%Personal Services 141 343 484 3.7%Government - 119 70 189 4.0%TOTAL 18,703 6,433 6,430 31,566 4.0%% change 4.2% 4.2% 3.5% 4.0%
Tourism Income (Compensation)(US$ Million, 2014)
19
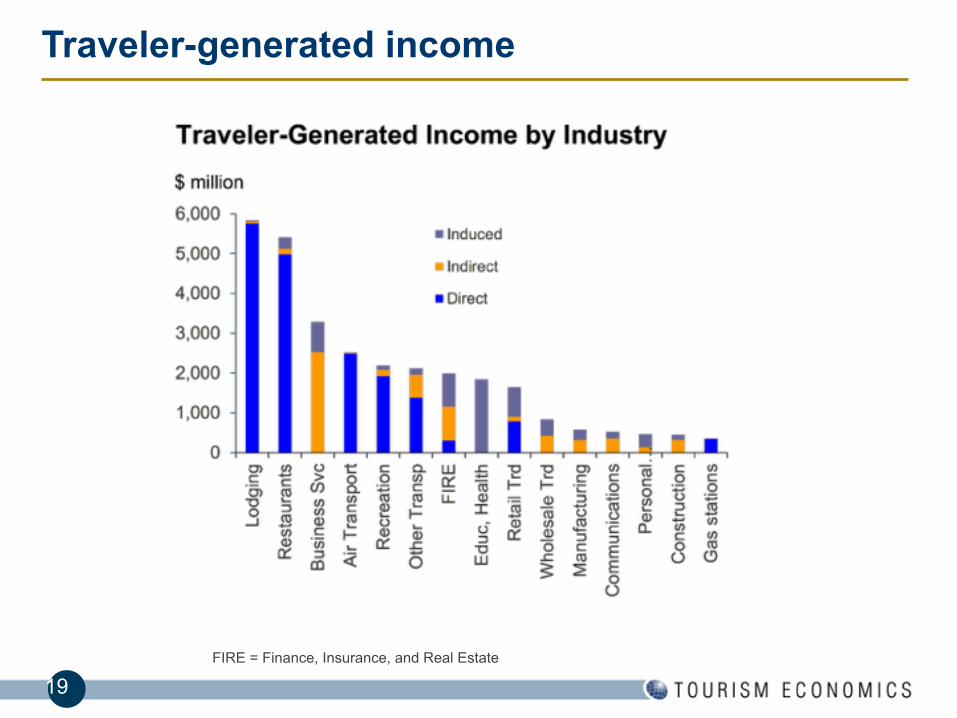
Traveler-generated income
FIRE = Finance, Insurance, and Real Estate

20
Tourism tax generation
● Tourism generated $16 billion in taxes in 2014, growing 4.5%.
● Total state and local tax proceeds of $7.8 billion saved the state’s households an average of $962 in tax burden.
TotalFederal Taxes 8,203.5 Corporate 1,447.5 Indirect Business 650.0 Personal Income 2,883.8 Social Security 3,222.3
State and Local Taxes 7,817.3 Corporate 1,541.6 Personal Income 1,246.9 Sales 2,355.6 Property 2,246.8 Excise and Fees 310.1 State Unemployment 116.3
TOTAL 16,020.8 % change 4.5%
Travel-Generated Taxes(US$ Million, 2014)
21
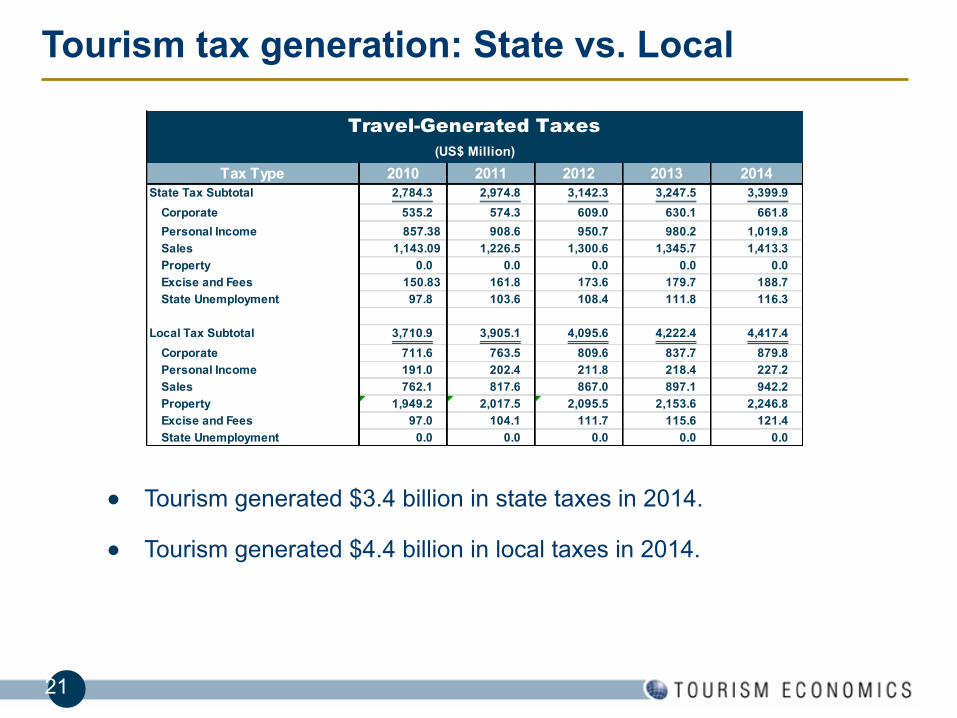
Tourism tax generation: State vs. Local
● Tourism generated $3.4 billion in state taxes in 2014.
● Tourism generated $4.4 billion in local taxes in 2014.
Tax Type 2010 2011 2012 2013 2014State Tax Subtotal 2,784.3 2,974.8 3,142.3 3,247.5 3,399.9
Corporate 535.2 574.3 609.0 630.1 661.8
Personal Income 857.38 908.6 950.7 980.2 1,019.8Sales 1,143.09 1,226.5 1,300.6 1,345.7 1,413.3Property 0.0 0.0 0.0 0.0 0.0Excise and Fees 150.83 161.8 173.6 179.7 188.7State Unemployment 97.8 103.6 108.4 111.8 116.3
Local Tax Subtotal 3,710.9 3,905.1 4,095.6 4,222.4 4,417.4
Corporate 711.6 763.5 809.6 837.7 879.8Personal Income 191.0 202.4 211.8 218.4 227.2Sales 762.1 817.6 867.0 897.1 942.2Property 1,949.2 2,017.5 2,095.5 2,153.6 2,246.8Excise and Fees 97.0 104.1 111.7 115.6 121.4State Unemployment 0.0 0.0 0.0 0.0 0.0
Travel-Generated Taxes(US$ Million)
22
Regional Summary
23
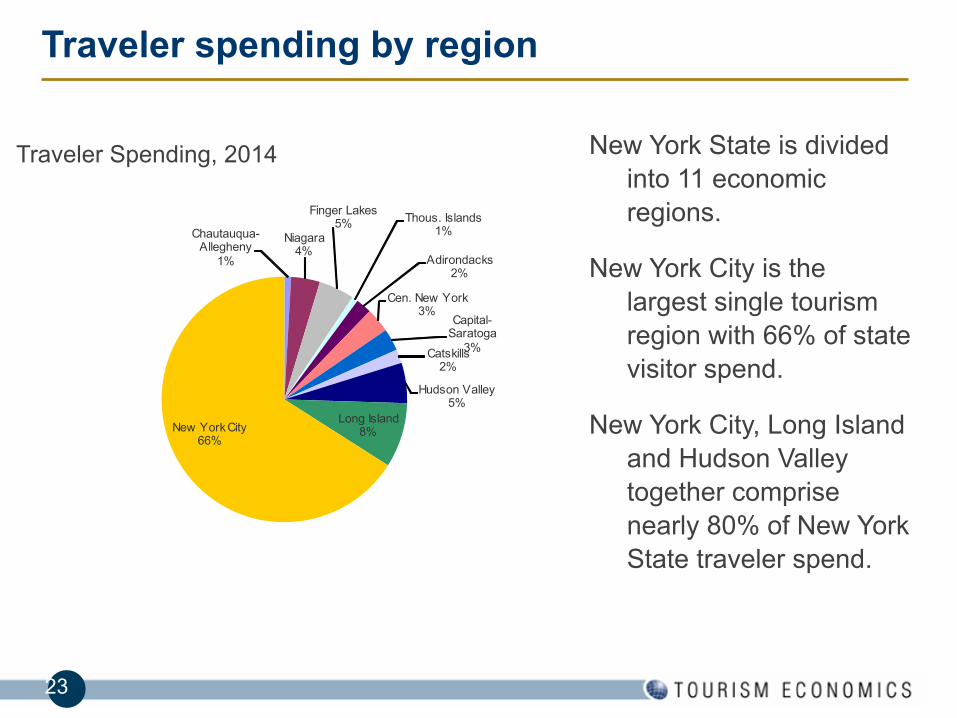
Traveler spending by region
New York State is divided into 11 economic regions.
New York City is the largest single tourism region with 66% of state visitor spend.
New York City, Long Island and Hudson Valley together comprise nearly 80% of New York State traveler spend.
Traveler Spending, 2014
Chautauqua-Allegheny
1%
Niagara4%
Finger Lakes5% Thous. Islands
1%
Adirondacks2%
Cen. New York3%
Capital-Saratoga
3%Catskills2%
Hudson Valley5%
Long Island8%New York City
66%
24
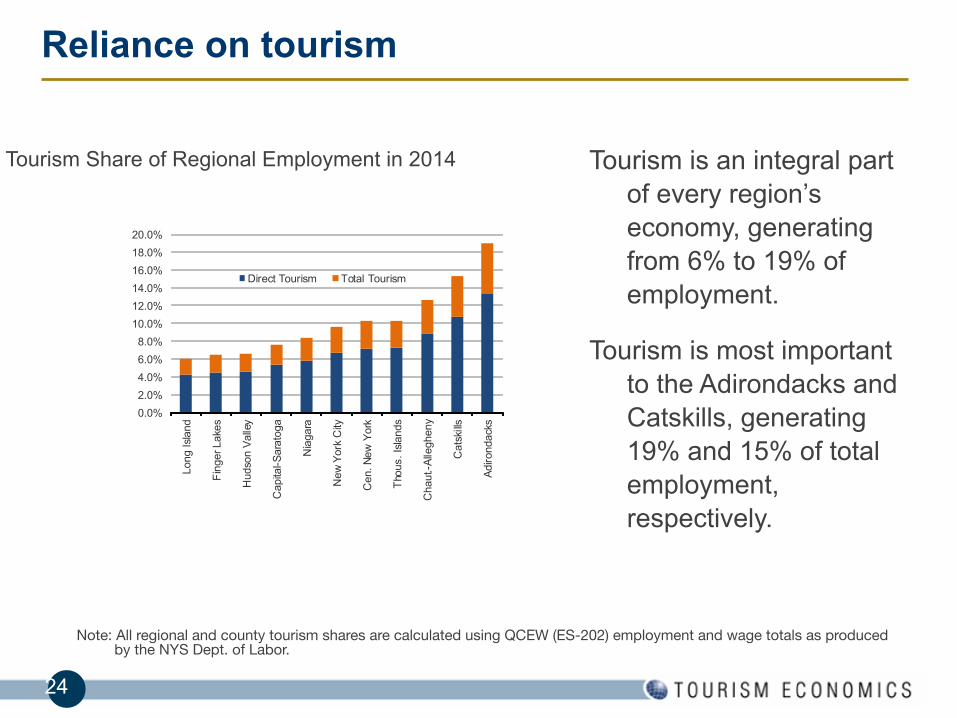
Reliance on tourism
Tourism is an integral part of every region’s economy, generating from 6% to 19% of employment.
Tourism is most important to the Adirondacks and Catskills, generating 19% and 15% of total employment, respectively.
Note: All regional and county tourism shares are calculated using QCEW (ES-202) employment and wage totals as produced by the NYS Dept. of Labor.
Tourism Share of Regional Employment in 2014
0.0%2.0%4.0%6.0%8.0%
10.0%12.0%14.0%16.0%18.0%20.0%
Long
Isla
nd
Fing
er L
akes
Hud
son
Valle
y
Cap
ital-S
arat
oga
Nia
gara
New
Yor
k C
ity
Cen
. New
Yor
k
Thou
s. Is
land
s
Cha
ut.-A
llegh
eny
Cat
skills
Adiro
ndac
ks
Direct Tourism Total Tourism
25
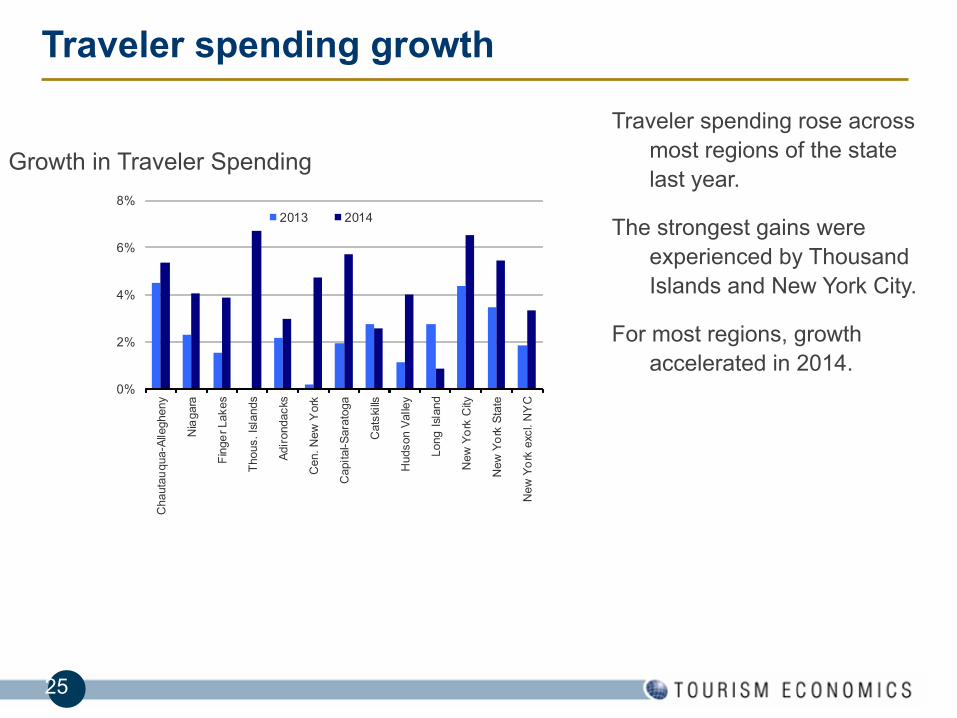
Traveler spending growth
Traveler spending rose across most regions of the state last year.
The strongest gains were experienced by Thousand Islands and New York City.
For most regions, growth accelerated in 2014.
Growth in Traveler Spending
0%
2%
4%
6%
8%
Cha
utau
qua-
Alle
ghen
y
Nia
gara
Fing
er L
akes
Thou
s. Is
land
s
Adiro
ndac
ks
Cen
. New
Yor
k
Cap
ital-S
arat
oga
Cat
skills
Hud
son
Valle
y
Long
Isla
nd
New
Yor
k C
ity
New
Yor
k St
ate
New
Yor
k ex
cl. N
YC
2013 2014
26
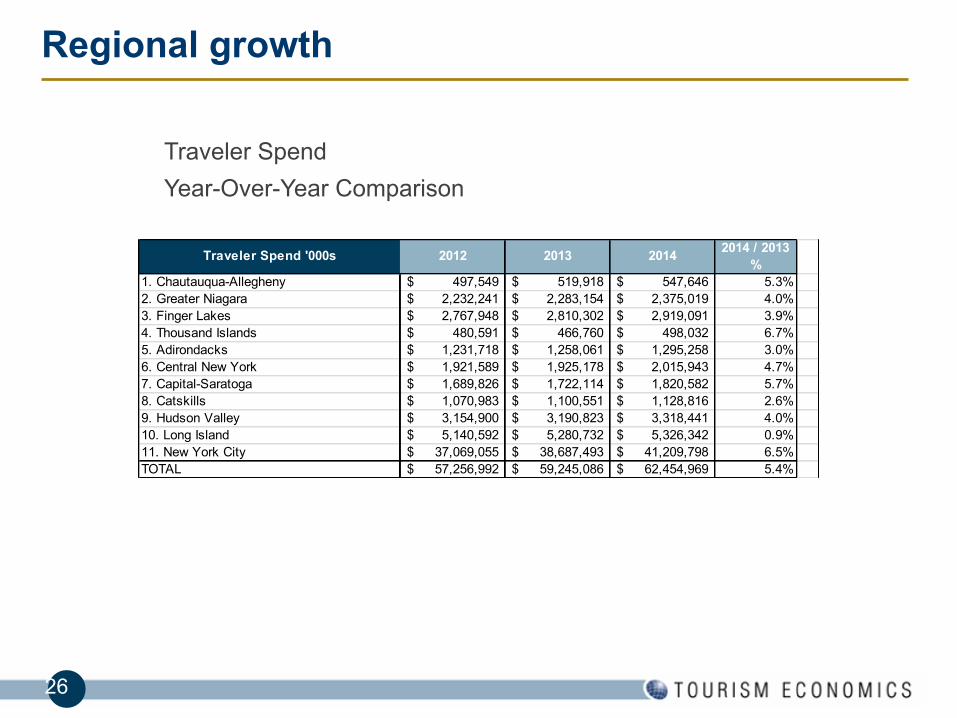
Regional growth
Business Day
Traveler Spend Year-Over-Year Comparison
Traveler Spend '000s 2012 2013 2014 2014 / 2013 %
1. Chautauqua-Allegheny 497,549$ 519,918$ 547,646$ 5.3%2. Greater Niagara 2,232,241$ 2,283,154$ 2,375,019$ 4.0%3. Finger Lakes 2,767,948$ 2,810,302$ 2,919,091$ 3.9%4. Thousand Islands 480,591$ 466,760$ 498,032$ 6.7%5. Adirondacks 1,231,718$ 1,258,061$ 1,295,258$ 3.0%6. Central New York 1,921,589$ 1,925,178$ 2,015,943$ 4.7%7. Capital-Saratoga 1,689,826$ 1,722,114$ 1,820,582$ 5.7%8. Catskills 1,070,983$ 1,100,551$ 1,128,816$ 2.6%9. Hudson Valley 3,154,900$ 3,190,823$ 3,318,441$ 4.0%10. Long Island 5,140,592$ 5,280,732$ 5,326,342$ 0.9%11. New York City 37,069,055$ 38,687,493$ 41,209,798$ 6.5%TOTAL 57,256,992$ 59,245,086$ 62,454,969$ 5.4%

27
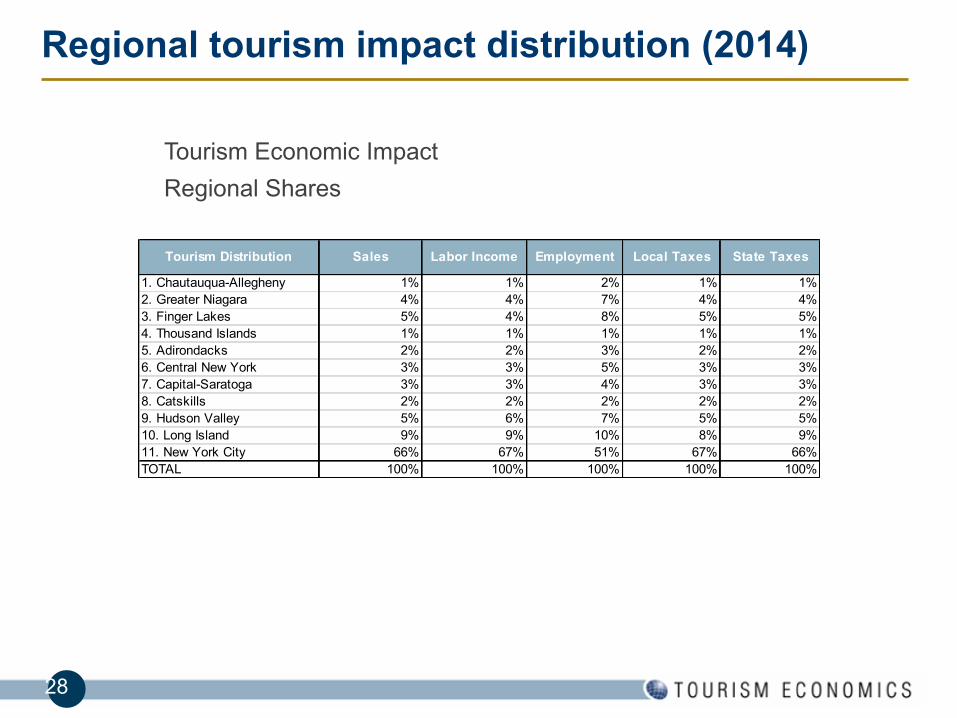
Regional tourism summary (2014)
Business Day
Tourism Economic Impact Combined Direct, Indirect, and Induced
Tourism Economic Impact Direct Sales, '000s
Labor Income, '000s
Employment, Persons
Local Taxes, '000s
State Taxes, '000s
1. Chautauqua-Allegheny 547,646$ 238,847$ 11,734 37,940$ 29,895$ 2. Greater Niagara 2,375,019$ 1,247,562$ 48,633 160,726$ 129,648$ 3. Finger Lakes 2,919,091$ 1,412,174$ 59,238 212,093$ 159,348$ 4. Thousand Islands 498,032$ 208,462$ 8,842 32,758$ 27,187$ 5. Adirondacks 1,295,258$ 590,003$ 21,203 88,969$ 70,706$ 6. Central New York 2,015,943$ 999,711$ 35,892 127,853$ 110,047$ 7. Capital-Saratoga 1,820,582$ 912,230$ 32,244 124,757$ 99,382$ 8. Catskills 1,128,816$ 494,179$ 17,275 75,231$ 61,620$ 9. Hudson Valley 3,318,441$ 1,777,390$ 54,276 218,970$ 181,148$ 10. Long Island 5,326,342$ 2,732,504$ 75,386 357,799$ 290,756$ 11. New York City 41,209,798$ 21,216,656$ 383,225 2,982,206$ 2,249,571$ TOTAL 62,454,969$ 31,829,718$ 747,948 4,419,302$ 3,409,308$
28
Regional tourism impact distribution (2014)
Business Day
Tourism Economic Impact Regional Shares
Tourism Distribution Sales Labor Income Employment Local Taxes State Taxes
1. Chautauqua-Allegheny 1% 1% 2% 1% 1%2. Greater Niagara 4% 4% 7% 4% 4%3. Finger Lakes 5% 4% 8% 5% 5%4. Thousand Islands 1% 1% 1% 1% 1%5. Adirondacks 2% 2% 3% 2% 2%6. Central New York 3% 3% 5% 3% 3%7. Capital-Saratoga 3% 3% 4% 3% 3%8. Catskills 2% 2% 2% 2% 2%9. Hudson Valley 5% 6% 7% 5% 5%10. Long Island 9% 9% 10% 8% 9%11. New York City 66% 67% 51% 67% 66%TOTAL 100% 100% 100% 100% 100%
29
Business Day
Regional Detail for
The Adirondacks
30
Adirondacks, county distribution
Business
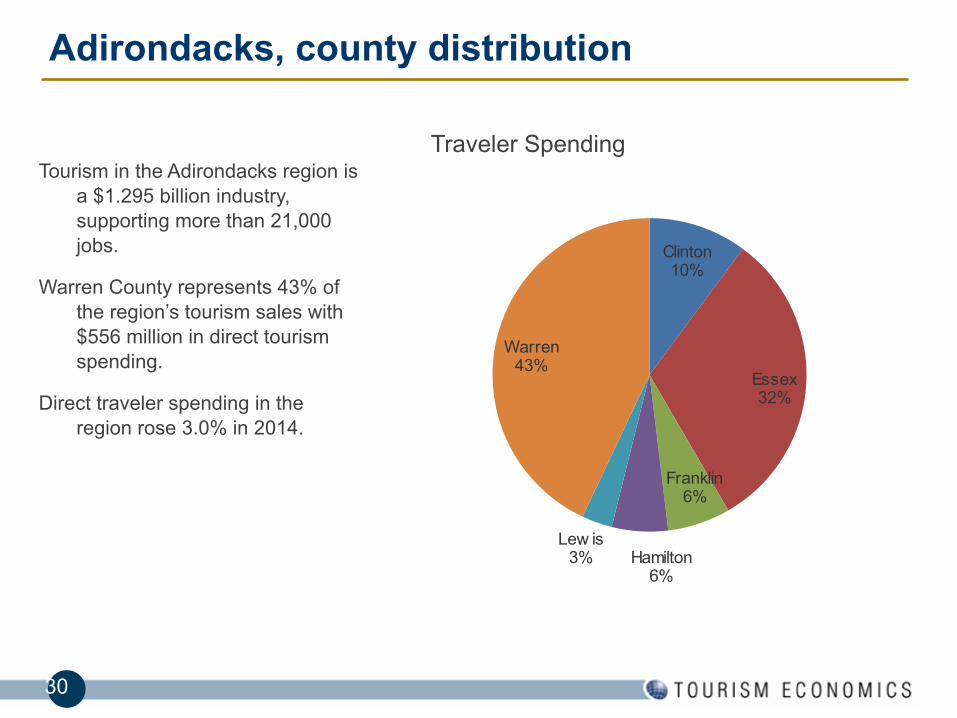
Tourism in the Adirondacks region is a $1.295 billion industry, supporting more than 21,000 jobs.
Warren County represents 43% of the region’s tourism sales with $556 million in direct tourism spending.
Direct traveler spending in the region rose 3.0% in 2014.
Traveler Spending
Clinton10%
Essex32%
Franklin6%
Hamilton6%
Lew is3%
Warren43%

31
Business Day
Total Tourism Impact, 2014
Traveler Spend '000
Labor Income, '000
Employment Local Taxes '000
State Taxes '000
Clinton $131,161 $62,896 2,647 $8,709 $7,160Essex $408,122 $191,432 6,352 $28,258 $22,279Franklin $83,657 $36,548 1,668 $5,426 $4,567Hamilton $75,007 $26,465 936 $4,715 $4,095Lewis $40,591 $13,626 565 $3,102 $2,216Warren $556,719 $259,036 9,036 $38,759 $30,390TOTAL $1,295,258 $590,003 21,203 $88,969 $70,706
Adirondacks, total tourism impact
32
Adirondacks, traveler spending
Business Day
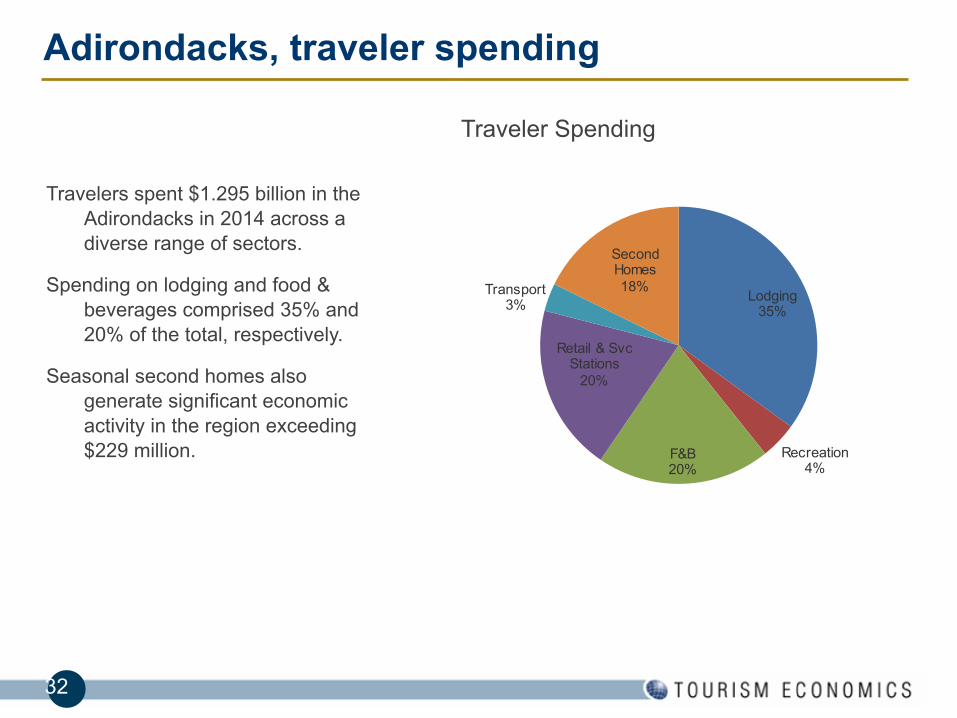
Travelers spent $1.295 billion in the Adirondacks in 2014 across a diverse range of sectors.
Spending on lodging and food & beverages comprised 35% and 20% of the total, respectively.
Seasonal second homes also generate significant economic activity in the region exceeding $229 million.
Traveler Spending
Lodging35%
Recreation4%
F&B20%
Retail & Svc Stations
20%
Transport3%
Second Homes18%
33
Business Day
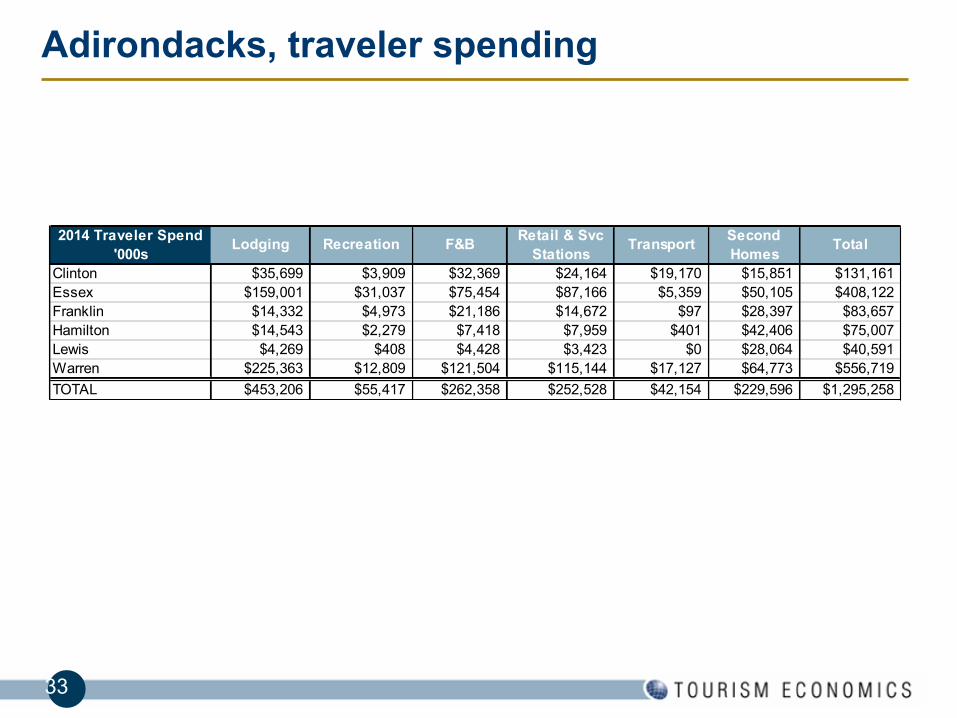
2014 Traveler Spend '000s
Lodging Recreation F&B Retail & Svc Stations
Transport Second Homes
Total
Clinton $35,699 $3,909 $32,369 $24,164 $19,170 $15,851 $131,161Essex $159,001 $31,037 $75,454 $87,166 $5,359 $50,105 $408,122Franklin $14,332 $4,973 $21,186 $14,672 $97 $28,397 $83,657Hamilton $14,543 $2,279 $7,418 $7,959 $401 $42,406 $75,007Lewis $4,269 $408 $4,428 $3,423 $0 $28,064 $40,591Warren $225,363 $12,809 $121,504 $115,144 $17,127 $64,773 $556,719TOTAL $453,206 $55,417 $262,358 $252,528 $42,154 $229,596 $1,295,258
Adirondacks, traveler spending
34
Regional growth
Traveler Spend '000s 2012 2013 2014 2014 / 2013 %
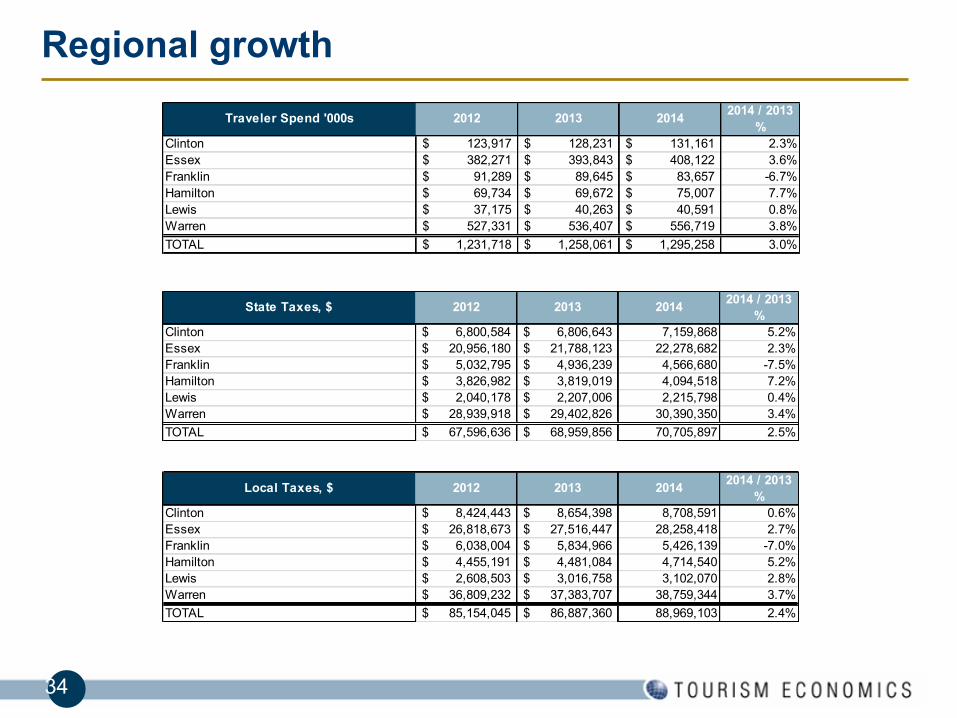
Clinton 123,917$ 128,231$ 131,161$ 2.3%Essex 382,271$ 393,843$ 408,122$ 3.6%Franklin 91,289$ 89,645$ 83,657$ -6.7%Hamilton 69,734$ 69,672$ 75,007$ 7.7%Lewis 37,175$ 40,263$ 40,591$ 0.8%Warren 527,331$ 536,407$ 556,719$ 3.8%TOTAL 1,231,718$ 1,258,061$ 1,295,258$ 3.0%
Local Taxes, $ 2012 2013 2014 2014 / 2013 %
Clinton 8,424,443$ 8,654,398$ 8,708,591 0.6%Essex 26,818,673$ 27,516,447$ 28,258,418 2.7%Franklin 6,038,004$ 5,834,966$ 5,426,139 -7.0%Hamilton 4,455,191$ 4,481,084$ 4,714,540 5.2%Lewis 2,608,503$ 3,016,758$ 3,102,070 2.8%Warren 36,809,232$ 37,383,707$ 38,759,344 3.7%TOTAL 85,154,045$ 86,887,360$ 88,969,103 2.4%
State Taxes, $ 2012 2013 2014 2014 / 2013 %
Clinton 6,800,584$ 6,806,643$ 7,159,868 5.2%Essex 20,956,180$ 21,788,123$ 22,278,682 2.3%Franklin 5,032,795$ 4,936,239$ 4,566,680 -7.5%Hamilton 3,826,982$ 3,819,019$ 4,094,518 7.2%Lewis 2,040,178$ 2,207,006$ 2,215,798 0.4%Warren 28,939,918$ 29,402,826$ 30,390,350 3.4%TOTAL 67,596,636$ 68,959,856$ 70,705,897 2.5%
35
Adirondacks, labor income
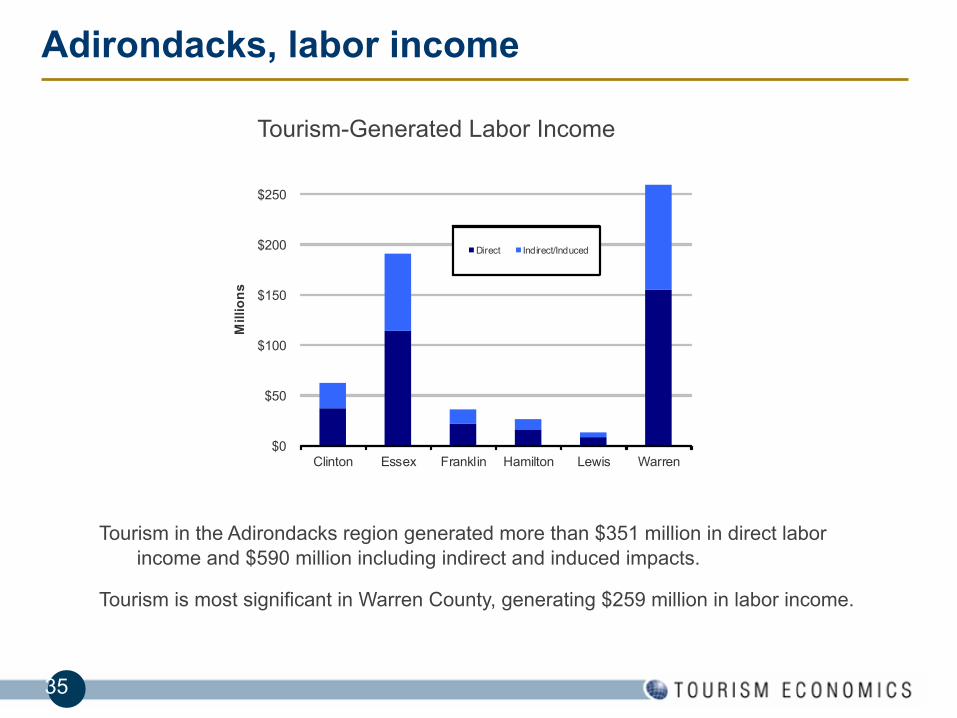
Business DayTourism in the Adirondacks region generated more than $351 million in direct labor
income and $590 million including indirect and induced impacts.
Tourism is most significant in Warren County, generating $259 million in labor income.
Tourism-Generated Labor Income
$0
$50
$100
$150
$200
$250
Clinton Essex Franklin Hamilton Lewis Warren
Millions
Direct Indirect/Induced
36
Business Day
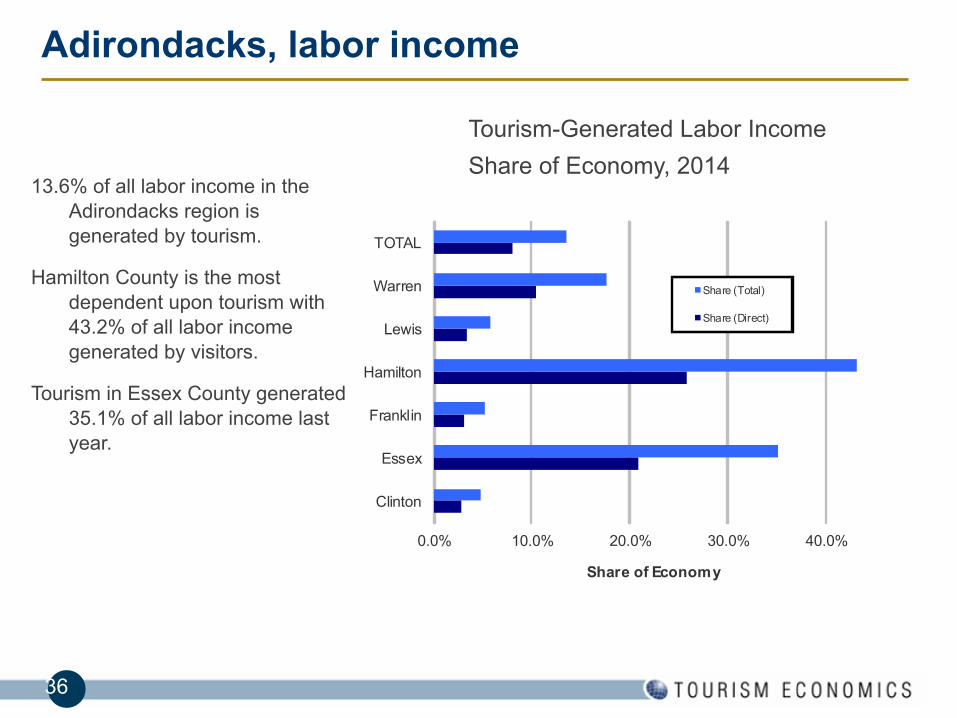
13.6% of all labor income in the Adirondacks region is generated by tourism.
Hamilton County is the most dependent upon tourism with 43.2% of all labor income generated by visitors.
Tourism in Essex County generated 35.1% of all labor income last year.
Tourism-Generated Labor Income Share of Economy, 2014
Adirondacks, labor income
0.0% 10.0% 20.0% 30.0% 40.0%
Clinton
Essex
Franklin
Hamilton
Lewis
Warren
TOTAL
Share of Economy
Share (Total)
Share (Direct)
37
Business Day
Adirondacks, labor income
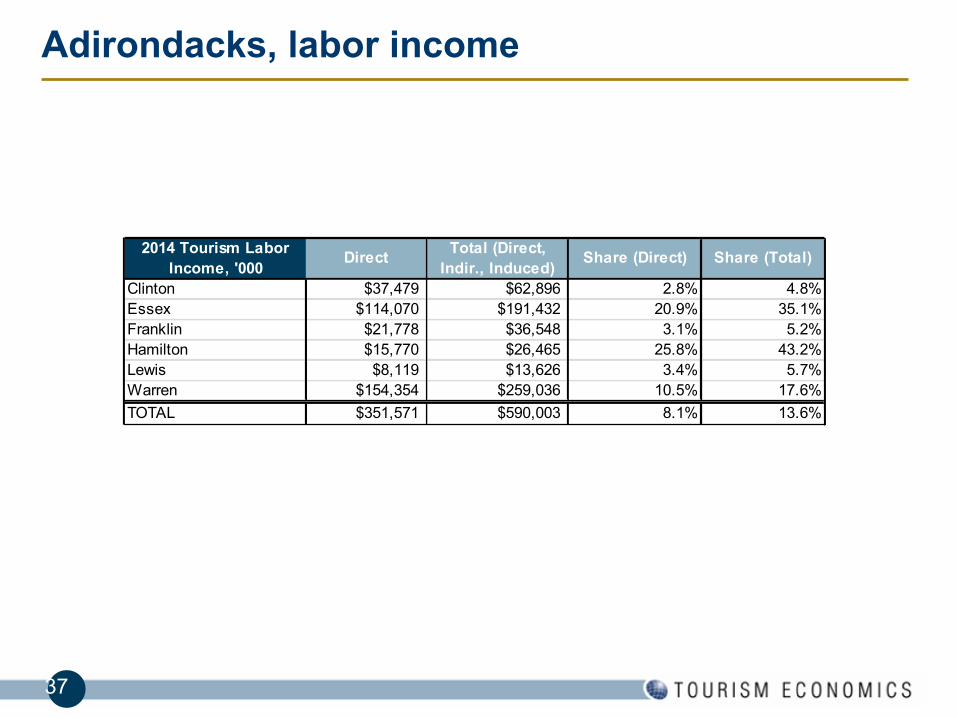
2014 Tourism Labor Income, '000
Direct Total (Direct, Indir., Induced)
Share (Direct) Share (Total)
Clinton $37,479 $62,896 2.8% 4.8%Essex $114,070 $191,432 20.9% 35.1%Franklin $21,778 $36,548 3.1% 5.2%Hamilton $15,770 $26,465 25.8% 43.2%Lewis $8,119 $13,626 3.4% 5.7%Warren $154,354 $259,036 10.5% 17.6%TOTAL $351,571 $590,003 8.1% 13.6%

38
Adirondacks, tourism employment
Business Day
19.0% of all employment in the Adirondacks region is generated by tourism.
Hamilton County is again the most dependent upon tourism with 49.4% of all employment sustained by visitors.
Tourism-Generated Employment Share of Economy, 2014
0.0% 10.0% 20.0% 30.0% 40.0% 50.0% 60.0%
Clinton
Essex
Franklin
Hamilton
Lewis
Warren
TOTAL
Share of Economy
Share (Total)
Share (Direct)

39
Business Day
Adirondacks, tourism employment
2014 Tourism Employment
Direct Total (Direct, Ind., Induced)
Share (Direct) Share (Total)
Clinton 1,848 2,647 5.6% 8.1%Essex 4,435 6,352 30.3% 43.4%Franklin 1,165 1,668 6.5% 9.3%Hamilton 653 936 34.5% 49.4%Lewis 394 565 6.1% 8.7%Warren 6,309 9,036 16.6% 23.8%TOTAL 14,805 21,203 13.3% 19.0%
Tourism-Generated Employment, 2014
0
1,000
2,000
3,000
4,000
5,000
6,000
7,000
8,000
9,000
10,000
Clinton Essex Franklin Hamilton Lewis Warren
Direct Indirect/Induced
40
Adirondacks, tourism taxes
Business Day
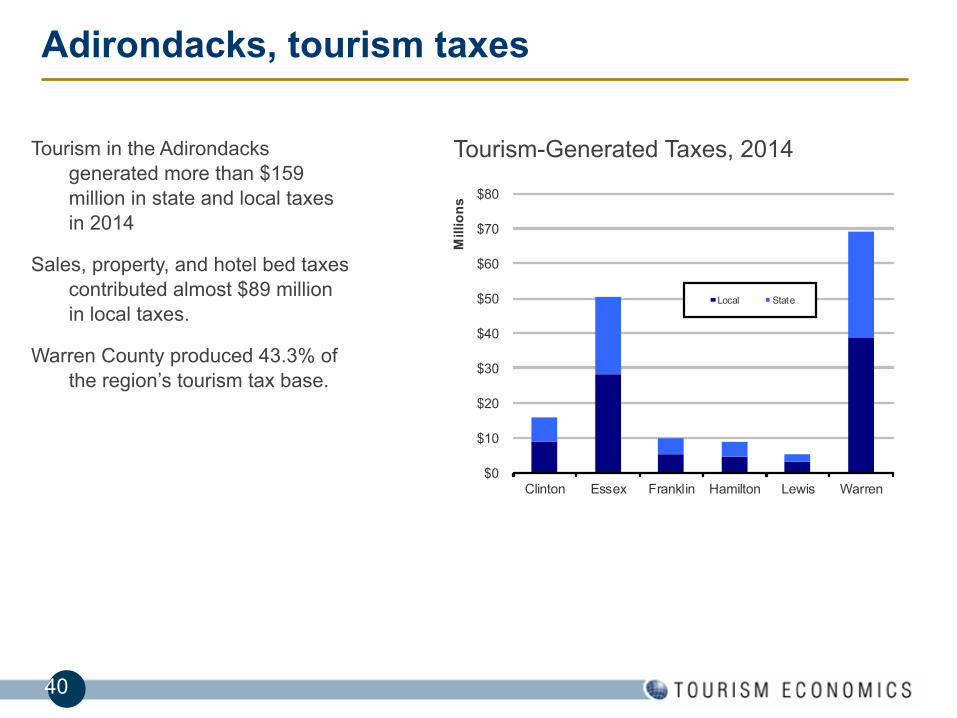
Tourism in the Adirondacks generated more than $159 million in state and local taxes in 2014
Sales, property, and hotel bed taxes contributed almost $89 million in local taxes.
Warren County produced 43.3% of the region’s tourism tax base.
Tourism-Generated Taxes, 2014
$0
$10
$20
$30
$40
$50
$60
$70
$80
Clinton Essex Franklin Hamilton Lewis Warren
Millions
Local State
41
Adirondacks, tourism taxes
Business Day
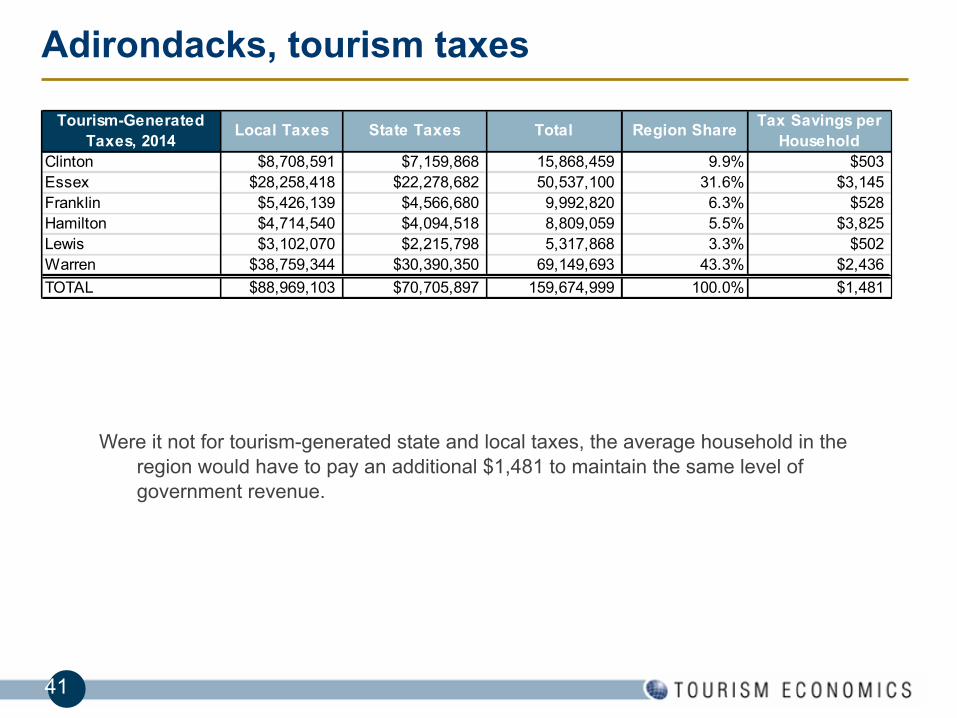
Tourism-Generated Taxes, 2014
Local Taxes State Taxes Total Region Share Tax Savings per Household
Clinton $8,708,591 $7,159,868 15,868,459 9.9% $503Essex $28,258,418 $22,278,682 50,537,100 31.6% $3,145Franklin $5,426,139 $4,566,680 9,992,820 6.3% $528Hamilton $4,714,540 $4,094,518 8,809,059 5.5% $3,825Lewis $3,102,070 $2,215,798 5,317,868 3.3% $502Warren $38,759,344 $30,390,350 69,149,693 43.3% $2,436TOTAL $88,969,103 $70,705,897 159,674,999 100.0% $1,481
Were it not for tourism-generated state and local taxes, the average household in the region would have to pay an additional $1,481 to maintain the same level of government revenue.
42
Household surveys from the US Travel Association and Longwoods International have provided key inputs in establishing traveler spending figures. Industry data on lodging, airports, Amtrak, and attractions contribute to year-over-year growth analysis.
Employment definitions. The basis of our data and modeling is the Regional Economic Information System (REIS), Bureau of Economic Analysis, U.S. Department of Commerce. This is different than the NYS Department of Labor data source (ES202/QCEW). The main definitional difference is that sole-proprietors, which do not require unemployment insurance and are not counted in the ES202 data. BEA data shows (for example) state accommodations employment at 89,124, compared with QCEW at 82,190. For total employment (across all sectors), the difference is 20%.
International methodology. Our approach (through Travel Industry Association calculations) is based the estimates on direct survey responses to the Department of Commerce in-flight survey and Statistics Canada data – constrained to BEA international balance of payments data. The NY data are consistent with TIA’s state-by-state distribution which ensures against overestimation.
All employment and income results are constrained to known industry measurements for key tourism sectors.
Methods and data sources
43
Local taxes are a build-up of individual categories (sales, occupancy, property). The model is not equipped to deal with individual exemptions such as Indian gaming.
Second home expenditures are based on the stock of seasonal second home inventory. Annual average expenditures for housing are pro-rated to the season length to account for various levels of expenditures not accounted in visitor surveys.
Lodging sector. Our models use survey information and constrains this to the value of the hotel sector in each county. This can vary from certain bed tax estimates of total revenue for several reasons. One is that the bed tax may only be based on room revenue while total sales for the industry may include other revenue sources (room service, phone, etc.). Another is that certain smaller establishments may not fully report or be required to report their revenue.
Methods and data sources
44
Tourism Economics utilized the IMPLAN input-output model for New York State to track the flow of sales through the economy to the generation of GDP, employment, wages, and taxes.
The impacts are measured on three levels:
Direct impact: The immediate benefit to persons and companies directly providing goods or services to travelers.
Indirect impact: The secondary benefit to suppliers of goods and services to the directly-involved companies. For example, a food wholesaler providing goods to a restaurant. The model is careful to exclude imports from the impact calculations.
Induced impact: The tertiary benefit to the local economy as incomes in the prior two levels of impact are spent on goods and services. For example, a restaurant employee spends his wages at a grocery store, generating addition economic output.
Methods and data sources
45
About Tourism Economics
Tourism Economics, headquartered in Philadelphia, is an Oxford Economics company dedicated to providing high value, robust, and relevant analyses of the tourism sector that reflects the dynamics of local and global economies. By combining quantitative methods with industry knowledge, Tourism Economics designs custom market strategies, project feasibility analysis, tourism forecasting models, tourism policy analysis, and economic impact studies.
Our staff have worked with over 100 destinations to quantify the economic value of tourism, forecast demand, guide strategy, or evaluate tourism policies.
Oxford Economics is one of the world’s leading providers of economic analysis, forecasts and consulting advice. Founded in 1981 as a joint venture with Oxford University’s business college, Oxford Economics is founded on a reputation for high quality, quantitative analysis and evidence-based advice. For this, it draws on its own staff of 40 highly-experienced professional economists; a dedicated data analysis team; global modeling tools; close links with Oxford University, and a range of partner institutions in Europe, the US and in the United Nations Project Link.
For more information: [email protected].