Embed Size (px)
Citation preview
The Economic Impact
of Travel on Texas
1994-2016p
Prepared for
Texas Tourism
Office of the Governor
Texas Economic Development & Tourism
July 2017

This page intentionally blank
THE ECONOMIC IMPACT OF TRAVEL ON TEXAS
1994-2016p
Texas Tourism
Office of the Governor
Economic Development & Tourism
Primary Research Conducted By:
Dean Runyan Associates
Portland, Oregon
July 2017
This page intentionally blank
DEAN RUNYAN ASSOCIATES PAGE i
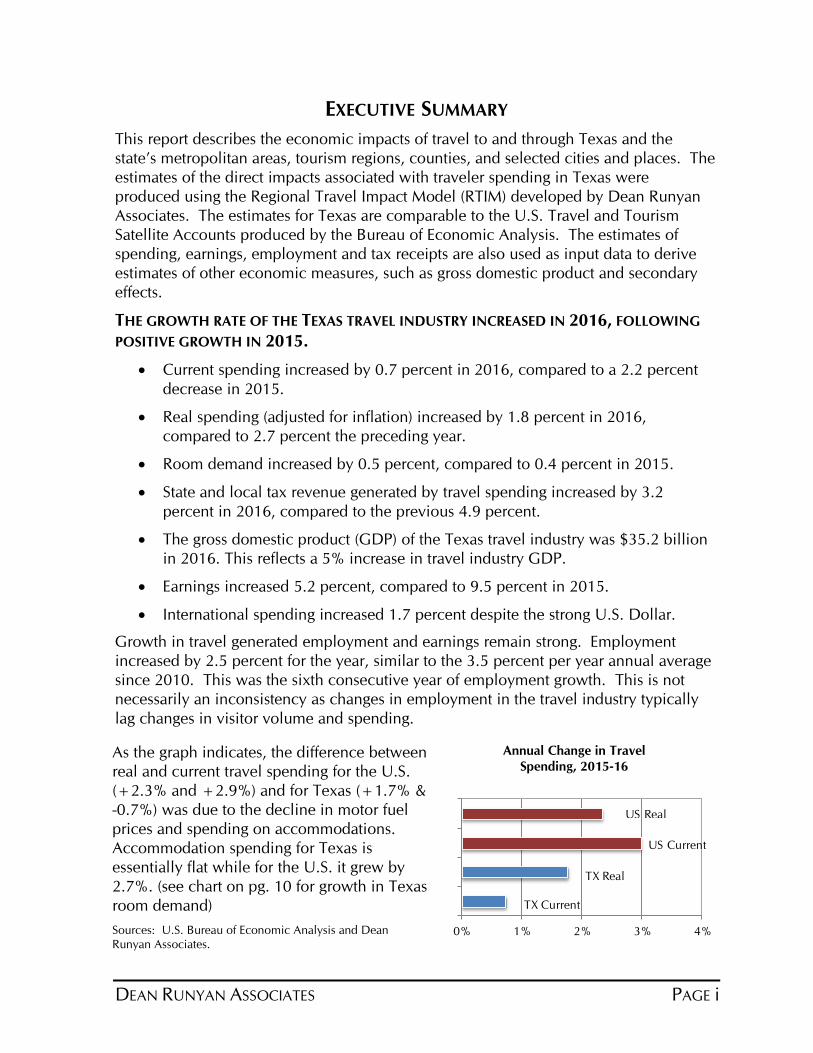
0% 1% 2% 3% 4%
US Real
US Current
TX Real
TX Current
EXECUTIVE SUMMARY
This report describes the economic impacts of travel to and through Texas and the
state’s metropolitan areas, tourism regions, counties, and selected cities and places. The
estimates of the direct impacts associated with traveler spending in Texas were
produced using the Regional Travel Impact Model (RTIM) developed by Dean Runyan
Associates. The estimates for Texas are comparable to the U.S. Travel and Tourism
Satellite Accounts produced by the Bureau of Economic Analysis. The estimates of
spending, earnings, employment and tax receipts are also used as input data to derive
estimates of other economic measures, such as gross domestic product and secondary
effects.
THE GROWTH RATE OF THE TEXAS TRAVEL INDUSTRY INCREASED IN 2016, FOLLOWING
POSITIVE GROWTH IN 2015.
Current spending increased by 0.7 percent in 2016, compared to a 2.2 percent
decrease in 2015.
Real spending (adjusted for inflation) increased by 1.8 percent in 2016,
compared to 2.7 percent the preceding year.
Room demand increased by 0.5 percent, compared to 0.4 percent in 2015.
State and local tax revenue generated by travel spending increased by 3.2
percent in 2016, compared to the previous 4.9 percent.
The gross domestic product (GDP) of the Texas travel industry was $35.2 billion
in 2016. This reflects a 5% increase in travel industry GDP.
Earnings increased 5.2 percent, compared to 9.5 percent in 2015.
International spending increased 1.7 percent despite the strong U.S. Dollar.
Growth in travel generated employment and earnings remain strong. Employment
increased by 2.5 percent for the year, similar to the 3.5 percent per year annual average
since 2010. This was the sixth consecutive year of employment growth. This is not
necessarily an inconsistency as changes in employment in the travel industry typically
lag changes in visitor volume and spending.
As the graph indicates, the difference between
real and current travel spending for the U.S.
(+2.3% and +2.9%) and for Texas (+1.7% &
-0.7%) was due to the decline in motor fuel
prices and spending on accommodations.
Accommodation spending for Texas is
essentially flat while for the U.S. it grew by
2.7%. (see chart on pg. 10 for growth in Texas
room demand)
Sources: U.S. Bureau of Economic Analysis and Dean Runyan Associates.
Annual Change in Travel
Spending, 2015-16
PAGE ii DEAN RUNYAN ASSOCIATES
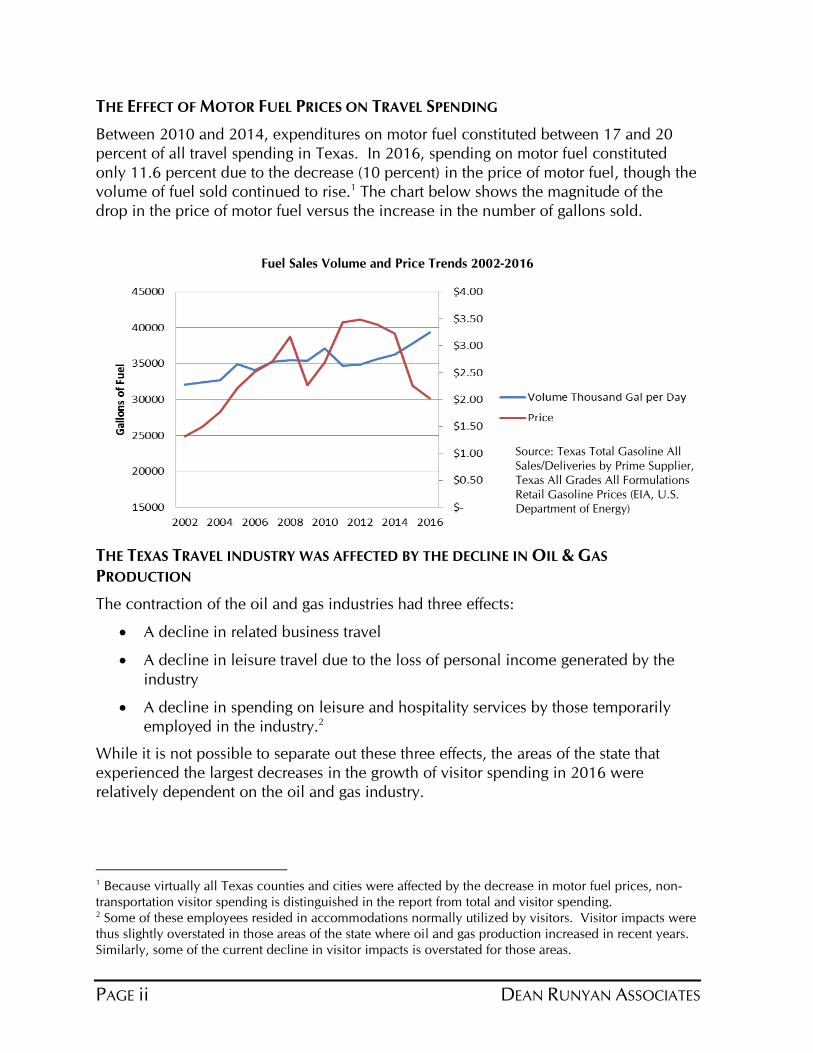
THE EFFECT OF MOTOR FUEL PRICES ON TRAVEL SPENDING
Between 2010 and 2014, expenditures on motor fuel constituted between 17 and 20
percent of all travel spending in Texas. In 2016, spending on motor fuel constituted
only 11.6 percent due to the decrease (10 percent) in the price of motor fuel, though the
volume of fuel sold continued to rise.1 The chart below shows the magnitude of the
drop in the price of motor fuel versus the increase in the number of gallons sold.
Fuel Sales Volume and Price Trends 2002-2016
THE TEXAS TRAVEL INDUSTRY WAS AFFECTED BY THE DECLINE IN OIL & GAS
PRODUCTION
The contraction of the oil and gas industries had three effects:
A decline in related business travel
A decline in leisure travel due to the loss of personal income generated by the
industry
A decline in spending on leisure and hospitality services by those temporarily
employed in the industry.2
While it is not possible to separate out these three effects, the areas of the state that experienced the largest decreases in the growth of visitor spending in 2016 were relatively dependent on the oil and gas industry.
1 Because virtually all Texas counties and cities were affected by the decrease in motor fuel prices, non-
transportation visitor spending is distinguished in the report from total and visitor spending. 2 Some of these employees resided in accommodations normally utilized by visitors. Visitor impacts were
thus slightly overstated in those areas of the state where oil and gas production increased in recent years.
Similarly, some of the current decline in visitor impacts is overstated for those areas.
Source: Texas Total Gasoline All
Sales/Deliveries by Prime Supplier,
Texas All Grades All Formulations
Retail Gasoline Prices (EIA, U.S. Department of Energy)
DEAN RUNYAN ASSOCIATES PAGE iii
TABLE OF CONTENTS
Section page
Executive Summary i
List of Tables and Figures iv
Preface viii
I U.S. Travel 1
II Texas Travel Impacts (Direct & Total) 5
III State and Local Government Revenue 18
IV Metropolitan Direct Travel Impacts 32
V Direct Travel Impacts for Tourism Regions 65
VI Direct County Travel Impacts 76
VII Texas City and Place Direct Travel Impacts 115
Appendices
A Regional Travel Impact Model 159
B Travel Industry Accounts 166
C Texas Earnings and Employment by Industry Sector 177
D Secondary Impacts Industry Groups 178
PAGE iv DEAN RUNYAN ASSOCIATES
LIST OF TABLES AND FIGURES
page
U.S. TravelAnnual Direct Travel Spending in U.S., 2000-16p 2
Spending by Foreign and Resident Travelers in U.S. 2
Foreign Share of U.S. Internal Travel Spending 3
Overseas Arrivals 3
Relative Value of Selected Foreign Currencies compared to U.S. Dollar 3
U.S. Travel Industry Employment 4
Components of U.S. Travel Industry Employment 4
State Tables & Figures
Texas Direct Travel Impacts, 1994-2016p (detail) 7-8
Texas Direct Travel Impacts, 2000-2016p (summary) 9
Texas Travel Spending in Real and Current Dollars 10
Domestic Air Passenger Arrivals to Texas 10
Texas Hotel/Motel Room Demand 10
Visitor Spending at Texas Destinations by Origin of Visitor (graph) 11
International Visitor Spending in Texas, 2000-16p 11
Texas Travel Impacts, 2016p, Origin of Visitor (table) 11
GDP of Texas Travel industry, 2016p 12
Texas Export-Oriented Industries Gross Domestic Product, 2016p 13
Total Employment & Earnings Generated by Travel Spending in Texas, 2016p 14
Direct and Secondary Employment, 2016p (graph) 16
Direct and Secondary Earnings, 2016p (graph) 16
Direct and Secondary Travel-Generated Employment, 2016p (table) 17
Direct and Secondary Travel-Generated Earnings, 2016p (table) 17
State and Local Government Revenue Tables & Figures
Production & Import Taxes as a Percent of Gross Domestic Product 18
Texas State and Local Government Tax Revenues, 2015-16 FY 19
Texas Travel Industry State and Local Government Tax Revenues, 2015-16 FY 20
Texas State and Local Tax Revenues, 2015-16 FY (table) 21
Travel-Generated Tax Revenue as a Percentage of Total Local and State Revenue 21
Travel-Generated Tax Revenue to State Government 21
Tourism Region Travel-Generated Tax Revenue per Household, 2016 CY 23
Tourism Region Visitor Share of State Sales Tax Revenue, 2016 CY 23
Metropolitan Area Travel-Generated Tax Revenue per Household, 2016 CY 24
Metropolitan Area Visitor Share of State Sales Tax Revenue, 2016CY 25
County Travel-Generated Tax Revenue per Household, 2016 CY 26
County Visitor Share of State Sales Tax Revenue, 2016 CY 29
DEAN RUNYAN ASSOCIATES PAGE v
page
Metro Area Direct Travel Impact Tables
Metropolitan Statistical Areas (counties included) 33
Direct Metropolitan Travel Spending, 1995-2016p 34
Travel Share of Total Metropolitan Earnings and Employment, 2016p 38
Abilene MSA, 2006-2016p 39
Amarillo MSA, 2006-2016p 40
Austin-Round Rock MSA, 2006-2016p 41
Beaumont-Port Arthur MSA, 2006-2016p 42
Brownsville-Harlingen MSA, 2006-2016p 43
College Station-Bryan MSA, 2006-2016p 44
Corpus Christi MSA, 2006-2016p 45
Dallas-Plano-Irving Metro Divison, 2006-2016p 46
Fort Worth-Arlington Metro Division, 2006-2016p 47
El Paso MSA, 2006-2016p 48
Houston-Baytown-Sugar Land MSA, 2006-2016p 49
Killeen-Temple-Fort Hood MSA, 2006-2016p 50
Laredo MSA, 2006-2016p 51
Longview MSA, 2006-2016p 52
Lubbock MSA, 2006-2016p 53
McAllen-Edinburg-Mission MSA, 2006-2016p 54
Midland MSA, 2006-2016p 55
Odessa MSA, 2006-2016p 56
San Angelo MSA, 2006-2016p 57
San Antonio MSA, 2006-2016p 58
Sherman-Denison MSA, 2006-2016p 59
Texarkana MSA, 2006-2016p 60
Tyler MSA, 2006-2016p 61
Victoria MSA, 2006-2016p 62
Waco MSA, 2006-2016p 63
Wichita Falls MSA, 2006-2016p 64
Tourism Region Direct Travel Impact Tables
Tourism Regions (counties included) 66
Direct Regional Travel Spending, 1995-2016p 67
Travel Share of Total Regional Earnings and Employment, 2016p 68
Big Bend, 2006-2016p 69
Gulf Coast, 2006-2016p 70
Hill Country, 2006-2016p 71
Panhandle Plains, 2006-2016p 72
Piney Woods, 2006-2016p 73
Prairies and Lakes, 2006-2016p 74
South Texas Plains, 2006-2016p 75
PAGE vi DEAN RUNYAN ASSOCIATES
page
County Direct Travel Impact Tables
Travel Share of Total County Earnings and Employment, 2016p 77
Anderson - Collin, 2016p Travel Impacts 83
Collingsworth - Gillespie, 2016p Travel Impacts 84
Glasscock - Karnes, 2016p Travel Impacts 85
Kaufman - Montgomery, 2016p Travel Impacts 86
Moore - Smith, 2016p Travel Impacts 87
Somervell - Zavala, 2016p Travel Impacts 88
Anderson - Bandera, 1995-2016p Travel Spending 89
Bastrop - Brazoria, 1995-2016p Travel Spending 90
Brazos - Callahan, 1995-2016p Travel Spending 91
Cameron - Cochran, 1995-2016p Travel Spending 92
Coke - Cottle, 1995-2016p Travel Spending 93
Crane - Denton, 1995-2016p Travel Spending 94
DeWitt - El Paso, 1995-2016p Travel Spending 95
Erath - Freestone, 1995-2016p Travel Spending 96
Frio - Grayson, 1995-2016p Travel Spending 97
Gregg - Harris, 1995-2016p Travel Spending 98
Harrison - Hood, 1995-2016p Travel Spending 99
Hopkins - Jasper, 1995-2016p Travel Spending 100
Jeff Davis - Kenedy, 1995-2016p Travel Spending 101
Kent - Lamb, 1995-2016p Travel Spending 102
Lampasas - Loving, 1995-2016p Travel Spending 103
Lubbock - Matagorda, 1995-2016p Travel Spending 104
Maverick - Moore, 1995-2016p Travel Spending 105
Morris - Orange, 1995-2016p Travel Spending 106
Palo Pinto - Randall, 1995-2016p Travel Spending 107
Reagan - Rusk, 1995-2016p Travel Spending 108
Sabine - Sherman, 1995-2016p Travel Spending 109
Smith - Tarrant, 1995-2016p Travel Spending 110
Taylor - Upshur, 1995-2016p Travel Spending 111
Upton - Webb, 1995-2016p Travel Spending 112
Wharton - Wood, 1995-2016p Travel Spending 113
Yoakum - Zavala, 1995-2016p Travel Spending 114
DEAN RUNYAN ASSOCIATES PAGE vii
page
City and Place Direct Travel Impacts, 2006-2016p
Abilene, Addison & Alice 116
Allen, Amarillo & Arlington 117
Athens, Austin & Baytown 118
Beaumont, Bedford & Big Spring 119
Boerne, Brenham & Brownsville 120
Bryan, Burleson & Carrollton 121
Cedar Park, Cleburne & Clute 122
College Station, Conroe & Corpus Christi 123
Corsicana, Dallas & Decatur 124
Dear Park, Del Rio & Dennison 125
Denton, Dumas & Duncanville 126
Eagle Pass, Edinburg & El Paso 127
Fort Stockton, Fort Worth & Fredericksburg 128
Frisco, Gainesville & Galveston 129
Garland, Georgetown, & Granbury 130
Grand Prairie, Grapevine & Greenville 131
Harlingen, Hillsboro & Horseshoe Bay 132
Houston, Humble & Huntsville 133
Hunt, Irving & Jasper 134
Katy, Kerrville & Killeen 135
Kingsville, La Porte & Lakeway 136
Laredo, League City & Lewisville 137
Longview, Lubbock & Lufkin 138
Marble Falls, Marshall & McAllen 139
McKinney, Mesquite & Midland 140
Mineral Wells, Mission & Mount Pleasant 141
Nacogdoches, New Braunfels & Odessa 142
Orange, Palestine & Paris 143
Pasadena, Pearland & Pflugerville 144
Pharr, Plainview & Plano 145
Port Aransas, Port Arthur & Richardson 146
Rockwell, Rosenberg & Round Rock 147
San Angelo, San Antonio & San Marcos 148
Schertz, Seabrook & Seguin 149
Shenandoah, Sherman, & S. Padre Island 150
Stafford, Stephenville & Sugar Land 151
Sulphur Springs, Sweetwater & Temple 152
Terrell, Texarkana & Texas City 153
The Colony, The Woodlands & Tyler 154
Uvalde, Victoria & Waco 155
Waxahachie, Weatherford & Webster 156
Weslaco & Wichita Falls 157
PAGE viii DEAN RUNYAN ASSOCIATES
PREFACE
The purpose of this study is to document the economic significance of the travel
industry in Texas from 1994 to 2016. These findings show the level of travel spending
by visitors traveling to and within the state and the impact this spending had on the
economy in terms of earnings, employment, and tax revenue.
Dean Runyan Associates prepared this study for the Office of the Governor, Economic
Development and Tourism. Dean Runyan Associates has specialized in research and
planning services for the travel, tourism, and recreation industry since 1984. With
respect to economic impact analysis, the firm developed and currently maintains the
Regional Travel Impact Model (RTIM), a proprietary computer model for analyzing
travel economic impacts at the state, regional, and local level. Dean Runyan Associates
also has extensive experience in project feasibility analysis, market evaluation, survey
research, and travel and tourism planning.
Many individuals and agencies provided information and advice for this report. Among
the organizations involved in this effort were the Texas Comptroller of Public Accounts,
the Texas Workforce Commission, the Texas Parks and Wildlife Department, and the
Texas Department of Transportation. Federal agencies that provided assistance included
the National Park Service, the Department of Labor, the Bureau of Economic Analysis,
and the Department of Transportation.
Thanks to Nate Gieryn, Research Manager, Office of the Governor, Economic
Development and Tourism, for his assistance.
Dean Runyan Associates
833 SW 11th Ave., Suite 920
Portland, OR 97205
(503) 226-2973
www.deanrunyan.com
DEAN RUNYAN ASSOCIATES PAGE ix
This page intentionally blank
DEAN RUNYAN ASSOCIATES PAGE 1
I. U.S. TRAVEL
PAGE 2 DEAN RUNYAN ASSOCIATES
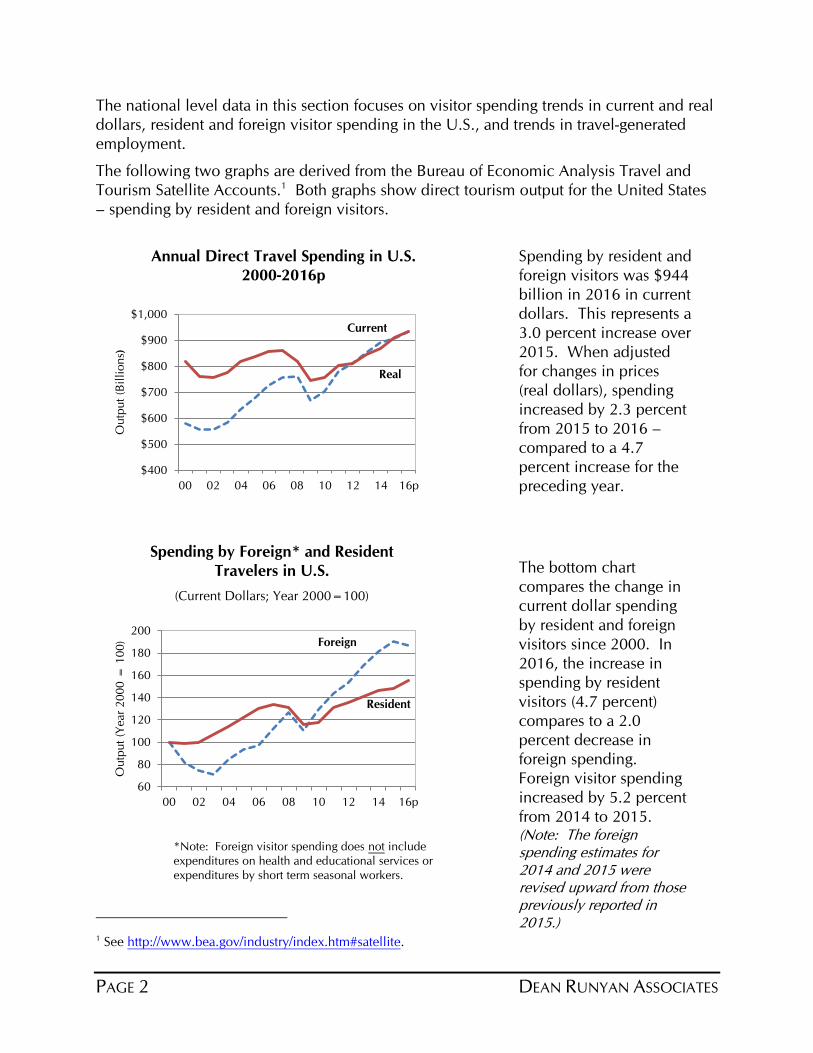
The national level data in this section focuses on visitor spending trends in current and real
dollars, resident and foreign visitor spending in the U.S., and trends in travel-generated
employment.
The following two graphs are derived from the Bureau of Economic Analysis Travel and
Tourism Satellite Accounts.1 Both graphs show direct tourism output for the United States
– spending by resident and foreign visitors.
1 See http://www.bea.gov/industry/index.htm#satellite.
$400
$500
$600
$700
$800
$900
$1,000
00 02 04 06 08 10 12 14 16p
Outp
ut
(Bil
lions)
Real
Current
60
80
100
120
140
160
180
200
00 02 04 06 08 10 12 14 16p
Outp
ut
(Year
2000 =
100) Foreign
Resident
Spending by resident and
foreign visitors was $944
billion in 2016 in current
dollars. This represents a
3.0 percent increase over
2015. When adjusted
for changes in prices
(real dollars), spending
increased by 2.3 percent
from 2015 to 2016 –
compared to a 4.7
percent increase for the
preceding year.
The bottom chart
compares the change in
current dollar spending
by resident and foreign
visitors since 2000. In
2016, the increase in
spending by resident
visitors (4.7 percent)
compares to a 2.0
percent decrease in
foreign spending.
Foreign visitor spending
increased by 5.2 percent
from 2014 to 2015. (Note: The foreign spending estimates for 2014 and 2015 were revised upward from those previously reported in 2015.)
Annual Direct Travel Spending in U.S.
2000-2016p
Spending by Foreign* and Resident
Travelers in U.S.
(Current Dollars; Year 2000=100)
*Note: Foreign visitor spending does not include
expenditures on health and educational services or
expenditures by short term seasonal workers.
DEAN RUNYAN ASSOCIATES PAGE 3
The foreign share of U.S. internal travel declined by almost a full percent point from 2015
to 2016 (18.2 percent to 17.2 percent). This has been due to two factors. First, overseas
arrivals began to show a decreasing rate of growth in the beginning of 2016 and actually
declined in absolute numbers in the most recently reported months. Secondly, the value of
foreign currencies has fall relative to the U.S. dollar. This not only discourages travel to the
U.S., but also means that foreigners that do travel to the U.S. have less money to spend on
goods and services.
8%9%
10%11%12%13%14%15%16%17%18%19%20%
00 02 04 06 08 10 12 14 16p
75
80
85
90
95
100
105
110
115
120
Jan 15 Jul 15 Jan 16 Jul 16 Jan 17
Euro
Canada
Japan
China
Overseas Arrivals (Year over Year Percent Change)
Foreign Share of U.S. Internal
Travel Spending
Relative Value of Selected Foreign
Currencies compared to U.S. Dollar
Monthly Averages, Jan 2015 through Dec 2016 Sources:
Foreign Share of U.S Internal Travel: Bureau
of Economic Analysis Travel & Tourism
Satellite Accounts and International
Transactions.
Overseas Arrivals: Office of Travel and
Tourism Industries, U.S. Department of
Commerce.
Relative Value of Selected Foreign
Currencies: XE Corporation. (www.x-
rates.com)
-10
-5
0
5
10
15
20
2015-Jan 2015-Jun 2016-Dec 2016-Jun
Year
over
Year
Pct.
Chg.
Note: Internal travel does not include spending on
international airfares to U.S carriers.
PAGE 4 DEAN RUNYAN ASSOCIATES
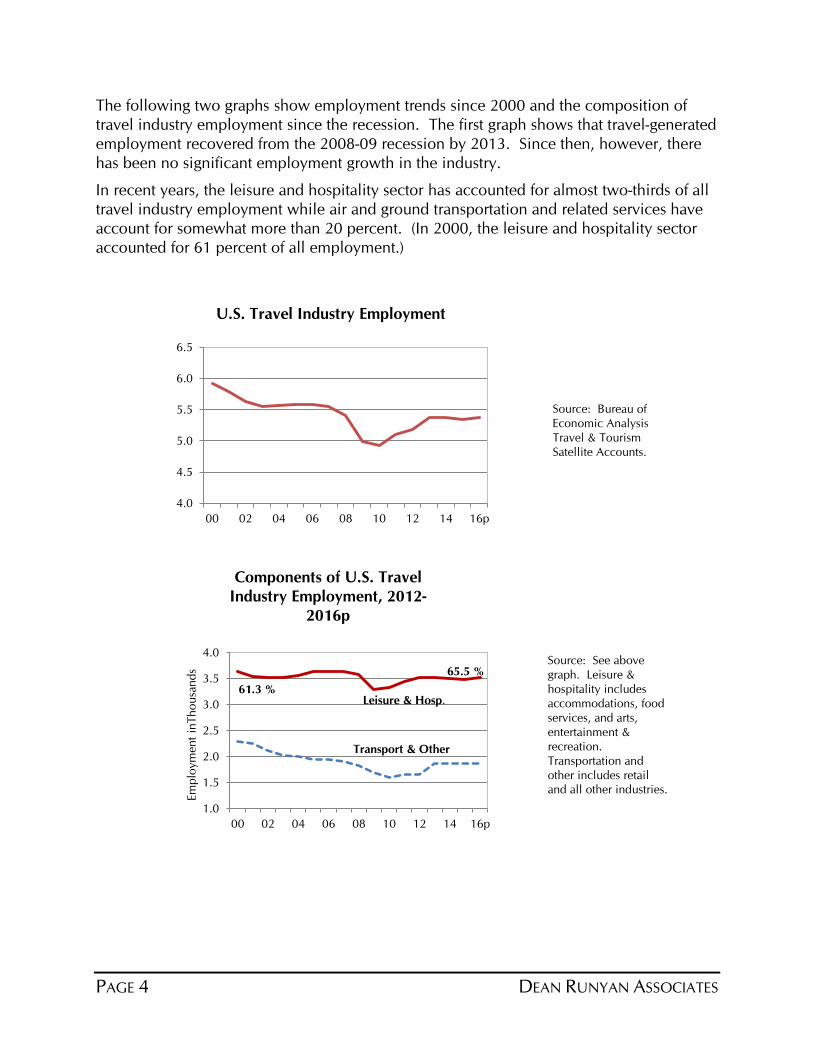
The following two graphs show employment trends since 2000 and the composition of
travel industry employment since the recession. The first graph shows that travel-generated
employment recovered from the 2008-09 recession by 2013. Since then, however, there
has been no significant employment growth in the industry.
In recent years, the leisure and hospitality sector has accounted for almost two-thirds of all
travel industry employment while air and ground transportation and related services have
account for somewhat more than 20 percent. (In 2000, the leisure and hospitality sector
accounted for 61 percent of all employment.)
Components of U.S. Travel
Industry Employment, 2012-
2016p
Source: Bureau of
Economic Analysis
Travel & Tourism
Satellite Accounts.
U.S. Travel Industry Employment
Source: See above
graph. Leisure &
hospitality includes
accommodations, food
services, and arts,
entertainment &
recreation.
Transportation and
other includes retail and all other industries.
4.0
4.5
5.0
5.5
6.0
6.5
00 02 04 06 08 10 12 14 16p
1.0
1.5
2.0
2.5
3.0
3.5
4.0
00 02 04 06 08 10 12 14 16p
Em
plo
ym
ent
inThousa
nds
Transport & Other
Leisure & Hosp.
65.5 %
61.3 %
DEAN RUNYAN ASSOCIATES PAGE 5
II. TEXAS TRAVEL IMPACTS
1994-2016P
PAGE 6 DEAN RUNYAN ASSOCIATES
The multi-billion dollar travel industry in Texas is a vital part of the state and local
economies. The industry is represented primarily by retail and service firms, including
lodging establishments, restaurants, retail stores, gasoline service stations, and other types
of businesses that sell their products and services to travelers. The money that visitors
spend on various goods and services while in Texas produces business receipts at these
firms, which in turn, employ Texas residents and pay their wages and salaries. State and
local government units benefit from travel as well, primarily in the form of excise taxes on
the goods and services purchased by visitors. Detailed travel impacts for 1994 through
2016p are reported on pages 7-8. A summary of the Texas travel industry performance
follows.
IMPACTS OF TRAVEL IN TEXAS: A SUMMARY
Total direct travel spending in Texas was $69.1 billion in 2016. This represents
slightly less than 1 percent increase over the preceding year in current dollars.
However, in real dollars (adjusted for inflation), travel spending increased by 1.7
percent.
Motor fuel prices in 2016 declined 10 percent on top of the 25 percent decline in
2015. Lower fuel prices affected the level of travel spending in all regions, counties
and cities.1
Room demand increased by 0.5 percent from 2015 to 2016 (Source Strategies, Inc.)
This compares to a 0.4 percent increase the preceding year. Visitor air travel on
domestic flights to Texas destinations increased by 5.4 percent, compared to 7.0
percent the preceding year.
Direct travel-generated employment increased by 2.5 percent for the year, while
earnings increased by 5.2 percent. This was the sixth consecutive year of
employment growth. Since 2010, employment has increased by 3.5 percent per
year.
State and local tax revenue ($6.4 billion) increased by 3.2 percent from 2015 to
2016.
Travel spending supported jobs in other industries through the re-spending of travel-
related revenues by businesses and individuals. The secondary impacts in 2016
were 499,600 jobs and $29.2 billion in earnings.
The gross domestic product (GDP) of the Texas travel industry was $35.2 billion in
2016. This is similar to other export-oriented industries such as microelectronics
and agriculture/food production. Only oil and gas production and related
manufacturing has a significantly greater GDP. GDP of the travel industry is slightly
more than 2 percent of the state total.
1 For this reason, transportation and non-transportation visitor spending is reported in the summary
spending tables for all areas in the state.
DEAN RUNYAN ASSOCIATES PAGE 7
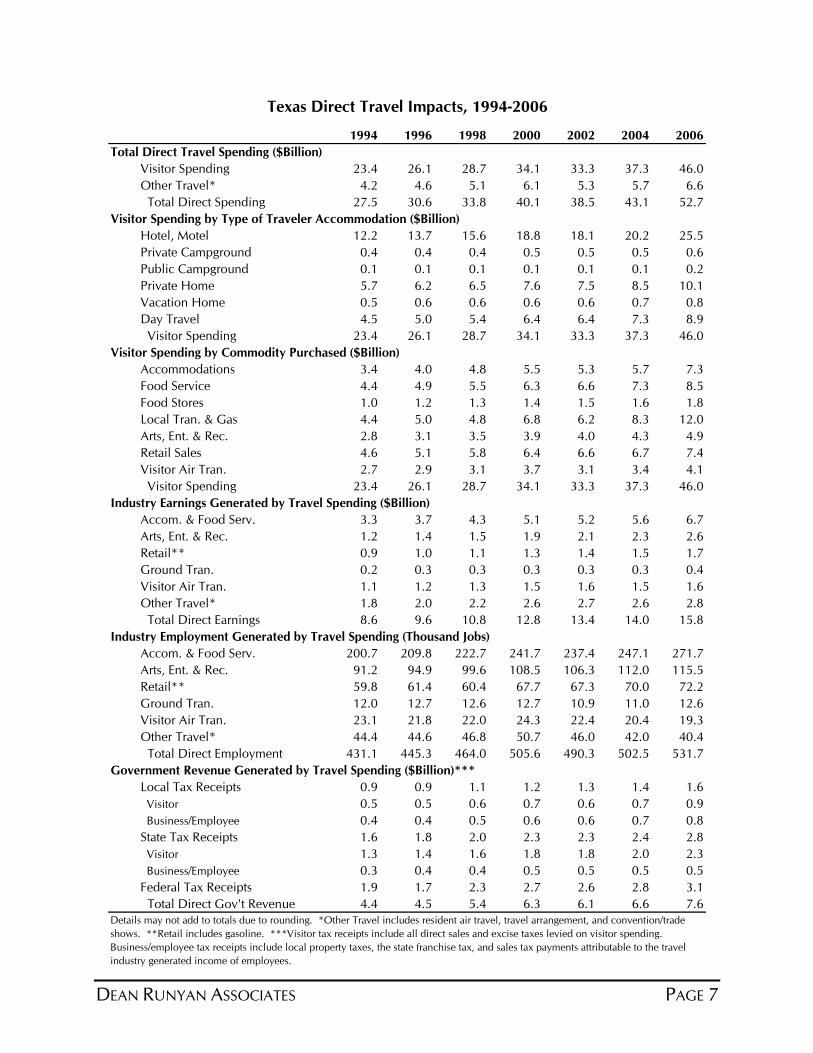
1994 1996 1998 2000 2002 2004 2006
Total Direct Travel Spending ($Billion)
Visitor Spending 23.4 26.1 28.7 34.1 33.3 37.3 46.0
Other Travel* 4.2 4.6 5.1 6.1 5.3 5.7 6.6
Total Direct Spending 27.5 30.6 33.8 40.1 38.5 43.1 52.7
Visitor Spending by Type of Traveler Accommodation ($Billion)
Hotel, Motel 12.2 13.7 15.6 18.8 18.1 20.2 25.5
Private Campground 0.4 0.4 0.4 0.5 0.5 0.5 0.6
Public Campground 0.1 0.1 0.1 0.1 0.1 0.1 0.2
Private Home 5.7 6.2 6.5 7.6 7.5 8.5 10.1
Vacation Home 0.5 0.6 0.6 0.6 0.6 0.7 0.8
Day Travel 4.5 5.0 5.4 6.4 6.4 7.3 8.9
Visitor Spending 23.4 26.1 28.7 34.1 33.3 37.3 46.0
Visitor Spending by Commodity Purchased ($Billion)
Accommodations 3.4 4.0 4.8 5.5 5.3 5.7 7.3
Food Service 4.4 4.9 5.5 6.3 6.6 7.3 8.5
Food Stores 1.0 1.2 1.3 1.4 1.5 1.6 1.8
Local Tran. & Gas 4.4 5.0 4.8 6.8 6.2 8.3 12.0
Arts, Ent. & Rec. 2.8 3.1 3.5 3.9 4.0 4.3 4.9
Retail Sales 4.6 5.1 5.8 6.4 6.6 6.7 7.4
Visitor Air Tran. 2.7 2.9 3.1 3.7 3.1 3.4 4.1
Visitor Spending 23.4 26.1 28.7 34.1 33.3 37.3 46.0
Industry Earnings Generated by Travel Spending ($Billion)
Accom. & Food Serv. 3.3 3.7 4.3 5.1 5.2 5.6 6.7
Arts, Ent. & Rec. 1.2 1.4 1.5 1.9 2.1 2.3 2.6
Retail** 0.9 1.0 1.1 1.3 1.4 1.5 1.7
Ground Tran. 0.2 0.3 0.3 0.3 0.3 0.3 0.4
Visitor Air Tran. 1.1 1.2 1.3 1.5 1.6 1.5 1.6
Other Travel* 1.8 2.0 2.2 2.6 2.7 2.6 2.8
Total Direct Earnings 8.6 9.6 10.8 12.8 13.4 14.0 15.8
Industry Employment Generated by Travel Spending (Thousand Jobs)
Accom. & Food Serv. 200.7 209.8 222.7 241.7 237.4 247.1 271.7
Arts, Ent. & Rec. 91.2 94.9 99.6 108.5 106.3 112.0 115.5
Retail** 59.8 61.4 60.4 67.7 67.3 70.0 72.2
Ground Tran. 12.0 12.7 12.6 12.7 10.9 11.0 12.6
Visitor Air Tran. 23.1 21.8 22.0 24.3 22.4 20.4 19.3
Other Travel* 44.4 44.6 46.8 50.7 46.0 42.0 40.4
Total Direct Employment 431.1 445.3 464.0 505.6 490.3 502.5 531.7
Government Revenue Generated by Travel Spending ($Billion)***
Local Tax Receipts 0.9 0.9 1.1 1.2 1.3 1.4 1.6
Visitor 0.5 0.5 0.6 0.7 0.6 0.7 0.9
Business/Employee 0.4 0.4 0.5 0.6 0.6 0.7 0.8
State Tax Receipts 1.6 1.8 2.0 2.3 2.3 2.4 2.8
Visitor 1.3 1.4 1.6 1.8 1.8 2.0 2.3
Business/Employee 0.3 0.4 0.4 0.5 0.5 0.5 0.5
Federal Tax Receipts 1.9 1.7 2.3 2.7 2.6 2.8 3.1
Total Direct Gov't Revenue 4.4 4.5 5.4 6.3 6.1 6.6 7.6
Texas Direct Travel Impacts, 1994-2006
Details may not add to totals due to rounding. *Other Travel includes resident air travel, travel arrangement, and convention/trade
shows. **Retail includes gasoline. ***Visitor tax receipts include all direct sales and excise taxes levied on visitor spending.
Business/employee tax receipts include local property taxes, the state franchise tax, and sales tax payments attributable to the travel
industry generated income of employees.
PAGE 8 DEAN RUNYAN ASSOCIATES
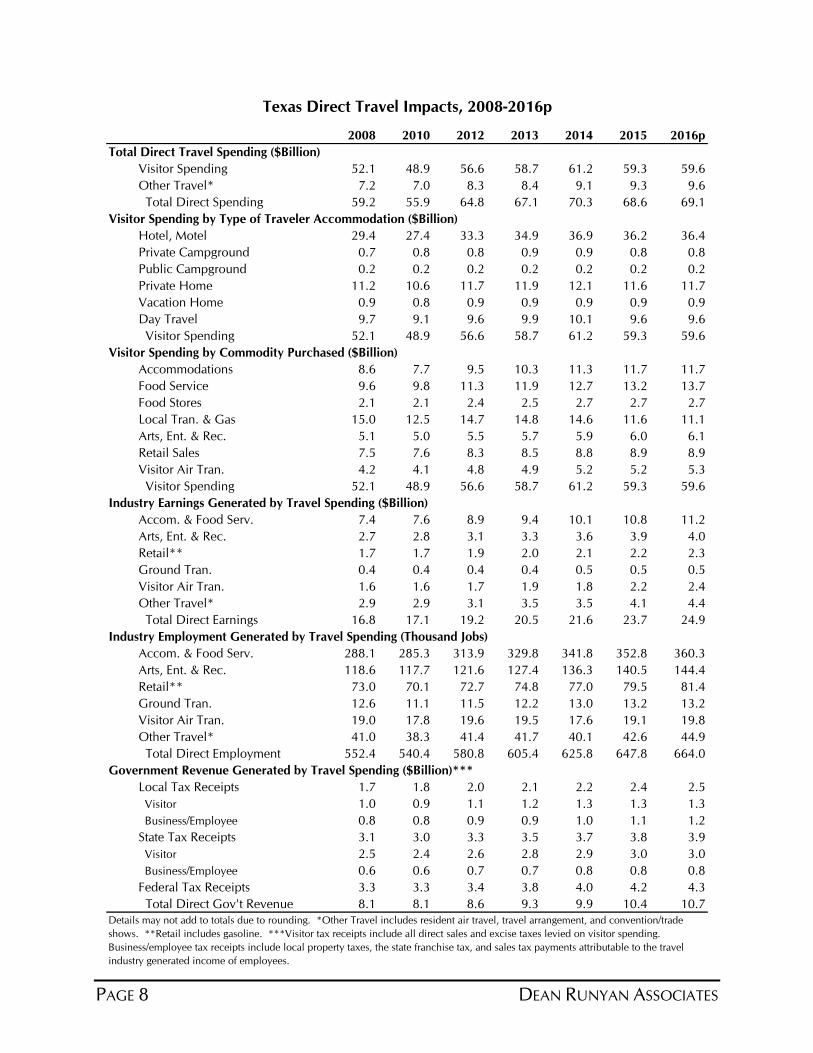
2008 2010 2012 2013 2014 2015 2016p
Total Direct Travel Spending ($Billion)
Visitor Spending 52.1 48.9 56.6 58.7 61.2 59.3 59.6
Other Travel* 7.2 7.0 8.3 8.4 9.1 9.3 9.6
Total Direct Spending 59.2 55.9 64.8 67.1 70.3 68.6 69.1
Visitor Spending by Type of Traveler Accommodation ($Billion)
Hotel, Motel 29.4 27.4 33.3 34.9 36.9 36.2 36.4
Private Campground 0.7 0.8 0.8 0.9 0.9 0.8 0.8
Public Campground 0.2 0.2 0.2 0.2 0.2 0.2 0.2
Private Home 11.2 10.6 11.7 11.9 12.1 11.6 11.7
Vacation Home 0.9 0.8 0.9 0.9 0.9 0.9 0.9
Day Travel 9.7 9.1 9.6 9.9 10.1 9.6 9.6
Visitor Spending 52.1 48.9 56.6 58.7 61.2 59.3 59.6
Visitor Spending by Commodity Purchased ($Billion)
Accommodations 8.6 7.7 9.5 10.3 11.3 11.7 11.7
Food Service 9.6 9.8 11.3 11.9 12.7 13.2 13.7
Food Stores 2.1 2.1 2.4 2.5 2.7 2.7 2.7
Local Tran. & Gas 15.0 12.5 14.7 14.8 14.6 11.6 11.1
Arts, Ent. & Rec. 5.1 5.0 5.5 5.7 5.9 6.0 6.1
Retail Sales 7.5 7.6 8.3 8.5 8.8 8.9 8.9
Visitor Air Tran. 4.2 4.1 4.8 4.9 5.2 5.2 5.3
Visitor Spending 52.1 48.9 56.6 58.7 61.2 59.3 59.6
Industry Earnings Generated by Travel Spending ($Billion)
Accom. & Food Serv. 7.4 7.6 8.9 9.4 10.1 10.8 11.2
Arts, Ent. & Rec. 2.7 2.8 3.1 3.3 3.6 3.9 4.0
Retail** 1.7 1.7 1.9 2.0 2.1 2.2 2.3
Ground Tran. 0.4 0.4 0.4 0.4 0.5 0.5 0.5
Visitor Air Tran. 1.6 1.6 1.7 1.9 1.8 2.2 2.4
Other Travel* 2.9 2.9 3.1 3.5 3.5 4.1 4.4
Total Direct Earnings 16.8 17.1 19.2 20.5 21.6 23.7 24.9
Industry Employment Generated by Travel Spending (Thousand Jobs)
Accom. & Food Serv. 288.1 285.3 313.9 329.8 341.8 352.8 360.3
Arts, Ent. & Rec. 118.6 117.7 121.6 127.4 136.3 140.5 144.4
Retail** 73.0 70.1 72.7 74.8 77.0 79.5 81.4
Ground Tran. 12.6 11.1 11.5 12.2 13.0 13.2 13.2
Visitor Air Tran. 19.0 17.8 19.6 19.5 17.6 19.1 19.8
Other Travel* 41.0 38.3 41.4 41.7 40.1 42.6 44.9
Total Direct Employment 552.4 540.4 580.8 605.4 625.8 647.8 664.0
Government Revenue Generated by Travel Spending ($Billion)***
Local Tax Receipts 1.7 1.8 2.0 2.1 2.2 2.4 2.5
Visitor 1.0 0.9 1.1 1.2 1.3 1.3 1.3
Business/Employee 0.8 0.8 0.9 0.9 1.0 1.1 1.2
State Tax Receipts 3.1 3.0 3.3 3.5 3.7 3.8 3.9
Visitor 2.5 2.4 2.6 2.8 2.9 3.0 3.0
Business/Employee 0.6 0.6 0.7 0.7 0.8 0.8 0.8
Federal Tax Receipts 3.3 3.3 3.4 3.8 4.0 4.2 4.3
Total Direct Gov't Revenue 8.1 8.1 8.6 9.3 9.9 10.4 10.7
Texas Direct Travel Impacts, 2008-2016p
Details may not add to totals due to rounding. *Other Travel includes resident air travel, travel arrangement, and convention/trade
shows. **Retail includes gasoline. ***Visitor tax receipts include all direct sales and excise taxes levied on visitor spending.
Business/employee tax receipts include local property taxes, the state franchise tax, and sales tax payments attributable to the travel
industry generated income of employees.
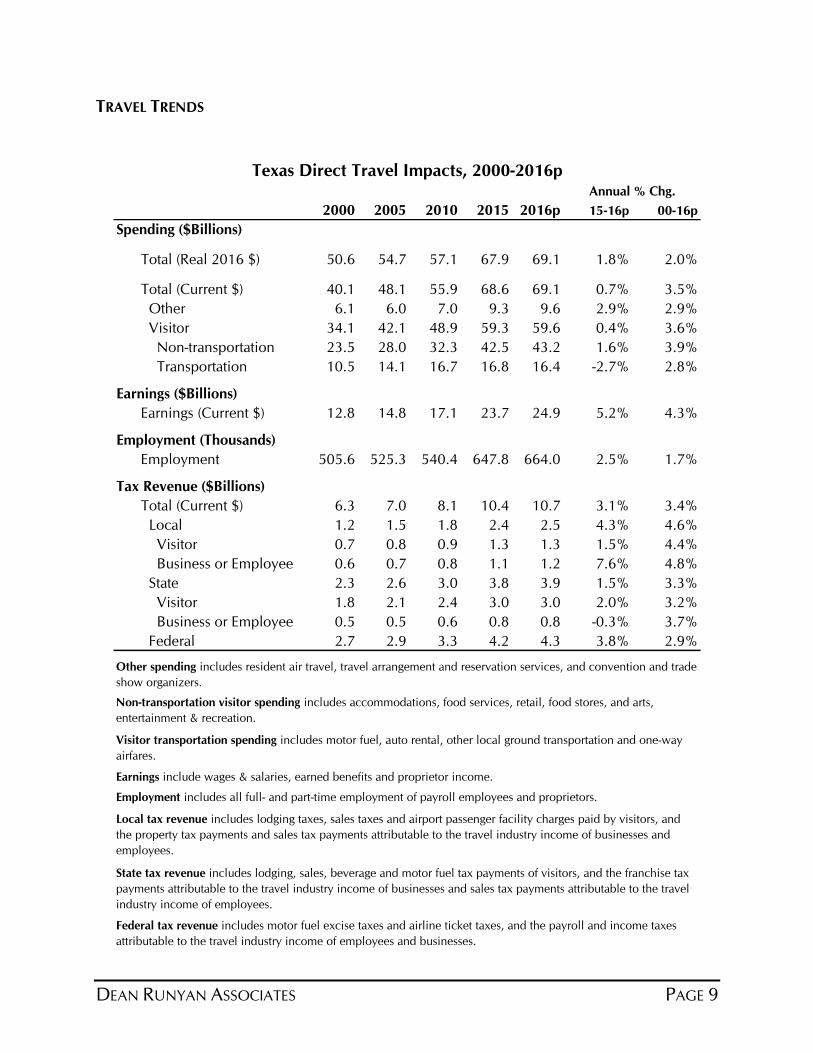
DEAN RUNYAN ASSOCIATES PAGE 9
TRAVEL TRENDS
2000 2005 2010 2015 2016p 15-16p 00-16p
Spending ($Billions)
Total (Real 2016 $) 50.6 54.7 57.1 67.9 69.1 1.8% 2.0%
Total (Current $) 40.1 48.1 55.9 68.6 69.1 0.7% 3.5%
Other 6.1 6.0 7.0 9.3 9.6 2.9% 2.9%
Visitor 34.1 42.1 48.9 59.3 59.6 0.4% 3.6%
Non-transportation 23.5 28.0 32.3 42.5 43.2 1.6% 3.9%
Transportation 10.5 14.1 16.7 16.8 16.4 -2.7% 2.8%
Earnings ($Billions)
Earnings (Current $) 12.8 14.8 17.1 23.7 24.9 5.2% 4.3%
Employment (Thousands)
Employment 505.6 525.3 540.4 647.8 664.0 2.5% 1.7%
Tax Revenue ($Billions)
Total (Current $) 6.3 7.0 8.1 10.4 10.7 3.1% 3.4%
Local 1.2 1.5 1.8 2.4 2.5 4.3% 4.6%
Visitor 0.7 0.8 0.9 1.3 1.3 1.5% 4.4%
Business or Employee 0.6 0.7 0.8 1.1 1.2 7.6% 4.8%
State 2.3 2.6 3.0 3.8 3.9 1.5% 3.3%
Visitor 1.8 2.1 2.4 3.0 3.0 2.0% 3.2%
Business or Employee 0.5 0.5 0.6 0.8 0.8 -0.3% 3.7%
Federal 2.7 2.9 3.3 4.2 4.3 3.8% 2.9%
Earnings include wages & salaries, earned benefits and proprietor income.
Employment includes all full- and part-time employment of payroll employees and proprietors.
Federal tax revenue includes motor fuel excise taxes and airline ticket taxes, and the payroll and income taxes
attributable to the travel industry income of employees and businesses.
Annual % Chg.
Texas Direct Travel Impacts, 2000-2016p
Other spending includes resident air travel, travel arrangement and reservation services, and convention and trade
show organizers.
Local tax revenue includes lodging taxes, sales taxes and airport passenger facility charges paid by visitors, and
the property tax payments and sales tax payments attributable to the travel industry income of businesses and
employees.
State tax revenue includes lodging, sales, beverage and motor fuel tax payments of visitors, and the franchise tax
payments attributable to the travel industry income of businesses and sales tax payments attributable to the travel
industry income of employees.
Non-transportation visitor spending includes accommodations, food services, retail, food stores, and arts,
entertainment & recreation.
Visitor transportation spending includes motor fuel, auto rental, other local ground transportation and one-way
airfares.
PAGE 10 DEAN RUNYAN ASSOCIATES
Real
Current
$30
$35
$40
$45
$50
$55
$60
$65
$70
$75
02 04 06 08 10 12 14 16p
Billio
ns
12
13
14
15
16
17
18
19
20
02 04 06 08 10 12 14 16p
Millio
ns
of V
isito
rs
50
60
70
80
90
100
110
03 04 05 06 07 08 09 10 11 12 13 14 15 16p
Ro
om
Nig
hts
So
ld in
Millio
ns
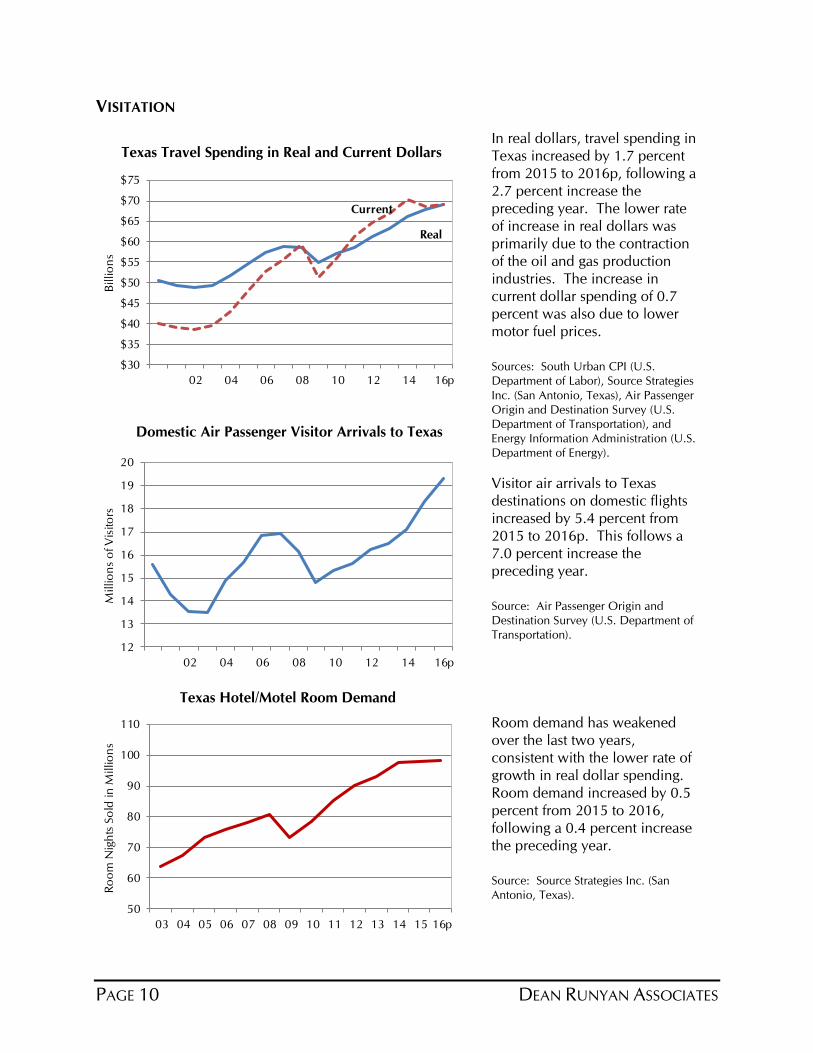
VISITATION
Texas Travel Spending in Real and Current Dollars
Domestic Air Passenger Visitor Arrivals to Texas
Texas Hotel/Motel Room Demand
In real dollars, travel spending in
Texas increased by 1.7 percent
from 2015 to 2016p, following a
2.7 percent increase the
preceding year. The lower rate
of increase in real dollars was
primarily due to the contraction
of the oil and gas production
industries. The increase in
current dollar spending of 0.7
percent was also due to lower
motor fuel prices.
Sources: South Urban CPI (U.S.
Department of Labor), Source Strategies
Inc. (San Antonio, Texas), Air Passenger
Origin and Destination Survey (U.S.
Department of Transportation), and
Energy Information Administration (U.S.
Department of Energy).
Visitor air arrivals to Texas
destinations on domestic flights
increased by 5.4 percent from
2015 to 2016p. This follows a
7.0 percent increase the
preceding year.
Source: Air Passenger Origin and
Destination Survey (U.S. Department of
Transportation).
Room demand has weakened
over the last two years,
consistent with the lower rate of
growth in real dollar spending.
Room demand increased by 0.5
percent from 2015 to 2016,
following a 0.4 percent increase
the preceding year.
Source: Source Strategies Inc. (San
Antonio, Texas).
DEAN RUNYAN ASSOCIATES PAGE 11
$4.0
$4.5
$5.0
$5.5
$6.0
$6.5
$7.0
$7.5
0%
2%
4%
6%
8%
10%
12%
14%
00 02 04 06 08 10 12 14 16p
Inte
rnat
ional
Shar
e
Share Spend
Texas
$27.1 45%
Other U.S.
$25.5 43%
International
$7.0 12%
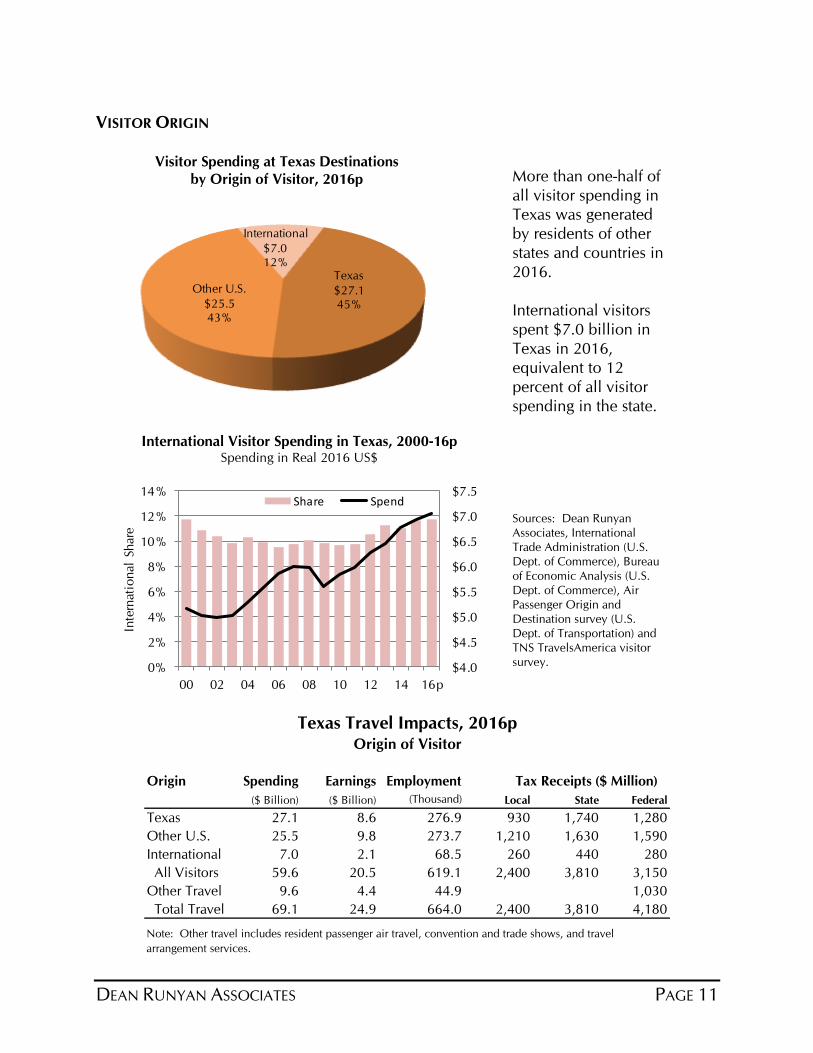
VISITOR ORIGIN
Origin Spending Earnings Employment
($ Billion) ($ Billion) (Thousand) Local State Federal
Texas 27.1 8.6 276.9 930 1,740 1,280
Other U.S. 25.5 9.8 273.7 1,210 1,630 1,590
International 7.0 2.1 68.5 260 440 280
All Visitors 59.6 20.5 619.1 2,400 3,810 3,150
Other Travel 9.6 4.4 44.9 1,030
Total Travel 69.1 24.9 664.0 2,400 3,810 4,180
Texas Travel Impacts, 2016pOrigin of Visitor
Tax Receipts ($ Million)
Note: Other travel includes resident passenger air travel, convention and trade shows, and travel
arrangement services.
Visitor Spending at Texas Destinations
by Origin of Visitor, 2016p
International Visitor Spending in Texas, 2000-16p Spending in Real 2016 US$
More than one-half of
all visitor spending in
Texas was generated
by residents of other
states and countries in
2016.
International visitors
spent $7.0 billion in
Texas in 2016,
equivalent to 12
percent of all visitor
spending in the state.
Sources: Dean Runyan
Associates, International
Trade Administration (U.S.
Dept. of Commerce), Bureau
of Economic Analysis (U.S.
Dept. of Commerce), Air
Passenger Origin and
Destination survey (U.S.
Dept. of Transportation) and
TNS TravelsAmerica visitor
survey.
PAGE 12 DEAN RUNYAN ASSOCIATES
$24.9 $24.9
$10.3 $10.3
$33.9
$0
$10
$20
$30
$40
$50
$60
$70
$80
Spending ($69.1) GDP ($35.2)
Bil
lions
$33.9 Intermed. Inputs
$10.3 Other Value Added
$24.9 Earnings
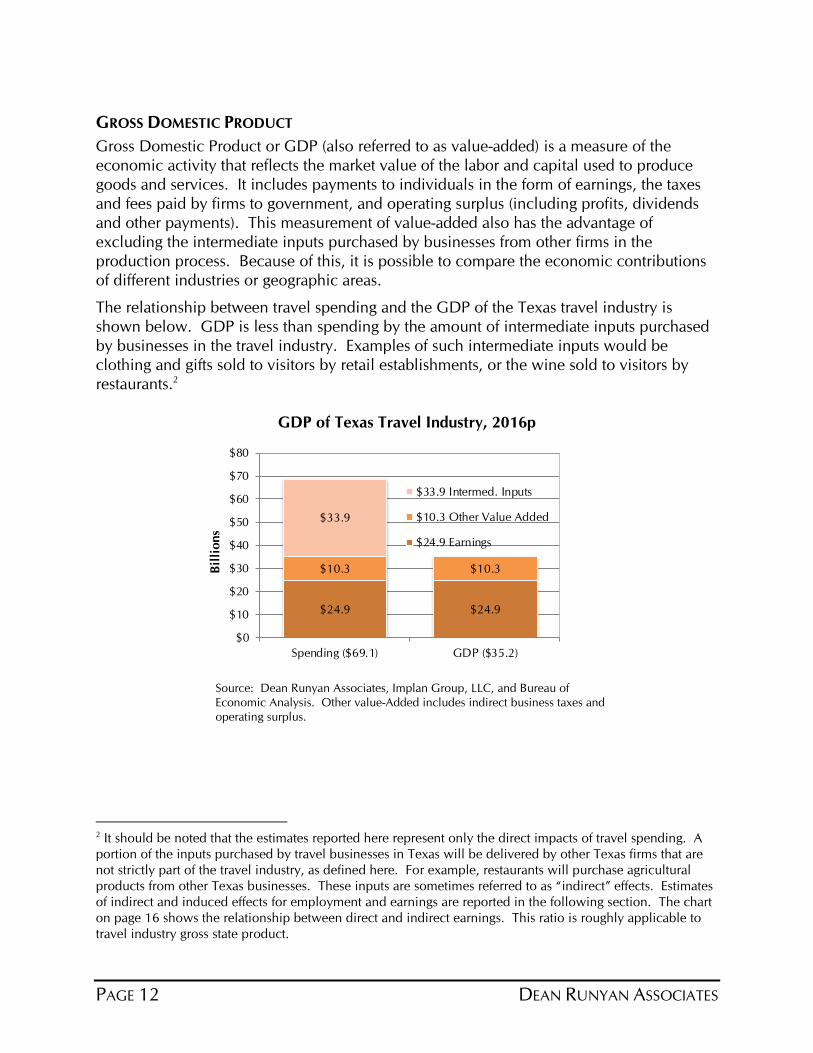
GROSS DOMESTIC PRODUCT
Gross Domestic Product or GDP (also referred to as value-added) is a measure of the
economic activity that reflects the market value of the labor and capital used to produce
goods and services. It includes payments to individuals in the form of earnings, the taxes
and fees paid by firms to government, and operating surplus (including profits, dividends
and other payments). This measurement of value-added also has the advantage of
excluding the intermediate inputs purchased by businesses from other firms in the
production process. Because of this, it is possible to compare the economic contributions
of different industries or geographic areas.
The relationship between travel spending and the GDP of the Texas travel industry is
shown below. GDP is less than spending by the amount of intermediate inputs purchased
by businesses in the travel industry. Examples of such intermediate inputs would be
clothing and gifts sold to visitors by retail establishments, or the wine sold to visitors by
restaurants.2
GDP of Texas Travel Industry, 2016p
Source: Dean Runyan Associates, Implan Group, LLC, and Bureau of
Economic Analysis. Other value-Added includes indirect business taxes and
operating surplus.
2 It should be noted that the estimates reported here represent only the direct impacts of travel spending. A
portion of the inputs purchased by travel businesses in Texas will be delivered by other Texas firms that are
not strictly part of the travel industry, as defined here. For example, restaurants will purchase agricultural
products from other Texas businesses. These inputs are sometimes referred to as “indirect” effects. Estimates
of indirect and induced effects for employment and earnings are reported in the following section. The chart
on page 16 shows the relationship between direct and indirect earnings. This ratio is roughly applicable to
travel industry gross state product.
DEAN RUNYAN ASSOCIATES PAGE 13
$0 $50 $100 $150 $200
Travel
Microelectronics
Oil/Gas
Agriculture/Food
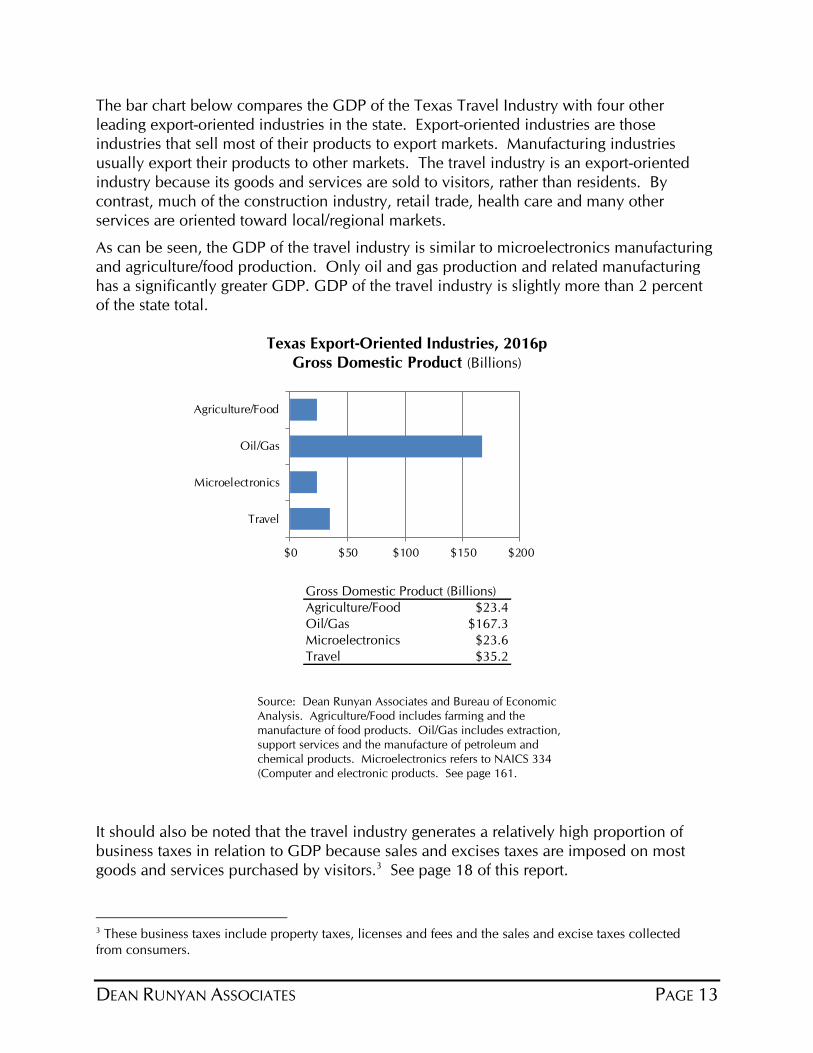
The bar chart below compares the GDP of the Texas Travel Industry with four other
leading export-oriented industries in the state. Export-oriented industries are those
industries that sell most of their products to export markets. Manufacturing industries
usually export their products to other markets. The travel industry is an export-oriented
industry because its goods and services are sold to visitors, rather than residents. By
contrast, much of the construction industry, retail trade, health care and many other
services are oriented toward local/regional markets.
As can be seen, the GDP of the travel industry is similar to microelectronics manufacturing
and agriculture/food production. Only oil and gas production and related manufacturing
has a significantly greater GDP. GDP of the travel industry is slightly more than 2 percent
of the state total.
Texas Export-Oriented Industries, 2016p
Gross Domestic Product (Billions)
Gross Domestic Product (Billions)
Agriculture/Food $23.4
Oil/Gas $167.3
Microelectronics $23.6
Travel $35.2
Source: Dean Runyan Associates and Bureau of Economic
Analysis. Agriculture/Food includes farming and the
manufacture of food products. Oil/Gas includes extraction,
support services and the manufacture of petroleum and
chemical products. Microelectronics refers to NAICS 334
(Computer and electronic products. See page 161.
It should also be noted that the travel industry generates a relatively high proportion of
business taxes in relation to GDP because sales and excises taxes are imposed on most
goods and services purchased by visitors.3 See page 18 of this report.
3 These business taxes include property taxes, licenses and fees and the sales and excise taxes collected
from consumers.
PAGE 14 DEAN RUNYAN ASSOCIATES
Direct
664Indirect
174
Induced
326
Employment (Thousands)
Direct
$24.9
Indirect
$10.7
Induced
$18.5
Earnings (Billions)
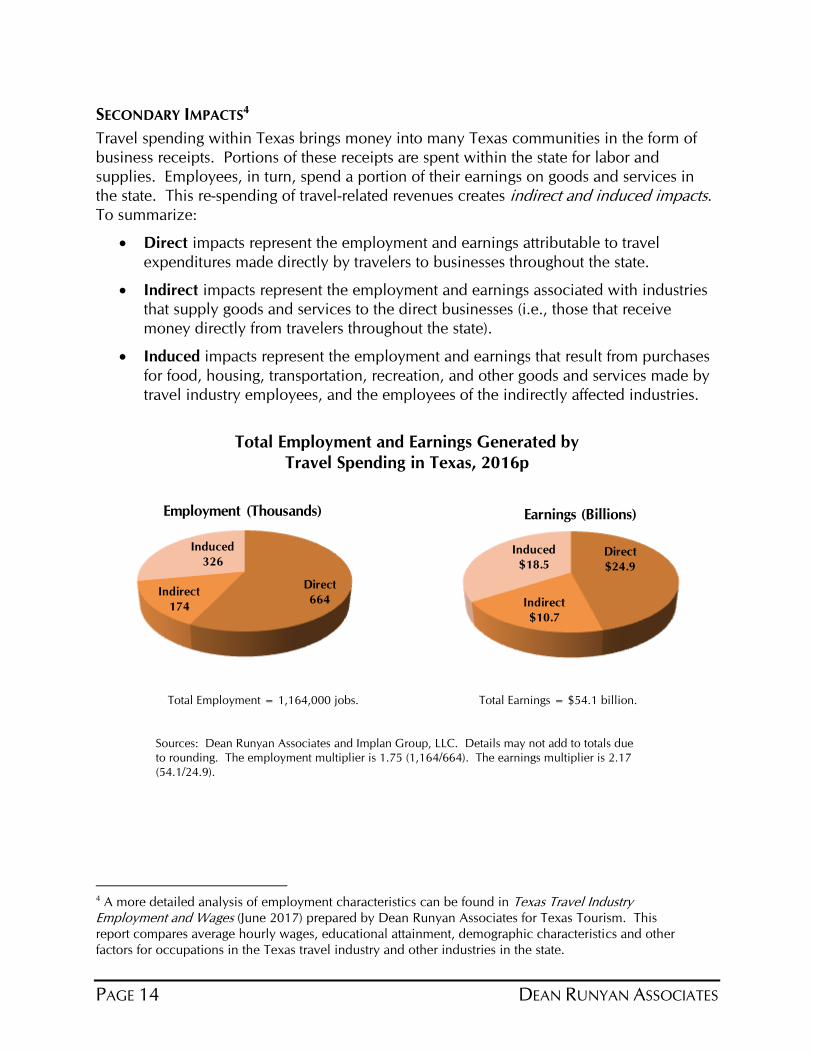
SECONDARY IMPACTS4
Travel spending within Texas brings money into many Texas communities in the form of
business receipts. Portions of these receipts are spent within the state for labor and
supplies. Employees, in turn, spend a portion of their earnings on goods and services in
the state. This re-spending of travel-related revenues creates indirect and induced impacts. To summarize:
Direct impacts represent the employment and earnings attributable to travel
expenditures made directly by travelers to businesses throughout the state.
Indirect impacts represent the employment and earnings associated with industries
that supply goods and services to the direct businesses (i.e., those that receive
money directly from travelers throughout the state).
Induced impacts represent the employment and earnings that result from purchases
for food, housing, transportation, recreation, and other goods and services made by
travel industry employees, and the employees of the indirectly affected industries.
Total Employment and Earnings Generated by
Travel Spending in Texas, 2016p
Total Employment = 1,164,000 jobs. Total Earnings = $54.1 billion.
Sources: Dean Runyan Associates and Implan Group, LLC. Details may not add to totals due
to rounding. The employment multiplier is 1.75 (1,164/664). The earnings multiplier is 2.17
(54.1/24.9).
4 A more detailed analysis of employment characteristics can be found in Texas Travel Industry Employment and Wages (June 2017) prepared by Dean Runyan Associates for Texas Tourism. This
report compares average hourly wages, educational attainment, demographic characteristics and other
factors for occupations in the Texas travel industry and other industries in the state.
DEAN RUNYAN ASSOCIATES PAGE 15
The impacts in this section are presented in terms of the employment and earnings of
eleven major industry groups. These industry groups are similar, but not identical to the
business service (or commodity) categories presented elsewhere in this report. (The
specific industries that comprise these major groups are listed in Appendix D.) Direct
travel impacts, such as those discussed in the first part of this section and the regional and
county impacts presented elsewhere in this report are found in the following industry
groups:
Accommodations & Food Services
Arts, Entertainment, and Recreation
Trade
Transportation
As is indicated in the following tables and graphs, the total direct employment and earnings
of these four industry groups is identical to the total direct employment and earnings
shown in the first part of this section. The only difference is that these industry groups
represent industry groupings (firms) rather than commodity or business service groupings.
The indirect and induced impacts of travel spending are found in all thirteen industry
groupings shown in the following tables and graphs. To summarize the primary secondary
impacts:
Professional & Business Services (83,700 jobs and $5.4 billion earnings). A
variety of administrative services (e.g., accounting and advertising) are utilized
by travel businesses (indirect effect). Employees of these firms also purchase
professional services (induced effect).
Education and Health Services (56,200 jobs and $3.4 billion earnings). The
secondary effects are primarily induced, such as employees of travel-related
businesses use of medical services.
Financial Activities (74,100 jobs and $3.6 billion earnings). Both businesses
and individuals make use of banking and insurance institutions.
Other Services (33,600 jobs and $1.6 billion earnings). Employees of travel-
related businesses purchase services from various providers, such as dry
cleaners and repair shops.
It should be emphasized that the estimates of indirect and induced impacts reported here
apply to the entire state of Texas and do not necessarily reflect economic patterns for
individual counties, regions or sub-regions within the state. While total economic impacts
can be calculated on a county or regional level, such a detailed analysis is not included in
this study. In general, geographic areas with lower levels of aggregate economic activity
will have smaller secondary impacts within those same geographic boundaries.
PAGE 16 DEAN RUNYAN ASSOCIATES
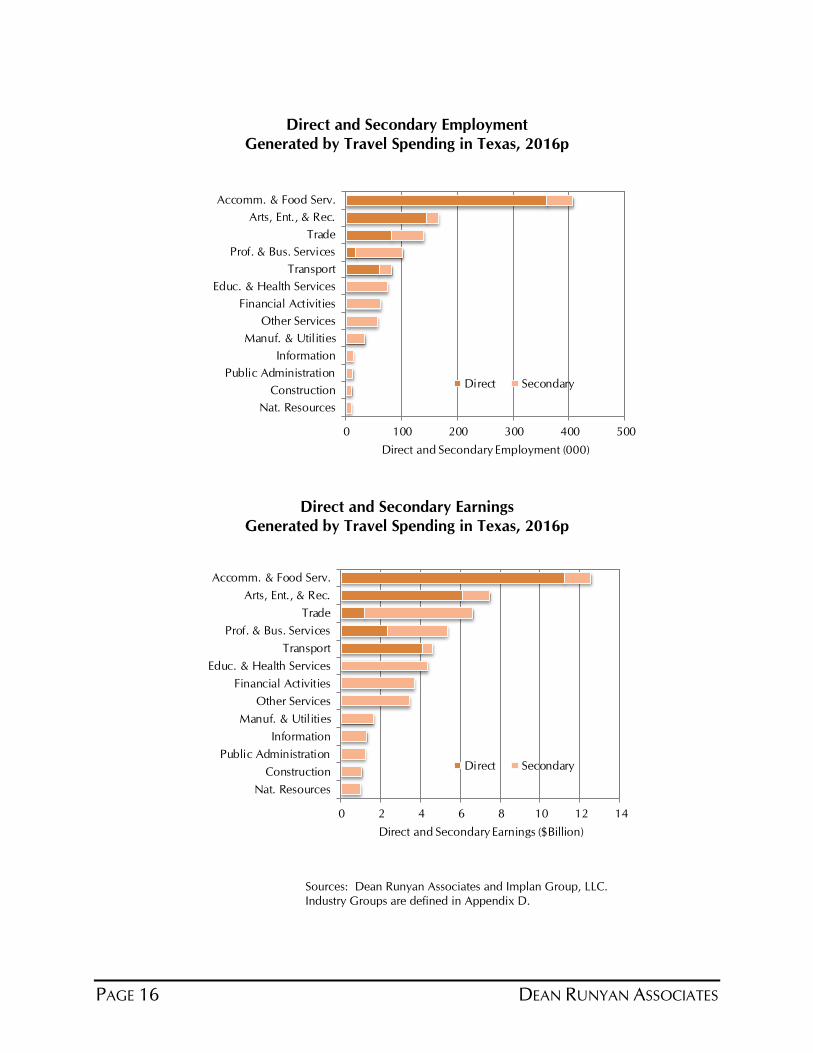
Direct and Secondary Employment
Generated by Travel Spending in Texas, 2016p
0 100 200 300 400 500
Nat. Resources
Construction
Public Administration
Information
Manuf. & Utilities
Other Services
Financial Activities
Educ. & Health Services
Transport
Prof. & Bus. Services
Trade
Arts, Ent., & Rec.
Accomm. & Food Serv.
Direct and Secondary Employment (000)
Direct Secondary
Direct and Secondary Earnings
Generated by Travel Spending in Texas, 2016p
0 2 4 6 8 10 12 14
Nat. Resources
Construction
Public Administration
Information
Manuf. & Utilities
Other Services
Financial Activities
Educ. & Health Services
Transport
Prof. & Bus. Services
Trade
Arts, Ent., & Rec.
Accomm. & Food Serv.
Direct and Secondary Earnings ($Billion)
Direct Secondary
Sources: Dean Runyan Associates and Implan Group, LLC.
Industry Groups are defined in Appendix D.
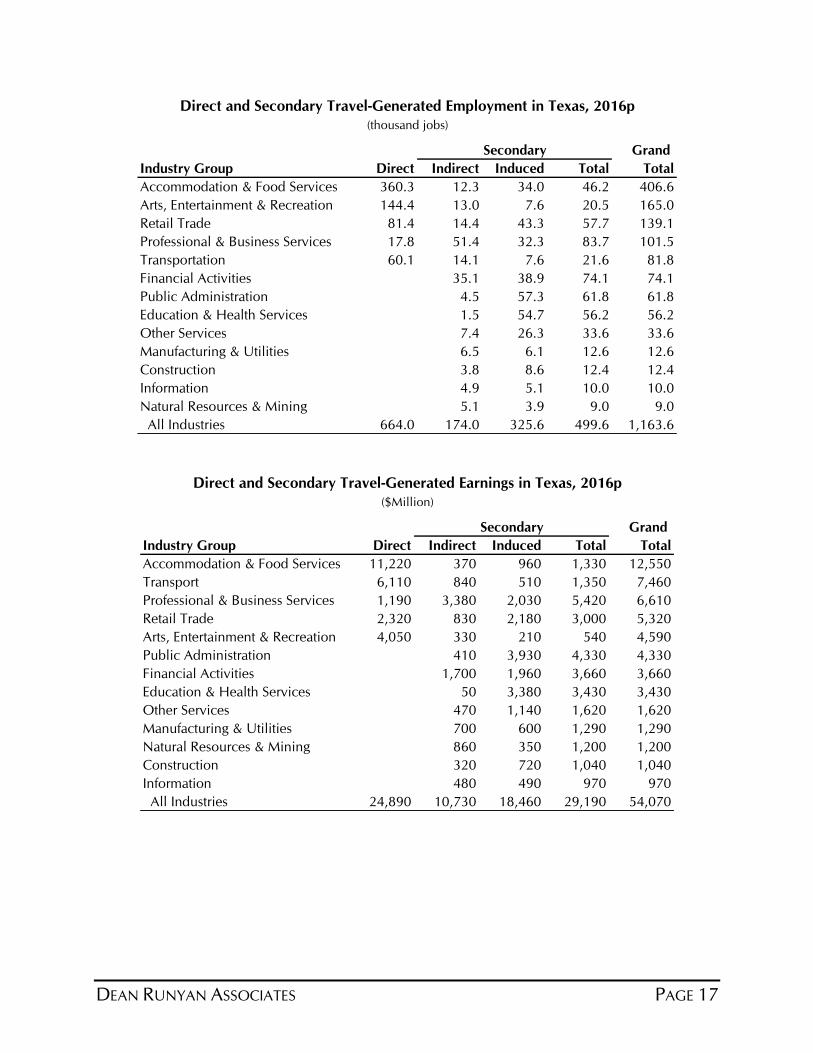
DEAN RUNYAN ASSOCIATES PAGE 17
Grand
Industry Group Direct Indirect Induced Total Total
Accommodation & Food Services 360.3 12.3 34.0 46.2 406.6
Arts, Entertainment & Recreation 144.4 13.0 7.6 20.5 165.0
Retail Trade 81.4 14.4 43.3 57.7 139.1
Professional & Business Services 17.8 51.4 32.3 83.7 101.5
Transportation 60.1 14.1 7.6 21.6 81.8
Financial Activities 35.1 38.9 74.1 74.1
Public Administration 4.5 57.3 61.8 61.8
Education & Health Services 1.5 54.7 56.2 56.2
Other Services 7.4 26.3 33.6 33.6
Manufacturing & Utilities 6.5 6.1 12.6 12.6
Construction 3.8 8.6 12.4 12.4
Information 4.9 5.1 10.0 10.0
Natural Resources & Mining 5.1 3.9 9.0 9.0
All Industries 664.0 174.0 325.6 499.6 1,163.6
Direct and Secondary Travel-Generated Employment in Texas, 2016p
(thousand jobs)
Secondary
Grand
Industry Group Direct Indirect Induced Total Total
Accommodation & Food Services 11,220 370 960 1,330 12,550
Transport 6,110 840 510 1,350 7,460
Professional & Business Services 1,190 3,380 2,030 5,420 6,610
Retail Trade 2,320 830 2,180 3,000 5,320
Arts, Entertainment & Recreation 4,050 330 210 540 4,590
Public Administration 410 3,930 4,330 4,330
Financial Activities 1,700 1,960 3,660 3,660
Education & Health Services 50 3,380 3,430 3,430
Other Services 470 1,140 1,620 1,620
Manufacturing & Utilities 700 600 1,290 1,290
Natural Resources & Mining 860 350 1,200 1,200
Construction 320 720 1,040 1,040
Information 480 490 970 970
All Industries 24,890 10,730 18,460 29,190 54,070
Secondary
Direct and Secondary Travel-Generated Earnings in Texas, 2016p
($Million)
PAGE 18 DEAN RUNYAN ASSOCIATES
0% 5% 10% 15% 20% 25% 30% 35%
All Industries
Travel
Retail
Oil & Gas Ext.
Manufacturing
Health Care
Construction
Percent of Gross Domestic Product
III. STATE AND LOCAL GOVERNMENT REVENUE
This report is concerned with the contribution of the Texas travel industry to state and local
government finance. The first part of the report compares the travel industry to various
other sectors of the state economy. The next several sections provide an overview of state
and local finance and the revenue contribution of the travel industry. The final section of
the report provides a more detailed breakout of state government tax revenue. The report
also contains numerous appendices.
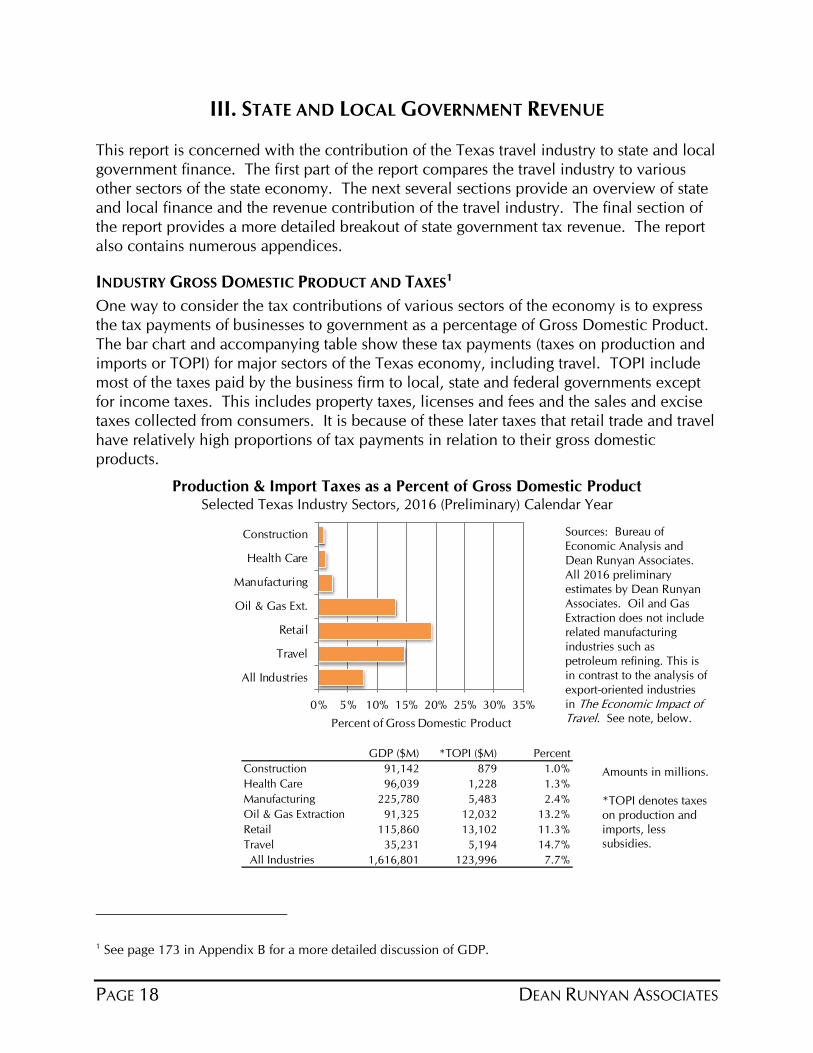
INDUSTRY GROSS DOMESTIC PRODUCT AND TAXES1
One way to consider the tax contributions of various sectors of the economy is to express
the tax payments of businesses to government as a percentage of Gross Domestic Product.
The bar chart and accompanying table show these tax payments (taxes on production and
imports or TOPI) for major sectors of the Texas economy, including travel. TOPI include
most of the taxes paid by the business firm to local, state and federal governments except
for income taxes. This includes property taxes, licenses and fees and the sales and excise
taxes collected from consumers. It is because of these later taxes that retail trade and travel
have relatively high proportions of tax payments in relation to their gross domestic
products.
Production & Import Taxes as a Percent of Gross Domestic Product Selected Texas Industry Sectors, 2016 (Preliminary) Calendar Year
GDP ($M) *TOPI ($M) Percent
Construction 91,142 879 1.0%
Health Care 96,039 1,228 1.3%
Manufacturing 225,780 5,483 2.4%
Oil & Gas Extraction 91,325 12,032 13.2%
Retail 115,860 13,102 11.3%
Travel 35,231 5,194 14.7%
All Industries 1,616,801 123,996 7.7%
1 See page 173 in Appendix B for a more detailed discussion of GDP.
Sources: Bureau of
Economic Analysis and
Dean Runyan Associates.
All 2016 preliminary
estimates by Dean Runyan
Associates. Oil and Gas
Extraction does not include
related manufacturing
industries such as
petroleum refining. This is
in contrast to the analysis of
export-oriented industries
in The Economic Impact of Travel. See note, below.
Amounts in millions.
*TOPI denotes taxes
on production and
imports, less subsidies.
DEAN RUNYAN ASSOCIATES PAGE 19
Sales &
Gross Receipts
$54.649%
Property
$48.644%
License &
Other$8.4
7%
The remainder of this report will focus on the travel industry and the specific tax
contributions made to state and local government in Texas. In addition to the taxes on
production discussed in the previous section, the tax payments of travel industry
employees derived from the income earned from travel industry businesses will be
included.2 The three primary sources of tax revenue generated by the travel industry are:
Sales tax receipts generated by visitor spending. This includes local and state sales
taxes, lodging taxes, alcoholic beverage taxes, motor vehicle rental taxes and motor
fuel taxes. (These taxes are denoted as visitor taxes in other sections of the report.)
Property and franchise taxes paid by travel industry businesses attributable to travel
generated business receipts (denoted as resident taxes).
Sales and property taxes paid by travel industry employees attributable to travel
generated earnings (denoted as resident taxes).
TEXAS TAX STRUCTURE
The pie chart below, adapted from the Bureau of the Census’ State and Local Government
Finance and other data sources, shows the main categories of tax revenue in Texas. About
one-half of all state and local tax revenue in the state is derived from sales or gross receipts
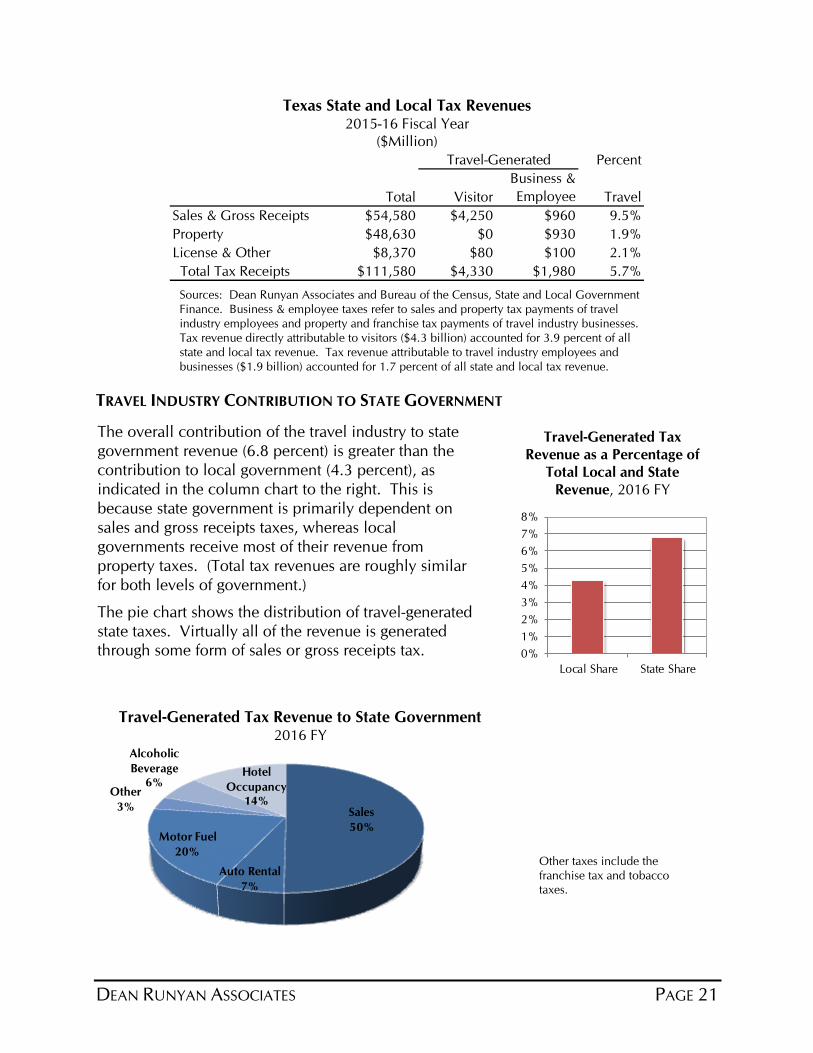
taxes. More than 80 percent of these sales taxes are collected by the state. The next largest
category is property taxes -- paid primarily by homeowners and businesses to local
governments.3 The franchise tax on businesses ($3.8 billion in 2016) is included in the
other category.
2 In effect, this means re-allocating some of the sales and excise payments made by other industries to the
travel industry because the payments are ultimately made by consumers that earned their income in the travel
industry. 3 Businesses pay 62 percent of all property taxes in Texas according to the Texas Taxpayers and Research
Associates (Observations on the Property Tax in Texas, January 2016).
Sources: The 2015-16 fiscal year estimates of state
and local tax revenues in Texas were prepared by
Dean Runyan Associates from various sources,
including the Bureau of the Census (State and Local
Government Finance), the Texas Comptroller’s
Office, the Bureau of Economic Analysis and a
selection of annual financial reports for cities and
counties. Sales and gross receipts taxes include the
general sales tax and a variety of selective taxes,
such as those on lodging, motor fuel and alcoholic
beverages. Other taxes include licenses and the
state franchise tax. State tax receipts comprise
slightly less than one-half of all state and local tax
receipts.
Note: The 2015-16 fiscal year is for the period September 1, 2015 through August 31, 2016.
Texas State and Local Government Tax Revenues
2015-16 Fiscal Year (Billions)
PAGE 20 DEAN RUNYAN ASSOCIATES
Employee
Sales$960
15%
Visitor Sales
$4,25067%
Property
$93015%
Other
$1703%
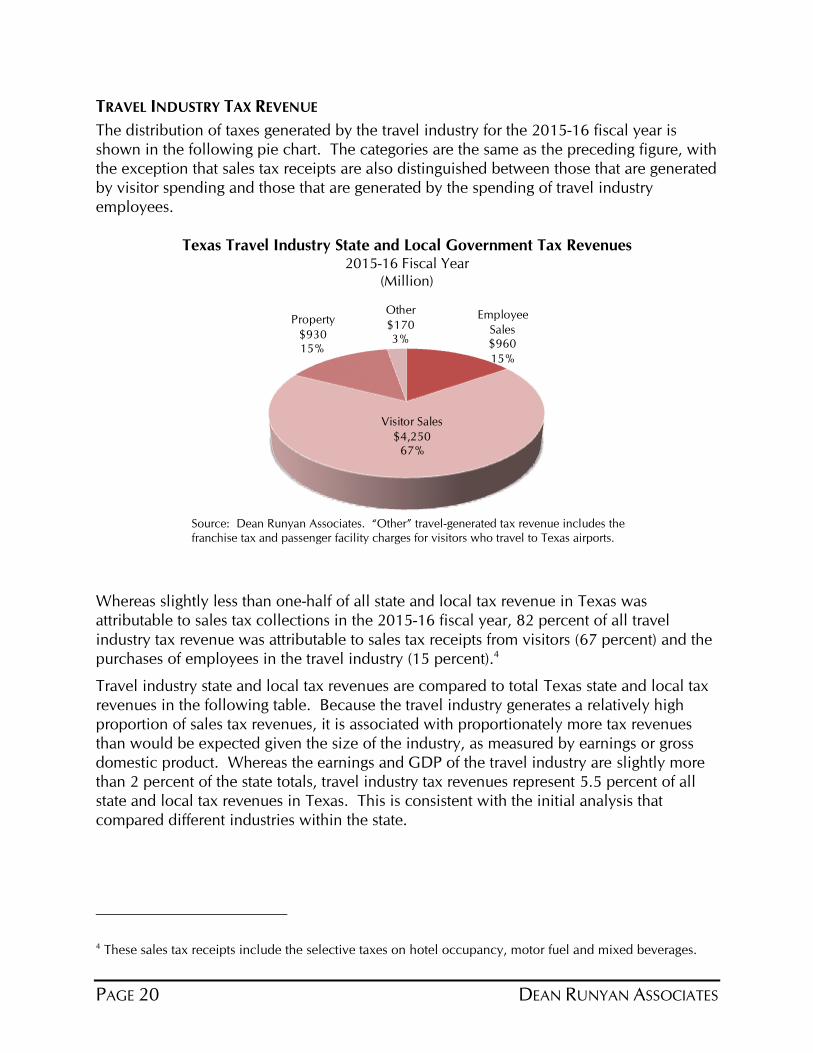
TRAVEL INDUSTRY TAX REVENUE
The distribution of taxes generated by the travel industry for the 2015-16 fiscal year is
shown in the following pie chart. The categories are the same as the preceding figure, with
the exception that sales tax receipts are also distinguished between those that are generated
by visitor spending and those that are generated by the spending of travel industry
employees.
Texas Travel Industry State and Local Government Tax Revenues 2015-16 Fiscal Year
(Million)
Source: Dean Runyan Associates. “Other” travel-generated tax revenue includes the
franchise tax and passenger facility charges for visitors who travel to Texas airports.
Whereas slightly less than one-half of all state and local tax revenue in Texas was
attributable to sales tax collections in the 2015-16 fiscal year, 82 percent of all travel
industry tax revenue was attributable to sales tax receipts from visitors (67 percent) and the
purchases of employees in the travel industry (15 percent).4
Travel industry state and local tax revenues are compared to total Texas state and local tax
revenues in the following table. Because the travel industry generates a relatively high
proportion of sales tax revenues, it is associated with proportionately more tax revenues
than would be expected given the size of the industry, as measured by earnings or gross
domestic product. Whereas the earnings and GDP of the travel industry are slightly more
than 2 percent of the state totals, travel industry tax revenues represent 5.5 percent of all
state and local tax revenues in Texas. This is consistent with the initial analysis that
compared different industries within the state.
4 These sales tax receipts include the selective taxes on hotel occupancy, motor fuel and mixed beverages.
DEAN RUNYAN ASSOCIATES PAGE 21
Sales
50%
Auto Rental
7%
Motor Fuel
20%
Other
3%
Alcoholic
Beverage6%
Hotel
Occupancy14%
0%
1%
2%
3%
4%
5%
6%
7%
8%
Local Share State Share
Texas State and Local Tax Revenues 2015-16 Fiscal Year
($Million)
Percent
Total Visitor
Business &
Employee Travel
Sales & Gross Receipts $54,580 $4,250 $960 9.5%
Property $48,630 $0 $930 1.9%
License & Other $8,370 $80 $100 2.1%
Total Tax Receipts $111,580 $4,330 $1,980 5.7%
Travel-Generated
Sources: Dean Runyan Associates and Bureau of the Census, State and Local Government
Finance. Business & employee taxes refer to sales and property tax payments of travel
industry employees and property and franchise tax payments of travel industry businesses.
Tax revenue directly attributable to visitors ($4.3 billion) accounted for 3.9 percent of all
state and local tax revenue. Tax revenue attributable to travel industry employees and
businesses ($1.9 billion) accounted for 1.7 percent of all state and local tax revenue.
TRAVEL INDUSTRY CONTRIBUTION TO STATE GOVERNMENT
Travel-Generated Tax
Revenue as a Percentage of
Total Local and State
Revenue, 2016 FY
Travel-Generated Tax Revenue to State Government 2016 FY
The overall contribution of the travel industry to state
government revenue (6.8 percent) is greater than the
contribution to local government (4.3 percent), as
indicated in the column chart to the right. This is
because state government is primarily dependent on
sales and gross receipts taxes, whereas local
governments receive most of their revenue from
property taxes. (Total tax revenues are roughly similar
for both levels of government.)
The pie chart shows the distribution of travel-generated
state taxes. Virtually all of the revenue is generated
through some form of sales or gross receipts tax.
Other taxes include the
franchise tax and tobacco taxes.
PAGE 22 DEAN RUNYAN ASSOCIATES
SUMMARY
This analysis of the tax revenue generated by the Texas travel industry can be summarized
as follows:
The Texas travel industry contributes more tax revenue to state and local
governments than would be expected based on the size of the industry. Whereas
the gross domestic product and employee earnings represent about two percent of
the state economy, the travel industry generates 5.7 percent of tax revenue.
The contribution of the travel industry to state government is even more
pronounced – 6.8 percent in the 2016 fiscal year.
The state’s reliance on sales and gross receipts taxes is the primary reason for the
large revenue contribution of the travel industry. Not only are most travel industry
goods and services taxed, but a large share of these commodities are taxed at rates
that are greater than the general sales tax (motor fuel, auto rental, mixed beverages).
A substantial share of travel-generated tax revenue is not borne by Texas residents
due to the fact that more than one-half of all visitor spending in the state is made by
out-of-state visitors. 5
Detailed tables for tourism regions, metropolitan areas and counties follow.
5 Spending by international visitors amounted to 12 percent of spending. Domestic out-of-state visitors
contributed 43 percent of all spending. See page 11.
DEAN RUNYAN ASSOCIATES PAGE 23
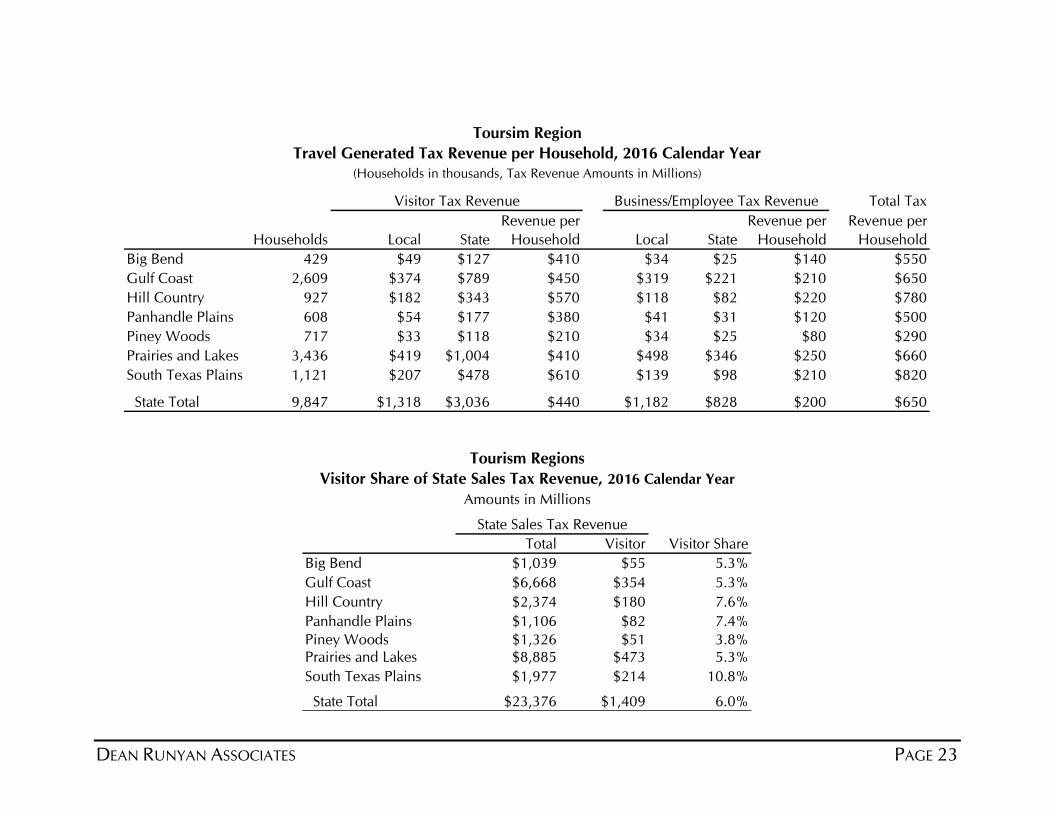
Total Tax
Local State Local State
Big Bend 429 $49 $127 $410 $34 $25 $140 $550
Gulf Coast 2,609 $374 $789 $450 $319 $221 $210 $650
Hill Country 927 $182 $343 $570 $118 $82 $220 $780
Panhandle Plains 608 $54 $177 $380 $41 $31 $120 $500
Piney Woods 717 $33 $118 $210 $34 $25 $80 $290
Prairies and Lakes 3,436 $419 $1,004 $410 $498 $346 $250 $660
South Texas Plains 1,121 $207 $478 $610 $139 $98 $210 $820
State Total 9,847 $1,318 $3,036 $440 $1,182 $828 $200 $650
Revenue per
Household
Revenue per
Household
Revenue per
HouseholdHouseholds
Toursim Region
Travel Generated Tax Revenue per Household, 2016 Calendar Year
(Households in thousands, Tax Revenue Amounts in Millions)
Visitor Tax Revenue Business/Employee Tax Revenue
Total Visitor Visitor Share
Big Bend $1,039 $55 5.3%
Gulf Coast $6,668 $354 5.3%
Hill Country $2,374 $180 7.6%
Panhandle Plains $1,106 $82 7.4%
Piney Woods $1,326 $51 3.8%Prairies and Lakes $8,885 $473 5.3%
South Texas Plains $1,977 $214 10.8%
State Total $23,376 $1,409 6.0%
State Sales Tax Revenue
Tourism Regions
Visitor Share of State Sales Tax Revenue, 2016 Calendar Year
Amounts in Millions
PAGE 24 DEAN RUNYAN ASSOCIATES
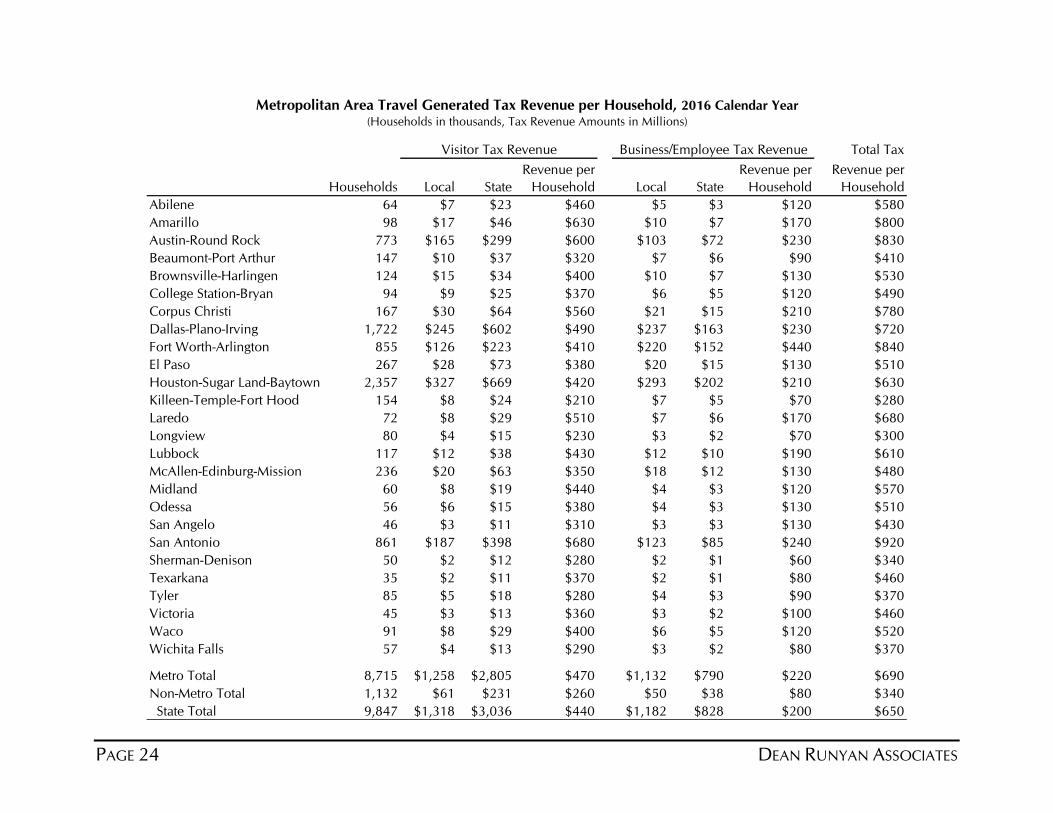
Total Tax
Local State Local State
Abilene 64 $7 $23 $460 $5 $3 $120 $580
Amarillo 98 $17 $46 $630 $10 $7 $170 $800
Austin-Round Rock 773 $165 $299 $600 $103 $72 $230 $830
Beaumont-Port Arthur 147 $10 $37 $320 $7 $6 $90 $410
Brownsville-Harlingen 124 $15 $34 $400 $10 $7 $130 $530
College Station-Bryan 94 $9 $25 $370 $6 $5 $120 $490
Corpus Christi 167 $30 $64 $560 $21 $15 $210 $780
Dallas-Plano-Irving 1,722 $245 $602 $490 $237 $163 $230 $720
Fort Worth-Arlington 855 $126 $223 $410 $220 $152 $440 $840
El Paso 267 $28 $73 $380 $20 $15 $130 $510
Houston-Sugar Land-Baytown 2,357 $327 $669 $420 $293 $202 $210 $630
Killeen-Temple-Fort Hood 154 $8 $24 $210 $7 $5 $70 $280
Laredo 72 $8 $29 $510 $7 $6 $170 $680
Longview 80 $4 $15 $230 $3 $2 $70 $300
Lubbock 117 $12 $38 $430 $12 $10 $190 $610
McAllen-Edinburg-Mission 236 $20 $63 $350 $18 $12 $130 $480
Midland 60 $8 $19 $440 $4 $3 $120 $570
Odessa 56 $6 $15 $380 $4 $3 $130 $510
San Angelo 46 $3 $11 $310 $3 $3 $130 $430
San Antonio 861 $187 $398 $680 $123 $85 $240 $920
Sherman-Denison 50 $2 $12 $280 $2 $1 $60 $340
Texarkana 35 $2 $11 $370 $2 $1 $80 $460
Tyler 85 $5 $18 $280 $4 $3 $90 $370
Victoria 45 $3 $13 $360 $3 $2 $100 $460
Waco 91 $8 $29 $400 $6 $5 $120 $520
Wichita Falls 57 $4 $13 $290 $3 $2 $80 $370
Metro Total 8,715 $1,258 $2,805 $470 $1,132 $790 $220 $690
Non-Metro Total 1,132 $61 $231 $260 $50 $38 $80 $340
State Total 9,847 $1,318 $3,036 $440 $1,182 $828 $200 $650
(Households in thousands, Tax Revenue Amounts in Millions)
Visitor Tax Revenue Business/Employee Tax Revenue
Revenue per
Household
Revenue per
Household
Revenue per
Household
Metropolitan Area Travel Generated Tax Revenue per Household, 2016 Calendar Year
Households
DEAN RUNYAN ASSOCIATES PAGE 25
Total Visitor Visitor Share
Abilene $117 $10 8.4%
Amarillo $218 $23 10.7%
Austin-Round Rock $2,055 $160 7.8%
Beaumont-Port Arthur $274 $15 5.6%
Brownsville-Harlingen $186 $20 10.5%College Station-Bryan $193 $12 6.2%
Corpus Christi $345 $34 9.8%
Dallas-Plano-Irving $4,669 $290 6.2%
Fort Worth-Arlington $1,934 $106 5.5%
El Paso $463 $30 6.5%
Houston-Sugar Land-Baytown $6,279 $292 4.6%
Killeen-Temple-Fort Hood $216 $13 6.2%
Laredo $151 $19 12.6%
Longview $170 $6 3.6%
Lubbock $258 $20 7.8%
McAllen-Edinburg-Mission $397 $40 10.0%
Midland $292 $10 3.6%
Odessa $200 $9 4.3%
San Angelo $90 $6 6.3%
San Antonio $1,570 $166 10.6%
Sherman-Denison $85 $4 5.2%
Texarkana $69 $4 5.4%
Tyler $182 $9 5.1%
Victoria $118 $7 5.6%
Waco $173 $14 8.3%
Wichita Falls $88 $6 6.6%
Metro Total $20,792 $1,325 6.4%
Non-Metro Total $2,585 $84 3.2%
State Total $23,376 $1,409 6.0%
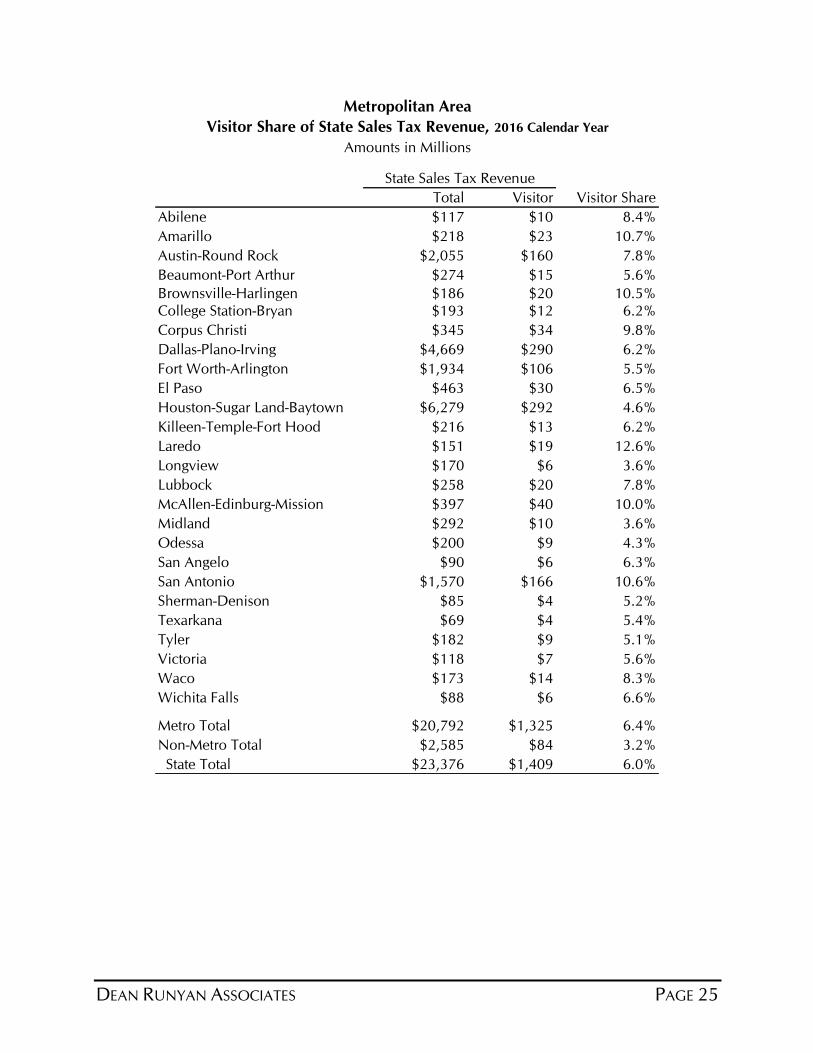
Metropolitan Area
Visitor Share of State Sales Tax Revenue, 2016 Calendar Year
Amounts in Millions
State Sales Tax Revenue
PAGE 26 DEAN RUNYAN ASSOCIATES
Total Tax
Local State Local State
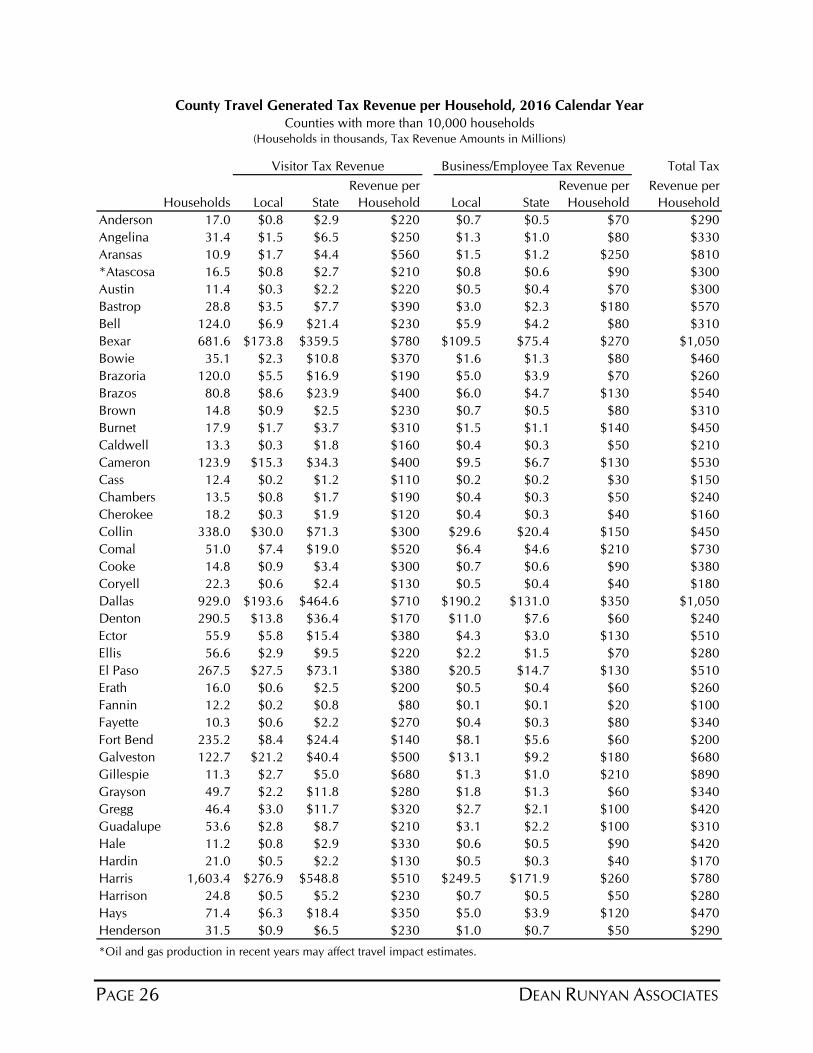
Anderson 17.0 $0.8 $2.9 $220 $0.7 $0.5 $70 $290
Angelina 31.4 $1.5 $6.5 $250 $1.3 $1.0 $80 $330
Aransas 10.9 $1.7 $4.4 $560 $1.5 $1.2 $250 $810
*Atascosa 16.5 $0.8 $2.7 $210 $0.8 $0.6 $90 $300
Austin 11.4 $0.3 $2.2 $220 $0.5 $0.4 $70 $300
Bastrop 28.8 $3.5 $7.7 $390 $3.0 $2.3 $180 $570
Bell 124.0 $6.9 $21.4 $230 $5.9 $4.2 $80 $310
Bexar 681.6 $173.8 $359.5 $780 $109.5 $75.4 $270 $1,050
Bowie 35.1 $2.3 $10.8 $370 $1.6 $1.3 $80 $460
Brazoria 120.0 $5.5 $16.9 $190 $5.0 $3.9 $70 $260
Brazos 80.8 $8.6 $23.9 $400 $6.0 $4.7 $130 $540
Brown 14.8 $0.9 $2.5 $230 $0.7 $0.5 $80 $310
Burnet 17.9 $1.7 $3.7 $310 $1.5 $1.1 $140 $450
Caldwell 13.3 $0.3 $1.8 $160 $0.4 $0.3 $50 $210
Cameron 123.9 $15.3 $34.3 $400 $9.5 $6.7 $130 $530
Cass 12.4 $0.2 $1.2 $110 $0.2 $0.2 $30 $150
Chambers 13.5 $0.8 $1.7 $190 $0.4 $0.3 $50 $240
Cherokee 18.2 $0.3 $1.9 $120 $0.4 $0.3 $40 $160
Collin 338.0 $30.0 $71.3 $300 $29.6 $20.4 $150 $450
Comal 51.0 $7.4 $19.0 $520 $6.4 $4.6 $210 $730
Cooke 14.8 $0.9 $3.4 $300 $0.7 $0.6 $90 $380
Coryell 22.3 $0.6 $2.4 $130 $0.5 $0.4 $40 $180
Dallas 929.0 $193.6 $464.6 $710 $190.2 $131.0 $350 $1,050
Denton 290.5 $13.8 $36.4 $170 $11.0 $7.6 $60 $240
Ector 55.9 $5.8 $15.4 $380 $4.3 $3.0 $130 $510
Ellis 56.6 $2.9 $9.5 $220 $2.2 $1.5 $70 $280
El Paso 267.5 $27.5 $73.1 $380 $20.5 $14.7 $130 $510
Erath 16.0 $0.6 $2.5 $200 $0.5 $0.4 $60 $260
Fannin 12.2 $0.2 $0.8 $80 $0.1 $0.1 $20 $100
Fayette 10.3 $0.6 $2.2 $270 $0.4 $0.3 $80 $340
Fort Bend 235.2 $8.4 $24.4 $140 $8.1 $5.6 $60 $200
Galveston 122.7 $21.2 $40.4 $500 $13.1 $9.2 $180 $680
Gillespie 11.3 $2.7 $5.0 $680 $1.3 $1.0 $210 $890
Grayson 49.7 $2.2 $11.8 $280 $1.8 $1.3 $60 $340
Gregg 46.4 $3.0 $11.7 $320 $2.7 $2.1 $100 $420
Guadalupe 53.6 $2.8 $8.7 $210 $3.1 $2.2 $100 $310
Hale 11.2 $0.8 $2.9 $330 $0.6 $0.5 $90 $420
Hardin 21.0 $0.5 $2.2 $130 $0.5 $0.3 $40 $170
Harris 1,603.4 $276.9 $548.8 $510 $249.5 $171.9 $260 $780
Harrison 24.8 $0.5 $5.2 $230 $0.7 $0.5 $50 $280
Hays 71.4 $6.3 $18.4 $350 $5.0 $3.9 $120 $470
Henderson 31.5 $0.9 $6.5 $230 $1.0 $0.7 $50 $290
*Oil and gas production in recent years may affect travel impact estimates.
Revenue per
Household
Revenue per
Household
Revenue per
Household
County Travel Generated Tax Revenue per Household, 2016 Calendar Year
Counties with more than 10,000 households(Households in thousands, Tax Revenue Amounts in Millions)
Visitor Tax Revenue Business/Employee Tax Revenue
Households
DEAN RUNYAN ASSOCIATES PAGE 27
Total Tax
Local State Local State
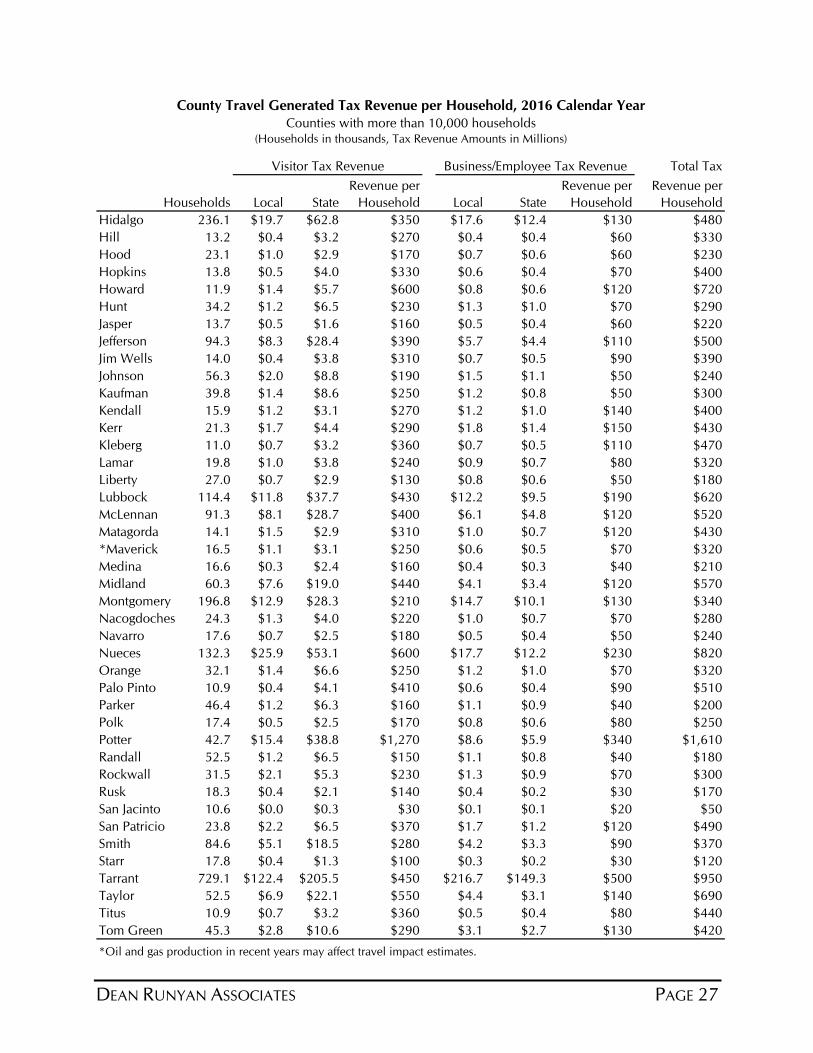
Hidalgo 236.1 $19.7 $62.8 $350 $17.6 $12.4 $130 $480
Hill 13.2 $0.4 $3.2 $270 $0.4 $0.4 $60 $330
Hood 23.1 $1.0 $2.9 $170 $0.7 $0.6 $60 $230
Hopkins 13.8 $0.5 $4.0 $330 $0.6 $0.4 $70 $400
Howard 11.9 $1.4 $5.7 $600 $0.8 $0.6 $120 $720
Hunt 34.2 $1.2 $6.5 $230 $1.3 $1.0 $70 $290
Jasper 13.7 $0.5 $1.6 $160 $0.5 $0.4 $60 $220
Jefferson 94.3 $8.3 $28.4 $390 $5.7 $4.4 $110 $500
Jim Wells 14.0 $0.4 $3.8 $310 $0.7 $0.5 $90 $390
Johnson 56.3 $2.0 $8.8 $190 $1.5 $1.1 $50 $240
Kaufman 39.8 $1.4 $8.6 $250 $1.2 $0.8 $50 $300
Kendall 15.9 $1.2 $3.1 $270 $1.2 $1.0 $140 $400
Kerr 21.3 $1.7 $4.4 $290 $1.8 $1.4 $150 $430
Kleberg 11.0 $0.7 $3.2 $360 $0.7 $0.5 $110 $470
Lamar 19.8 $1.0 $3.8 $240 $0.9 $0.7 $80 $320
Liberty 27.0 $0.7 $2.9 $130 $0.8 $0.6 $50 $180
Lubbock 114.4 $11.8 $37.7 $430 $12.2 $9.5 $190 $620
McLennan 91.3 $8.1 $28.7 $400 $6.1 $4.8 $120 $520
Matagorda 14.1 $1.5 $2.9 $310 $1.0 $0.7 $120 $430
*Maverick 16.5 $1.1 $3.1 $250 $0.6 $0.5 $70 $320
Medina 16.6 $0.3 $2.4 $160 $0.4 $0.3 $40 $210
Midland 60.3 $7.6 $19.0 $440 $4.1 $3.4 $120 $570
Montgomery 196.8 $12.9 $28.3 $210 $14.7 $10.1 $130 $340
Nacogdoches 24.3 $1.3 $4.0 $220 $1.0 $0.7 $70 $280
Navarro 17.6 $0.7 $2.5 $180 $0.5 $0.4 $50 $240
Nueces 132.3 $25.9 $53.1 $600 $17.7 $12.2 $230 $820
Orange 32.1 $1.4 $6.6 $250 $1.2 $1.0 $70 $320
Palo Pinto 10.9 $0.4 $4.1 $410 $0.6 $0.4 $90 $510
Parker 46.4 $1.2 $6.3 $160 $1.1 $0.9 $40 $200
Polk 17.4 $0.5 $2.5 $170 $0.8 $0.6 $80 $250
Potter 42.7 $15.4 $38.8 $1,270 $8.6 $5.9 $340 $1,610
Randall 52.5 $1.2 $6.5 $150 $1.1 $0.8 $40 $180
Rockwall 31.5 $2.1 $5.3 $230 $1.3 $0.9 $70 $300
Rusk 18.3 $0.4 $2.1 $140 $0.4 $0.2 $30 $170
San Jacinto 10.6 $0.0 $0.3 $30 $0.1 $0.1 $20 $50
San Patricio 23.8 $2.2 $6.5 $370 $1.7 $1.2 $120 $490
Smith 84.6 $5.1 $18.5 $280 $4.2 $3.3 $90 $370
Starr 17.8 $0.4 $1.3 $100 $0.3 $0.2 $30 $120
Tarrant 729.1 $122.4 $205.5 $450 $216.7 $149.3 $500 $950
Taylor 52.5 $6.9 $22.1 $550 $4.4 $3.1 $140 $690
Titus 10.9 $0.7 $3.2 $360 $0.5 $0.4 $80 $440
Tom Green 45.3 $2.8 $10.6 $290 $3.1 $2.7 $130 $420
*Oil and gas production in recent years may affect travel impact estimates.
Revenue per
Household
Revenue per
Household
Revenue per
HouseholdHouseholds
County Travel Generated Tax Revenue per Household, 2016 Calendar Year
Counties with more than 10,000 households(Households in thousands, Tax Revenue Amounts in Millions)
Visitor Tax Revenue Business/Employee Tax Revenue
PAGE 28 DEAN RUNYAN ASSOCIATES
Total Tax
Local State Local State
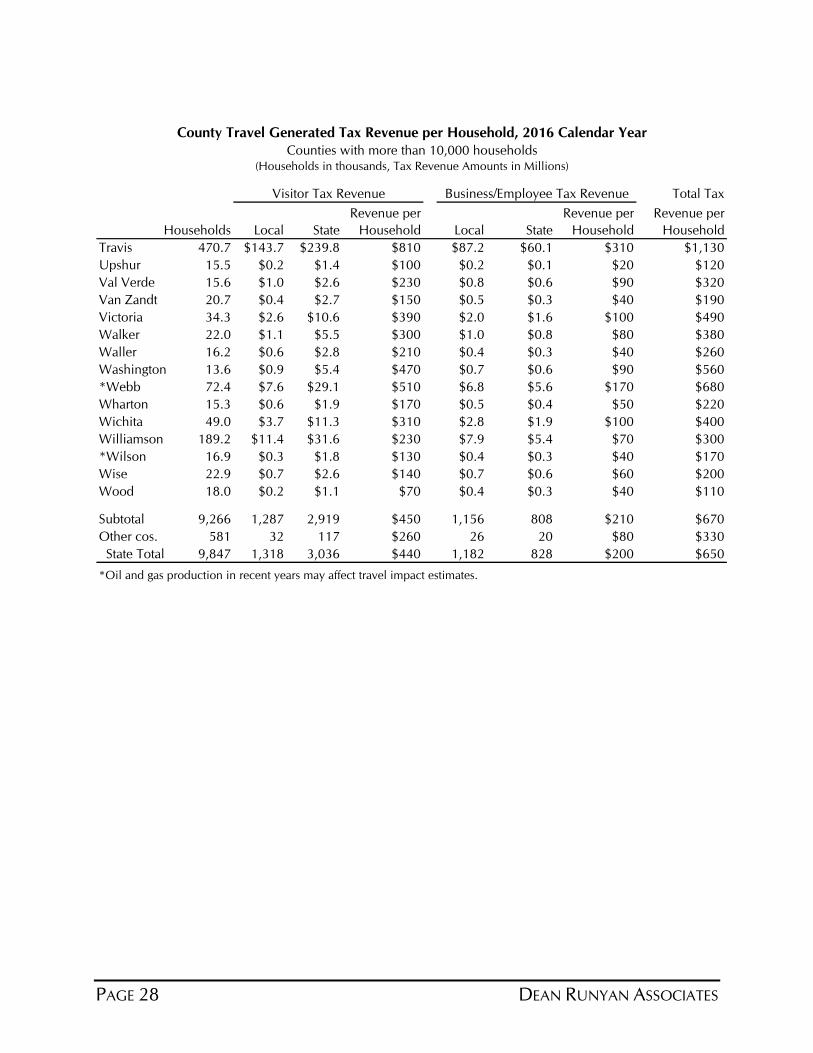
Travis 470.7 $143.7 $239.8 $810 $87.2 $60.1 $310 $1,130
Upshur 15.5 $0.2 $1.4 $100 $0.2 $0.1 $20 $120
Val Verde 15.6 $1.0 $2.6 $230 $0.8 $0.6 $90 $320
Van Zandt 20.7 $0.4 $2.7 $150 $0.5 $0.3 $40 $190
Victoria 34.3 $2.6 $10.6 $390 $2.0 $1.6 $100 $490
Walker 22.0 $1.1 $5.5 $300 $1.0 $0.8 $80 $380
Waller 16.2 $0.6 $2.8 $210 $0.4 $0.3 $40 $260
Washington 13.6 $0.9 $5.4 $470 $0.7 $0.6 $90 $560
*Webb 72.4 $7.6 $29.1 $510 $6.8 $5.6 $170 $680
Wharton 15.3 $0.6 $1.9 $170 $0.5 $0.4 $50 $220
Wichita 49.0 $3.7 $11.3 $310 $2.8 $1.9 $100 $400
Williamson 189.2 $11.4 $31.6 $230 $7.9 $5.4 $70 $300
*Wilson 16.9 $0.3 $1.8 $130 $0.4 $0.3 $40 $170
Wise 22.9 $0.7 $2.6 $140 $0.7 $0.6 $60 $200
Wood 18.0 $0.2 $1.1 $70 $0.4 $0.3 $40 $110
Subtotal 9,266 1,287 2,919 $450 1,156 808 $210 $670
Other cos. 581 32 117 $260 26 20 $80 $330
State Total 9,847 1,318 3,036 $440 1,182 828 $200 $650
*Oil and gas production in recent years may affect travel impact estimates.
Revenue per
Household
Revenue per
Household
Revenue per
HouseholdHouseholds
County Travel Generated Tax Revenue per Household, 2016 Calendar Year
Counties with more than 10,000 households(Households in thousands, Tax Revenue Amounts in Millions)
Visitor Tax Revenue Business/Employee Tax Revenue
DEAN RUNYAN ASSOCIATES PAGE 29
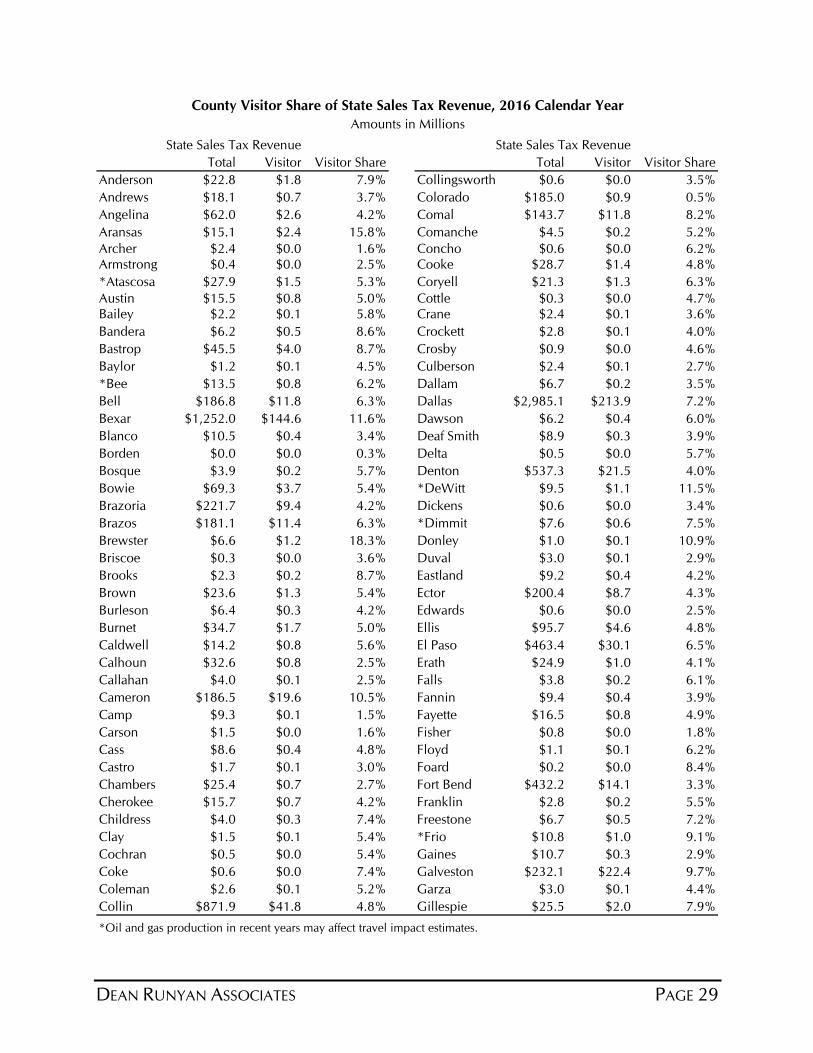
Total Visitor Visitor Share Total Visitor Visitor Share
Anderson $22.8 $1.8 7.9% Collingsworth $0.6 $0.0 3.5%
Andrews $18.1 $0.7 3.7% Colorado $185.0 $0.9 0.5%
Angelina $62.0 $2.6 4.2% Comal $143.7 $11.8 8.2%
Aransas $15.1 $2.4 15.8% Comanche $4.5 $0.2 5.2%
Archer $2.4 $0.0 1.6% Concho $0.6 $0.0 6.2%Armstrong $0.4 $0.0 2.5% Cooke $28.7 $1.4 4.8%
*Atascosa $27.9 $1.5 5.3% Coryell $21.3 $1.3 6.3%
Austin $15.5 $0.8 5.0% Cottle $0.3 $0.0 4.7%Bailey $2.2 $0.1 5.8% Crane $2.4 $0.1 3.6%
Bandera $6.2 $0.5 8.6% Crockett $2.8 $0.1 4.0%
Bastrop $45.5 $4.0 8.7% Crosby $0.9 $0.0 4.6%
Baylor $1.2 $0.1 4.5% Culberson $2.4 $0.1 2.7%
*Bee $13.5 $0.8 6.2% Dallam $6.7 $0.2 3.5%
Bell $186.8 $11.8 6.3% Dallas $2,985.1 $213.9 7.2%
Bexar $1,252.0 $144.6 11.6% Dawson $6.2 $0.4 6.0%
Blanco $10.5 $0.4 3.4% Deaf Smith $8.9 $0.3 3.9%
Borden $0.0 $0.0 0.3% Delta $0.5 $0.0 5.7%
Bosque $3.9 $0.2 5.7% Denton $537.3 $21.5 4.0%
Bowie $69.3 $3.7 5.4% *DeWitt $9.5 $1.1 11.5%
Brazoria $221.7 $9.4 4.2% Dickens $0.6 $0.0 3.4%
Brazos $181.1 $11.4 6.3% *Dimmit $7.6 $0.6 7.5%
Brewster $6.6 $1.2 18.3% Donley $1.0 $0.1 10.9%
Briscoe $0.3 $0.0 3.6% Duval $3.0 $0.1 2.9%
Brooks $2.3 $0.2 8.7% Eastland $9.2 $0.4 4.2%
Brown $23.6 $1.3 5.4% Ector $200.4 $8.7 4.3%
Burleson $6.4 $0.3 4.2% Edwards $0.6 $0.0 2.5%
Burnet $34.7 $1.7 5.0% Ellis $95.7 $4.6 4.8%
Caldwell $14.2 $0.8 5.6% El Paso $463.4 $30.1 6.5%
Calhoun $32.6 $0.8 2.5% Erath $24.9 $1.0 4.1%
Callahan $4.0 $0.1 2.5% Falls $3.8 $0.2 6.1%
Cameron $186.5 $19.6 10.5% Fannin $9.4 $0.4 3.9%
Camp $9.3 $0.1 1.5% Fayette $16.5 $0.8 4.9%
Carson $1.5 $0.0 1.6% Fisher $0.8 $0.0 1.8%
Cass $8.6 $0.4 4.8% Floyd $1.1 $0.1 6.2%
Castro $1.7 $0.1 3.0% Foard $0.2 $0.0 8.4%
Chambers $25.4 $0.7 2.7% Fort Bend $432.2 $14.1 3.3%
Cherokee $15.7 $0.7 4.2% Franklin $2.8 $0.2 5.5%
Childress $4.0 $0.3 7.4% Freestone $6.7 $0.5 7.2%
Clay $1.5 $0.1 5.4% *Frio $10.8 $1.0 9.1%
Cochran $0.5 $0.0 5.4% Gaines $10.7 $0.3 2.9%
Coke $0.6 $0.0 7.4% Galveston $232.1 $22.4 9.7%
Coleman $2.6 $0.1 5.2% Garza $3.0 $0.1 4.4%
Collin $871.9 $41.8 4.8% Gillespie $25.5 $2.0 7.9%
*Oil and gas production in recent years may affect travel impact estimates.
Amounts in Millions
County Visitor Share of State Sales Tax Revenue, 2016 Calendar Year
State Sales Tax Revenue State Sales Tax Revenue
PAGE 30 DEAN RUNYAN ASSOCIATES
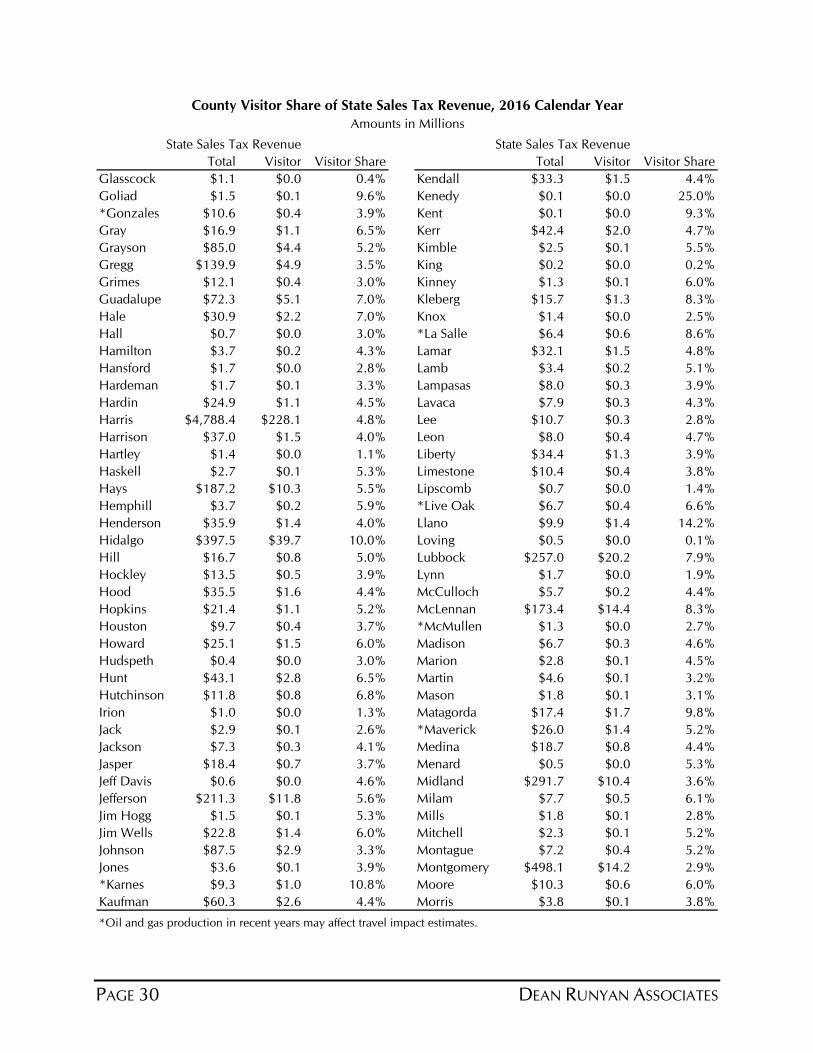
Total Visitor Visitor Share Total Visitor Visitor Share
Glasscock $1.1 $0.0 0.4% Kendall $33.3 $1.5 4.4%
Goliad $1.5 $0.1 9.6% Kenedy $0.1 $0.0 25.0%
*Gonzales $10.6 $0.4 3.9% Kent $0.1 $0.0 9.3%
Gray $16.9 $1.1 6.5% Kerr $42.4 $2.0 4.7%
Grayson $85.0 $4.4 5.2% Kimble $2.5 $0.1 5.5%
Gregg $139.9 $4.9 3.5% King $0.2 $0.0 0.2%
Grimes $12.1 $0.4 3.0% Kinney $1.3 $0.1 6.0%
Guadalupe $72.3 $5.1 7.0% Kleberg $15.7 $1.3 8.3%
Hale $30.9 $2.2 7.0% Knox $1.4 $0.0 2.5%
Hall $0.7 $0.0 3.0% *La Salle $6.4 $0.6 8.6%
Hamilton $3.7 $0.2 4.3% Lamar $32.1 $1.5 4.8%
Hansford $1.7 $0.0 2.8% Lamb $3.4 $0.2 5.1%
Hardeman $1.7 $0.1 3.3% Lampasas $8.0 $0.3 3.9%
Hardin $24.9 $1.1 4.5% Lavaca $7.9 $0.3 4.3%
Harris $4,788.4 $228.1 4.8% Lee $10.7 $0.3 2.8%
Harrison $37.0 $1.5 4.0% Leon $8.0 $0.4 4.7%
Hartley $1.4 $0.0 1.1% Liberty $34.4 $1.3 3.9%
Haskell $2.7 $0.1 5.3% Limestone $10.4 $0.4 3.8%
Hays $187.2 $10.3 5.5% Lipscomb $0.7 $0.0 1.4%
Hemphill $3.7 $0.2 5.9% *Live Oak $6.7 $0.4 6.6%
Henderson $35.9 $1.4 4.0% Llano $9.9 $1.4 14.2%
Hidalgo $397.5 $39.7 10.0% Loving $0.5 $0.0 0.1%
Hill $16.7 $0.8 5.0% Lubbock $257.0 $20.2 7.9%
Hockley $13.5 $0.5 3.9% Lynn $1.7 $0.0 1.9%
Hood $35.5 $1.6 4.4% McCulloch $5.7 $0.2 4.4%
Hopkins $21.4 $1.1 5.2% McLennan $173.4 $14.4 8.3%
Houston $9.7 $0.4 3.7% *McMullen $1.3 $0.0 2.7%
Howard $25.1 $1.5 6.0% Madison $6.7 $0.3 4.6%
Hudspeth $0.4 $0.0 3.0% Marion $2.8 $0.1 4.5%
Hunt $43.1 $2.8 6.5% Martin $4.6 $0.1 3.2%
Hutchinson $11.8 $0.8 6.8% Mason $1.8 $0.1 3.1%
Irion $1.0 $0.0 1.3% Matagorda $17.4 $1.7 9.8%
Jack $2.9 $0.1 2.6% *Maverick $26.0 $1.4 5.2%
Jackson $7.3 $0.3 4.1% Medina $18.7 $0.8 4.4%
Jasper $18.4 $0.7 3.7% Menard $0.5 $0.0 5.3%
Jeff Davis $0.6 $0.0 4.6% Midland $291.7 $10.4 3.6%
Jefferson $211.3 $11.8 5.6% Milam $7.7 $0.5 6.1%
Jim Hogg $1.5 $0.1 5.3% Mills $1.8 $0.1 2.8%
Jim Wells $22.8 $1.4 6.0% Mitchell $2.3 $0.1 5.2%
Johnson $87.5 $2.9 3.3% Montague $7.2 $0.4 5.2%
Jones $3.6 $0.1 3.9% Montgomery $498.1 $14.2 2.9%
*Karnes $9.3 $1.0 10.8% Moore $10.3 $0.6 6.0%
Kaufman $60.3 $2.6 4.4% Morris $3.8 $0.1 3.8%
*Oil and gas production in recent years may affect travel impact estimates.
County Visitor Share of State Sales Tax Revenue, 2016 Calendar Year
Amounts in Millions
State Sales Tax Revenue State Sales Tax Revenue
DEAN RUNYAN ASSOCIATES PAGE 31
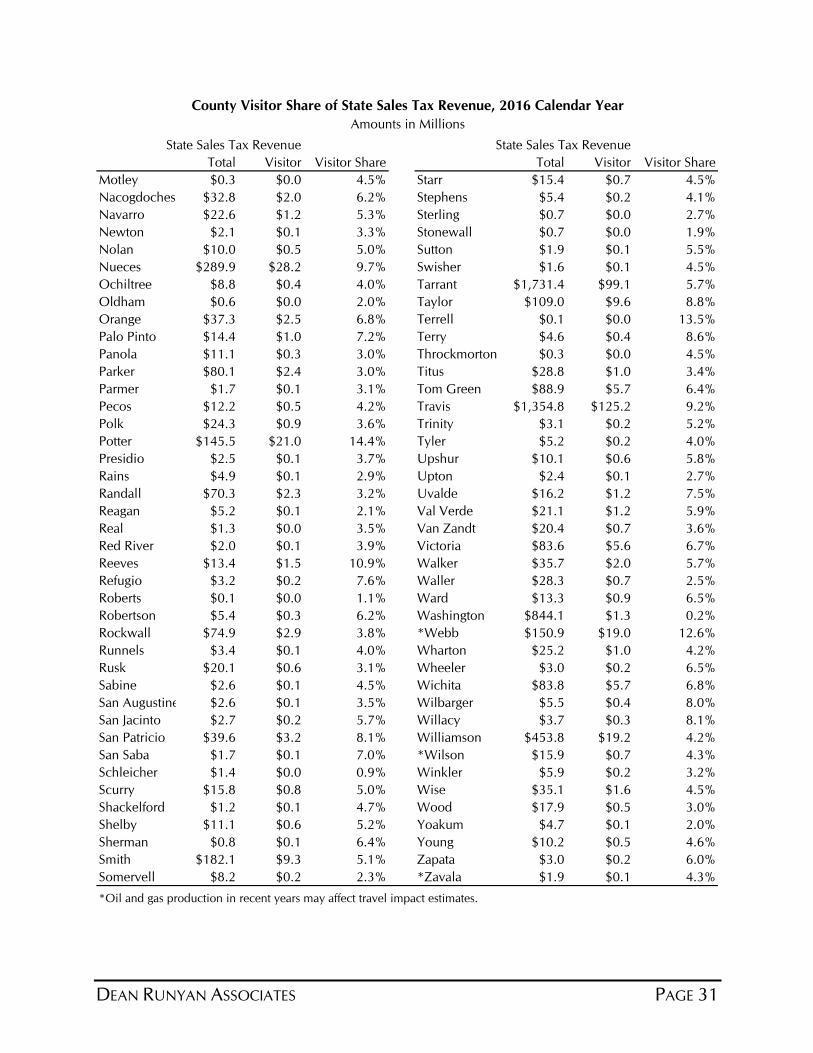
Total Visitor Visitor Share Total Visitor Visitor Share
Motley $0.3 $0.0 4.5% Starr $15.4 $0.7 4.5%
Nacogdoches $32.8 $2.0 6.2% Stephens $5.4 $0.2 4.1%
Navarro $22.6 $1.2 5.3% Sterling $0.7 $0.0 2.7%
Newton $2.1 $0.1 3.3% Stonewall $0.7 $0.0 1.9%
Nolan $10.0 $0.5 5.0% Sutton $1.9 $0.1 5.5%
Nueces $289.9 $28.2 9.7% Swisher $1.6 $0.1 4.5%
Ochiltree $8.8 $0.4 4.0% Tarrant $1,731.4 $99.1 5.7%
Oldham $0.6 $0.0 2.0% Taylor $109.0 $9.6 8.8%
Orange $37.3 $2.5 6.8% Terrell $0.1 $0.0 13.5%
Palo Pinto $14.4 $1.0 7.2% Terry $4.6 $0.4 8.6%
Panola $11.1 $0.3 3.0% Throckmorton $0.3 $0.0 4.5%
Parker $80.1 $2.4 3.0% Titus $28.8 $1.0 3.4%
Parmer $1.7 $0.1 3.1% Tom Green $88.9 $5.7 6.4%
Pecos $12.2 $0.5 4.2% Travis $1,354.8 $125.2 9.2%
Polk $24.3 $0.9 3.6% Trinity $3.1 $0.2 5.2%
Potter $145.5 $21.0 14.4% Tyler $5.2 $0.2 4.0%
Presidio $2.5 $0.1 3.7% Upshur $10.1 $0.6 5.8%
Rains $4.9 $0.1 2.9% Upton $2.4 $0.1 2.7%
Randall $70.3 $2.3 3.2% Uvalde $16.2 $1.2 7.5%
Reagan $5.2 $0.1 2.1% Val Verde $21.1 $1.2 5.9%
Real $1.3 $0.0 3.5% Van Zandt $20.4 $0.7 3.6%
Red River $2.0 $0.1 3.9% Victoria $83.6 $5.6 6.7%
Reeves $13.4 $1.5 10.9% Walker $35.7 $2.0 5.7%
Refugio $3.2 $0.2 7.6% Waller $28.3 $0.7 2.5%
Roberts $0.1 $0.0 1.1% Ward $13.3 $0.9 6.5%
Robertson $5.4 $0.3 6.2% Washington $844.1 $1.3 0.2%
Rockwall $74.9 $2.9 3.8% *Webb $150.9 $19.0 12.6%
Runnels $3.4 $0.1 4.0% Wharton $25.2 $1.0 4.2%
Rusk $20.1 $0.6 3.1% Wheeler $3.0 $0.2 6.5%
Sabine $2.6 $0.1 4.5% Wichita $83.8 $5.7 6.8%
San Augustine $2.6 $0.1 3.5% Wilbarger $5.5 $0.4 8.0%
San Jacinto $2.7 $0.2 5.7% Willacy $3.7 $0.3 8.1%
San Patricio $39.6 $3.2 8.1% Williamson $453.8 $19.2 4.2%
San Saba $1.7 $0.1 7.0% *Wilson $15.9 $0.7 4.3%
Schleicher $1.4 $0.0 0.9% Winkler $5.9 $0.2 3.2%
Scurry $15.8 $0.8 5.0% Wise $35.1 $1.6 4.5%
Shackelford $1.2 $0.1 4.7% Wood $17.9 $0.5 3.0%
Shelby $11.1 $0.6 5.2% Yoakum $4.7 $0.1 2.0%
Sherman $0.8 $0.1 6.4% Young $10.2 $0.5 4.6%
Smith $182.1 $9.3 5.1% Zapata $3.0 $0.2 6.0%
Somervell $8.2 $0.2 2.3% *Zavala $1.9 $0.1 4.3%
*Oil and gas production in recent years may affect travel impact estimates.
County Visitor Share of State Sales Tax Revenue, 2016 Calendar Year
Amounts in Millions
State Sales Tax Revenue State Sales Tax Revenue
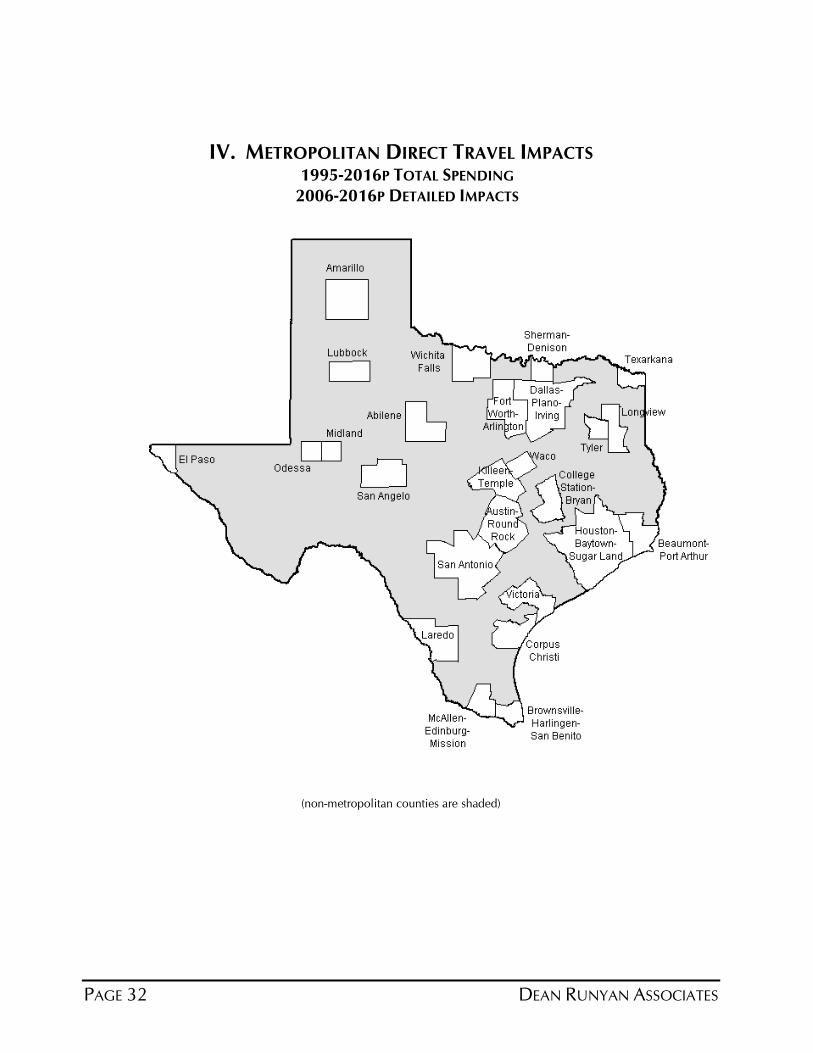
PAGE 32 DEAN RUNYAN ASSOCIATES
IV. METROPOLITAN DIRECT TRAVEL IMPACTS 1995-2016P TOTAL SPENDING
2006-2016P DETAILED IMPACTS
(non-metropolitan counties are shaded)
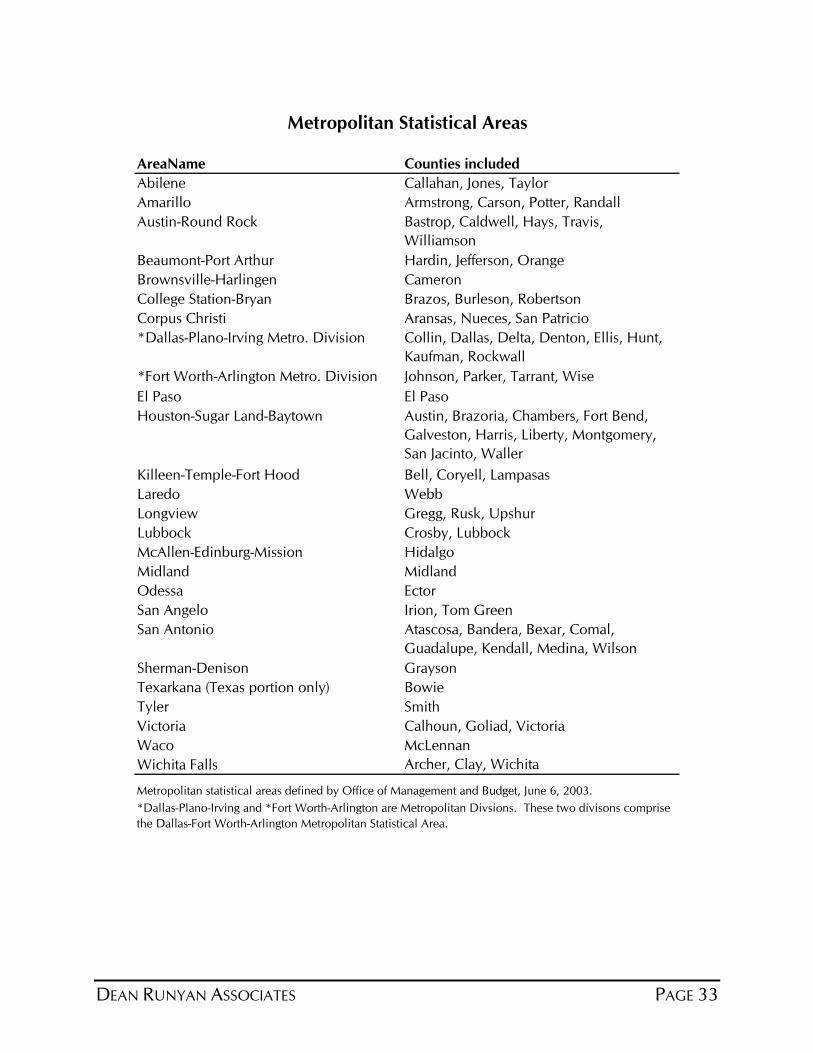
DEAN RUNYAN ASSOCIATES PAGE 33
AreaName Counties included
Abilene Callahan, Jones, Taylor
Amarillo Armstrong, Carson, Potter, Randall
Austin-Round Rock Bastrop, Caldwell, Hays, Travis,
Williamson
Beaumont-Port Arthur Hardin, Jefferson, Orange
Brownsville-Harlingen Cameron
College Station-Bryan Brazos, Burleson, Robertson
Corpus Christi Aransas, Nueces, San Patricio
*Dallas-Plano-Irving Metro. Division Collin, Dallas, Delta, Denton, Ellis, Hunt,
Kaufman, Rockwall
*Fort Worth-Arlington Metro. Division Johnson, Parker, Tarrant, Wise
El Paso El Paso
Houston-Sugar Land-Baytown Austin, Brazoria, Chambers, Fort Bend,
Galveston, Harris, Liberty, Montgomery,
San Jacinto, Waller
Killeen-Temple-Fort Hood Bell, Coryell, Lampasas
Laredo Webb
Longview Gregg, Rusk, Upshur
Lubbock Crosby, Lubbock
McAllen-Edinburg-Mission Hidalgo
Midland Midland
Odessa Ector
San Angelo Irion, Tom Green
San Antonio Atascosa, Bandera, Bexar, Comal,
Guadalupe, Kendall, Medina, Wilson
Sherman-Denison Grayson
Texarkana (Texas portion only) Bowie
Tyler Smith
Victoria Calhoun, Goliad, Victoria
Waco McLennan
Wichita Falls Archer, Clay, Wichita
Metropolitan statistical areas defined by Office of Management and Budget, June 6, 2003.
Metropolitan Statistical Areas
*Dallas-Plano-Irving and *Fort Worth-Arlington are Metropolitan Divsions. These two divisons comprise
the Dallas-Fort Worth-Arlington Metropolitan Statistical Area.
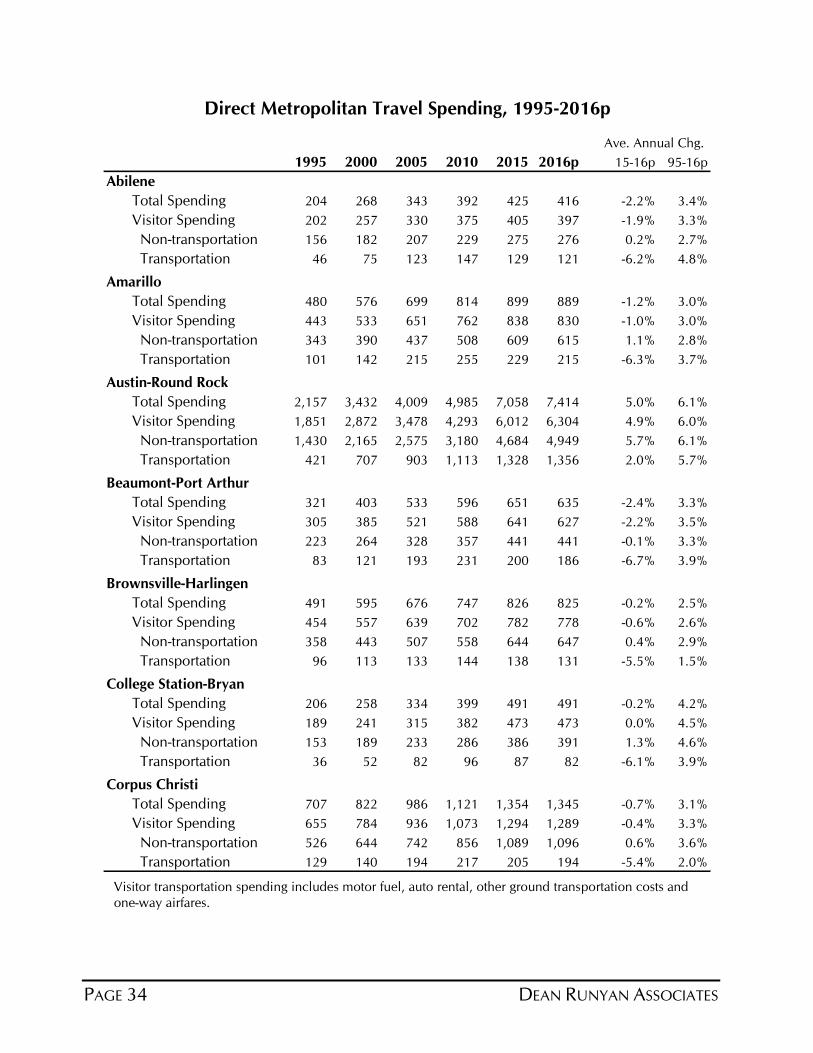
PAGE 34 DEAN RUNYAN ASSOCIATES
1995 2000 2005 2010 2015 2016p 15-16p 95-16p
Abilene
Total Spending 204 268 343 392 425 416 -2.2% 3.4%
Visitor Spending 202 257 330 375 405 397 -1.9% 3.3%
Non-transportation 156 182 207 229 275 276 0.2% 2.7%
Transportation 46 75 123 147 129 121 -6.2% 4.8%
Amarillo
Total Spending 480 576 699 814 899 889 -1.2% 3.0%
Visitor Spending 443 533 651 762 838 830 -1.0% 3.0%
Non-transportation 343 390 437 508 609 615 1.1% 2.8%
Transportation 101 142 215 255 229 215 -6.3% 3.7%
Austin-Round Rock
Total Spending 2,157 3,432 4,009 4,985 7,058 7,414 5.0% 6.1%
Visitor Spending 1,851 2,872 3,478 4,293 6,012 6,304 4.9% 6.0%
Non-transportation 1,430 2,165 2,575 3,180 4,684 4,949 5.7% 6.1%
Transportation 421 707 903 1,113 1,328 1,356 2.0% 5.7%
Beaumont-Port Arthur
Total Spending 321 403 533 596 651 635 -2.4% 3.3%
Visitor Spending 305 385 521 588 641 627 -2.2% 3.5%
Non-transportation 223 264 328 357 441 441 -0.1% 3.3%
Transportation 83 121 193 231 200 186 -6.7% 3.9%
Brownsville-Harlingen
Total Spending 491 595 676 747 826 825 -0.2% 2.5%
Visitor Spending 454 557 639 702 782 778 -0.6% 2.6%
Non-transportation 358 443 507 558 644 647 0.4% 2.9%
Transportation 96 113 133 144 138 131 -5.5% 1.5%
College Station-Bryan
Total Spending 206 258 334 399 491 491 -0.2% 4.2%
Visitor Spending 189 241 315 382 473 473 0.0% 4.5%
Non-transportation 153 189 233 286 386 391 1.3% 4.6%
Transportation 36 52 82 96 87 82 -6.1% 3.9%
Corpus Christi
Total Spending 707 822 986 1,121 1,354 1,345 -0.7% 3.1%
Visitor Spending 655 784 936 1,073 1,294 1,289 -0.4% 3.3%
Non-transportation 526 644 742 856 1,089 1,096 0.6% 3.6%
Transportation 129 140 194 217 205 194 -5.4% 2.0%
Ave. Annual Chg.
Direct Metropolitan Travel Spending, 1995-2016p
Visitor transportation spending includes motor fuel, auto rental, other ground transportation costs and
one-way airfares.
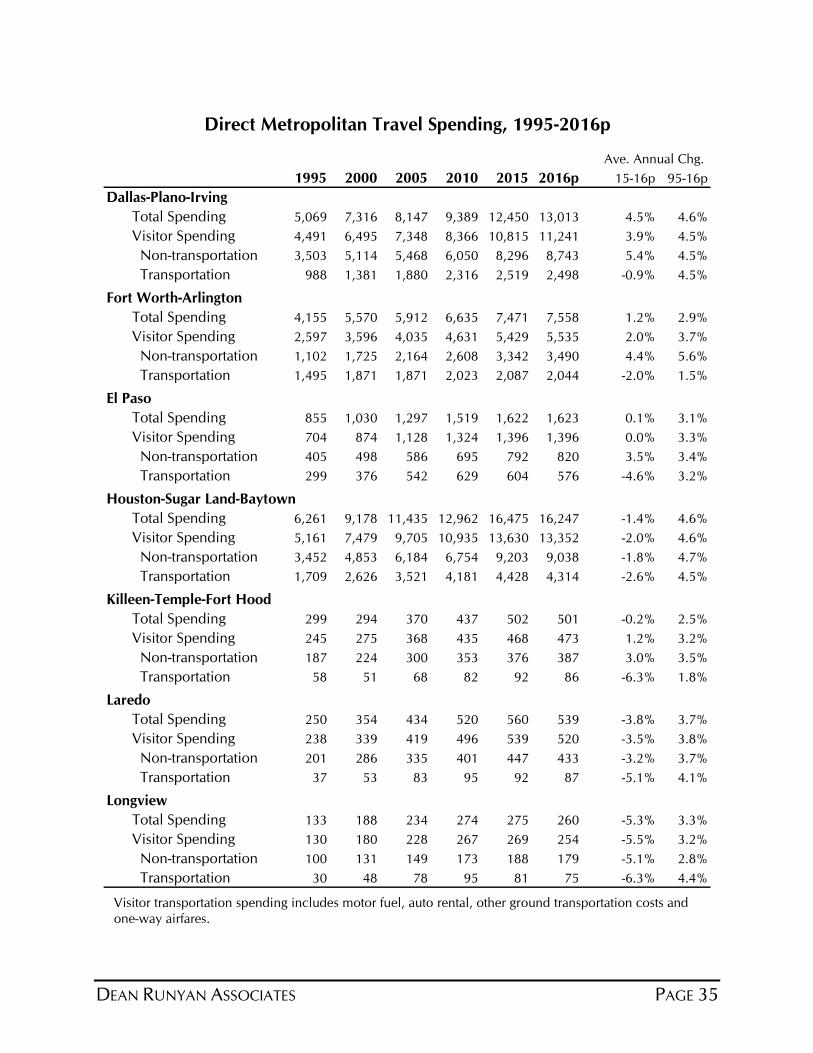
DEAN RUNYAN ASSOCIATES PAGE 35
1995 2000 2005 2010 2015 2016p 15-16p 95-16p
Dallas-Plano-Irving
Total Spending 5,069 7,316 8,147 9,389 12,450 13,013 4.5% 4.6%
Visitor Spending 4,491 6,495 7,348 8,366 10,815 11,241 3.9% 4.5%
Non-transportation 3,503 5,114 5,468 6,050 8,296 8,743 5.4% 4.5%
Transportation 988 1,381 1,880 2,316 2,519 2,498 -0.9% 4.5%
Fort Worth-Arlington
Total Spending 4,155 5,570 5,912 6,635 7,471 7,558 1.2% 2.9%
Visitor Spending 2,597 3,596 4,035 4,631 5,429 5,535 2.0% 3.7%
Non-transportation 1,102 1,725 2,164 2,608 3,342 3,490 4.4% 5.6%
Transportation 1,495 1,871 1,871 2,023 2,087 2,044 -2.0% 1.5%
El Paso
Total Spending 855 1,030 1,297 1,519 1,622 1,623 0.1% 3.1%
Visitor Spending 704 874 1,128 1,324 1,396 1,396 0.0% 3.3%
Non-transportation 405 498 586 695 792 820 3.5% 3.4%
Transportation 299 376 542 629 604 576 -4.6% 3.2%
Houston-Sugar Land-Baytown
Total Spending 6,261 9,178 11,435 12,962 16,475 16,247 -1.4% 4.6%
Visitor Spending 5,161 7,479 9,705 10,935 13,630 13,352 -2.0% 4.6%
Non-transportation 3,452 4,853 6,184 6,754 9,203 9,038 -1.8% 4.7%
Transportation 1,709 2,626 3,521 4,181 4,428 4,314 -2.6% 4.5%
Killeen-Temple-Fort Hood
Total Spending 299 294 370 437 502 501 -0.2% 2.5%
Visitor Spending 245 275 368 435 468 473 1.2% 3.2%
Non-transportation 187 224 300 353 376 387 3.0% 3.5%
Transportation 58 51 68 82 92 86 -6.3% 1.8%
Laredo
Total Spending 250 354 434 520 560 539 -3.8% 3.7%
Visitor Spending 238 339 419 496 539 520 -3.5% 3.8%
Non-transportation 201 286 335 401 447 433 -3.2% 3.7%
Transportation 37 53 83 95 92 87 -5.1% 4.1%
Longview
Total Spending 133 188 234 274 275 260 -5.3% 3.3%
Visitor Spending 130 180 228 267 269 254 -5.5% 3.2%
Non-transportation 100 131 149 173 188 179 -5.1% 2.8%
Transportation 30 48 78 95 81 75 -6.3% 4.4%
Direct Metropolitan Travel Spending, 1995-2016p
Ave. Annual Chg.
Visitor transportation spending includes motor fuel, auto rental, other ground transportation costs and
one-way airfares.
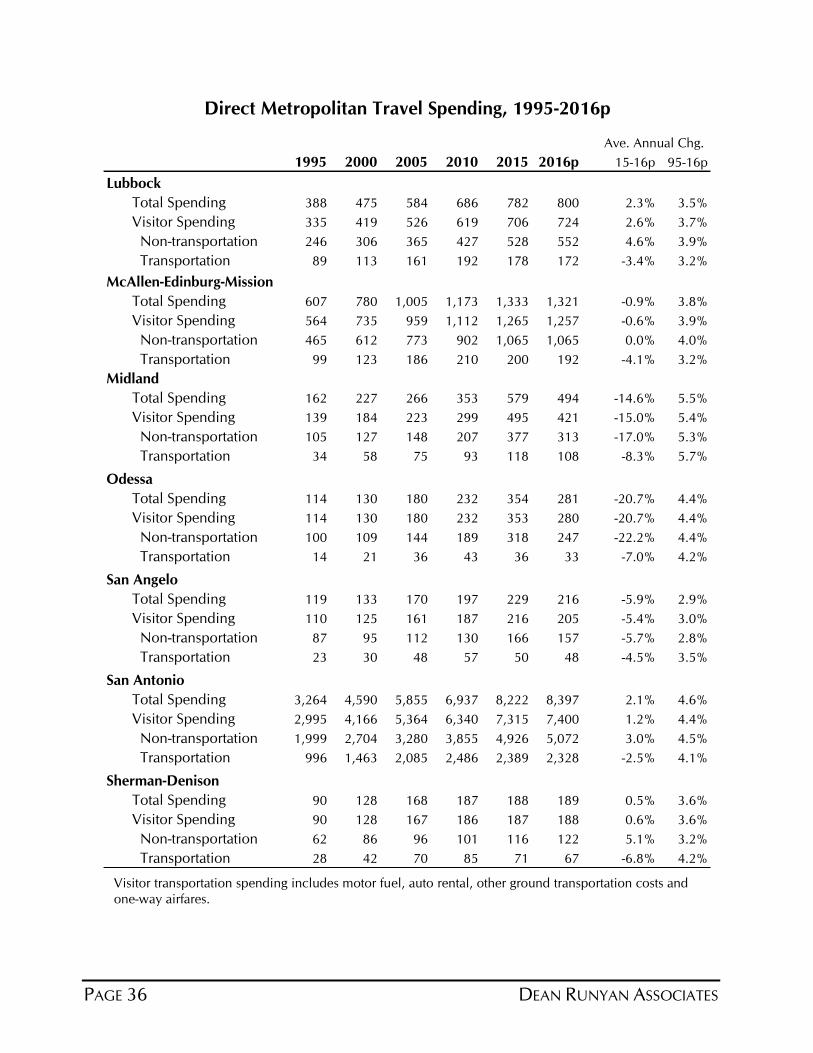
PAGE 36 DEAN RUNYAN ASSOCIATES
1995 2000 2005 2010 2015 2016p 15-16p 95-16p
Lubbock
Total Spending 388 475 584 686 782 800 2.3% 3.5%
Visitor Spending 335 419 526 619 706 724 2.6% 3.7%
Non-transportation 246 306 365 427 528 552 4.6% 3.9%
Transportation 89 113 161 192 178 172 -3.4% 3.2%
McAllen-Edinburg-Mission
Total Spending 607 780 1,005 1,173 1,333 1,321 -0.9% 3.8%
Visitor Spending 564 735 959 1,112 1,265 1,257 -0.6% 3.9%
Non-transportation 465 612 773 902 1,065 1,065 0.0% 4.0%
Transportation 99 123 186 210 200 192 -4.1% 3.2%
Midland
Total Spending 162 227 266 353 579 494 -14.6% 5.5%
Visitor Spending 139 184 223 299 495 421 -15.0% 5.4%
Non-transportation 105 127 148 207 377 313 -17.0% 5.3%
Transportation 34 58 75 93 118 108 -8.3% 5.7%
Odessa
Total Spending 114 130 180 232 354 281 -20.7% 4.4%
Visitor Spending 114 130 180 232 353 280 -20.7% 4.4%
Non-transportation 100 109 144 189 318 247 -22.2% 4.4%
Transportation 14 21 36 43 36 33 -7.0% 4.2%
San Angelo
Total Spending 119 133 170 197 229 216 -5.9% 2.9%
Visitor Spending 110 125 161 187 216 205 -5.4% 3.0%
Non-transportation 87 95 112 130 166 157 -5.7% 2.8%
Transportation 23 30 48 57 50 48 -4.5% 3.5%
San Antonio
Total Spending 3,264 4,590 5,855 6,937 8,222 8,397 2.1% 4.6%
Visitor Spending 2,995 4,166 5,364 6,340 7,315 7,400 1.2% 4.4%
Non-transportation 1,999 2,704 3,280 3,855 4,926 5,072 3.0% 4.5%
Transportation 996 1,463 2,085 2,486 2,389 2,328 -2.5% 4.1%
Sherman-Denison
Total Spending 90 128 168 187 188 189 0.5% 3.6%
Visitor Spending 90 128 167 186 187 188 0.6% 3.6%
Non-transportation 62 86 96 101 116 122 5.1% 3.2%
Transportation 28 42 70 85 71 67 -6.8% 4.2%
Direct Metropolitan Travel Spending, 1995-2016p
Ave. Annual Chg.
Visitor transportation spending includes motor fuel, auto rental, other ground transportation costs and
one-way airfares.
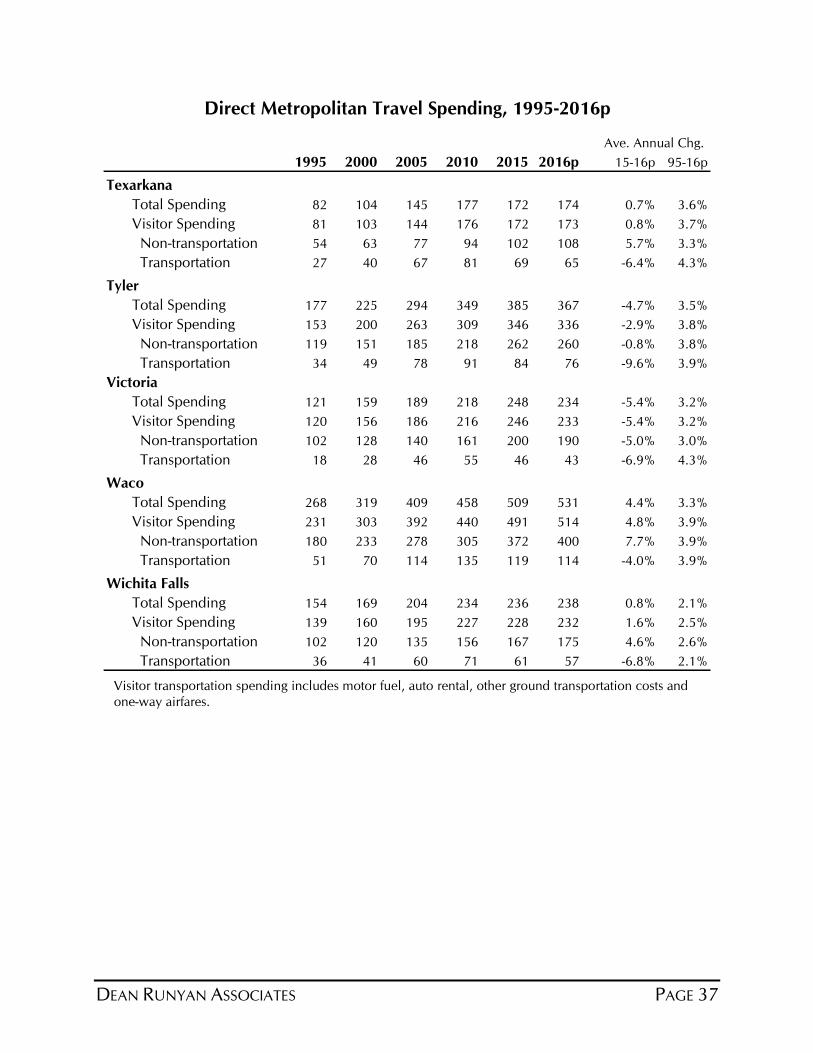
DEAN RUNYAN ASSOCIATES PAGE 37
1995 2000 2005 2010 2015 2016p 15-16p 95-16p
Texarkana
Total Spending 82 104 145 177 172 174 0.7% 3.6%
Visitor Spending 81 103 144 176 172 173 0.8% 3.7%
Non-transportation 54 63 77 94 102 108 5.7% 3.3%
Transportation 27 40 67 81 69 65 -6.4% 4.3%
Tyler
Total Spending 177 225 294 349 385 367 -4.7% 3.5%
Visitor Spending 153 200 263 309 346 336 -2.9% 3.8%
Non-transportation 119 151 185 218 262 260 -0.8% 3.8%
Transportation 34 49 78 91 84 76 -9.6% 3.9%
Victoria
Total Spending 121 159 189 218 248 234 -5.4% 3.2%
Visitor Spending 120 156 186 216 246 233 -5.4% 3.2%
Non-transportation 102 128 140 161 200 190 -5.0% 3.0%
Transportation 18 28 46 55 46 43 -6.9% 4.3%
Waco
Total Spending 268 319 409 458 509 531 4.4% 3.3%
Visitor Spending 231 303 392 440 491 514 4.8% 3.9%
Non-transportation 180 233 278 305 372 400 7.7% 3.9%
Transportation 51 70 114 135 119 114 -4.0% 3.9%
Wichita Falls
Total Spending 154 169 204 234 236 238 0.8% 2.1%
Visitor Spending 139 160 195 227 228 232 1.6% 2.5%
Non-transportation 102 120 135 156 167 175 4.6% 2.6%
Transportation 36 41 60 71 61 57 -6.8% 2.1%
Direct Metropolitan Travel Spending, 1995-2016p
Ave. Annual Chg.
Visitor transportation spending includes motor fuel, auto rental, other ground transportation costs and
one-way airfares.
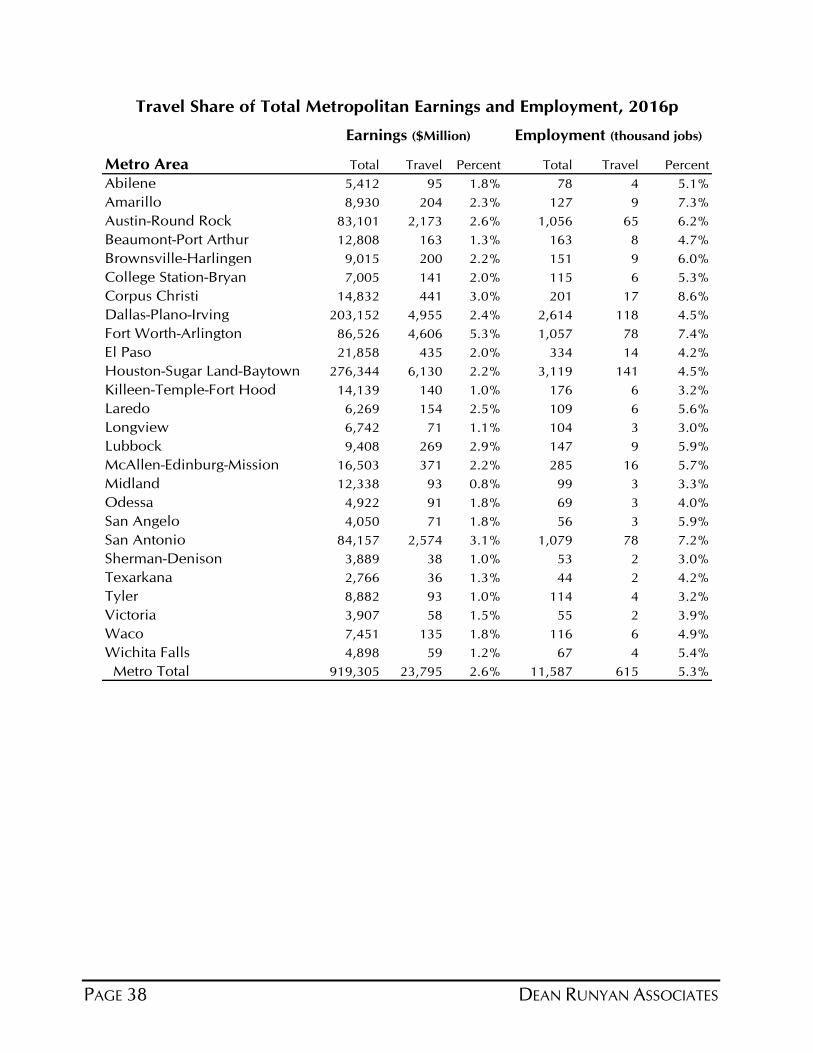
PAGE 38 DEAN RUNYAN ASSOCIATES
Metro Area Total Travel Percent Total Travel Percent
Abilene 5,412 95 1.8% 78 4 5.1%
Amarillo 8,930 204 2.3% 127 9 7.3%
Austin-Round Rock 83,101 2,173 2.6% 1,056 65 6.2%
Beaumont-Port Arthur 12,808 163 1.3% 163 8 4.7%
Brownsville-Harlingen 9,015 200 2.2% 151 9 6.0%
College Station-Bryan 7,005 141 2.0% 115 6 5.3%
Corpus Christi 14,832 441 3.0% 201 17 8.6%
Dallas-Plano-Irving 203,152 4,955 2.4% 2,614 118 4.5%
Fort Worth-Arlington 86,526 4,606 5.3% 1,057 78 7.4%
El Paso 21,858 435 2.0% 334 14 4.2%
Houston-Sugar Land-Baytown 276,344 6,130 2.2% 3,119 141 4.5%
Killeen-Temple-Fort Hood 14,139 140 1.0% 176 6 3.2%
Laredo 6,269 154 2.5% 109 6 5.6%
Longview 6,742 71 1.1% 104 3 3.0%
Lubbock 9,408 269 2.9% 147 9 5.9%
McAllen-Edinburg-Mission 16,503 371 2.2% 285 16 5.7%
Midland 12,338 93 0.8% 99 3 3.3%
Odessa 4,922 91 1.8% 69 3 4.0%
San Angelo 4,050 71 1.8% 56 3 5.9%
San Antonio 84,157 2,574 3.1% 1,079 78 7.2%
Sherman-Denison 3,889 38 1.0% 53 2 3.0%
Texarkana 2,766 36 1.3% 44 2 4.2%
Tyler 8,882 93 1.0% 114 4 3.2%
Victoria 3,907 58 1.5% 55 2 3.9%
Waco 7,451 135 1.8% 116 6 4.9%
Wichita Falls 4,898 59 1.2% 67 4 5.4%
Metro Total 919,305 23,795 2.6% 11,587 615 5.3%
Travel Share of Total Metropolitan Earnings and Employment, 2016p
Earnings ($Million) Employment (thousand jobs)

DEAN RUNYAN ASSOCIATES PAGE 39
2006 2008 2010 2012 2014 2015 2016p
Total Direct Travel Spending ($Million)
Visitor Spending 360.2 412.6 375.2 420.4 443.1 404.5 397.0
Other Travel* 16.9 18.0 16.9 19.4 21.9 20.9 19.1
Total Direct Spending 377.0 430.6 392.1 439.8 465.0 425.5 416.1
Visitor Spending by Type of Traveler Accommodation ($Million)
Hotel, Motel 156.9 188.5 169.9 202.0 222.2 203.9 199.8
Private Campground 5.1 5.9 6.3 7.0 7.2 6.7 6.6
Public Campground 1.0 1.1 1.1 1.3 1.3 1.2 1.2
Private Home 95.9 106.9 97.2 105.9 104.7 95.6 93.8
Vacation Home 2.5 2.8 2.5 2.7 2.8 2.7 2.7
Day Travel 98.7 107.3 98.1 101.5 104.9 94.5 92.9
Visitor Spending 360.2 412.6 375.2 420.4 443.1 404.5 397.0
Visitor Spending by Commodity Purchased ($Million)
Accommodations 38.5 45.2 42.1 49.5 58.0 58.3 56.8
Food Service 53.5 58.9 59.5 65.9 73.5 75.5 77.2
Food Stores 13.4 15.0 14.7 16.4 17.8 18.0 17.8
Local Tran. & Gas 131.2 168.1 137.4 161.1 158.0 118.4 111.0
Arts, Ent. & Rec. 43.3 44.6 42.9 45.0 47.9 47.9 48.5
Retail Sales 70.6 70.0 69.3 72.2 76.1 75.5 75.4
Visitor Air Tran. 9.6 10.7 9.2 10.4 11.7 11.0 10.3
Visitor Spending 360.2 412.6 375.2 420.4 443.1 404.5 397.0
Industry Earnings Generated by Travel Spending ($Million)
Accom. & Food Serv. 37.0 40.8 42.6 47.3 52.8 53.5 54.9
Arts, Ent. & Rec. 13.9 14.4 14.6 15.1 16.7 17.6 18.2
Retail** 13.1 13.2 12.8 14.0 15.6 16.2 16.7
Ground Tran. 1.9 2.1 2.0 2.2 2.4 2.5 2.5
Visitor Air Tran. 0.5 0.5 0.5 0.5 0.6 0.7 0.8
Other Travel* 1.4 1.5 1.7 1.9 2.3 2.4 2.2
Total Direct Earnings 67.8 72.5 74.1 81.1 90.6 93.0 95.3
Industry Employment Generated by Travel Spending (Jobs)
Accom. & Food Serv. 1,920 1,940 1,910 1,980 2,100 2,100 2,080
Arts, Ent. & Rec. 1,150 1,060 1,010 970 1,030 1,060 1,010
Retail** 650 620 580 590 620 630 650
Ground Tran. 60 60 60 60 70 70 70
Visitor Air Tran. 10 10 10 10 10 10 10
Other Travel* 60 40 40 60 70 60 60
Total Direct Employment 3,890 3,770 3,650 3,730 3,930 3,980 3,930
Government Revenue Generated by Travel Spending ($Million)***
Local Tax Receipts 8.5 9.0 9.1 9.9 11.2 11.4 11.5 Visitor 5.1 5.7 5.4 6.2 7.0 7.0 7.0
Business/Employee 3.3 3.3 3.6 3.7 4.2 4.3 4.5
State Tax Receipts 21.7 23.1 22.4 23.3 25.5 25.6 25.8 Visitor 19.4 20.5 20.0 20.5 22.3 22.4 22.6
Business/Employee 2.3 2.6 2.5 2.8 3.2 3.3 3.2
Total Direct Gov't Revenue 30.2 32.1 31.5 33.2 36.7 37.0 37.2
Abilene MSA
Travel Impacts, 2006-2016p
Details may not add to totals due to rounding. *Other Travel includes resident air travel, travel arrangement, and
convention/trade shows. **Retail includes gasoline. ***Visitor tax receipts include all direct sales and excise taxes levied
on visitor spending. Business/employee tax receipts include local property taxes, the state franchise tax, and sales tax
payments attributable to the travel industry generated income of employees.
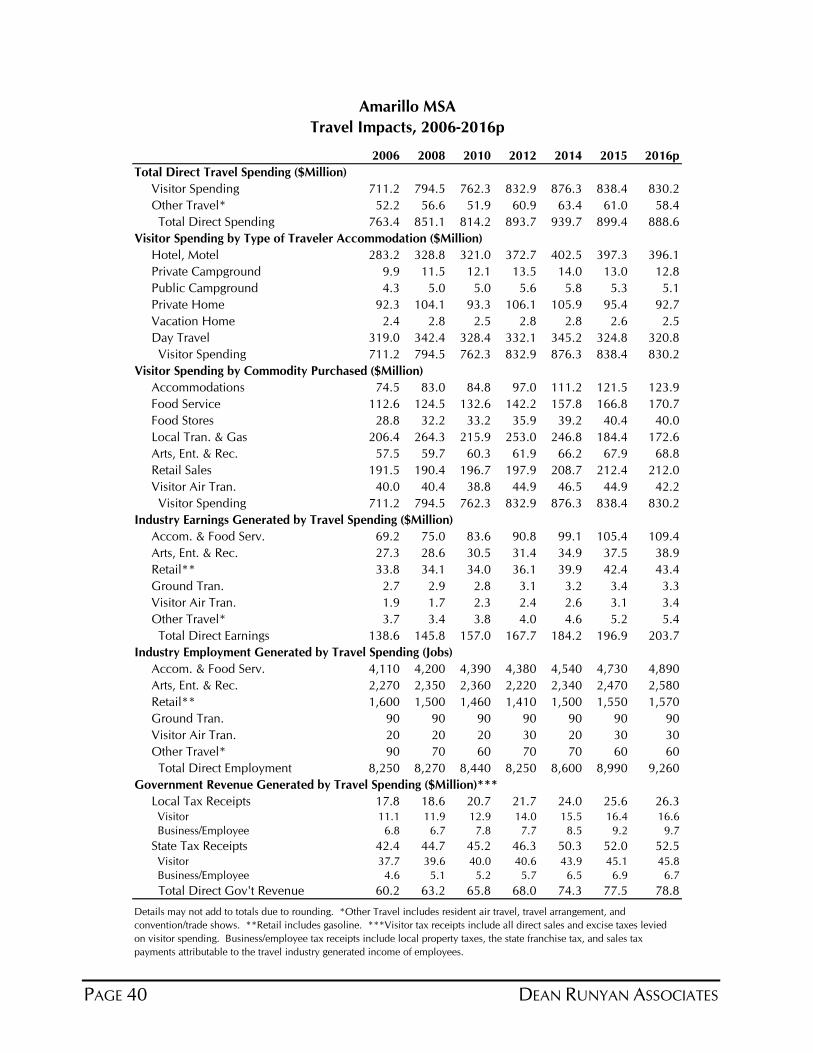
PAGE 40 DEAN RUNYAN ASSOCIATES
2006 2008 2010 2012 2014 2015 2016p
Total Direct Travel Spending ($Million)
Visitor Spending 711.2 794.5 762.3 832.9 876.3 838.4 830.2
Other Travel* 52.2 56.6 51.9 60.9 63.4 61.0 58.4
Total Direct Spending 763.4 851.1 814.2 893.7 939.7 899.4 888.6
Visitor Spending by Type of Traveler Accommodation ($Million)
Hotel, Motel 283.2 328.8 321.0 372.7 402.5 397.3 396.1
Private Campground 9.9 11.5 12.1 13.5 14.0 13.0 12.8
Public Campground 4.3 5.0 5.0 5.6 5.8 5.3 5.1
Private Home 92.3 104.1 93.3 106.1 105.9 95.4 92.7
Vacation Home 2.4 2.8 2.5 2.8 2.8 2.6 2.5
Day Travel 319.0 342.4 328.4 332.1 345.2 324.8 320.8
Visitor Spending 711.2 794.5 762.3 832.9 876.3 838.4 830.2
Visitor Spending by Commodity Purchased ($Million)
Accommodations 74.5 83.0 84.8 97.0 111.2 121.5 123.9
Food Service 112.6 124.5 132.6 142.2 157.8 166.8 170.7
Food Stores 28.8 32.2 33.2 35.9 39.2 40.4 40.0
Local Tran. & Gas 206.4 264.3 215.9 253.0 246.8 184.4 172.6
Arts, Ent. & Rec. 57.5 59.7 60.3 61.9 66.2 67.9 68.8
Retail Sales 191.5 190.4 196.7 197.9 208.7 212.4 212.0
Visitor Air Tran. 40.0 40.4 38.8 44.9 46.5 44.9 42.2
Visitor Spending 711.2 794.5 762.3 832.9 876.3 838.4 830.2
Industry Earnings Generated by Travel Spending ($Million)
Accom. & Food Serv. 69.2 75.0 83.6 90.8 99.1 105.4 109.4
Arts, Ent. & Rec. 27.3 28.6 30.5 31.4 34.9 37.5 38.9
Retail** 33.8 34.1 34.0 36.1 39.9 42.4 43.4
Ground Tran. 2.7 2.9 2.8 3.1 3.2 3.4 3.3
Visitor Air Tran. 1.9 1.7 2.3 2.4 2.6 3.1 3.4
Other Travel* 3.7 3.4 3.8 4.0 4.6 5.2 5.4
Total Direct Earnings 138.6 145.8 157.0 167.7 184.2 196.9 203.7
Industry Employment Generated by Travel Spending (Jobs)
Accom. & Food Serv. 4,110 4,200 4,390 4,380 4,540 4,730 4,890
Arts, Ent. & Rec. 2,270 2,350 2,360 2,220 2,340 2,470 2,580
Retail** 1,600 1,500 1,460 1,410 1,500 1,550 1,570
Ground Tran. 90 90 90 90 90 90 90
Visitor Air Tran. 20 20 20 30 20 30 30
Other Travel* 90 70 60 70 70 60 60
Total Direct Employment 8,250 8,270 8,440 8,250 8,600 8,990 9,260
Government Revenue Generated by Travel Spending ($Million)***
Local Tax Receipts 17.8 18.6 20.7 21.7 24.0 25.6 26.3 Visitor 11.1 11.9 12.9 14.0 15.5 16.4 16.6
Business/Employee 6.8 6.7 7.8 7.7 8.5 9.2 9.7
State Tax Receipts 42.4 44.7 45.2 46.3 50.3 52.0 52.5 Visitor 37.7 39.6 40.0 40.6 43.9 45.1 45.8
Business/Employee 4.6 5.1 5.2 5.7 6.5 6.9 6.7
Total Direct Gov't Revenue 60.2 63.2 65.8 68.0 74.3 77.5 78.8
Amarillo MSA
Travel Impacts, 2006-2016p
Details may not add to totals due to rounding. *Other Travel includes resident air travel, travel arrangement, and
convention/trade shows. **Retail includes gasoline. ***Visitor tax receipts include all direct sales and excise taxes levied
on visitor spending. Business/employee tax receipts include local property taxes, the state franchise tax, and sales tax
payments attributable to the travel industry generated income of employees.
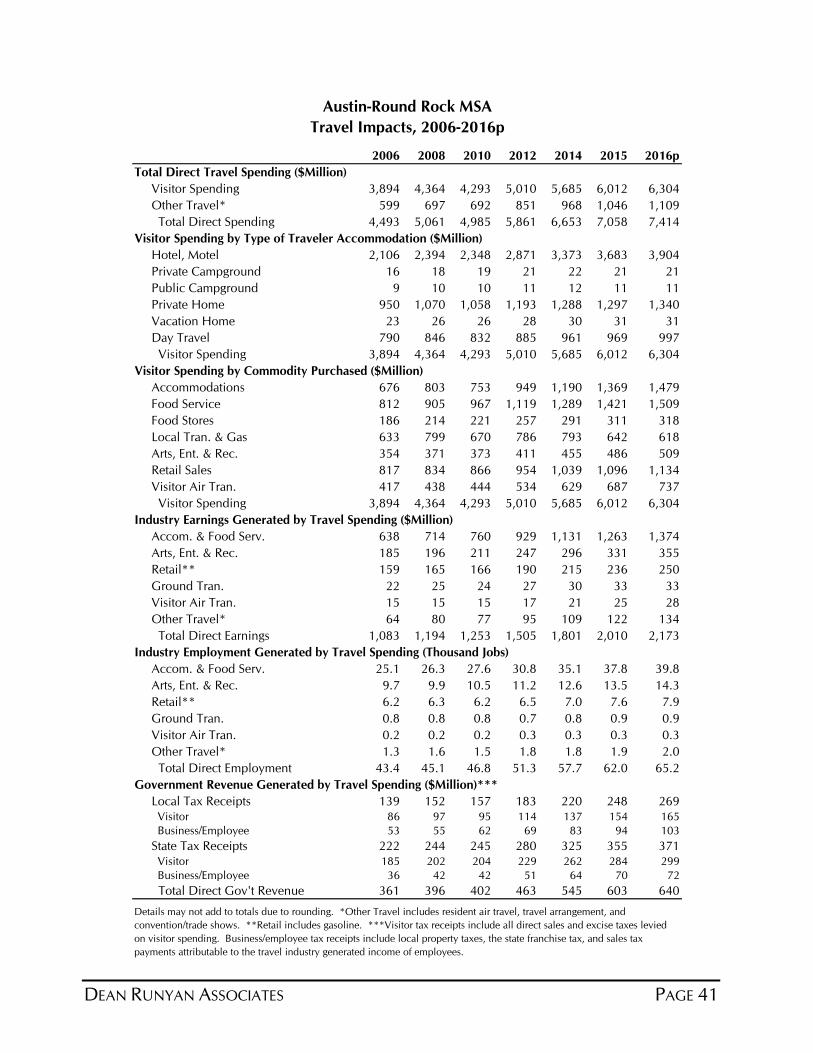
DEAN RUNYAN ASSOCIATES PAGE 41
2006 2008 2010 2012 2014 2015 2016p
Total Direct Travel Spending ($Million)
Visitor Spending 3,894 4,364 4,293 5,010 5,685 6,012 6,304
Other Travel* 599 697 692 851 968 1,046 1,109
Total Direct Spending 4,493 5,061 4,985 5,861 6,653 7,058 7,414
Visitor Spending by Type of Traveler Accommodation ($Million)
Hotel, Motel 2,106 2,394 2,348 2,871 3,373 3,683 3,904
Private Campground 16 18 19 21 22 21 21
Public Campground 9 10 10 11 12 11 11
Private Home 950 1,070 1,058 1,193 1,288 1,297 1,340
Vacation Home 23 26 26 28 30 31 31
Day Travel 790 846 832 885 961 969 997
Visitor Spending 3,894 4,364 4,293 5,010 5,685 6,012 6,304
Visitor Spending by Commodity Purchased ($Million)
Accommodations 676 803 753 949 1,190 1,369 1,479
Food Service 812 905 967 1,119 1,289 1,421 1,509
Food Stores 186 214 221 257 291 311 318
Local Tran. & Gas 633 799 670 786 793 642 618
Arts, Ent. & Rec. 354 371 373 411 455 486 509
Retail Sales 817 834 866 954 1,039 1,096 1,134
Visitor Air Tran. 417 438 444 534 629 687 737
Visitor Spending 3,894 4,364 4,293 5,010 5,685 6,012 6,304
Industry Earnings Generated by Travel Spending ($Million)
Accom. & Food Serv. 638 714 760 929 1,131 1,263 1,374
Arts, Ent. & Rec. 185 196 211 247 296 331 355
Retail** 159 165 166 190 215 236 250
Ground Tran. 22 25 24 27 30 33 33
Visitor Air Tran. 15 15 15 17 21 25 28
Other Travel* 64 80 77 95 109 122 134
Total Direct Earnings 1,083 1,194 1,253 1,505 1,801 2,010 2,173
Industry Employment Generated by Travel Spending (Thousand Jobs)
Accom. & Food Serv. 25.1 26.3 27.6 30.8 35.1 37.8 39.8
Arts, Ent. & Rec. 9.7 9.9 10.5 11.2 12.6 13.5 14.3
Retail** 6.2 6.3 6.2 6.5 7.0 7.6 7.9
Ground Tran. 0.8 0.8 0.8 0.7 0.8 0.9 0.9
Visitor Air Tran. 0.2 0.2 0.2 0.3 0.3 0.3 0.3
Other Travel* 1.3 1.6 1.5 1.8 1.8 1.9 2.0
Total Direct Employment 43.4 45.1 46.8 51.3 57.7 62.0 65.2
Government Revenue Generated by Travel Spending ($Million)***
Local Tax Receipts 139 152 157 183 220 248 269 Visitor 86 97 95 114 137 154 165
Business/Employee 53 55 62 69 83 94 103
State Tax Receipts 222 244 245 280 325 355 371 Visitor 185 202 204 229 262 284 299
Business/Employee 36 42 42 51 64 70 72
Total Direct Gov't Revenue 361 396 402 463 545 603 640
Austin-Round Rock MSA
Travel Impacts, 2006-2016p
Details may not add to totals due to rounding. *Other Travel includes resident air travel, travel arrangement, and
convention/trade shows. **Retail includes gasoline. ***Visitor tax receipts include all direct sales and excise taxes levied
on visitor spending. Business/employee tax receipts include local property taxes, the state franchise tax, and sales tax
payments attributable to the travel industry generated income of employees.
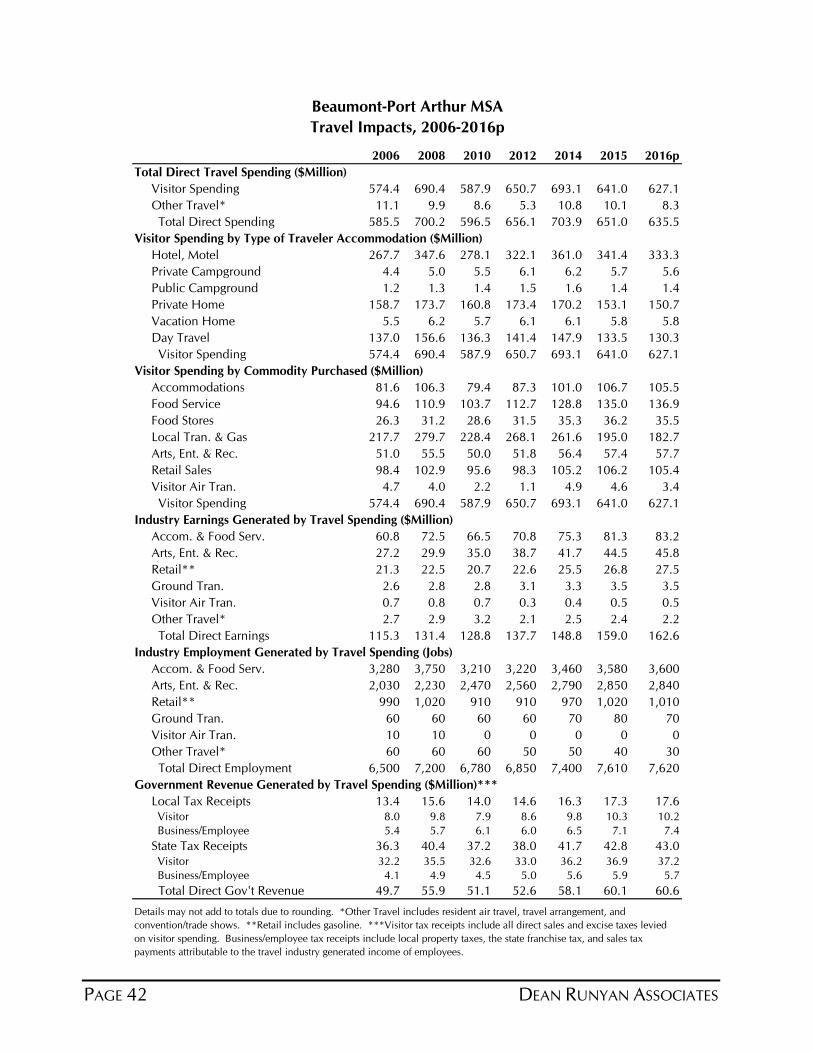
PAGE 42 DEAN RUNYAN ASSOCIATES
2006 2008 2010 2012 2014 2015 2016p
Total Direct Travel Spending ($Million)
Visitor Spending 574.4 690.4 587.9 650.7 693.1 641.0 627.1
Other Travel* 11.1 9.9 8.6 5.3 10.8 10.1 8.3
Total Direct Spending 585.5 700.2 596.5 656.1 703.9 651.0 635.5
Visitor Spending by Type of Traveler Accommodation ($Million)
Hotel, Motel 267.7 347.6 278.1 322.1 361.0 341.4 333.3
Private Campground 4.4 5.0 5.5 6.1 6.2 5.7 5.6
Public Campground 1.2 1.3 1.4 1.5 1.6 1.4 1.4
Private Home 158.7 173.7 160.8 173.4 170.2 153.1 150.7
Vacation Home 5.5 6.2 5.7 6.1 6.1 5.8 5.8
Day Travel 137.0 156.6 136.3 141.4 147.9 133.5 130.3
Visitor Spending 574.4 690.4 587.9 650.7 693.1 641.0 627.1
Visitor Spending by Commodity Purchased ($Million)
Accommodations 81.6 106.3 79.4 87.3 101.0 106.7 105.5
Food Service 94.6 110.9 103.7 112.7 128.8 135.0 136.9
Food Stores 26.3 31.2 28.6 31.5 35.3 36.2 35.5
Local Tran. & Gas 217.7 279.7 228.4 268.1 261.6 195.0 182.7
Arts, Ent. & Rec. 51.0 55.5 50.0 51.8 56.4 57.4 57.7
Retail Sales 98.4 102.9 95.6 98.3 105.2 106.2 105.4
Visitor Air Tran. 4.7 4.0 2.2 1.1 4.9 4.6 3.4
Visitor Spending 574.4 690.4 587.9 650.7 693.1 641.0 627.1
Industry Earnings Generated by Travel Spending ($Million)
Accom. & Food Serv. 60.8 72.5 66.5 70.8 75.3 81.3 83.2
Arts, Ent. & Rec. 27.2 29.9 35.0 38.7 41.7 44.5 45.8
Retail** 21.3 22.5 20.7 22.6 25.5 26.8 27.5
Ground Tran. 2.6 2.8 2.8 3.1 3.3 3.5 3.5
Visitor Air Tran. 0.7 0.8 0.7 0.3 0.4 0.5 0.5
Other Travel* 2.7 2.9 3.2 2.1 2.5 2.4 2.2
Total Direct Earnings 115.3 131.4 128.8 137.7 148.8 159.0 162.6
Industry Employment Generated by Travel Spending (Jobs)
Accom. & Food Serv. 3,280 3,750 3,210 3,220 3,460 3,580 3,600
Arts, Ent. & Rec. 2,030 2,230 2,470 2,560 2,790 2,850 2,840
Retail** 990 1,020 910 910 970 1,020 1,010
Ground Tran. 60 60 60 60 70 80 70
Visitor Air Tran. 10 10 0 0 0 0 0
Other Travel* 60 60 60 50 50 40 30
Total Direct Employment 6,500 7,200 6,780 6,850 7,400 7,610 7,620
Government Revenue Generated by Travel Spending ($Million)***
Local Tax Receipts 13.4 15.6 14.0 14.6 16.3 17.3 17.6 Visitor 8.0 9.8 7.9 8.6 9.8 10.3 10.2
Business/Employee 5.4 5.7 6.1 6.0 6.5 7.1 7.4
State Tax Receipts 36.3 40.4 37.2 38.0 41.7 42.8 43.0 Visitor 32.2 35.5 32.6 33.0 36.2 36.9 37.2
Business/Employee 4.1 4.9 4.5 5.0 5.6 5.9 5.7
Total Direct Gov't Revenue 49.7 55.9 51.1 52.6 58.1 60.1 60.6
Beaumont-Port Arthur MSA
Travel Impacts, 2006-2016p
Details may not add to totals due to rounding. *Other Travel includes resident air travel, travel arrangement, and
convention/trade shows. **Retail includes gasoline. ***Visitor tax receipts include all direct sales and excise taxes levied
on visitor spending. Business/employee tax receipts include local property taxes, the state franchise tax, and sales tax
payments attributable to the travel industry generated income of employees.
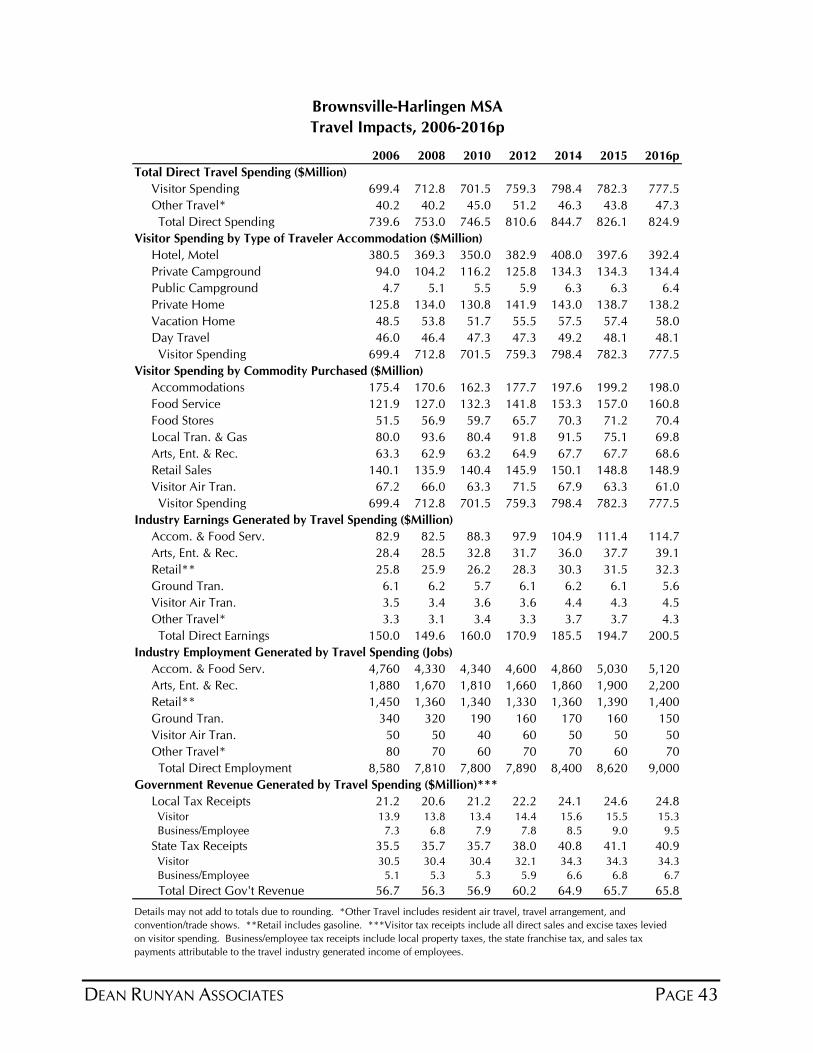
DEAN RUNYAN ASSOCIATES PAGE 43
2006 2008 2010 2012 2014 2015 2016p
Total Direct Travel Spending ($Million)
Visitor Spending 699.4 712.8 701.5 759.3 798.4 782.3 777.5
Other Travel* 40.2 40.2 45.0 51.2 46.3 43.8 47.3
Total Direct Spending 739.6 753.0 746.5 810.6 844.7 826.1 824.9
Visitor Spending by Type of Traveler Accommodation ($Million)
Hotel, Motel 380.5 369.3 350.0 382.9 408.0 397.6 392.4
Private Campground 94.0 104.2 116.2 125.8 134.3 134.3 134.4
Public Campground 4.7 5.1 5.5 5.9 6.3 6.3 6.4
Private Home 125.8 134.0 130.8 141.9 143.0 138.7 138.2
Vacation Home 48.5 53.8 51.7 55.5 57.5 57.4 58.0
Day Travel 46.0 46.4 47.3 47.3 49.2 48.1 48.1
Visitor Spending 699.4 712.8 701.5 759.3 798.4 782.3 777.5
Visitor Spending by Commodity Purchased ($Million)
Accommodations 175.4 170.6 162.3 177.7 197.6 199.2 198.0
Food Service 121.9 127.0 132.3 141.8 153.3 157.0 160.8
Food Stores 51.5 56.9 59.7 65.7 70.3 71.2 70.4
Local Tran. & Gas 80.0 93.6 80.4 91.8 91.5 75.1 69.8
Arts, Ent. & Rec. 63.3 62.9 63.2 64.9 67.7 67.7 68.6
Retail Sales 140.1 135.9 140.4 145.9 150.1 148.8 148.9
Visitor Air Tran. 67.2 66.0 63.3 71.5 67.9 63.3 61.0
Visitor Spending 699.4 712.8 701.5 759.3 798.4 782.3 777.5
Industry Earnings Generated by Travel Spending ($Million)
Accom. & Food Serv. 82.9 82.5 88.3 97.9 104.9 111.4 114.7
Arts, Ent. & Rec. 28.4 28.5 32.8 31.7 36.0 37.7 39.1
Retail** 25.8 25.9 26.2 28.3 30.3 31.5 32.3
Ground Tran. 6.1 6.2 5.7 6.1 6.2 6.1 5.6
Visitor Air Tran. 3.5 3.4 3.6 3.6 4.4 4.3 4.5
Other Travel* 3.3 3.1 3.4 3.3 3.7 3.7 4.3
Total Direct Earnings 150.0 149.6 160.0 170.9 185.5 194.7 200.5
Industry Employment Generated by Travel Spending (Jobs)
Accom. & Food Serv. 4,760 4,330 4,340 4,600 4,860 5,030 5,120
Arts, Ent. & Rec. 1,880 1,670 1,810 1,660 1,860 1,900 2,200
Retail** 1,450 1,360 1,340 1,330 1,360 1,390 1,400
Ground Tran. 340 320 190 160 170 160 150
Visitor Air Tran. 50 50 40 60 50 50 50
Other Travel* 80 70 60 70 70 60 70
Total Direct Employment 8,580 7,810 7,800 7,890 8,400 8,620 9,000
Government Revenue Generated by Travel Spending ($Million)***
Local Tax Receipts 21.2 20.6 21.2 22.2 24.1 24.6 24.8 Visitor 13.9 13.8 13.4 14.4 15.6 15.5 15.3
Business/Employee 7.3 6.8 7.9 7.8 8.5 9.0 9.5
State Tax Receipts 35.5 35.7 35.7 38.0 40.8 41.1 40.9 Visitor 30.5 30.4 30.4 32.1 34.3 34.3 34.3
Business/Employee 5.1 5.3 5.3 5.9 6.6 6.8 6.7
Total Direct Gov't Revenue 56.7 56.3 56.9 60.2 64.9 65.7 65.8
Brownsville-Harlingen MSA
Travel Impacts, 2006-2016p
Details may not add to totals due to rounding. *Other Travel includes resident air travel, travel arrangement, and
convention/trade shows. **Retail includes gasoline. ***Visitor tax receipts include all direct sales and excise taxes levied
on visitor spending. Business/employee tax receipts include local property taxes, the state franchise tax, and sales tax
payments attributable to the travel industry generated income of employees.
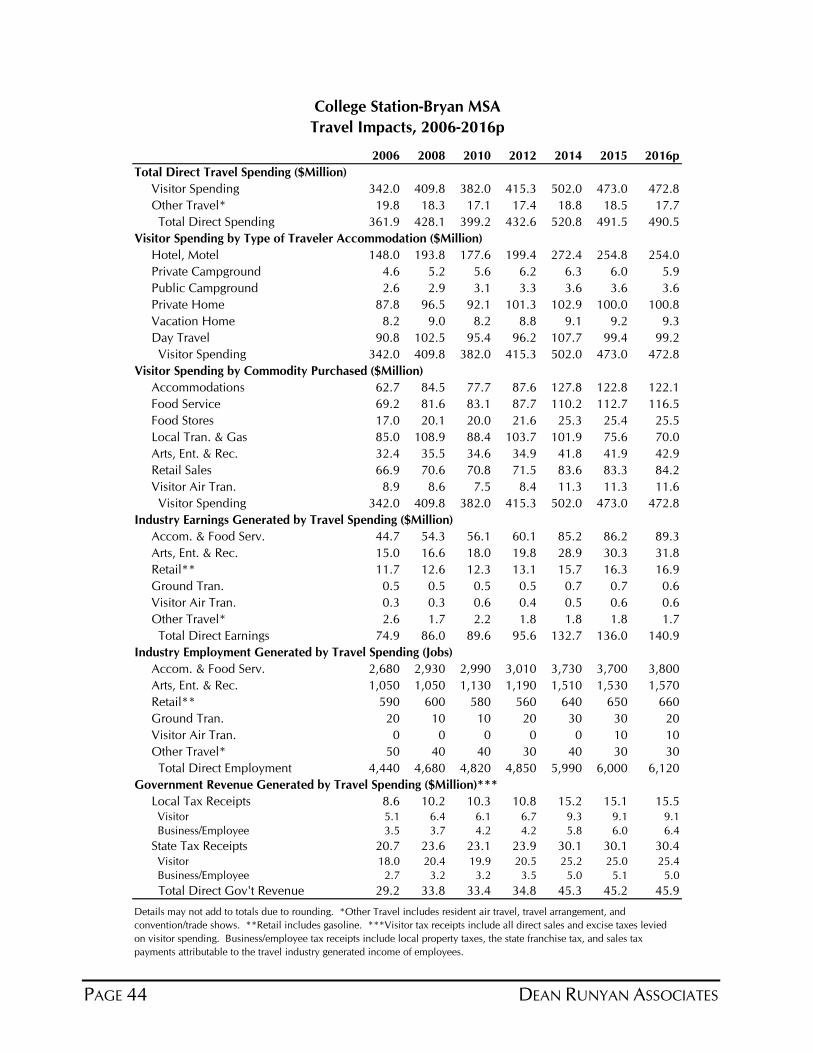
PAGE 44 DEAN RUNYAN ASSOCIATES
2006 2008 2010 2012 2014 2015 2016p
Total Direct Travel Spending ($Million)
Visitor Spending 342.0 409.8 382.0 415.3 502.0 473.0 472.8
Other Travel* 19.8 18.3 17.1 17.4 18.8 18.5 17.7
Total Direct Spending 361.9 428.1 399.2 432.6 520.8 491.5 490.5
Visitor Spending by Type of Traveler Accommodation ($Million)
Hotel, Motel 148.0 193.8 177.6 199.4 272.4 254.8 254.0
Private Campground 4.6 5.2 5.6 6.2 6.3 6.0 5.9
Public Campground 2.6 2.9 3.1 3.3 3.6 3.6 3.6
Private Home 87.8 96.5 92.1 101.3 102.9 100.0 100.8
Vacation Home 8.2 9.0 8.2 8.8 9.1 9.2 9.3
Day Travel 90.8 102.5 95.4 96.2 107.7 99.4 99.2
Visitor Spending 342.0 409.8 382.0 415.3 502.0 473.0 472.8
Visitor Spending by Commodity Purchased ($Million)
Accommodations 62.7 84.5 77.7 87.6 127.8 122.8 122.1
Food Service 69.2 81.6 83.1 87.7 110.2 112.7 116.5
Food Stores 17.0 20.1 20.0 21.6 25.3 25.4 25.5
Local Tran. & Gas 85.0 108.9 88.4 103.7 101.9 75.6 70.0
Arts, Ent. & Rec. 32.4 35.5 34.6 34.9 41.8 41.9 42.9
Retail Sales 66.9 70.6 70.8 71.5 83.6 83.3 84.2
Visitor Air Tran. 8.9 8.6 7.5 8.4 11.3 11.3 11.6
Visitor Spending 342.0 409.8 382.0 415.3 502.0 473.0 472.8
Industry Earnings Generated by Travel Spending ($Million)
Accom. & Food Serv. 44.7 54.3 56.1 60.1 85.2 86.2 89.3
Arts, Ent. & Rec. 15.0 16.6 18.0 19.8 28.9 30.3 31.8
Retail** 11.7 12.6 12.3 13.1 15.7 16.3 16.9
Ground Tran. 0.5 0.5 0.5 0.5 0.7 0.7 0.6
Visitor Air Tran. 0.3 0.3 0.6 0.4 0.5 0.6 0.6
Other Travel* 2.6 1.7 2.2 1.8 1.8 1.8 1.7
Total Direct Earnings 74.9 86.0 89.6 95.6 132.7 136.0 140.9
Industry Employment Generated by Travel Spending (Jobs)
Accom. & Food Serv. 2,680 2,930 2,990 3,010 3,730 3,700 3,800
Arts, Ent. & Rec. 1,050 1,050 1,130 1,190 1,510 1,530 1,570
Retail** 590 600 580 560 640 650 660
Ground Tran. 20 10 10 20 30 30 20
Visitor Air Tran. 0 0 0 0 0 10 10
Other Travel* 50 40 40 30 40 30 30
Total Direct Employment 4,440 4,680 4,820 4,850 5,990 6,000 6,120
Government Revenue Generated by Travel Spending ($Million)***
Local Tax Receipts 8.6 10.2 10.3 10.8 15.2 15.1 15.5 Visitor 5.1 6.4 6.1 6.7 9.3 9.1 9.1
Business/Employee 3.5 3.7 4.2 4.2 5.8 6.0 6.4
State Tax Receipts 20.7 23.6 23.1 23.9 30.1 30.1 30.4 Visitor 18.0 20.4 19.9 20.5 25.2 25.0 25.4
Business/Employee 2.7 3.2 3.2 3.5 5.0 5.1 5.0
Total Direct Gov't Revenue 29.2 33.8 33.4 34.8 45.3 45.2 45.9
College Station-Bryan MSA
Travel Impacts, 2006-2016p
Details may not add to totals due to rounding. *Other Travel includes resident air travel, travel arrangement, and
convention/trade shows. **Retail includes gasoline. ***Visitor tax receipts include all direct sales and excise taxes levied
on visitor spending. Business/employee tax receipts include local property taxes, the state franchise tax, and sales tax
payments attributable to the travel industry generated income of employees.
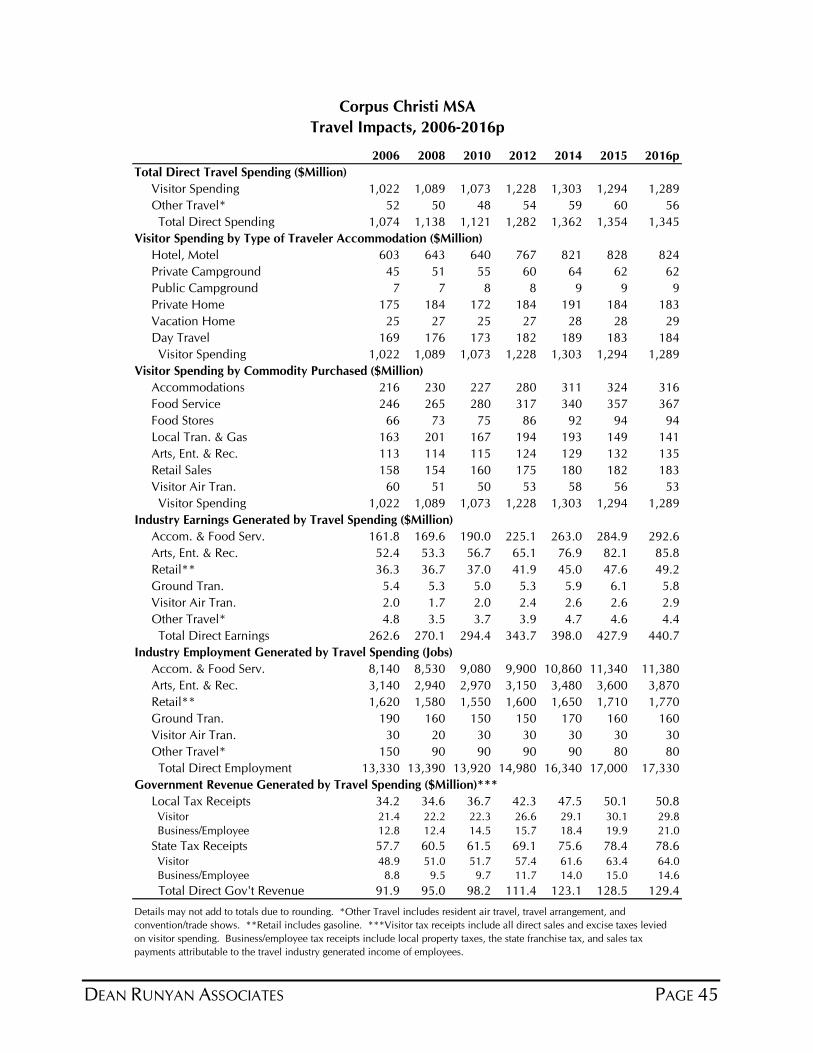
DEAN RUNYAN ASSOCIATES PAGE 45
2006 2008 2010 2012 2014 2015 2016p
Total Direct Travel Spending ($Million)
Visitor Spending 1,022 1,089 1,073 1,228 1,303 1,294 1,289
Other Travel* 52 50 48 54 59 60 56
Total Direct Spending 1,074 1,138 1,121 1,282 1,362 1,354 1,345
Visitor Spending by Type of Traveler Accommodation ($Million)
Hotel, Motel 603 643 640 767 821 828 824
Private Campground 45 51 55 60 64 62 62
Public Campground 7 7 8 8 9 9 9
Private Home 175 184 172 184 191 184 183
Vacation Home 25 27 25 27 28 28 29
Day Travel 169 176 173 182 189 183 184
Visitor Spending 1,022 1,089 1,073 1,228 1,303 1,294 1,289
Visitor Spending by Commodity Purchased ($Million)
Accommodations 216 230 227 280 311 324 316
Food Service 246 265 280 317 340 357 367
Food Stores 66 73 75 86 92 94 94
Local Tran. & Gas 163 201 167 194 193 149 141
Arts, Ent. & Rec. 113 114 115 124 129 132 135
Retail Sales 158 154 160 175 180 182 183
Visitor Air Tran. 60 51 50 53 58 56 53
Visitor Spending 1,022 1,089 1,073 1,228 1,303 1,294 1,289
Industry Earnings Generated by Travel Spending ($Million)
Accom. & Food Serv. 161.8 169.6 190.0 225.1 263.0 284.9 292.6
Arts, Ent. & Rec. 52.4 53.3 56.7 65.1 76.9 82.1 85.8
Retail** 36.3 36.7 37.0 41.9 45.0 47.6 49.2
Ground Tran. 5.4 5.3 5.0 5.3 5.9 6.1 5.8
Visitor Air Tran. 2.0 1.7 2.0 2.4 2.6 2.6 2.9
Other Travel* 4.8 3.5 3.7 3.9 4.7 4.6 4.4
Total Direct Earnings 262.6 270.1 294.4 343.7 398.0 427.9 440.7
Industry Employment Generated by Travel Spending (Jobs)
Accom. & Food Serv. 8,140 8,530 9,080 9,900 10,860 11,340 11,380
Arts, Ent. & Rec. 3,140 2,940 2,970 3,150 3,480 3,600 3,870
Retail** 1,620 1,580 1,550 1,600 1,650 1,710 1,770
Ground Tran. 190 160 150 150 170 160 160
Visitor Air Tran. 30 20 30 30 30 30 30
Other Travel* 150 90 90 90 90 80 80
Total Direct Employment 13,330 13,390 13,920 14,980 16,340 17,000 17,330
Government Revenue Generated by Travel Spending ($Million)***
Local Tax Receipts 34.2 34.6 36.7 42.3 47.5 50.1 50.8 Visitor 21.4 22.2 22.3 26.6 29.1 30.1 29.8
Business/Employee 12.8 12.4 14.5 15.7 18.4 19.9 21.0
State Tax Receipts 57.7 60.5 61.5 69.1 75.6 78.4 78.6 Visitor 48.9 51.0 51.7 57.4 61.6 63.4 64.0
Business/Employee 8.8 9.5 9.7 11.7 14.0 15.0 14.6
Total Direct Gov't Revenue 91.9 95.0 98.2 111.4 123.1 128.5 129.4
Details may not add to totals due to rounding. *Other Travel includes resident air travel, travel arrangement, and
convention/trade shows. **Retail includes gasoline. ***Visitor tax receipts include all direct sales and excise taxes levied
on visitor spending. Business/employee tax receipts include local property taxes, the state franchise tax, and sales tax
payments attributable to the travel industry generated income of employees.
Corpus Christi MSA
Travel Impacts, 2006-2016p
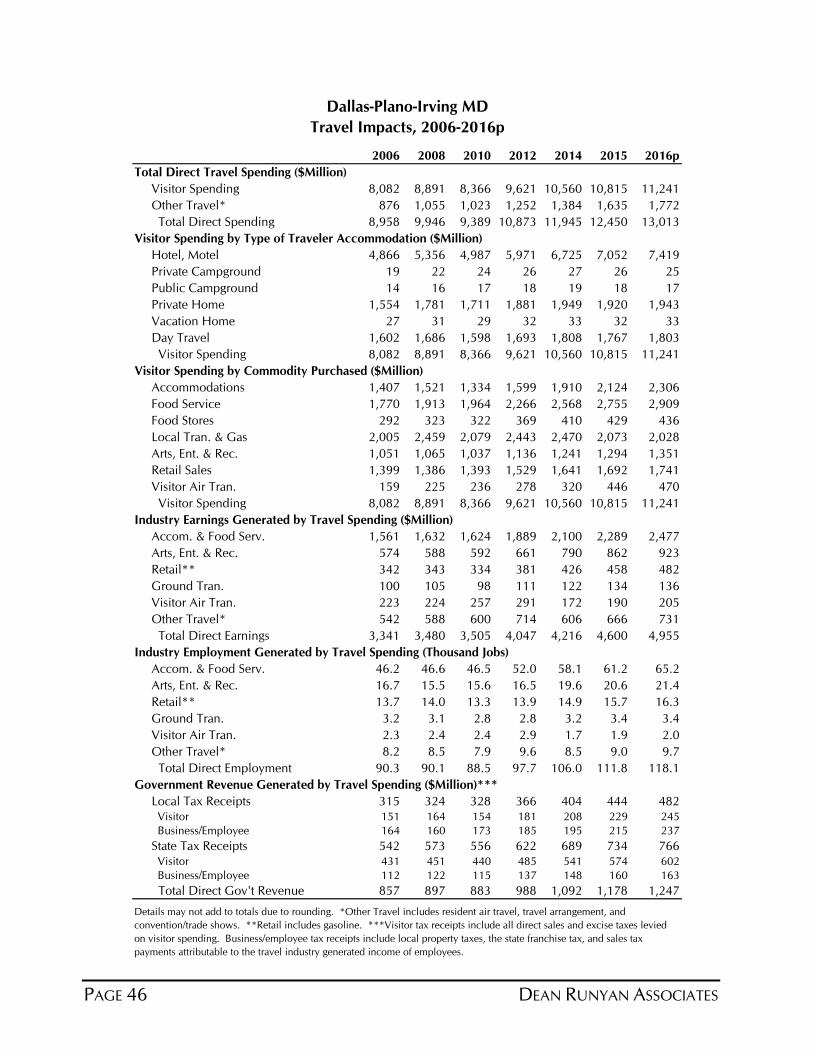
PAGE 46 DEAN RUNYAN ASSOCIATES
2006 2008 2010 2012 2014 2015 2016p
Total Direct Travel Spending ($Million)
Visitor Spending 8,082 8,891 8,366 9,621 10,560 10,815 11,241
Other Travel* 876 1,055 1,023 1,252 1,384 1,635 1,772
Total Direct Spending 8,958 9,946 9,389 10,873 11,945 12,450 13,013
Visitor Spending by Type of Traveler Accommodation ($Million)
Hotel, Motel 4,866 5,356 4,987 5,971 6,725 7,052 7,419
Private Campground 19 22 24 26 27 26 25
Public Campground 14 16 17 18 19 18 17
Private Home 1,554 1,781 1,711 1,881 1,949 1,920 1,943
Vacation Home 27 31 29 32 33 32 33
Day Travel 1,602 1,686 1,598 1,693 1,808 1,767 1,803
Visitor Spending 8,082 8,891 8,366 9,621 10,560 10,815 11,241
Visitor Spending by Commodity Purchased ($Million)
Accommodations 1,407 1,521 1,334 1,599 1,910 2,124 2,306
Food Service 1,770 1,913 1,964 2,266 2,568 2,755 2,909
Food Stores 292 323 322 369 410 429 436
Local Tran. & Gas 2,005 2,459 2,079 2,443 2,470 2,073 2,028
Arts, Ent. & Rec. 1,051 1,065 1,037 1,136 1,241 1,294 1,351
Retail Sales 1,399 1,386 1,393 1,529 1,641 1,692 1,741
Visitor Air Tran. 159 225 236 278 320 446 470
Visitor Spending 8,082 8,891 8,366 9,621 10,560 10,815 11,241
Industry Earnings Generated by Travel Spending ($Million)
Accom. & Food Serv. 1,561 1,632 1,624 1,889 2,100 2,289 2,477
Arts, Ent. & Rec. 574 588 592 661 790 862 923
Retail** 342 343 334 381 426 458 482
Ground Tran. 100 105 98 111 122 134 136
Visitor Air Tran. 223 224 257 291 172 190 205
Other Travel* 542 588 600 714 606 666 731
Total Direct Earnings 3,341 3,480 3,505 4,047 4,216 4,600 4,955
Industry Employment Generated by Travel Spending (Thousand Jobs)
Accom. & Food Serv. 46.2 46.6 46.5 52.0 58.1 61.2 65.2
Arts, Ent. & Rec. 16.7 15.5 15.6 16.5 19.6 20.6 21.4
Retail** 13.7 14.0 13.3 13.9 14.9 15.7 16.3
Ground Tran. 3.2 3.1 2.8 2.8 3.2 3.4 3.4
Visitor Air Tran. 2.3 2.4 2.4 2.9 1.7 1.9 2.0
Other Travel* 8.2 8.5 7.9 9.6 8.5 9.0 9.7
Total Direct Employment 90.3 90.1 88.5 97.7 106.0 111.8 118.1
Government Revenue Generated by Travel Spending ($Million)***
Local Tax Receipts 315 324 328 366 404 444 482 Visitor 151 164 154 181 208 229 245
Business/Employee 164 160 173 185 195 215 237
State Tax Receipts 542 573 556 622 689 734 766 Visitor 431 451 440 485 541 574 602
Business/Employee 112 122 115 137 148 160 163
Total Direct Gov't Revenue 857 897 883 988 1,092 1,178 1,247
Dallas-Plano-Irving MD
Travel Impacts, 2006-2016p
Details may not add to totals due to rounding. *Other Travel includes resident air travel, travel arrangement, and
convention/trade shows. **Retail includes gasoline. ***Visitor tax receipts include all direct sales and excise taxes levied
on visitor spending. Business/employee tax receipts include local property taxes, the state franchise tax, and sales tax
payments attributable to the travel industry generated income of employees.
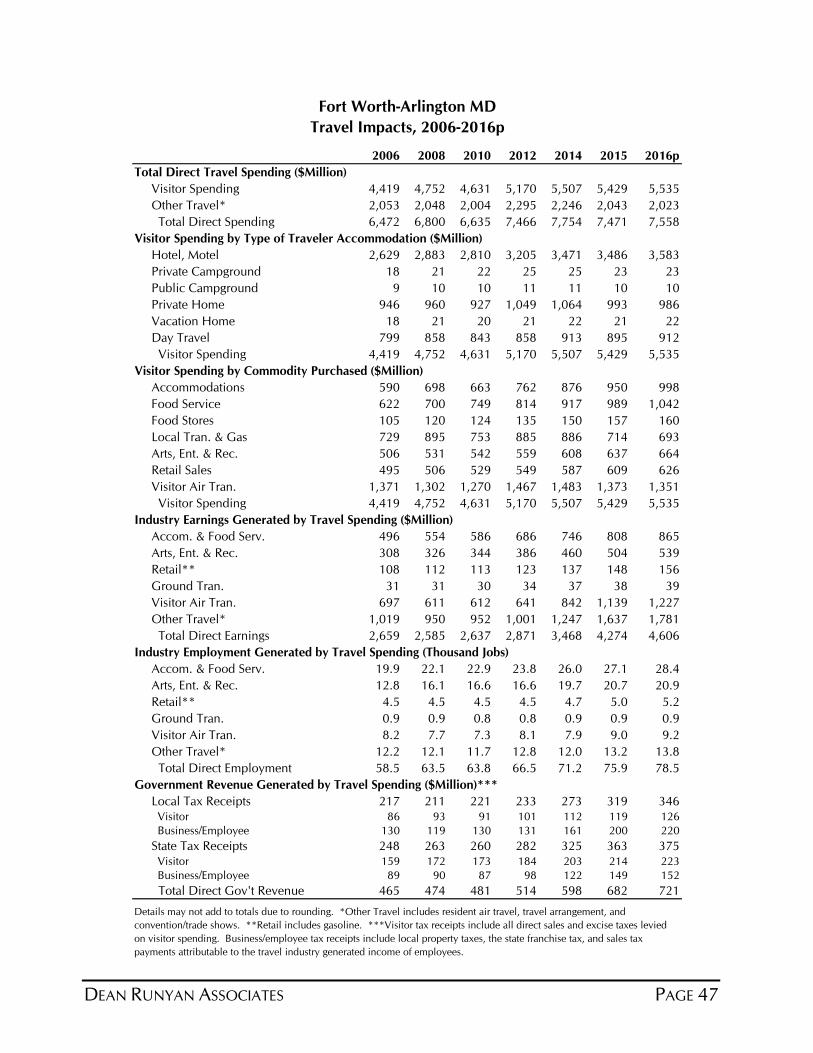
DEAN RUNYAN ASSOCIATES PAGE 47
2006 2008 2010 2012 2014 2015 2016p
Total Direct Travel Spending ($Million)
Visitor Spending 4,419 4,752 4,631 5,170 5,507 5,429 5,535
Other Travel* 2,053 2,048 2,004 2,295 2,246 2,043 2,023
Total Direct Spending 6,472 6,800 6,635 7,466 7,754 7,471 7,558
Visitor Spending by Type of Traveler Accommodation ($Million)
Hotel, Motel 2,629 2,883 2,810 3,205 3,471 3,486 3,583
Private Campground 18 21 22 25 25 23 23
Public Campground 9 10 10 11 11 10 10
Private Home 946 960 927 1,049 1,064 993 986
Vacation Home 18 21 20 21 22 21 22
Day Travel 799 858 843 858 913 895 912
Visitor Spending 4,419 4,752 4,631 5,170 5,507 5,429 5,535
Visitor Spending by Commodity Purchased ($Million)
Accommodations 590 698 663 762 876 950 998
Food Service 622 700 749 814 917 989 1,042
Food Stores 105 120 124 135 150 157 160
Local Tran. & Gas 729 895 753 885 886 714 693
Arts, Ent. & Rec. 506 531 542 559 608 637 664
Retail Sales 495 506 529 549 587 609 626
Visitor Air Tran. 1,371 1,302 1,270 1,467 1,483 1,373 1,351
Visitor Spending 4,419 4,752 4,631 5,170 5,507 5,429 5,535
Industry Earnings Generated by Travel Spending ($Million)
Accom. & Food Serv. 496 554 586 686 746 808 865
Arts, Ent. & Rec. 308 326 344 386 460 504 539
Retail** 108 112 113 123 137 148 156
Ground Tran. 31 31 30 34 37 38 39
Visitor Air Tran. 697 611 612 641 842 1,139 1,227
Other Travel* 1,019 950 952 1,001 1,247 1,637 1,781
Total Direct Earnings 2,659 2,585 2,637 2,871 3,468 4,274 4,606
Industry Employment Generated by Travel Spending (Thousand Jobs)
Accom. & Food Serv. 19.9 22.1 22.9 23.8 26.0 27.1 28.4
Arts, Ent. & Rec. 12.8 16.1 16.6 16.6 19.7 20.7 20.9
Retail** 4.5 4.5 4.5 4.5 4.7 5.0 5.2
Ground Tran. 0.9 0.9 0.8 0.8 0.9 0.9 0.9
Visitor Air Tran. 8.2 7.7 7.3 8.1 7.9 9.0 9.2
Other Travel* 12.2 12.1 11.7 12.8 12.0 13.2 13.8
Total Direct Employment 58.5 63.5 63.8 66.5 71.2 75.9 78.5
Government Revenue Generated by Travel Spending ($Million)***
Local Tax Receipts 217 211 221 233 273 319 346 Visitor 86 93 91 101 112 119 126
Business/Employee 130 119 130 131 161 200 220
State Tax Receipts 248 263 260 282 325 363 375 Visitor 159 172 173 184 203 214 223
Business/Employee 89 90 87 98 122 149 152
Total Direct Gov't Revenue 465 474 481 514 598 682 721
Details may not add to totals due to rounding. *Other Travel includes resident air travel, travel arrangement, and
convention/trade shows. **Retail includes gasoline. ***Visitor tax receipts include all direct sales and excise taxes levied
on visitor spending. Business/employee tax receipts include local property taxes, the state franchise tax, and sales tax
payments attributable to the travel industry generated income of employees.
Fort Worth-Arlington MD
Travel Impacts, 2006-2016p
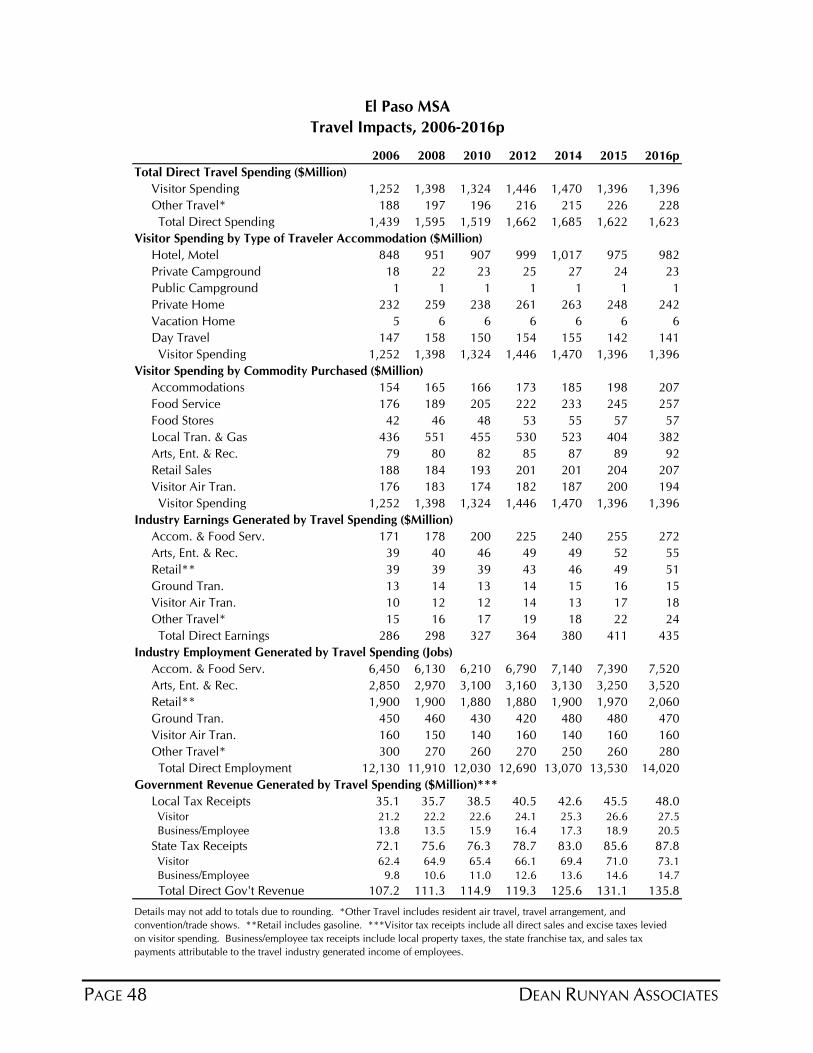
PAGE 48 DEAN RUNYAN ASSOCIATES
2006 2008 2010 2012 2014 2015 2016p
Total Direct Travel Spending ($Million)
Visitor Spending 1,252 1,398 1,324 1,446 1,470 1,396 1,396
Other Travel* 188 197 196 216 215 226 228
Total Direct Spending 1,439 1,595 1,519 1,662 1,685 1,622 1,623
Visitor Spending by Type of Traveler Accommodation ($Million)
Hotel, Motel 848 951 907 999 1,017 975 982
Private Campground 18 22 23 25 27 24 23
Public Campground 1 1 1 1 1 1 1
Private Home 232 259 238 261 263 248 242
Vacation Home 5 6 6 6 6 6 6
Day Travel 147 158 150 154 155 142 141
Visitor Spending 1,252 1,398 1,324 1,446 1,470 1,396 1,396
Visitor Spending by Commodity Purchased ($Million)
Accommodations 154 165 166 173 185 198 207
Food Service 176 189 205 222 233 245 257
Food Stores 42 46 48 53 55 57 57
Local Tran. & Gas 436 551 455 530 523 404 382
Arts, Ent. & Rec. 79 80 82 85 87 89 92
Retail Sales 188 184 193 201 201 204 207
Visitor Air Tran. 176 183 174 182 187 200 194
Visitor Spending 1,252 1,398 1,324 1,446 1,470 1,396 1,396
Industry Earnings Generated by Travel Spending ($Million)
Accom. & Food Serv. 171 178 200 225 240 255 272
Arts, Ent. & Rec. 39 40 46 49 49 52 55
Retail** 39 39 39 43 46 49 51
Ground Tran. 13 14 13 14 15 16 15
Visitor Air Tran. 10 12 12 14 13 17 18
Other Travel* 15 16 17 19 18 22 24
Total Direct Earnings 286 298 327 364 380 411 435
Industry Employment Generated by Travel Spending (Jobs)
Accom. & Food Serv. 6,450 6,130 6,210 6,790 7,140 7,390 7,520
Arts, Ent. & Rec. 2,850 2,970 3,100 3,160 3,130 3,250 3,520
Retail** 1,900 1,900 1,880 1,880 1,900 1,970 2,060
Ground Tran. 450 460 430 420 480 480 470
Visitor Air Tran. 160 150 140 160 140 160 160
Other Travel* 300 270 260 270 250 260 280
Total Direct Employment 12,130 11,910 12,030 12,690 13,070 13,530 14,020
Government Revenue Generated by Travel Spending ($Million)***
Local Tax Receipts 35.1 35.7 38.5 40.5 42.6 45.5 48.0 Visitor 21.2 22.2 22.6 24.1 25.3 26.6 27.5
Business/Employee 13.8 13.5 15.9 16.4 17.3 18.9 20.5
State Tax Receipts 72.1 75.6 76.3 78.7 83.0 85.6 87.8 Visitor 62.4 64.9 65.4 66.1 69.4 71.0 73.1
Business/Employee 9.8 10.6 11.0 12.6 13.6 14.6 14.7
Total Direct Gov't Revenue 107.2 111.3 114.9 119.3 125.6 131.1 135.8
El Paso MSA
Travel Impacts, 2006-2016p
Details may not add to totals due to rounding. *Other Travel includes resident air travel, travel arrangement, and
convention/trade shows. **Retail includes gasoline. ***Visitor tax receipts include all direct sales and excise taxes levied
on visitor spending. Business/employee tax receipts include local property taxes, the state franchise tax, and sales tax
payments attributable to the travel industry generated income of employees.
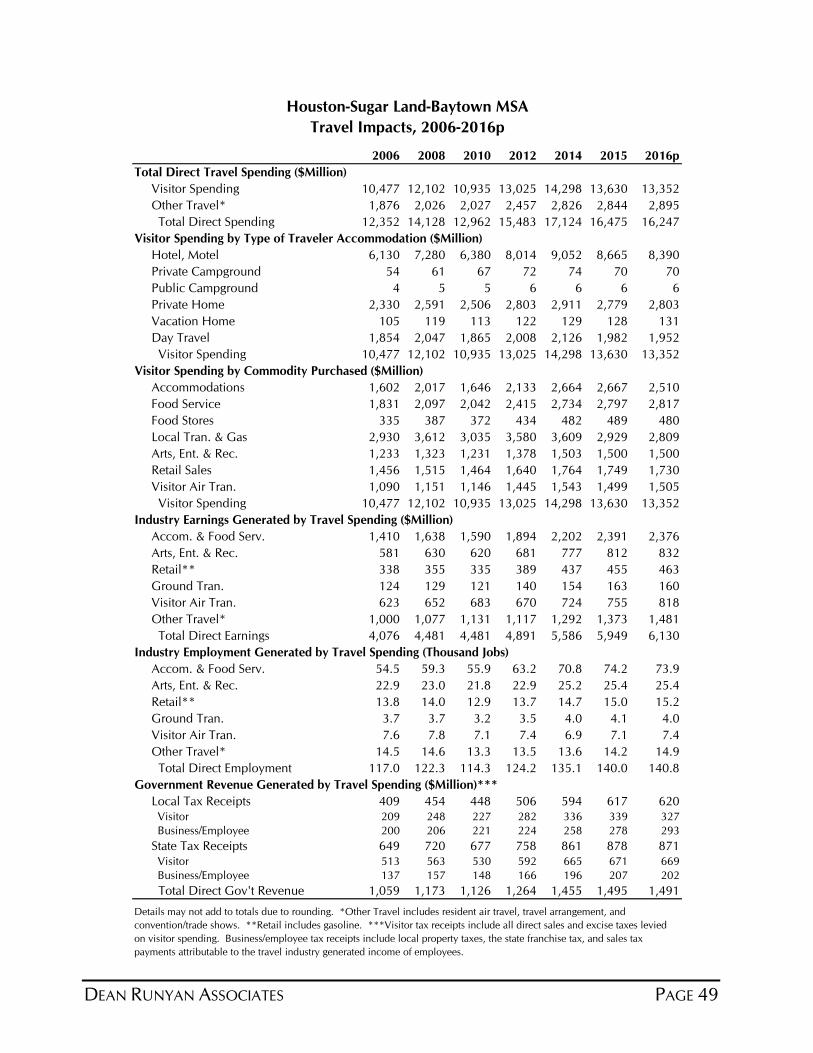
DEAN RUNYAN ASSOCIATES PAGE 49
2006 2008 2010 2012 2014 2015 2016p
Total Direct Travel Spending ($Million)
Visitor Spending 10,477 12,102 10,935 13,025 14,298 13,630 13,352
Other Travel* 1,876 2,026 2,027 2,457 2,826 2,844 2,895
Total Direct Spending 12,352 14,128 12,962 15,483 17,124 16,475 16,247
Visitor Spending by Type of Traveler Accommodation ($Million)
Hotel, Motel 6,130 7,280 6,380 8,014 9,052 8,665 8,390
Private Campground 54 61 67 72 74 70 70
Public Campground 4 5 5 6 6 6 6
Private Home 2,330 2,591 2,506 2,803 2,911 2,779 2,803
Vacation Home 105 119 113 122 129 128 131
Day Travel 1,854 2,047 1,865 2,008 2,126 1,982 1,952
Visitor Spending 10,477 12,102 10,935 13,025 14,298 13,630 13,352
Visitor Spending by Commodity Purchased ($Million)
Accommodations 1,602 2,017 1,646 2,133 2,664 2,667 2,510
Food Service 1,831 2,097 2,042 2,415 2,734 2,797 2,817
Food Stores 335 387 372 434 482 489 480
Local Tran. & Gas 2,930 3,612 3,035 3,580 3,609 2,929 2,809
Arts, Ent. & Rec. 1,233 1,323 1,231 1,378 1,503 1,500 1,500
Retail Sales 1,456 1,515 1,464 1,640 1,764 1,749 1,730
Visitor Air Tran. 1,090 1,151 1,146 1,445 1,543 1,499 1,505
Visitor Spending 10,477 12,102 10,935 13,025 14,298 13,630 13,352
Industry Earnings Generated by Travel Spending ($Million)
Accom. & Food Serv. 1,410 1,638 1,590 1,894 2,202 2,391 2,376
Arts, Ent. & Rec. 581 630 620 681 777 812 832
Retail** 338 355 335 389 437 455 463
Ground Tran. 124 129 121 140 154 163 160
Visitor Air Tran. 623 652 683 670 724 755 818
Other Travel* 1,000 1,077 1,131 1,117 1,292 1,373 1,481
Total Direct Earnings 4,076 4,481 4,481 4,891 5,586 5,949 6,130
Industry Employment Generated by Travel Spending (Thousand Jobs)
Accom. & Food Serv. 54.5 59.3 55.9 63.2 70.8 74.2 73.9
Arts, Ent. & Rec. 22.9 23.0 21.8 22.9 25.2 25.4 25.4
Retail** 13.8 14.0 12.9 13.7 14.7 15.0 15.2
Ground Tran. 3.7 3.7 3.2 3.5 4.0 4.1 4.0
Visitor Air Tran. 7.6 7.8 7.1 7.4 6.9 7.1 7.4
Other Travel* 14.5 14.6 13.3 13.5 13.6 14.2 14.9
Total Direct Employment 117.0 122.3 114.3 124.2 135.1 140.0 140.8
Government Revenue Generated by Travel Spending ($Million)***
Local Tax Receipts 409 454 448 506 594 617 620 Visitor 209 248 227 282 336 339 327
Business/Employee 200 206 221 224 258 278 293
State Tax Receipts 649 720 677 758 861 878 871 Visitor 513 563 530 592 665 671 669
Business/Employee 137 157 148 166 196 207 202
Total Direct Gov't Revenue 1,059 1,173 1,126 1,264 1,455 1,495 1,491
Houston-Sugar Land-Baytown MSA
Travel Impacts, 2006-2016p
Details may not add to totals due to rounding. *Other Travel includes resident air travel, travel arrangement, and
convention/trade shows. **Retail includes gasoline. ***Visitor tax receipts include all direct sales and excise taxes levied
on visitor spending. Business/employee tax receipts include local property taxes, the state franchise tax, and sales tax
payments attributable to the travel industry generated income of employees.
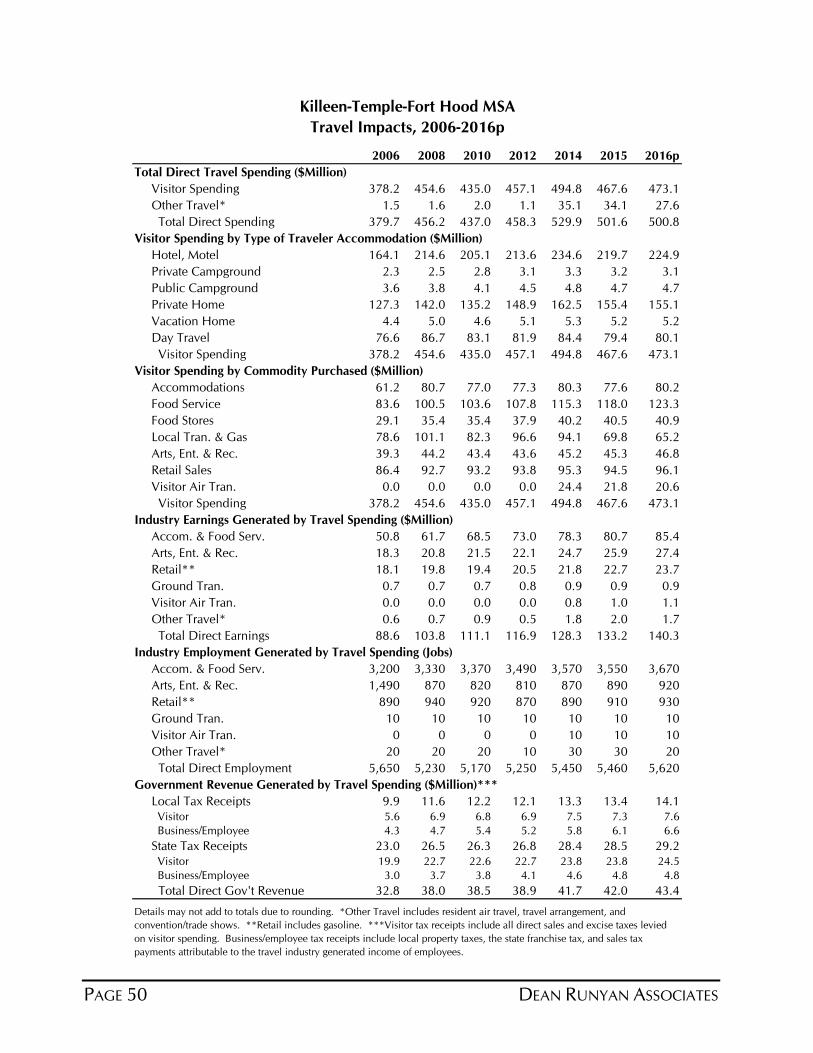
PAGE 50 DEAN RUNYAN ASSOCIATES
2006 2008 2010 2012 2014 2015 2016p
Total Direct Travel Spending ($Million)
Visitor Spending 378.2 454.6 435.0 457.1 494.8 467.6 473.1
Other Travel* 1.5 1.6 2.0 1.1 35.1 34.1 27.6
Total Direct Spending 379.7 456.2 437.0 458.3 529.9 501.6 500.8
Visitor Spending by Type of Traveler Accommodation ($Million)
Hotel, Motel 164.1 214.6 205.1 213.6 234.6 219.7 224.9
Private Campground 2.3 2.5 2.8 3.1 3.3 3.2 3.1
Public Campground 3.6 3.8 4.1 4.5 4.8 4.7 4.7
Private Home 127.3 142.0 135.2 148.9 162.5 155.4 155.1
Vacation Home 4.4 5.0 4.6 5.1 5.3 5.2 5.2
Day Travel 76.6 86.7 83.1 81.9 84.4 79.4 80.1
Visitor Spending 378.2 454.6 435.0 457.1 494.8 467.6 473.1
Visitor Spending by Commodity Purchased ($Million)
Accommodations 61.2 80.7 77.0 77.3 80.3 77.6 80.2
Food Service 83.6 100.5 103.6 107.8 115.3 118.0 123.3
Food Stores 29.1 35.4 35.4 37.9 40.2 40.5 40.9
Local Tran. & Gas 78.6 101.1 82.3 96.6 94.1 69.8 65.2
Arts, Ent. & Rec. 39.3 44.2 43.4 43.6 45.2 45.3 46.8
Retail Sales 86.4 92.7 93.2 93.8 95.3 94.5 96.1
Visitor Air Tran. 0.0 0.0 0.0 0.0 24.4 21.8 20.6
Visitor Spending 378.2 454.6 435.0 457.1 494.8 467.6 473.1
Industry Earnings Generated by Travel Spending ($Million)
Accom. & Food Serv. 50.8 61.7 68.5 73.0 78.3 80.7 85.4
Arts, Ent. & Rec. 18.3 20.8 21.5 22.1 24.7 25.9 27.4
Retail** 18.1 19.8 19.4 20.5 21.8 22.7 23.7
Ground Tran. 0.7 0.7 0.7 0.8 0.9 0.9 0.9
Visitor Air Tran. 0.0 0.0 0.0 0.0 0.8 1.0 1.1
Other Travel* 0.6 0.7 0.9 0.5 1.8 2.0 1.7
Total Direct Earnings 88.6 103.8 111.1 116.9 128.3 133.2 140.3
Industry Employment Generated by Travel Spending (Jobs)
Accom. & Food Serv. 3,200 3,330 3,370 3,490 3,570 3,550 3,670
Arts, Ent. & Rec. 1,490 870 820 810 870 890 920
Retail** 890 940 920 870 890 910 930
Ground Tran. 10 10 10 10 10 10 10
Visitor Air Tran. 0 0 0 0 10 10 10
Other Travel* 20 20 20 10 30 30 20
Total Direct Employment 5,650 5,230 5,170 5,250 5,450 5,460 5,620
Government Revenue Generated by Travel Spending ($Million)***
Local Tax Receipts 9.9 11.6 12.2 12.1 13.3 13.4 14.1 Visitor 5.6 6.9 6.8 6.9 7.5 7.3 7.6
Business/Employee 4.3 4.7 5.4 5.2 5.8 6.1 6.6
State Tax Receipts 23.0 26.5 26.3 26.8 28.4 28.5 29.2 Visitor 19.9 22.7 22.6 22.7 23.8 23.8 24.5
Business/Employee 3.0 3.7 3.8 4.1 4.6 4.8 4.8
Total Direct Gov't Revenue 32.8 38.0 38.5 38.9 41.7 42.0 43.4
Travel Impacts, 2006-2016p
Killeen-Temple-Fort Hood MSA
Details may not add to totals due to rounding. *Other Travel includes resident air travel, travel arrangement, and
convention/trade shows. **Retail includes gasoline. ***Visitor tax receipts include all direct sales and excise taxes levied
on visitor spending. Business/employee tax receipts include local property taxes, the state franchise tax, and sales tax
payments attributable to the travel industry generated income of employees.

DEAN RUNYAN ASSOCIATES PAGE 51
2006 2008 2010 2012 2014 2015 2016p
Total Direct Travel Spending ($Million)
Visitor Spending 460.2 492.8 496.2 570.7 576.7 538.7 519.9
Other Travel* 17.5 18.6 23.7 24.2 22.1 21.5 18.8
Total Direct Spending 477.7 511.5 519.9 595.0 598.8 560.2 538.7
Visitor Spending by Type of Traveler Accommodation ($Million)
Hotel, Motel 245.4 262.4 269.5 328.5 325.1 295.1 276.9
Private Campground 0.7 0.8 0.9 0.9 1.0 1.0 1.0
Public Campground 0.0 0.0 0.0 0.0 0.0 0.0 0.0
Private Home 157.2 170.9 166.9 179.0 187.8 183.5 184.7
Vacation Home 4.2 4.8 4.6 5.0 5.2 5.2 5.3
Day Travel 52.6 54.0 54.3 57.4 57.6 53.9 52.1
Visitor Spending 460.2 492.8 496.2 570.7 576.7 538.7 519.9
Visitor Spending by Commodity Purchased ($Million)
Accommodations 59.4 60.3 64.6 83.3 79.5 71.0 64.9
Food Service 102.0 111.4 119.5 138.5 143.7 142.7 140.6
Food Stores 15.6 17.5 18.1 21.2 21.9 21.5 20.6
Local Tran. & Gas 78.9 100.1 83.4 97.7 96.6 74.9 71.4
Arts, Ent. & Rec. 31.9 32.9 33.4 36.7 37.0 36.0 35.4
Retail Sales 158.1 158.8 165.2 181.3 181.1 175.6 171.1
Visitor Air Tran. 14.3 11.9 11.9 11.9 16.8 17.0 15.9
Visitor Spending 460.2 492.8 496.2 570.7 576.7 538.7 519.9
Industry Earnings Generated by Travel Spending ($Million)
Accom. & Food Serv. 68.6 71.6 72.9 87.6 96.5 101.9 100.0
Arts, Ent. & Rec. 13.0 13.6 13.3 15.0 17.7 18.0 18.1
Retail** 23.4 23.8 23.8 27.2 28.4 28.9 28.9
Ground Tran. 2.7 2.9 2.9 3.2 3.4 3.7 3.6
Visitor Air Tran. 0.4 0.4 0.3 0.6 1.0 1.1 1.3
Other Travel* 1.1 1.0 0.9 1.5 2.0 2.0 1.9
Total Direct Earnings 109.3 113.2 114.1 135.2 149.0 155.6 153.9
Industry Employment Generated by Travel Spending (Jobs)
Accom. & Food Serv. 3,280 3,160 3,010 3,390 3,670 3,750 3,670
Arts, Ent. & Rec. 970 940 860 910 1,050 1,040 1,010
Retail** 1,220 1,190 1,170 1,220 1,220 1,220 1,230
Ground Tran. 80 80 80 80 90 90 90
Visitor Air Tran. 10 10 0 10 20 20 20
Other Travel* 40 30 30 40 50 50 40
Total Direct Employment 5,620 5,440 5,190 5,690 6,140 6,180 6,090
Government Revenue Generated by Travel Spending ($Million)***
Local Tax Receipts 11.6 11.6 12.5 14.5 15.0 14.8 14.4 Visitor 6.6 6.8 7.2 8.8 8.7 8.1 7.6
Business/Employee 5.0 4.8 5.3 5.7 6.4 6.7 6.8
State Tax Receipts 29.0 30.3 31.1 35.0 36.3 35.7 34.7 Visitor 24.9 26.0 26.9 30.0 30.5 29.7 29.1
Business/Employee 4.0 4.4 4.1 5.1 5.8 6.0 5.6
Total Direct Gov't Revenue 40.6 41.9 43.6 49.5 51.3 50.5 49.2
Travel Impacts, 2006-2016p
Details may not add to totals due to rounding. *Other Travel includes resident air travel, travel arrangement, and
convention/trade shows. **Retail includes gasoline. ***Visitor tax receipts include all direct sales and excise taxes levied
on visitor spending. Business/employee tax receipts include local property taxes, the state franchise tax, and sales tax
payments attributable to the travel industry generated income of employees.
Laredo MSA
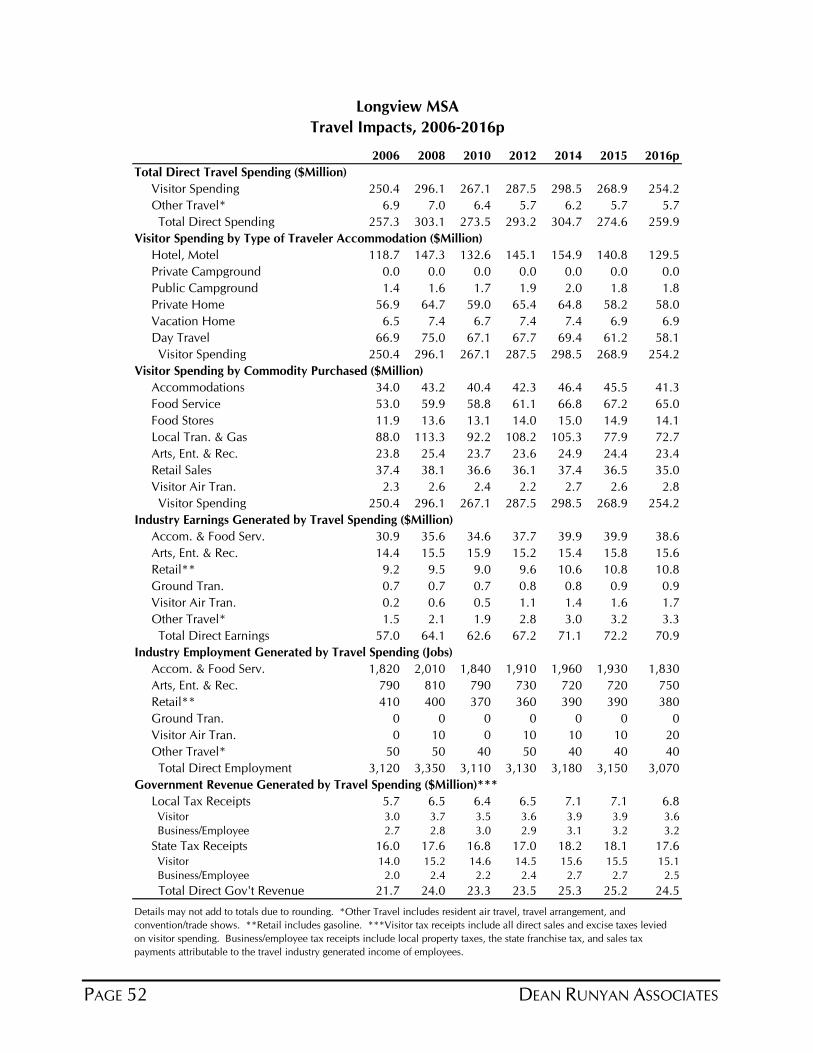
PAGE 52 DEAN RUNYAN ASSOCIATES
2006 2008 2010 2012 2014 2015 2016p
Total Direct Travel Spending ($Million)
Visitor Spending 250.4 296.1 267.1 287.5 298.5 268.9 254.2
Other Travel* 6.9 7.0 6.4 5.7 6.2 5.7 5.7
Total Direct Spending 257.3 303.1 273.5 293.2 304.7 274.6 259.9
Visitor Spending by Type of Traveler Accommodation ($Million)
Hotel, Motel 118.7 147.3 132.6 145.1 154.9 140.8 129.5
Private Campground 0.0 0.0 0.0 0.0 0.0 0.0 0.0
Public Campground 1.4 1.6 1.7 1.9 2.0 1.8 1.8
Private Home 56.9 64.7 59.0 65.4 64.8 58.2 58.0
Vacation Home 6.5 7.4 6.7 7.4 7.4 6.9 6.9
Day Travel 66.9 75.0 67.1 67.7 69.4 61.2 58.1
Visitor Spending 250.4 296.1 267.1 287.5 298.5 268.9 254.2
Visitor Spending by Commodity Purchased ($Million)
Accommodations 34.0 43.2 40.4 42.3 46.4 45.5 41.3
Food Service 53.0 59.9 58.8 61.1 66.8 67.2 65.0
Food Stores 11.9 13.6 13.1 14.0 15.0 14.9 14.1
Local Tran. & Gas 88.0 113.3 92.2 108.2 105.3 77.9 72.7
Arts, Ent. & Rec. 23.8 25.4 23.7 23.6 24.9 24.4 23.4
Retail Sales 37.4 38.1 36.6 36.1 37.4 36.5 35.0
Visitor Air Tran. 2.3 2.6 2.4 2.2 2.7 2.6 2.8
Visitor Spending 250.4 296.1 267.1 287.5 298.5 268.9 254.2
Industry Earnings Generated by Travel Spending ($Million)
Accom. & Food Serv. 30.9 35.6 34.6 37.7 39.9 39.9 38.6
Arts, Ent. & Rec. 14.4 15.5 15.9 15.2 15.4 15.8 15.6
Retail** 9.2 9.5 9.0 9.6 10.6 10.8 10.8
Ground Tran. 0.7 0.7 0.7 0.8 0.8 0.9 0.9
Visitor Air Tran. 0.2 0.6 0.5 1.1 1.4 1.6 1.7
Other Travel* 1.5 2.1 1.9 2.8 3.0 3.2 3.3
Total Direct Earnings 57.0 64.1 62.6 67.2 71.1 72.2 70.9
Industry Employment Generated by Travel Spending (Jobs)
Accom. & Food Serv. 1,820 2,010 1,840 1,910 1,960 1,930 1,830
Arts, Ent. & Rec. 790 810 790 730 720 720 750
Retail** 410 400 370 360 390 390 380
Ground Tran. 0 0 0 0 0 0 0
Visitor Air Tran. 0 10 0 10 10 10 20
Other Travel* 50 50 40 50 40 40 40
Total Direct Employment 3,120 3,350 3,110 3,130 3,180 3,150 3,070
Government Revenue Generated by Travel Spending ($Million)***
Local Tax Receipts 5.7 6.5 6.4 6.5 7.1 7.1 6.8 Visitor 3.0 3.7 3.5 3.6 3.9 3.9 3.6
Business/Employee 2.7 2.8 3.0 2.9 3.1 3.2 3.2
State Tax Receipts 16.0 17.6 16.8 17.0 18.2 18.1 17.6 Visitor 14.0 15.2 14.6 14.5 15.6 15.5 15.1
Business/Employee 2.0 2.4 2.2 2.4 2.7 2.7 2.5
Total Direct Gov't Revenue 21.7 24.0 23.3 23.5 25.3 25.2 24.5
Details may not add to totals due to rounding. *Other Travel includes resident air travel, travel arrangement, and
convention/trade shows. **Retail includes gasoline. ***Visitor tax receipts include all direct sales and excise taxes levied
on visitor spending. Business/employee tax receipts include local property taxes, the state franchise tax, and sales tax
payments attributable to the travel industry generated income of employees.
Longview MSA
Travel Impacts, 2006-2016p
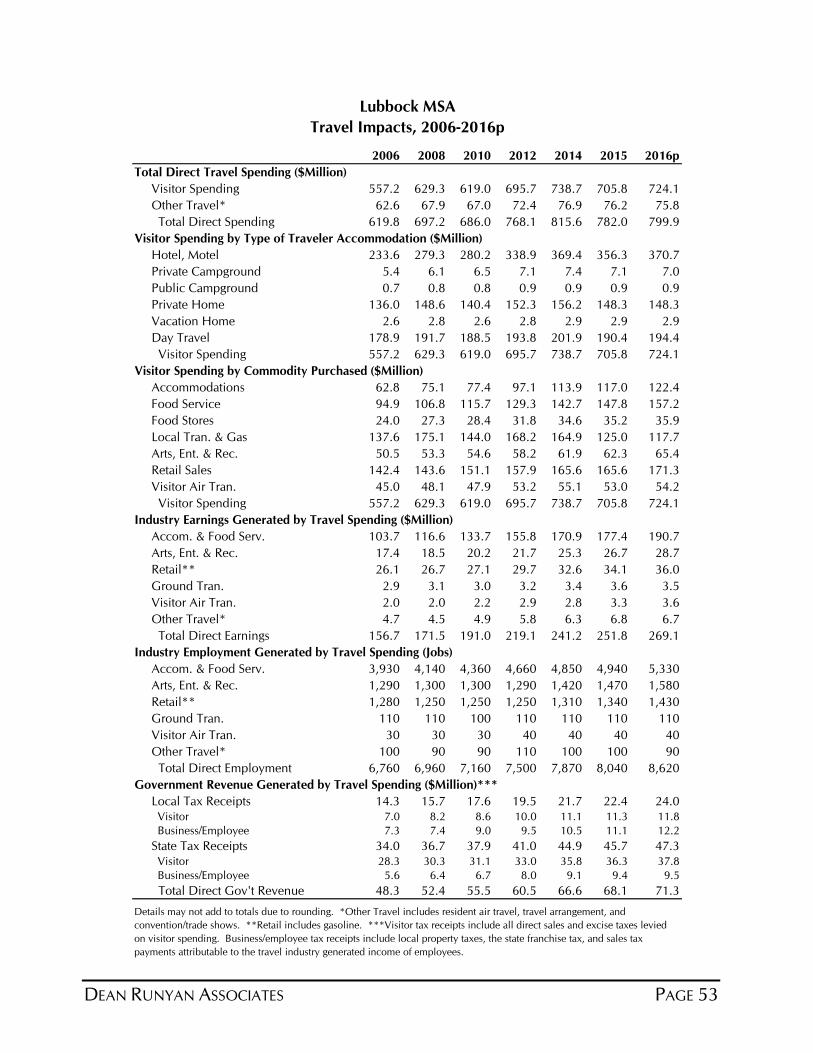
DEAN RUNYAN ASSOCIATES PAGE 53
2006 2008 2010 2012 2014 2015 2016p
Total Direct Travel Spending ($Million)
Visitor Spending 557.2 629.3 619.0 695.7 738.7 705.8 724.1
Other Travel* 62.6 67.9 67.0 72.4 76.9 76.2 75.8
Total Direct Spending 619.8 697.2 686.0 768.1 815.6 782.0 799.9
Visitor Spending by Type of Traveler Accommodation ($Million)
Hotel, Motel 233.6 279.3 280.2 338.9 369.4 356.3 370.7
Private Campground 5.4 6.1 6.5 7.1 7.4 7.1 7.0
Public Campground 0.7 0.8 0.8 0.9 0.9 0.9 0.9
Private Home 136.0 148.6 140.4 152.3 156.2 148.3 148.3
Vacation Home 2.6 2.8 2.6 2.8 2.9 2.9 2.9
Day Travel 178.9 191.7 188.5 193.8 201.9 190.4 194.4
Visitor Spending 557.2 629.3 619.0 695.7 738.7 705.8 724.1
Visitor Spending by Commodity Purchased ($Million)
Accommodations 62.8 75.1 77.4 97.1 113.9 117.0 122.4
Food Service 94.9 106.8 115.7 129.3 142.7 147.8 157.2
Food Stores 24.0 27.3 28.4 31.8 34.6 35.2 35.9
Local Tran. & Gas 137.6 175.1 144.0 168.2 164.9 125.0 117.7
Arts, Ent. & Rec. 50.5 53.3 54.6 58.2 61.9 62.3 65.4
Retail Sales 142.4 143.6 151.1 157.9 165.6 165.6 171.3
Visitor Air Tran. 45.0 48.1 47.9 53.2 55.1 53.0 54.2
Visitor Spending 557.2 629.3 619.0 695.7 738.7 705.8 724.1
Industry Earnings Generated by Travel Spending ($Million)
Accom. & Food Serv. 103.7 116.6 133.7 155.8 170.9 177.4 190.7
Arts, Ent. & Rec. 17.4 18.5 20.2 21.7 25.3 26.7 28.7
Retail** 26.1 26.7 27.1 29.7 32.6 34.1 36.0
Ground Tran. 2.9 3.1 3.0 3.2 3.4 3.6 3.5
Visitor Air Tran. 2.0 2.0 2.2 2.9 2.8 3.3 3.6
Other Travel* 4.7 4.5 4.9 5.8 6.3 6.8 6.7
Total Direct Earnings 156.7 171.5 191.0 219.1 241.2 251.8 269.1
Industry Employment Generated by Travel Spending (Jobs)
Accom. & Food Serv. 3,930 4,140 4,360 4,660 4,850 4,940 5,330
Arts, Ent. & Rec. 1,290 1,300 1,300 1,290 1,420 1,470 1,580
Retail** 1,280 1,250 1,250 1,250 1,310 1,340 1,430
Ground Tran. 110 110 100 110 110 110 110
Visitor Air Tran. 30 30 30 40 40 40 40
Other Travel* 100 90 90 110 100 100 90
Total Direct Employment 6,760 6,960 7,160 7,500 7,870 8,040 8,620
Government Revenue Generated by Travel Spending ($Million)***
Local Tax Receipts 14.3 15.7 17.6 19.5 21.7 22.4 24.0 Visitor 7.0 8.2 8.6 10.0 11.1 11.3 11.8
Business/Employee 7.3 7.4 9.0 9.5 10.5 11.1 12.2
State Tax Receipts 34.0 36.7 37.9 41.0 44.9 45.7 47.3 Visitor 28.3 30.3 31.1 33.0 35.8 36.3 37.8
Business/Employee 5.6 6.4 6.7 8.0 9.1 9.4 9.5
Total Direct Gov't Revenue 48.3 52.4 55.5 60.5 66.6 68.1 71.3
Lubbock MSA
Travel Impacts, 2006-2016p
Details may not add to totals due to rounding. *Other Travel includes resident air travel, travel arrangement, and
convention/trade shows. **Retail includes gasoline. ***Visitor tax receipts include all direct sales and excise taxes levied
on visitor spending. Business/employee tax receipts include local property taxes, the state franchise tax, and sales tax
payments attributable to the travel industry generated income of employees.

PAGE 54 DEAN RUNYAN ASSOCIATES
2006 2008 2010 2012 2014 2015 2016p
Total Direct Travel Spending ($Million)
Visitor Spending 1,022 1,143 1,112 1,197 1,295 1,265 1,257
Other Travel* 55 60 61 67 64 67 64
Total Direct Spending 1,078 1,203 1,173 1,263 1,359 1,333 1,321
Visitor Spending by Type of Traveler Accommodation ($Million)
Hotel, Motel 341 387 352 382 438 429 417
Private Campground 134 150 165 180 190 185 185
Public Campground 1 1 1 1 1 1 1
Private Home 279 311 303 332 349 340 344
Vacation Home 83 95 93 102 107 106 107
Day Travel 185 198 198 199 211 204 203
Visitor Spending 1,022 1,143 1,112 1,197 1,295 1,265 1,257
Visitor Spending by Commodity Purchased ($Million)
Accommodations 139 161 149 159 184 185 181
Food Service 273 304 317 340 378 391 397
Food Stores 89 102 107 118 128 130 129
Local Tran. & Gas 160 206 168 197 192 143 134
Arts, Ent. & Rec. 77 81 82 84 89 90 91
Retail Sales 233 238 247 255 269 269 268
Visitor Air Tran. 51 51 42 43 56 57 58
Visitor Spending 1,022 1,143 1,112 1,197 1,295 1,265 1,257
Industry Earnings Generated by Travel Spending ($Million)
Accom. & Food Serv. 159.0 176.4 195.7 209.6 225.9 239.2 244.5
Arts, Ent. & Rec. 36.6 38.8 41.3 42.2 52.4 55.3 57.1
Retail** 46.0 48.3 48.8 52.8 57.8 60.6 61.9
Ground Tran. 1.7 1.8 1.8 2.0 2.1 2.3 2.2
Visitor Air Tran. 1.7 1.9 1.7 1.5 2.1 2.2 2.5
Other Travel* 3.4 4.1 3.9 3.7 4.3 4.1 2.7
Total Direct Earnings 248.4 271.2 293.1 311.8 344.5 363.7 370.9
Industry Employment Generated by Travel Spending (Jobs)
Accom. & Food Serv. 8,470 8,570 8,740 9,000 9,470 9,830 9,870
Arts, Ent. & Rec. 2,770 3,030 2,960 2,910 3,530 3,660 3,640
Retail** 2,440 2,480 2,450 2,420 2,540 2,610 2,630
Ground Tran. 50 50 50 50 50 50 50
Visitor Air Tran. 20 30 20 20 20 20 20
Other Travel* 80 90 80 70 70 100 30
Total Direct Employment 13,860 14,270 14,320 14,490 15,710 16,300 16,270
Government Revenue Generated by Travel Spending ($Million)***
Local Tax Receipts 27.3 29.2 30.8 31.8 35.7 36.9 37.3 Visitor 15.2 16.8 16.4 17.6 19.8 20.0 19.7
Business/Employee 12.1 12.4 14.4 14.2 15.8 16.9 17.6
State Tax Receipts 58.3 63.5 64.2 67.2 73.8 75.2 75.1 Visitor 49.9 54.0 54.5 56.5 61.6 62.4 62.8
Business/Employee 8.4 9.6 9.7 10.7 12.2 12.8 12.4
Total Direct Gov't Revenue 85.6 92.7 95.0 98.9 109.5 112.1 112.4
McAllen-Edinburg-Mission MSA
Travel Impacts, 2006-2016p
Details may not add to totals due to rounding. *Other Travel includes resident air travel, travel arrangement, and
convention/trade shows. **Retail includes gasoline. ***Visitor tax receipts include all direct sales and excise taxes levied
on visitor spending. Business/employee tax receipts include local property taxes, the state franchise tax, and sales tax
payments attributable to the travel industry generated income of employees.
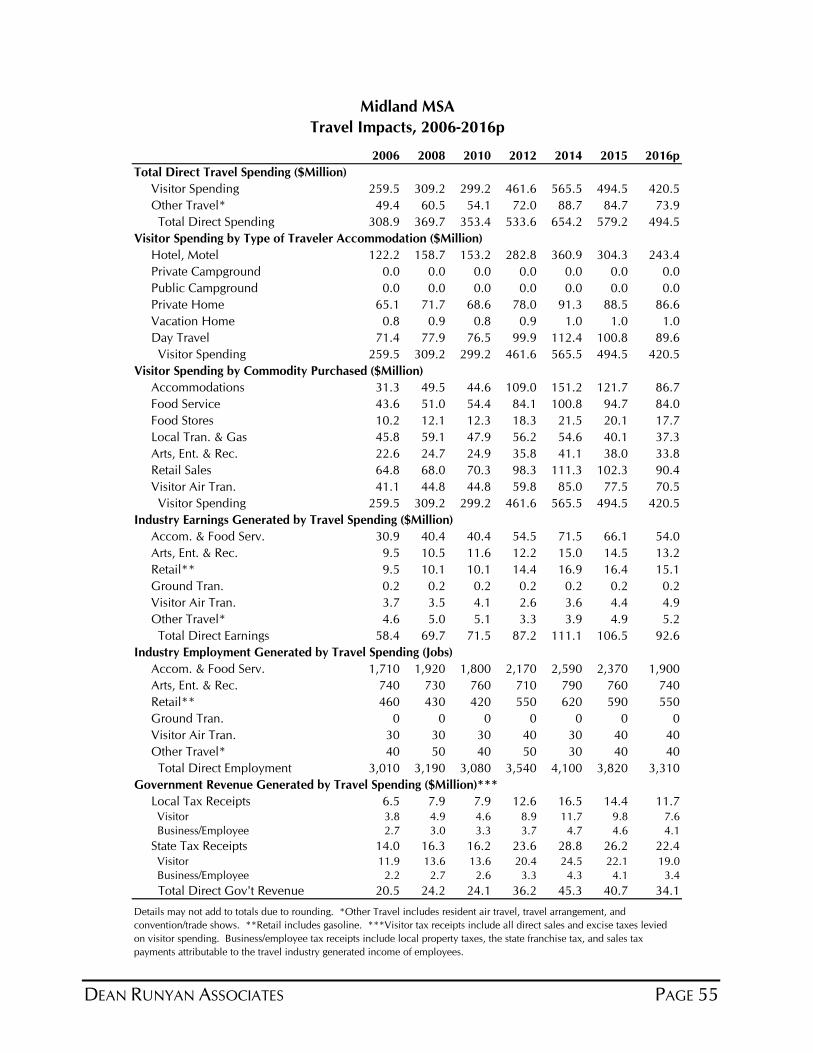
DEAN RUNYAN ASSOCIATES PAGE 55
2006 2008 2010 2012 2014 2015 2016p
Total Direct Travel Spending ($Million)
Visitor Spending 259.5 309.2 299.2 461.6 565.5 494.5 420.5
Other Travel* 49.4 60.5 54.1 72.0 88.7 84.7 73.9
Total Direct Spending 308.9 369.7 353.4 533.6 654.2 579.2 494.5
Visitor Spending by Type of Traveler Accommodation ($Million)
Hotel, Motel 122.2 158.7 153.2 282.8 360.9 304.3 243.4
Private Campground 0.0 0.0 0.0 0.0 0.0 0.0 0.0
Public Campground 0.0 0.0 0.0 0.0 0.0 0.0 0.0
Private Home 65.1 71.7 68.6 78.0 91.3 88.5 86.6
Vacation Home 0.8 0.9 0.8 0.9 1.0 1.0 1.0
Day Travel 71.4 77.9 76.5 99.9 112.4 100.8 89.6
Visitor Spending 259.5 309.2 299.2 461.6 565.5 494.5 420.5
Visitor Spending by Commodity Purchased ($Million)
Accommodations 31.3 49.5 44.6 109.0 151.2 121.7 86.7
Food Service 43.6 51.0 54.4 84.1 100.8 94.7 84.0
Food Stores 10.2 12.1 12.3 18.3 21.5 20.1 17.7
Local Tran. & Gas 45.8 59.1 47.9 56.2 54.6 40.1 37.3
Arts, Ent. & Rec. 22.6 24.7 24.9 35.8 41.1 38.0 33.8
Retail Sales 64.8 68.0 70.3 98.3 111.3 102.3 90.4
Visitor Air Tran. 41.1 44.8 44.8 59.8 85.0 77.5 70.5
Visitor Spending 259.5 309.2 299.2 461.6 565.5 494.5 420.5
Industry Earnings Generated by Travel Spending ($Million)
Accom. & Food Serv. 30.9 40.4 40.4 54.5 71.5 66.1 54.0
Arts, Ent. & Rec. 9.5 10.5 11.6 12.2 15.0 14.5 13.2
Retail** 9.5 10.1 10.1 14.4 16.9 16.4 15.1
Ground Tran. 0.2 0.2 0.2 0.2 0.2 0.2 0.2
Visitor Air Tran. 3.7 3.5 4.1 2.6 3.6 4.4 4.9
Other Travel* 4.6 5.0 5.1 3.3 3.9 4.9 5.2
Total Direct Earnings 58.4 69.7 71.5 87.2 111.1 106.5 92.6
Industry Employment Generated by Travel Spending (Jobs)
Accom. & Food Serv. 1,710 1,920 1,800 2,170 2,590 2,370 1,900
Arts, Ent. & Rec. 740 730 760 710 790 760 740
Retail** 460 430 420 550 620 590 550
Ground Tran. 0 0 0 0 0 0 0
Visitor Air Tran. 30 30 30 40 30 40 40
Other Travel* 40 50 40 50 30 40 40
Total Direct Employment 3,010 3,190 3,080 3,540 4,100 3,820 3,310
Government Revenue Generated by Travel Spending ($Million)***
Local Tax Receipts 6.5 7.9 7.9 12.6 16.5 14.4 11.7 Visitor 3.8 4.9 4.6 8.9 11.7 9.8 7.6
Business/Employee 2.7 3.0 3.3 3.7 4.7 4.6 4.1
State Tax Receipts 14.0 16.3 16.2 23.6 28.8 26.2 22.4 Visitor 11.9 13.6 13.6 20.4 24.5 22.1 19.0
Business/Employee 2.2 2.7 2.6 3.3 4.3 4.1 3.4
Total Direct Gov't Revenue 20.5 24.2 24.1 36.2 45.3 40.7 34.1
Details may not add to totals due to rounding. *Other Travel includes resident air travel, travel arrangement, and
convention/trade shows. **Retail includes gasoline. ***Visitor tax receipts include all direct sales and excise taxes levied
on visitor spending. Business/employee tax receipts include local property taxes, the state franchise tax, and sales tax
payments attributable to the travel industry generated income of employees.
Midland MSA
Travel Impacts, 2006-2016p
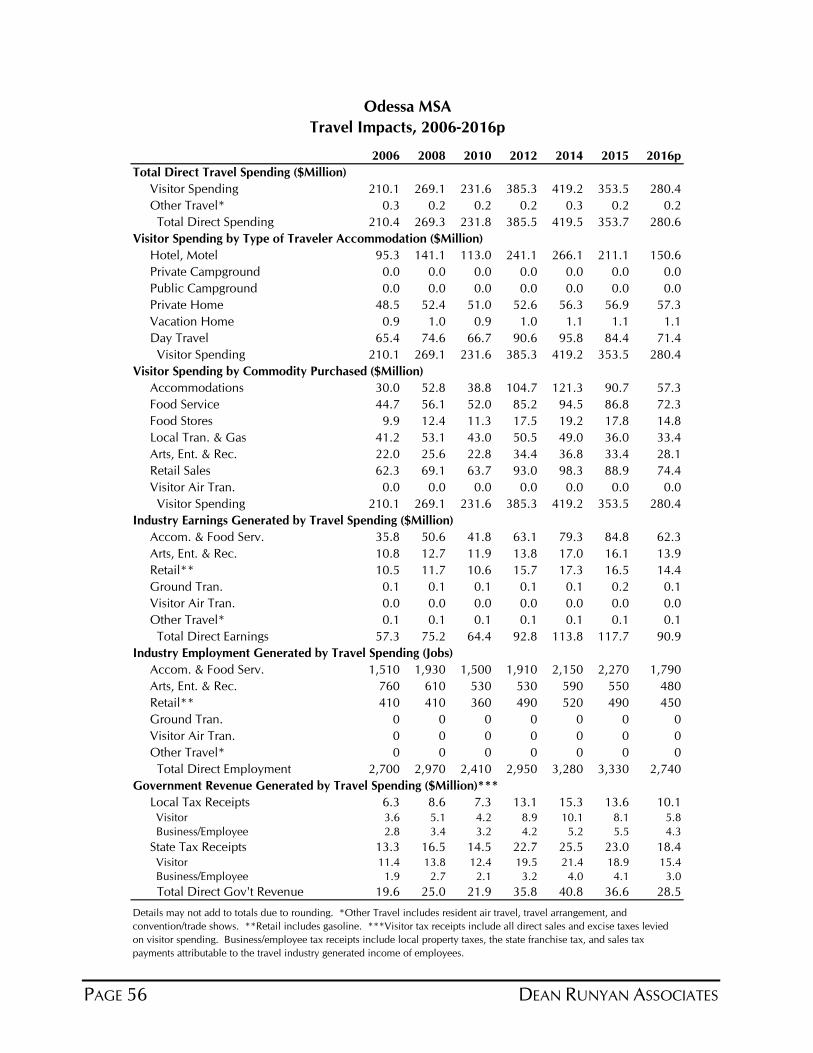
PAGE 56 DEAN RUNYAN ASSOCIATES
2006 2008 2010 2012 2014 2015 2016p
Total Direct Travel Spending ($Million)
Visitor Spending 210.1 269.1 231.6 385.3 419.2 353.5 280.4
Other Travel* 0.3 0.2 0.2 0.2 0.3 0.2 0.2
Total Direct Spending 210.4 269.3 231.8 385.5 419.5 353.7 280.6
Visitor Spending by Type of Traveler Accommodation ($Million)
Hotel, Motel 95.3 141.1 113.0 241.1 266.1 211.1 150.6
Private Campground 0.0 0.0 0.0 0.0 0.0 0.0 0.0
Public Campground 0.0 0.0 0.0 0.0 0.0 0.0 0.0
Private Home 48.5 52.4 51.0 52.6 56.3 56.9 57.3
Vacation Home 0.9 1.0 0.9 1.0 1.1 1.1 1.1
Day Travel 65.4 74.6 66.7 90.6 95.8 84.4 71.4
Visitor Spending 210.1 269.1 231.6 385.3 419.2 353.5 280.4
Visitor Spending by Commodity Purchased ($Million)
Accommodations 30.0 52.8 38.8 104.7 121.3 90.7 57.3
Food Service 44.7 56.1 52.0 85.2 94.5 86.8 72.3
Food Stores 9.9 12.4 11.3 17.5 19.2 17.8 14.8
Local Tran. & Gas 41.2 53.1 43.0 50.5 49.0 36.0 33.4
Arts, Ent. & Rec. 22.0 25.6 22.8 34.4 36.8 33.4 28.1
Retail Sales 62.3 69.1 63.7 93.0 98.3 88.9 74.4
Visitor Air Tran. 0.0 0.0 0.0 0.0 0.0 0.0 0.0
Visitor Spending 210.1 269.1 231.6 385.3 419.2 353.5 280.4
Industry Earnings Generated by Travel Spending ($Million)
Accom. & Food Serv. 35.8 50.6 41.8 63.1 79.3 84.8 62.3
Arts, Ent. & Rec. 10.8 12.7 11.9 13.8 17.0 16.1 13.9
Retail** 10.5 11.7 10.6 15.7 17.3 16.5 14.4
Ground Tran. 0.1 0.1 0.1 0.1 0.1 0.2 0.1
Visitor Air Tran. 0.0 0.0 0.0 0.0 0.0 0.0 0.0
Other Travel* 0.1 0.1 0.1 0.1 0.1 0.1 0.1
Total Direct Earnings 57.3 75.2 64.4 92.8 113.8 117.7 90.9
Industry Employment Generated by Travel Spending (Jobs)
Accom. & Food Serv. 1,510 1,930 1,500 1,910 2,150 2,270 1,790
Arts, Ent. & Rec. 760 610 530 530 590 550 480
Retail** 410 410 360 490 520 490 450
Ground Tran. 0 0 0 0 0 0 0
Visitor Air Tran. 0 0 0 0 0 0 0
Other Travel* 0 0 0 0 0 0 0
Total Direct Employment 2,700 2,970 2,410 2,950 3,280 3,330 2,740
Government Revenue Generated by Travel Spending ($Million)***
Local Tax Receipts 6.3 8.6 7.3 13.1 15.3 13.6 10.1 Visitor 3.6 5.1 4.2 8.9 10.1 8.1 5.8
Business/Employee 2.8 3.4 3.2 4.2 5.2 5.5 4.3
State Tax Receipts 13.3 16.5 14.5 22.7 25.5 23.0 18.4 Visitor 11.4 13.8 12.4 19.5 21.4 18.9 15.4
Business/Employee 1.9 2.7 2.1 3.2 4.0 4.1 3.0
Total Direct Gov't Revenue 19.6 25.0 21.9 35.8 40.8 36.6 28.5
Details may not add to totals due to rounding. *Other Travel includes resident air travel, travel arrangement, and
convention/trade shows. **Retail includes gasoline. ***Visitor tax receipts include all direct sales and excise taxes levied
on visitor spending. Business/employee tax receipts include local property taxes, the state franchise tax, and sales tax
payments attributable to the travel industry generated income of employees.
Odessa MSA
Travel Impacts, 2006-2016p
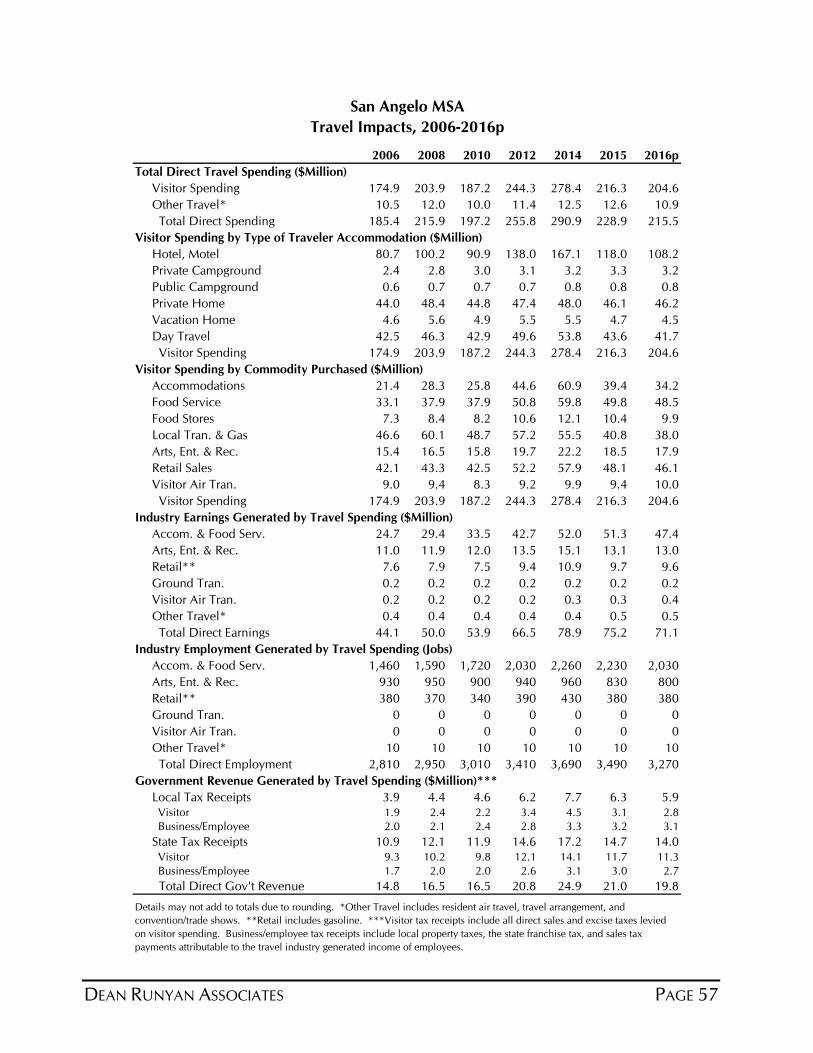
DEAN RUNYAN ASSOCIATES PAGE 57
2006 2008 2010 2012 2014 2015 2016p
Total Direct Travel Spending ($Million)
Visitor Spending 174.9 203.9 187.2 244.3 278.4 216.3 204.6
Other Travel* 10.5 12.0 10.0 11.4 12.5 12.6 10.9
Total Direct Spending 185.4 215.9 197.2 255.8 290.9 228.9 215.5
Visitor Spending by Type of Traveler Accommodation ($Million)
Hotel, Motel 80.7 100.2 90.9 138.0 167.1 118.0 108.2
Private Campground 2.4 2.8 3.0 3.1 3.2 3.3 3.2
Public Campground 0.6 0.7 0.7 0.7 0.8 0.8 0.8
Private Home 44.0 48.4 44.8 47.4 48.0 46.1 46.2
Vacation Home 4.6 5.6 4.9 5.5 5.5 4.7 4.5
Day Travel 42.5 46.3 42.9 49.6 53.8 43.6 41.7
Visitor Spending 174.9 203.9 187.2 244.3 278.4 216.3 204.6
Visitor Spending by Commodity Purchased ($Million)
Accommodations 21.4 28.3 25.8 44.6 60.9 39.4 34.2
Food Service 33.1 37.9 37.9 50.8 59.8 49.8 48.5
Food Stores 7.3 8.4 8.2 10.6 12.1 10.4 9.9
Local Tran. & Gas 46.6 60.1 48.7 57.2 55.5 40.8 38.0
Arts, Ent. & Rec. 15.4 16.5 15.8 19.7 22.2 18.5 17.9
Retail Sales 42.1 43.3 42.5 52.2 57.9 48.1 46.1
Visitor Air Tran. 9.0 9.4 8.3 9.2 9.9 9.4 10.0
Visitor Spending 174.9 203.9 187.2 244.3 278.4 216.3 204.6
Industry Earnings Generated by Travel Spending ($Million)
Accom. & Food Serv. 24.7 29.4 33.5 42.7 52.0 51.3 47.4
Arts, Ent. & Rec. 11.0 11.9 12.0 13.5 15.1 13.1 13.0
Retail** 7.6 7.9 7.5 9.4 10.9 9.7 9.6
Ground Tran. 0.2 0.2 0.2 0.2 0.2 0.2 0.2
Visitor Air Tran. 0.2 0.2 0.2 0.2 0.3 0.3 0.4
Other Travel* 0.4 0.4 0.4 0.4 0.4 0.5 0.5
Total Direct Earnings 44.1 50.0 53.9 66.5 78.9 75.2 71.1
Industry Employment Generated by Travel Spending (Jobs)
Accom. & Food Serv. 1,460 1,590 1,720 2,030 2,260 2,230 2,030
Arts, Ent. & Rec. 930 950 900 940 960 830 800
Retail** 380 370 340 390 430 380 380
Ground Tran. 0 0 0 0 0 0 0
Visitor Air Tran. 0 0 0 0 0 0 0
Other Travel* 10 10 10 10 10 10 10
Total Direct Employment 2,810 2,950 3,010 3,410 3,690 3,490 3,270
Government Revenue Generated by Travel Spending ($Million)***
Local Tax Receipts 3.9 4.4 4.6 6.2 7.7 6.3 5.9 Visitor 1.9 2.4 2.2 3.4 4.5 3.1 2.8
Business/Employee 2.0 2.1 2.4 2.8 3.3 3.2 3.1
State Tax Receipts 10.9 12.1 11.9 14.6 17.2 14.7 14.0 Visitor 9.3 10.2 9.8 12.1 14.1 11.7 11.3
Business/Employee 1.7 2.0 2.0 2.6 3.1 3.0 2.7
Total Direct Gov't Revenue 14.8 16.5 16.5 20.8 24.9 21.0 19.8
San Angelo MSA
Travel Impacts, 2006-2016p
Details may not add to totals due to rounding. *Other Travel includes resident air travel, travel arrangement, and
convention/trade shows. **Retail includes gasoline. ***Visitor tax receipts include all direct sales and excise taxes levied
on visitor spending. Business/employee tax receipts include local property taxes, the state franchise tax, and sales tax
payments attributable to the travel industry generated income of employees.
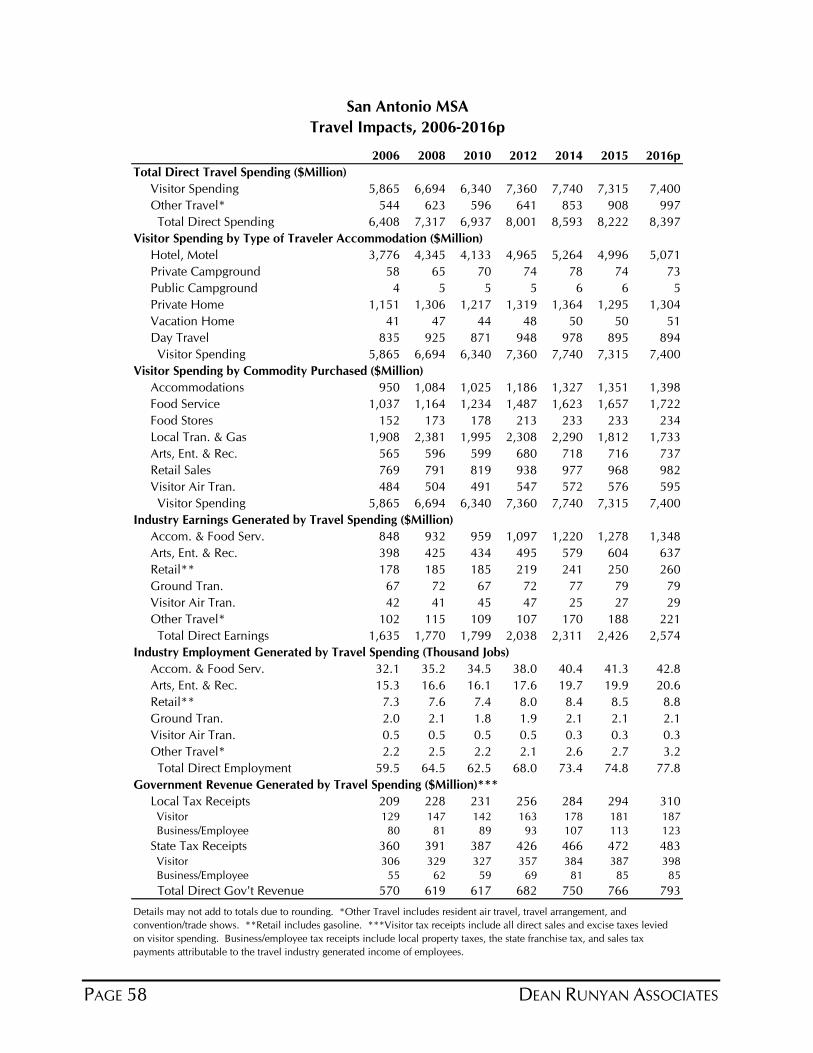
PAGE 58 DEAN RUNYAN ASSOCIATES
2006 2008 2010 2012 2014 2015 2016p
Total Direct Travel Spending ($Million)
Visitor Spending 5,865 6,694 6,340 7,360 7,740 7,315 7,400
Other Travel* 544 623 596 641 853 908 997
Total Direct Spending 6,408 7,317 6,937 8,001 8,593 8,222 8,397
Visitor Spending by Type of Traveler Accommodation ($Million)
Hotel, Motel 3,776 4,345 4,133 4,965 5,264 4,996 5,071
Private Campground 58 65 70 74 78 74 73
Public Campground 4 5 5 5 6 6 5
Private Home 1,151 1,306 1,217 1,319 1,364 1,295 1,304
Vacation Home 41 47 44 48 50 50 51
Day Travel 835 925 871 948 978 895 894
Visitor Spending 5,865 6,694 6,340 7,360 7,740 7,315 7,400
Visitor Spending by Commodity Purchased ($Million)
Accommodations 950 1,084 1,025 1,186 1,327 1,351 1,398
Food Service 1,037 1,164 1,234 1,487 1,623 1,657 1,722
Food Stores 152 173 178 213 233 233 234
Local Tran. & Gas 1,908 2,381 1,995 2,308 2,290 1,812 1,733
Arts, Ent. & Rec. 565 596 599 680 718 716 737
Retail Sales 769 791 819 938 977 968 982
Visitor Air Tran. 484 504 491 547 572 576 595
Visitor Spending 5,865 6,694 6,340 7,360 7,740 7,315 7,400
Industry Earnings Generated by Travel Spending ($Million)
Accom. & Food Serv. 848 932 959 1,097 1,220 1,278 1,348
Arts, Ent. & Rec. 398 425 434 495 579 604 637
Retail** 178 185 185 219 241 250 260
Ground Tran. 67 72 67 72 77 79 79
Visitor Air Tran. 42 41 45 47 25 27 29
Other Travel* 102 115 109 107 170 188 221
Total Direct Earnings 1,635 1,770 1,799 2,038 2,311 2,426 2,574
Industry Employment Generated by Travel Spending (Thousand Jobs)
Accom. & Food Serv. 32.1 35.2 34.5 38.0 40.4 41.3 42.8
Arts, Ent. & Rec. 15.3 16.6 16.1 17.6 19.7 19.9 20.6
Retail** 7.3 7.6 7.4 8.0 8.4 8.5 8.8
Ground Tran. 2.0 2.1 1.8 1.9 2.1 2.1 2.1
Visitor Air Tran. 0.5 0.5 0.5 0.5 0.3 0.3 0.3
Other Travel* 2.2 2.5 2.2 2.1 2.6 2.7 3.2
Total Direct Employment 59.5 64.5 62.5 68.0 73.4 74.8 77.8
Government Revenue Generated by Travel Spending ($Million)***
Local Tax Receipts 209 228 231 256 284 294 310 Visitor 129 147 142 163 178 181 187
Business/Employee 80 81 89 93 107 113 123
State Tax Receipts 360 391 387 426 466 472 483 Visitor 306 329 327 357 384 387 398
Business/Employee 55 62 59 69 81 85 85
Total Direct Gov't Revenue 570 619 617 682 750 766 793
Details may not add to totals due to rounding. *Other Travel includes resident air travel, travel arrangement, and
convention/trade shows. **Retail includes gasoline. ***Visitor tax receipts include all direct sales and excise taxes levied
on visitor spending. Business/employee tax receipts include local property taxes, the state franchise tax, and sales tax
payments attributable to the travel industry generated income of employees.
San Antonio MSA
Travel Impacts, 2006-2016p
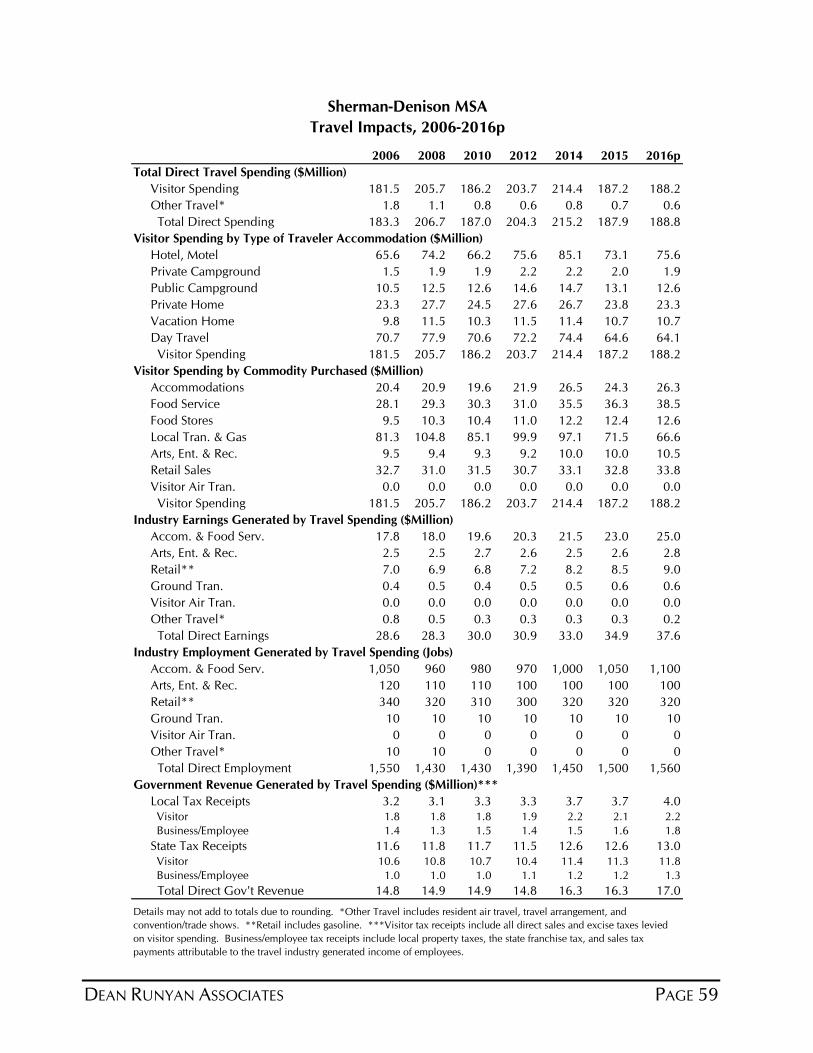
DEAN RUNYAN ASSOCIATES PAGE 59
2006 2008 2010 2012 2014 2015 2016p
Total Direct Travel Spending ($Million)
Visitor Spending 181.5 205.7 186.2 203.7 214.4 187.2 188.2
Other Travel* 1.8 1.1 0.8 0.6 0.8 0.7 0.6
Total Direct Spending 183.3 206.7 187.0 204.3 215.2 187.9 188.8
Visitor Spending by Type of Traveler Accommodation ($Million)
Hotel, Motel 65.6 74.2 66.2 75.6 85.1 73.1 75.6
Private Campground 1.5 1.9 1.9 2.2 2.2 2.0 1.9
Public Campground 10.5 12.5 12.6 14.6 14.7 13.1 12.6
Private Home 23.3 27.7 24.5 27.6 26.7 23.8 23.3
Vacation Home 9.8 11.5 10.3 11.5 11.4 10.7 10.7
Day Travel 70.7 77.9 70.6 72.2 74.4 64.6 64.1
Visitor Spending 181.5 205.7 186.2 203.7 214.4 187.2 188.2
Visitor Spending by Commodity Purchased ($Million)
Accommodations 20.4 20.9 19.6 21.9 26.5 24.3 26.3
Food Service 28.1 29.3 30.3 31.0 35.5 36.3 38.5
Food Stores 9.5 10.3 10.4 11.0 12.2 12.4 12.6
Local Tran. & Gas 81.3 104.8 85.1 99.9 97.1 71.5 66.6
Arts, Ent. & Rec. 9.5 9.4 9.3 9.2 10.0 10.0 10.5
Retail Sales 32.7 31.0 31.5 30.7 33.1 32.8 33.8
Visitor Air Tran. 0.0 0.0 0.0 0.0 0.0 0.0 0.0
Visitor Spending 181.5 205.7 186.2 203.7 214.4 187.2 188.2
Industry Earnings Generated by Travel Spending ($Million)
Accom. & Food Serv. 17.8 18.0 19.6 20.3 21.5 23.0 25.0
Arts, Ent. & Rec. 2.5 2.5 2.7 2.6 2.5 2.6 2.8
Retail** 7.0 6.9 6.8 7.2 8.2 8.5 9.0
Ground Tran. 0.4 0.5 0.4 0.5 0.5 0.6 0.6
Visitor Air Tran. 0.0 0.0 0.0 0.0 0.0 0.0 0.0
Other Travel* 0.8 0.5 0.3 0.3 0.3 0.3 0.2
Total Direct Earnings 28.6 28.3 30.0 30.9 33.0 34.9 37.6
Industry Employment Generated by Travel Spending (Jobs)
Accom. & Food Serv. 1,050 960 980 970 1,000 1,050 1,100
Arts, Ent. & Rec. 120 110 110 100 100 100 100
Retail** 340 320 310 300 320 320 320
Ground Tran. 10 10 10 10 10 10 10
Visitor Air Tran. 0 0 0 0 0 0 0
Other Travel* 10 10 0 0 0 0 0
Total Direct Employment 1,550 1,430 1,430 1,390 1,450 1,500 1,560
Government Revenue Generated by Travel Spending ($Million)***
Local Tax Receipts 3.2 3.1 3.3 3.3 3.7 3.7 4.0 Visitor 1.8 1.8 1.8 1.9 2.2 2.1 2.2
Business/Employee 1.4 1.3 1.5 1.4 1.5 1.6 1.8
State Tax Receipts 11.6 11.8 11.7 11.5 12.6 12.6 13.0 Visitor 10.6 10.8 10.7 10.4 11.4 11.3 11.8
Business/Employee 1.0 1.0 1.0 1.1 1.2 1.2 1.3
Total Direct Gov't Revenue 14.8 14.9 14.9 14.8 16.3 16.3 17.0
Sherman-Denison MSA
Travel Impacts, 2006-2016p
Details may not add to totals due to rounding. *Other Travel includes resident air travel, travel arrangement, and
convention/trade shows. **Retail includes gasoline. ***Visitor tax receipts include all direct sales and excise taxes levied
on visitor spending. Business/employee tax receipts include local property taxes, the state franchise tax, and sales tax
payments attributable to the travel industry generated income of employees.
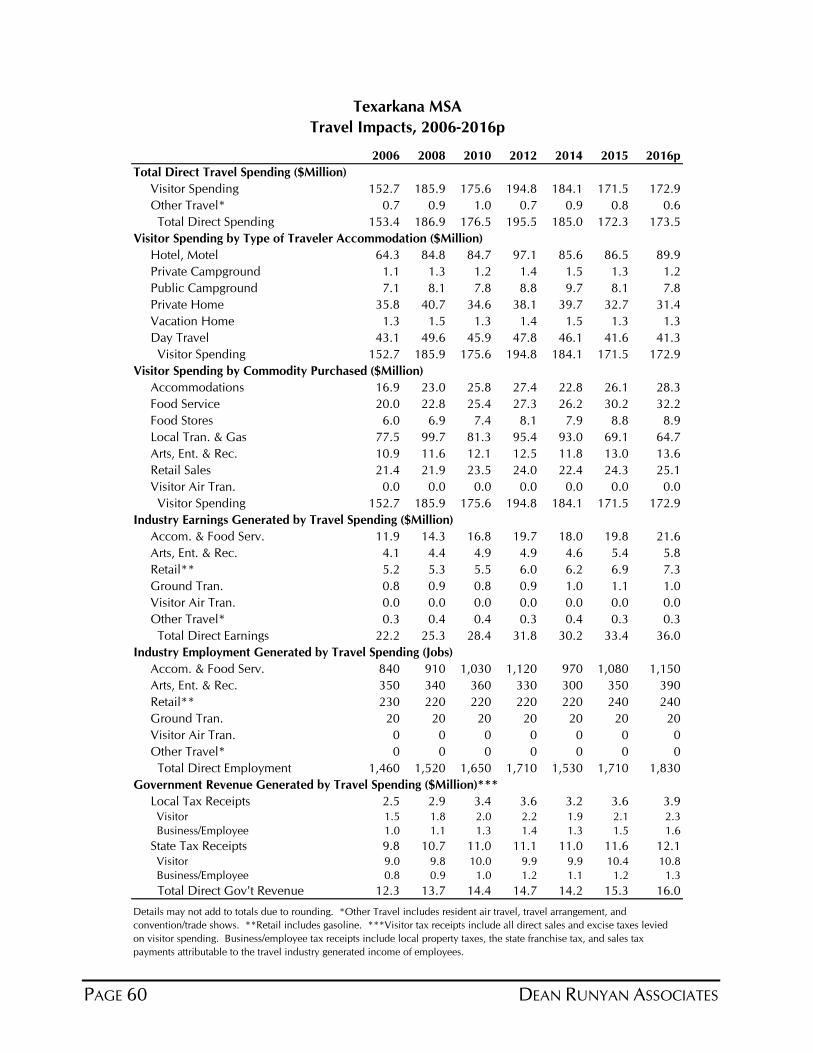
PAGE 60 DEAN RUNYAN ASSOCIATES
2006 2008 2010 2012 2014 2015 2016p
Total Direct Travel Spending ($Million)
Visitor Spending 152.7 185.9 175.6 194.8 184.1 171.5 172.9
Other Travel* 0.7 0.9 1.0 0.7 0.9 0.8 0.6
Total Direct Spending 153.4 186.9 176.5 195.5 185.0 172.3 173.5
Visitor Spending by Type of Traveler Accommodation ($Million)
Hotel, Motel 64.3 84.8 84.7 97.1 85.6 86.5 89.9
Private Campground 1.1 1.3 1.2 1.4 1.5 1.3 1.2
Public Campground 7.1 8.1 7.8 8.8 9.7 8.1 7.8
Private Home 35.8 40.7 34.6 38.1 39.7 32.7 31.4
Vacation Home 1.3 1.5 1.3 1.4 1.5 1.3 1.3
Day Travel 43.1 49.6 45.9 47.8 46.1 41.6 41.3
Visitor Spending 152.7 185.9 175.6 194.8 184.1 171.5 172.9
Visitor Spending by Commodity Purchased ($Million)
Accommodations 16.9 23.0 25.8 27.4 22.8 26.1 28.3
Food Service 20.0 22.8 25.4 27.3 26.2 30.2 32.2
Food Stores 6.0 6.9 7.4 8.1 7.9 8.8 8.9
Local Tran. & Gas 77.5 99.7 81.3 95.4 93.0 69.1 64.7
Arts, Ent. & Rec. 10.9 11.6 12.1 12.5 11.8 13.0 13.6
Retail Sales 21.4 21.9 23.5 24.0 22.4 24.3 25.1
Visitor Air Tran. 0.0 0.0 0.0 0.0 0.0 0.0 0.0
Visitor Spending 152.7 185.9 175.6 194.8 184.1 171.5 172.9
Industry Earnings Generated by Travel Spending ($Million)
Accom. & Food Serv. 11.9 14.3 16.8 19.7 18.0 19.8 21.6
Arts, Ent. & Rec. 4.1 4.4 4.9 4.9 4.6 5.4 5.8
Retail** 5.2 5.3 5.5 6.0 6.2 6.9 7.3
Ground Tran. 0.8 0.9 0.8 0.9 1.0 1.1 1.0
Visitor Air Tran. 0.0 0.0 0.0 0.0 0.0 0.0 0.0
Other Travel* 0.3 0.4 0.4 0.3 0.4 0.3 0.3
Total Direct Earnings 22.2 25.3 28.4 31.8 30.2 33.4 36.0
Industry Employment Generated by Travel Spending (Jobs)
Accom. & Food Serv. 840 910 1,030 1,120 970 1,080 1,150
Arts, Ent. & Rec. 350 340 360 330 300 350 390
Retail** 230 220 220 220 220 240 240
Ground Tran. 20 20 20 20 20 20 20
Visitor Air Tran. 0 0 0 0 0 0 0
Other Travel* 0 0 0 0 0 0 0
Total Direct Employment 1,460 1,520 1,650 1,710 1,530 1,710 1,830
Government Revenue Generated by Travel Spending ($Million)***
Local Tax Receipts 2.5 2.9 3.4 3.6 3.2 3.6 3.9 Visitor 1.5 1.8 2.0 2.2 1.9 2.1 2.3
Business/Employee 1.0 1.1 1.3 1.4 1.3 1.5 1.6
State Tax Receipts 9.8 10.7 11.0 11.1 11.0 11.6 12.1 Visitor 9.0 9.8 10.0 9.9 9.9 10.4 10.8
Business/Employee 0.8 0.9 1.0 1.2 1.1 1.2 1.3
Total Direct Gov't Revenue 12.3 13.7 14.4 14.7 14.2 15.3 16.0
Texarkana MSA
Travel Impacts, 2006-2016p
Details may not add to totals due to rounding. *Other Travel includes resident air travel, travel arrangement, and
convention/trade shows. **Retail includes gasoline. ***Visitor tax receipts include all direct sales and excise taxes levied
on visitor spending. Business/employee tax receipts include local property taxes, the state franchise tax, and sales tax
payments attributable to the travel industry generated income of employees.
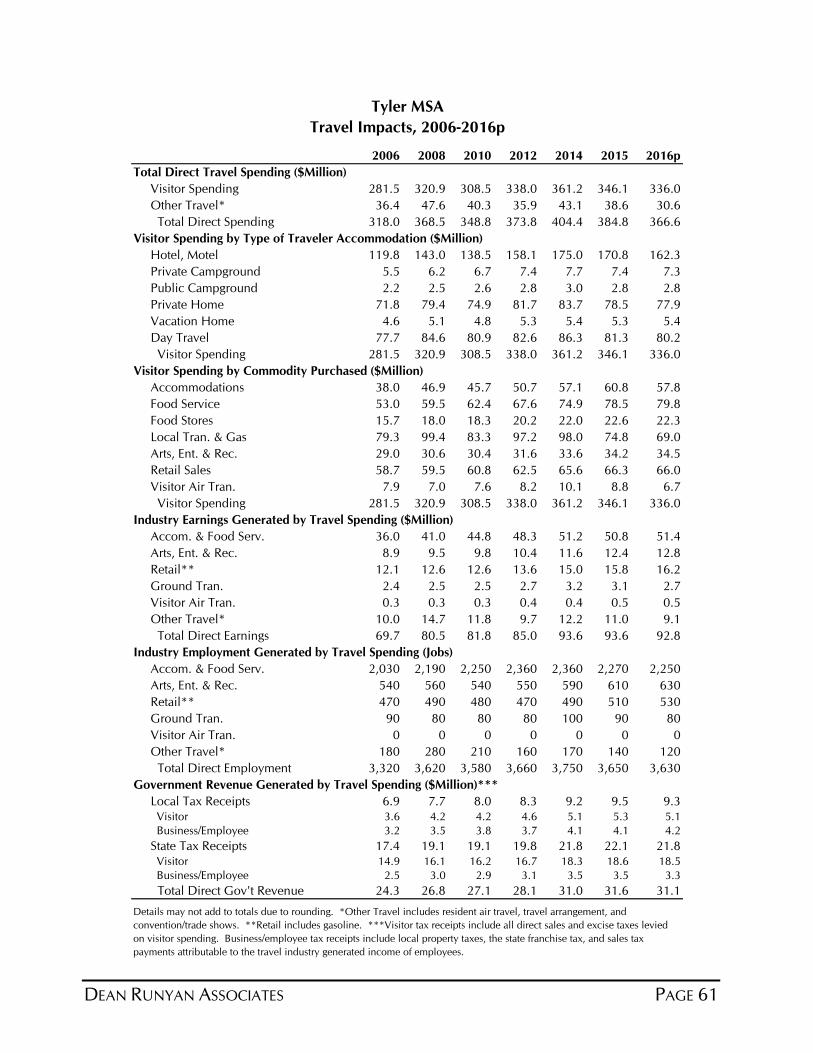
DEAN RUNYAN ASSOCIATES PAGE 61
2006 2008 2010 2012 2014 2015 2016p
Total Direct Travel Spending ($Million)
Visitor Spending 281.5 320.9 308.5 338.0 361.2 346.1 336.0
Other Travel* 36.4 47.6 40.3 35.9 43.1 38.6 30.6
Total Direct Spending 318.0 368.5 348.8 373.8 404.4 384.8 366.6
Visitor Spending by Type of Traveler Accommodation ($Million)
Hotel, Motel 119.8 143.0 138.5 158.1 175.0 170.8 162.3
Private Campground 5.5 6.2 6.7 7.4 7.7 7.4 7.3
Public Campground 2.2 2.5 2.6 2.8 3.0 2.8 2.8
Private Home 71.8 79.4 74.9 81.7 83.7 78.5 77.9
Vacation Home 4.6 5.1 4.8 5.3 5.4 5.3 5.4
Day Travel 77.7 84.6 80.9 82.6 86.3 81.3 80.2
Visitor Spending 281.5 320.9 308.5 338.0 361.2 346.1 336.0
Visitor Spending by Commodity Purchased ($Million)
Accommodations 38.0 46.9 45.7 50.7 57.1 60.8 57.8
Food Service 53.0 59.5 62.4 67.6 74.9 78.5 79.8
Food Stores 15.7 18.0 18.3 20.2 22.0 22.6 22.3
Local Tran. & Gas 79.3 99.4 83.3 97.2 98.0 74.8 69.0
Arts, Ent. & Rec. 29.0 30.6 30.4 31.6 33.6 34.2 34.5
Retail Sales 58.7 59.5 60.8 62.5 65.6 66.3 66.0
Visitor Air Tran. 7.9 7.0 7.6 8.2 10.1 8.8 6.7
Visitor Spending 281.5 320.9 308.5 338.0 361.2 346.1 336.0
Industry Earnings Generated by Travel Spending ($Million)
Accom. & Food Serv. 36.0 41.0 44.8 48.3 51.2 50.8 51.4
Arts, Ent. & Rec. 8.9 9.5 9.8 10.4 11.6 12.4 12.8
Retail** 12.1 12.6 12.6 13.6 15.0 15.8 16.2
Ground Tran. 2.4 2.5 2.5 2.7 3.2 3.1 2.7
Visitor Air Tran. 0.3 0.3 0.3 0.4 0.4 0.5 0.5
Other Travel* 10.0 14.7 11.8 9.7 12.2 11.0 9.1
Total Direct Earnings 69.7 80.5 81.8 85.0 93.6 93.6 92.8
Industry Employment Generated by Travel Spending (Jobs)
Accom. & Food Serv. 2,030 2,190 2,250 2,360 2,360 2,270 2,250
Arts, Ent. & Rec. 540 560 540 550 590 610 630
Retail** 470 490 480 470 490 510 530
Ground Tran. 90 80 80 80 100 90 80
Visitor Air Tran. 0 0 0 0 0 0 0
Other Travel* 180 280 210 160 170 140 120
Total Direct Employment 3,320 3,620 3,580 3,660 3,750 3,650 3,630
Government Revenue Generated by Travel Spending ($Million)***
Local Tax Receipts 6.9 7.7 8.0 8.3 9.2 9.5 9.3 Visitor 3.6 4.2 4.2 4.6 5.1 5.3 5.1
Business/Employee 3.2 3.5 3.8 3.7 4.1 4.1 4.2
State Tax Receipts 17.4 19.1 19.1 19.8 21.8 22.1 21.8 Visitor 14.9 16.1 16.2 16.7 18.3 18.6 18.5
Business/Employee 2.5 3.0 2.9 3.1 3.5 3.5 3.3
Total Direct Gov't Revenue 24.3 26.8 27.1 28.1 31.0 31.6 31.1
Details may not add to totals due to rounding. *Other Travel includes resident air travel, travel arrangement, and
convention/trade shows. **Retail includes gasoline. ***Visitor tax receipts include all direct sales and excise taxes levied
on visitor spending. Business/employee tax receipts include local property taxes, the state franchise tax, and sales tax
payments attributable to the travel industry generated income of employees.
Tyler MSA
Travel Impacts, 2006-2016p
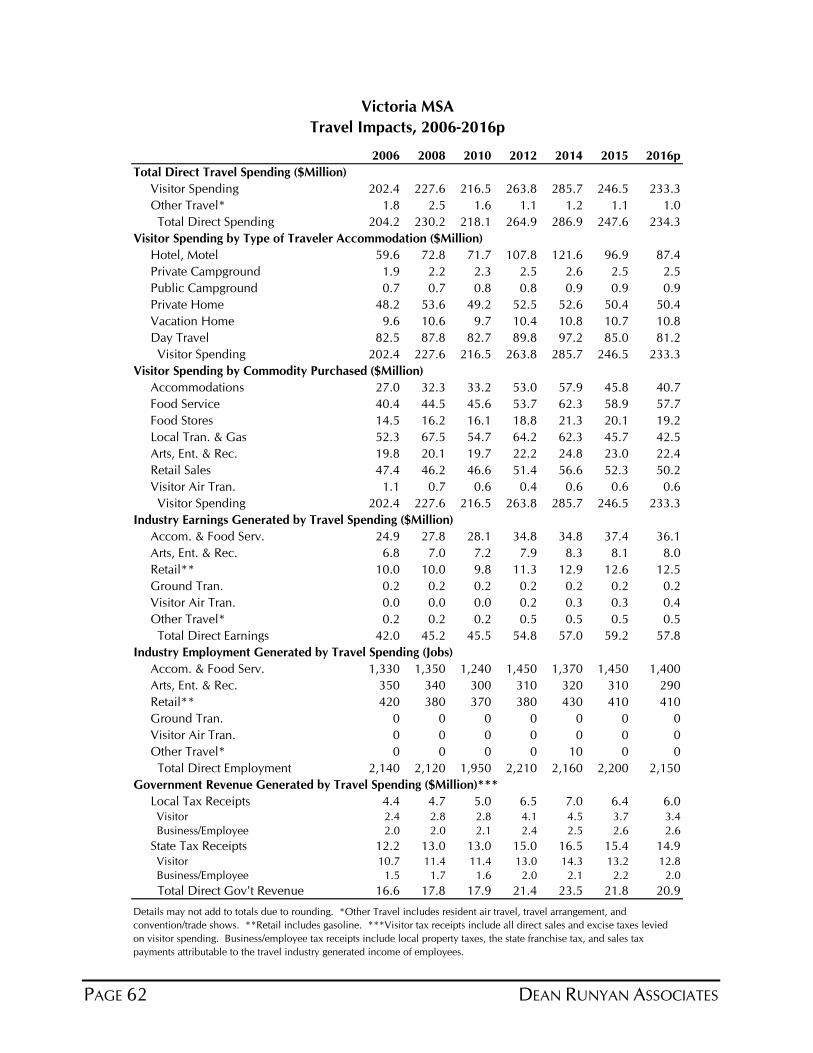
PAGE 62 DEAN RUNYAN ASSOCIATES
2006 2008 2010 2012 2014 2015 2016p
Total Direct Travel Spending ($Million)
Visitor Spending 202.4 227.6 216.5 263.8 285.7 246.5 233.3
Other Travel* 1.8 2.5 1.6 1.1 1.2 1.1 1.0
Total Direct Spending 204.2 230.2 218.1 264.9 286.9 247.6 234.3
Visitor Spending by Type of Traveler Accommodation ($Million)
Hotel, Motel 59.6 72.8 71.7 107.8 121.6 96.9 87.4
Private Campground 1.9 2.2 2.3 2.5 2.6 2.5 2.5
Public Campground 0.7 0.7 0.8 0.8 0.9 0.9 0.9
Private Home 48.2 53.6 49.2 52.5 52.6 50.4 50.4
Vacation Home 9.6 10.6 9.7 10.4 10.8 10.7 10.8
Day Travel 82.5 87.8 82.7 89.8 97.2 85.0 81.2
Visitor Spending 202.4 227.6 216.5 263.8 285.7 246.5 233.3
Visitor Spending by Commodity Purchased ($Million)
Accommodations 27.0 32.3 33.2 53.0 57.9 45.8 40.7
Food Service 40.4 44.5 45.6 53.7 62.3 58.9 57.7
Food Stores 14.5 16.2 16.1 18.8 21.3 20.1 19.2
Local Tran. & Gas 52.3 67.5 54.7 64.2 62.3 45.7 42.5
Arts, Ent. & Rec. 19.8 20.1 19.7 22.2 24.8 23.0 22.4
Retail Sales 47.4 46.2 46.6 51.4 56.6 52.3 50.2
Visitor Air Tran. 1.1 0.7 0.6 0.4 0.6 0.6 0.6
Visitor Spending 202.4 227.6 216.5 263.8 285.7 246.5 233.3
Industry Earnings Generated by Travel Spending ($Million)
Accom. & Food Serv. 24.9 27.8 28.1 34.8 34.8 37.4 36.1
Arts, Ent. & Rec. 6.8 7.0 7.2 7.9 8.3 8.1 8.0
Retail** 10.0 10.0 9.8 11.3 12.9 12.6 12.5
Ground Tran. 0.2 0.2 0.2 0.2 0.2 0.2 0.2
Visitor Air Tran. 0.0 0.0 0.0 0.2 0.3 0.3 0.4
Other Travel* 0.2 0.2 0.2 0.5 0.5 0.5 0.5
Total Direct Earnings 42.0 45.2 45.5 54.8 57.0 59.2 57.8
Industry Employment Generated by Travel Spending (Jobs)
Accom. & Food Serv. 1,330 1,350 1,240 1,450 1,370 1,450 1,400
Arts, Ent. & Rec. 350 340 300 310 320 310 290
Retail** 420 380 370 380 430 410 410
Ground Tran. 0 0 0 0 0 0 0
Visitor Air Tran. 0 0 0 0 0 0 0
Other Travel* 0 0 0 0 10 0 0
Total Direct Employment 2,140 2,120 1,950 2,210 2,160 2,200 2,150
Government Revenue Generated by Travel Spending ($Million)***
Local Tax Receipts 4.4 4.7 5.0 6.5 7.0 6.4 6.0 Visitor 2.4 2.8 2.8 4.1 4.5 3.7 3.4
Business/Employee 2.0 2.0 2.1 2.4 2.5 2.6 2.6
State Tax Receipts 12.2 13.0 13.0 15.0 16.5 15.4 14.9 Visitor 10.7 11.4 11.4 13.0 14.3 13.2 12.8
Business/Employee 1.5 1.7 1.6 2.0 2.1 2.2 2.0
Total Direct Gov't Revenue 16.6 17.8 17.9 21.4 23.5 21.8 20.9
Victoria MSA
Travel Impacts, 2006-2016p
Details may not add to totals due to rounding. *Other Travel includes resident air travel, travel arrangement, and
convention/trade shows. **Retail includes gasoline. ***Visitor tax receipts include all direct sales and excise taxes levied
on visitor spending. Business/employee tax receipts include local property taxes, the state franchise tax, and sales tax
payments attributable to the travel industry generated income of employees.

DEAN RUNYAN ASSOCIATES PAGE 63
2006 2008 2010 2012 2014 2015 2016p
Total Direct Travel Spending ($Million)
Visitor Spending 414.4 460.6 439.8 473.5 507.5 490.8 514.4
Other Travel* 17.9 18.3 18.0 17.2 19.0 17.9 16.7
Total Direct Spending 432.3 478.9 457.8 490.6 526.4 508.7 531.1
Visitor Spending by Type of Traveler Accommodation ($Million)
Hotel, Motel 149.5 172.9 166.9 190.1 214.5 215.6 235.3
Private Campground 4.8 5.5 5.9 6.6 6.8 6.4 6.3
Public Campground 3.6 4.0 4.2 4.7 4.9 4.6 4.5
Private Home 82.8 92.1 85.3 93.7 94.2 87.0 86.6
Vacation Home 2.2 2.5 2.3 2.5 2.6 2.5 2.5
Day Travel 171.6 183.6 175.2 175.9 184.5 174.7 179.3
Visitor Spending 414.4 460.6 439.8 473.5 507.5 490.8 514.4
Visitor Spending by Commodity Purchased ($Million)
Accommodations 49.7 55.3 54.7 60.2 72.4 79.5 90.9
Food Service 76.7 82.9 87.7 92.0 103.3 110.6 119.2
Food Stores 22.5 24.8 25.4 27.2 30.0 31.4 32.5
Local Tran. & Gas 122.8 156.7 128.8 151.0 148.4 112.1 106.0
Arts, Ent. & Rec. 40.7 41.4 41.5 41.8 45.0 46.7 49.5
Retail Sales 94.9 92.6 95.5 94.6 100.4 103.3 107.9
Visitor Air Tran. 7.2 6.8 6.1 6.6 7.9 7.1 8.5
Visitor Spending 414.4 460.6 439.8 473.5 507.5 490.8 514.4
Industry Earnings Generated by Travel Spending ($Million)
Accom. & Food Serv. 47.8 51.1 57.3 62.8 68.9 74.8 83.5
Arts, Ent. & Rec. 16.5 17.0 18.4 17.8 19.2 20.9 22.7
Retail** 17.2 17.2 17.1 18.0 20.1 21.5 22.9
Ground Tran. 2.4 2.6 2.6 2.9 3.1 3.2 3.2
Visitor Air Tran. 0.1 0.1 0.2 0.2 0.2 0.3 0.3
Other Travel* 2.2 2.5 3.0 2.4 2.8 2.6 2.2
Total Direct Earnings 86.3 90.5 98.6 104.1 114.3 123.3 134.9
Industry Employment Generated by Travel Spending (Jobs)
Accom. & Food Serv. 2,580 2,610 2,730 2,860 3,010 3,070 3,330
Arts, Ent. & Rec. 1,280 1,230 1,240 1,140 1,190 1,210 1,250
Retail** 850 840 820 790 830 880 910
Ground Tran. 80 80 70 80 90 90 90
Visitor Air Tran. 0 0 0 0 0 0 0
Other Travel* 70 80 90 60 60 50 40
Total Direct Employment 4,890 4,860 4,970 4,950 5,210 5,330 5,640
Government Revenue Generated by Travel Spending ($Million)***
Local Tax Receipts 9.1 9.4 10.1 10.4 11.8 12.7 14.2 Visitor 5.1 5.5 5.5 5.9 6.8 7.3 8.1
Business/Employee 4.0 3.9 4.6 4.5 5.0 5.4 6.1
State Tax Receipts 25.5 26.8 27.1 27.5 30.3 31.6 33.5 Visitor 22.4 23.4 23.6 23.7 26.0 27.0 28.7
Business/Employee 3.1 3.4 3.5 3.8 4.3 4.6 4.8
Total Direct Gov't Revenue 34.7 36.2 37.2 37.9 42.1 44.4 47.7
Details may not add to totals due to rounding. *Other Travel includes resident air travel, travel arrangement, and
convention/trade shows. **Retail includes gasoline. ***Visitor tax receipts include all direct sales and excise taxes levied
on visitor spending. Business/employee tax receipts include local property taxes, the state franchise tax, and sales tax
payments attributable to the travel industry generated income of employees.
Travel Impacts, 2006-2016p
Waco MSA
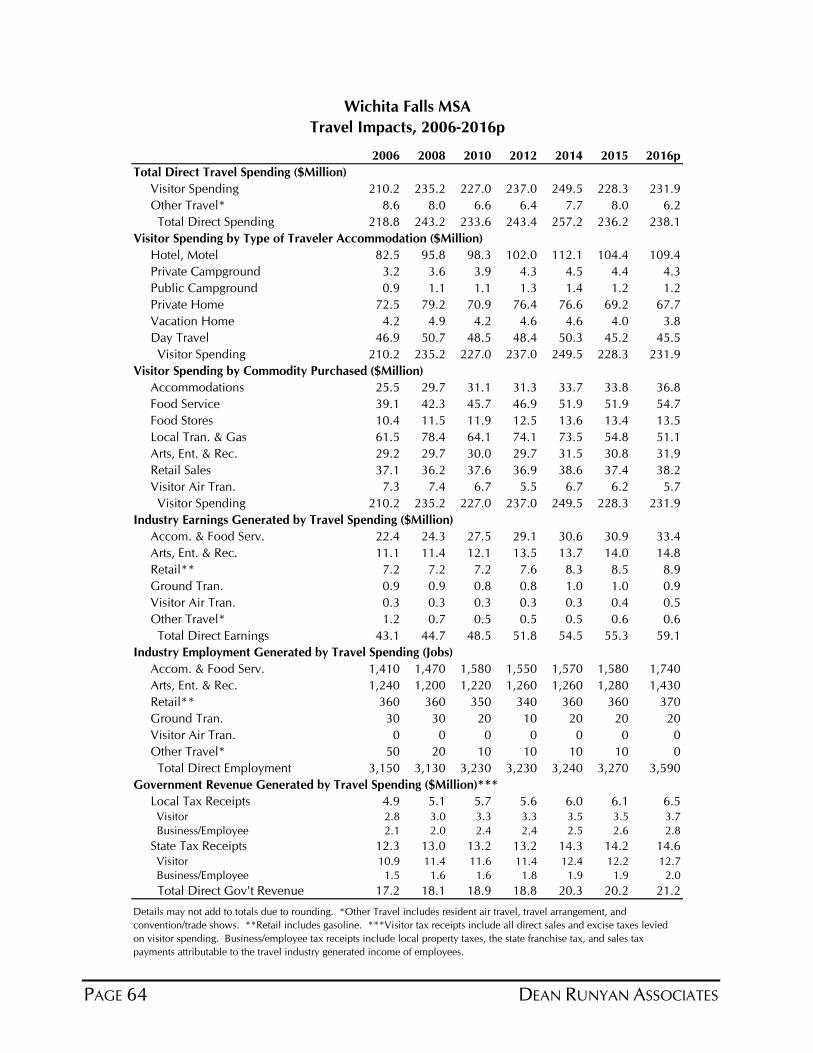
PAGE 64 DEAN RUNYAN ASSOCIATES
2006 2008 2010 2012 2014 2015 2016p
Total Direct Travel Spending ($Million)
Visitor Spending 210.2 235.2 227.0 237.0 249.5 228.3 231.9
Other Travel* 8.6 8.0 6.6 6.4 7.7 8.0 6.2
Total Direct Spending 218.8 243.2 233.6 243.4 257.2 236.2 238.1
Visitor Spending by Type of Traveler Accommodation ($Million)
Hotel, Motel 82.5 95.8 98.3 102.0 112.1 104.4 109.4
Private Campground 3.2 3.6 3.9 4.3 4.5 4.4 4.3
Public Campground 0.9 1.1 1.1 1.3 1.4 1.2 1.2
Private Home 72.5 79.2 70.9 76.4 76.6 69.2 67.7
Vacation Home 4.2 4.9 4.2 4.6 4.6 4.0 3.8
Day Travel 46.9 50.7 48.5 48.4 50.3 45.2 45.5
Visitor Spending 210.2 235.2 227.0 237.0 249.5 228.3 231.9
Visitor Spending by Commodity Purchased ($Million)
Accommodations 25.5 29.7 31.1 31.3 33.7 33.8 36.8
Food Service 39.1 42.3 45.7 46.9 51.9 51.9 54.7
Food Stores 10.4 11.5 11.9 12.5 13.6 13.4 13.5
Local Tran. & Gas 61.5 78.4 64.1 74.1 73.5 54.8 51.1
Arts, Ent. & Rec. 29.2 29.7 30.0 29.7 31.5 30.8 31.9
Retail Sales 37.1 36.2 37.6 36.9 38.6 37.4 38.2
Visitor Air Tran. 7.3 7.4 6.7 5.5 6.7 6.2 5.7
Visitor Spending 210.2 235.2 227.0 237.0 249.5 228.3 231.9
Industry Earnings Generated by Travel Spending ($Million)
Accom. & Food Serv. 22.4 24.3 27.5 29.1 30.6 30.9 33.4
Arts, Ent. & Rec. 11.1 11.4 12.1 13.5 13.7 14.0 14.8
Retail** 7.2 7.2 7.2 7.6 8.3 8.5 8.9
Ground Tran. 0.9 0.9 0.8 0.8 1.0 1.0 0.9
Visitor Air Tran. 0.3 0.3 0.3 0.3 0.3 0.4 0.5
Other Travel* 1.2 0.7 0.5 0.5 0.5 0.6 0.6
Total Direct Earnings 43.1 44.7 48.5 51.8 54.5 55.3 59.1
Industry Employment Generated by Travel Spending (Jobs)
Accom. & Food Serv. 1,410 1,470 1,580 1,550 1,570 1,580 1,740
Arts, Ent. & Rec. 1,240 1,200 1,220 1,260 1,260 1,280 1,430
Retail** 360 360 350 340 360 360 370
Ground Tran. 30 30 20 10 20 20 20
Visitor Air Tran. 0 0 0 0 0 0 0
Other Travel* 50 20 10 10 10 10 0
Total Direct Employment 3,150 3,130 3,230 3,230 3,240 3,270 3,590
Government Revenue Generated by Travel Spending ($Million)***
Local Tax Receipts 4.9 5.1 5.7 5.6 6.0 6.1 6.5 Visitor 2.8 3.0 3.3 3.3 3.5 3.5 3.7
Business/Employee 2.1 2.0 2.4 2.4 2.5 2.6 2.8
State Tax Receipts 12.3 13.0 13.2 13.2 14.3 14.2 14.6 Visitor 10.9 11.4 11.6 11.4 12.4 12.2 12.7
Business/Employee 1.5 1.6 1.6 1.8 1.9 1.9 2.0
Total Direct Gov't Revenue 17.2 18.1 18.9 18.8 20.3 20.2 21.2
Wichita Falls MSA
Travel Impacts, 2006-2016p
Details may not add to totals due to rounding. *Other Travel includes resident air travel, travel arrangement, and
convention/trade shows. **Retail includes gasoline. ***Visitor tax receipts include all direct sales and excise taxes levied
on visitor spending. Business/employee tax receipts include local property taxes, the state franchise tax, and sales tax
payments attributable to the travel industry generated income of employees.
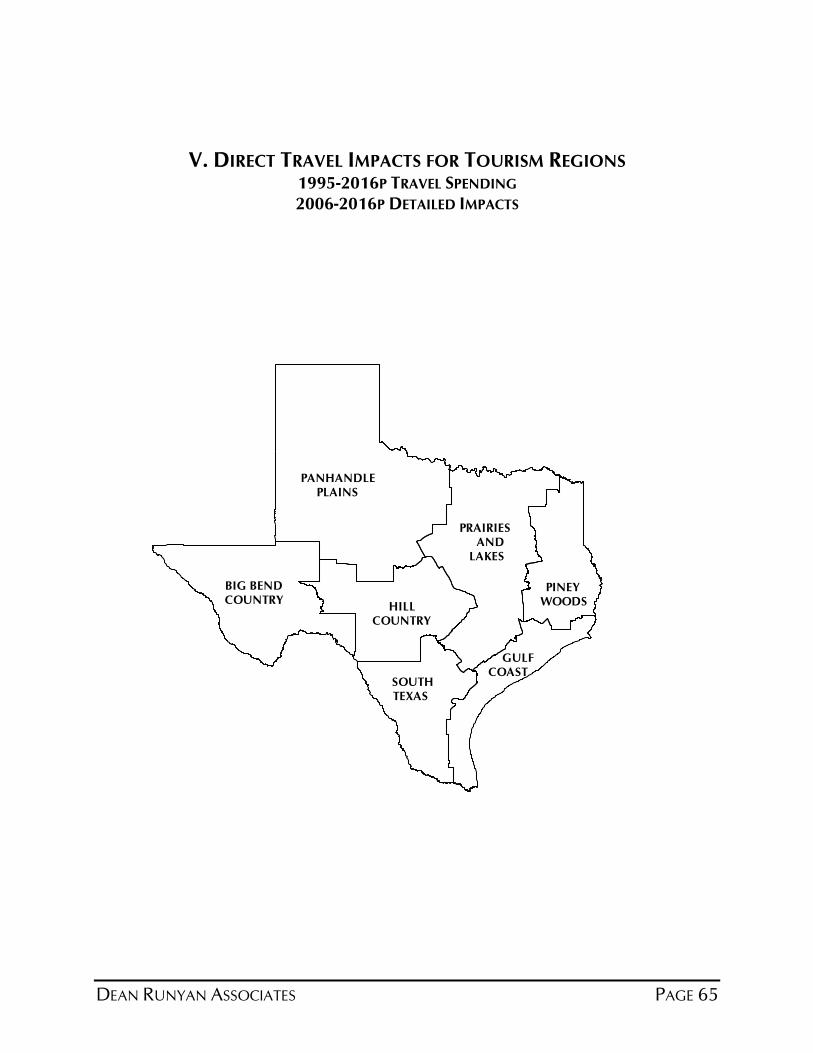
DEAN RUNYAN ASSOCIATES PAGE 65
V. DIRECT TRAVEL IMPACTS FOR TOURISM REGIONS 1995-2016P TRAVEL SPENDING
2006-2016P DETAILED IMPACTS
PANHANDLEPLAINS
BIG BENDCOUNTRY
HILLCOUNTRY
PRAIRIES AND
LAKES
PINEYWOODS
GULFCOAST
SOUTHTEXAS
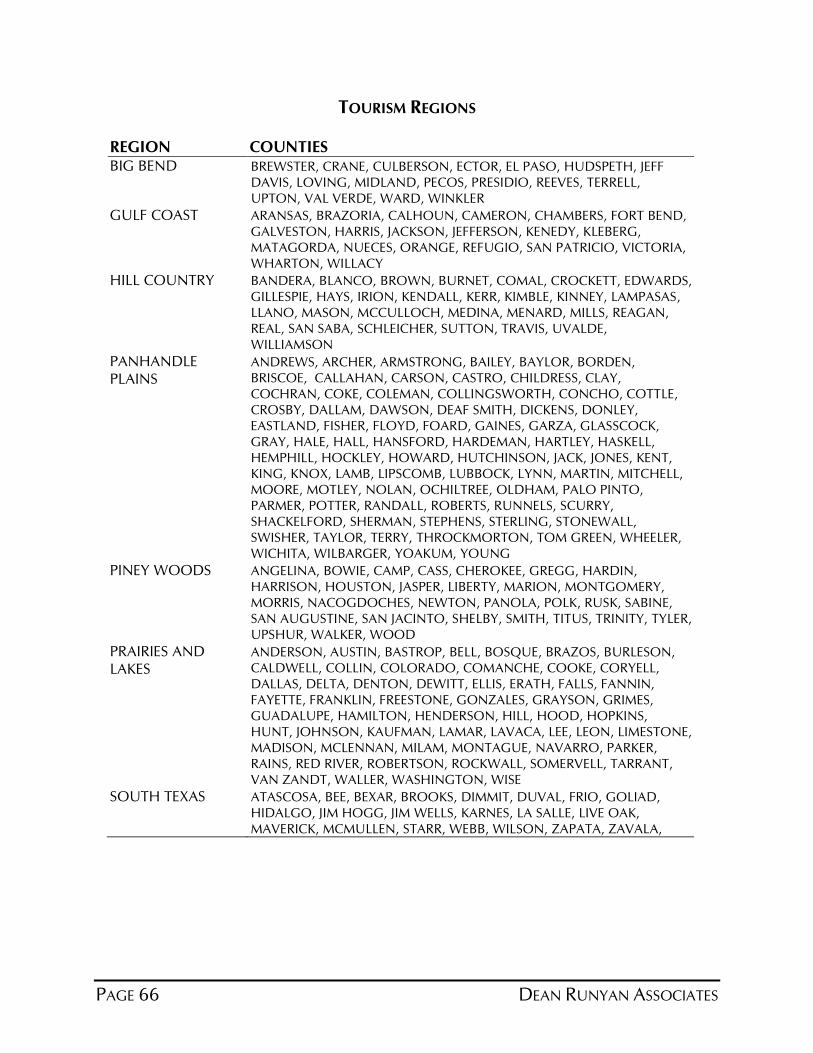
PAGE 66 DEAN RUNYAN ASSOCIATES
TOURISM REGIONS
REGION COUNTIES BIG BEND BREWSTER, CRANE, CULBERSON, ECTOR, EL PASO, HUDSPETH, JEFF
DAVIS, LOVING, MIDLAND, PECOS, PRESIDIO, REEVES, TERRELL,
UPTON, VAL VERDE, WARD, WINKLER
GULF COAST ARANSAS, BRAZORIA, CALHOUN, CAMERON, CHAMBERS, FORT BEND,
GALVESTON, HARRIS, JACKSON, JEFFERSON, KENEDY, KLEBERG,
MATAGORDA, NUECES, ORANGE, REFUGIO, SAN PATRICIO, VICTORIA,
WHARTON, WILLACY
HILL COUNTRY BANDERA, BLANCO, BROWN, BURNET, COMAL, CROCKETT, EDWARDS,
GILLESPIE, HAYS, IRION, KENDALL, KERR, KIMBLE, KINNEY, LAMPASAS,
LLANO, MASON, MCCULLOCH, MEDINA, MENARD, MILLS, REAGAN,
REAL, SAN SABA, SCHLEICHER, SUTTON, TRAVIS, UVALDE,
WILLIAMSON
PANHANDLE
PLAINS ANDREWS, ARCHER, ARMSTRONG, BAILEY, BAYLOR, BORDEN,
BRISCOE, CALLAHAN, CARSON, CASTRO, CHILDRESS, CLAY,
COCHRAN, COKE, COLEMAN, COLLINGSWORTH, CONCHO, COTTLE,
CROSBY, DALLAM, DAWSON, DEAF SMITH, DICKENS, DONLEY,
EASTLAND, FISHER, FLOYD, FOARD, GAINES, GARZA, GLASSCOCK,
GRAY, HALE, HALL, HANSFORD, HARDEMAN, HARTLEY, HASKELL,
HEMPHILL, HOCKLEY, HOWARD, HUTCHINSON, JACK, JONES, KENT,
KING, KNOX, LAMB, LIPSCOMB, LUBBOCK, LYNN, MARTIN, MITCHELL,
MOORE, MOTLEY, NOLAN, OCHILTREE, OLDHAM, PALO PINTO,
PARMER, POTTER, RANDALL, ROBERTS, RUNNELS, SCURRY,
SHACKELFORD, SHERMAN, STEPHENS, STERLING, STONEWALL,
SWISHER, TAYLOR, TERRY, THROCKMORTON, TOM GREEN, WHEELER,
WICHITA, WILBARGER, YOAKUM, YOUNG
PINEY WOODS ANGELINA, BOWIE, CAMP, CASS, CHEROKEE, GREGG, HARDIN,
HARRISON, HOUSTON, JASPER, LIBERTY, MARION, MONTGOMERY,
MORRIS, NACOGDOCHES, NEWTON, PANOLA, POLK, RUSK, SABINE,
SAN AUGUSTINE, SAN JACINTO, SHELBY, SMITH, TITUS, TRINITY, TYLER,
UPSHUR, WALKER, WOOD
PRAIRIES AND
LAKES ANDERSON, AUSTIN, BASTROP, BELL, BOSQUE, BRAZOS, BURLESON,
CALDWELL, COLLIN, COLORADO, COMANCHE, COOKE, CORYELL,
DALLAS, DELTA, DENTON, DEWITT, ELLIS, ERATH, FALLS, FANNIN,
FAYETTE, FRANKLIN, FREESTONE, GONZALES, GRAYSON, GRIMES,
GUADALUPE, HAMILTON, HENDERSON, HILL, HOOD, HOPKINS,
HUNT, JOHNSON, KAUFMAN, LAMAR, LAVACA, LEE, LEON, LIMESTONE,
MADISON, MCLENNAN, MILAM, MONTAGUE, NAVARRO, PARKER,
RAINS, RED RIVER, ROBERTSON, ROCKWALL, SOMERVELL, TARRANT,
VAN ZANDT, WALLER, WASHINGTON, WISE
SOUTH TEXAS ATASCOSA, BEE, BEXAR, BROOKS, DIMMIT, DUVAL, FRIO, GOLIAD,
HIDALGO, JIM HOGG, JIM WELLS, KARNES, LA SALLE, LIVE OAK,
MAVERICK, MCMULLEN, STARR, WEBB, WILSON, ZAPATA, ZAVALA,
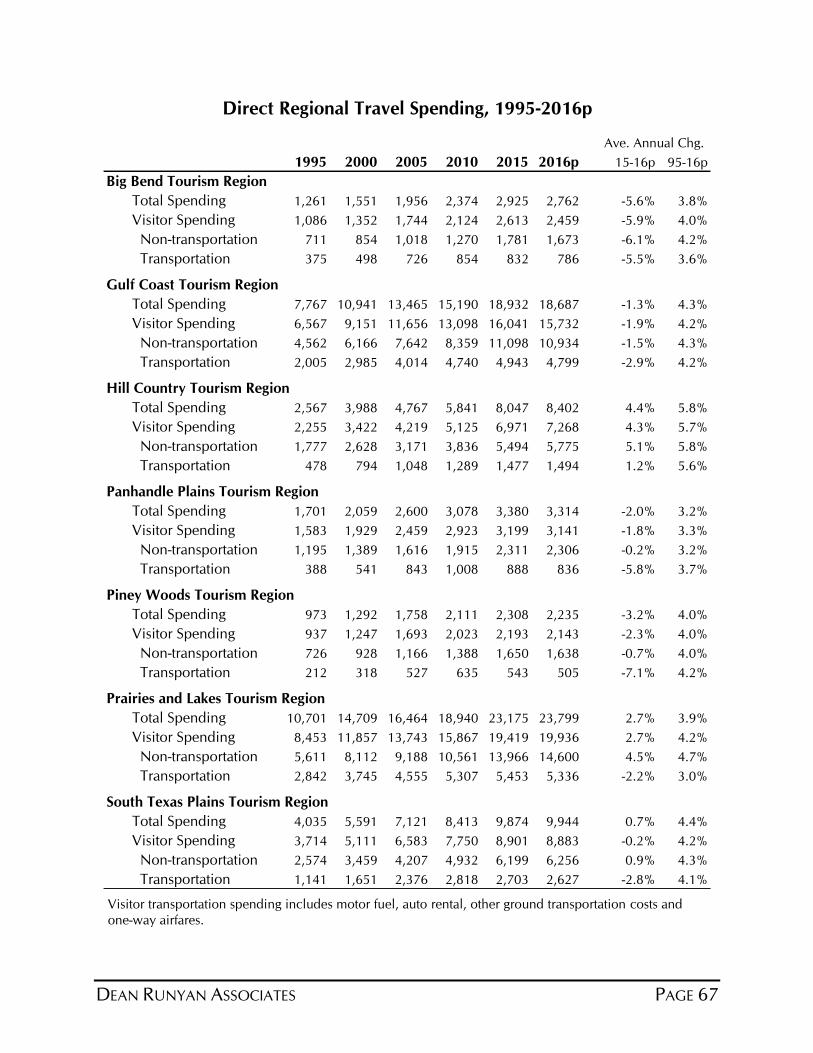
DEAN RUNYAN ASSOCIATES PAGE 67
1995 2000 2005 2010 2015 2016p 15-16p 95-16p
Big Bend Tourism Region
Total Spending 1,261 1,551 1,956 2,374 2,925 2,762 -5.6% 3.8%
Visitor Spending 1,086 1,352 1,744 2,124 2,613 2,459 -5.9% 4.0%
Non-transportation 711 854 1,018 1,270 1,781 1,673 -6.1% 4.2%
Transportation 375 498 726 854 832 786 -5.5% 3.6%
Gulf Coast Tourism Region
Total Spending 7,767 10,941 13,465 15,190 18,932 18,687 -1.3% 4.3%
Visitor Spending 6,567 9,151 11,656 13,098 16,041 15,732 -1.9% 4.2%
Non-transportation 4,562 6,166 7,642 8,359 11,098 10,934 -1.5% 4.3%
Transportation 2,005 2,985 4,014 4,740 4,943 4,799 -2.9% 4.2%
Hill Country Tourism Region
Total Spending 2,567 3,988 4,767 5,841 8,047 8,402 4.4% 5.8%
Visitor Spending 2,255 3,422 4,219 5,125 6,971 7,268 4.3% 5.7%
Non-transportation 1,777 2,628 3,171 3,836 5,494 5,775 5.1% 5.8%
Transportation 478 794 1,048 1,289 1,477 1,494 1.2% 5.6%
Panhandle Plains Tourism Region
Total Spending 1,701 2,059 2,600 3,078 3,380 3,314 -2.0% 3.2%
Visitor Spending 1,583 1,929 2,459 2,923 3,199 3,141 -1.8% 3.3%
Non-transportation 1,195 1,389 1,616 1,915 2,311 2,306 -0.2% 3.2%
Transportation 388 541 843 1,008 888 836 -5.8% 3.7%
Piney Woods Tourism Region
Total Spending 973 1,292 1,758 2,111 2,308 2,235 -3.2% 4.0%
Visitor Spending 937 1,247 1,693 2,023 2,193 2,143 -2.3% 4.0%
Non-transportation 726 928 1,166 1,388 1,650 1,638 -0.7% 4.0%
Transportation 212 318 527 635 543 505 -7.1% 4.2%
Prairies and Lakes Tourism Region
Total Spending 10,701 14,709 16,464 18,940 23,175 23,799 2.7% 3.9%
Visitor Spending 8,453 11,857 13,743 15,867 19,419 19,936 2.7% 4.2%
Non-transportation 5,611 8,112 9,188 10,561 13,966 14,600 4.5% 4.7%
Transportation 2,842 3,745 4,555 5,307 5,453 5,336 -2.2% 3.0%
South Texas Plains Tourism Region
Total Spending 4,035 5,591 7,121 8,413 9,874 9,944 0.7% 4.4%
Visitor Spending 3,714 5,111 6,583 7,750 8,901 8,883 -0.2% 4.2%
Non-transportation 2,574 3,459 4,207 4,932 6,199 6,256 0.9% 4.3%
Transportation 1,141 1,651 2,376 2,818 2,703 2,627 -2.8% 4.1%
Ave. Annual Chg.
Direct Regional Travel Spending, 1995-2016p
Visitor transportation spending includes motor fuel, auto rental, other ground transportation costs and
one-way airfares.
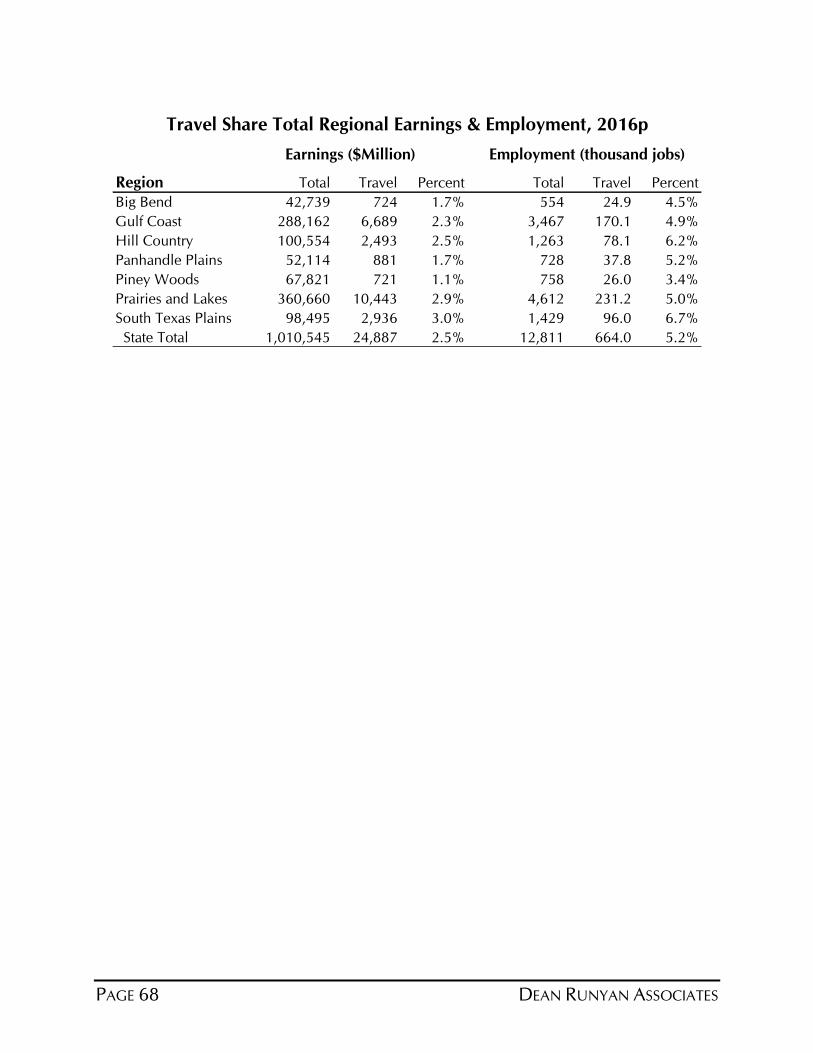
PAGE 68 DEAN RUNYAN ASSOCIATES
Earnings ($Million) Employment (thousand jobs)
Region Total Travel Percent Total Travel Percent
Big Bend 42,739 724 1.7% 554 24.9 4.5%
Gulf Coast 288,162 6,689 2.3% 3,467 170.1 4.9%
Hill Country 100,554 2,493 2.5% 1,263 78.1 6.2%
Panhandle Plains 52,114 881 1.7% 728 37.8 5.2%
Piney Woods 67,821 721 1.1% 758 26.0 3.4%
Prairies and Lakes 360,660 10,443 2.9% 4,612 231.2 5.0%
South Texas Plains 98,495 2,936 3.0% 1,429 96.0 6.7%
State Total 1,010,545 24,887 2.5% 12,811 664.0 5.2%
Travel Share Total Regional Earnings & Employment, 2016p
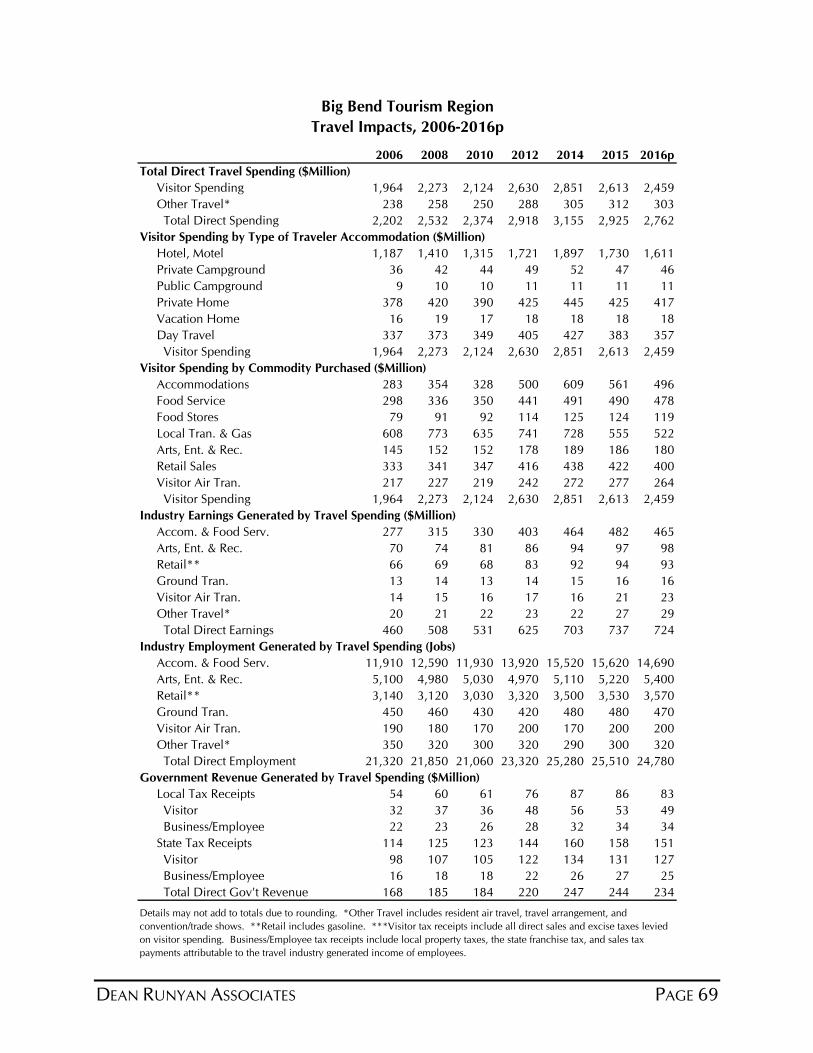
DEAN RUNYAN ASSOCIATES PAGE 69
2006 2008 2010 2012 2014 2015 2016p
Total Direct Travel Spending ($Million)
Visitor Spending 1,964 2,273 2,124 2,630 2,851 2,613 2,459
Other Travel* 238 258 250 288 305 312 303
Total Direct Spending 2,202 2,532 2,374 2,918 3,155 2,925 2,762
Visitor Spending by Type of Traveler Accommodation ($Million)
Hotel, Motel 1,187 1,410 1,315 1,721 1,897 1,730 1,611
Private Campground 36 42 44 49 52 47 46
Public Campground 9 10 10 11 11 11 11
Private Home 378 420 390 425 445 425 417
Vacation Home 16 19 17 18 18 18 18
Day Travel 337 373 349 405 427 383 357
Visitor Spending 1,964 2,273 2,124 2,630 2,851 2,613 2,459
Visitor Spending by Commodity Purchased ($Million)
Accommodations 283 354 328 500 609 561 496
Food Service 298 336 350 441 491 490 478
Food Stores 79 91 92 114 125 124 119
Local Tran. & Gas 608 773 635 741 728 555 522
Arts, Ent. & Rec. 145 152 152 178 189 186 180
Retail Sales 333 341 347 416 438 422 400
Visitor Air Tran. 217 227 219 242 272 277 264
Visitor Spending 1,964 2,273 2,124 2,630 2,851 2,613 2,459
Industry Earnings Generated by Travel Spending ($Million)
Accom. & Food Serv. 277 315 330 403 464 482 465
Arts, Ent. & Rec. 70 74 81 86 94 97 98
Retail** 66 69 68 83 92 94 93
Ground Tran. 13 14 13 14 15 16 16
Visitor Air Tran. 14 15 16 17 16 21 23
Other Travel* 20 21 22 23 22 27 29
Total Direct Earnings 460 508 531 625 703 737 724
Industry Employment Generated by Travel Spending (Jobs)
Accom. & Food Serv. 11,910 12,590 11,930 13,920 15,520 15,620 14,690
Arts, Ent. & Rec. 5,100 4,980 5,030 4,970 5,110 5,220 5,400
Retail** 3,140 3,120 3,030 3,320 3,500 3,530 3,570
Ground Tran. 450 460 430 420 480 480 470
Visitor Air Tran. 190 180 170 200 170 200 200
Other Travel* 350 320 300 320 290 300 320
Total Direct Employment 21,320 21,850 21,060 23,320 25,280 25,510 24,780
Government Revenue Generated by Travel Spending ($Million)
Local Tax Receipts 54 60 61 76 87 86 83
Visitor 32 37 36 48 56 53 49
Business/Employee 22 23 26 28 32 34 34
State Tax Receipts 114 125 123 144 160 158 151
Visitor 98 107 105 122 134 131 127
Business/Employee 16 18 18 22 26 27 25
Total Direct Gov't Revenue 168 185 184 220 247 244 234
Details may not add to totals due to rounding. *Other Travel includes resident air travel, travel arrangement, and
convention/trade shows. **Retail includes gasoline. ***Visitor tax receipts include all direct sales and excise taxes levied
on visitor spending. Business/Employee tax receipts include local property taxes, the state franchise tax, and sales tax
payments attributable to the travel industry generated income of employees.
Big Bend Tourism Region
Travel Impacts, 2006-2016p
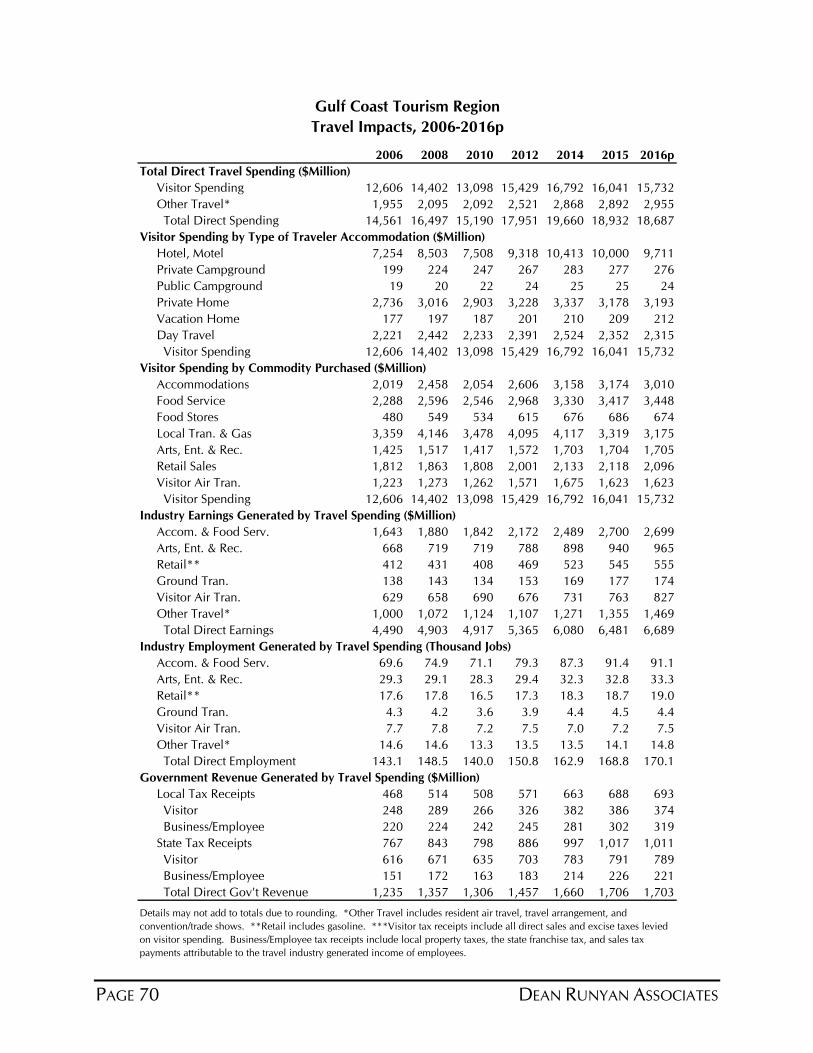
PAGE 70 DEAN RUNYAN ASSOCIATES
2006 2008 2010 2012 2014 2015 2016p
Total Direct Travel Spending ($Million)
Visitor Spending 12,606 14,402 13,098 15,429 16,792 16,041 15,732
Other Travel* 1,955 2,095 2,092 2,521 2,868 2,892 2,955
Total Direct Spending 14,561 16,497 15,190 17,951 19,660 18,932 18,687
Visitor Spending by Type of Traveler Accommodation ($Million)
Hotel, Motel 7,254 8,503 7,508 9,318 10,413 10,000 9,711
Private Campground 199 224 247 267 283 277 276
Public Campground 19 20 22 24 25 25 24
Private Home 2,736 3,016 2,903 3,228 3,337 3,178 3,193
Vacation Home 177 197 187 201 210 209 212
Day Travel 2,221 2,442 2,233 2,391 2,524 2,352 2,315
Visitor Spending 12,606 14,402 13,098 15,429 16,792 16,041 15,732
Visitor Spending by Commodity Purchased ($Million)
Accommodations 2,019 2,458 2,054 2,606 3,158 3,174 3,010
Food Service 2,288 2,596 2,546 2,968 3,330 3,417 3,448
Food Stores 480 549 534 615 676 686 674
Local Tran. & Gas 3,359 4,146 3,478 4,095 4,117 3,319 3,175
Arts, Ent. & Rec. 1,425 1,517 1,417 1,572 1,703 1,704 1,705
Retail Sales 1,812 1,863 1,808 2,001 2,133 2,118 2,096
Visitor Air Tran. 1,223 1,273 1,262 1,571 1,675 1,623 1,623
Visitor Spending 12,606 14,402 13,098 15,429 16,792 16,041 15,732
Industry Earnings Generated by Travel Spending ($Million)
Accom. & Food Serv. 1,643 1,880 1,842 2,172 2,489 2,700 2,699
Arts, Ent. & Rec. 668 719 719 788 898 940 965
Retail** 412 431 408 469 523 545 555
Ground Tran. 138 143 134 153 169 177 174
Visitor Air Tran. 629 658 690 676 731 763 827
Other Travel* 1,000 1,072 1,124 1,107 1,271 1,355 1,469
Total Direct Earnings 4,490 4,903 4,917 5,365 6,080 6,481 6,689
Industry Employment Generated by Travel Spending (Thousand Jobs)
Accom. & Food Serv. 69.6 74.9 71.1 79.3 87.3 91.4 91.1
Arts, Ent. & Rec. 29.3 29.1 28.3 29.4 32.3 32.8 33.3
Retail** 17.6 17.8 16.5 17.3 18.3 18.7 19.0
Ground Tran. 4.3 4.2 3.6 3.9 4.4 4.5 4.4
Visitor Air Tran. 7.7 7.8 7.2 7.5 7.0 7.2 7.5
Other Travel* 14.6 14.6 13.3 13.5 13.5 14.1 14.8
Total Direct Employment 143.1 148.5 140.0 150.8 162.9 168.8 170.1
Government Revenue Generated by Travel Spending ($Million)
Local Tax Receipts 468 514 508 571 663 688 693
Visitor 248 289 266 326 382 386 374
Business/Employee 220 224 242 245 281 302 319
State Tax Receipts 767 843 798 886 997 1,017 1,011
Visitor 616 671 635 703 783 791 789
Business/Employee 151 172 163 183 214 226 221
Total Direct Gov't Revenue 1,235 1,357 1,306 1,457 1,660 1,706 1,703
Gulf Coast Tourism Region
Travel Impacts, 2006-2016p
Details may not add to totals due to rounding. *Other Travel includes resident air travel, travel arrangement, and
convention/trade shows. **Retail includes gasoline. ***Visitor tax receipts include all direct sales and excise taxes levied
on visitor spending. Business/Employee tax receipts include local property taxes, the state franchise tax, and sales tax
payments attributable to the travel industry generated income of employees.
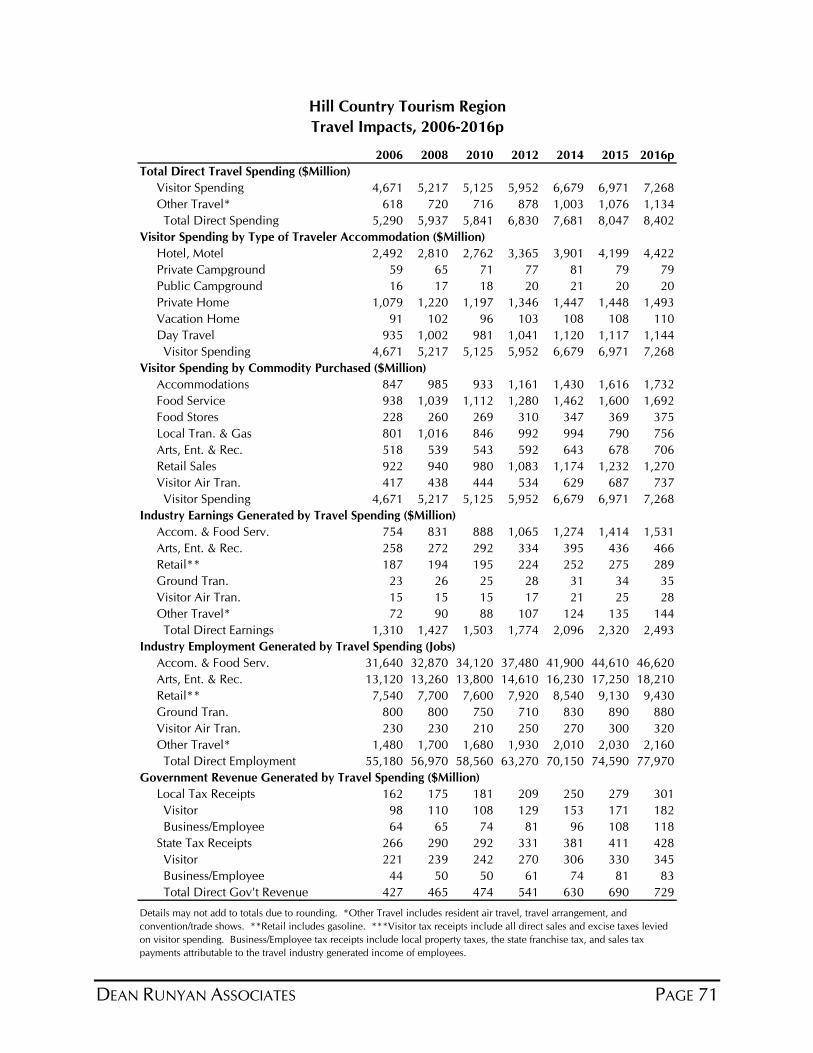
DEAN RUNYAN ASSOCIATES PAGE 71
2006 2008 2010 2012 2014 2015 2016p
Total Direct Travel Spending ($Million)
Visitor Spending 4,671 5,217 5,125 5,952 6,679 6,971 7,268
Other Travel* 618 720 716 878 1,003 1,076 1,134
Total Direct Spending 5,290 5,937 5,841 6,830 7,681 8,047 8,402
Visitor Spending by Type of Traveler Accommodation ($Million)
Hotel, Motel 2,492 2,810 2,762 3,365 3,901 4,199 4,422
Private Campground 59 65 71 77 81 79 79
Public Campground 16 17 18 20 21 20 20
Private Home 1,079 1,220 1,197 1,346 1,447 1,448 1,493
Vacation Home 91 102 96 103 108 108 110
Day Travel 935 1,002 981 1,041 1,120 1,117 1,144
Visitor Spending 4,671 5,217 5,125 5,952 6,679 6,971 7,268
Visitor Spending by Commodity Purchased ($Million)
Accommodations 847 985 933 1,161 1,430 1,616 1,732
Food Service 938 1,039 1,112 1,280 1,462 1,600 1,692
Food Stores 228 260 269 310 347 369 375
Local Tran. & Gas 801 1,016 846 992 994 790 756
Arts, Ent. & Rec. 518 539 543 592 643 678 706
Retail Sales 922 940 980 1,083 1,174 1,232 1,270
Visitor Air Tran. 417 438 444 534 629 687 737
Visitor Spending 4,671 5,217 5,125 5,952 6,679 6,971 7,268
Industry Earnings Generated by Travel Spending ($Million)
Accom. & Food Serv. 754 831 888 1,065 1,274 1,414 1,531
Arts, Ent. & Rec. 258 272 292 334 395 436 466
Retail** 187 194 195 224 252 275 289
Ground Tran. 23 26 25 28 31 34 35
Visitor Air Tran. 15 15 15 17 21 25 28
Other Travel* 72 90 88 107 124 135 144
Total Direct Earnings 1,310 1,427 1,503 1,774 2,096 2,320 2,493
Industry Employment Generated by Travel Spending (Jobs)
Accom. & Food Serv. 31,640 32,870 34,120 37,480 41,900 44,610 46,620
Arts, Ent. & Rec. 13,120 13,260 13,800 14,610 16,230 17,250 18,210
Retail** 7,540 7,700 7,600 7,920 8,540 9,130 9,430
Ground Tran. 800 800 750 710 830 890 880
Visitor Air Tran. 230 230 210 250 270 300 320
Other Travel* 1,480 1,700 1,680 1,930 2,010 2,030 2,160
Total Direct Employment 55,180 56,970 58,560 63,270 70,150 74,590 77,970
Government Revenue Generated by Travel Spending ($Million)
Local Tax Receipts 162 175 181 209 250 279 301
Visitor 98 110 108 129 153 171 182
Business/Employee 64 65 74 81 96 108 118
State Tax Receipts 266 290 292 331 381 411 428
Visitor 221 239 242 270 306 330 345
Business/Employee 44 50 50 61 74 81 83
Total Direct Gov't Revenue 427 465 474 541 630 690 729
Travel Impacts, 2006-2016p
Hill Country Tourism Region
Details may not add to totals due to rounding. *Other Travel includes resident air travel, travel arrangement, and
convention/trade shows. **Retail includes gasoline. ***Visitor tax receipts include all direct sales and excise taxes levied
on visitor spending. Business/Employee tax receipts include local property taxes, the state franchise tax, and sales tax
payments attributable to the travel industry generated income of employees.
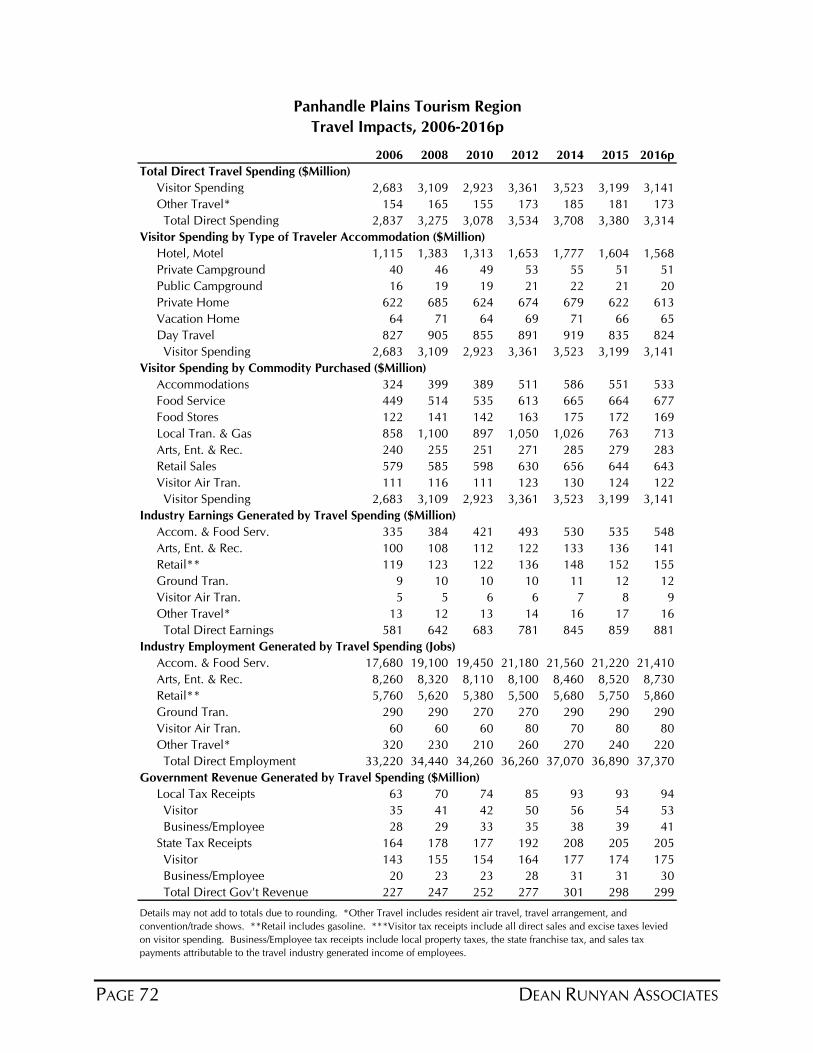
PAGE 72 DEAN RUNYAN ASSOCIATES
2006 2008 2010 2012 2014 2015 2016p
Total Direct Travel Spending ($Million)
Visitor Spending 2,683 3,109 2,923 3,361 3,523 3,199 3,141
Other Travel* 154 165 155 173 185 181 173
Total Direct Spending 2,837 3,275 3,078 3,534 3,708 3,380 3,314
Visitor Spending by Type of Traveler Accommodation ($Million)
Hotel, Motel 1,115 1,383 1,313 1,653 1,777 1,604 1,568
Private Campground 40 46 49 53 55 51 51
Public Campground 16 19 19 21 22 21 20
Private Home 622 685 624 674 679 622 613
Vacation Home 64 71 64 69 71 66 65
Day Travel 827 905 855 891 919 835 824
Visitor Spending 2,683 3,109 2,923 3,361 3,523 3,199 3,141
Visitor Spending by Commodity Purchased ($Million)
Accommodations 324 399 389 511 586 551 533
Food Service 449 514 535 613 665 664 677
Food Stores 122 141 142 163 175 172 169
Local Tran. & Gas 858 1,100 897 1,050 1,026 763 713
Arts, Ent. & Rec. 240 255 251 271 285 279 283
Retail Sales 579 585 598 630 656 644 643
Visitor Air Tran. 111 116 111 123 130 124 122
Visitor Spending 2,683 3,109 2,923 3,361 3,523 3,199 3,141
Industry Earnings Generated by Travel Spending ($Million)
Accom. & Food Serv. 335 384 421 493 530 535 548
Arts, Ent. & Rec. 100 108 112 122 133 136 141
Retail** 119 123 122 136 148 152 155
Ground Tran. 9 10 10 10 11 12 12
Visitor Air Tran. 5 5 6 6 7 8 9
Other Travel* 13 12 13 14 16 17 16
Total Direct Earnings 581 642 683 781 845 859 881
Industry Employment Generated by Travel Spending (Jobs)
Accom. & Food Serv. 17,680 19,100 19,450 21,180 21,560 21,220 21,410
Arts, Ent. & Rec. 8,260 8,320 8,110 8,100 8,460 8,520 8,730
Retail** 5,760 5,620 5,380 5,500 5,680 5,750 5,860
Ground Tran. 290 290 270 270 290 290 290
Visitor Air Tran. 60 60 60 80 70 80 80
Other Travel* 320 230 210 260 270 240 220
Total Direct Employment 33,220 34,440 34,260 36,260 37,070 36,890 37,370
Government Revenue Generated by Travel Spending ($Million)
Local Tax Receipts 63 70 74 85 93 93 94
Visitor 35 41 42 50 56 54 53
Business/Employee 28 29 33 35 38 39 41
State Tax Receipts 164 178 177 192 208 205 205
Visitor 143 155 154 164 177 174 175
Business/Employee 20 23 23 28 31 31 30
Total Direct Gov't Revenue 227 247 252 277 301 298 299
Panhandle Plains Tourism Region
Travel Impacts, 2006-2016p
Details may not add to totals due to rounding. *Other Travel includes resident air travel, travel arrangement, and
convention/trade shows. **Retail includes gasoline. ***Visitor tax receipts include all direct sales and excise taxes levied
on visitor spending. Business/Employee tax receipts include local property taxes, the state franchise tax, and sales tax
payments attributable to the travel industry generated income of employees.
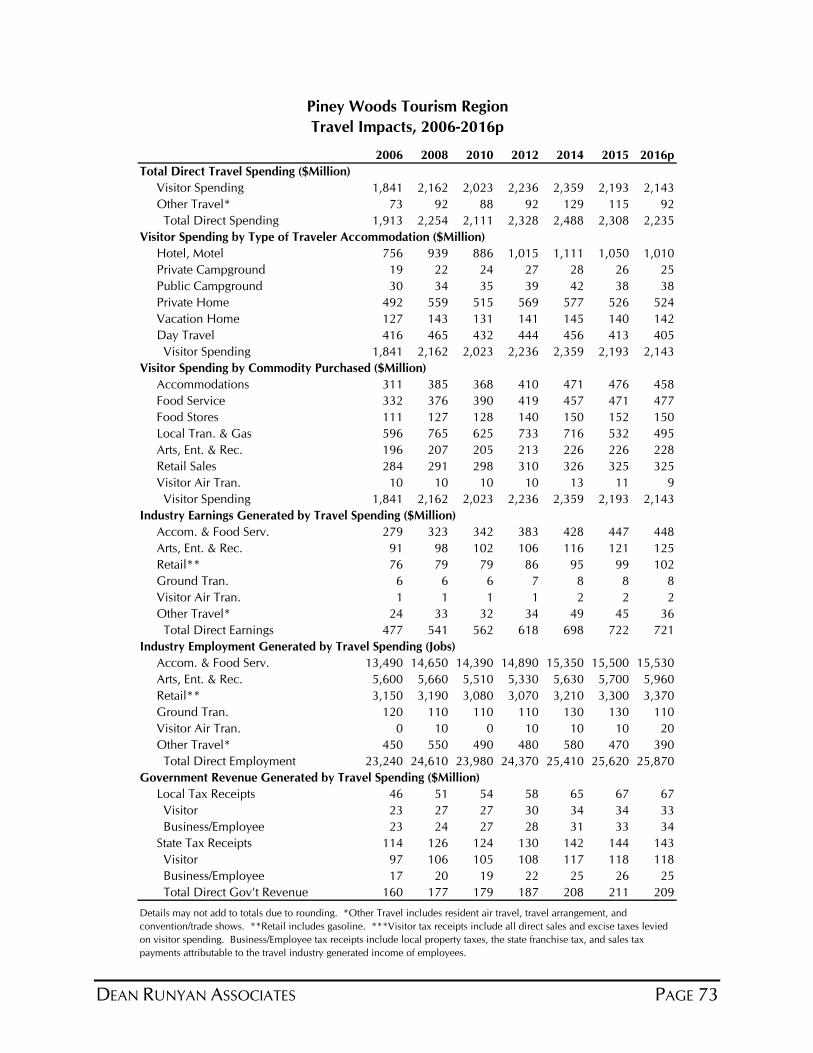
DEAN RUNYAN ASSOCIATES PAGE 73
2006 2008 2010 2012 2014 2015 2016p
Total Direct Travel Spending ($Million)
Visitor Spending 1,841 2,162 2,023 2,236 2,359 2,193 2,143
Other Travel* 73 92 88 92 129 115 92
Total Direct Spending 1,913 2,254 2,111 2,328 2,488 2,308 2,235
Visitor Spending by Type of Traveler Accommodation ($Million)
Hotel, Motel 756 939 886 1,015 1,111 1,050 1,010
Private Campground 19 22 24 27 28 26 25
Public Campground 30 34 35 39 42 38 38
Private Home 492 559 515 569 577 526 524
Vacation Home 127 143 131 141 145 140 142
Day Travel 416 465 432 444 456 413 405
Visitor Spending 1,841 2,162 2,023 2,236 2,359 2,193 2,143
Visitor Spending by Commodity Purchased ($Million)
Accommodations 311 385 368 410 471 476 458
Food Service 332 376 390 419 457 471 477
Food Stores 111 127 128 140 150 152 150
Local Tran. & Gas 596 765 625 733 716 532 495
Arts, Ent. & Rec. 196 207 205 213 226 226 228
Retail Sales 284 291 298 310 326 325 325
Visitor Air Tran. 10 10 10 10 13 11 9
Visitor Spending 1,841 2,162 2,023 2,236 2,359 2,193 2,143
Industry Earnings Generated by Travel Spending ($Million)
Accom. & Food Serv. 279 323 342 383 428 447 448
Arts, Ent. & Rec. 91 98 102 106 116 121 125
Retail** 76 79 79 86 95 99 102
Ground Tran. 6 6 6 7 8 8 8
Visitor Air Tran. 1 1 1 1 2 2 2
Other Travel* 24 33 32 34 49 45 36
Total Direct Earnings 477 541 562 618 698 722 721
Industry Employment Generated by Travel Spending (Jobs)
Accom. & Food Serv. 13,490 14,650 14,390 14,890 15,350 15,500 15,530
Arts, Ent. & Rec. 5,600 5,660 5,510 5,330 5,630 5,700 5,960
Retail** 3,150 3,190 3,080 3,070 3,210 3,300 3,370
Ground Tran. 120 110 110 110 130 130 110
Visitor Air Tran. 0 10 0 10 10 10 20
Other Travel* 450 550 490 480 580 470 390
Total Direct Employment 23,240 24,610 23,980 24,370 25,410 25,620 25,870
Government Revenue Generated by Travel Spending ($Million)
Local Tax Receipts 46 51 54 58 65 67 67
Visitor 23 27 27 30 34 34 33
Business/Employee 23 24 27 28 31 33 34
State Tax Receipts 114 126 124 130 142 144 143
Visitor 97 106 105 108 117 118 118
Business/Employee 17 20 19 22 25 26 25
Total Direct Gov't Revenue 160 177 179 187 208 211 209
Piney Woods Tourism Region
Travel Impacts, 2006-2016p
Details may not add to totals due to rounding. *Other Travel includes resident air travel, travel arrangement, and
convention/trade shows. **Retail includes gasoline. ***Visitor tax receipts include all direct sales and excise taxes levied
on visitor spending. Business/Employee tax receipts include local property taxes, the state franchise tax, and sales tax
payments attributable to the travel industry generated income of employees.
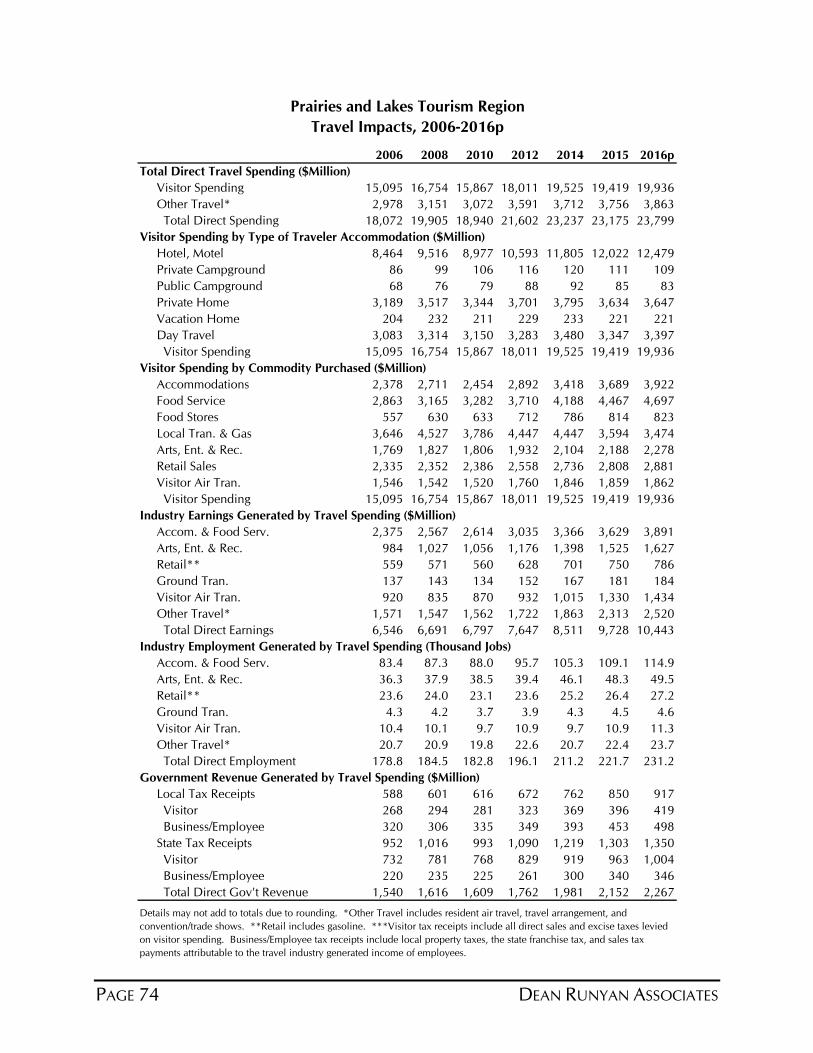
PAGE 74 DEAN RUNYAN ASSOCIATES
2006 2008 2010 2012 2014 2015 2016p
Total Direct Travel Spending ($Million)
Visitor Spending 15,095 16,754 15,867 18,011 19,525 19,419 19,936
Other Travel* 2,978 3,151 3,072 3,591 3,712 3,756 3,863
Total Direct Spending 18,072 19,905 18,940 21,602 23,237 23,175 23,799
Visitor Spending by Type of Traveler Accommodation ($Million)
Hotel, Motel 8,464 9,516 8,977 10,593 11,805 12,022 12,479
Private Campground 86 99 106 116 120 111 109
Public Campground 68 76 79 88 92 85 83
Private Home 3,189 3,517 3,344 3,701 3,795 3,634 3,647
Vacation Home 204 232 211 229 233 221 221
Day Travel 3,083 3,314 3,150 3,283 3,480 3,347 3,397
Visitor Spending 15,095 16,754 15,867 18,011 19,525 19,419 19,936
Visitor Spending by Commodity Purchased ($Million)
Accommodations 2,378 2,711 2,454 2,892 3,418 3,689 3,922
Food Service 2,863 3,165 3,282 3,710 4,188 4,467 4,697
Food Stores 557 630 633 712 786 814 823
Local Tran. & Gas 3,646 4,527 3,786 4,447 4,447 3,594 3,474
Arts, Ent. & Rec. 1,769 1,827 1,806 1,932 2,104 2,188 2,278
Retail Sales 2,335 2,352 2,386 2,558 2,736 2,808 2,881
Visitor Air Tran. 1,546 1,542 1,520 1,760 1,846 1,859 1,862
Visitor Spending 15,095 16,754 15,867 18,011 19,525 19,419 19,936
Industry Earnings Generated by Travel Spending ($Million)
Accom. & Food Serv. 2,375 2,567 2,614 3,035 3,366 3,629 3,891
Arts, Ent. & Rec. 984 1,027 1,056 1,176 1,398 1,525 1,627
Retail** 559 571 560 628 701 750 786
Ground Tran. 137 143 134 152 167 181 184
Visitor Air Tran. 920 835 870 932 1,015 1,330 1,434
Other Travel* 1,571 1,547 1,562 1,722 1,863 2,313 2,520
Total Direct Earnings 6,546 6,691 6,797 7,647 8,511 9,728 10,443
Industry Employment Generated by Travel Spending (Thousand Jobs)
Accom. & Food Serv. 83.4 87.3 88.0 95.7 105.3 109.1 114.9
Arts, Ent. & Rec. 36.3 37.9 38.5 39.4 46.1 48.3 49.5
Retail** 23.6 24.0 23.1 23.6 25.2 26.4 27.2
Ground Tran. 4.3 4.2 3.7 3.9 4.3 4.5 4.6
Visitor Air Tran. 10.4 10.1 9.7 10.9 9.7 10.9 11.3
Other Travel* 20.7 20.9 19.8 22.6 20.7 22.4 23.7
Total Direct Employment 178.8 184.5 182.8 196.1 211.2 221.7 231.2
Government Revenue Generated by Travel Spending ($Million)
Local Tax Receipts 588 601 616 672 762 850 917
Visitor 268 294 281 323 369 396 419
Business/Employee 320 306 335 349 393 453 498
State Tax Receipts 952 1,016 993 1,090 1,219 1,303 1,350
Visitor 732 781 768 829 919 963 1,004
Business/Employee 220 235 225 261 300 340 346
Total Direct Gov't Revenue 1,540 1,616 1,609 1,762 1,981 2,152 2,267
Travel Impacts, 2006-2016p
Details may not add to totals due to rounding. *Other Travel includes resident air travel, travel arrangement, and
convention/trade shows. **Retail includes gasoline. ***Visitor tax receipts include all direct sales and excise taxes levied
on visitor spending. Business/Employee tax receipts include local property taxes, the state franchise tax, and sales tax
payments attributable to the travel industry generated income of employees.
Prairies and Lakes Tourism Region
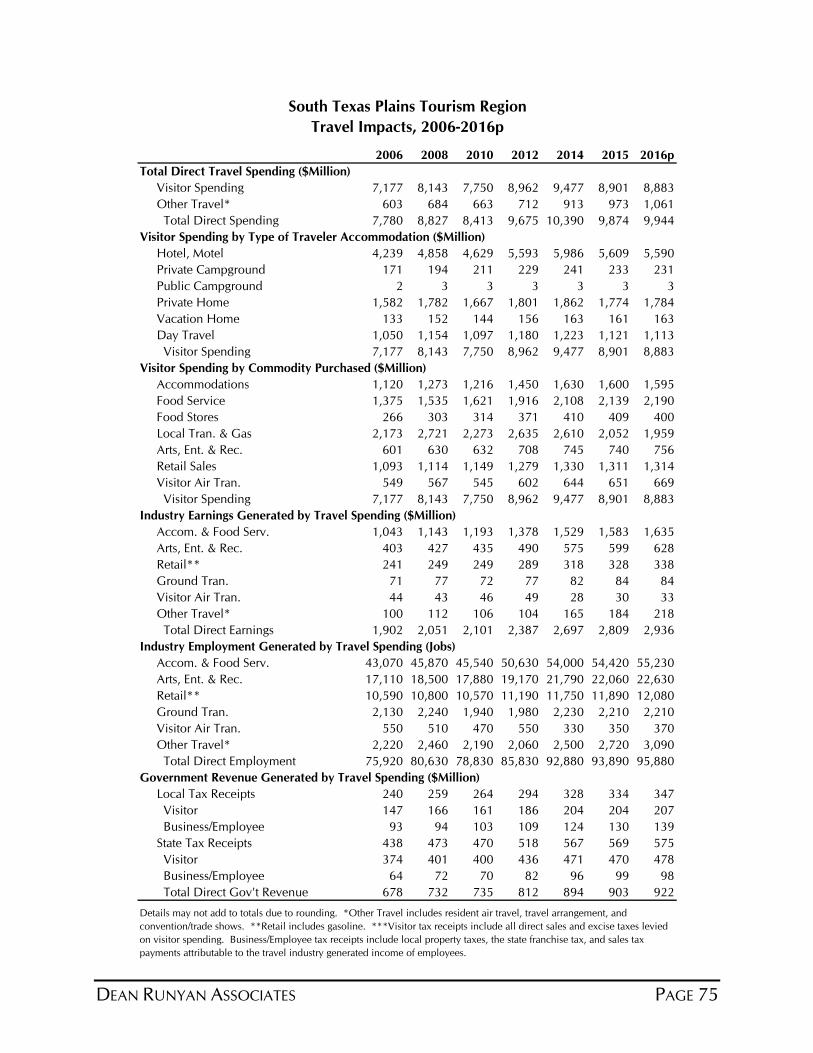
DEAN RUNYAN ASSOCIATES PAGE 75
2006 2008 2010 2012 2014 2015 2016p
Total Direct Travel Spending ($Million)
Visitor Spending 7,177 8,143 7,750 8,962 9,477 8,901 8,883
Other Travel* 603 684 663 712 913 973 1,061
Total Direct Spending 7,780 8,827 8,413 9,675 10,390 9,874 9,944
Visitor Spending by Type of Traveler Accommodation ($Million)
Hotel, Motel 4,239 4,858 4,629 5,593 5,986 5,609 5,590
Private Campground 171 194 211 229 241 233 231
Public Campground 2 3 3 3 3 3 3
Private Home 1,582 1,782 1,667 1,801 1,862 1,774 1,784
Vacation Home 133 152 144 156 163 161 163
Day Travel 1,050 1,154 1,097 1,180 1,223 1,121 1,113
Visitor Spending 7,177 8,143 7,750 8,962 9,477 8,901 8,883
Visitor Spending by Commodity Purchased ($Million)
Accommodations 1,120 1,273 1,216 1,450 1,630 1,600 1,595
Food Service 1,375 1,535 1,621 1,916 2,108 2,139 2,190
Food Stores 266 303 314 371 410 409 400
Local Tran. & Gas 2,173 2,721 2,273 2,635 2,610 2,052 1,959
Arts, Ent. & Rec. 601 630 632 708 745 740 756
Retail Sales 1,093 1,114 1,149 1,279 1,330 1,311 1,314
Visitor Air Tran. 549 567 545 602 644 651 669
Visitor Spending 7,177 8,143 7,750 8,962 9,477 8,901 8,883
Industry Earnings Generated by Travel Spending ($Million)
Accom. & Food Serv. 1,043 1,143 1,193 1,378 1,529 1,583 1,635
Arts, Ent. & Rec. 403 427 435 490 575 599 628
Retail** 241 249 249 289 318 328 338
Ground Tran. 71 77 72 77 82 84 84
Visitor Air Tran. 44 43 46 49 28 30 33
Other Travel* 100 112 106 104 165 184 218
Total Direct Earnings 1,902 2,051 2,101 2,387 2,697 2,809 2,936
Industry Employment Generated by Travel Spending (Jobs)
Accom. & Food Serv. 43,070 45,870 45,540 50,630 54,000 54,420 55,230
Arts, Ent. & Rec. 17,110 18,500 17,880 19,170 21,790 22,060 22,630
Retail** 10,590 10,800 10,570 11,190 11,750 11,890 12,080
Ground Tran. 2,130 2,240 1,940 1,980 2,230 2,210 2,210
Visitor Air Tran. 550 510 470 550 330 350 370
Other Travel* 2,220 2,460 2,190 2,060 2,500 2,720 3,090
Total Direct Employment 75,920 80,630 78,830 85,830 92,880 93,890 95,880
Government Revenue Generated by Travel Spending ($Million)
Local Tax Receipts 240 259 264 294 328 334 347
Visitor 147 166 161 186 204 204 207
Business/Employee 93 94 103 109 124 130 139
State Tax Receipts 438 473 470 518 567 569 575
Visitor 374 401 400 436 471 470 478
Business/Employee 64 72 70 82 96 99 98
Total Direct Gov't Revenue 678 732 735 812 894 903 922
Travel Impacts, 2006-2016p
Details may not add to totals due to rounding. *Other Travel includes resident air travel, travel arrangement, and
convention/trade shows. **Retail includes gasoline. ***Visitor tax receipts include all direct sales and excise taxes levied
on visitor spending. Business/Employee tax receipts include local property taxes, the state franchise tax, and sales tax
payments attributable to the travel industry generated income of employees.
South Texas Plains Tourism Region
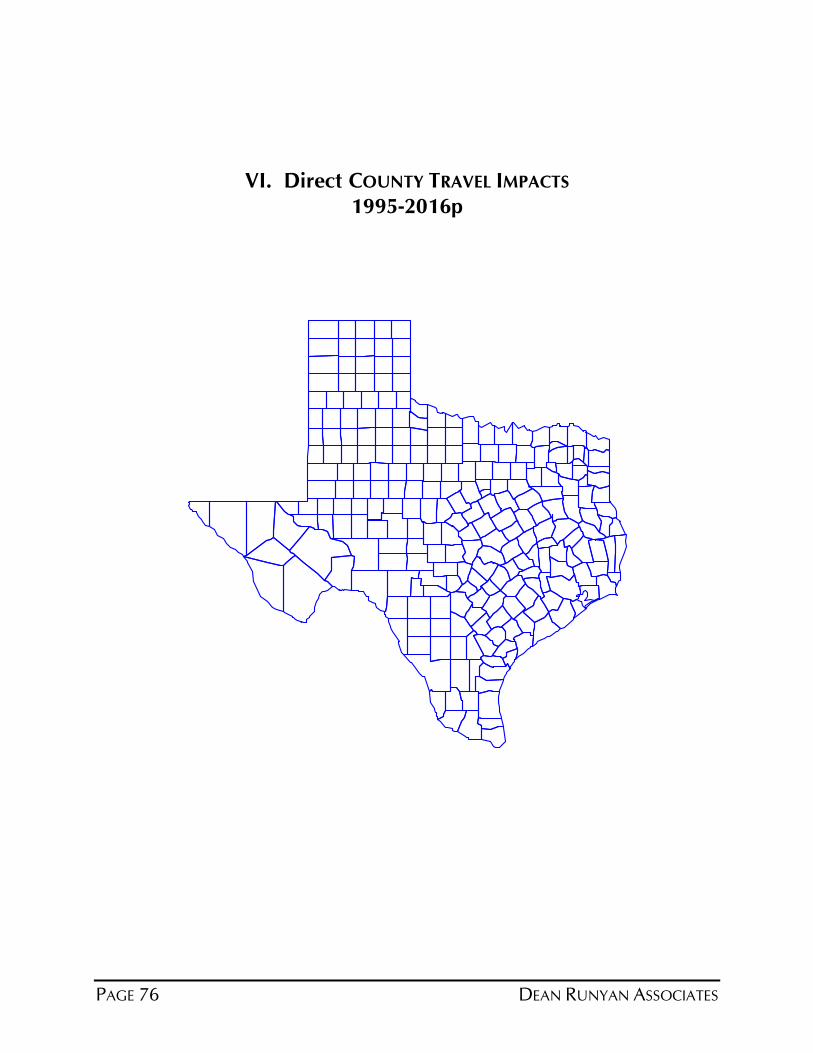
PAGE 76 DEAN RUNYAN ASSOCIATES
VI. Direct COUNTY TRAVEL IMPACTS
1995-2016p
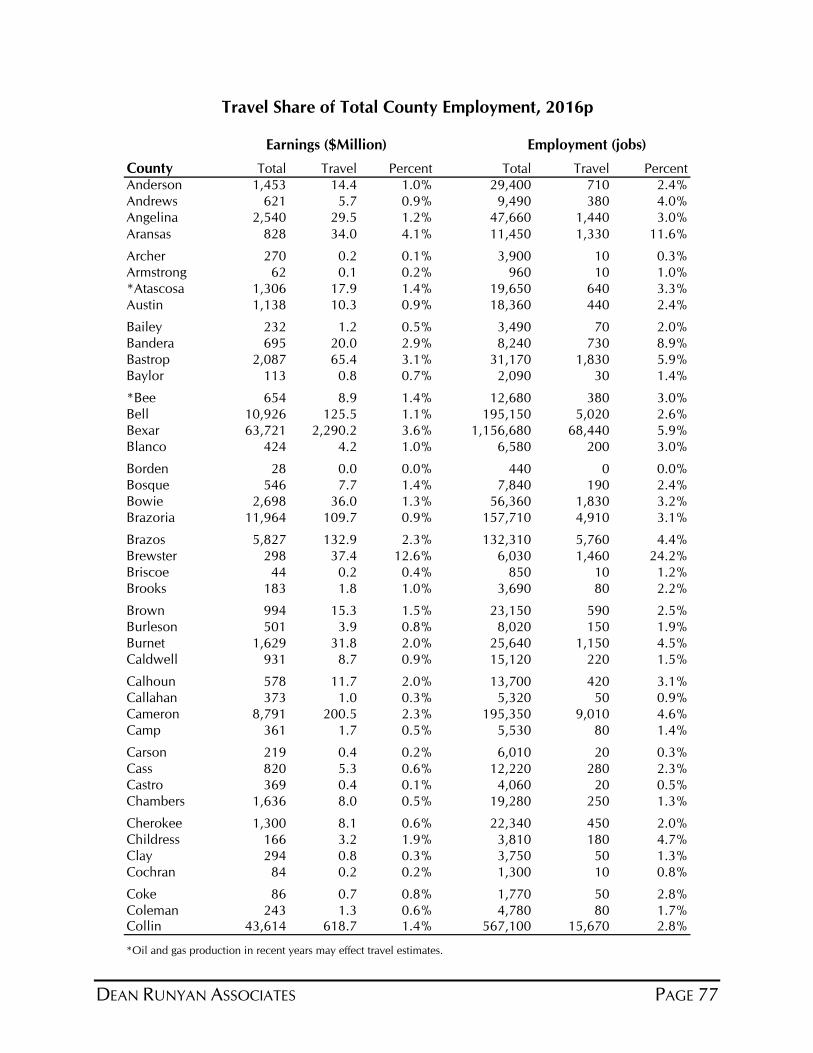
DEAN RUNYAN ASSOCIATES PAGE 77
Earnings ($Million) Employment (jobs)
County Total Travel Percent Total Travel Percent
Anderson 1,453 14.4 1.0% 29,400 710 2.4%
Andrews 621 5.7 0.9% 9,490 380 4.0%
Angelina 2,540 29.5 1.2% 47,660 1,440 3.0%
Aransas 828 34.0 4.1% 11,450 1,330 11.6%
Archer 270 0.2 0.1% 3,900 10 0.3%
Armstrong 62 0.1 0.2% 960 10 1.0%
*Atascosa 1,306 17.9 1.4% 19,650 640 3.3%
Austin 1,138 10.3 0.9% 18,360 440 2.4%
Bailey 232 1.2 0.5% 3,490 70 2.0%
Bandera 695 20.0 2.9% 8,240 730 8.9%
Bastrop 2,087 65.4 3.1% 31,170 1,830 5.9%
Baylor 113 0.8 0.7% 2,090 30 1.4%
*Bee 654 8.9 1.4% 12,680 380 3.0%
Bell 10,926 125.5 1.1% 195,150 5,020 2.6%
Bexar 63,721 2,290.2 3.6% 1,156,680 68,440 5.9%
Blanco 424 4.2 1.0% 6,580 200 3.0%
Borden 28 0.0 0.0% 440 0 0.0%
Bosque 546 7.7 1.4% 7,840 190 2.4%
Bowie 2,698 36.0 1.3% 56,360 1,830 3.2%
Brazoria 11,964 109.7 0.9% 157,710 4,910 3.1%
Brazos 5,827 132.9 2.3% 132,310 5,760 4.4%
Brewster 298 37.4 12.6% 6,030 1,460 24.2%
Briscoe 44 0.2 0.4% 850 10 1.2%
Brooks 183 1.8 1.0% 3,690 80 2.2%
Brown 994 15.3 1.5% 23,150 590 2.5%
Burleson 501 3.9 0.8% 8,020 150 1.9%
Burnet 1,629 31.8 2.0% 25,640 1,150 4.5%
Caldwell 931 8.7 0.9% 15,120 220 1.5%
Calhoun 578 11.7 2.0% 13,700 420 3.1%
Callahan 373 1.0 0.3% 5,320 50 0.9%
Cameron 8,791 200.5 2.3% 195,350 9,010 4.6%
Camp 361 1.7 0.5% 5,530 80 1.4%
Carson 219 0.4 0.2% 6,010 20 0.3%
Cass 820 5.3 0.6% 12,220 280 2.3%
Castro 369 0.4 0.1% 4,060 20 0.5%
Chambers 1,636 8.0 0.5% 19,280 250 1.3%
Cherokee 1,300 8.1 0.6% 22,340 450 2.0%
Childress 166 3.2 1.9% 3,810 180 4.7%
Clay 294 0.8 0.3% 3,750 50 1.3%
Cochran 84 0.2 0.2% 1,300 10 0.8%
Coke 86 0.7 0.8% 1,770 50 2.8%
Coleman 243 1.3 0.6% 4,780 80 1.7%Collin 43,614 618.7 1.4% 567,100 15,670 2.8%
*Oil and gas production in recent years may effect travel estimates.
Travel Share of Total County Employment, 2016p
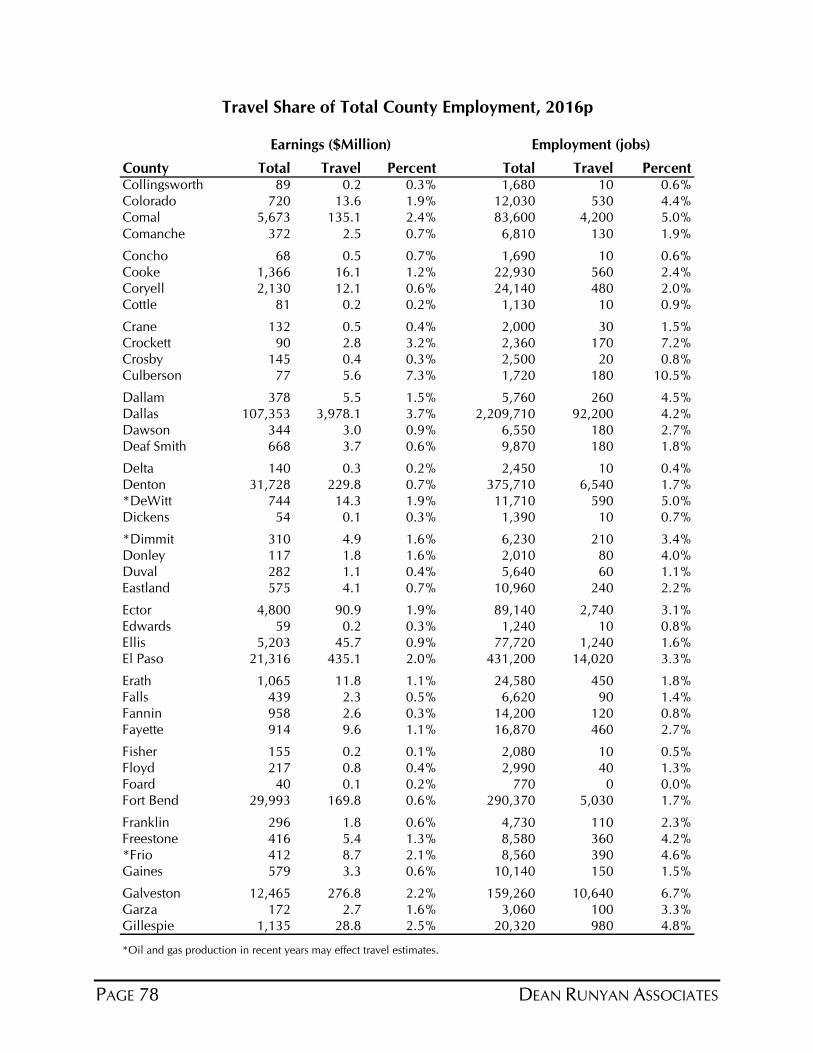
PAGE 78 DEAN RUNYAN ASSOCIATES
Earnings ($Million) Employment (jobs)
County Total Travel Percent Total Travel PercentCollingsworth 89 0.2 0.3% 1,680 10 0.6%
Colorado 720 13.6 1.9% 12,030 530 4.4%
Comal 5,673 135.1 2.4% 83,600 4,200 5.0%
Comanche 372 2.5 0.7% 6,810 130 1.9%
Concho 68 0.5 0.7% 1,690 10 0.6%
Cooke 1,366 16.1 1.2% 22,930 560 2.4%
Coryell 2,130 12.1 0.6% 24,140 480 2.0%
Cottle 81 0.2 0.2% 1,130 10 0.9%
Crane 132 0.5 0.4% 2,000 30 1.5%
Crockett 90 2.8 3.2% 2,360 170 7.2%
Crosby 145 0.4 0.3% 2,500 20 0.8%
Culberson 77 5.6 7.3% 1,720 180 10.5%
Dallam 378 5.5 1.5% 5,760 260 4.5%
Dallas 107,353 3,978.1 3.7% 2,209,710 92,200 4.2%
Dawson 344 3.0 0.9% 6,550 180 2.7%
Deaf Smith 668 3.7 0.6% 9,870 180 1.8%
Delta 140 0.3 0.2% 2,450 10 0.4%
Denton 31,728 229.8 0.7% 375,710 6,540 1.7%
*DeWitt 744 14.3 1.9% 11,710 590 5.0%
Dickens 54 0.1 0.3% 1,390 10 0.7%
*Dimmit 310 4.9 1.6% 6,230 210 3.4%
Donley 117 1.8 1.6% 2,010 80 4.0%
Duval 282 1.1 0.4% 5,640 60 1.1%
Eastland 575 4.1 0.7% 10,960 240 2.2%
Ector 4,800 90.9 1.9% 89,140 2,740 3.1%
Edwards 59 0.2 0.3% 1,240 10 0.8%
Ellis 5,203 45.7 0.9% 77,720 1,240 1.6%
El Paso 21,316 435.1 2.0% 431,200 14,020 3.3%
Erath 1,065 11.8 1.1% 24,580 450 1.8%
Falls 439 2.3 0.5% 6,620 90 1.4%
Fannin 958 2.6 0.3% 14,200 120 0.8%
Fayette 914 9.6 1.1% 16,870 460 2.7%
Fisher 155 0.2 0.1% 2,080 10 0.5%
Floyd 217 0.8 0.4% 2,990 40 1.3%
Foard 40 0.1 0.2% 770 0 0.0%
Fort Bend 29,993 169.8 0.6% 290,370 5,030 1.7%
Franklin 296 1.8 0.6% 4,730 110 2.3%
Freestone 416 5.4 1.3% 8,580 360 4.2%
*Frio 412 8.7 2.1% 8,560 390 4.6%
Gaines 579 3.3 0.6% 10,140 150 1.5%
Galveston 12,465 276.8 2.2% 159,260 10,640 6.7%
Garza 172 2.7 1.6% 3,060 100 3.3%
Gillespie 1,135 28.8 2.5% 20,320 980 4.8%
*Oil and gas production in recent years may effect travel estimates.
Travel Share of Total County Employment, 2016p
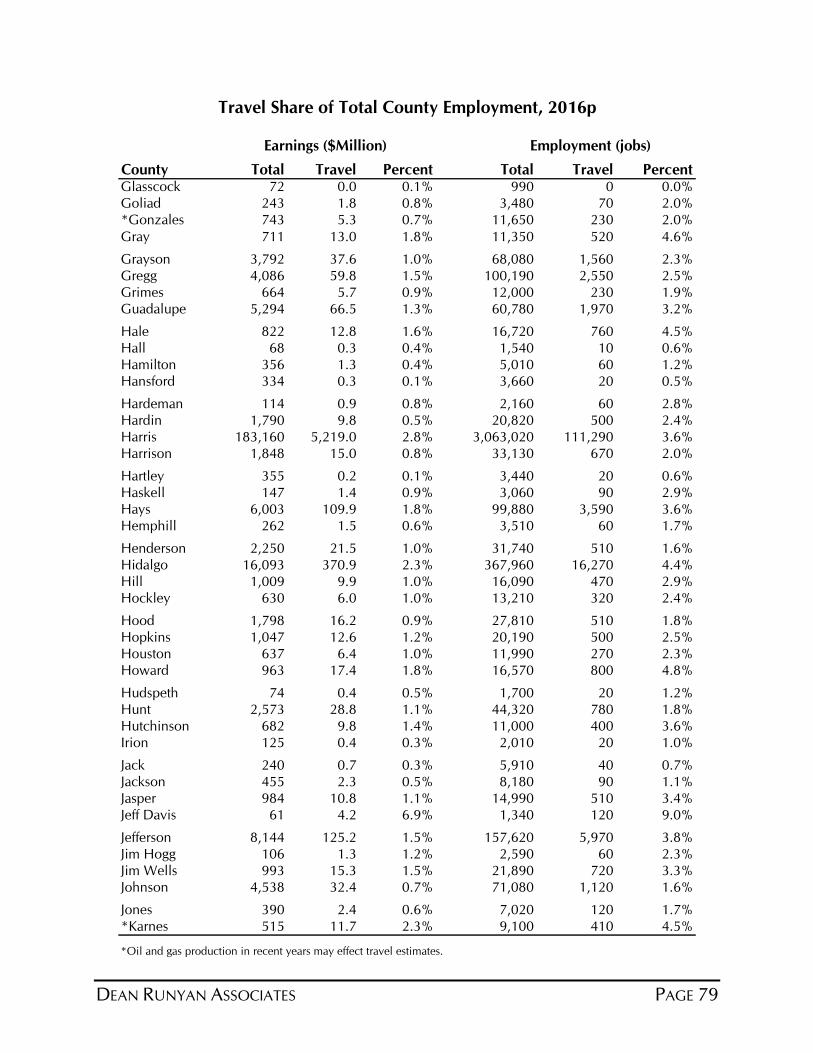
DEAN RUNYAN ASSOCIATES PAGE 79
Earnings ($Million) Employment (jobs)
County Total Travel Percent Total Travel PercentGlasscock 72 0.0 0.1% 990 0 0.0%
Goliad 243 1.8 0.8% 3,480 70 2.0%
*Gonzales 743 5.3 0.7% 11,650 230 2.0%
Gray 711 13.0 1.8% 11,350 520 4.6%
Grayson 3,792 37.6 1.0% 68,080 1,560 2.3%
Gregg 4,086 59.8 1.5% 100,190 2,550 2.5%
Grimes 664 5.7 0.9% 12,000 230 1.9%
Guadalupe 5,294 66.5 1.3% 60,780 1,970 3.2%
Hale 822 12.8 1.6% 16,720 760 4.5%
Hall 68 0.3 0.4% 1,540 10 0.6%
Hamilton 356 1.3 0.4% 5,010 60 1.2%
Hansford 334 0.3 0.1% 3,660 20 0.5%
Hardeman 114 0.9 0.8% 2,160 60 2.8%
Hardin 1,790 9.8 0.5% 20,820 500 2.4%
Harris 183,160 5,219.0 2.8% 3,063,020 111,290 3.6%
Harrison 1,848 15.0 0.8% 33,130 670 2.0%
Hartley 355 0.2 0.1% 3,440 20 0.6%
Haskell 147 1.4 0.9% 3,060 90 2.9%
Hays 6,003 109.9 1.8% 99,880 3,590 3.6%
Hemphill 262 1.5 0.6% 3,510 60 1.7%
Henderson 2,250 21.5 1.0% 31,740 510 1.6%
Hidalgo 16,093 370.9 2.3% 367,960 16,270 4.4%
Hill 1,009 9.9 1.0% 16,090 470 2.9%
Hockley 630 6.0 1.0% 13,210 320 2.4%
Hood 1,798 16.2 0.9% 27,810 510 1.8%
Hopkins 1,047 12.6 1.2% 20,190 500 2.5%
Houston 637 6.4 1.0% 11,990 270 2.3%
Howard 963 17.4 1.8% 16,570 800 4.8%
Hudspeth 74 0.4 0.5% 1,700 20 1.2%
Hunt 2,573 28.8 1.1% 44,320 780 1.8%
Hutchinson 682 9.8 1.4% 11,000 400 3.6%
Irion 125 0.4 0.3% 2,010 20 1.0%
Jack 240 0.7 0.3% 5,910 40 0.7%
Jackson 455 2.3 0.5% 8,180 90 1.1%
Jasper 984 10.8 1.1% 14,990 510 3.4%
Jeff Davis 61 4.2 6.9% 1,340 120 9.0%
Jefferson 8,144 125.2 1.5% 157,620 5,970 3.8%
Jim Hogg 106 1.3 1.2% 2,590 60 2.3%
Jim Wells 993 15.3 1.5% 21,890 720 3.3%
Johnson 4,538 32.4 0.7% 71,080 1,120 1.6%
Jones 390 2.4 0.6% 7,020 120 1.7%
*Karnes 515 11.7 2.3% 9,100 410 4.5%
*Oil and gas production in recent years may effect travel estimates.
Travel Share of Total County Employment, 2016p
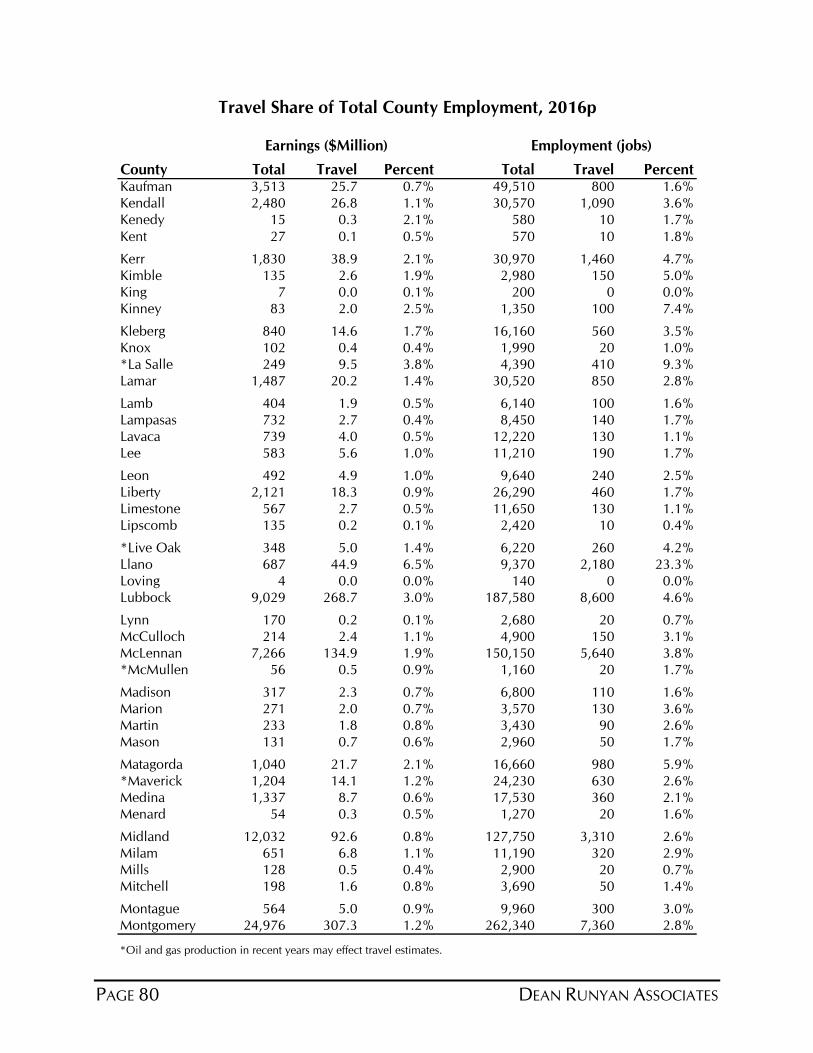
PAGE 80 DEAN RUNYAN ASSOCIATES
Earnings ($Million) Employment (jobs)
County Total Travel Percent Total Travel PercentKaufman 3,513 25.7 0.7% 49,510 800 1.6%
Kendall 2,480 26.8 1.1% 30,570 1,090 3.6%
Kenedy 15 0.3 2.1% 580 10 1.7%
Kent 27 0.1 0.5% 570 10 1.8%
Kerr 1,830 38.9 2.1% 30,970 1,460 4.7%
Kimble 135 2.6 1.9% 2,980 150 5.0%
King 7 0.0 0.1% 200 0 0.0%
Kinney 83 2.0 2.5% 1,350 100 7.4%
Kleberg 840 14.6 1.7% 16,160 560 3.5%
Knox 102 0.4 0.4% 1,990 20 1.0%
*La Salle 249 9.5 3.8% 4,390 410 9.3%
Lamar 1,487 20.2 1.4% 30,520 850 2.8%
Lamb 404 1.9 0.5% 6,140 100 1.6%
Lampasas 732 2.7 0.4% 8,450 140 1.7%
Lavaca 739 4.0 0.5% 12,220 130 1.1%
Lee 583 5.6 1.0% 11,210 190 1.7%
Leon 492 4.9 1.0% 9,640 240 2.5%
Liberty 2,121 18.3 0.9% 26,290 460 1.7%
Limestone 567 2.7 0.5% 11,650 130 1.1%
Lipscomb 135 0.2 0.1% 2,420 10 0.4%
*Live Oak 348 5.0 1.4% 6,220 260 4.2%
Llano 687 44.9 6.5% 9,370 2,180 23.3%
Loving 4 0.0 0.0% 140 0 0.0%
Lubbock 9,029 268.7 3.0% 187,580 8,600 4.6%
Lynn 170 0.2 0.1% 2,680 20 0.7%
McCulloch 214 2.4 1.1% 4,900 150 3.1%
McLennan 7,266 134.9 1.9% 150,150 5,640 3.8%
*McMullen 56 0.5 0.9% 1,160 20 1.7%
Madison 317 2.3 0.7% 6,800 110 1.6%
Marion 271 2.0 0.7% 3,570 130 3.6%
Martin 233 1.8 0.8% 3,430 90 2.6%
Mason 131 0.7 0.6% 2,960 50 1.7%
Matagorda 1,040 21.7 2.1% 16,660 980 5.9%
*Maverick 1,204 14.1 1.2% 24,230 630 2.6%
Medina 1,337 8.7 0.6% 17,530 360 2.1%
Menard 54 0.3 0.5% 1,270 20 1.6%
Midland 12,032 92.6 0.8% 127,750 3,310 2.6%
Milam 651 6.8 1.1% 11,190 320 2.9%
Mills 128 0.5 0.4% 2,900 20 0.7%
Mitchell 198 1.6 0.8% 3,690 50 1.4%
Montague 564 5.0 0.9% 9,960 300 3.0%
Montgomery 24,976 307.3 1.2% 262,340 7,360 2.8%
*Oil and gas production in recent years may effect travel estimates.
Travel Share of Total County Employment, 2016p
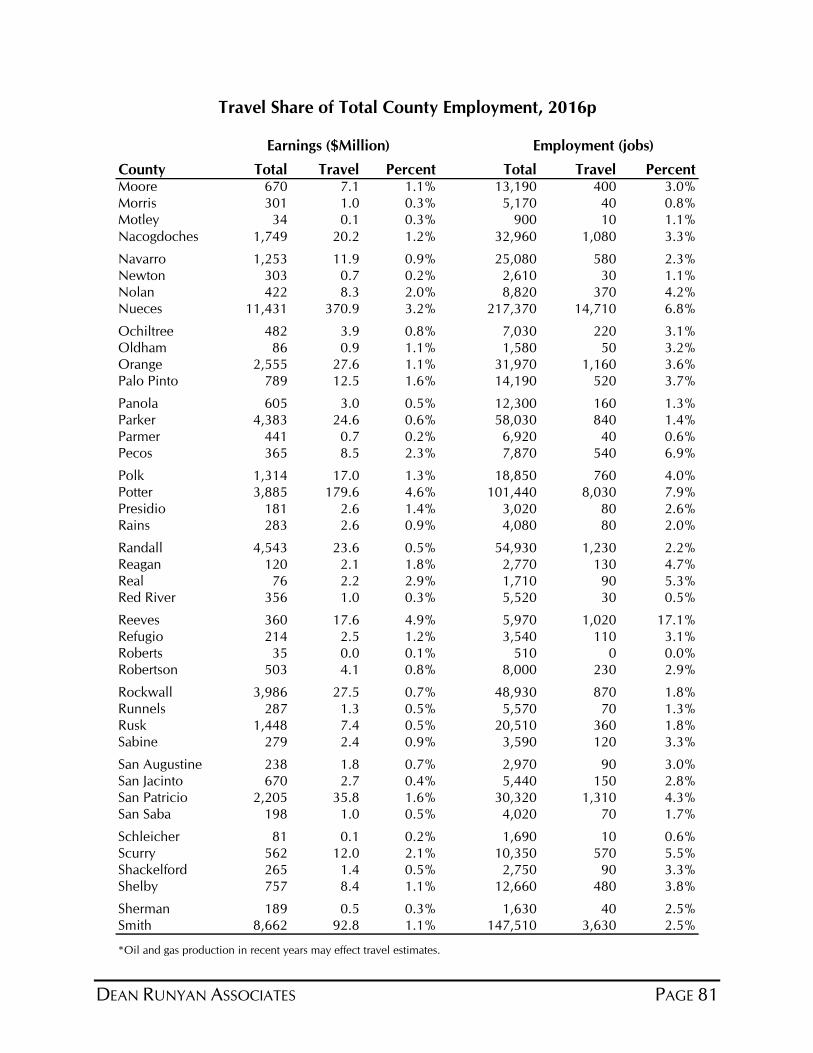
DEAN RUNYAN ASSOCIATES PAGE 81
Earnings ($Million) Employment (jobs)
County Total Travel Percent Total Travel PercentMoore 670 7.1 1.1% 13,190 400 3.0%
Morris 301 1.0 0.3% 5,170 40 0.8%
Motley 34 0.1 0.3% 900 10 1.1%
Nacogdoches 1,749 20.2 1.2% 32,960 1,080 3.3%
Navarro 1,253 11.9 0.9% 25,080 580 2.3%
Newton 303 0.7 0.2% 2,610 30 1.1%
Nolan 422 8.3 2.0% 8,820 370 4.2%
Nueces 11,431 370.9 3.2% 217,370 14,710 6.8%
Ochiltree 482 3.9 0.8% 7,030 220 3.1%
Oldham 86 0.9 1.1% 1,580 50 3.2%
Orange 2,555 27.6 1.1% 31,970 1,160 3.6%
Palo Pinto 789 12.5 1.6% 14,190 520 3.7%
Panola 605 3.0 0.5% 12,300 160 1.3%
Parker 4,383 24.6 0.6% 58,030 840 1.4%
Parmer 441 0.7 0.2% 6,920 40 0.6%
Pecos 365 8.5 2.3% 7,870 540 6.9%
Polk 1,314 17.0 1.3% 18,850 760 4.0%
Potter 3,885 179.6 4.6% 101,440 8,030 7.9%
Presidio 181 2.6 1.4% 3,020 80 2.6%
Rains 283 2.6 0.9% 4,080 80 2.0%
Randall 4,543 23.6 0.5% 54,930 1,230 2.2%
Reagan 120 2.1 1.8% 2,770 130 4.7%
Real 76 2.2 2.9% 1,710 90 5.3%
Red River 356 1.0 0.3% 5,520 30 0.5%
Reeves 360 17.6 4.9% 5,970 1,020 17.1%
Refugio 214 2.5 1.2% 3,540 110 3.1%
Roberts 35 0.0 0.1% 510 0 0.0%
Robertson 503 4.1 0.8% 8,000 230 2.9%
Rockwall 3,986 27.5 0.7% 48,930 870 1.8%
Runnels 287 1.3 0.5% 5,570 70 1.3%
Rusk 1,448 7.4 0.5% 20,510 360 1.8%
Sabine 279 2.4 0.9% 3,590 120 3.3%
San Augustine 238 1.8 0.7% 2,970 90 3.0%
San Jacinto 670 2.7 0.4% 5,440 150 2.8%
San Patricio 2,205 35.8 1.6% 30,320 1,310 4.3%
San Saba 198 1.0 0.5% 4,020 70 1.7%
Schleicher 81 0.1 0.2% 1,690 10 0.6%
Scurry 562 12.0 2.1% 10,350 570 5.5%
Shackelford 265 1.4 0.5% 2,750 90 3.3%
Shelby 757 8.4 1.1% 12,660 480 3.8%
Sherman 189 0.5 0.3% 1,630 40 2.5%
Smith 8,662 92.8 1.1% 147,510 3,630 2.5%
*Oil and gas production in recent years may effect travel estimates.
Travel Share of Total County Employment, 2016p
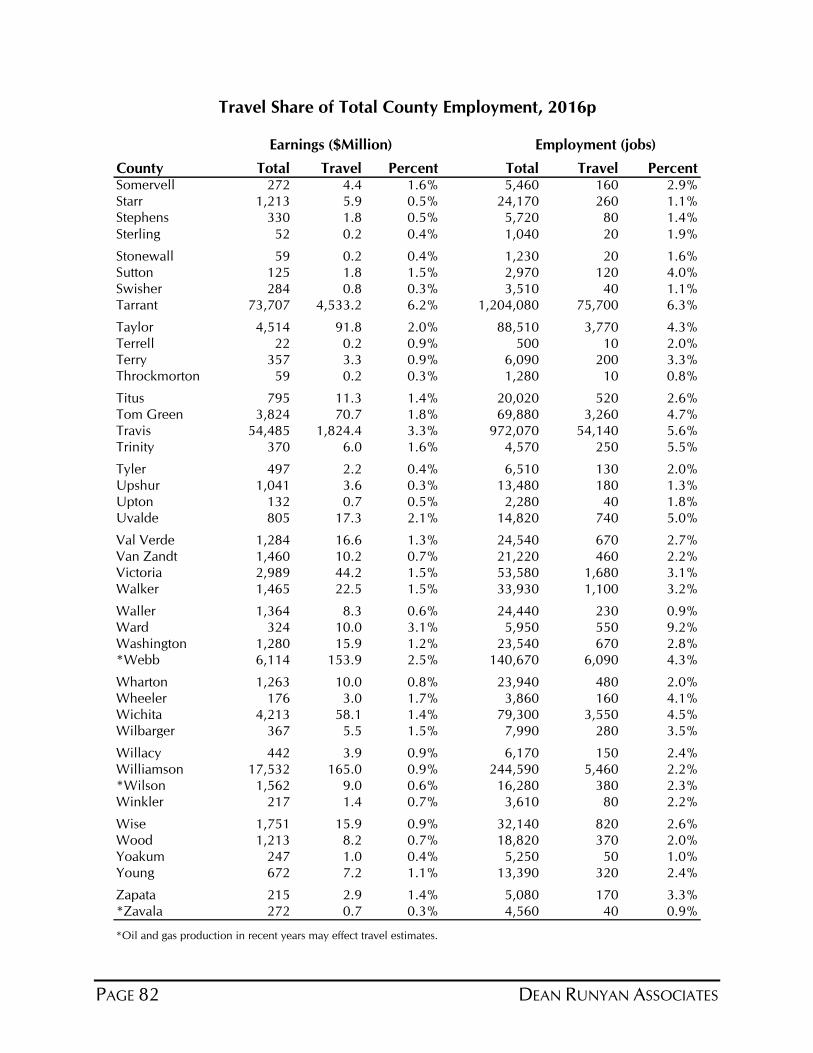
PAGE 82 DEAN RUNYAN ASSOCIATES
Earnings ($Million) Employment (jobs)
County Total Travel Percent Total Travel PercentSomervell 272 4.4 1.6% 5,460 160 2.9%
Starr 1,213 5.9 0.5% 24,170 260 1.1%
Stephens 330 1.8 0.5% 5,720 80 1.4%
Sterling 52 0.2 0.4% 1,040 20 1.9%
Stonewall 59 0.2 0.4% 1,230 20 1.6%
Sutton 125 1.8 1.5% 2,970 120 4.0%
Swisher 284 0.8 0.3% 3,510 40 1.1%
Tarrant 73,707 4,533.2 6.2% 1,204,080 75,700 6.3%
Taylor 4,514 91.8 2.0% 88,510 3,770 4.3%
Terrell 22 0.2 0.9% 500 10 2.0%
Terry 357 3.3 0.9% 6,090 200 3.3%
Throckmorton 59 0.2 0.3% 1,280 10 0.8%
Titus 795 11.3 1.4% 20,020 520 2.6%
Tom Green 3,824 70.7 1.8% 69,880 3,260 4.7%
Travis 54,485 1,824.4 3.3% 972,070 54,140 5.6%
Trinity 370 6.0 1.6% 4,570 250 5.5%
Tyler 497 2.2 0.4% 6,510 130 2.0%
Upshur 1,041 3.6 0.3% 13,480 180 1.3%
Upton 132 0.7 0.5% 2,280 40 1.8%
Uvalde 805 17.3 2.1% 14,820 740 5.0%
Val Verde 1,284 16.6 1.3% 24,540 670 2.7%
Van Zandt 1,460 10.2 0.7% 21,220 460 2.2%
Victoria 2,989 44.2 1.5% 53,580 1,680 3.1%
Walker 1,465 22.5 1.5% 33,930 1,100 3.2%
Waller 1,364 8.3 0.6% 24,440 230 0.9%
Ward 324 10.0 3.1% 5,950 550 9.2%
Washington 1,280 15.9 1.2% 23,540 670 2.8%
*Webb 6,114 153.9 2.5% 140,670 6,090 4.3%
Wharton 1,263 10.0 0.8% 23,940 480 2.0%
Wheeler 176 3.0 1.7% 3,860 160 4.1%
Wichita 4,213 58.1 1.4% 79,300 3,550 4.5%
Wilbarger 367 5.5 1.5% 7,990 280 3.5%
Willacy 442 3.9 0.9% 6,170 150 2.4%
Williamson 17,532 165.0 0.9% 244,590 5,460 2.2%
*Wilson 1,562 9.0 0.6% 16,280 380 2.3%
Winkler 217 1.4 0.7% 3,610 80 2.2%
Wise 1,751 15.9 0.9% 32,140 820 2.6%
Wood 1,213 8.2 0.7% 18,820 370 2.0%
Yoakum 247 1.0 0.4% 5,250 50 1.0%
Young 672 7.2 1.1% 13,390 320 2.4%
Zapata 215 2.9 1.4% 5,080 170 3.3%
*Zavala 272 0.7 0.3% 4,560 40 0.9%
*Oil and gas production in recent years may effect travel estimates.
Travel Share of Total County Employment, 2016p
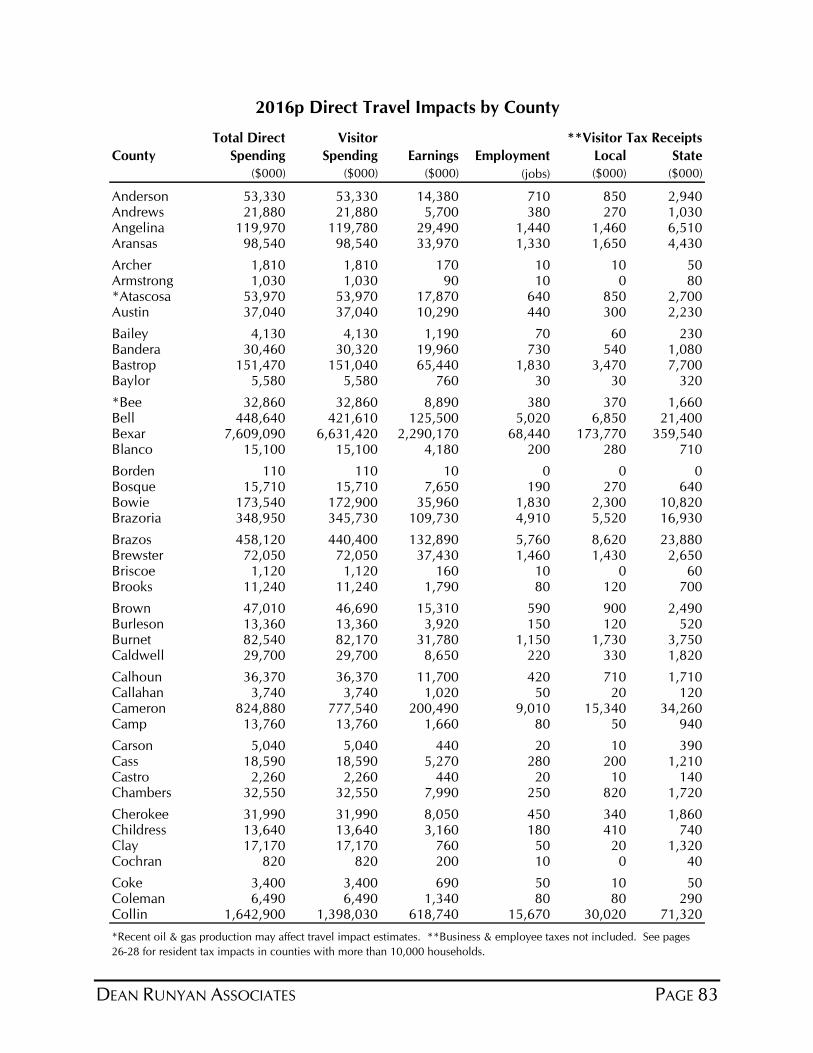
DEAN RUNYAN ASSOCIATES PAGE 83
Total Direct Visitor
County Spending Spending Earnings Employment Local State
($000) ($000) ($000) (jobs) ($000) ($000)
Anderson 53,330 53,330 14,380 710 850 2,940Andrews 21,880 21,880 5,700 380 270 1,030Angelina 119,970 119,780 29,490 1,440 1,460 6,510Aransas 98,540 98,540 33,970 1,330 1,650 4,430
Archer 1,810 1,810 170 10 10 50Armstrong 1,030 1,030 90 10 0 80*Atascosa 53,970 53,970 17,870 640 850 2,700Austin 37,040 37,040 10,290 440 300 2,230
Bailey 4,130 4,130 1,190 70 60 230Bandera 30,460 30,320 19,960 730 540 1,080Bastrop 151,470 151,040 65,440 1,830 3,470 7,700Baylor 5,580 5,580 760 30 30 320
*Bee 32,860 32,860 8,890 380 370 1,660Bell 448,640 421,610 125,500 5,020 6,850 21,400Bexar 7,609,090 6,631,420 2,290,170 68,440 173,770 359,540Blanco 15,100 15,100 4,180 200 280 710
Borden 110 110 10 0 0 0Bosque 15,710 15,710 7,650 190 270 640Bowie 173,540 172,900 35,960 1,830 2,300 10,820Brazoria 348,950 345,730 109,730 4,910 5,520 16,930
Brazos 458,120 440,400 132,890 5,760 8,620 23,880Brewster 72,050 72,050 37,430 1,460 1,430 2,650Briscoe 1,120 1,120 160 10 0 60Brooks 11,240 11,240 1,790 80 120 700
Brown 47,010 46,690 15,310 590 900 2,490Burleson 13,360 13,360 3,920 150 120 520Burnet 82,540 82,170 31,780 1,150 1,730 3,750Caldwell 29,700 29,700 8,650 220 330 1,820
Calhoun 36,370 36,370 11,700 420 710 1,710Callahan 3,740 3,740 1,020 50 20 120Cameron 824,880 777,540 200,490 9,010 15,340 34,260Camp 13,760 13,760 1,660 80 50 940
Carson 5,040 5,040 440 20 10 390Cass 18,590 18,590 5,270 280 200 1,210Castro 2,260 2,260 440 20 10 140Chambers 32,550 32,550 7,990 250 820 1,720
Cherokee 31,990 31,990 8,050 450 340 1,860Childress 13,640 13,640 3,160 180 410 740Clay 17,170 17,170 760 50 20 1,320Cochran 820 820 200 10 0 40
Coke 3,400 3,400 690 50 10 50Coleman 6,490 6,490 1,340 80 80 290Collin 1,642,900 1,398,030 618,740 15,670 30,020 71,320
**Visitor Tax Receipts
2016p Direct Travel Impacts by County
*Recent oil & gas production may affect travel impact estimates. **Business & employee taxes not included. See pages
26-28 for resident tax impacts in counties with more than 10,000 households.
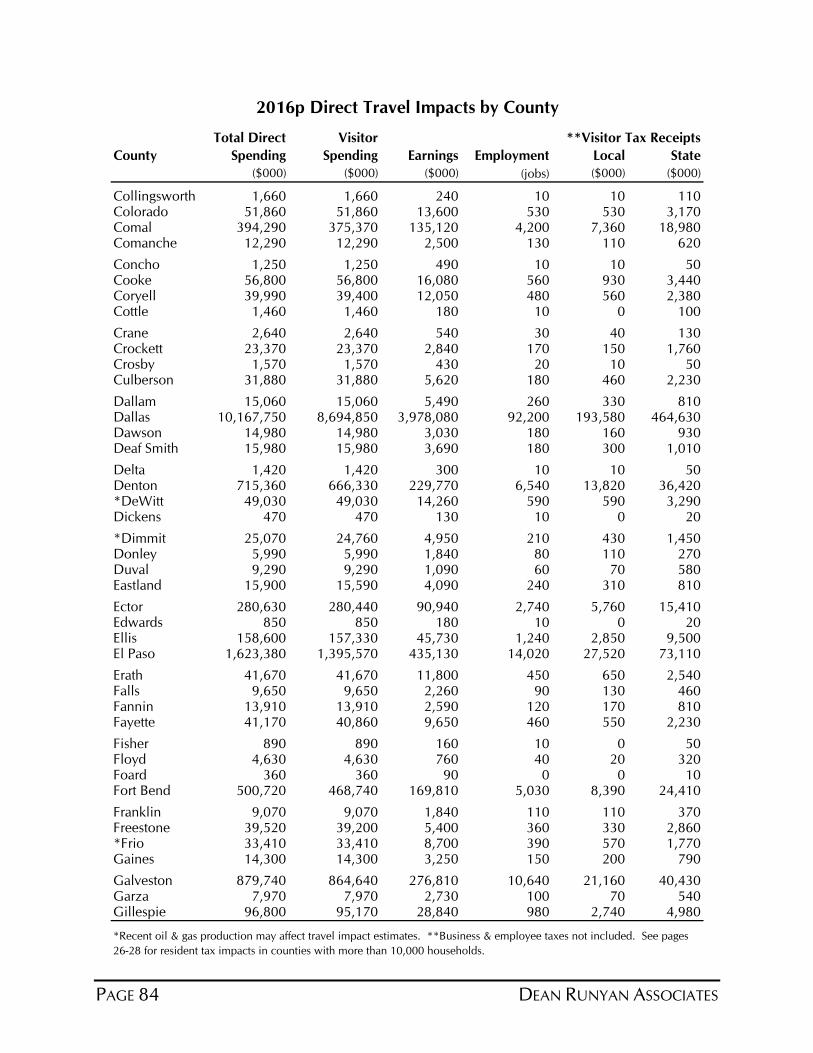
PAGE 84 DEAN RUNYAN ASSOCIATES
Total Direct Visitor
County Spending Spending Earnings Employment Local State
($000) ($000) ($000) (jobs) ($000) ($000)
Collingsworth 1,660 1,660 240 10 10 110Colorado 51,860 51,860 13,600 530 530 3,170Comal 394,290 375,370 135,120 4,200 7,360 18,980Comanche 12,290 12,290 2,500 130 110 620
Concho 1,250 1,250 490 10 10 50Cooke 56,800 56,800 16,080 560 930 3,440Coryell 39,990 39,400 12,050 480 560 2,380Cottle 1,460 1,460 180 10 0 100
Crane 2,640 2,640 540 30 40 130Crockett 23,370 23,370 2,840 170 150 1,760Crosby 1,570 1,570 430 20 10 50Culberson 31,880 31,880 5,620 180 460 2,230
Dallam 15,060 15,060 5,490 260 330 810Dallas 10,167,750 8,694,850 3,978,080 92,200 193,580 464,630Dawson 14,980 14,980 3,030 180 160 930Deaf Smith 15,980 15,980 3,690 180 300 1,010
Delta 1,420 1,420 300 10 10 50Denton 715,360 666,330 229,770 6,540 13,820 36,420*DeWitt 49,030 49,030 14,260 590 590 3,290Dickens 470 470 130 10 0 20
*Dimmit 25,070 24,760 4,950 210 430 1,450Donley 5,990 5,990 1,840 80 110 270Duval 9,290 9,290 1,090 60 70 580Eastland 15,900 15,590 4,090 240 310 810
Ector 280,630 280,440 90,940 2,740 5,760 15,410Edwards 850 850 180 10 0 20Ellis 158,600 157,330 45,730 1,240 2,850 9,500El Paso 1,623,380 1,395,570 435,130 14,020 27,520 73,110
Erath 41,670 41,670 11,800 450 650 2,540Falls 9,650 9,650 2,260 90 130 460Fannin 13,910 13,910 2,590 120 170 810Fayette 41,170 40,860 9,650 460 550 2,230
Fisher 890 890 160 10 0 50Floyd 4,630 4,630 760 40 20 320Foard 360 360 90 0 0 10Fort Bend 500,720 468,740 169,810 5,030 8,390 24,410
Franklin 9,070 9,070 1,840 110 110 370Freestone 39,520 39,200 5,400 360 330 2,860*Frio 33,410 33,410 8,700 390 570 1,770Gaines 14,300 14,300 3,250 150 200 790
Galveston 879,740 864,640 276,810 10,640 21,160 40,430Garza 7,970 7,970 2,730 100 70 540Gillespie 96,800 95,170 28,840 980 2,740 4,980
2016p Direct Travel Impacts by County
**Visitor Tax Receipts
*Recent oil & gas production may affect travel impact estimates. **Business & employee taxes not included. See pages
26-28 for resident tax impacts in counties with more than 10,000 households.
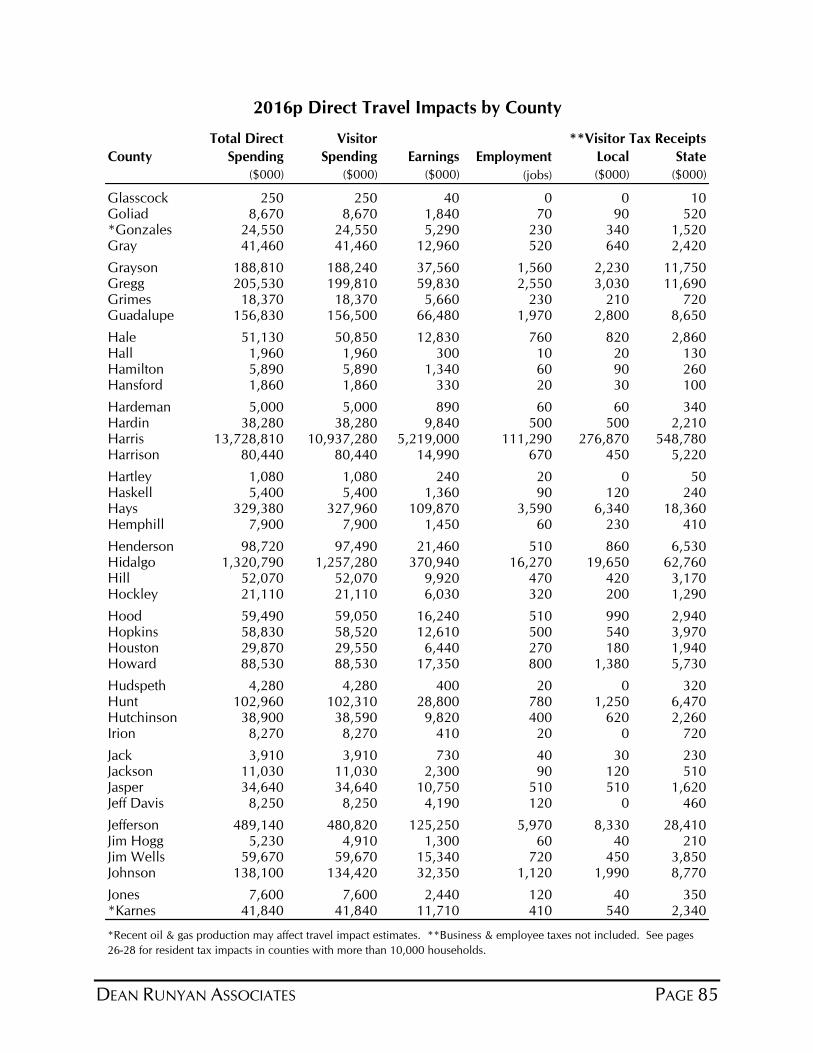
DEAN RUNYAN ASSOCIATES PAGE 85
Total Direct Visitor
County Spending Spending Earnings Employment Local State
($000) ($000) ($000) (jobs) ($000) ($000)
Glasscock 250 250 40 0 0 10Goliad 8,670 8,670 1,840 70 90 520*Gonzales 24,550 24,550 5,290 230 340 1,520Gray 41,460 41,460 12,960 520 640 2,420
Grayson 188,810 188,240 37,560 1,560 2,230 11,750Gregg 205,530 199,810 59,830 2,550 3,030 11,690Grimes 18,370 18,370 5,660 230 210 720Guadalupe 156,830 156,500 66,480 1,970 2,800 8,650
Hale 51,130 50,850 12,830 760 820 2,860Hall 1,960 1,960 300 10 20 130Hamilton 5,890 5,890 1,340 60 90 260Hansford 1,860 1,860 330 20 30 100
Hardeman 5,000 5,000 890 60 60 340Hardin 38,280 38,280 9,840 500 500 2,210Harris 13,728,810 10,937,280 5,219,000 111,290 276,870 548,780Harrison 80,440 80,440 14,990 670 450 5,220
Hartley 1,080 1,080 240 20 0 50Haskell 5,400 5,400 1,360 90 120 240Hays 329,380 327,960 109,870 3,590 6,340 18,360Hemphill 7,900 7,900 1,450 60 230 410
Henderson 98,720 97,490 21,460 510 860 6,530Hidalgo 1,320,790 1,257,280 370,940 16,270 19,650 62,760Hill 52,070 52,070 9,920 470 420 3,170Hockley 21,110 21,110 6,030 320 200 1,290
Hood 59,490 59,050 16,240 510 990 2,940Hopkins 58,830 58,520 12,610 500 540 3,970Houston 29,870 29,550 6,440 270 180 1,940Howard 88,530 88,530 17,350 800 1,380 5,730
Hudspeth 4,280 4,280 400 20 0 320Hunt 102,960 102,310 28,800 780 1,250 6,470Hutchinson 38,900 38,590 9,820 400 620 2,260Irion 8,270 8,270 410 20 0 720
Jack 3,910 3,910 730 40 30 230Jackson 11,030 11,030 2,300 90 120 510Jasper 34,640 34,640 10,750 510 510 1,620Jeff Davis 8,250 8,250 4,190 120 0 460
Jefferson 489,140 480,820 125,250 5,970 8,330 28,410Jim Hogg 5,230 4,910 1,300 60 40 210Jim Wells 59,670 59,670 15,340 720 450 3,850Johnson 138,100 134,420 32,350 1,120 1,990 8,770
Jones 7,600 7,600 2,440 120 40 350*Karnes 41,840 41,840 11,710 410 540 2,340
2016p Direct Travel Impacts by County
**Visitor Tax Receipts
*Recent oil & gas production may affect travel impact estimates. **Business & employee taxes not included. See pages
26-28 for resident tax impacts in counties with more than 10,000 households.
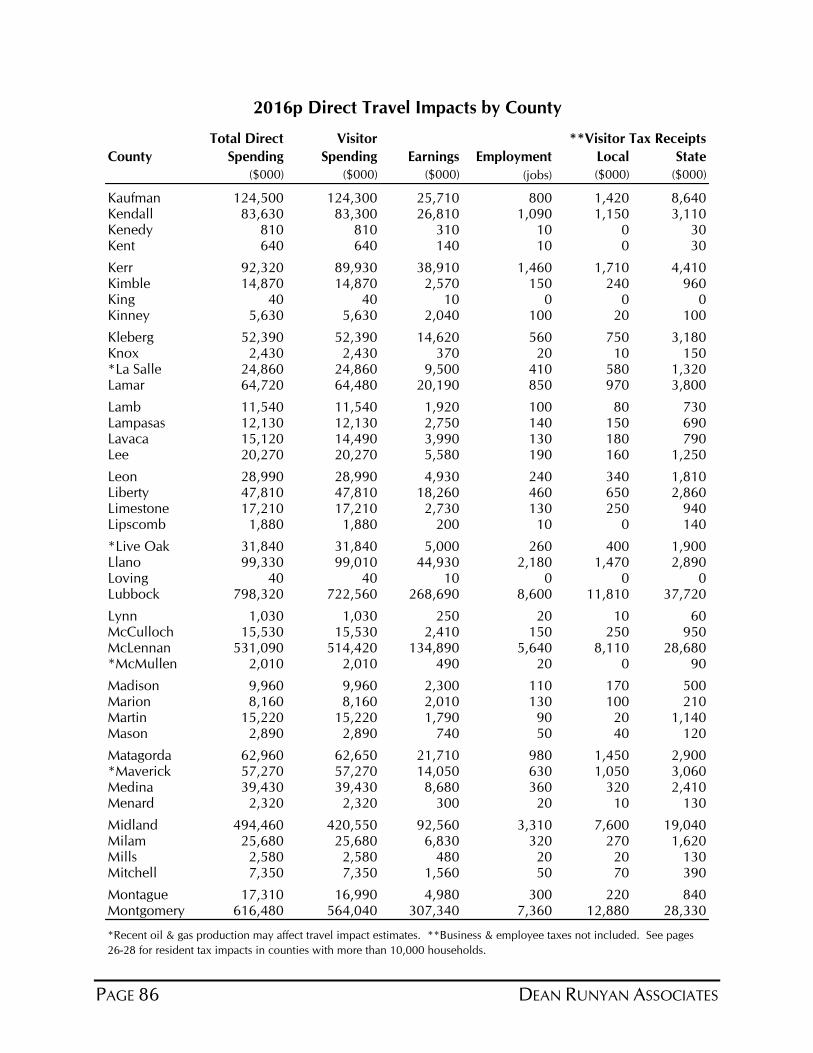
PAGE 86 DEAN RUNYAN ASSOCIATES
Total Direct Visitor
County Spending Spending Earnings Employment Local State
($000) ($000) ($000) (jobs) ($000) ($000)
Kaufman 124,500 124,300 25,710 800 1,420 8,640Kendall 83,630 83,300 26,810 1,090 1,150 3,110Kenedy 810 810 310 10 0 30Kent 640 640 140 10 0 30
Kerr 92,320 89,930 38,910 1,460 1,710 4,410Kimble 14,870 14,870 2,570 150 240 960King 40 40 10 0 0 0Kinney 5,630 5,630 2,040 100 20 100
Kleberg 52,390 52,390 14,620 560 750 3,180Knox 2,430 2,430 370 20 10 150*La Salle 24,860 24,860 9,500 410 580 1,320Lamar 64,720 64,480 20,190 850 970 3,800
Lamb 11,540 11,540 1,920 100 80 730Lampasas 12,130 12,130 2,750 140 150 690Lavaca 15,120 14,490 3,990 130 180 790Lee 20,270 20,270 5,580 190 160 1,250
Leon 28,990 28,990 4,930 240 340 1,810Liberty 47,810 47,810 18,260 460 650 2,860Limestone 17,210 17,210 2,730 130 250 940Lipscomb 1,880 1,880 200 10 0 140
*Live Oak 31,840 31,840 5,000 260 400 1,900Llano 99,330 99,010 44,930 2,180 1,470 2,890Loving 40 40 10 0 0 0Lubbock 798,320 722,560 268,690 8,600 11,810 37,720
Lynn 1,030 1,030 250 20 10 60McCulloch 15,530 15,530 2,410 150 250 950McLennan 531,090 514,420 134,890 5,640 8,110 28,680*McMullen 2,010 2,010 490 20 0 90
Madison 9,960 9,960 2,300 110 170 500Marion 8,160 8,160 2,010 130 100 210Martin 15,220 15,220 1,790 90 20 1,140Mason 2,890 2,890 740 50 40 120
Matagorda 62,960 62,650 21,710 980 1,450 2,900*Maverick 57,270 57,270 14,050 630 1,050 3,060Medina 39,430 39,430 8,680 360 320 2,410Menard 2,320 2,320 300 20 10 130
Midland 494,460 420,550 92,560 3,310 7,600 19,040Milam 25,680 25,680 6,830 320 270 1,620Mills 2,580 2,580 480 20 20 130Mitchell 7,350 7,350 1,560 50 70 390
Montague 17,310 16,990 4,980 300 220 840Montgomery 616,480 564,040 307,340 7,360 12,880 28,330
2016p Direct Travel Impacts by County
**Visitor Tax Receipts
*Recent oil & gas production may affect travel impact estimates. **Business & employee taxes not included. See pages
26-28 for resident tax impacts in counties with more than 10,000 households.
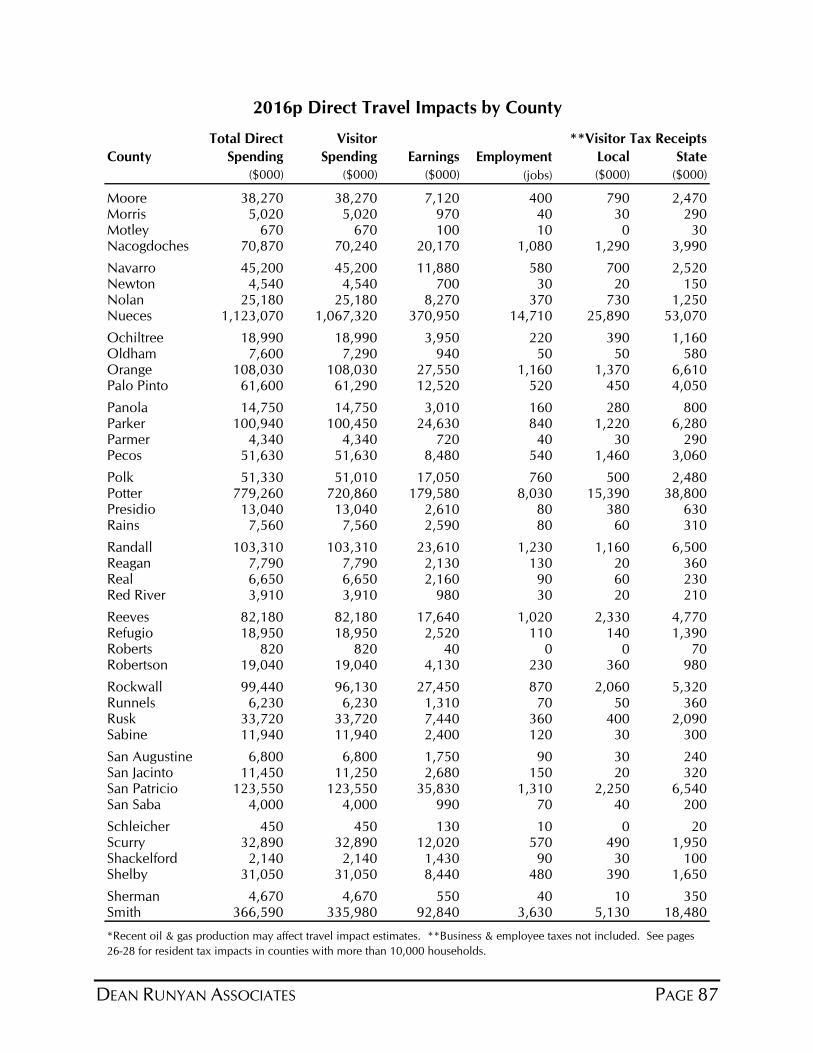
DEAN RUNYAN ASSOCIATES PAGE 87
Total Direct Visitor
County Spending Spending Earnings Employment Local State
($000) ($000) ($000) (jobs) ($000) ($000)
Moore 38,270 38,270 7,120 400 790 2,470Morris 5,020 5,020 970 40 30 290Motley 670 670 100 10 0 30Nacogdoches 70,870 70,240 20,170 1,080 1,290 3,990
Navarro 45,200 45,200 11,880 580 700 2,520Newton 4,540 4,540 700 30 20 150Nolan 25,180 25,180 8,270 370 730 1,250Nueces 1,123,070 1,067,320 370,950 14,710 25,890 53,070
Ochiltree 18,990 18,990 3,950 220 390 1,160Oldham 7,600 7,290 940 50 50 580Orange 108,030 108,030 27,550 1,160 1,370 6,610Palo Pinto 61,600 61,290 12,520 520 450 4,050
Panola 14,750 14,750 3,010 160 280 800Parker 100,940 100,450 24,630 840 1,220 6,280Parmer 4,340 4,340 720 40 30 290Pecos 51,630 51,630 8,480 540 1,460 3,060
Polk 51,330 51,010 17,050 760 500 2,480Potter 779,260 720,860 179,580 8,030 15,390 38,800Presidio 13,040 13,040 2,610 80 380 630Rains 7,560 7,560 2,590 80 60 310
Randall 103,310 103,310 23,610 1,230 1,160 6,500Reagan 7,790 7,790 2,130 130 20 360Real 6,650 6,650 2,160 90 60 230Red River 3,910 3,910 980 30 20 210
Reeves 82,180 82,180 17,640 1,020 2,330 4,770Refugio 18,950 18,950 2,520 110 140 1,390Roberts 820 820 40 0 0 70Robertson 19,040 19,040 4,130 230 360 980
Rockwall 99,440 96,130 27,450 870 2,060 5,320Runnels 6,230 6,230 1,310 70 50 360Rusk 33,720 33,720 7,440 360 400 2,090Sabine 11,940 11,940 2,400 120 30 300
San Augustine 6,800 6,800 1,750 90 30 240San Jacinto 11,450 11,250 2,680 150 20 320San Patricio 123,550 123,550 35,830 1,310 2,250 6,540San Saba 4,000 4,000 990 70 40 200
Schleicher 450 450 130 10 0 20Scurry 32,890 32,890 12,020 570 490 1,950Shackelford 2,140 2,140 1,430 90 30 100Shelby 31,050 31,050 8,440 480 390 1,650
Sherman 4,670 4,670 550 40 10 350Smith 366,590 335,980 92,840 3,630 5,130 18,480
2016p Direct Travel Impacts by County
**Visitor Tax Receipts
*Recent oil & gas production may affect travel impact estimates. **Business & employee taxes not included. See pages
26-28 for resident tax impacts in counties with more than 10,000 households.
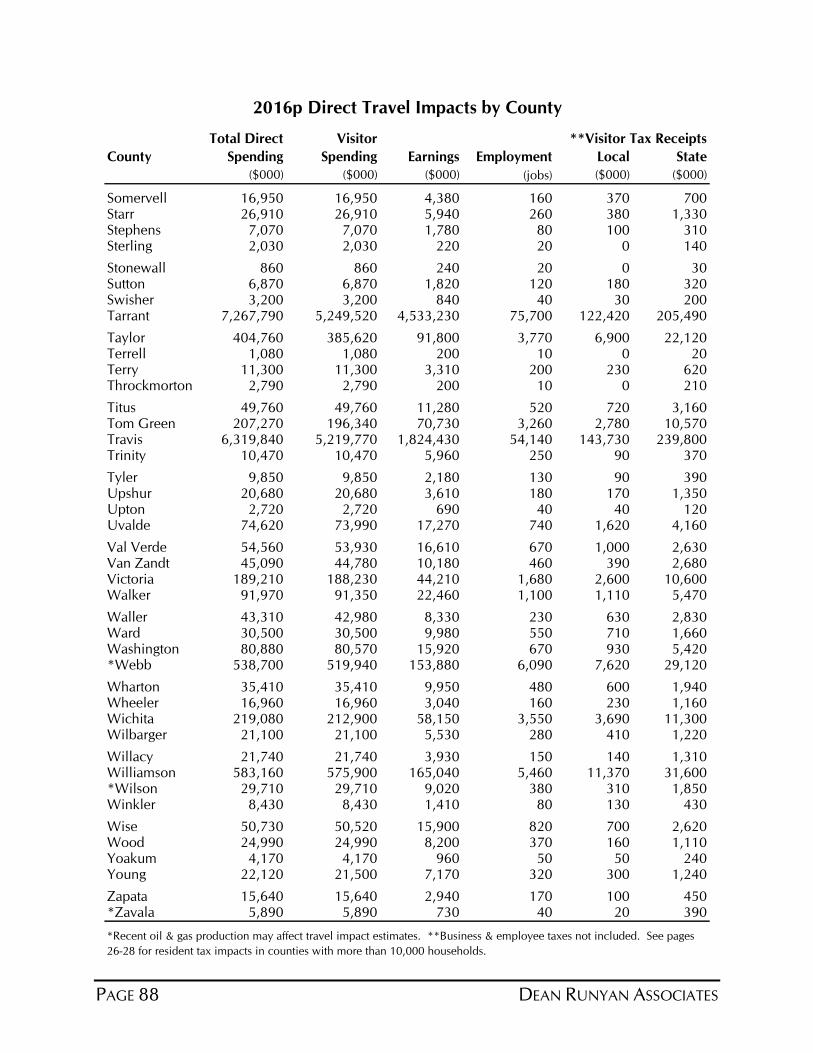
PAGE 88 DEAN RUNYAN ASSOCIATES
Total Direct Visitor
County Spending Spending Earnings Employment Local State
($000) ($000) ($000) (jobs) ($000) ($000)
Somervell 16,950 16,950 4,380 160 370 700Starr 26,910 26,910 5,940 260 380 1,330Stephens 7,070 7,070 1,780 80 100 310Sterling 2,030 2,030 220 20 0 140
Stonewall 860 860 240 20 0 30Sutton 6,870 6,870 1,820 120 180 320Swisher 3,200 3,200 840 40 30 200Tarrant 7,267,790 5,249,520 4,533,230 75,700 122,420 205,490
Taylor 404,760 385,620 91,800 3,770 6,900 22,120Terrell 1,080 1,080 200 10 0 20Terry 11,300 11,300 3,310 200 230 620Throckmorton 2,790 2,790 200 10 0 210
Titus 49,760 49,760 11,280 520 720 3,160Tom Green 207,270 196,340 70,730 3,260 2,780 10,570Travis 6,319,840 5,219,770 1,824,430 54,140 143,730 239,800Trinity 10,470 10,470 5,960 250 90 370
Tyler 9,850 9,850 2,180 130 90 390Upshur 20,680 20,680 3,610 180 170 1,350Upton 2,720 2,720 690 40 40 120Uvalde 74,620 73,990 17,270 740 1,620 4,160
Val Verde 54,560 53,930 16,610 670 1,000 2,630Van Zandt 45,090 44,780 10,180 460 390 2,680Victoria 189,210 188,230 44,210 1,680 2,600 10,600Walker 91,970 91,350 22,460 1,100 1,110 5,470
Waller 43,310 42,980 8,330 230 630 2,830Ward 30,500 30,500 9,980 550 710 1,660Washington 80,880 80,570 15,920 670 930 5,420*Webb 538,700 519,940 153,880 6,090 7,620 29,120
Wharton 35,410 35,410 9,950 480 600 1,940Wheeler 16,960 16,960 3,040 160 230 1,160Wichita 219,080 212,900 58,150 3,550 3,690 11,300Wilbarger 21,100 21,100 5,530 280 410 1,220
Willacy 21,740 21,740 3,930 150 140 1,310Williamson 583,160 575,900 165,040 5,460 11,370 31,600*Wilson 29,710 29,710 9,020 380 310 1,850Winkler 8,430 8,430 1,410 80 130 430
Wise 50,730 50,520 15,900 820 700 2,620Wood 24,990 24,990 8,200 370 160 1,110Yoakum 4,170 4,170 960 50 50 240Young 22,120 21,500 7,170 320 300 1,240
Zapata 15,640 15,640 2,940 170 100 450*Zavala 5,890 5,890 730 40 20 390
2016p Direct Travel Impacts by County
**Visitor Tax Receipts
*Recent oil & gas production may affect travel impact estimates. **Business & employee taxes not included. See pages
26-28 for resident tax impacts in counties with more than 10,000 households.
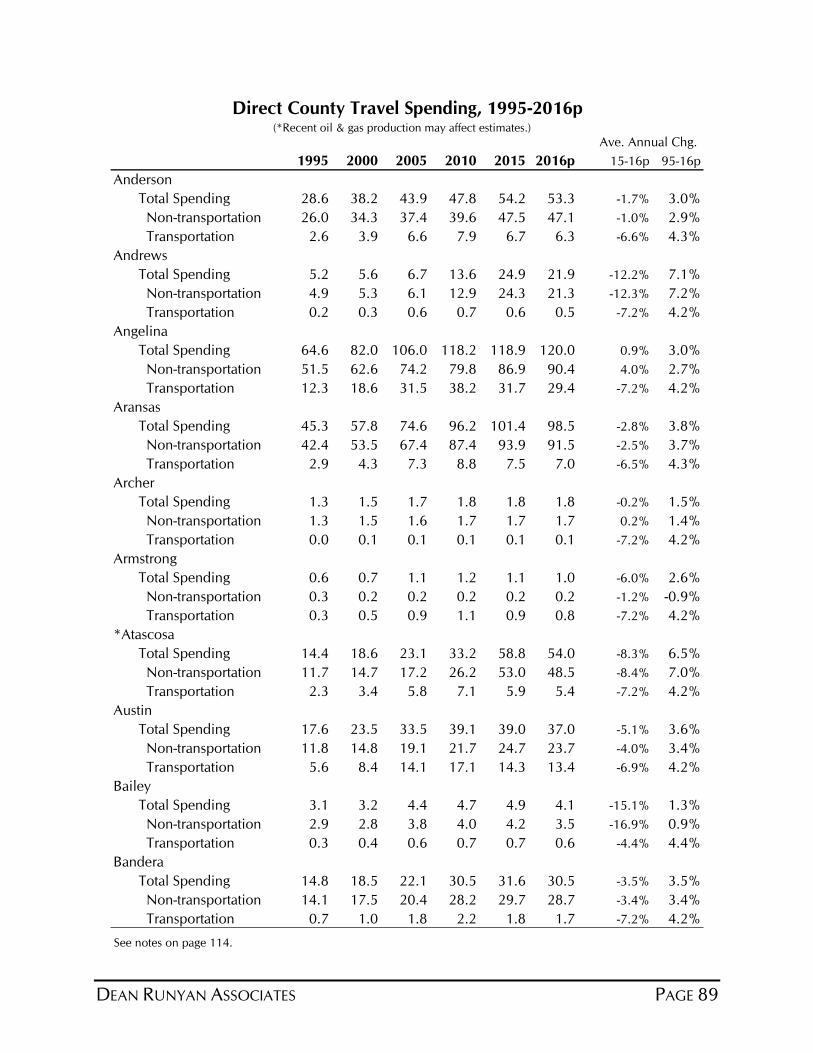
DEAN RUNYAN ASSOCIATES PAGE 89
1995 2000 2005 2010 2015 2016p 15-16p 95-16p
Anderson
Total Spending 28.6 38.2 43.9 47.8 54.2 53.3 -1.7% 3.0%
Non-transportation 26.0 34.3 37.4 39.6 47.5 47.1 -1.0% 2.9%
Transportation 2.6 3.9 6.6 7.9 6.7 6.3 -6.6% 4.3%
Andrews
Total Spending 5.2 5.6 6.7 13.6 24.9 21.9 -12.2% 7.1%
Non-transportation 4.9 5.3 6.1 12.9 24.3 21.3 -12.3% 7.2%
Transportation 0.2 0.3 0.6 0.7 0.6 0.5 -7.2% 4.2%
Angelina
Total Spending 64.6 82.0 106.0 118.2 118.9 120.0 0.9% 3.0%
Non-transportation 51.5 62.6 74.2 79.8 86.9 90.4 4.0% 2.7%
Transportation 12.3 18.6 31.5 38.2 31.7 29.4 -7.2% 4.2%
Aransas
Total Spending 45.3 57.8 74.6 96.2 101.4 98.5 -2.8% 3.8%
Non-transportation 42.4 53.5 67.4 87.4 93.9 91.5 -2.5% 3.7%
Transportation 2.9 4.3 7.3 8.8 7.5 7.0 -6.5% 4.3%
Archer
Total Spending 1.3 1.5 1.7 1.8 1.8 1.8 -0.2% 1.5%
Non-transportation 1.3 1.5 1.6 1.7 1.7 1.7 0.2% 1.4%
Transportation 0.0 0.1 0.1 0.1 0.1 0.1 -7.2% 4.2%
Armstrong
Total Spending 0.6 0.7 1.1 1.2 1.1 1.0 -6.0% 2.6%
Non-transportation 0.3 0.2 0.2 0.2 0.2 0.2 -1.2% -0.9%
Transportation 0.3 0.5 0.9 1.1 0.9 0.8 -7.2% 4.2%
*Atascosa
Total Spending 14.4 18.6 23.1 33.2 58.8 54.0 -8.3% 6.5%
Non-transportation 11.7 14.7 17.2 26.2 53.0 48.5 -8.4% 7.0%
Transportation 2.3 3.4 5.8 7.1 5.9 5.4 -7.2% 4.2%
Austin
Total Spending 17.6 23.5 33.5 39.1 39.0 37.0 -5.1% 3.6%
Non-transportation 11.8 14.8 19.1 21.7 24.7 23.7 -4.0% 3.4%
Transportation 5.6 8.4 14.1 17.1 14.3 13.4 -6.9% 4.2%
Bailey
Total Spending 3.1 3.2 4.4 4.7 4.9 4.1 -15.1% 1.3%
Non-transportation 2.9 2.8 3.8 4.0 4.2 3.5 -16.9% 0.9%
Transportation 0.3 0.4 0.6 0.7 0.7 0.6 -4.4% 4.4%
Bandera
Total Spending 14.8 18.5 22.1 30.5 31.6 30.5 -3.5% 3.5%
Non-transportation 14.1 17.5 20.4 28.2 29.7 28.7 -3.4% 3.4%
Transportation 0.7 1.0 1.8 2.2 1.8 1.7 -7.2% 4.2%
Ave. Annual Chg.
Direct County Travel Spending, 1995-2016p (*Recent oil & gas production may affect estimates.)
See notes on page 114.
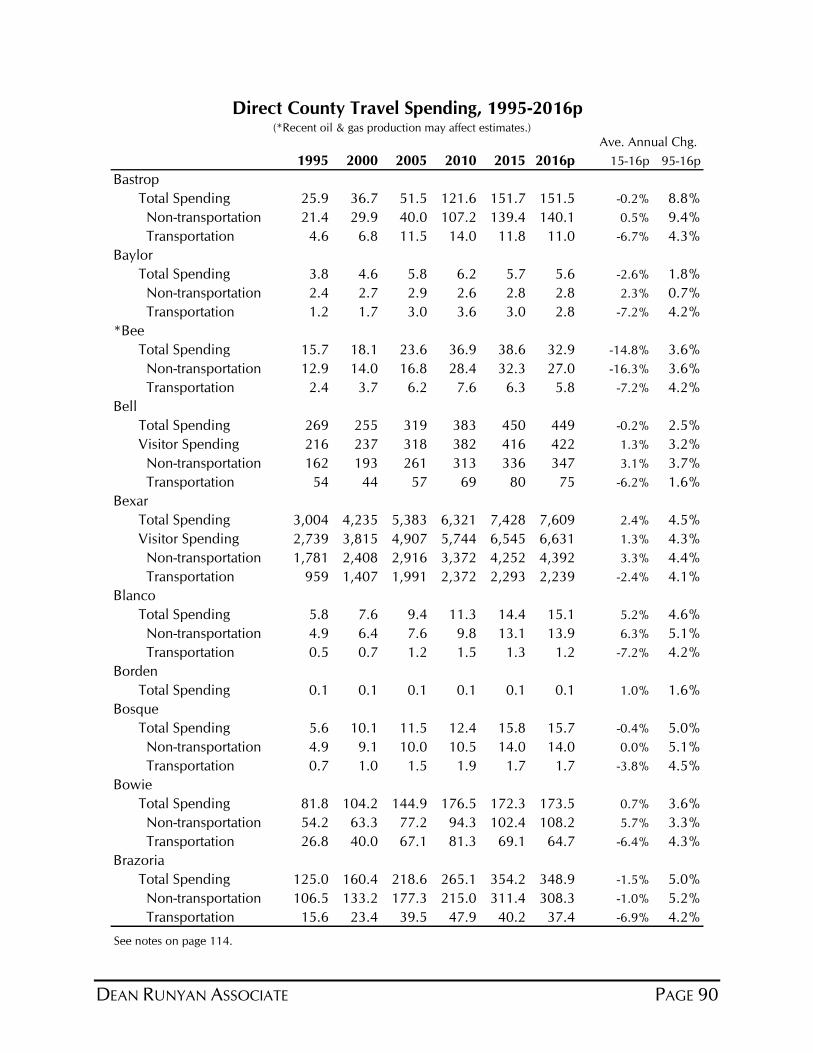
DEAN RUNYAN ASSOCIATE PAGE 90
1995 2000 2005 2010 2015 2016p 15-16p 95-16p
Bastrop
Total Spending 25.9 36.7 51.5 121.6 151.7 151.5 -0.2% 8.8%
Non-transportation 21.4 29.9 40.0 107.2 139.4 140.1 0.5% 9.4%
Transportation 4.6 6.8 11.5 14.0 11.8 11.0 -6.7% 4.3%
Baylor
Total Spending 3.8 4.6 5.8 6.2 5.7 5.6 -2.6% 1.8%
Non-transportation 2.4 2.7 2.9 2.6 2.8 2.8 2.3% 0.7%
Transportation 1.2 1.7 3.0 3.6 3.0 2.8 -7.2% 4.2%
*Bee
Total Spending 15.7 18.1 23.6 36.9 38.6 32.9 -14.8% 3.6%
Non-transportation 12.9 14.0 16.8 28.4 32.3 27.0 -16.3% 3.6%
Transportation 2.4 3.7 6.2 7.6 6.3 5.8 -7.2% 4.2%
Bell
Total Spending 269 255 319 383 450 449 -0.2% 2.5%
Visitor Spending 216 237 318 382 416 422 1.3% 3.2%
Non-transportation 162 193 261 313 336 347 3.1% 3.7%
Transportation 54 44 57 69 80 75 -6.2% 1.6%
Bexar
Total Spending 3,004 4,235 5,383 6,321 7,428 7,609 2.4% 4.5%
Visitor Spending 2,739 3,815 4,907 5,744 6,545 6,631 1.3% 4.3%
Non-transportation 1,781 2,408 2,916 3,372 4,252 4,392 3.3% 4.4%
Transportation 959 1,407 1,991 2,372 2,293 2,239 -2.4% 4.1%
Blanco
Total Spending 5.8 7.6 9.4 11.3 14.4 15.1 5.2% 4.6%
Non-transportation 4.9 6.4 7.6 9.8 13.1 13.9 6.3% 5.1%
Transportation 0.5 0.7 1.2 1.5 1.3 1.2 -7.2% 4.2%
Borden
Total Spending 0.1 0.1 0.1 0.1 0.1 0.1 1.0% 1.6%
Bosque
Total Spending 5.6 10.1 11.5 12.4 15.8 15.7 -0.4% 5.0%
Non-transportation 4.9 9.1 10.0 10.5 14.0 14.0 0.0% 5.1%
Transportation 0.7 1.0 1.5 1.9 1.7 1.7 -3.8% 4.5%
Bowie
Total Spending 81.8 104.2 144.9 176.5 172.3 173.5 0.7% 3.6%
Non-transportation 54.2 63.3 77.2 94.3 102.4 108.2 5.7% 3.3%
Transportation 26.8 40.0 67.1 81.3 69.1 64.7 -6.4% 4.3%
Brazoria
Total Spending 125.0 160.4 218.6 265.1 354.2 348.9 -1.5% 5.0%
Non-transportation 106.5 133.2 177.3 215.0 311.4 308.3 -1.0% 5.2%
Transportation 15.6 23.4 39.5 47.9 40.2 37.4 -6.9% 4.2%
Direct County Travel Spending, 1995-2016p
Ave. Annual Chg. (*Recent oil & gas production may affect estimates.)
See notes on page 114.
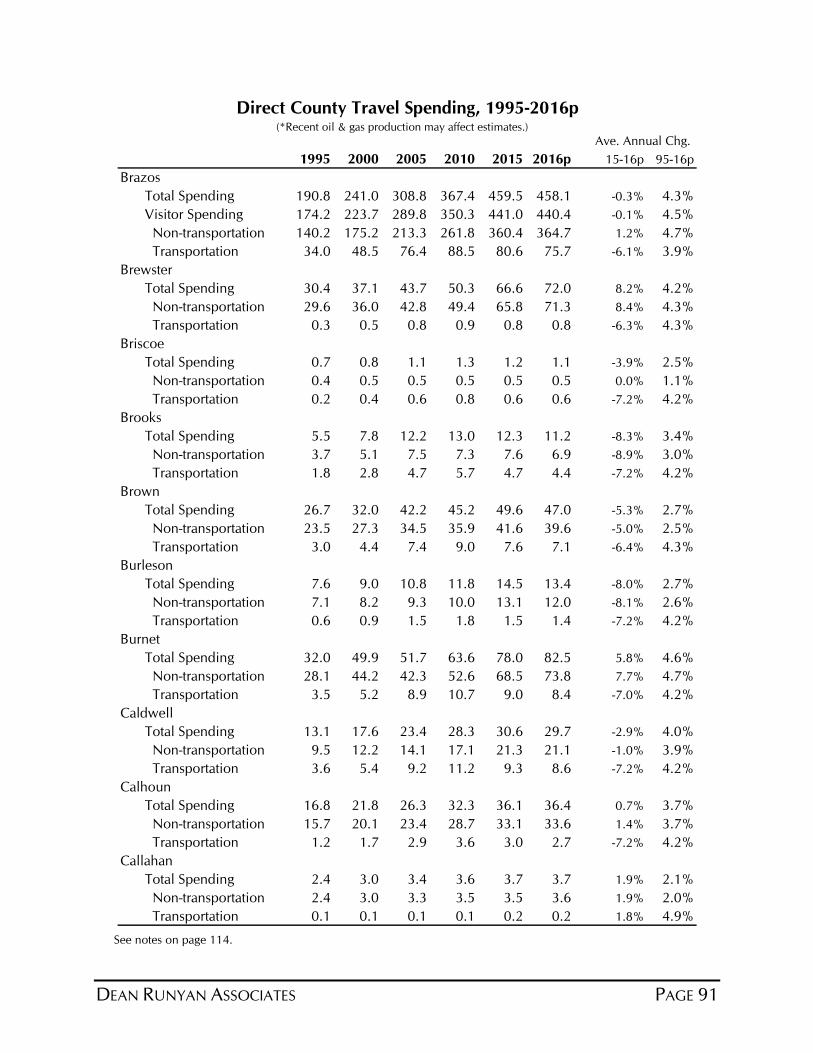
DEAN RUNYAN ASSOCIATES PAGE 91
1995 2000 2005 2010 2015 2016p 15-16p 95-16p
Brazos
Total Spending 190.8 241.0 308.8 367.4 459.5 458.1 -0.3% 4.3%
Visitor Spending 174.2 223.7 289.8 350.3 441.0 440.4 -0.1% 4.5%
Non-transportation 140.2 175.2 213.3 261.8 360.4 364.7 1.2% 4.7%
Transportation 34.0 48.5 76.4 88.5 80.6 75.7 -6.1% 3.9%
Brewster
Total Spending 30.4 37.1 43.7 50.3 66.6 72.0 8.2% 4.2%
Non-transportation 29.6 36.0 42.8 49.4 65.8 71.3 8.4% 4.3%
Transportation 0.3 0.5 0.8 0.9 0.8 0.8 -6.3% 4.3%
Briscoe
Total Spending 0.7 0.8 1.1 1.3 1.2 1.1 -3.9% 2.5%
Non-transportation 0.4 0.5 0.5 0.5 0.5 0.5 0.0% 1.1%
Transportation 0.2 0.4 0.6 0.8 0.6 0.6 -7.2% 4.2%
Brooks
Total Spending 5.5 7.8 12.2 13.0 12.3 11.2 -8.3% 3.4%
Non-transportation 3.7 5.1 7.5 7.3 7.6 6.9 -8.9% 3.0%
Transportation 1.8 2.8 4.7 5.7 4.7 4.4 -7.2% 4.2%
Brown
Total Spending 26.7 32.0 42.2 45.2 49.6 47.0 -5.3% 2.7%
Non-transportation 23.5 27.3 34.5 35.9 41.6 39.6 -5.0% 2.5%
Transportation 3.0 4.4 7.4 9.0 7.6 7.1 -6.4% 4.3%
Burleson
Total Spending 7.6 9.0 10.8 11.8 14.5 13.4 -8.0% 2.7%
Non-transportation 7.1 8.2 9.3 10.0 13.1 12.0 -8.1% 2.6%
Transportation 0.6 0.9 1.5 1.8 1.5 1.4 -7.2% 4.2%
Burnet
Total Spending 32.0 49.9 51.7 63.6 78.0 82.5 5.8% 4.6%
Non-transportation 28.1 44.2 42.3 52.6 68.5 73.8 7.7% 4.7%
Transportation 3.5 5.2 8.9 10.7 9.0 8.4 -7.0% 4.2%
Caldwell
Total Spending 13.1 17.6 23.4 28.3 30.6 29.7 -2.9% 4.0%
Non-transportation 9.5 12.2 14.1 17.1 21.3 21.1 -1.0% 3.9%
Transportation 3.6 5.4 9.2 11.2 9.3 8.6 -7.2% 4.2%
Calhoun
Total Spending 16.8 21.8 26.3 32.3 36.1 36.4 0.7% 3.7%
Non-transportation 15.7 20.1 23.4 28.7 33.1 33.6 1.4% 3.7%
Transportation 1.2 1.7 2.9 3.6 3.0 2.7 -7.2% 4.2%
Callahan
Total Spending 2.4 3.0 3.4 3.6 3.7 3.7 1.9% 2.1%
Non-transportation 2.4 3.0 3.3 3.5 3.5 3.6 1.9% 2.0%
Transportation 0.1 0.1 0.1 0.1 0.2 0.2 1.8% 4.9%
Direct County Travel Spending, 1995-2016p
Ave. Annual Chg. (*Recent oil & gas production may affect estimates.)
See notes on page 114.
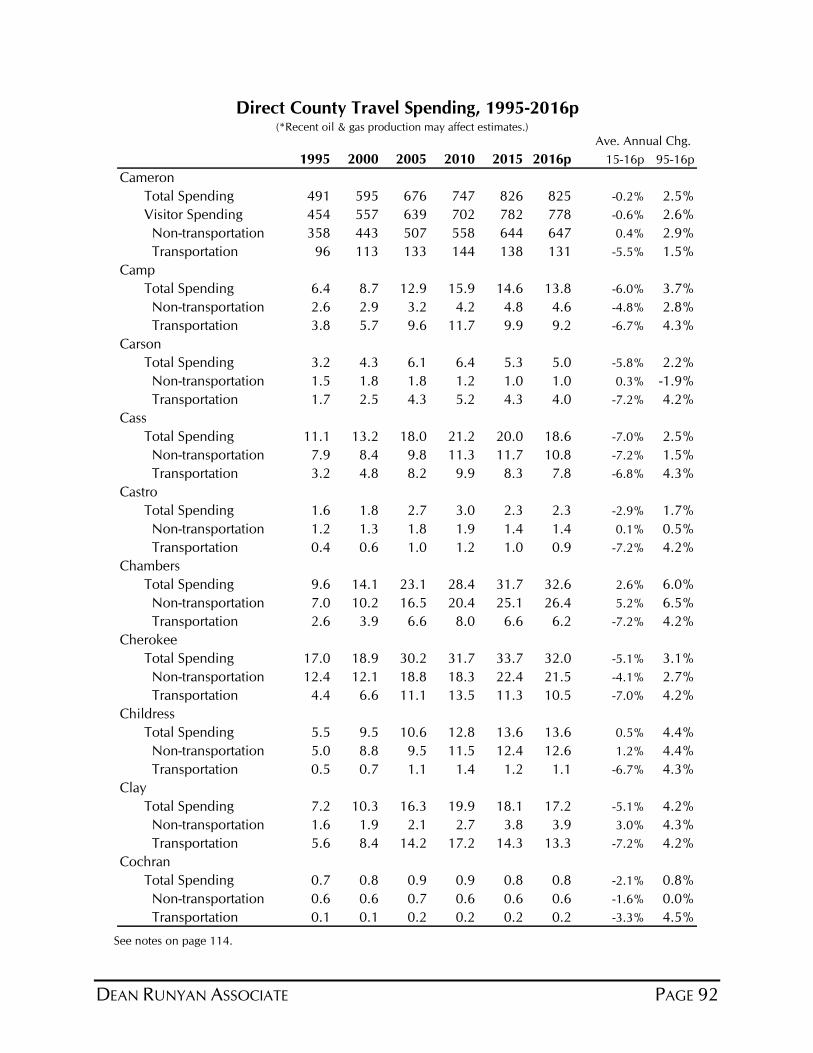
DEAN RUNYAN ASSOCIATE PAGE 92
1995 2000 2005 2010 2015 2016p 15-16p 95-16p
Cameron
Total Spending 491 595 676 747 826 825 -0.2% 2.5%
Visitor Spending 454 557 639 702 782 778 -0.6% 2.6%
Non-transportation 358 443 507 558 644 647 0.4% 2.9%
Transportation 96 113 133 144 138 131 -5.5% 1.5%
Camp
Total Spending 6.4 8.7 12.9 15.9 14.6 13.8 -6.0% 3.7%
Non-transportation 2.6 2.9 3.2 4.2 4.8 4.6 -4.8% 2.8%
Transportation 3.8 5.7 9.6 11.7 9.9 9.2 -6.7% 4.3%
Carson
Total Spending 3.2 4.3 6.1 6.4 5.3 5.0 -5.8% 2.2%
Non-transportation 1.5 1.8 1.8 1.2 1.0 1.0 0.3% -1.9%
Transportation 1.7 2.5 4.3 5.2 4.3 4.0 -7.2% 4.2%
Cass
Total Spending 11.1 13.2 18.0 21.2 20.0 18.6 -7.0% 2.5%
Non-transportation 7.9 8.4 9.8 11.3 11.7 10.8 -7.2% 1.5%
Transportation 3.2 4.8 8.2 9.9 8.3 7.8 -6.8% 4.3%
Castro
Total Spending 1.6 1.8 2.7 3.0 2.3 2.3 -2.9% 1.7%
Non-transportation 1.2 1.3 1.8 1.9 1.4 1.4 0.1% 0.5%
Transportation 0.4 0.6 1.0 1.2 1.0 0.9 -7.2% 4.2%
Chambers
Total Spending 9.6 14.1 23.1 28.4 31.7 32.6 2.6% 6.0%
Non-transportation 7.0 10.2 16.5 20.4 25.1 26.4 5.2% 6.5%
Transportation 2.6 3.9 6.6 8.0 6.6 6.2 -7.2% 4.2%
Cherokee
Total Spending 17.0 18.9 30.2 31.7 33.7 32.0 -5.1% 3.1%
Non-transportation 12.4 12.1 18.8 18.3 22.4 21.5 -4.1% 2.7%
Transportation 4.4 6.6 11.1 13.5 11.3 10.5 -7.0% 4.2%
Childress
Total Spending 5.5 9.5 10.6 12.8 13.6 13.6 0.5% 4.4%
Non-transportation 5.0 8.8 9.5 11.5 12.4 12.6 1.2% 4.4%
Transportation 0.5 0.7 1.1 1.4 1.2 1.1 -6.7% 4.3%
Clay
Total Spending 7.2 10.3 16.3 19.9 18.1 17.2 -5.1% 4.2%
Non-transportation 1.6 1.9 2.1 2.7 3.8 3.9 3.0% 4.3%
Transportation 5.6 8.4 14.2 17.2 14.3 13.3 -7.2% 4.2%
Cochran
Total Spending 0.7 0.8 0.9 0.9 0.8 0.8 -2.1% 0.8%
Non-transportation 0.6 0.6 0.7 0.6 0.6 0.6 -1.6% 0.0%
Transportation 0.1 0.1 0.2 0.2 0.2 0.2 -3.3% 4.5%
Direct County Travel Spending, 1995-2016p
Ave. Annual Chg. (*Recent oil & gas production may affect estimates.)
See notes on page 114.
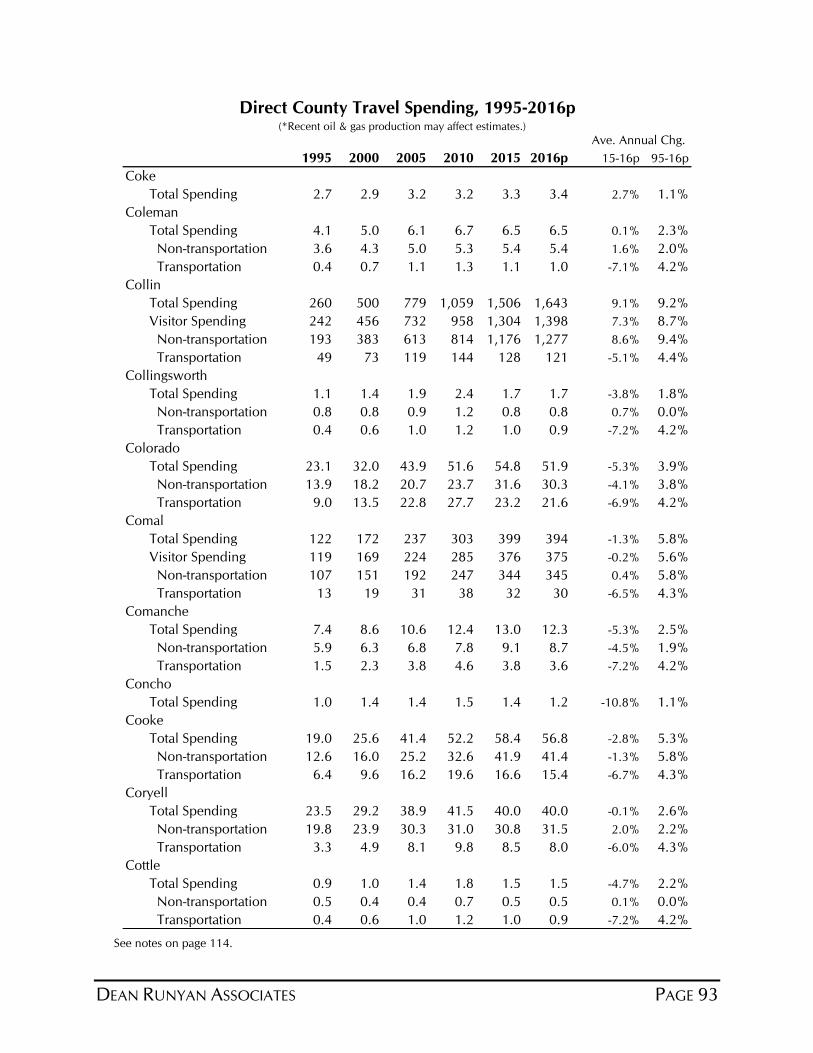
DEAN RUNYAN ASSOCIATES PAGE 93
1995 2000 2005 2010 2015 2016p 15-16p 95-16p
Coke
Total Spending 2.7 2.9 3.2 3.2 3.3 3.4 2.7% 1.1%
Coleman
Total Spending 4.1 5.0 6.1 6.7 6.5 6.5 0.1% 2.3%
Non-transportation 3.6 4.3 5.0 5.3 5.4 5.4 1.6% 2.0%
Transportation 0.4 0.7 1.1 1.3 1.1 1.0 -7.1% 4.2%
Collin
Total Spending 260 500 779 1,059 1,506 1,643 9.1% 9.2%
Visitor Spending 242 456 732 958 1,304 1,398 7.3% 8.7%
Non-transportation 193 383 613 814 1,176 1,277 8.6% 9.4%
Transportation 49 73 119 144 128 121 -5.1% 4.4%
Collingsworth
Total Spending 1.1 1.4 1.9 2.4 1.7 1.7 -3.8% 1.8%
Non-transportation 0.8 0.8 0.9 1.2 0.8 0.8 0.7% 0.0%
Transportation 0.4 0.6 1.0 1.2 1.0 0.9 -7.2% 4.2%
Colorado
Total Spending 23.1 32.0 43.9 51.6 54.8 51.9 -5.3% 3.9%
Non-transportation 13.9 18.2 20.7 23.7 31.6 30.3 -4.1% 3.8%
Transportation 9.0 13.5 22.8 27.7 23.2 21.6 -6.9% 4.2%
Comal
Total Spending 122 172 237 303 399 394 -1.3% 5.8%
Visitor Spending 119 169 224 285 376 375 -0.2% 5.6%
Non-transportation 107 151 192 247 344 345 0.4% 5.8%
Transportation 13 19 31 38 32 30 -6.5% 4.3%
Comanche
Total Spending 7.4 8.6 10.6 12.4 13.0 12.3 -5.3% 2.5%
Non-transportation 5.9 6.3 6.8 7.8 9.1 8.7 -4.5% 1.9%
Transportation 1.5 2.3 3.8 4.6 3.8 3.6 -7.2% 4.2%
Concho
Total Spending 1.0 1.4 1.4 1.5 1.4 1.2 -10.8% 1.1%
Cooke
Total Spending 19.0 25.6 41.4 52.2 58.4 56.8 -2.8% 5.3%
Non-transportation 12.6 16.0 25.2 32.6 41.9 41.4 -1.3% 5.8%
Transportation 6.4 9.6 16.2 19.6 16.6 15.4 -6.7% 4.3%
Coryell
Total Spending 23.5 29.2 38.9 41.5 40.0 40.0 -0.1% 2.6%
Non-transportation 19.8 23.9 30.3 31.0 30.8 31.5 2.0% 2.2%
Transportation 3.3 4.9 8.1 9.8 8.5 8.0 -6.0% 4.3%
Cottle
Total Spending 0.9 1.0 1.4 1.8 1.5 1.5 -4.7% 2.2%
Non-transportation 0.5 0.4 0.4 0.7 0.5 0.5 0.1% 0.0%
Transportation 0.4 0.6 1.0 1.2 1.0 0.9 -7.2% 4.2%
Direct County Travel Spending, 1995-2016p
Ave. Annual Chg. (*Recent oil & gas production may affect estimates.)
See notes on page 114.
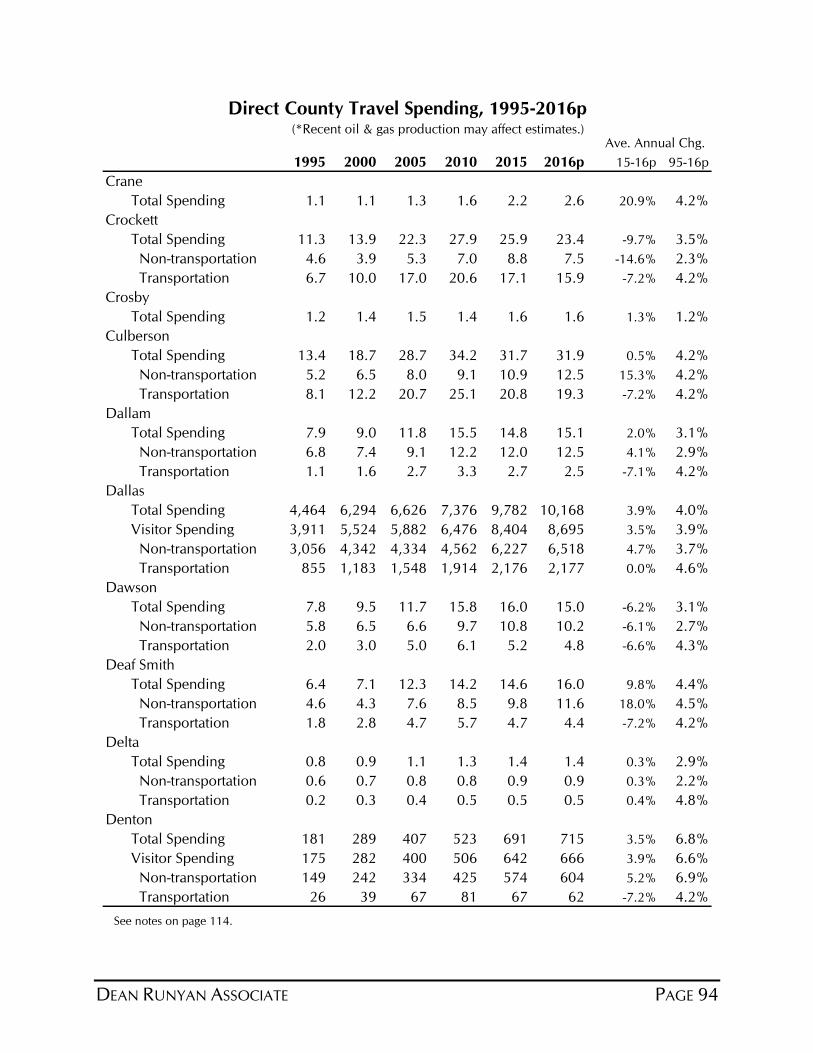
DEAN RUNYAN ASSOCIATE PAGE 94
1995 2000 2005 2010 2015 2016p 15-16p 95-16p
Crane
Total Spending 1.1 1.1 1.3 1.6 2.2 2.6 20.9% 4.2%
Crockett
Total Spending 11.3 13.9 22.3 27.9 25.9 23.4 -9.7% 3.5%
Non-transportation 4.6 3.9 5.3 7.0 8.8 7.5 -14.6% 2.3%
Transportation 6.7 10.0 17.0 20.6 17.1 15.9 -7.2% 4.2%
Crosby
Total Spending 1.2 1.4 1.5 1.4 1.6 1.6 1.3% 1.2%
Culberson
Total Spending 13.4 18.7 28.7 34.2 31.7 31.9 0.5% 4.2%
Non-transportation 5.2 6.5 8.0 9.1 10.9 12.5 15.3% 4.2%
Transportation 8.1 12.2 20.7 25.1 20.8 19.3 -7.2% 4.2%
Dallam
Total Spending 7.9 9.0 11.8 15.5 14.8 15.1 2.0% 3.1%
Non-transportation 6.8 7.4 9.1 12.2 12.0 12.5 4.1% 2.9%
Transportation 1.1 1.6 2.7 3.3 2.7 2.5 -7.1% 4.2%
Dallas
Total Spending 4,464 6,294 6,626 7,376 9,782 10,168 3.9% 4.0%
Visitor Spending 3,911 5,524 5,882 6,476 8,404 8,695 3.5% 3.9%
Non-transportation 3,056 4,342 4,334 4,562 6,227 6,518 4.7% 3.7%
Transportation 855 1,183 1,548 1,914 2,176 2,177 0.0% 4.6%
Dawson
Total Spending 7.8 9.5 11.7 15.8 16.0 15.0 -6.2% 3.1%
Non-transportation 5.8 6.5 6.6 9.7 10.8 10.2 -6.1% 2.7%
Transportation 2.0 3.0 5.0 6.1 5.2 4.8 -6.6% 4.3%
Deaf Smith
Total Spending 6.4 7.1 12.3 14.2 14.6 16.0 9.8% 4.4%
Non-transportation 4.6 4.3 7.6 8.5 9.8 11.6 18.0% 4.5%
Transportation 1.8 2.8 4.7 5.7 4.7 4.4 -7.2% 4.2%
Delta
Total Spending 0.8 0.9 1.1 1.3 1.4 1.4 0.3% 2.9%
Non-transportation 0.6 0.7 0.8 0.8 0.9 0.9 0.3% 2.2%
Transportation 0.2 0.3 0.4 0.5 0.5 0.5 0.4% 4.8%
Denton
Total Spending 181 289 407 523 691 715 3.5% 6.8%
Visitor Spending 175 282 400 506 642 666 3.9% 6.6%
Non-transportation 149 242 334 425 574 604 5.2% 6.9%
Transportation 26 39 67 81 67 62 -7.2% 4.2%
Direct County Travel Spending, 1995-2016p
Ave. Annual Chg.(*Recent oil & gas production may affect estimates.)
See notes on page 114.
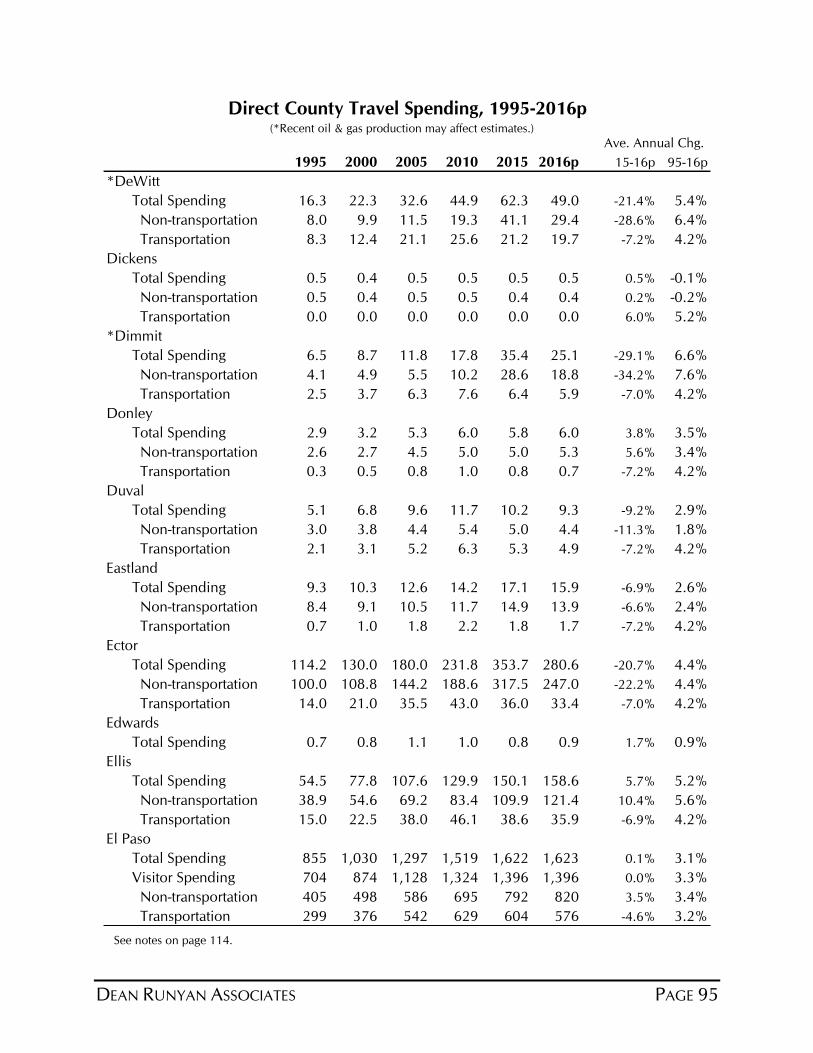
DEAN RUNYAN ASSOCIATES PAGE 95
1995 2000 2005 2010 2015 2016p 15-16p 95-16p
*DeWitt
Total Spending 16.3 22.3 32.6 44.9 62.3 49.0 -21.4% 5.4%
Non-transportation 8.0 9.9 11.5 19.3 41.1 29.4 -28.6% 6.4%
Transportation 8.3 12.4 21.1 25.6 21.2 19.7 -7.2% 4.2%
Dickens
Total Spending 0.5 0.4 0.5 0.5 0.5 0.5 0.5% -0.1%
Non-transportation 0.5 0.4 0.5 0.5 0.4 0.4 0.2% -0.2%
Transportation 0.0 0.0 0.0 0.0 0.0 0.0 6.0% 5.2%
*Dimmit
Total Spending 6.5 8.7 11.8 17.8 35.4 25.1 -29.1% 6.6%
Non-transportation 4.1 4.9 5.5 10.2 28.6 18.8 -34.2% 7.6%
Transportation 2.5 3.7 6.3 7.6 6.4 5.9 -7.0% 4.2%
Donley
Total Spending 2.9 3.2 5.3 6.0 5.8 6.0 3.8% 3.5%
Non-transportation 2.6 2.7 4.5 5.0 5.0 5.3 5.6% 3.4%
Transportation 0.3 0.5 0.8 1.0 0.8 0.7 -7.2% 4.2%
Duval
Total Spending 5.1 6.8 9.6 11.7 10.2 9.3 -9.2% 2.9%
Non-transportation 3.0 3.8 4.4 5.4 5.0 4.4 -11.3% 1.8%
Transportation 2.1 3.1 5.2 6.3 5.3 4.9 -7.2% 4.2%
Eastland
Total Spending 9.3 10.3 12.6 14.2 17.1 15.9 -6.9% 2.6%
Non-transportation 8.4 9.1 10.5 11.7 14.9 13.9 -6.6% 2.4%
Transportation 0.7 1.0 1.8 2.2 1.8 1.7 -7.2% 4.2%
Ector
Total Spending 114.2 130.0 180.0 231.8 353.7 280.6 -20.7% 4.4%
Non-transportation 100.0 108.8 144.2 188.6 317.5 247.0 -22.2% 4.4%
Transportation 14.0 21.0 35.5 43.0 36.0 33.4 -7.0% 4.2%
Edwards
Total Spending 0.7 0.8 1.1 1.0 0.8 0.9 1.7% 0.9%
Ellis
Total Spending 54.5 77.8 107.6 129.9 150.1 158.6 5.7% 5.2%
Non-transportation 38.9 54.6 69.2 83.4 109.9 121.4 10.4% 5.6%
Transportation 15.0 22.5 38.0 46.1 38.6 35.9 -6.9% 4.2%
El Paso
Total Spending 855 1,030 1,297 1,519 1,622 1,623 0.1% 3.1%
Visitor Spending 704 874 1,128 1,324 1,396 1,396 0.0% 3.3%
Non-transportation 405 498 586 695 792 820 3.5% 3.4%
Transportation 299 376 542 629 604 576 -4.6% 3.2%
Direct County Travel Spending, 1995-2016p
Ave. Annual Chg. (*Recent oil & gas production may affect estimates.)
See notes on page 114.

DEAN RUNYAN ASSOCIATE PAGE 96
1995 2000 2005 2010 2015 2016p 15-16p 95-16p
Erath
Total Spending 18.7 24.0 32.9 41.2 43.6 41.7 -4.4% 3.9%
Non-transportation 14.0 17.0 21.1 26.6 31.7 30.6 -3.4% 3.8%
Transportation 4.6 7.0 11.9 14.4 11.9 11.1 -7.2% 4.2%
Falls
Total Spending 5.8 6.7 7.5 8.3 9.7 9.6 -0.5% 2.5%
Non-transportation 4.5 5.0 4.9 5.5 6.9 6.9 0.1% 2.1%
Transportation 1.1 1.5 2.4 2.9 2.8 2.7 -2.1% 4.6%
Fannin
Total Spending 7.4 8.6 9.8 11.3 11.3 13.9 23.6% 3.1%
Non-transportation 5.6 6.0 5.5 6.1 6.6 9.5 43.7% 2.6%
Transportation 1.8 2.6 4.3 5.2 4.6 4.4 -5.2% 4.4%
Fayette
Total Spending 17.4 20.8 27.4 35.5 43.2 41.2 -4.8% 4.2%
Non-transportation 12.8 14.1 16.2 22.0 31.7 30.4 -4.0% 4.2%
Transportation 4.3 6.5 10.9 13.2 11.2 10.4 -6.6% 4.3%
Fisher
Total Spending 0.6 0.7 0.9 1.0 0.9 0.9 -3.2% 2.1%
Non-transportation 0.4 0.4 0.5 0.5 0.5 0.5 0.2% 1.0%
Transportation 0.2 0.2 0.4 0.5 0.4 0.4 -7.2% 4.2%
Floyd
Total Spending 2.3 2.8 4.6 4.7 4.7 4.6 -1.6% 3.3%
Non-transportation 1.2 1.2 1.9 1.4 1.9 2.0 5.7% 2.4%
Transportation 1.1 1.6 2.7 3.3 2.8 2.6 -6.7% 4.3%
Foard
Total Spending 0.3 0.3 0.3 0.3 0.4 0.4 -0.3% 1.2%
Non-transportation 0.2 0.3 0.3 0.3 0.3 0.3 -2.3% 0.3%
Transportation 0.0 0.0 0.1 0.1 0.1 0.1 6.0% 5.2%
Fort Bend
Total Spending 119 196 308 383 506 501 -1.1% 7.1%
Visitor Spending 115 190 298 366 477 469 -1.8% 6.9%
Non-transportation 91 154 238 294 416 412 -1.1% 7.4%
Transportation 24 36 60 72 61 57 -6.6% 4.3%
Franklin
Total Spending 4.1 5.8 7.5 8.1 8.7 9.1 3.6% 3.9%
Non-transportation 3.3 4.7 5.7 5.7 6.8 7.3 5.9% 3.8%
Transportation 0.7 1.1 1.8 2.1 1.9 1.8 -4.8% 4.4%
Freestone
Total Spending 17.0 26.9 39.3 48.5 41.8 39.5 -5.4% 4.1%
Non-transportation 6.8 11.5 13.4 17.1 15.1 14.8 -2.2% 3.8%
Transportation 10.2 15.3 25.9 31.4 26.2 24.4 -7.0% 4.2%
Direct County Travel Spending, 1995-2016p
Ave. Annual Chg. (*Recent oil & gas production may affect estimates.)
See notes on page 114.
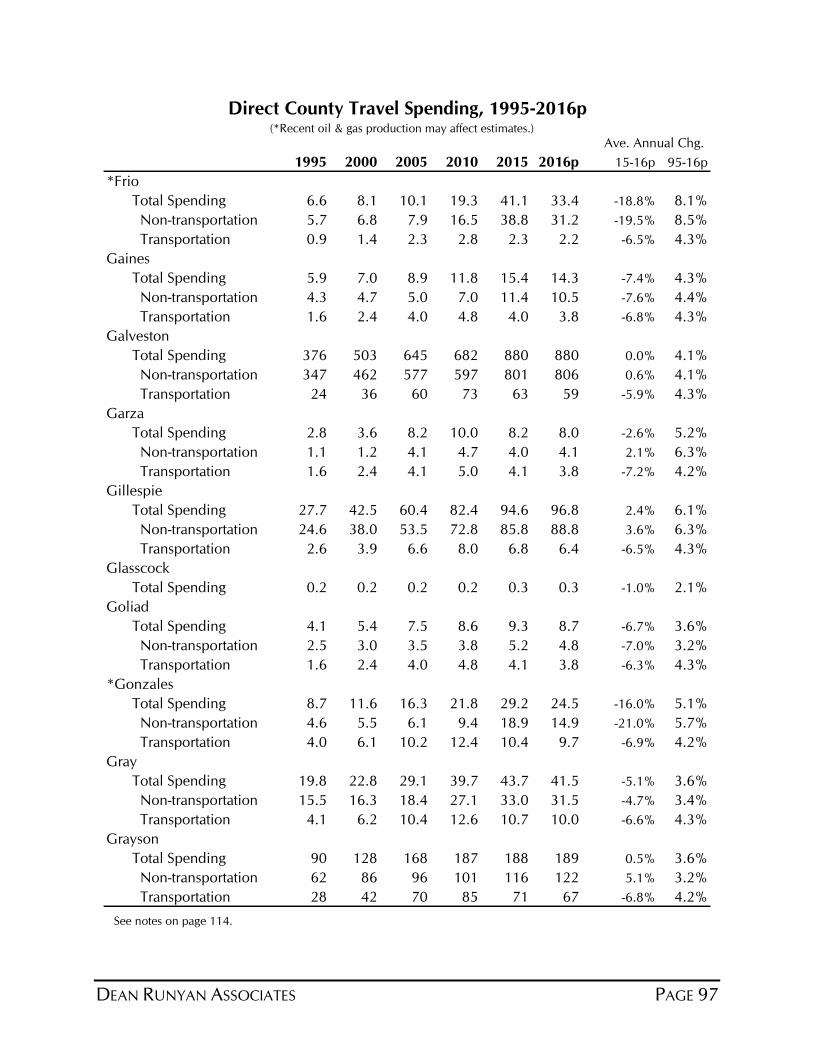
DEAN RUNYAN ASSOCIATES PAGE 97
1995 2000 2005 2010 2015 2016p 15-16p 95-16p
*Frio
Total Spending 6.6 8.1 10.1 19.3 41.1 33.4 -18.8% 8.1%
Non-transportation 5.7 6.8 7.9 16.5 38.8 31.2 -19.5% 8.5%
Transportation 0.9 1.4 2.3 2.8 2.3 2.2 -6.5% 4.3%
Gaines
Total Spending 5.9 7.0 8.9 11.8 15.4 14.3 -7.4% 4.3%
Non-transportation 4.3 4.7 5.0 7.0 11.4 10.5 -7.6% 4.4%
Transportation 1.6 2.4 4.0 4.8 4.0 3.8 -6.8% 4.3%
Galveston
Total Spending 376 503 645 682 880 880 0.0% 4.1%
Non-transportation 347 462 577 597 801 806 0.6% 4.1%
Transportation 24 36 60 73 63 59 -5.9% 4.3%
Garza
Total Spending 2.8 3.6 8.2 10.0 8.2 8.0 -2.6% 5.2%
Non-transportation 1.1 1.2 4.1 4.7 4.0 4.1 2.1% 6.3%
Transportation 1.6 2.4 4.1 5.0 4.1 3.8 -7.2% 4.2%
Gillespie
Total Spending 27.7 42.5 60.4 82.4 94.6 96.8 2.4% 6.1%
Non-transportation 24.6 38.0 53.5 72.8 85.8 88.8 3.6% 6.3%
Transportation 2.6 3.9 6.6 8.0 6.8 6.4 -6.5% 4.3%
Glasscock
Total Spending 0.2 0.2 0.2 0.2 0.3 0.3 -1.0% 2.1%
Goliad
Total Spending 4.1 5.4 7.5 8.6 9.3 8.7 -6.7% 3.6%
Non-transportation 2.5 3.0 3.5 3.8 5.2 4.8 -7.0% 3.2%
Transportation 1.6 2.4 4.0 4.8 4.1 3.8 -6.3% 4.3%
*Gonzales
Total Spending 8.7 11.6 16.3 21.8 29.2 24.5 -16.0% 5.1%
Non-transportation 4.6 5.5 6.1 9.4 18.9 14.9 -21.0% 5.7%
Transportation 4.0 6.1 10.2 12.4 10.4 9.7 -6.9% 4.2%
Gray
Total Spending 19.8 22.8 29.1 39.7 43.7 41.5 -5.1% 3.6%
Non-transportation 15.5 16.3 18.4 27.1 33.0 31.5 -4.7% 3.4%
Transportation 4.1 6.2 10.4 12.6 10.7 10.0 -6.6% 4.3%
Grayson
Total Spending 90 128 168 187 188 189 0.5% 3.6%
Non-transportation 62 86 96 101 116 122 5.1% 3.2%
Transportation 28 42 70 85 71 67 -6.8% 4.2%
Direct County Travel Spending, 1995-2016p
Ave. Annual Chg. (*Recent oil & gas production may affect estimates.)
See notes on page 114.
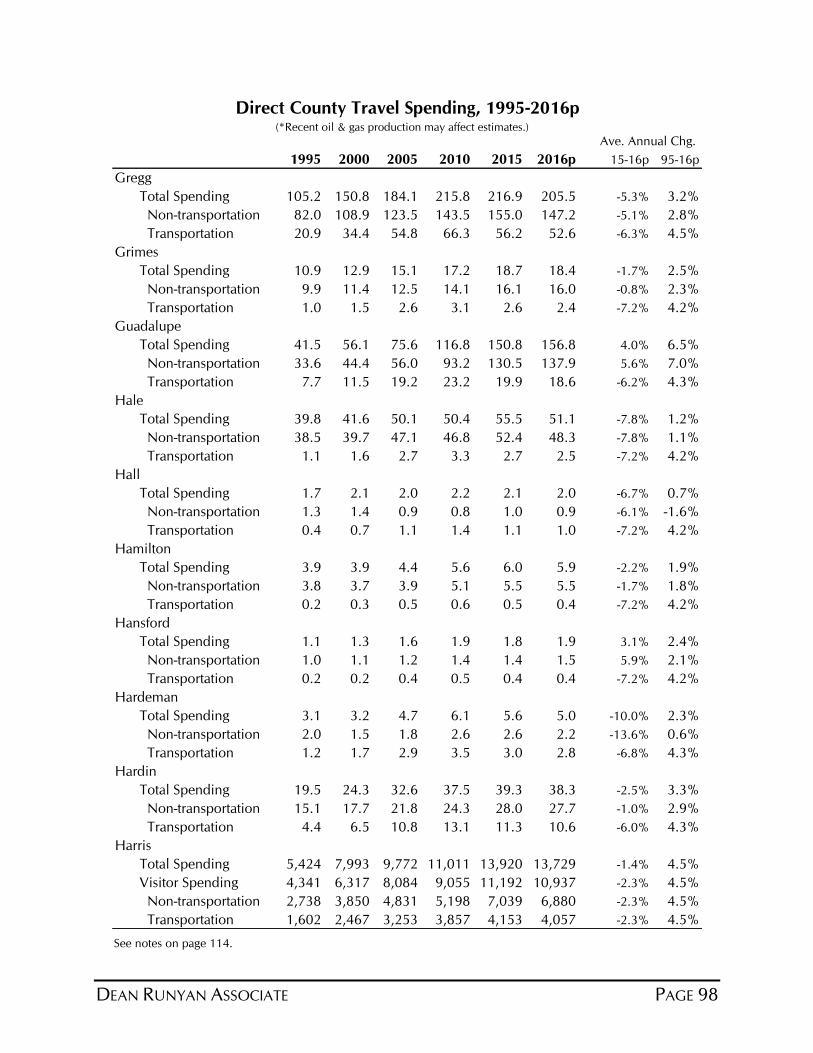
DEAN RUNYAN ASSOCIATE PAGE 98
1995 2000 2005 2010 2015 2016p 15-16p 95-16p
Gregg
Total Spending 105.2 150.8 184.1 215.8 216.9 205.5 -5.3% 3.2%
Non-transportation 82.0 108.9 123.5 143.5 155.0 147.2 -5.1% 2.8%
Transportation 20.9 34.4 54.8 66.3 56.2 52.6 -6.3% 4.5%
Grimes
Total Spending 10.9 12.9 15.1 17.2 18.7 18.4 -1.7% 2.5%
Non-transportation 9.9 11.4 12.5 14.1 16.1 16.0 -0.8% 2.3%
Transportation 1.0 1.5 2.6 3.1 2.6 2.4 -7.2% 4.2%
Guadalupe
Total Spending 41.5 56.1 75.6 116.8 150.8 156.8 4.0% 6.5%
Non-transportation 33.6 44.4 56.0 93.2 130.5 137.9 5.6% 7.0%
Transportation 7.7 11.5 19.2 23.2 19.9 18.6 -6.2% 4.3%
Hale
Total Spending 39.8 41.6 50.1 50.4 55.5 51.1 -7.8% 1.2%
Non-transportation 38.5 39.7 47.1 46.8 52.4 48.3 -7.8% 1.1%
Transportation 1.1 1.6 2.7 3.3 2.7 2.5 -7.2% 4.2%
Hall
Total Spending 1.7 2.1 2.0 2.2 2.1 2.0 -6.7% 0.7%
Non-transportation 1.3 1.4 0.9 0.8 1.0 0.9 -6.1% -1.6%
Transportation 0.4 0.7 1.1 1.4 1.1 1.0 -7.2% 4.2%
Hamilton
Total Spending 3.9 3.9 4.4 5.6 6.0 5.9 -2.2% 1.9%
Non-transportation 3.8 3.7 3.9 5.1 5.5 5.5 -1.7% 1.8%
Transportation 0.2 0.3 0.5 0.6 0.5 0.4 -7.2% 4.2%
Hansford
Total Spending 1.1 1.3 1.6 1.9 1.8 1.9 3.1% 2.4%
Non-transportation 1.0 1.1 1.2 1.4 1.4 1.5 5.9% 2.1%
Transportation 0.2 0.2 0.4 0.5 0.4 0.4 -7.2% 4.2%
Hardeman
Total Spending 3.1 3.2 4.7 6.1 5.6 5.0 -10.0% 2.3%
Non-transportation 2.0 1.5 1.8 2.6 2.6 2.2 -13.6% 0.6%
Transportation 1.2 1.7 2.9 3.5 3.0 2.8 -6.8% 4.3%
Hardin
Total Spending 19.5 24.3 32.6 37.5 39.3 38.3 -2.5% 3.3%
Non-transportation 15.1 17.7 21.8 24.3 28.0 27.7 -1.0% 2.9%
Transportation 4.4 6.5 10.8 13.1 11.3 10.6 -6.0% 4.3%
Harris
Total Spending 5,424 7,993 9,772 11,011 13,920 13,729 -1.4% 4.5%
Visitor Spending 4,341 6,317 8,084 9,055 11,192 10,937 -2.3% 4.5%
Non-transportation 2,738 3,850 4,831 5,198 7,039 6,880 -2.3% 4.5%
Transportation 1,602 2,467 3,253 3,857 4,153 4,057 -2.3% 4.5%
Direct County Travel Spending, 1995-2016p
Ave. Annual Chg. (*Recent oil & gas production may affect estimates.)
See notes on page 114.
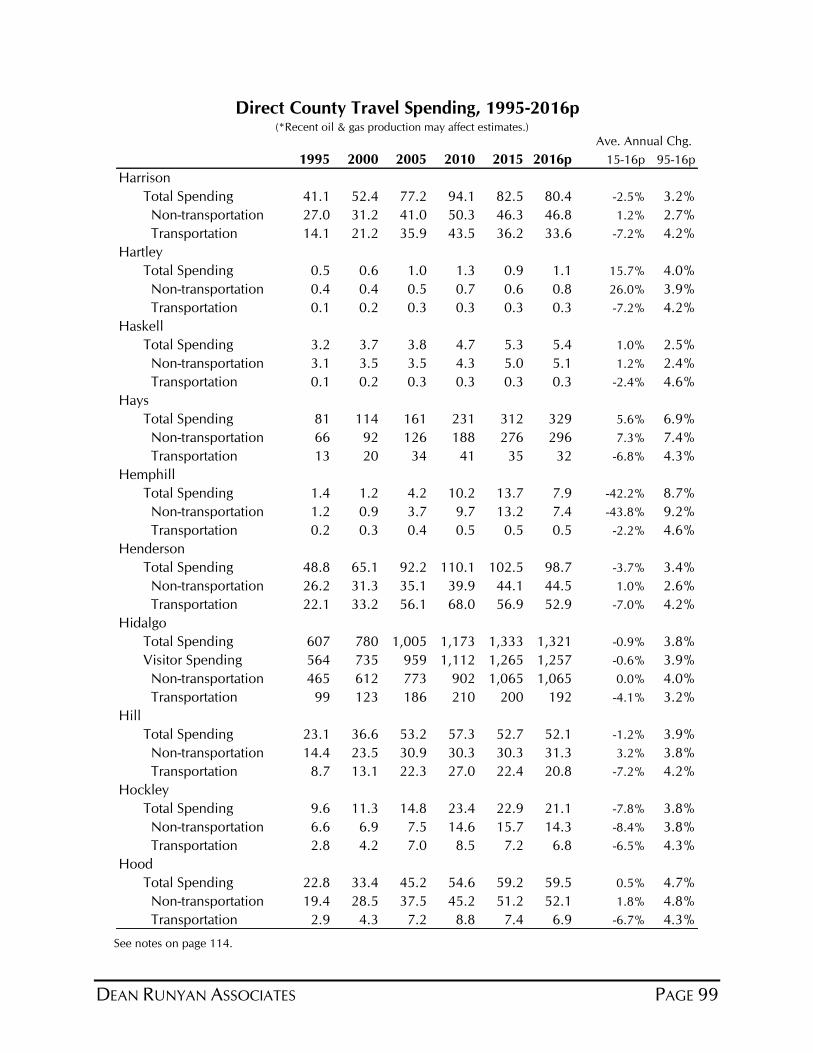
DEAN RUNYAN ASSOCIATES PAGE 99
1995 2000 2005 2010 2015 2016p 15-16p 95-16p
Harrison
Total Spending 41.1 52.4 77.2 94.1 82.5 80.4 -2.5% 3.2%
Non-transportation 27.0 31.2 41.0 50.3 46.3 46.8 1.2% 2.7%
Transportation 14.1 21.2 35.9 43.5 36.2 33.6 -7.2% 4.2%
Hartley
Total Spending 0.5 0.6 1.0 1.3 0.9 1.1 15.7% 4.0%
Non-transportation 0.4 0.4 0.5 0.7 0.6 0.8 26.0% 3.9%
Transportation 0.1 0.2 0.3 0.3 0.3 0.3 -7.2% 4.2%
Haskell
Total Spending 3.2 3.7 3.8 4.7 5.3 5.4 1.0% 2.5%
Non-transportation 3.1 3.5 3.5 4.3 5.0 5.1 1.2% 2.4%
Transportation 0.1 0.2 0.3 0.3 0.3 0.3 -2.4% 4.6%
Hays
Total Spending 81 114 161 231 312 329 5.6% 6.9%
Non-transportation 66 92 126 188 276 296 7.3% 7.4%
Transportation 13 20 34 41 35 32 -6.8% 4.3%
Hemphill
Total Spending 1.4 1.2 4.2 10.2 13.7 7.9 -42.2% 8.7%
Non-transportation 1.2 0.9 3.7 9.7 13.2 7.4 -43.8% 9.2%
Transportation 0.2 0.3 0.4 0.5 0.5 0.5 -2.2% 4.6%
Henderson
Total Spending 48.8 65.1 92.2 110.1 102.5 98.7 -3.7% 3.4%
Non-transportation 26.2 31.3 35.1 39.9 44.1 44.5 1.0% 2.6%
Transportation 22.1 33.2 56.1 68.0 56.9 52.9 -7.0% 4.2%
Hidalgo
Total Spending 607 780 1,005 1,173 1,333 1,321 -0.9% 3.8%
Visitor Spending 564 735 959 1,112 1,265 1,257 -0.6% 3.9%
Non-transportation 465 612 773 902 1,065 1,065 0.0% 4.0%
Transportation 99 123 186 210 200 192 -4.1% 3.2%
Hill
Total Spending 23.1 36.6 53.2 57.3 52.7 52.1 -1.2% 3.9%
Non-transportation 14.4 23.5 30.9 30.3 30.3 31.3 3.2% 3.8%
Transportation 8.7 13.1 22.3 27.0 22.4 20.8 -7.2% 4.2%
Hockley
Total Spending 9.6 11.3 14.8 23.4 22.9 21.1 -7.8% 3.8%
Non-transportation 6.6 6.9 7.5 14.6 15.7 14.3 -8.4% 3.8%
Transportation 2.8 4.2 7.0 8.5 7.2 6.8 -6.5% 4.3%
Hood
Total Spending 22.8 33.4 45.2 54.6 59.2 59.5 0.5% 4.7%
Non-transportation 19.4 28.5 37.5 45.2 51.2 52.1 1.8% 4.8%
Transportation 2.9 4.3 7.2 8.8 7.4 6.9 -6.7% 4.3%
Direct County Travel Spending, 1995-2016p
Ave. Annual Chg. (*Recent oil & gas production may affect estimates.)
See notes on page 114.

DEAN RUNYAN ASSOCIATE PAGE 100
1995 2000 2005 2010 2015 2016p 15-16p 95-16p
Hopkins
Total Spending 28.2 37.6 51.0 61.1 59.3 58.8 -0.9% 3.6%
Non-transportation 17.0 20.8 22.3 26.5 30.4 31.9 5.2% 3.0%
Transportation 11.1 16.7 28.3 34.3 28.6 26.6 -7.1% 4.2%
Houston
Total Spending 16.2 20.5 29.5 33.6 32.4 29.9 -7.8% 3.0%
Non-transportation 8.9 9.7 11.8 12.4 14.3 13.1 -8.3% 1.9%
Transportation 6.9 10.3 17.5 21.2 17.7 16.4 -7.1% 4.2%
Howard
Total Spending 35.6 44.4 65.5 83.1 99.2 88.5 -10.8% 4.4%
Non-transportation 20.2 21.3 26.5 36.2 60.3 52.4 -13.1% 4.6%
Transportation 15.2 22.8 38.7 46.8 39.0 36.2 -7.2% 4.2%
Hudspeth
Total Spending 2.4 2.9 4.5 5.5 4.5 4.3 -4.3% 2.8%
Non-transportation 0.9 0.7 0.7 0.9 0.7 0.7 13.0% -1.0%
Transportation 1.5 2.2 3.8 4.6 3.8 3.5 -7.2% 4.2%
Hunt
Total Spending 46.2 59.3 82.6 95.3 98.3 103.0 4.7% 3.9%
Non-transportation 33.3 40.1 50.0 55.8 65.0 72.2 11.0% 3.7%
Transportation 12.6 19.0 32.3 39.1 32.5 30.1 -7.2% 4.2%
Hutchinson
Total Spending 14.5 19.7 29.3 37.2 42.4 38.9 -8.3% 4.8%
Non-transportation 9.3 11.9 16.5 21.7 29.5 26.9 -8.9% 5.2%
Transportation 4.9 7.3 12.3 14.9 12.5 11.7 -6.8% 4.3%
Irion
Total Spending 3.6 5.3 8.7 10.5 8.9 8.3 -6.7% 4.0%
Non-transportation 0.4 0.4 0.5 0.5 0.6 0.6 1.1% 2.1%
Transportation 3.2 4.9 8.2 10.0 8.3 7.7 -7.2% 4.2%
Jack
Total Spending 3.0 3.3 4.0 5.4 4.0 3.9 -2.5% 1.3%
Non-transportation 2.3 2.4 2.4 3.4 2.4 2.4 0.9% 0.0%
Transportation 0.6 1.0 1.6 2.0 1.7 1.5 -7.2% 4.2%
Jackson
Total Spending 6.1 7.4 8.8 10.8 12.1 11.0 -8.6% 2.9%
Non-transportation 5.5 6.5 7.3 9.0 10.6 9.7 -8.8% 2.7%
Transportation 0.6 0.9 1.5 1.8 1.5 1.4 -7.2% 4.2%
Jasper
Total Spending 25.3 27.8 35.0 33.7 35.5 34.6 -2.4% 1.5%
Non-transportation 22.6 23.8 28.2 25.4 28.6 28.2 -1.2% 1.1%
Transportation 2.7 4.0 6.9 8.3 6.9 6.4 -7.2% 4.2%
Direct County Travel Spending, 1995-2016p
Ave. Annual Chg. (*Recent oil & gas production may affect estimates.)
See notes on page 114.
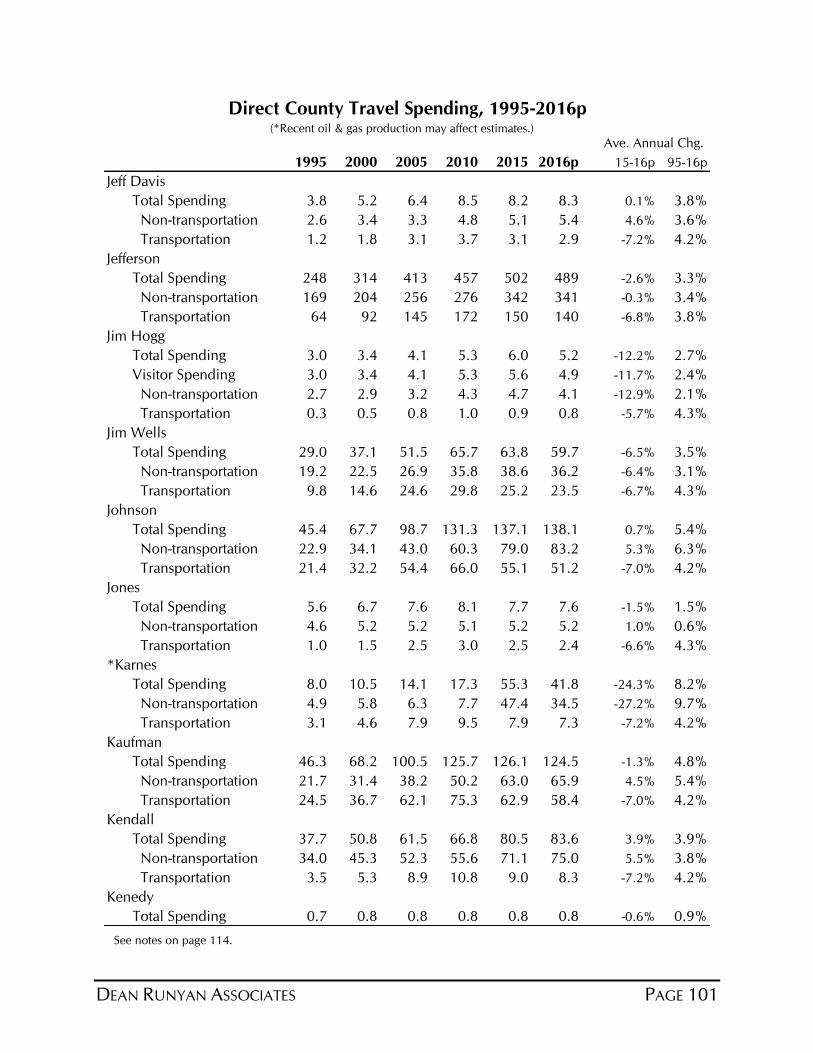
DEAN RUNYAN ASSOCIATES PAGE 101
1995 2000 2005 2010 2015 2016p 15-16p 95-16p
Jeff Davis
Total Spending 3.8 5.2 6.4 8.5 8.2 8.3 0.1% 3.8%
Non-transportation 2.6 3.4 3.3 4.8 5.1 5.4 4.6% 3.6%
Transportation 1.2 1.8 3.1 3.7 3.1 2.9 -7.2% 4.2%
Jefferson
Total Spending 248 314 413 457 502 489 -2.6% 3.3%
Non-transportation 169 204 256 276 342 341 -0.3% 3.4%
Transportation 64 92 145 172 150 140 -6.8% 3.8%
Jim Hogg
Total Spending 3.0 3.4 4.1 5.3 6.0 5.2 -12.2% 2.7%
Visitor Spending 3.0 3.4 4.1 5.3 5.6 4.9 -11.7% 2.4%
Non-transportation 2.7 2.9 3.2 4.3 4.7 4.1 -12.9% 2.1%
Transportation 0.3 0.5 0.8 1.0 0.9 0.8 -5.7% 4.3%
Jim Wells
Total Spending 29.0 37.1 51.5 65.7 63.8 59.7 -6.5% 3.5%
Non-transportation 19.2 22.5 26.9 35.8 38.6 36.2 -6.4% 3.1%
Transportation 9.8 14.6 24.6 29.8 25.2 23.5 -6.7% 4.3%
Johnson
Total Spending 45.4 67.7 98.7 131.3 137.1 138.1 0.7% 5.4%
Non-transportation 22.9 34.1 43.0 60.3 79.0 83.2 5.3% 6.3%
Transportation 21.4 32.2 54.4 66.0 55.1 51.2 -7.0% 4.2%
Jones
Total Spending 5.6 6.7 7.6 8.1 7.7 7.6 -1.5% 1.5%
Non-transportation 4.6 5.2 5.2 5.1 5.2 5.2 1.0% 0.6%
Transportation 1.0 1.5 2.5 3.0 2.5 2.4 -6.6% 4.3%
*Karnes
Total Spending 8.0 10.5 14.1 17.3 55.3 41.8 -24.3% 8.2%
Non-transportation 4.9 5.8 6.3 7.7 47.4 34.5 -27.2% 9.7%
Transportation 3.1 4.6 7.9 9.5 7.9 7.3 -7.2% 4.2%
Kaufman
Total Spending 46.3 68.2 100.5 125.7 126.1 124.5 -1.3% 4.8%
Non-transportation 21.7 31.4 38.2 50.2 63.0 65.9 4.5% 5.4%
Transportation 24.5 36.7 62.1 75.3 62.9 58.4 -7.0% 4.2%
Kendall
Total Spending 37.7 50.8 61.5 66.8 80.5 83.6 3.9% 3.9%
Non-transportation 34.0 45.3 52.3 55.6 71.1 75.0 5.5% 3.8%
Transportation 3.5 5.3 8.9 10.8 9.0 8.3 -7.2% 4.2%
Kenedy
Total Spending 0.7 0.8 0.8 0.8 0.8 0.8 -0.6% 0.9%
Direct County Travel Spending, 1995-2016p
Ave. Annual Chg. (*Recent oil & gas production may affect estimates.)
See notes on page 114.
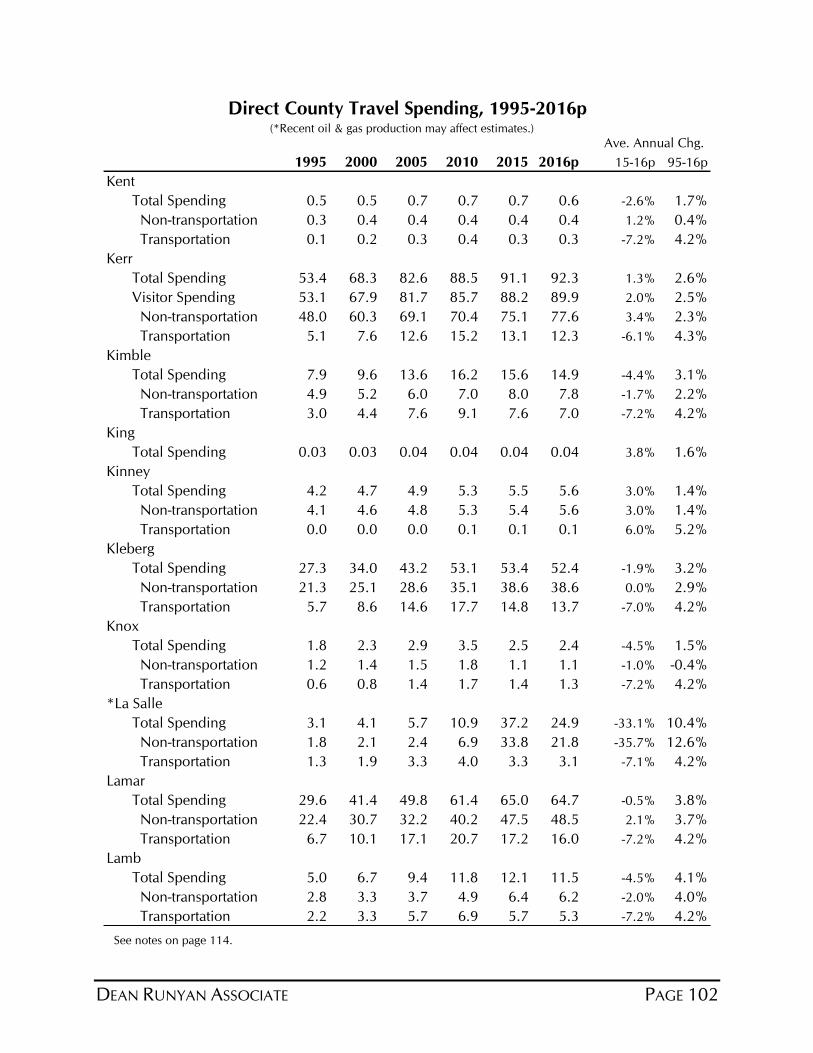
DEAN RUNYAN ASSOCIATE PAGE 102
1995 2000 2005 2010 2015 2016p 15-16p 95-16p
Kent
Total Spending 0.5 0.5 0.7 0.7 0.7 0.6 -2.6% 1.7%
Non-transportation 0.3 0.4 0.4 0.4 0.4 0.4 1.2% 0.4%
Transportation 0.1 0.2 0.3 0.4 0.3 0.3 -7.2% 4.2%
Kerr
Total Spending 53.4 68.3 82.6 88.5 91.1 92.3 1.3% 2.6%
Visitor Spending 53.1 67.9 81.7 85.7 88.2 89.9 2.0% 2.5%
Non-transportation 48.0 60.3 69.1 70.4 75.1 77.6 3.4% 2.3%
Transportation 5.1 7.6 12.6 15.2 13.1 12.3 -6.1% 4.3%
Kimble
Total Spending 7.9 9.6 13.6 16.2 15.6 14.9 -4.4% 3.1%
Non-transportation 4.9 5.2 6.0 7.0 8.0 7.8 -1.7% 2.2%
Transportation 3.0 4.4 7.6 9.1 7.6 7.0 -7.2% 4.2%
King
Total Spending 0.03 0.03 0.04 0.04 0.04 0.04 3.8% 1.6%
Kinney
Total Spending 4.2 4.7 4.9 5.3 5.5 5.6 3.0% 1.4%
Non-transportation 4.1 4.6 4.8 5.3 5.4 5.6 3.0% 1.4%
Transportation 0.0 0.0 0.0 0.1 0.1 0.1 6.0% 5.2%
Kleberg
Total Spending 27.3 34.0 43.2 53.1 53.4 52.4 -1.9% 3.2%
Non-transportation 21.3 25.1 28.6 35.1 38.6 38.6 0.0% 2.9%
Transportation 5.7 8.6 14.6 17.7 14.8 13.7 -7.0% 4.2%
Knox
Total Spending 1.8 2.3 2.9 3.5 2.5 2.4 -4.5% 1.5%
Non-transportation 1.2 1.4 1.5 1.8 1.1 1.1 -1.0% -0.4%
Transportation 0.6 0.8 1.4 1.7 1.4 1.3 -7.2% 4.2%
*La Salle
Total Spending 3.1 4.1 5.7 10.9 37.2 24.9 -33.1% 10.4%
Non-transportation 1.8 2.1 2.4 6.9 33.8 21.8 -35.7% 12.6%
Transportation 1.3 1.9 3.3 4.0 3.3 3.1 -7.1% 4.2%
Lamar
Total Spending 29.6 41.4 49.8 61.4 65.0 64.7 -0.5% 3.8%
Non-transportation 22.4 30.7 32.2 40.2 47.5 48.5 2.1% 3.7%
Transportation 6.7 10.1 17.1 20.7 17.2 16.0 -7.2% 4.2%
Lamb
Total Spending 5.0 6.7 9.4 11.8 12.1 11.5 -4.5% 4.1%
Non-transportation 2.8 3.3 3.7 4.9 6.4 6.2 -2.0% 4.0%
Transportation 2.2 3.3 5.7 6.9 5.7 5.3 -7.2% 4.2%
Direct County Travel Spending, 1995-2016p
Ave. Annual Chg. (*Recent oil & gas production may affect estimates.)
See notes on page 114.
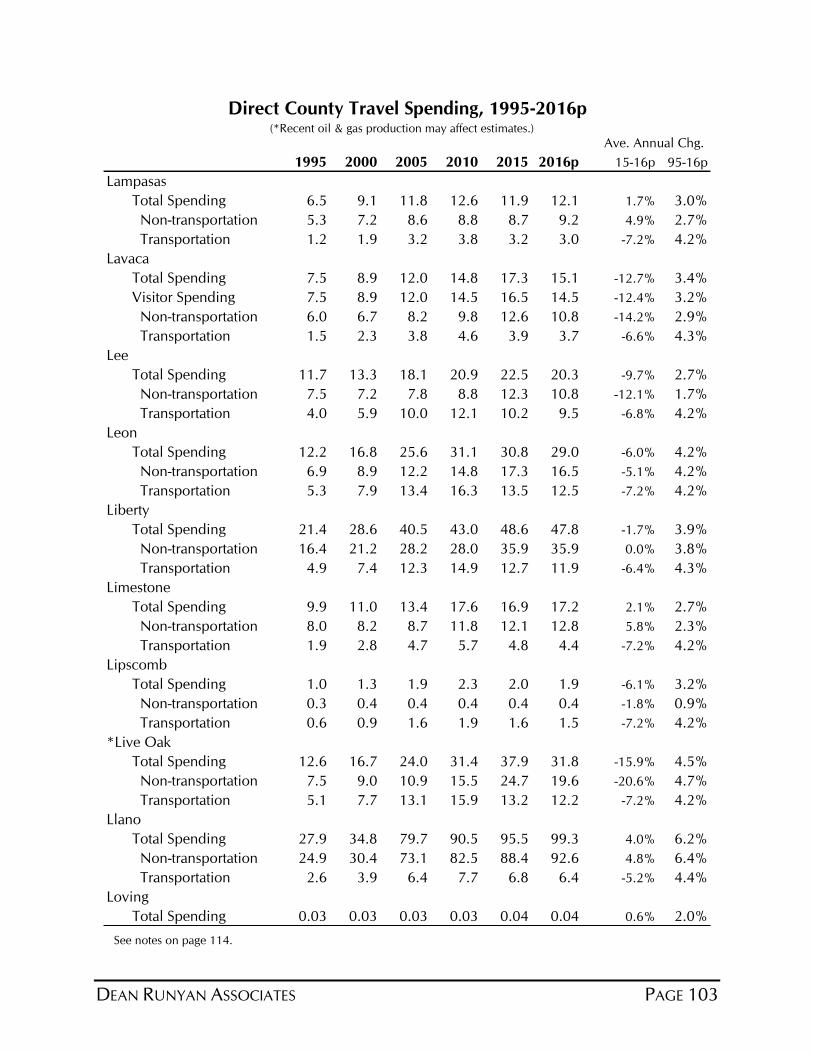
DEAN RUNYAN ASSOCIATES PAGE 103
1995 2000 2005 2010 2015 2016p 15-16p 95-16p
Lampasas
Total Spending 6.5 9.1 11.8 12.6 11.9 12.1 1.7% 3.0%
Non-transportation 5.3 7.2 8.6 8.8 8.7 9.2 4.9% 2.7%
Transportation 1.2 1.9 3.2 3.8 3.2 3.0 -7.2% 4.2%
Lavaca
Total Spending 7.5 8.9 12.0 14.8 17.3 15.1 -12.7% 3.4%
Visitor Spending 7.5 8.9 12.0 14.5 16.5 14.5 -12.4% 3.2%
Non-transportation 6.0 6.7 8.2 9.8 12.6 10.8 -14.2% 2.9%
Transportation 1.5 2.3 3.8 4.6 3.9 3.7 -6.6% 4.3%
Lee
Total Spending 11.7 13.3 18.1 20.9 22.5 20.3 -9.7% 2.7%
Non-transportation 7.5 7.2 7.8 8.8 12.3 10.8 -12.1% 1.7%
Transportation 4.0 5.9 10.0 12.1 10.2 9.5 -6.8% 4.2%
Leon
Total Spending 12.2 16.8 25.6 31.1 30.8 29.0 -6.0% 4.2%
Non-transportation 6.9 8.9 12.2 14.8 17.3 16.5 -5.1% 4.2%
Transportation 5.3 7.9 13.4 16.3 13.5 12.5 -7.2% 4.2%
Liberty
Total Spending 21.4 28.6 40.5 43.0 48.6 47.8 -1.7% 3.9%
Non-transportation 16.4 21.2 28.2 28.0 35.9 35.9 0.0% 3.8%
Transportation 4.9 7.4 12.3 14.9 12.7 11.9 -6.4% 4.3%
Limestone
Total Spending 9.9 11.0 13.4 17.6 16.9 17.2 2.1% 2.7%
Non-transportation 8.0 8.2 8.7 11.8 12.1 12.8 5.8% 2.3%
Transportation 1.9 2.8 4.7 5.7 4.8 4.4 -7.2% 4.2%
Lipscomb
Total Spending 1.0 1.3 1.9 2.3 2.0 1.9 -6.1% 3.2%
Non-transportation 0.3 0.4 0.4 0.4 0.4 0.4 -1.8% 0.9%
Transportation 0.6 0.9 1.6 1.9 1.6 1.5 -7.2% 4.2%
*Live Oak
Total Spending 12.6 16.7 24.0 31.4 37.9 31.8 -15.9% 4.5%
Non-transportation 7.5 9.0 10.9 15.5 24.7 19.6 -20.6% 4.7%
Transportation 5.1 7.7 13.1 15.9 13.2 12.2 -7.2% 4.2%
Llano
Total Spending 27.9 34.8 79.7 90.5 95.5 99.3 4.0% 6.2%
Non-transportation 24.9 30.4 73.1 82.5 88.4 92.6 4.8% 6.4%
Transportation 2.6 3.9 6.4 7.7 6.8 6.4 -5.2% 4.4%
Loving
Total Spending 0.03 0.03 0.03 0.03 0.04 0.04 0.6% 2.0%
Direct County Travel Spending, 1995-2016p
Ave. Annual Chg. (*Recent oil & gas production may affect estimates.)
See notes on page 114.
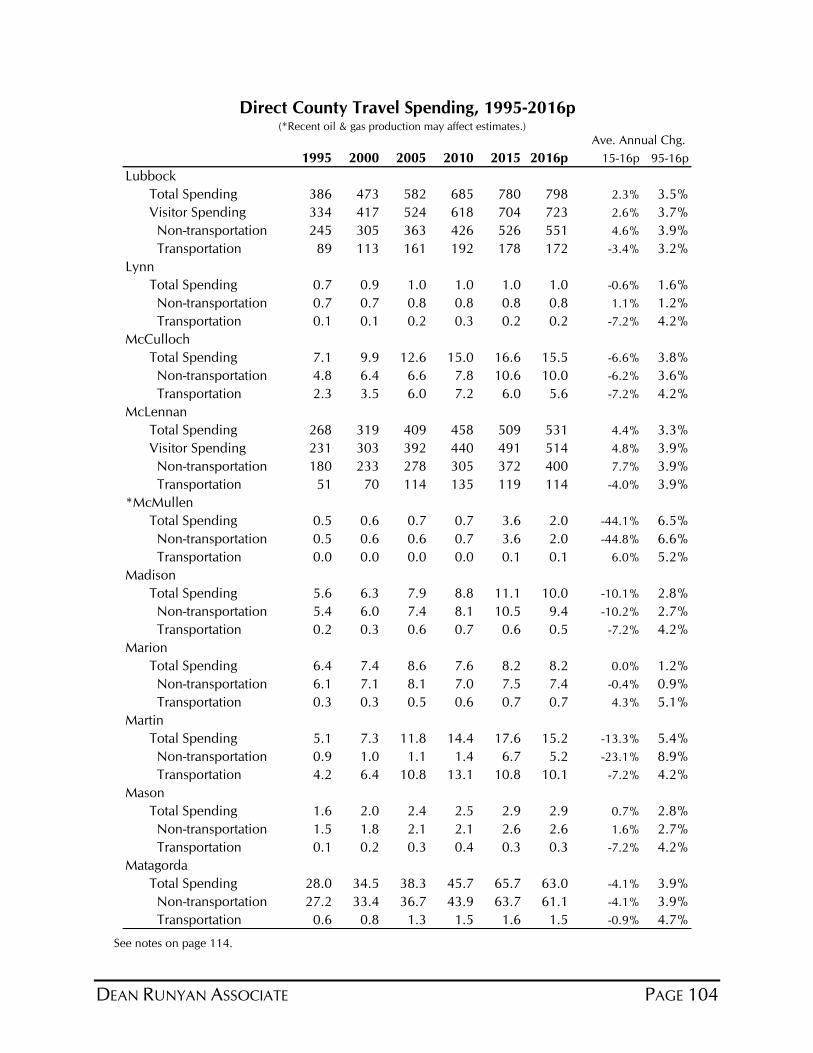
DEAN RUNYAN ASSOCIATE PAGE 104
1995 2000 2005 2010 2015 2016p 15-16p 95-16p
Lubbock
Total Spending 386 473 582 685 780 798 2.3% 3.5%
Visitor Spending 334 417 524 618 704 723 2.6% 3.7%
Non-transportation 245 305 363 426 526 551 4.6% 3.9%
Transportation 89 113 161 192 178 172 -3.4% 3.2%
Lynn
Total Spending 0.7 0.9 1.0 1.0 1.0 1.0 -0.6% 1.6%
Non-transportation 0.7 0.7 0.8 0.8 0.8 0.8 1.1% 1.2%
Transportation 0.1 0.1 0.2 0.3 0.2 0.2 -7.2% 4.2%
McCulloch
Total Spending 7.1 9.9 12.6 15.0 16.6 15.5 -6.6% 3.8%
Non-transportation 4.8 6.4 6.6 7.8 10.6 10.0 -6.2% 3.6%
Transportation 2.3 3.5 6.0 7.2 6.0 5.6 -7.2% 4.2%
McLennan
Total Spending 268 319 409 458 509 531 4.4% 3.3%
Visitor Spending 231 303 392 440 491 514 4.8% 3.9%
Non-transportation 180 233 278 305 372 400 7.7% 3.9%
Transportation 51 70 114 135 119 114 -4.0% 3.9%
*McMullen
Total Spending 0.5 0.6 0.7 0.7 3.6 2.0 -44.1% 6.5%
Non-transportation 0.5 0.6 0.6 0.7 3.6 2.0 -44.8% 6.6%
Transportation 0.0 0.0 0.0 0.0 0.1 0.1 6.0% 5.2%
Madison
Total Spending 5.6 6.3 7.9 8.8 11.1 10.0 -10.1% 2.8%
Non-transportation 5.4 6.0 7.4 8.1 10.5 9.4 -10.2% 2.7%
Transportation 0.2 0.3 0.6 0.7 0.6 0.5 -7.2% 4.2%
Marion
Total Spending 6.4 7.4 8.6 7.6 8.2 8.2 0.0% 1.2%
Non-transportation 6.1 7.1 8.1 7.0 7.5 7.4 -0.4% 0.9%
Transportation 0.3 0.3 0.5 0.6 0.7 0.7 4.3% 5.1%
Martin
Total Spending 5.1 7.3 11.8 14.4 17.6 15.2 -13.3% 5.4%
Non-transportation 0.9 1.0 1.1 1.4 6.7 5.2 -23.1% 8.9%
Transportation 4.2 6.4 10.8 13.1 10.8 10.1 -7.2% 4.2%
Mason
Total Spending 1.6 2.0 2.4 2.5 2.9 2.9 0.7% 2.8%
Non-transportation 1.5 1.8 2.1 2.1 2.6 2.6 1.6% 2.7%
Transportation 0.1 0.2 0.3 0.4 0.3 0.3 -7.2% 4.2%
Matagorda
Total Spending 28.0 34.5 38.3 45.7 65.7 63.0 -4.1% 3.9%
Non-transportation 27.2 33.4 36.7 43.9 63.7 61.1 -4.1% 3.9%
Transportation 0.6 0.8 1.3 1.5 1.6 1.5 -0.9% 4.7%
Direct County Travel Spending, 1995-2016p
Ave. Annual Chg. (*Recent oil & gas production may affect estimates.)
See notes on page 114.
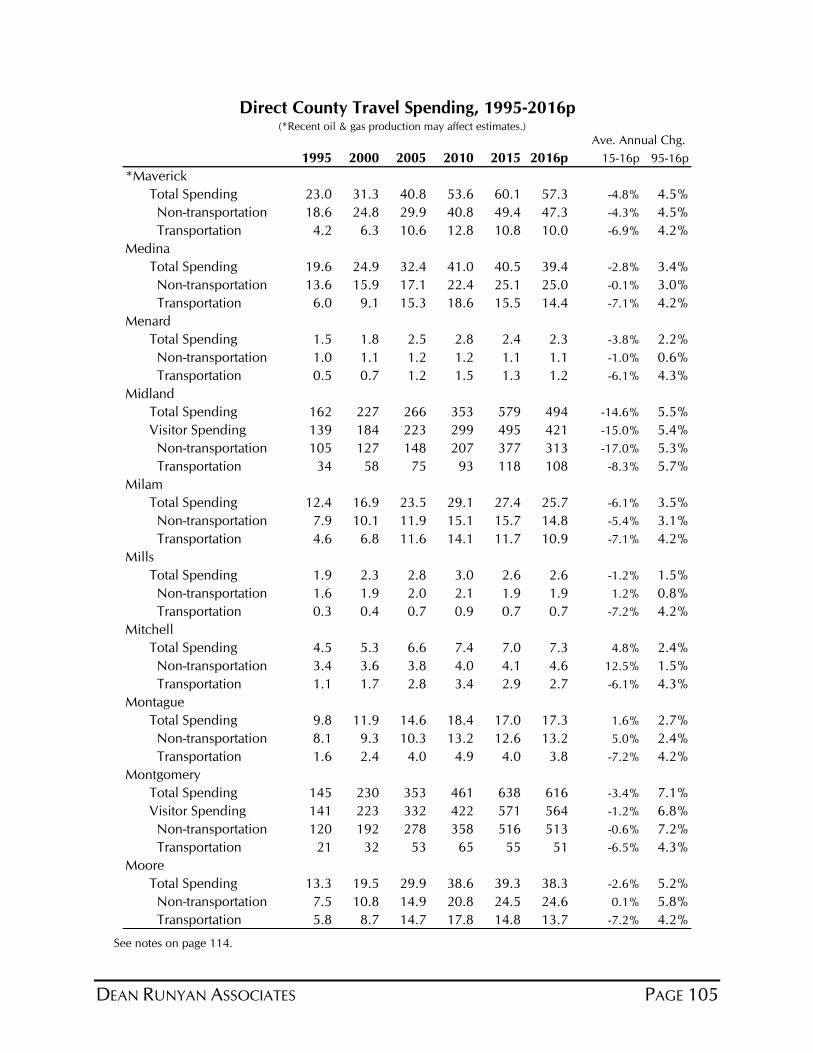
DEAN RUNYAN ASSOCIATES PAGE 105
1995 2000 2005 2010 2015 2016p 15-16p 95-16p
*Maverick
Total Spending 23.0 31.3 40.8 53.6 60.1 57.3 -4.8% 4.5%
Non-transportation 18.6 24.8 29.9 40.8 49.4 47.3 -4.3% 4.5%
Transportation 4.2 6.3 10.6 12.8 10.8 10.0 -6.9% 4.2%
Medina
Total Spending 19.6 24.9 32.4 41.0 40.5 39.4 -2.8% 3.4%
Non-transportation 13.6 15.9 17.1 22.4 25.1 25.0 -0.1% 3.0%
Transportation 6.0 9.1 15.3 18.6 15.5 14.4 -7.1% 4.2%
Menard
Total Spending 1.5 1.8 2.5 2.8 2.4 2.3 -3.8% 2.2%
Non-transportation 1.0 1.1 1.2 1.2 1.1 1.1 -1.0% 0.6%
Transportation 0.5 0.7 1.2 1.5 1.3 1.2 -6.1% 4.3%
Midland
Total Spending 162 227 266 353 579 494 -14.6% 5.5%
Visitor Spending 139 184 223 299 495 421 -15.0% 5.4%
Non-transportation 105 127 148 207 377 313 -17.0% 5.3%
Transportation 34 58 75 93 118 108 -8.3% 5.7%
Milam
Total Spending 12.4 16.9 23.5 29.1 27.4 25.7 -6.1% 3.5%
Non-transportation 7.9 10.1 11.9 15.1 15.7 14.8 -5.4% 3.1%
Transportation 4.6 6.8 11.6 14.1 11.7 10.9 -7.1% 4.2%
Mills
Total Spending 1.9 2.3 2.8 3.0 2.6 2.6 -1.2% 1.5%
Non-transportation 1.6 1.9 2.0 2.1 1.9 1.9 1.2% 0.8%
Transportation 0.3 0.4 0.7 0.9 0.7 0.7 -7.2% 4.2%
Mitchell
Total Spending 4.5 5.3 6.6 7.4 7.0 7.3 4.8% 2.4%
Non-transportation 3.4 3.6 3.8 4.0 4.1 4.6 12.5% 1.5%
Transportation 1.1 1.7 2.8 3.4 2.9 2.7 -6.1% 4.3%
Montague
Total Spending 9.8 11.9 14.6 18.4 17.0 17.3 1.6% 2.7%
Non-transportation 8.1 9.3 10.3 13.2 12.6 13.2 5.0% 2.4%
Transportation 1.6 2.4 4.0 4.9 4.0 3.8 -7.2% 4.2%
Montgomery
Total Spending 145 230 353 461 638 616 -3.4% 7.1%
Visitor Spending 141 223 332 422 571 564 -1.2% 6.8%
Non-transportation 120 192 278 358 516 513 -0.6% 7.2%
Transportation 21 32 53 65 55 51 -6.5% 4.3%
Moore
Total Spending 13.3 19.5 29.9 38.6 39.3 38.3 -2.6% 5.2%
Non-transportation 7.5 10.8 14.9 20.8 24.5 24.6 0.1% 5.8%
Transportation 5.8 8.7 14.7 17.8 14.8 13.7 -7.2% 4.2%
Direct County Travel Spending, 1995-2016p
Ave. Annual Chg. (*Recent oil & gas production may affect estimates.)
See notes on page 114.
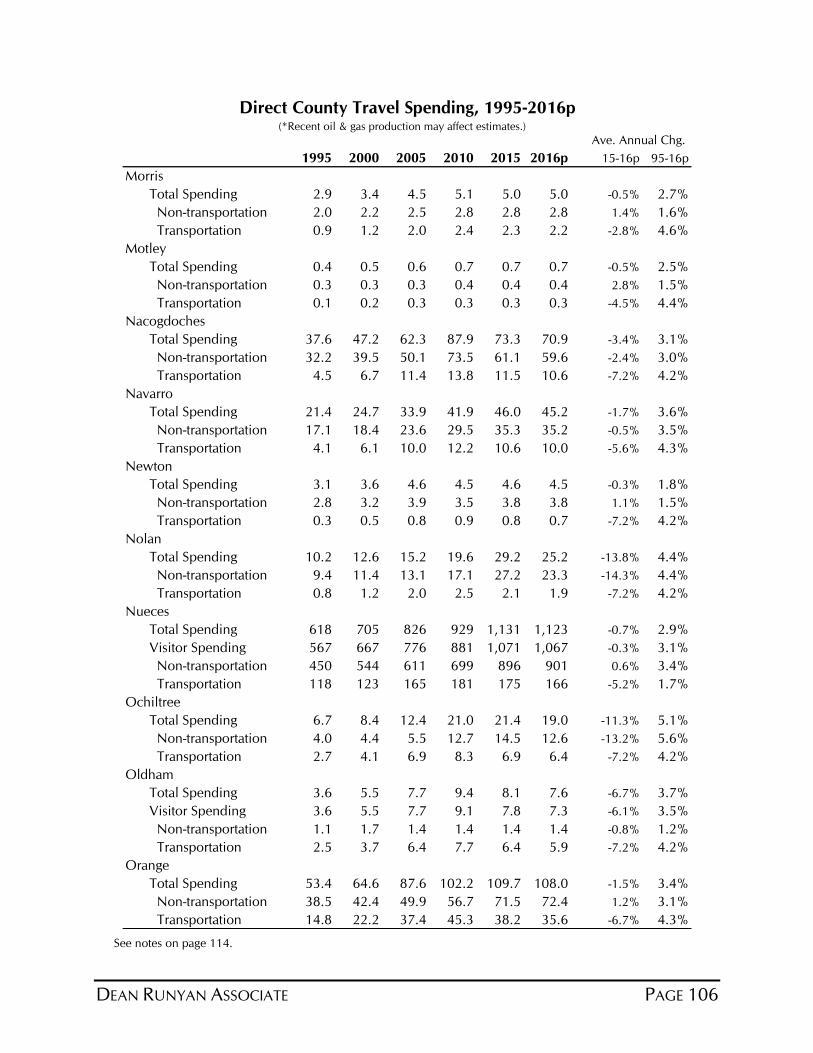
DEAN RUNYAN ASSOCIATE PAGE 106
1995 2000 2005 2010 2015 2016p 15-16p 95-16p
Morris
Total Spending 2.9 3.4 4.5 5.1 5.0 5.0 -0.5% 2.7%
Non-transportation 2.0 2.2 2.5 2.8 2.8 2.8 1.4% 1.6%
Transportation 0.9 1.2 2.0 2.4 2.3 2.2 -2.8% 4.6%
Motley
Total Spending 0.4 0.5 0.6 0.7 0.7 0.7 -0.5% 2.5%
Non-transportation 0.3 0.3 0.3 0.4 0.4 0.4 2.8% 1.5%
Transportation 0.1 0.2 0.3 0.3 0.3 0.3 -4.5% 4.4%
Nacogdoches
Total Spending 37.6 47.2 62.3 87.9 73.3 70.9 -3.4% 3.1%
Non-transportation 32.2 39.5 50.1 73.5 61.1 59.6 -2.4% 3.0%
Transportation 4.5 6.7 11.4 13.8 11.5 10.6 -7.2% 4.2%
Navarro
Total Spending 21.4 24.7 33.9 41.9 46.0 45.2 -1.7% 3.6%
Non-transportation 17.1 18.4 23.6 29.5 35.3 35.2 -0.5% 3.5%
Transportation 4.1 6.1 10.0 12.2 10.6 10.0 -5.6% 4.3%
Newton
Total Spending 3.1 3.6 4.6 4.5 4.6 4.5 -0.3% 1.8%
Non-transportation 2.8 3.2 3.9 3.5 3.8 3.8 1.1% 1.5%
Transportation 0.3 0.5 0.8 0.9 0.8 0.7 -7.2% 4.2%
Nolan
Total Spending 10.2 12.6 15.2 19.6 29.2 25.2 -13.8% 4.4%
Non-transportation 9.4 11.4 13.1 17.1 27.2 23.3 -14.3% 4.4%
Transportation 0.8 1.2 2.0 2.5 2.1 1.9 -7.2% 4.2%
Nueces
Total Spending 618 705 826 929 1,131 1,123 -0.7% 2.9%
Visitor Spending 567 667 776 881 1,071 1,067 -0.3% 3.1%
Non-transportation 450 544 611 699 896 901 0.6% 3.4%
Transportation 118 123 165 181 175 166 -5.2% 1.7%
Ochiltree
Total Spending 6.7 8.4 12.4 21.0 21.4 19.0 -11.3% 5.1%
Non-transportation 4.0 4.4 5.5 12.7 14.5 12.6 -13.2% 5.6%
Transportation 2.7 4.1 6.9 8.3 6.9 6.4 -7.2% 4.2%
Oldham
Total Spending 3.6 5.5 7.7 9.4 8.1 7.6 -6.7% 3.7%
Visitor Spending 3.6 5.5 7.7 9.1 7.8 7.3 -6.1% 3.5%
Non-transportation 1.1 1.7 1.4 1.4 1.4 1.4 -0.8% 1.2%
Transportation 2.5 3.7 6.4 7.7 6.4 5.9 -7.2% 4.2%
Orange
Total Spending 53.4 64.6 87.6 102.2 109.7 108.0 -1.5% 3.4%
Non-transportation 38.5 42.4 49.9 56.7 71.5 72.4 1.2% 3.1%
Transportation 14.8 22.2 37.4 45.3 38.2 35.6 -6.7% 4.3%
Direct County Travel Spending, 1995-2016p
Ave. Annual Chg. (*Recent oil & gas production may affect estimates.)
See notes on page 114.

DEAN RUNYAN ASSOCIATES PAGE 107
1995 2000 2005 2010 2015 2016p 15-16p 95-16p
Palo Pinto
Total Spending 27.8 44.8 62.1 73.0 63.6 61.6 -3.2% 3.9%
Non-transportation 15.1 25.7 30.3 34.5 31.5 31.8 1.0% 3.6%
Transportation 12.4 18.6 31.5 38.2 31.8 29.5 -7.1% 4.2%
Panola
Total Spending 6.2 8.1 12.4 22.0 18.2 14.7 -18.8% 4.2%
Non-transportation 4.8 6.0 9.2 18.4 15.1 11.8 -21.4% 4.4%
Transportation 1.2 1.8 3.0 3.6 3.1 2.9 -6.1% 4.3%
Parker
Total Spending 41.4 55.6 87.8 97.2 101.6 100.9 -0.7% 4.3%
Non-transportation 27.0 34.1 51.4 53.1 64.7 66.7 3.1% 4.4%
Transportation 14.1 21.2 36.0 43.6 36.3 33.7 -7.1% 4.2%
Parmer
Total Spending 2.6 2.9 4.2 4.8 4.4 4.3 -1.3% 2.5%
Non-transportation 1.6 1.4 1.6 1.6 1.7 1.9 7.3% 0.8%
Transportation 1.0 1.6 2.6 3.2 2.7 2.5 -6.9% 4.2%
Pecos
Total Spending 18.3 23.9 33.5 46.7 53.5 51.6 -3.4% 5.1%
Non-transportation 12.1 14.6 17.6 27.4 37.5 36.8 -1.8% 5.4%
Transportation 6.2 9.4 15.9 19.3 16.0 14.8 -7.2% 4.2%
Polk
Total Spending 26.7 34.3 44.5 49.0 51.5 51.3 -0.3% 3.2%
Non-transportation 20.5 25.0 29.1 30.7 36.0 36.9 2.7% 2.9%
Transportation 5.9 8.8 14.8 18.0 15.1 14.1 -6.8% 4.2%
Potter
Total Spending 430 506 606 701 789 779 -1.3% 2.9%
Visitor Spending 393 462 558 649 728 721 -1.0% 2.9%
Non-transportation 311 348 391 452 547 551 0.7% 2.8%
Transportation 82 114 167 197 181 170 -6.1% 3.5%
Presidio
Total Spending 2.7 4.2 6.8 8.2 9.9 13.0 31.5% 7.7%
Non-transportation 2.2 3.4 5.4 6.5 8.5 11.7 37.9% 8.3%
Transportation 0.5 0.8 1.4 1.7 1.4 1.3 -7.2% 4.4%
Rains
Total Spending 3.5 5.0 6.1 6.2 7.5 7.6 0.4% 3.8%
Non-transportation 2.8 4.1 4.5 4.3 5.9 6.0 2.1% 3.7%
Transportation 0.6 0.9 1.6 1.9 1.6 1.6 -5.7% 4.3%
Randall
Total Spending 46.4 65.1 85.9 105.6 103.6 103.3 -0.3% 3.9%
Non-transportation 29.7 40.0 43.2 54.0 60.8 63.6 4.5% 3.7%
Transportation 16.7 25.1 42.6 51.6 42.8 39.8 -7.2% 4.2%
Direct County Travel Spending, 1995-2016p
Ave. Annual Chg. (*Recent oil & gas production may affect estimates.)
See notes on page 114.

DEAN RUNYAN ASSOCIATE PAGE 108
1995 2000 2005 2010 2015 2016p 15-16p 95-16p
Reagan
Total Spending 1.2 1.3 1.8 2.4 12.3 7.8 -36.8% 9.2%
Non-transportation 1.0 1.0 1.2 1.8 11.8 7.3 -38.2% 9.8%
Transportation 0.2 0.3 0.5 0.6 0.5 0.5 -6.5% 4.3%
Real
Total Spending 2.1 3.1 4.5 5.2 6.8 6.6 -2.7% 5.6%
Non-transportation 2.1 3.0 4.4 5.0 6.7 6.5 -2.6% 5.6%
Transportation 0.1 0.1 0.2 0.2 0.2 0.2 -7.2% 4.2%
Red River
Total Spending 2.9 3.5 4.3 4.6 4.0 3.9 -3.3% 1.4%
Non-transportation 2.3 2.6 2.8 2.7 2.5 2.5 -0.9% 0.4%
Transportation 0.6 0.9 1.5 1.9 1.5 1.4 -7.2% 4.2%
Reeves
Total Spending 14.9 19.9 28.3 43.0 92.6 82.2 -11.3% 8.5%
Non-transportation 8.1 9.8 11.2 22.2 75.3 66.1 -12.2% 10.5%
Transportation 6.7 10.1 17.2 20.8 17.3 16.1 -7.1% 4.2%
Refugio
Total Spending 8.9 12.0 17.8 21.7 20.0 18.9 -5.2% 3.7%
Non-transportation 4.0 4.6 5.2 6.5 7.4 7.3 -1.6% 2.9%
Transportation 4.9 7.4 12.5 15.2 12.6 11.7 -7.2% 4.2%
Roberts
Total Spending 0.4 0.5 0.9 1.0 0.9 0.8 -6.6% 3.9%
Non-transportation 0.1 0.1 0.1 0.1 0.1 0.1 0.1% 2.0%
Transportation 0.3 0.5 0.8 1.0 0.8 0.7 -7.2% 4.2%
Robertson
Total Spending 7.5 8.4 14.9 20.0 17.4 19.0 9.3% 4.5%
Non-transportation 5.7 5.6 10.3 14.4 12.6 14.5 15.0% 4.6%
Transportation 1.9 2.8 4.6 5.5 4.8 4.5 -5.8% 4.3%
Rockwall
Total Spending 15.8 27.6 43.5 78.5 95.4 99.4 4.2% 9.2%
Non-transportation 10.4 19.7 29.8 58.8 79.3 83.7 5.5% 10.4%
Transportation 5.2 7.7 13.0 15.7 13.3 12.4 -6.5% 4.3%
Runnels
Total Spending 4.4 4.9 5.9 6.8 6.4 6.2 -2.5% 1.6%
Non-transportation 3.5 3.5 3.5 4.0 4.0 4.0 0.0% 0.6%
Transportation 0.9 1.4 2.3 2.8 2.4 2.2 -6.8% 4.3%
Rusk
Total Spending 16.2 22.0 30.2 36.8 37.0 33.7 -8.9% 3.6%
Non-transportation 9.9 12.8 15.1 18.8 22.0 19.7 -10.5% 3.3%
Transportation 5.8 8.7 14.6 17.7 15.0 14.0 -6.6% 4.3%
Direct County Travel Spending, 1995-2016p
Ave. Annual Chg. (*Recent oil & gas production may affect estimates.)
See notes on page 114.
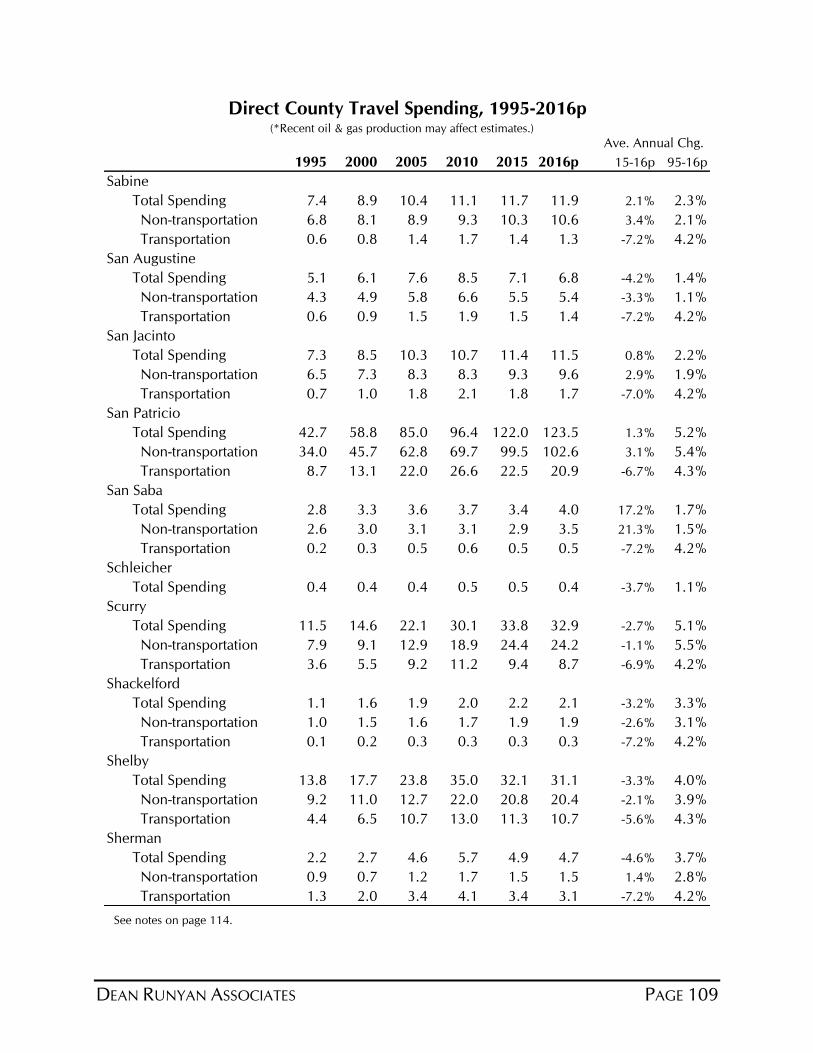
DEAN RUNYAN ASSOCIATES PAGE 109
1995 2000 2005 2010 2015 2016p 15-16p 95-16p
Sabine
Total Spending 7.4 8.9 10.4 11.1 11.7 11.9 2.1% 2.3%
Non-transportation 6.8 8.1 8.9 9.3 10.3 10.6 3.4% 2.1%
Transportation 0.6 0.8 1.4 1.7 1.4 1.3 -7.2% 4.2%
San Augustine
Total Spending 5.1 6.1 7.6 8.5 7.1 6.8 -4.2% 1.4%
Non-transportation 4.3 4.9 5.8 6.6 5.5 5.4 -3.3% 1.1%
Transportation 0.6 0.9 1.5 1.9 1.5 1.4 -7.2% 4.2%
San Jacinto
Total Spending 7.3 8.5 10.3 10.7 11.4 11.5 0.8% 2.2%
Non-transportation 6.5 7.3 8.3 8.3 9.3 9.6 2.9% 1.9%
Transportation 0.7 1.0 1.8 2.1 1.8 1.7 -7.0% 4.2%
San Patricio
Total Spending 42.7 58.8 85.0 96.4 122.0 123.5 1.3% 5.2%
Non-transportation 34.0 45.7 62.8 69.7 99.5 102.6 3.1% 5.4%
Transportation 8.7 13.1 22.0 26.6 22.5 20.9 -6.7% 4.3%
San Saba
Total Spending 2.8 3.3 3.6 3.7 3.4 4.0 17.2% 1.7%
Non-transportation 2.6 3.0 3.1 3.1 2.9 3.5 21.3% 1.5%
Transportation 0.2 0.3 0.5 0.6 0.5 0.5 -7.2% 4.2%
Schleicher
Total Spending 0.4 0.4 0.4 0.5 0.5 0.4 -3.7% 1.1%
Scurry
Total Spending 11.5 14.6 22.1 30.1 33.8 32.9 -2.7% 5.1%
Non-transportation 7.9 9.1 12.9 18.9 24.4 24.2 -1.1% 5.5%
Transportation 3.6 5.5 9.2 11.2 9.4 8.7 -6.9% 4.2%
Shackelford
Total Spending 1.1 1.6 1.9 2.0 2.2 2.1 -3.2% 3.3%
Non-transportation 1.0 1.5 1.6 1.7 1.9 1.9 -2.6% 3.1%
Transportation 0.1 0.2 0.3 0.3 0.3 0.3 -7.2% 4.2%
Shelby
Total Spending 13.8 17.7 23.8 35.0 32.1 31.1 -3.3% 4.0%
Non-transportation 9.2 11.0 12.7 22.0 20.8 20.4 -2.1% 3.9%
Transportation 4.4 6.5 10.7 13.0 11.3 10.7 -5.6% 4.3%
Sherman
Total Spending 2.2 2.7 4.6 5.7 4.9 4.7 -4.6% 3.7%
Non-transportation 0.9 0.7 1.2 1.7 1.5 1.5 1.4% 2.8%
Transportation 1.3 2.0 3.4 4.1 3.4 3.1 -7.2% 4.2%
Direct County Travel Spending, 1995-2016p
Ave. Annual Chg. (*Recent oil & gas production may affect estimates.)
See notes on page 114.
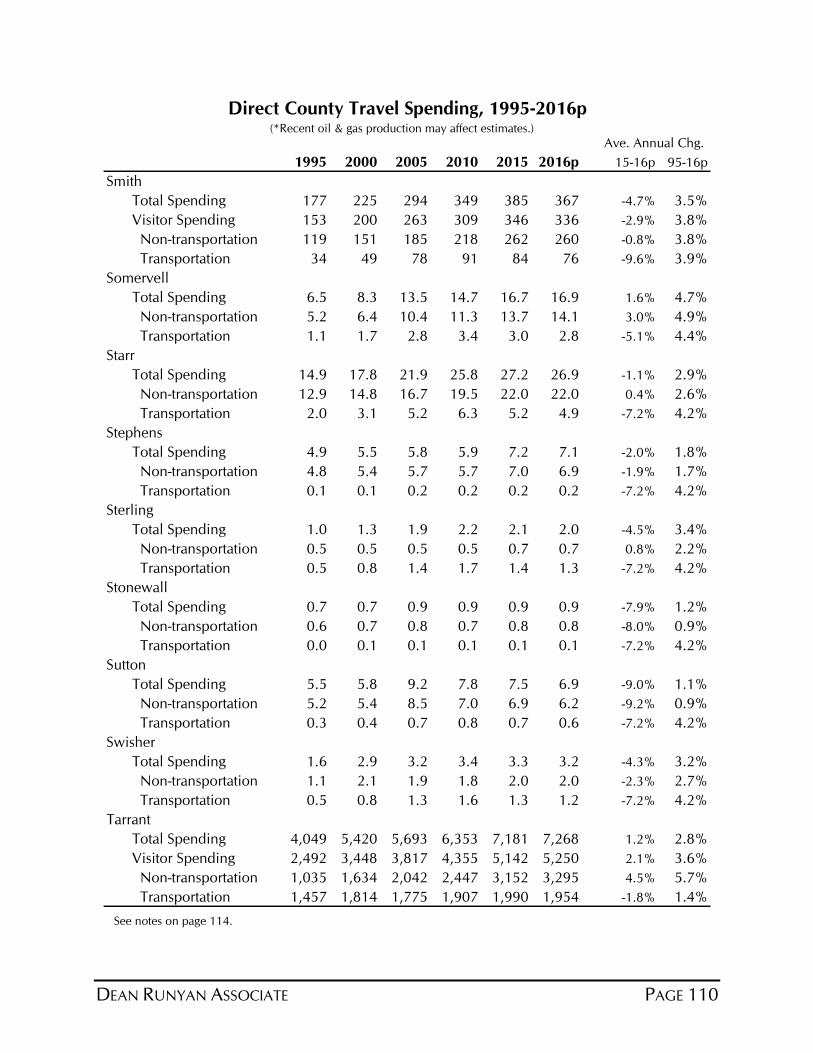
DEAN RUNYAN ASSOCIATE PAGE 110
1995 2000 2005 2010 2015 2016p 15-16p 95-16p
Smith
Total Spending 177 225 294 349 385 367 -4.7% 3.5%
Visitor Spending 153 200 263 309 346 336 -2.9% 3.8%
Non-transportation 119 151 185 218 262 260 -0.8% 3.8%
Transportation 34 49 78 91 84 76 -9.6% 3.9%
Somervell
Total Spending 6.5 8.3 13.5 14.7 16.7 16.9 1.6% 4.7%
Non-transportation 5.2 6.4 10.4 11.3 13.7 14.1 3.0% 4.9%
Transportation 1.1 1.7 2.8 3.4 3.0 2.8 -5.1% 4.4%
Starr
Total Spending 14.9 17.8 21.9 25.8 27.2 26.9 -1.1% 2.9%
Non-transportation 12.9 14.8 16.7 19.5 22.0 22.0 0.4% 2.6%
Transportation 2.0 3.1 5.2 6.3 5.2 4.9 -7.2% 4.2%
Stephens
Total Spending 4.9 5.5 5.8 5.9 7.2 7.1 -2.0% 1.8%
Non-transportation 4.8 5.4 5.7 5.7 7.0 6.9 -1.9% 1.7%
Transportation 0.1 0.1 0.2 0.2 0.2 0.2 -7.2% 4.2%
Sterling
Total Spending 1.0 1.3 1.9 2.2 2.1 2.0 -4.5% 3.4%
Non-transportation 0.5 0.5 0.5 0.5 0.7 0.7 0.8% 2.2%
Transportation 0.5 0.8 1.4 1.7 1.4 1.3 -7.2% 4.2%
Stonewall
Total Spending 0.7 0.7 0.9 0.9 0.9 0.9 -7.9% 1.2%
Non-transportation 0.6 0.7 0.8 0.7 0.8 0.8 -8.0% 0.9%
Transportation 0.0 0.1 0.1 0.1 0.1 0.1 -7.2% 4.2%
Sutton
Total Spending 5.5 5.8 9.2 7.8 7.5 6.9 -9.0% 1.1%
Non-transportation 5.2 5.4 8.5 7.0 6.9 6.2 -9.2% 0.9%
Transportation 0.3 0.4 0.7 0.8 0.7 0.6 -7.2% 4.2%
Swisher
Total Spending 1.6 2.9 3.2 3.4 3.3 3.2 -4.3% 3.2%
Non-transportation 1.1 2.1 1.9 1.8 2.0 2.0 -2.3% 2.7%
Transportation 0.5 0.8 1.3 1.6 1.3 1.2 -7.2% 4.2%
Tarrant
Total Spending 4,049 5,420 5,693 6,353 7,181 7,268 1.2% 2.8%
Visitor Spending 2,492 3,448 3,817 4,355 5,142 5,250 2.1% 3.6%
Non-transportation 1,035 1,634 2,042 2,447 3,152 3,295 4.5% 5.7%
Transportation 1,457 1,814 1,775 1,907 1,990 1,954 -1.8% 1.4%
Direct County Travel Spending, 1995-2016p
Ave. Annual Chg. (*Recent oil & gas production may affect estimates.)
See notes on page 114.
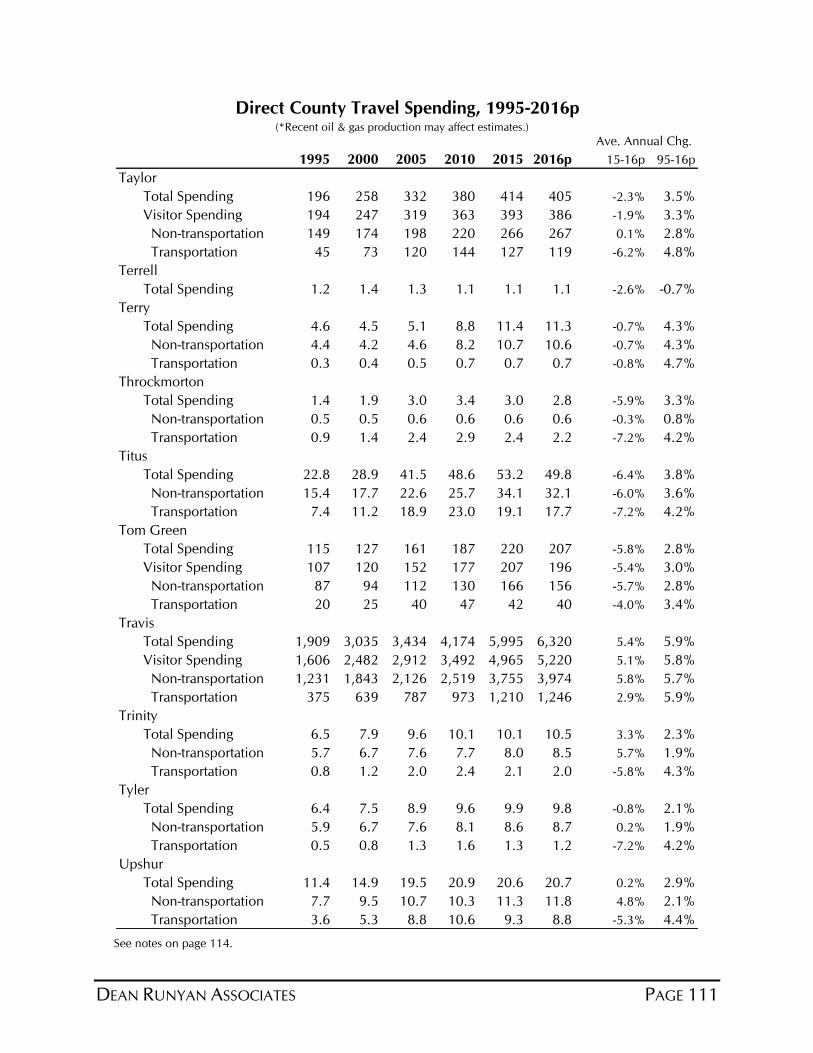
DEAN RUNYAN ASSOCIATES PAGE 111
1995 2000 2005 2010 2015 2016p 15-16p 95-16p
Taylor
Total Spending 196 258 332 380 414 405 -2.3% 3.5%
Visitor Spending 194 247 319 363 393 386 -1.9% 3.3%
Non-transportation 149 174 198 220 266 267 0.1% 2.8%
Transportation 45 73 120 144 127 119 -6.2% 4.8%
Terrell
Total Spending 1.2 1.4 1.3 1.1 1.1 1.1 -2.6% -0.7%
Terry
Total Spending 4.6 4.5 5.1 8.8 11.4 11.3 -0.7% 4.3%
Non-transportation 4.4 4.2 4.6 8.2 10.7 10.6 -0.7% 4.3%
Transportation 0.3 0.4 0.5 0.7 0.7 0.7 -0.8% 4.7%
Throckmorton
Total Spending 1.4 1.9 3.0 3.4 3.0 2.8 -5.9% 3.3%
Non-transportation 0.5 0.5 0.6 0.6 0.6 0.6 -0.3% 0.8%
Transportation 0.9 1.4 2.4 2.9 2.4 2.2 -7.2% 4.2%
Titus
Total Spending 22.8 28.9 41.5 48.6 53.2 49.8 -6.4% 3.8%
Non-transportation 15.4 17.7 22.6 25.7 34.1 32.1 -6.0% 3.6%
Transportation 7.4 11.2 18.9 23.0 19.1 17.7 -7.2% 4.2%
Tom Green
Total Spending 115 127 161 187 220 207 -5.8% 2.8%
Visitor Spending 107 120 152 177 207 196 -5.4% 3.0%
Non-transportation 87 94 112 130 166 156 -5.7% 2.8%
Transportation 20 25 40 47 42 40 -4.0% 3.4%
Travis
Total Spending 1,909 3,035 3,434 4,174 5,995 6,320 5.4% 5.9%
Visitor Spending 1,606 2,482 2,912 3,492 4,965 5,220 5.1% 5.8%
Non-transportation 1,231 1,843 2,126 2,519 3,755 3,974 5.8% 5.7%
Transportation 375 639 787 973 1,210 1,246 2.9% 5.9%
Trinity
Total Spending 6.5 7.9 9.6 10.1 10.1 10.5 3.3% 2.3%
Non-transportation 5.7 6.7 7.6 7.7 8.0 8.5 5.7% 1.9%
Transportation 0.8 1.2 2.0 2.4 2.1 2.0 -5.8% 4.3%
Tyler
Total Spending 6.4 7.5 8.9 9.6 9.9 9.8 -0.8% 2.1%
Non-transportation 5.9 6.7 7.6 8.1 8.6 8.7 0.2% 1.9%
Transportation 0.5 0.8 1.3 1.6 1.3 1.2 -7.2% 4.2%
Upshur
Total Spending 11.4 14.9 19.5 20.9 20.6 20.7 0.2% 2.9%
Non-transportation 7.7 9.5 10.7 10.3 11.3 11.8 4.8% 2.1%
Transportation 3.6 5.3 8.8 10.6 9.3 8.8 -5.3% 4.4%
Direct County Travel Spending, 1995-2016p
Ave. Annual Chg. (*Recent oil & gas production may affect estimates.)
See notes on page 114.
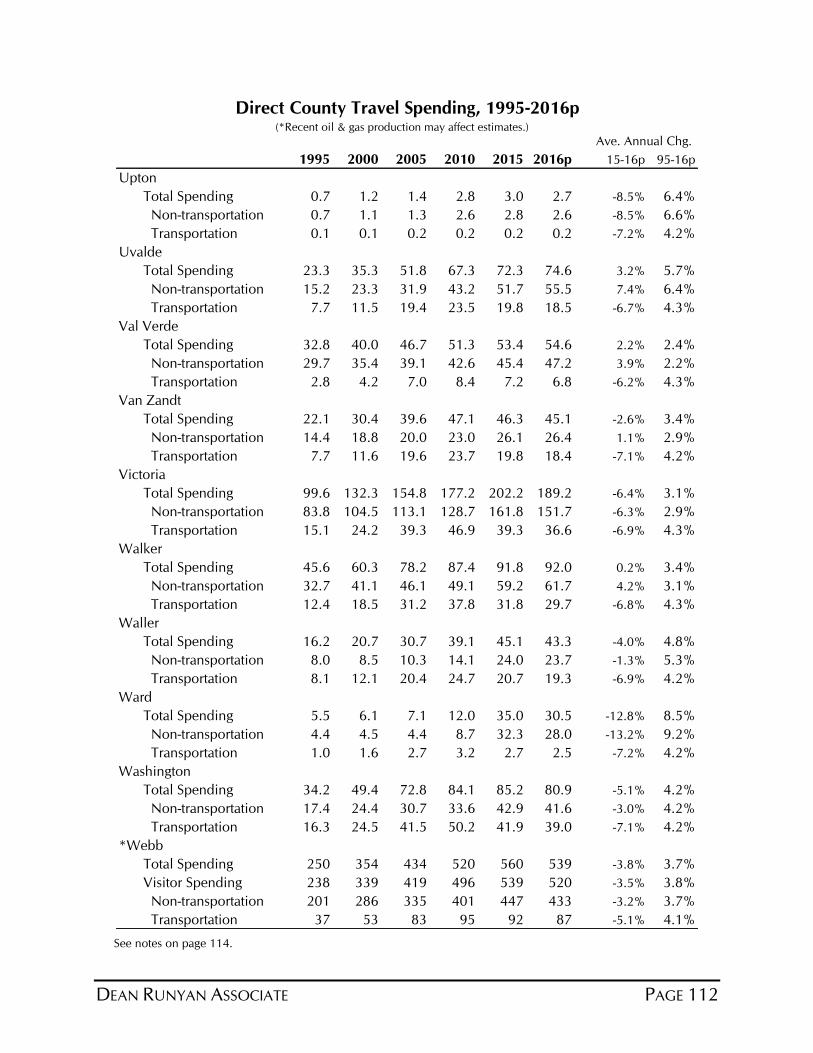
DEAN RUNYAN ASSOCIATE PAGE 112
1995 2000 2005 2010 2015 2016p 15-16p 95-16p
Upton
Total Spending 0.7 1.2 1.4 2.8 3.0 2.7 -8.5% 6.4%
Non-transportation 0.7 1.1 1.3 2.6 2.8 2.6 -8.5% 6.6%
Transportation 0.1 0.1 0.2 0.2 0.2 0.2 -7.2% 4.2%
Uvalde
Total Spending 23.3 35.3 51.8 67.3 72.3 74.6 3.2% 5.7%
Non-transportation 15.2 23.3 31.9 43.2 51.7 55.5 7.4% 6.4%
Transportation 7.7 11.5 19.4 23.5 19.8 18.5 -6.7% 4.3%
Val Verde
Total Spending 32.8 40.0 46.7 51.3 53.4 54.6 2.2% 2.4%
Non-transportation 29.7 35.4 39.1 42.6 45.4 47.2 3.9% 2.2%
Transportation 2.8 4.2 7.0 8.4 7.2 6.8 -6.2% 4.3%
Van Zandt
Total Spending 22.1 30.4 39.6 47.1 46.3 45.1 -2.6% 3.4%
Non-transportation 14.4 18.8 20.0 23.0 26.1 26.4 1.1% 2.9%
Transportation 7.7 11.6 19.6 23.7 19.8 18.4 -7.1% 4.2%
Victoria
Total Spending 99.6 132.3 154.8 177.2 202.2 189.2 -6.4% 3.1%
Non-transportation 83.8 104.5 113.1 128.7 161.8 151.7 -6.3% 2.9%
Transportation 15.1 24.2 39.3 46.9 39.3 36.6 -6.9% 4.3%
Walker
Total Spending 45.6 60.3 78.2 87.4 91.8 92.0 0.2% 3.4%
Non-transportation 32.7 41.1 46.1 49.1 59.2 61.7 4.2% 3.1%
Transportation 12.4 18.5 31.2 37.8 31.8 29.7 -6.8% 4.3%
Waller
Total Spending 16.2 20.7 30.7 39.1 45.1 43.3 -4.0% 4.8%
Non-transportation 8.0 8.5 10.3 14.1 24.0 23.7 -1.3% 5.3%
Transportation 8.1 12.1 20.4 24.7 20.7 19.3 -6.9% 4.2%
Ward
Total Spending 5.5 6.1 7.1 12.0 35.0 30.5 -12.8% 8.5%
Non-transportation 4.4 4.5 4.4 8.7 32.3 28.0 -13.2% 9.2%
Transportation 1.0 1.6 2.7 3.2 2.7 2.5 -7.2% 4.2%
Washington
Total Spending 34.2 49.4 72.8 84.1 85.2 80.9 -5.1% 4.2%
Non-transportation 17.4 24.4 30.7 33.6 42.9 41.6 -3.0% 4.2%
Transportation 16.3 24.5 41.5 50.2 41.9 39.0 -7.1% 4.2%
*Webb
Total Spending 250 354 434 520 560 539 -3.8% 3.7%
Visitor Spending 238 339 419 496 539 520 -3.5% 3.8%
Non-transportation 201 286 335 401 447 433 -3.2% 3.7%
Transportation 37 53 83 95 92 87 -5.1% 4.1%
Direct County Travel Spending, 1995-2016p
Ave. Annual Chg. (*Recent oil & gas production may affect estimates.)
See notes on page 114.
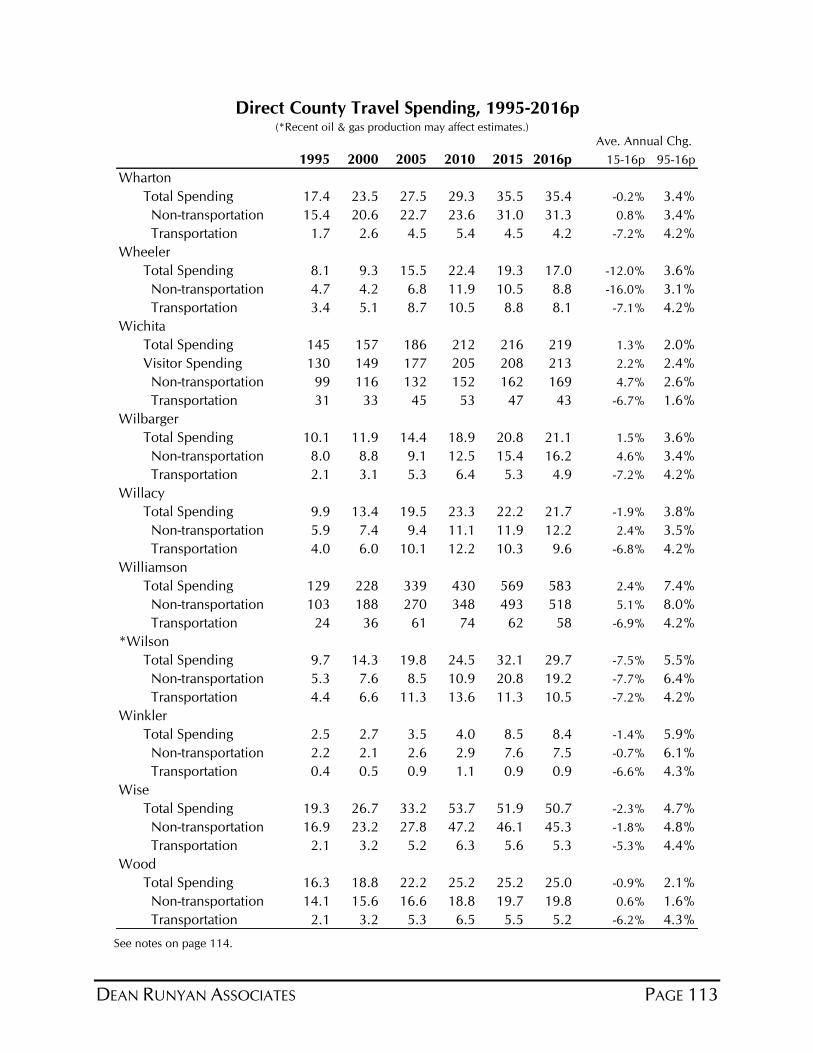
DEAN RUNYAN ASSOCIATES PAGE 113
1995 2000 2005 2010 2015 2016p 15-16p 95-16p
Wharton
Total Spending 17.4 23.5 27.5 29.3 35.5 35.4 -0.2% 3.4%
Non-transportation 15.4 20.6 22.7 23.6 31.0 31.3 0.8% 3.4%
Transportation 1.7 2.6 4.5 5.4 4.5 4.2 -7.2% 4.2%
Wheeler
Total Spending 8.1 9.3 15.5 22.4 19.3 17.0 -12.0% 3.6%
Non-transportation 4.7 4.2 6.8 11.9 10.5 8.8 -16.0% 3.1%
Transportation 3.4 5.1 8.7 10.5 8.8 8.1 -7.1% 4.2%
Wichita
Total Spending 145 157 186 212 216 219 1.3% 2.0%
Visitor Spending 130 149 177 205 208 213 2.2% 2.4%
Non-transportation 99 116 132 152 162 169 4.7% 2.6%
Transportation 31 33 45 53 47 43 -6.7% 1.6%
Wilbarger
Total Spending 10.1 11.9 14.4 18.9 20.8 21.1 1.5% 3.6%
Non-transportation 8.0 8.8 9.1 12.5 15.4 16.2 4.6% 3.4%
Transportation 2.1 3.1 5.3 6.4 5.3 4.9 -7.2% 4.2%
Willacy
Total Spending 9.9 13.4 19.5 23.3 22.2 21.7 -1.9% 3.8%
Non-transportation 5.9 7.4 9.4 11.1 11.9 12.2 2.4% 3.5%
Transportation 4.0 6.0 10.1 12.2 10.3 9.6 -6.8% 4.2%
Williamson
Total Spending 129 228 339 430 569 583 2.4% 7.4%
Non-transportation 103 188 270 348 493 518 5.1% 8.0%
Transportation 24 36 61 74 62 58 -6.9% 4.2%
*Wilson
Total Spending 9.7 14.3 19.8 24.5 32.1 29.7 -7.5% 5.5%
Non-transportation 5.3 7.6 8.5 10.9 20.8 19.2 -7.7% 6.4%
Transportation 4.4 6.6 11.3 13.6 11.3 10.5 -7.2% 4.2%
Winkler
Total Spending 2.5 2.7 3.5 4.0 8.5 8.4 -1.4% 5.9%
Non-transportation 2.2 2.1 2.6 2.9 7.6 7.5 -0.7% 6.1%
Transportation 0.4 0.5 0.9 1.1 0.9 0.9 -6.6% 4.3%
Wise
Total Spending 19.3 26.7 33.2 53.7 51.9 50.7 -2.3% 4.7%
Non-transportation 16.9 23.2 27.8 47.2 46.1 45.3 -1.8% 4.8%
Transportation 2.1 3.2 5.2 6.3 5.6 5.3 -5.3% 4.4%
Wood
Total Spending 16.3 18.8 22.2 25.2 25.2 25.0 -0.9% 2.1%
Non-transportation 14.1 15.6 16.6 18.8 19.7 19.8 0.6% 1.6%
Transportation 2.1 3.2 5.3 6.5 5.5 5.2 -6.2% 4.3%
Direct County Travel Spending, 1995-2016p
Ave. Annual Chg. (*Recent oil & gas production may affect estimates.)
See notes on page 114.
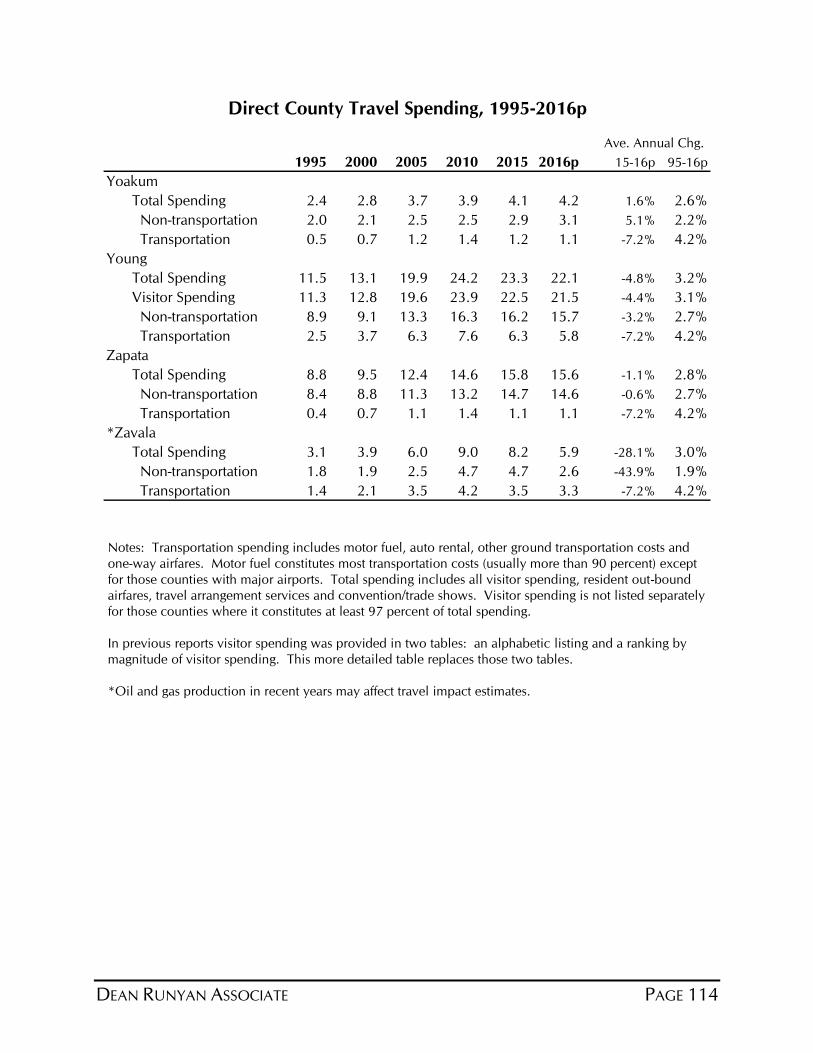
DEAN RUNYAN ASSOCIATE PAGE 114
1995 2000 2005 2010 2015 2016p 15-16p 95-16p
Yoakum
Total Spending 2.4 2.8 3.7 3.9 4.1 4.2 1.6% 2.6%
Non-transportation 2.0 2.1 2.5 2.5 2.9 3.1 5.1% 2.2%
Transportation 0.5 0.7 1.2 1.4 1.2 1.1 -7.2% 4.2%
Young
Total Spending 11.5 13.1 19.9 24.2 23.3 22.1 -4.8% 3.2%
Visitor Spending 11.3 12.8 19.6 23.9 22.5 21.5 -4.4% 3.1%
Non-transportation 8.9 9.1 13.3 16.3 16.2 15.7 -3.2% 2.7%
Transportation 2.5 3.7 6.3 7.6 6.3 5.8 -7.2% 4.2%
Zapata
Total Spending 8.8 9.5 12.4 14.6 15.8 15.6 -1.1% 2.8%
Non-transportation 8.4 8.8 11.3 13.2 14.7 14.6 -0.6% 2.7%
Transportation 0.4 0.7 1.1 1.4 1.1 1.1 -7.2% 4.2%
*Zavala
Total Spending 3.1 3.9 6.0 9.0 8.2 5.9 -28.1% 3.0%
Non-transportation 1.8 1.9 2.5 4.7 4.7 2.6 -43.9% 1.9%
Transportation 1.4 2.1 3.5 4.2 3.5 3.3 -7.2% 4.2%
Direct County Travel Spending, 1995-2016p
Ave. Annual Chg.
Notes: Transportation spending includes motor fuel, auto rental, other ground transportation costs and
one-way airfares. Motor fuel constitutes most transportation costs (usually more than 90 percent) except
for those counties with major airports. Total spending includes all visitor spending, resident out-bound
airfares, travel arrangement services and convention/trade shows. Visitor spending is not listed separately
for those counties where it constitutes at least 97 percent of total spending.
In previous reports visitor spending was provided in two tables: an alphabetic listing and a ranking by
magnitude of visitor spending. This more detailed table replaces those two tables.
*Oil and gas production in recent years may affect travel impact estimates.
DEAN RUNYAN ASSOCIATES PAGE 115
VII. TEXAS CITY AND PLACE DIRECT TRAVEL IMPACTS
2006-2016P
This section provides travel impact estimates for 125 cities and places within Texas for the
years 2006 through 2016. These estimates were derived from the county and metropolitan
impact found in this report, room sales data for cities and places reported by Source
Strategies, Inc. of San Antonio, and population estimates of places reported by the U.S.
Census Bureau.
The cities and places chosen were based on the availability of room sales data and other
source data to check and validate the estimates. This other source data included the (a)
Economic Census data for places in Texas, (b) gross sales data from the Texas Comptroller
of Public Accounts, and (c) zip code data from County Business Patterns (U.S. Census
Bureau). Only travel impact estimates that are consistent with other source data are
reported. The 125 cities and places accounted for 80 percent of all travel spending in the
state in 2016.
The estimates reported are summary measures of spending, earnings, employment and
local and state taxes. More detailed estimates (such as those reported for metro areas in
The Economic Impact of Travel on Texas) would require more data collection and
modeling efforts. For small cities and places such detailed estimates cannot be reliably
made. In general, estimates for smaller areas will be less reliable.
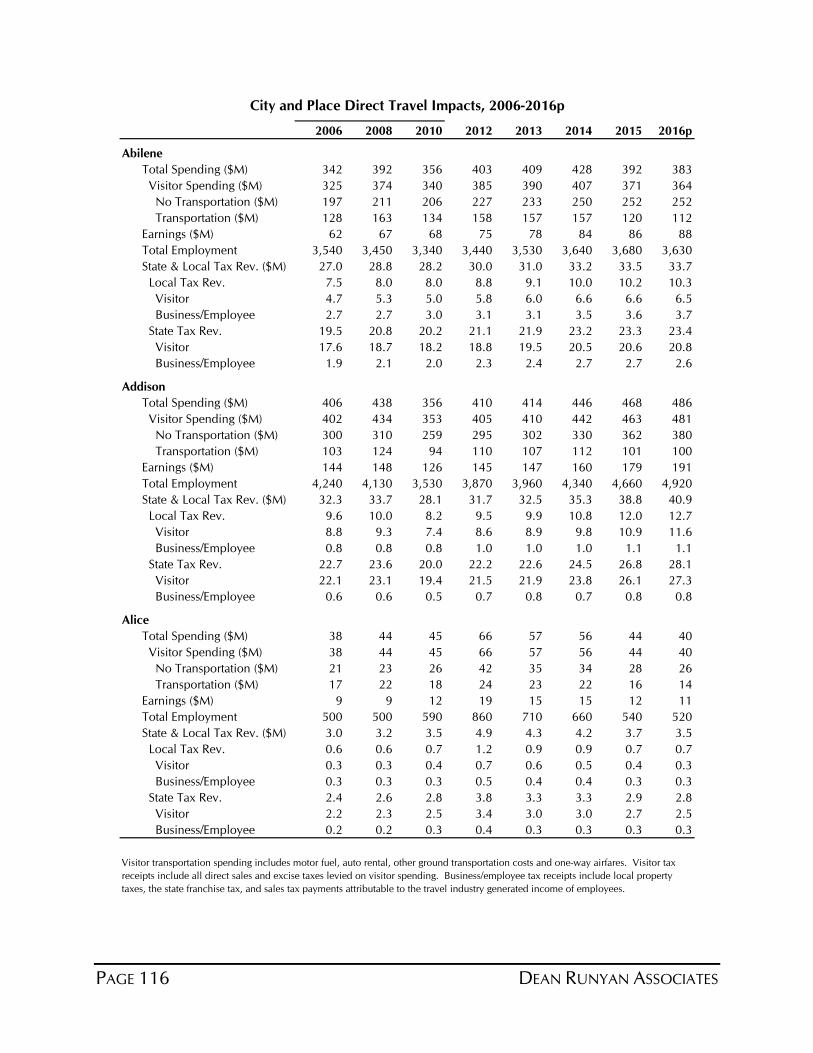
PAGE 116 DEAN RUNYAN ASSOCIATES
2006 2008 2010 2012 2013 2014 2015 2016p
Abilene
Total Spending ($M) 342 392 356 403 409 428 392 383
Visitor Spending ($M) 325 374 340 385 390 407 371 364
No Transportation ($M) 197 211 206 227 233 250 252 252
Transportation ($M) 128 163 134 158 157 157 120 112
Earnings ($M) 62 67 68 75 78 84 86 88
Total Employment 3,540 3,450 3,340 3,440 3,530 3,640 3,680 3,630
State & Local Tax Rev. ($M) 27.0 28.8 28.2 30.0 31.0 33.2 33.5 33.7
Local Tax Rev. 7.5 8.0 8.0 8.8 9.1 10.0 10.2 10.3
Visitor 4.7 5.3 5.0 5.8 6.0 6.6 6.6 6.5
Business/Employee 2.7 2.7 3.0 3.1 3.1 3.5 3.6 3.7
State Tax Rev. 19.5 20.8 20.2 21.1 21.9 23.2 23.3 23.4
Visitor 17.6 18.7 18.2 18.8 19.5 20.5 20.6 20.8
Business/Employee 1.9 2.1 2.0 2.3 2.4 2.7 2.7 2.6
Addison
Total Spending ($M) 406 438 356 410 414 446 468 486
Visitor Spending ($M) 402 434 353 405 410 442 463 481
No Transportation ($M) 300 310 259 295 302 330 362 380
Transportation ($M) 103 124 94 110 107 112 101 100
Earnings ($M) 144 148 126 145 147 160 179 191
Total Employment 4,240 4,130 3,530 3,870 3,960 4,340 4,660 4,920
State & Local Tax Rev. ($M) 32.3 33.7 28.1 31.7 32.5 35.3 38.8 40.9
Local Tax Rev. 9.6 10.0 8.2 9.5 9.9 10.8 12.0 12.7
Visitor 8.8 9.3 7.4 8.6 8.9 9.8 10.9 11.6
Business/Employee 0.8 0.8 0.8 1.0 1.0 1.0 1.1 1.1
State Tax Rev. 22.7 23.6 20.0 22.2 22.6 24.5 26.8 28.1
Visitor 22.1 23.1 19.4 21.5 21.9 23.8 26.1 27.3
Business/Employee 0.6 0.6 0.5 0.7 0.8 0.7 0.8 0.8
Alice
Total Spending ($M) 38 44 45 66 57 56 44 40
Visitor Spending ($M) 38 44 45 66 57 56 44 40
No Transportation ($M) 21 23 26 42 35 34 28 26
Transportation ($M) 17 22 18 24 23 22 16 14
Earnings ($M) 9 9 12 19 15 15 12 11
Total Employment 500 500 590 860 710 660 540 520
State & Local Tax Rev. ($M) 3.0 3.2 3.5 4.9 4.3 4.2 3.7 3.5
Local Tax Rev. 0.6 0.6 0.7 1.2 0.9 0.9 0.7 0.7
Visitor 0.3 0.3 0.4 0.7 0.6 0.5 0.4 0.3
Business/Employee 0.3 0.3 0.3 0.5 0.4 0.4 0.3 0.3
State Tax Rev. 2.4 2.6 2.8 3.8 3.3 3.3 2.9 2.8
Visitor 2.2 2.3 2.5 3.4 3.0 3.0 2.7 2.5
Business/Employee 0.2 0.2 0.3 0.4 0.3 0.3 0.3 0.3
Visitor transportation spending includes motor fuel, auto rental, other ground transportation costs and one-way airfares. Visitor tax
receipts include all direct sales and excise taxes levied on visitor spending. Business/employee tax receipts include local property
taxes, the state franchise tax, and sales tax payments attributable to the travel industry generated income of employees.
City and Place Direct Travel Impacts, 2006-2016p
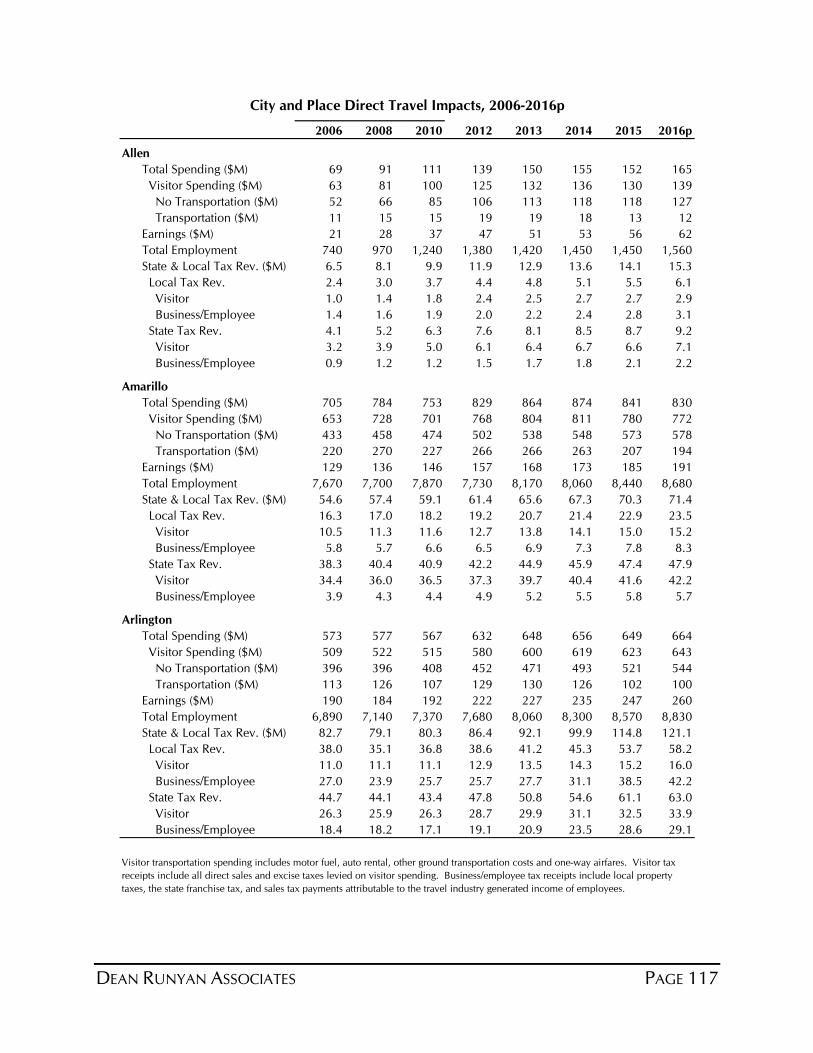
DEAN RUNYAN ASSOCIATES PAGE 117
2006 2008 2010 2012 2013 2014 2015 2016p
Allen
Total Spending ($M) 69 91 111 139 150 155 152 165
Visitor Spending ($M) 63 81 100 125 132 136 130 139
No Transportation ($M) 52 66 85 106 113 118 118 127
Transportation ($M) 11 15 15 19 19 18 13 12
Earnings ($M) 21 28 37 47 51 53 56 62
Total Employment 740 970 1,240 1,380 1,420 1,450 1,450 1,560
State & Local Tax Rev. ($M) 6.5 8.1 9.9 11.9 12.9 13.6 14.1 15.3
Local Tax Rev. 2.4 3.0 3.7 4.4 4.8 5.1 5.5 6.1
Visitor 1.0 1.4 1.8 2.4 2.5 2.7 2.7 2.9
Business/Employee 1.4 1.6 1.9 2.0 2.2 2.4 2.8 3.1
State Tax Rev. 4.1 5.2 6.3 7.6 8.1 8.5 8.7 9.2
Visitor 3.2 3.9 5.0 6.1 6.4 6.7 6.6 7.1
Business/Employee 0.9 1.2 1.2 1.5 1.7 1.8 2.1 2.2
Amarillo
Total Spending ($M) 705 784 753 829 864 874 841 830
Visitor Spending ($M) 653 728 701 768 804 811 780 772
No Transportation ($M) 433 458 474 502 538 548 573 578
Transportation ($M) 220 270 227 266 266 263 207 194
Earnings ($M) 129 136 146 157 168 173 185 191
Total Employment 7,670 7,700 7,870 7,730 8,170 8,060 8,440 8,680
State & Local Tax Rev. ($M) 54.6 57.4 59.1 61.4 65.6 67.3 70.3 71.4
Local Tax Rev. 16.3 17.0 18.2 19.2 20.7 21.4 22.9 23.5
Visitor 10.5 11.3 11.6 12.7 13.8 14.1 15.0 15.2
Business/Employee 5.8 5.7 6.6 6.5 6.9 7.3 7.8 8.3
State Tax Rev. 38.3 40.4 40.9 42.2 44.9 45.9 47.4 47.9
Visitor 34.4 36.0 36.5 37.3 39.7 40.4 41.6 42.2
Business/Employee 3.9 4.3 4.4 4.9 5.2 5.5 5.8 5.7
Arlington
Total Spending ($M) 573 577 567 632 648 656 649 664
Visitor Spending ($M) 509 522 515 580 600 619 623 643
No Transportation ($M) 396 396 408 452 471 493 521 544
Transportation ($M) 113 126 107 129 130 126 102 100
Earnings ($M) 190 184 192 222 227 235 247 260
Total Employment 6,890 7,140 7,370 7,680 8,060 8,300 8,570 8,830
State & Local Tax Rev. ($M) 82.7 79.1 80.3 86.4 92.1 99.9 114.8 121.1
Local Tax Rev. 38.0 35.1 36.8 38.6 41.2 45.3 53.7 58.2
Visitor 11.0 11.1 11.1 12.9 13.5 14.3 15.2 16.0
Business/Employee 27.0 23.9 25.7 25.7 27.7 31.1 38.5 42.2
State Tax Rev. 44.7 44.1 43.4 47.8 50.8 54.6 61.1 63.0
Visitor 26.3 25.9 26.3 28.7 29.9 31.1 32.5 33.9
Business/Employee 18.4 18.2 17.1 19.1 20.9 23.5 28.6 29.1
City and Place Direct Travel Impacts, 2006-2016p
Visitor transportation spending includes motor fuel, auto rental, other ground transportation costs and one-way airfares. Visitor tax
receipts include all direct sales and excise taxes levied on visitor spending. Business/employee tax receipts include local property
taxes, the state franchise tax, and sales tax payments attributable to the travel industry generated income of employees.

PAGE 118 DEAN RUNYAN ASSOCIATES
2006 2008 2010 2012 2013 2014 2015 2016p
Athens
Total Spending ($M) 35 48 43 44 46 46 39 38
Visitor Spending ($M) 35 48 42 43 46 45 39 38
No Transportation ($M) 16 19 19 18 19 20 20 20
Transportation ($M) 19 28 23 26 27 26 19 17
Earnings ($M) 7 9 9 8 9 9 9 10
Total Employment 220 250 230 210 220 220 220 230
State & Local Tax Rev. ($M) 2.4 3.0 3.0 2.7 2.9 3.0 3.0 3.0
Local Tax Rev. 0.4 0.6 0.6 0.5 0.6 0.6 0.6 0.6
Visitor 0.3 0.4 0.4 0.4 0.4 0.4 0.4 0.5
Business/Employee 0.1 0.1 0.1 0.1 0.1 0.1 0.2 0.2
State Tax Rev. 2.0 2.4 2.4 2.2 2.4 2.4 2.4 2.4
Visitor 1.9 2.3 2.3 2.1 2.2 2.3 2.3 2.3
Business/Employee 0.1 0.1 0.1 0.1 0.1 0.1 0.1 0.1
Austin
Total Spending ($M) 4,034 4,470 4,319 5,141 5,552 5,881 6,299 6,630
Visitor Spending ($M) 3,410 3,757 3,618 4,281 4,643 4,904 5,250 5,524
No Transportation ($M) 2,408 2,602 2,574 3,035 3,333 3,535 3,925 4,158
Transportation ($M) 1,002 1,155 1,044 1,246 1,310 1,369 1,325 1,366
Earnings ($M) 872 962 940 1,144 1,242 1,379 1,553 1,682
Total Employment 37,700 39,610 38,500 42,700 45,930 48,480 52,570 55,360
State & Local Tax Rev. ($M) 283.6 306.2 302.7 353.7 388.3 419.6 467.8 497.6
Local Tax Rev. 109.3 117.6 117.5 139.5 154.4 169.6 192.9 209.1
Visitor 70.2 78.6 74.5 91.6 102.9 111.4 127.1 136.4
Business/Employee 39.1 39.0 43.1 47.9 51.6 58.2 65.8 72.7
State Tax Rev. 174.3 188.6 185.2 214.2 233.9 250.0 274.9 288.6
Visitor 148.5 159.6 157.4 179.7 196.2 207.3 227.5 240.0
Business/Employee 25.8 29.0 27.8 34.4 37.7 42.7 47.4 48.6
Baytown
Total Spending ($M) 105 133 111 147 156 181 183 179
Visitor Spending ($M) 97 125 104 139 147 171 172 167
No Transportation ($M) 63 79 68 91 98 117 126 123
Transportation ($M) 34 46 36 47 48 54 47 45
Earnings ($M) 27 33 30 39 42 51 58 58
Total Employment 980 1,120 980 1,220 1,300 1,520 1,670 1,660
State & Local Tax Rev. ($M) 12.6 14.7 13.3 16.0 17.4 19.9 21.3 21.1
Local Tax Rev. 5.1 5.8 5.4 6.4 7.1 8.1 8.7 8.7
Visitor 2.1 2.8 2.2 3.3 3.6 4.5 4.9 4.7
Business/Employee 3.0 3.0 3.2 3.1 3.5 3.6 3.8 3.9
State Tax Rev. 7.5 8.8 7.9 9.5 10.3 11.8 12.6 12.5
Visitor 5.4 6.5 5.8 7.2 7.7 9.1 9.8 9.7
Business/Employee 2.1 2.3 2.1 2.3 2.6 2.7 2.8 2.7
Visitor transportation spending includes motor fuel, auto rental, other ground transportation costs and one-way airfares. Visitor tax
receipts include all direct sales and excise taxes levied on visitor spending. Business/employee tax receipts include local property
taxes, the state franchise tax, and sales tax payments attributable to the travel industry generated income of employees.
City and Place Direct Travel Impacts, 2006-2016p
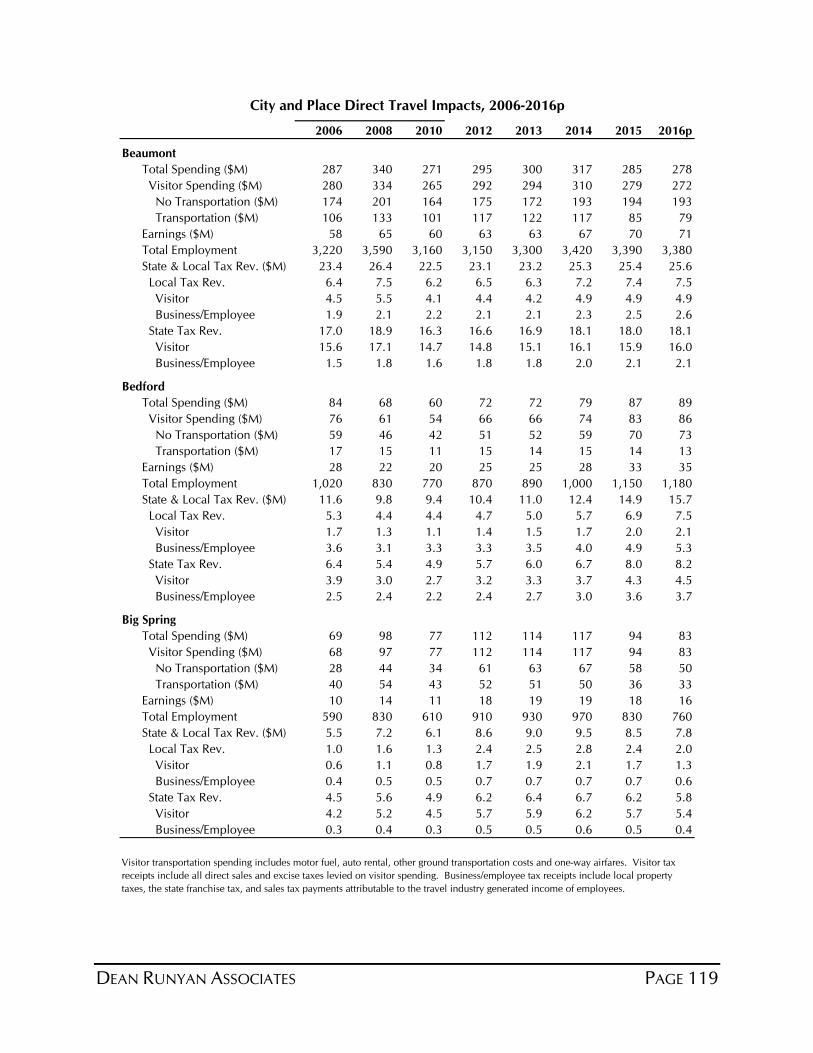
DEAN RUNYAN ASSOCIATES PAGE 119
2006 2008 2010 2012 2013 2014 2015 2016p
Beaumont
Total Spending ($M) 287 340 271 295 300 317 285 278
Visitor Spending ($M) 280 334 265 292 294 310 279 272
No Transportation ($M) 174 201 164 175 172 193 194 193
Transportation ($M) 106 133 101 117 122 117 85 79
Earnings ($M) 58 65 60 63 63 67 70 71
Total Employment 3,220 3,590 3,160 3,150 3,300 3,420 3,390 3,380
State & Local Tax Rev. ($M) 23.4 26.4 22.5 23.1 23.2 25.3 25.4 25.6
Local Tax Rev. 6.4 7.5 6.2 6.5 6.3 7.2 7.4 7.5
Visitor 4.5 5.5 4.1 4.4 4.2 4.9 4.9 4.9
Business/Employee 1.9 2.1 2.2 2.1 2.1 2.3 2.5 2.6
State Tax Rev. 17.0 18.9 16.3 16.6 16.9 18.1 18.0 18.1
Visitor 15.6 17.1 14.7 14.8 15.1 16.1 15.9 16.0
Business/Employee 1.5 1.8 1.6 1.8 1.8 2.0 2.1 2.1
Bedford
Total Spending ($M) 84 68 60 72 72 79 87 89
Visitor Spending ($M) 76 61 54 66 66 74 83 86
No Transportation ($M) 59 46 42 51 52 59 70 73
Transportation ($M) 17 15 11 15 14 15 14 13
Earnings ($M) 28 22 20 25 25 28 33 35
Total Employment 1,020 830 770 870 890 1,000 1,150 1,180
State & Local Tax Rev. ($M) 11.6 9.8 9.4 10.4 11.0 12.4 14.9 15.7
Local Tax Rev. 5.3 4.4 4.4 4.7 5.0 5.7 6.9 7.5
Visitor 1.7 1.3 1.1 1.4 1.5 1.7 2.0 2.1
Business/Employee 3.6 3.1 3.3 3.3 3.5 4.0 4.9 5.3
State Tax Rev. 6.4 5.4 4.9 5.7 6.0 6.7 8.0 8.2
Visitor 3.9 3.0 2.7 3.2 3.3 3.7 4.3 4.5
Business/Employee 2.5 2.4 2.2 2.4 2.7 3.0 3.6 3.7
Big Spring
Total Spending ($M) 69 98 77 112 114 117 94 83
Visitor Spending ($M) 68 97 77 112 114 117 94 83
No Transportation ($M) 28 44 34 61 63 67 58 50
Transportation ($M) 40 54 43 52 51 50 36 33
Earnings ($M) 10 14 11 18 19 19 18 16
Total Employment 590 830 610 910 930 970 830 760
State & Local Tax Rev. ($M) 5.5 7.2 6.1 8.6 9.0 9.5 8.5 7.8
Local Tax Rev. 1.0 1.6 1.3 2.4 2.5 2.8 2.4 2.0
Visitor 0.6 1.1 0.8 1.7 1.9 2.1 1.7 1.3
Business/Employee 0.4 0.5 0.5 0.7 0.7 0.7 0.7 0.6
State Tax Rev. 4.5 5.6 4.9 6.2 6.4 6.7 6.2 5.8
Visitor 4.2 5.2 4.5 5.7 5.9 6.2 5.7 5.4
Business/Employee 0.3 0.4 0.3 0.5 0.5 0.6 0.5 0.4
City and Place Direct Travel Impacts, 2006-2016p
Visitor transportation spending includes motor fuel, auto rental, other ground transportation costs and one-way airfares. Visitor tax
receipts include all direct sales and excise taxes levied on visitor spending. Business/employee tax receipts include local property
taxes, the state franchise tax, and sales tax payments attributable to the travel industry generated income of employees.
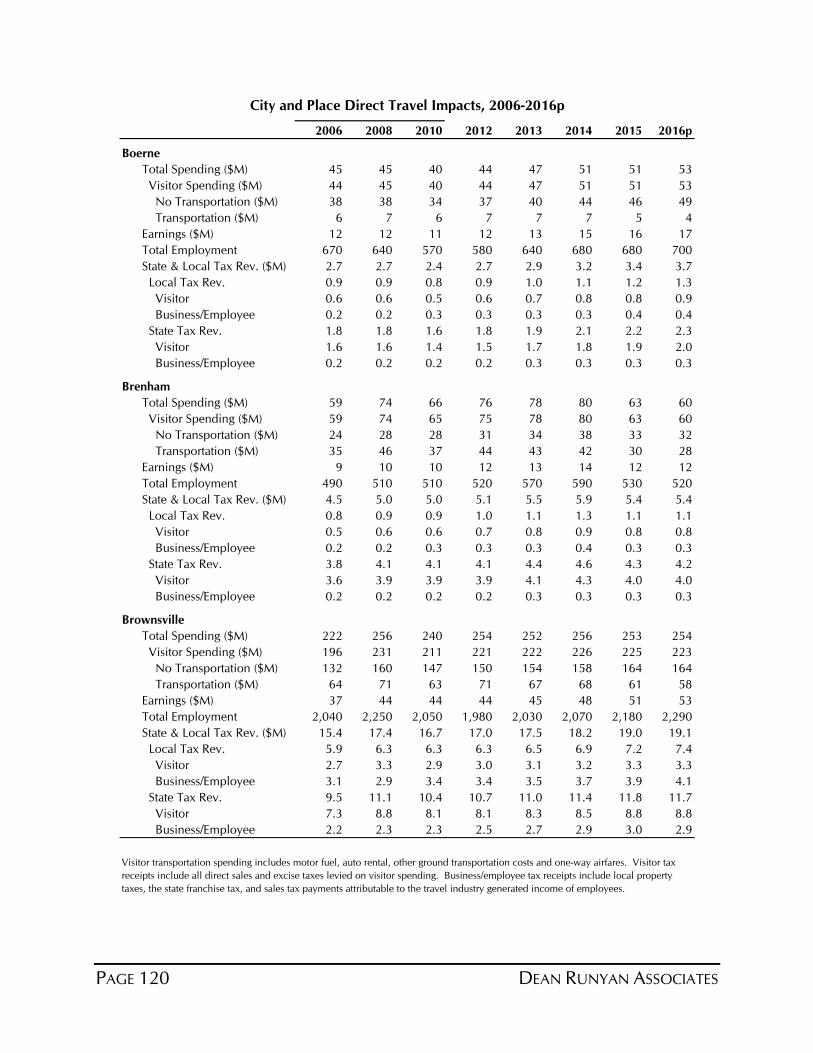
PAGE 120 DEAN RUNYAN ASSOCIATES
2006 2008 2010 2012 2013 2014 2015 2016p
Boerne
Total Spending ($M) 45 45 40 44 47 51 51 53
Visitor Spending ($M) 44 45 40 44 47 51 51 53
No Transportation ($M) 38 38 34 37 40 44 46 49
Transportation ($M) 6 7 6 7 7 7 5 4
Earnings ($M) 12 12 11 12 13 15 16 17
Total Employment 670 640 570 580 640 680 680 700
State & Local Tax Rev. ($M) 2.7 2.7 2.4 2.7 2.9 3.2 3.4 3.7
Local Tax Rev. 0.9 0.9 0.8 0.9 1.0 1.1 1.2 1.3
Visitor 0.6 0.6 0.5 0.6 0.7 0.8 0.8 0.9
Business/Employee 0.2 0.2 0.3 0.3 0.3 0.3 0.4 0.4
State Tax Rev. 1.8 1.8 1.6 1.8 1.9 2.1 2.2 2.3
Visitor 1.6 1.6 1.4 1.5 1.7 1.8 1.9 2.0
Business/Employee 0.2 0.2 0.2 0.2 0.3 0.3 0.3 0.3
Brenham
Total Spending ($M) 59 74 66 76 78 80 63 60
Visitor Spending ($M) 59 74 65 75 78 80 63 60
No Transportation ($M) 24 28 28 31 34 38 33 32
Transportation ($M) 35 46 37 44 43 42 30 28
Earnings ($M) 9 10 10 12 13 14 12 12
Total Employment 490 510 510 520 570 590 530 520
State & Local Tax Rev. ($M) 4.5 5.0 5.0 5.1 5.5 5.9 5.4 5.4
Local Tax Rev. 0.8 0.9 0.9 1.0 1.1 1.3 1.1 1.1
Visitor 0.5 0.6 0.6 0.7 0.8 0.9 0.8 0.8
Business/Employee 0.2 0.2 0.3 0.3 0.3 0.4 0.3 0.3
State Tax Rev. 3.8 4.1 4.1 4.1 4.4 4.6 4.3 4.2
Visitor 3.6 3.9 3.9 3.9 4.1 4.3 4.0 4.0
Business/Employee 0.2 0.2 0.2 0.2 0.3 0.3 0.3 0.3
Brownsville
Total Spending ($M) 222 256 240 254 252 256 253 254
Visitor Spending ($M) 196 231 211 221 222 226 225 223
No Transportation ($M) 132 160 147 150 154 158 164 164
Transportation ($M) 64 71 63 71 67 68 61 58
Earnings ($M) 37 44 44 44 45 48 51 53
Total Employment 2,040 2,250 2,050 1,980 2,030 2,070 2,180 2,290
State & Local Tax Rev. ($M) 15.4 17.4 16.7 17.0 17.5 18.2 19.0 19.1
Local Tax Rev. 5.9 6.3 6.3 6.3 6.5 6.9 7.2 7.4
Visitor 2.7 3.3 2.9 3.0 3.1 3.2 3.3 3.3
Business/Employee 3.1 2.9 3.4 3.4 3.5 3.7 3.9 4.1
State Tax Rev. 9.5 11.1 10.4 10.7 11.0 11.4 11.8 11.7
Visitor 7.3 8.8 8.1 8.1 8.3 8.5 8.8 8.8
Business/Employee 2.2 2.3 2.3 2.5 2.7 2.9 3.0 2.9
City and Place Direct Travel Impacts, 2006-2016p
Visitor transportation spending includes motor fuel, auto rental, other ground transportation costs and one-way airfares. Visitor tax
receipts include all direct sales and excise taxes levied on visitor spending. Business/employee tax receipts include local property
taxes, the state franchise tax, and sales tax payments attributable to the travel industry generated income of employees.

DEAN RUNYAN ASSOCIATES PAGE 121
2006 2008 2010 2012 2013 2014 2015 2016p
Bryan
Total Spending ($M) 67 73 79 84 96 123 111 110
Visitor Spending ($M) 65 72 78 83 95 122 110 109
No Transportation ($M) 47 50 58 60 71 95 91 92
Transportation ($M) 18 22 20 23 24 26 19 17
Earnings ($M) 13 14 17 18 23 32 32 33
Total Employment 790 750 930 930 1,100 1,460 1,400 1,430
State & Local Tax Rev. ($M) 6.5 7.0 7.8 8.0 9.5 12.3 11.9 12.0
Local Tax Rev. 1.9 2.1 2.5 2.5 3.1 4.1 4.0 4.1
Visitor 0.6 0.7 0.9 1.0 1.3 2.0 1.9 1.9
Business/Employee 1.3 1.4 1.5 1.5 1.8 2.1 2.2 2.3
State Tax Rev. 4.6 4.9 5.4 5.5 6.4 8.1 7.9 7.9
Visitor 3.6 3.7 4.2 4.2 4.9 6.3 6.0 6.1
Business/Employee 1.0 1.2 1.1 1.2 1.5 1.8 1.8 1.8
Burleson
Total Spending ($M) 42 56 52 56 58 62 58 59
Visitor Spending ($M) 37 51 47 51 53 58 55 57
No Transportation ($M) 22 33 33 35 36 41 41 43
Transportation ($M) 15 18 14 17 17 18 14 13
Earnings ($M) 11 15 16 17 18 20 19 21
Total Employment 400 590 590 590 620 680 670 690
State & Local Tax Rev. ($M) 3.7 4.7 4.7 4.9 5.3 5.9 6.4 6.8
Local Tax Rev. 1.2 1.6 1.6 1.7 1.9 2.1 2.4 2.6
Visitor 0.6 0.9 0.9 1.0 1.0 1.1 1.2 1.2
Business/Employee 0.6 0.7 0.8 0.8 0.9 1.0 1.2 1.4
State Tax Rev. 2.5 3.1 3.1 3.2 3.4 3.8 4.0 4.2
Visitor 2.1 2.6 2.6 2.6 2.7 3.0 3.1 3.2
Business/Employee 0.4 0.5 0.5 0.6 0.7 0.8 0.9 0.9
Carrollton
Total Spending ($M) 105 116 105 119 124 128 134 137
Visitor Spending ($M) 83 91 82 90 94 98 100 101
No Transportation ($M) 62 65 61 67 71 74 80 82
Transportation ($M) 21 26 21 23 24 24 19 19
Earnings ($M) 33 35 33 38 40 43 47 50
Total Employment 940 940 880 950 1,000 1,050 1,130 1,170
State & Local Tax Rev. ($M) 11.7 12.0 11.7 12.9 13.6 13.9 15.3 15.8
Local Tax Rev. 4.8 4.7 4.9 5.3 5.6 5.7 6.3 6.8
Visitor 1.1 1.2 1.1 1.2 1.3 1.4 1.6 1.6
Business/Employee 3.7 3.5 3.8 4.1 4.3 4.2 4.7 5.1
State Tax Rev. 6.9 7.3 6.8 7.5 8.0 8.2 8.9 9.0
Visitor 4.4 4.6 4.3 4.5 4.8 5.0 5.4 5.5
Business/Employee 2.5 2.7 2.5 3.0 3.2 3.2 3.5 3.5
City and Place Direct Travel Impacts, 2006-2016p
Visitor transportation spending includes motor fuel, auto rental, other ground transportation costs and one-way airfares. Visitor tax
receipts include all direct sales and excise taxes levied on visitor spending. Business/employee tax receipts include local property
taxes, the state franchise tax, and sales tax payments attributable to the travel industry generated income of employees.

PAGE 122 DEAN RUNYAN ASSOCIATES
2006 2008 2010 2012 2013 2014 2015 2016p
Cedar Park
Total Spending ($M) 46 55 62 75 81 85 88 93
Visitor Spending ($M) 42 50 56 68 73 77 79 82
No Transportation ($M) 34 39 46 56 61 65 70 74
Transportation ($M) 8 11 10 12 12 12 9 9
Earnings ($M) 12 14 17 22 24 26 29 31
Total Employment 480 530 640 730 780 830 880 930
State & Local Tax Rev. ($M) 3.8 4.2 5.2 6.2 6.7 7.3 7.9 8.3
Local Tax Rev. 1.2 1.3 1.7 2.1 2.3 2.5 2.8 3.0
Visitor 0.7 0.8 1.0 1.3 1.4 1.5 1.7 1.8
Business/Employee 0.5 0.5 0.7 0.8 0.9 1.0 1.1 1.3
State Tax Rev. 2.6 2.9 3.5 4.1 4.4 4.7 5.1 5.3
Visitor 2.2 2.5 3.0 3.5 3.7 3.9 4.2 4.4
Business/Employee 0.3 0.4 0.5 0.6 0.7 0.8 0.8 0.9
Cleburne
Total Spending ($M) 38 56 44 44 47 46 41 41
Visitor Spending ($M) 37 55 43 43 46 45 40 41
No Transportation ($M) 17 27 22 20 23 23 25 26
Transportation ($M) 20 29 21 22 23 22 16 15
Earnings ($M) 6 9 8 8 9 9 9 10
Total Employment 280 400 320 280 320 320 330 340
State & Local Tax Rev. ($M) 3.0 4.1 3.5 3.1 3.5 3.5 3.6 3.8
Local Tax Rev. 0.6 0.9 0.8 0.7 0.8 0.8 0.9 1.0
Visitor 0.4 0.7 0.5 0.5 0.6 0.6 0.6 0.7
Business/Employee 0.2 0.2 0.2 0.2 0.2 0.2 0.3 0.3
State Tax Rev. 2.4 3.1 2.7 2.4 2.7 2.7 2.7 2.8
Visitor 2.3 3.0 2.5 2.2 2.5 2.5 2.5 2.6
Business/Employee 0.1 0.2 0.1 0.2 0.2 0.2 0.2 0.2
Clute
Total Spending ($M) 33 40 30 42 50 52 53 51
Visitor Spending ($M) 33 40 30 42 50 52 53 51
No Transportation ($M) 28 32 25 35 43 45 48 46
Transportation ($M) 5 7 5 6 7 7 5 5
Earnings ($M) 9 11 9 12 14 15 17 17
Total Employment 540 590 460 590 700 710 790 750
State & Local Tax Rev. ($M) 2.3 2.7 2.1 2.9 3.5 3.7 3.9 3.8
Local Tax Rev. 0.6 0.8 0.6 0.9 1.0 1.1 1.2 1.2
Visitor 0.5 0.7 0.5 0.7 0.9 1.0 1.1 1.0
Business/Employee 0.1 0.1 0.1 0.1 0.1 0.1 0.2 0.2
State Tax Rev. 1.7 1.9 1.5 2.0 2.4 2.6 2.7 2.6
Visitor 1.6 1.8 1.4 1.9 2.3 2.4 2.6 2.5
Business/Employee 0.1 0.1 0.1 0.1 0.1 0.1 0.1 0.1
City and Place Direct Travel Impacts, 2006-2016p
Visitor transportation spending includes motor fuel, auto rental, other ground transportation costs and one-way airfares. Visitor tax
receipts include all direct sales and excise taxes levied on visitor spending. Business/employee tax receipts include local property
taxes, the state franchise tax, and sales tax payments attributable to the travel industry generated income of employees.
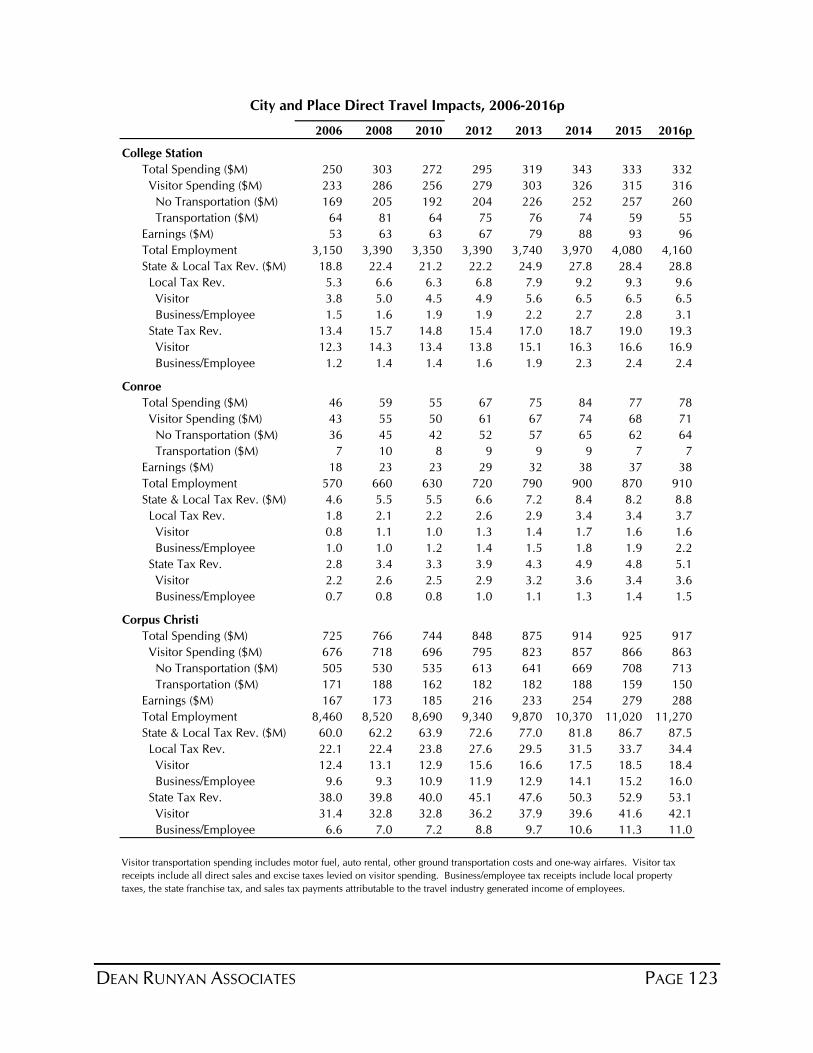
DEAN RUNYAN ASSOCIATES PAGE 123
2006 2008 2010 2012 2013 2014 2015 2016p
College Station
Total Spending ($M) 250 303 272 295 319 343 333 332
Visitor Spending ($M) 233 286 256 279 303 326 315 316
No Transportation ($M) 169 205 192 204 226 252 257 260
Transportation ($M) 64 81 64 75 76 74 59 55
Earnings ($M) 53 63 63 67 79 88 93 96
Total Employment 3,150 3,390 3,350 3,390 3,740 3,970 4,080 4,160
State & Local Tax Rev. ($M) 18.8 22.4 21.2 22.2 24.9 27.8 28.4 28.8
Local Tax Rev. 5.3 6.6 6.3 6.8 7.9 9.2 9.3 9.6
Visitor 3.8 5.0 4.5 4.9 5.6 6.5 6.5 6.5
Business/Employee 1.5 1.6 1.9 1.9 2.2 2.7 2.8 3.1
State Tax Rev. 13.4 15.7 14.8 15.4 17.0 18.7 19.0 19.3
Visitor 12.3 14.3 13.4 13.8 15.1 16.3 16.6 16.9
Business/Employee 1.2 1.4 1.4 1.6 1.9 2.3 2.4 2.4
Conroe
Total Spending ($M) 46 59 55 67 75 84 77 78
Visitor Spending ($M) 43 55 50 61 67 74 68 71
No Transportation ($M) 36 45 42 52 57 65 62 64
Transportation ($M) 7 10 8 9 9 9 7 7
Earnings ($M) 18 23 23 29 32 38 37 38
Total Employment 570 660 630 720 790 900 870 910
State & Local Tax Rev. ($M) 4.6 5.5 5.5 6.6 7.2 8.4 8.2 8.8
Local Tax Rev. 1.8 2.1 2.2 2.6 2.9 3.4 3.4 3.7
Visitor 0.8 1.1 1.0 1.3 1.4 1.7 1.6 1.6
Business/Employee 1.0 1.0 1.2 1.4 1.5 1.8 1.9 2.2
State Tax Rev. 2.8 3.4 3.3 3.9 4.3 4.9 4.8 5.1
Visitor 2.2 2.6 2.5 2.9 3.2 3.6 3.4 3.6
Business/Employee 0.7 0.8 0.8 1.0 1.1 1.3 1.4 1.5
Corpus Christi
Total Spending ($M) 725 766 744 848 875 914 925 917
Visitor Spending ($M) 676 718 696 795 823 857 866 863
No Transportation ($M) 505 530 535 613 641 669 708 713
Transportation ($M) 171 188 162 182 182 188 159 150
Earnings ($M) 167 173 185 216 233 254 279 288
Total Employment 8,460 8,520 8,690 9,340 9,870 10,370 11,020 11,270
State & Local Tax Rev. ($M) 60.0 62.2 63.9 72.6 77.0 81.8 86.7 87.5
Local Tax Rev. 22.1 22.4 23.8 27.6 29.5 31.5 33.7 34.4
Visitor 12.4 13.1 12.9 15.6 16.6 17.5 18.5 18.4
Business/Employee 9.6 9.3 10.9 11.9 12.9 14.1 15.2 16.0
State Tax Rev. 38.0 39.8 40.0 45.1 47.6 50.3 52.9 53.1
Visitor 31.4 32.8 32.8 36.2 37.9 39.6 41.6 42.1
Business/Employee 6.6 7.0 7.2 8.8 9.7 10.6 11.3 11.0
City and Place Direct Travel Impacts, 2006-2016p
Visitor transportation spending includes motor fuel, auto rental, other ground transportation costs and one-way airfares. Visitor tax
receipts include all direct sales and excise taxes levied on visitor spending. Business/employee tax receipts include local property
taxes, the state franchise tax, and sales tax payments attributable to the travel industry generated income of employees.
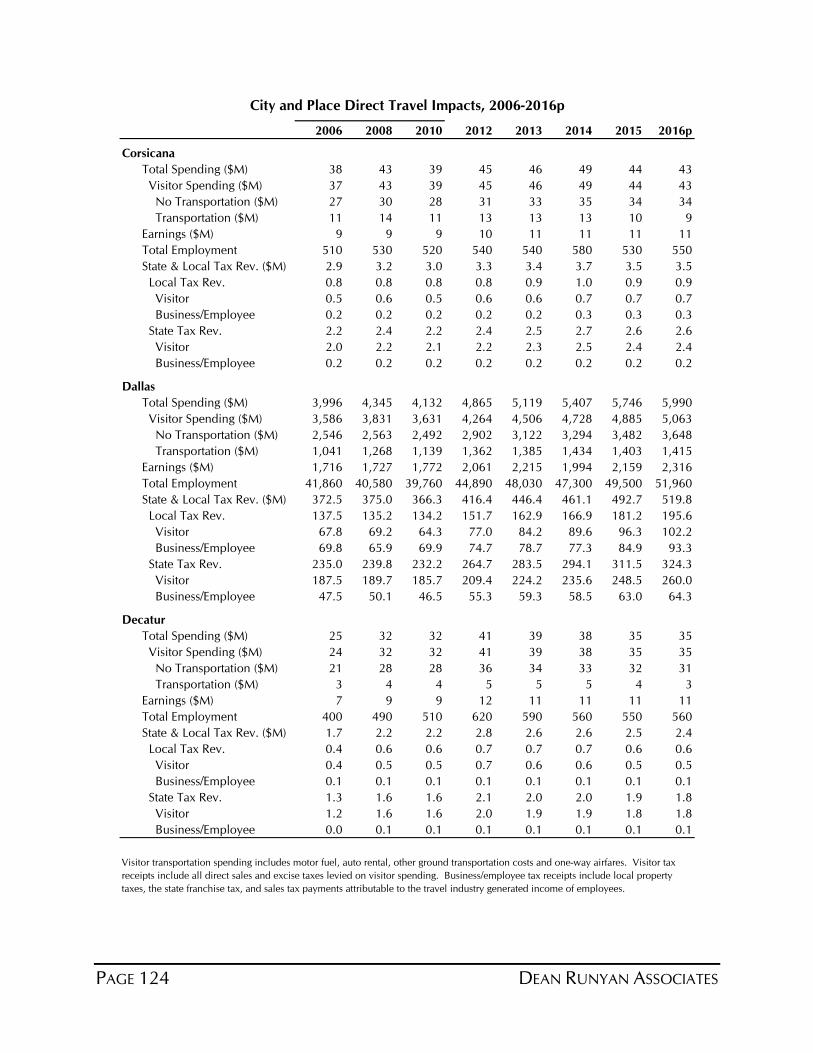
PAGE 124 DEAN RUNYAN ASSOCIATES
2006 2008 2010 2012 2013 2014 2015 2016p
Corsicana
Total Spending ($M) 38 43 39 45 46 49 44 43
Visitor Spending ($M) 37 43 39 45 46 49 44 43
No Transportation ($M) 27 30 28 31 33 35 34 34
Transportation ($M) 11 14 11 13 13 13 10 9
Earnings ($M) 9 9 9 10 11 11 11 11
Total Employment 510 530 520 540 540 580 530 550
State & Local Tax Rev. ($M) 2.9 3.2 3.0 3.3 3.4 3.7 3.5 3.5
Local Tax Rev. 0.8 0.8 0.8 0.8 0.9 1.0 0.9 0.9
Visitor 0.5 0.6 0.5 0.6 0.6 0.7 0.7 0.7
Business/Employee 0.2 0.2 0.2 0.2 0.2 0.3 0.3 0.3
State Tax Rev. 2.2 2.4 2.2 2.4 2.5 2.7 2.6 2.6
Visitor 2.0 2.2 2.1 2.2 2.3 2.5 2.4 2.4
Business/Employee 0.2 0.2 0.2 0.2 0.2 0.2 0.2 0.2
Dallas
Total Spending ($M) 3,996 4,345 4,132 4,865 5,119 5,407 5,746 5,990
Visitor Spending ($M) 3,586 3,831 3,631 4,264 4,506 4,728 4,885 5,063
No Transportation ($M) 2,546 2,563 2,492 2,902 3,122 3,294 3,482 3,648
Transportation ($M) 1,041 1,268 1,139 1,362 1,385 1,434 1,403 1,415
Earnings ($M) 1,716 1,727 1,772 2,061 2,215 1,994 2,159 2,316
Total Employment 41,860 40,580 39,760 44,890 48,030 47,300 49,500 51,960
State & Local Tax Rev. ($M) 372.5 375.0 366.3 416.4 446.4 461.1 492.7 519.8
Local Tax Rev. 137.5 135.2 134.2 151.7 162.9 166.9 181.2 195.6
Visitor 67.8 69.2 64.3 77.0 84.2 89.6 96.3 102.2
Business/Employee 69.8 65.9 69.9 74.7 78.7 77.3 84.9 93.3
State Tax Rev. 235.0 239.8 232.2 264.7 283.5 294.1 311.5 324.3
Visitor 187.5 189.7 185.7 209.4 224.2 235.6 248.5 260.0
Business/Employee 47.5 50.1 46.5 55.3 59.3 58.5 63.0 64.3
Decatur
Total Spending ($M) 25 32 32 41 39 38 35 35
Visitor Spending ($M) 24 32 32 41 39 38 35 35
No Transportation ($M) 21 28 28 36 34 33 32 31
Transportation ($M) 3 4 4 5 5 5 4 3
Earnings ($M) 7 9 9 12 11 11 11 11
Total Employment 400 490 510 620 590 560 550 560
State & Local Tax Rev. ($M) 1.7 2.2 2.2 2.8 2.6 2.6 2.5 2.4
Local Tax Rev. 0.4 0.6 0.6 0.7 0.7 0.7 0.6 0.6
Visitor 0.4 0.5 0.5 0.7 0.6 0.6 0.5 0.5
Business/Employee 0.1 0.1 0.1 0.1 0.1 0.1 0.1 0.1
State Tax Rev. 1.3 1.6 1.6 2.1 2.0 2.0 1.9 1.8
Visitor 1.2 1.6 1.6 2.0 1.9 1.9 1.8 1.8
Business/Employee 0.0 0.1 0.1 0.1 0.1 0.1 0.1 0.1
City and Place Direct Travel Impacts, 2006-2016p
Visitor transportation spending includes motor fuel, auto rental, other ground transportation costs and one-way airfares. Visitor tax
receipts include all direct sales and excise taxes levied on visitor spending. Business/employee tax receipts include local property
taxes, the state franchise tax, and sales tax payments attributable to the travel industry generated income of employees.
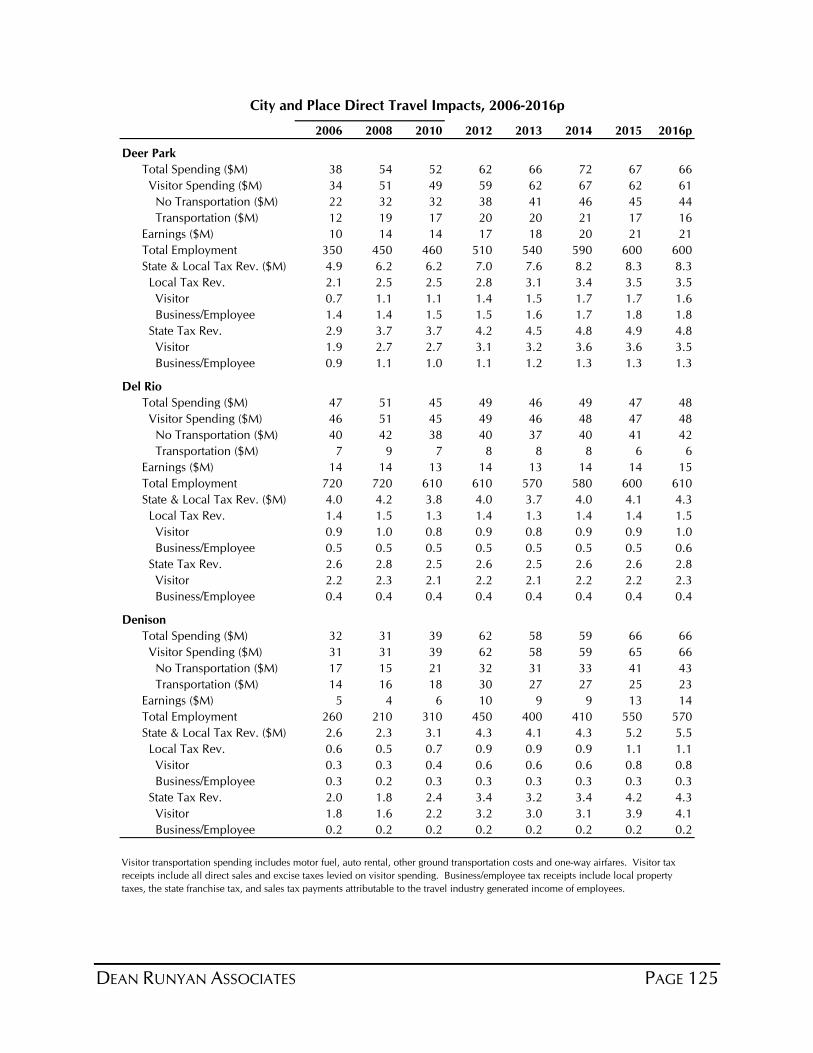
DEAN RUNYAN ASSOCIATES PAGE 125
2006 2008 2010 2012 2013 2014 2015 2016p
Deer Park
Total Spending ($M) 38 54 52 62 66 72 67 66
Visitor Spending ($M) 34 51 49 59 62 67 62 61
No Transportation ($M) 22 32 32 38 41 46 45 44
Transportation ($M) 12 19 17 20 20 21 17 16
Earnings ($M) 10 14 14 17 18 20 21 21
Total Employment 350 450 460 510 540 590 600 600
State & Local Tax Rev. ($M) 4.9 6.2 6.2 7.0 7.6 8.2 8.3 8.3
Local Tax Rev. 2.1 2.5 2.5 2.8 3.1 3.4 3.5 3.5
Visitor 0.7 1.1 1.1 1.4 1.5 1.7 1.7 1.6
Business/Employee 1.4 1.4 1.5 1.5 1.6 1.7 1.8 1.8
State Tax Rev. 2.9 3.7 3.7 4.2 4.5 4.8 4.9 4.8
Visitor 1.9 2.7 2.7 3.1 3.2 3.6 3.6 3.5
Business/Employee 0.9 1.1 1.0 1.1 1.2 1.3 1.3 1.3
Del Rio
Total Spending ($M) 47 51 45 49 46 49 47 48
Visitor Spending ($M) 46 51 45 49 46 48 47 48
No Transportation ($M) 40 42 38 40 37 40 41 42
Transportation ($M) 7 9 7 8 8 8 6 6
Earnings ($M) 14 14 13 14 13 14 14 15
Total Employment 720 720 610 610 570 580 600 610
State & Local Tax Rev. ($M) 4.0 4.2 3.8 4.0 3.7 4.0 4.1 4.3
Local Tax Rev. 1.4 1.5 1.3 1.4 1.3 1.4 1.4 1.5
Visitor 0.9 1.0 0.8 0.9 0.8 0.9 0.9 1.0
Business/Employee 0.5 0.5 0.5 0.5 0.5 0.5 0.5 0.6
State Tax Rev. 2.6 2.8 2.5 2.6 2.5 2.6 2.6 2.8
Visitor 2.2 2.3 2.1 2.2 2.1 2.2 2.2 2.3
Business/Employee 0.4 0.4 0.4 0.4 0.4 0.4 0.4 0.4
Denison
Total Spending ($M) 32 31 39 62 58 59 66 66
Visitor Spending ($M) 31 31 39 62 58 59 65 66
No Transportation ($M) 17 15 21 32 31 33 41 43
Transportation ($M) 14 16 18 30 27 27 25 23
Earnings ($M) 5 4 6 10 9 9 13 14
Total Employment 260 210 310 450 400 410 550 570
State & Local Tax Rev. ($M) 2.6 2.3 3.1 4.3 4.1 4.3 5.2 5.5
Local Tax Rev. 0.6 0.5 0.7 0.9 0.9 0.9 1.1 1.1
Visitor 0.3 0.3 0.4 0.6 0.6 0.6 0.8 0.8
Business/Employee 0.3 0.2 0.3 0.3 0.3 0.3 0.3 0.3
State Tax Rev. 2.0 1.8 2.4 3.4 3.2 3.4 4.2 4.3
Visitor 1.8 1.6 2.2 3.2 3.0 3.1 3.9 4.1
Business/Employee 0.2 0.2 0.2 0.2 0.2 0.2 0.2 0.2
Visitor transportation spending includes motor fuel, auto rental, other ground transportation costs and one-way airfares. Visitor tax
receipts include all direct sales and excise taxes levied on visitor spending. Business/employee tax receipts include local property
taxes, the state franchise tax, and sales tax payments attributable to the travel industry generated income of employees.
City and Place Direct Travel Impacts, 2006-2016p
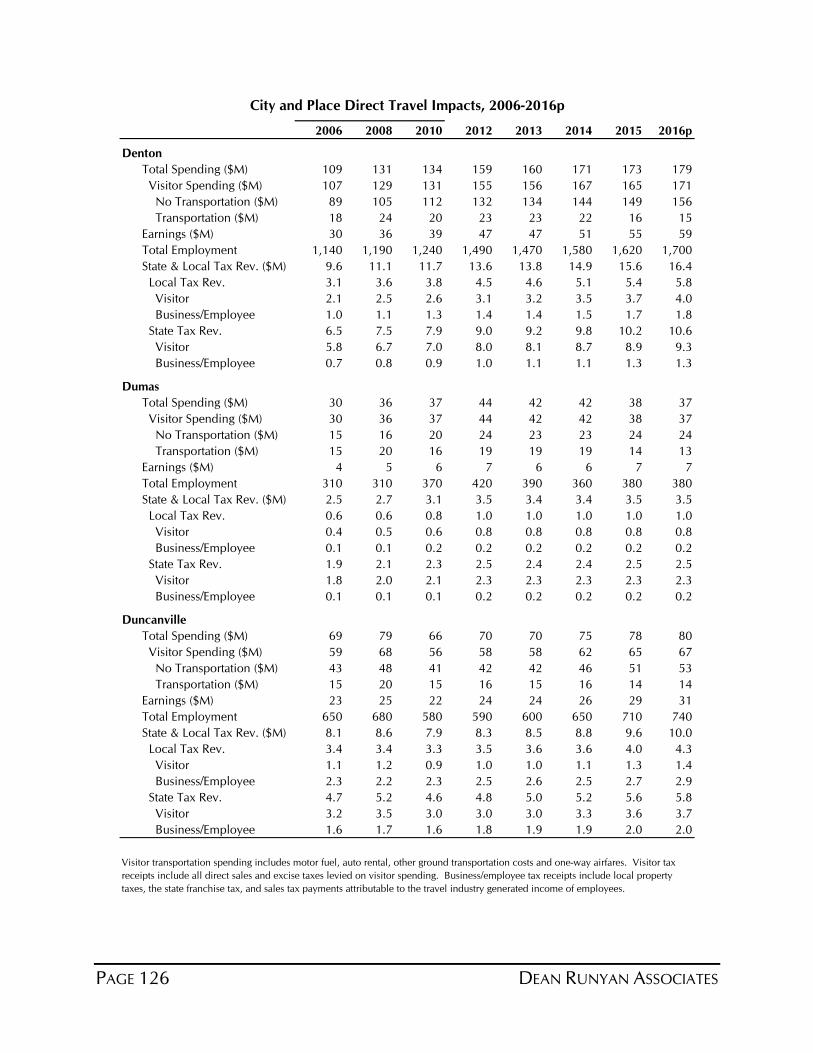
PAGE 126 DEAN RUNYAN ASSOCIATES
2006 2008 2010 2012 2013 2014 2015 2016p
Denton
Total Spending ($M) 109 131 134 159 160 171 173 179
Visitor Spending ($M) 107 129 131 155 156 167 165 171
No Transportation ($M) 89 105 112 132 134 144 149 156
Transportation ($M) 18 24 20 23 23 22 16 15
Earnings ($M) 30 36 39 47 47 51 55 59
Total Employment 1,140 1,190 1,240 1,490 1,470 1,580 1,620 1,700
State & Local Tax Rev. ($M) 9.6 11.1 11.7 13.6 13.8 14.9 15.6 16.4
Local Tax Rev. 3.1 3.6 3.8 4.5 4.6 5.1 5.4 5.8
Visitor 2.1 2.5 2.6 3.1 3.2 3.5 3.7 4.0
Business/Employee 1.0 1.1 1.3 1.4 1.4 1.5 1.7 1.8
State Tax Rev. 6.5 7.5 7.9 9.0 9.2 9.8 10.2 10.6
Visitor 5.8 6.7 7.0 8.0 8.1 8.7 8.9 9.3
Business/Employee 0.7 0.8 0.9 1.0 1.1 1.1 1.3 1.3
Dumas
Total Spending ($M) 30 36 37 44 42 42 38 37
Visitor Spending ($M) 30 36 37 44 42 42 38 37
No Transportation ($M) 15 16 20 24 23 23 24 24
Transportation ($M) 15 20 16 19 19 19 14 13
Earnings ($M) 4 5 6 7 6 6 7 7
Total Employment 310 310 370 420 390 360 380 380
State & Local Tax Rev. ($M) 2.5 2.7 3.1 3.5 3.4 3.4 3.5 3.5
Local Tax Rev. 0.6 0.6 0.8 1.0 1.0 1.0 1.0 1.0
Visitor 0.4 0.5 0.6 0.8 0.8 0.8 0.8 0.8
Business/Employee 0.1 0.1 0.2 0.2 0.2 0.2 0.2 0.2
State Tax Rev. 1.9 2.1 2.3 2.5 2.4 2.4 2.5 2.5
Visitor 1.8 2.0 2.1 2.3 2.3 2.3 2.3 2.3
Business/Employee 0.1 0.1 0.1 0.2 0.2 0.2 0.2 0.2
Duncanville
Total Spending ($M) 69 79 66 70 70 75 78 80
Visitor Spending ($M) 59 68 56 58 58 62 65 67
No Transportation ($M) 43 48 41 42 42 46 51 53
Transportation ($M) 15 20 15 16 15 16 14 14
Earnings ($M) 23 25 22 24 24 26 29 31
Total Employment 650 680 580 590 600 650 710 740
State & Local Tax Rev. ($M) 8.1 8.6 7.9 8.3 8.5 8.8 9.6 10.0
Local Tax Rev. 3.4 3.4 3.3 3.5 3.6 3.6 4.0 4.3
Visitor 1.1 1.2 0.9 1.0 1.0 1.1 1.3 1.4
Business/Employee 2.3 2.2 2.3 2.5 2.6 2.5 2.7 2.9
State Tax Rev. 4.7 5.2 4.6 4.8 5.0 5.2 5.6 5.8
Visitor 3.2 3.5 3.0 3.0 3.0 3.3 3.6 3.7
Business/Employee 1.6 1.7 1.6 1.8 1.9 1.9 2.0 2.0
City and Place Direct Travel Impacts, 2006-2016p
Visitor transportation spending includes motor fuel, auto rental, other ground transportation costs and one-way airfares. Visitor tax
receipts include all direct sales and excise taxes levied on visitor spending. Business/employee tax receipts include local property
taxes, the state franchise tax, and sales tax payments attributable to the travel industry generated income of employees.
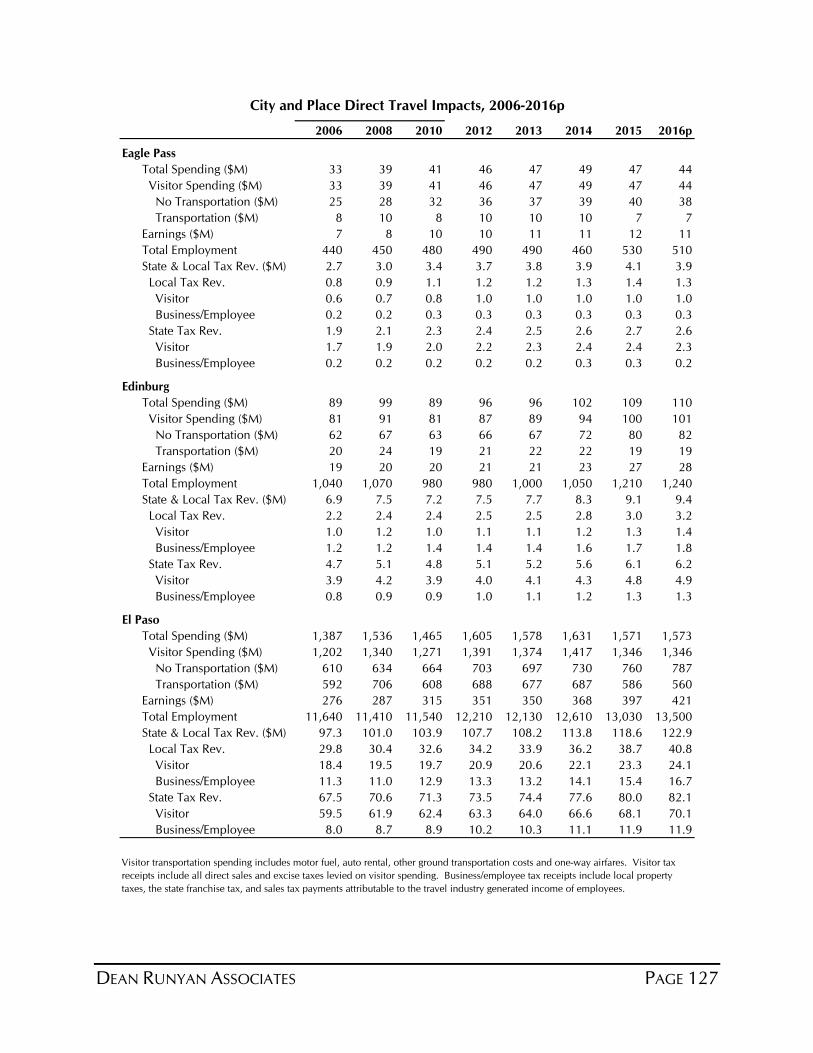
DEAN RUNYAN ASSOCIATES PAGE 127
2006 2008 2010 2012 2013 2014 2015 2016p
Eagle Pass
Total Spending ($M) 33 39 41 46 47 49 47 44
Visitor Spending ($M) 33 39 41 46 47 49 47 44
No Transportation ($M) 25 28 32 36 37 39 40 38
Transportation ($M) 8 10 8 10 10 10 7 7
Earnings ($M) 7 8 10 10 11 11 12 11
Total Employment 440 450 480 490 490 460 530 510
State & Local Tax Rev. ($M) 2.7 3.0 3.4 3.7 3.8 3.9 4.1 3.9
Local Tax Rev. 0.8 0.9 1.1 1.2 1.2 1.3 1.4 1.3
Visitor 0.6 0.7 0.8 1.0 1.0 1.0 1.0 1.0
Business/Employee 0.2 0.2 0.3 0.3 0.3 0.3 0.3 0.3
State Tax Rev. 1.9 2.1 2.3 2.4 2.5 2.6 2.7 2.6
Visitor 1.7 1.9 2.0 2.2 2.3 2.4 2.4 2.3
Business/Employee 0.2 0.2 0.2 0.2 0.2 0.3 0.3 0.2
Edinburg
Total Spending ($M) 89 99 89 96 96 102 109 110
Visitor Spending ($M) 81 91 81 87 89 94 100 101
No Transportation ($M) 62 67 63 66 67 72 80 82
Transportation ($M) 20 24 19 21 22 22 19 19
Earnings ($M) 19 20 20 21 21 23 27 28
Total Employment 1,040 1,070 980 980 1,000 1,050 1,210 1,240
State & Local Tax Rev. ($M) 6.9 7.5 7.2 7.5 7.7 8.3 9.1 9.4
Local Tax Rev. 2.2 2.4 2.4 2.5 2.5 2.8 3.0 3.2
Visitor 1.0 1.2 1.0 1.1 1.1 1.2 1.3 1.4
Business/Employee 1.2 1.2 1.4 1.4 1.4 1.6 1.7 1.8
State Tax Rev. 4.7 5.1 4.8 5.1 5.2 5.6 6.1 6.2
Visitor 3.9 4.2 3.9 4.0 4.1 4.3 4.8 4.9
Business/Employee 0.8 0.9 0.9 1.0 1.1 1.2 1.3 1.3
El Paso
Total Spending ($M) 1,387 1,536 1,465 1,605 1,578 1,631 1,571 1,573
Visitor Spending ($M) 1,202 1,340 1,271 1,391 1,374 1,417 1,346 1,346
No Transportation ($M) 610 634 664 703 697 730 760 787
Transportation ($M) 592 706 608 688 677 687 586 560
Earnings ($M) 276 287 315 351 350 368 397 421
Total Employment 11,640 11,410 11,540 12,210 12,130 12,610 13,030 13,500
State & Local Tax Rev. ($M) 97.3 101.0 103.9 107.7 108.2 113.8 118.6 122.9
Local Tax Rev. 29.8 30.4 32.6 34.2 33.9 36.2 38.7 40.8
Visitor 18.4 19.5 19.7 20.9 20.6 22.1 23.3 24.1
Business/Employee 11.3 11.0 12.9 13.3 13.2 14.1 15.4 16.7
State Tax Rev. 67.5 70.6 71.3 73.5 74.4 77.6 80.0 82.1
Visitor 59.5 61.9 62.4 63.3 64.0 66.6 68.1 70.1
Business/Employee 8.0 8.7 8.9 10.2 10.3 11.1 11.9 11.9
City and Place Direct Travel Impacts, 2006-2016p
Visitor transportation spending includes motor fuel, auto rental, other ground transportation costs and one-way airfares. Visitor tax
receipts include all direct sales and excise taxes levied on visitor spending. Business/employee tax receipts include local property
taxes, the state franchise tax, and sales tax payments attributable to the travel industry generated income of employees.
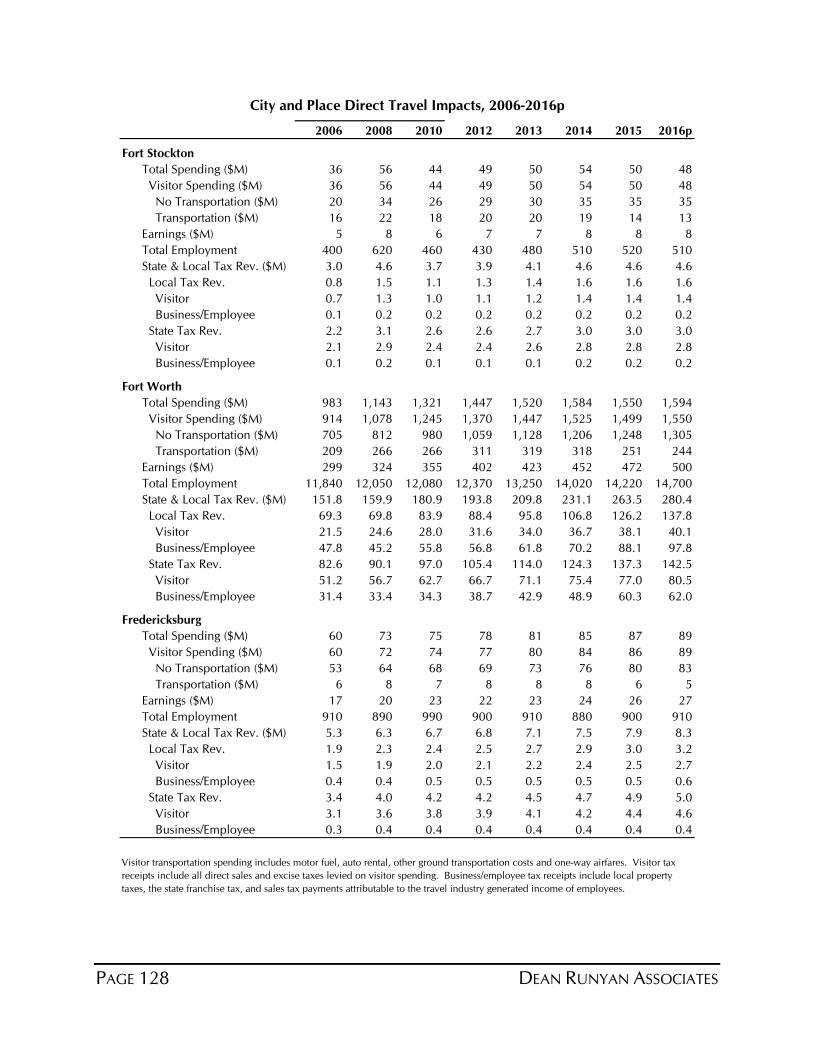
PAGE 128 DEAN RUNYAN ASSOCIATES
2006 2008 2010 2012 2013 2014 2015 2016p
Fort Stockton
Total Spending ($M) 36 56 44 49 50 54 50 48
Visitor Spending ($M) 36 56 44 49 50 54 50 48
No Transportation ($M) 20 34 26 29 30 35 35 35
Transportation ($M) 16 22 18 20 20 19 14 13
Earnings ($M) 5 8 6 7 7 8 8 8
Total Employment 400 620 460 430 480 510 520 510
State & Local Tax Rev. ($M) 3.0 4.6 3.7 3.9 4.1 4.6 4.6 4.6
Local Tax Rev. 0.8 1.5 1.1 1.3 1.4 1.6 1.6 1.6
Visitor 0.7 1.3 1.0 1.1 1.2 1.4 1.4 1.4
Business/Employee 0.1 0.2 0.2 0.2 0.2 0.2 0.2 0.2
State Tax Rev. 2.2 3.1 2.6 2.6 2.7 3.0 3.0 3.0
Visitor 2.1 2.9 2.4 2.4 2.6 2.8 2.8 2.8
Business/Employee 0.1 0.2 0.1 0.1 0.1 0.2 0.2 0.2
Fort Worth
Total Spending ($M) 983 1,143 1,321 1,447 1,520 1,584 1,550 1,594
Visitor Spending ($M) 914 1,078 1,245 1,370 1,447 1,525 1,499 1,550
No Transportation ($M) 705 812 980 1,059 1,128 1,206 1,248 1,305
Transportation ($M) 209 266 266 311 319 318 251 244
Earnings ($M) 299 324 355 402 423 452 472 500
Total Employment 11,840 12,050 12,080 12,370 13,250 14,020 14,220 14,700
State & Local Tax Rev. ($M) 151.8 159.9 180.9 193.8 209.8 231.1 263.5 280.4
Local Tax Rev. 69.3 69.8 83.9 88.4 95.8 106.8 126.2 137.8
Visitor 21.5 24.6 28.0 31.6 34.0 36.7 38.1 40.1
Business/Employee 47.8 45.2 55.8 56.8 61.8 70.2 88.1 97.8
State Tax Rev. 82.6 90.1 97.0 105.4 114.0 124.3 137.3 142.5
Visitor 51.2 56.7 62.7 66.7 71.1 75.4 77.0 80.5
Business/Employee 31.4 33.4 34.3 38.7 42.9 48.9 60.3 62.0
Fredericksburg
Total Spending ($M) 60 73 75 78 81 85 87 89
Visitor Spending ($M) 60 72 74 77 80 84 86 89
No Transportation ($M) 53 64 68 69 73 76 80 83
Transportation ($M) 6 8 7 8 8 8 6 5
Earnings ($M) 17 20 23 22 23 24 26 27
Total Employment 910 890 990 900 910 880 900 910
State & Local Tax Rev. ($M) 5.3 6.3 6.7 6.8 7.1 7.5 7.9 8.3
Local Tax Rev. 1.9 2.3 2.4 2.5 2.7 2.9 3.0 3.2
Visitor 1.5 1.9 2.0 2.1 2.2 2.4 2.5 2.7
Business/Employee 0.4 0.4 0.5 0.5 0.5 0.5 0.5 0.6
State Tax Rev. 3.4 4.0 4.2 4.2 4.5 4.7 4.9 5.0
Visitor 3.1 3.6 3.8 3.9 4.1 4.2 4.4 4.6
Business/Employee 0.3 0.4 0.4 0.4 0.4 0.4 0.4 0.4
City and Place Direct Travel Impacts, 2006-2016p
Visitor transportation spending includes motor fuel, auto rental, other ground transportation costs and one-way airfares. Visitor tax
receipts include all direct sales and excise taxes levied on visitor spending. Business/employee tax receipts include local property
taxes, the state franchise tax, and sales tax payments attributable to the travel industry generated income of employees.
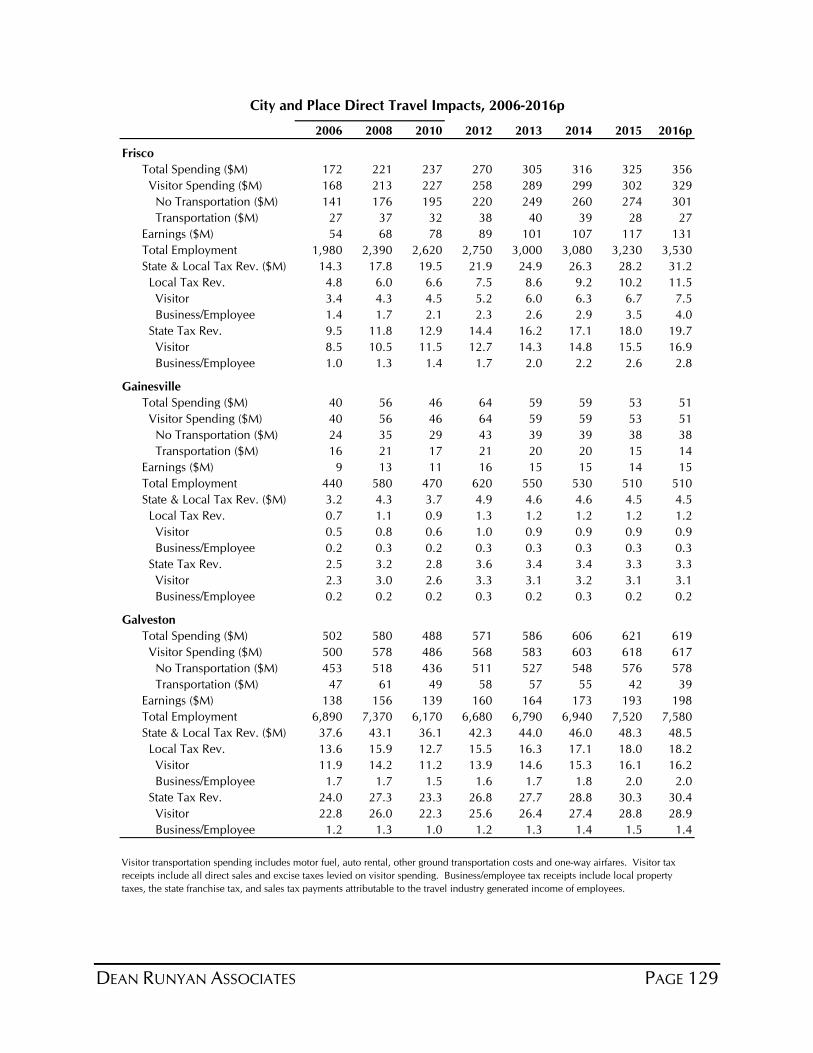
DEAN RUNYAN ASSOCIATES PAGE 129
2006 2008 2010 2012 2013 2014 2015 2016p
Frisco
Total Spending ($M) 172 221 237 270 305 316 325 356
Visitor Spending ($M) 168 213 227 258 289 299 302 329
No Transportation ($M) 141 176 195 220 249 260 274 301
Transportation ($M) 27 37 32 38 40 39 28 27
Earnings ($M) 54 68 78 89 101 107 117 131
Total Employment 1,980 2,390 2,620 2,750 3,000 3,080 3,230 3,530
State & Local Tax Rev. ($M) 14.3 17.8 19.5 21.9 24.9 26.3 28.2 31.2
Local Tax Rev. 4.8 6.0 6.6 7.5 8.6 9.2 10.2 11.5
Visitor 3.4 4.3 4.5 5.2 6.0 6.3 6.7 7.5
Business/Employee 1.4 1.7 2.1 2.3 2.6 2.9 3.5 4.0
State Tax Rev. 9.5 11.8 12.9 14.4 16.2 17.1 18.0 19.7
Visitor 8.5 10.5 11.5 12.7 14.3 14.8 15.5 16.9
Business/Employee 1.0 1.3 1.4 1.7 2.0 2.2 2.6 2.8
Gainesville
Total Spending ($M) 40 56 46 64 59 59 53 51
Visitor Spending ($M) 40 56 46 64 59 59 53 51
No Transportation ($M) 24 35 29 43 39 39 38 38
Transportation ($M) 16 21 17 21 20 20 15 14
Earnings ($M) 9 13 11 16 15 15 14 15
Total Employment 440 580 470 620 550 530 510 510
State & Local Tax Rev. ($M) 3.2 4.3 3.7 4.9 4.6 4.6 4.5 4.5
Local Tax Rev. 0.7 1.1 0.9 1.3 1.2 1.2 1.2 1.2
Visitor 0.5 0.8 0.6 1.0 0.9 0.9 0.9 0.9
Business/Employee 0.2 0.3 0.2 0.3 0.3 0.3 0.3 0.3
State Tax Rev. 2.5 3.2 2.8 3.6 3.4 3.4 3.3 3.3
Visitor 2.3 3.0 2.6 3.3 3.1 3.2 3.1 3.1
Business/Employee 0.2 0.2 0.2 0.3 0.2 0.3 0.2 0.2
Galveston
Total Spending ($M) 502 580 488 571 586 606 621 619
Visitor Spending ($M) 500 578 486 568 583 603 618 617
No Transportation ($M) 453 518 436 511 527 548 576 578
Transportation ($M) 47 61 49 58 57 55 42 39
Earnings ($M) 138 156 139 160 164 173 193 198
Total Employment 6,890 7,370 6,170 6,680 6,790 6,940 7,520 7,580
State & Local Tax Rev. ($M) 37.6 43.1 36.1 42.3 44.0 46.0 48.3 48.5
Local Tax Rev. 13.6 15.9 12.7 15.5 16.3 17.1 18.0 18.2
Visitor 11.9 14.2 11.2 13.9 14.6 15.3 16.1 16.2
Business/Employee 1.7 1.7 1.5 1.6 1.7 1.8 2.0 2.0
State Tax Rev. 24.0 27.3 23.3 26.8 27.7 28.8 30.3 30.4
Visitor 22.8 26.0 22.3 25.6 26.4 27.4 28.8 28.9
Business/Employee 1.2 1.3 1.0 1.2 1.3 1.4 1.5 1.4
City and Place Direct Travel Impacts, 2006-2016p
Visitor transportation spending includes motor fuel, auto rental, other ground transportation costs and one-way airfares. Visitor tax
receipts include all direct sales and excise taxes levied on visitor spending. Business/employee tax receipts include local property
taxes, the state franchise tax, and sales tax payments attributable to the travel industry generated income of employees.
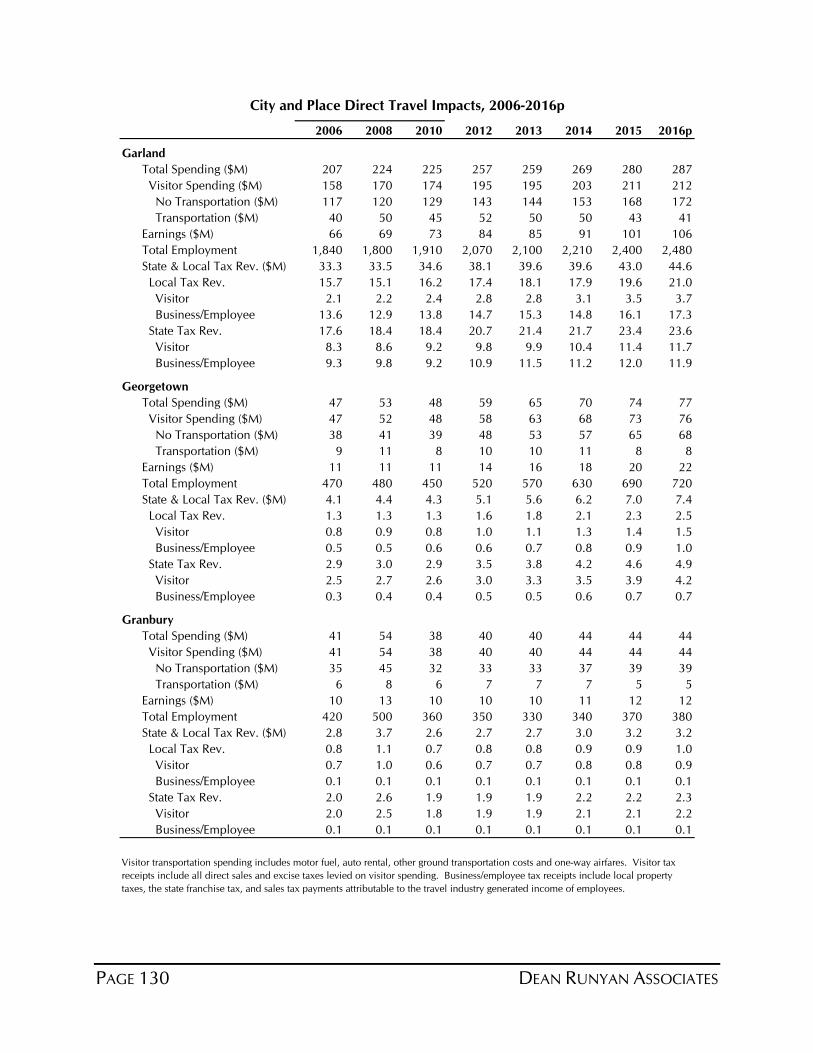
PAGE 130 DEAN RUNYAN ASSOCIATES
2006 2008 2010 2012 2013 2014 2015 2016p
Garland
Total Spending ($M) 207 224 225 257 259 269 280 287
Visitor Spending ($M) 158 170 174 195 195 203 211 212
No Transportation ($M) 117 120 129 143 144 153 168 172
Transportation ($M) 40 50 45 52 50 50 43 41
Earnings ($M) 66 69 73 84 85 91 101 106
Total Employment 1,840 1,800 1,910 2,070 2,100 2,210 2,400 2,480
State & Local Tax Rev. ($M) 33.3 33.5 34.6 38.1 39.6 39.6 43.0 44.6
Local Tax Rev. 15.7 15.1 16.2 17.4 18.1 17.9 19.6 21.0
Visitor 2.1 2.2 2.4 2.8 2.8 3.1 3.5 3.7
Business/Employee 13.6 12.9 13.8 14.7 15.3 14.8 16.1 17.3
State Tax Rev. 17.6 18.4 18.4 20.7 21.4 21.7 23.4 23.6
Visitor 8.3 8.6 9.2 9.8 9.9 10.4 11.4 11.7
Business/Employee 9.3 9.8 9.2 10.9 11.5 11.2 12.0 11.9
Georgetown
Total Spending ($M) 47 53 48 59 65 70 74 77
Visitor Spending ($M) 47 52 48 58 63 68 73 76
No Transportation ($M) 38 41 39 48 53 57 65 68
Transportation ($M) 9 11 8 10 10 11 8 8
Earnings ($M) 11 11 11 14 16 18 20 22
Total Employment 470 480 450 520 570 630 690 720
State & Local Tax Rev. ($M) 4.1 4.4 4.3 5.1 5.6 6.2 7.0 7.4
Local Tax Rev. 1.3 1.3 1.3 1.6 1.8 2.1 2.3 2.5
Visitor 0.8 0.9 0.8 1.0 1.1 1.3 1.4 1.5
Business/Employee 0.5 0.5 0.6 0.6 0.7 0.8 0.9 1.0
State Tax Rev. 2.9 3.0 2.9 3.5 3.8 4.2 4.6 4.9
Visitor 2.5 2.7 2.6 3.0 3.3 3.5 3.9 4.2
Business/Employee 0.3 0.4 0.4 0.5 0.5 0.6 0.7 0.7
Granbury
Total Spending ($M) 41 54 38 40 40 44 44 44
Visitor Spending ($M) 41 54 38 40 40 44 44 44
No Transportation ($M) 35 45 32 33 33 37 39 39
Transportation ($M) 6 8 6 7 7 7 5 5
Earnings ($M) 10 13 10 10 10 11 12 12
Total Employment 420 500 360 350 330 340 370 380
State & Local Tax Rev. ($M) 2.8 3.7 2.6 2.7 2.7 3.0 3.2 3.2
Local Tax Rev. 0.8 1.1 0.7 0.8 0.8 0.9 0.9 1.0
Visitor 0.7 1.0 0.6 0.7 0.7 0.8 0.8 0.9
Business/Employee 0.1 0.1 0.1 0.1 0.1 0.1 0.1 0.1
State Tax Rev. 2.0 2.6 1.9 1.9 1.9 2.2 2.2 2.3
Visitor 2.0 2.5 1.8 1.9 1.9 2.1 2.1 2.2
Business/Employee 0.1 0.1 0.1 0.1 0.1 0.1 0.1 0.1
City and Place Direct Travel Impacts, 2006-2016p
Visitor transportation spending includes motor fuel, auto rental, other ground transportation costs and one-way airfares. Visitor tax
receipts include all direct sales and excise taxes levied on visitor spending. Business/employee tax receipts include local property
taxes, the state franchise tax, and sales tax payments attributable to the travel industry generated income of employees.
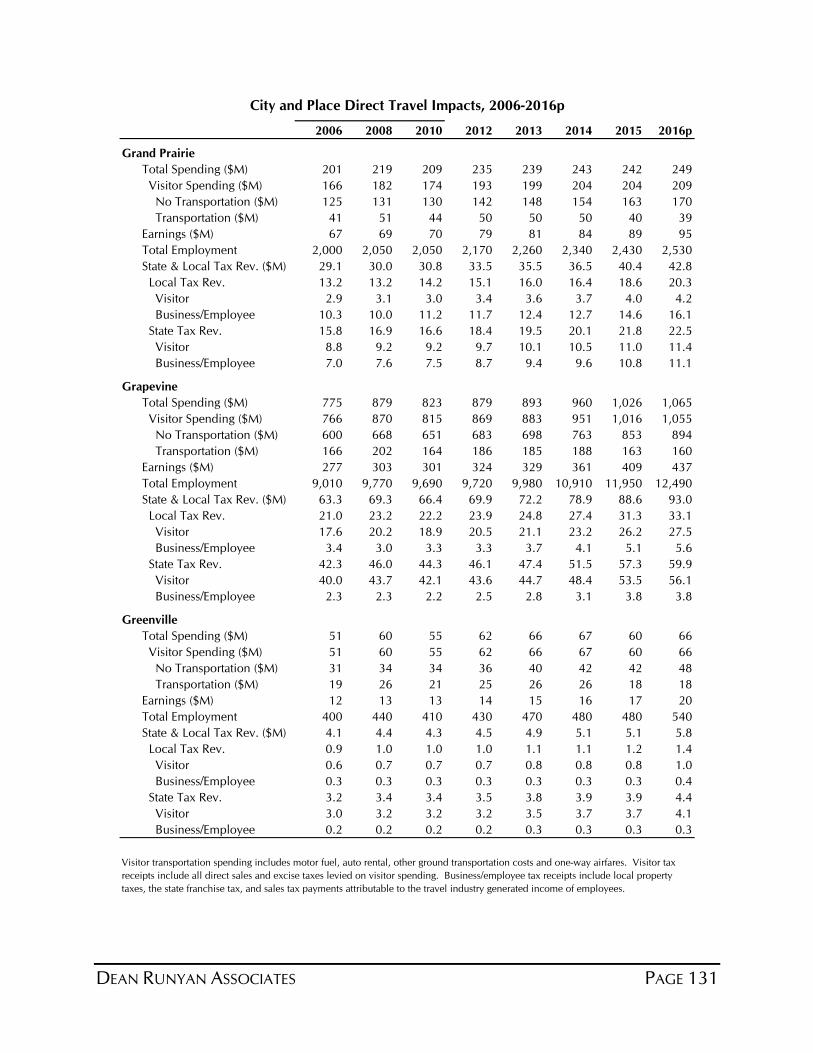
DEAN RUNYAN ASSOCIATES PAGE 131
2006 2008 2010 2012 2013 2014 2015 2016p
Grand Prairie
Total Spending ($M) 201 219 209 235 239 243 242 249
Visitor Spending ($M) 166 182 174 193 199 204 204 209
No Transportation ($M) 125 131 130 142 148 154 163 170
Transportation ($M) 41 51 44 50 50 50 40 39
Earnings ($M) 67 69 70 79 81 84 89 95
Total Employment 2,000 2,050 2,050 2,170 2,260 2,340 2,430 2,530
State & Local Tax Rev. ($M) 29.1 30.0 30.8 33.5 35.5 36.5 40.4 42.8
Local Tax Rev. 13.2 13.2 14.2 15.1 16.0 16.4 18.6 20.3
Visitor 2.9 3.1 3.0 3.4 3.6 3.7 4.0 4.2
Business/Employee 10.3 10.0 11.2 11.7 12.4 12.7 14.6 16.1
State Tax Rev. 15.8 16.9 16.6 18.4 19.5 20.1 21.8 22.5
Visitor 8.8 9.2 9.2 9.7 10.1 10.5 11.0 11.4
Business/Employee 7.0 7.6 7.5 8.7 9.4 9.6 10.8 11.1
Grapevine
Total Spending ($M) 775 879 823 879 893 960 1,026 1,065
Visitor Spending ($M) 766 870 815 869 883 951 1,016 1,055
No Transportation ($M) 600 668 651 683 698 763 853 894
Transportation ($M) 166 202 164 186 185 188 163 160
Earnings ($M) 277 303 301 324 329 361 409 437
Total Employment 9,010 9,770 9,690 9,720 9,980 10,910 11,950 12,490
State & Local Tax Rev. ($M) 63.3 69.3 66.4 69.9 72.2 78.9 88.6 93.0
Local Tax Rev. 21.0 23.2 22.2 23.9 24.8 27.4 31.3 33.1
Visitor 17.6 20.2 18.9 20.5 21.1 23.2 26.2 27.5
Business/Employee 3.4 3.0 3.3 3.3 3.7 4.1 5.1 5.6
State Tax Rev. 42.3 46.0 44.3 46.1 47.4 51.5 57.3 59.9
Visitor 40.0 43.7 42.1 43.6 44.7 48.4 53.5 56.1
Business/Employee 2.3 2.3 2.2 2.5 2.8 3.1 3.8 3.8
Greenville
Total Spending ($M) 51 60 55 62 66 67 60 66
Visitor Spending ($M) 51 60 55 62 66 67 60 66
No Transportation ($M) 31 34 34 36 40 42 42 48
Transportation ($M) 19 26 21 25 26 26 18 18
Earnings ($M) 12 13 13 14 15 16 17 20
Total Employment 400 440 410 430 470 480 480 540
State & Local Tax Rev. ($M) 4.1 4.4 4.3 4.5 4.9 5.1 5.1 5.8
Local Tax Rev. 0.9 1.0 1.0 1.0 1.1 1.1 1.2 1.4
Visitor 0.6 0.7 0.7 0.7 0.8 0.8 0.8 1.0
Business/Employee 0.3 0.3 0.3 0.3 0.3 0.3 0.3 0.4
State Tax Rev. 3.2 3.4 3.4 3.5 3.8 3.9 3.9 4.4
Visitor 3.0 3.2 3.2 3.2 3.5 3.7 3.7 4.1
Business/Employee 0.2 0.2 0.2 0.2 0.3 0.3 0.3 0.3
Visitor transportation spending includes motor fuel, auto rental, other ground transportation costs and one-way airfares. Visitor tax
receipts include all direct sales and excise taxes levied on visitor spending. Business/employee tax receipts include local property
taxes, the state franchise tax, and sales tax payments attributable to the travel industry generated income of employees.
City and Place Direct Travel Impacts, 2006-2016p
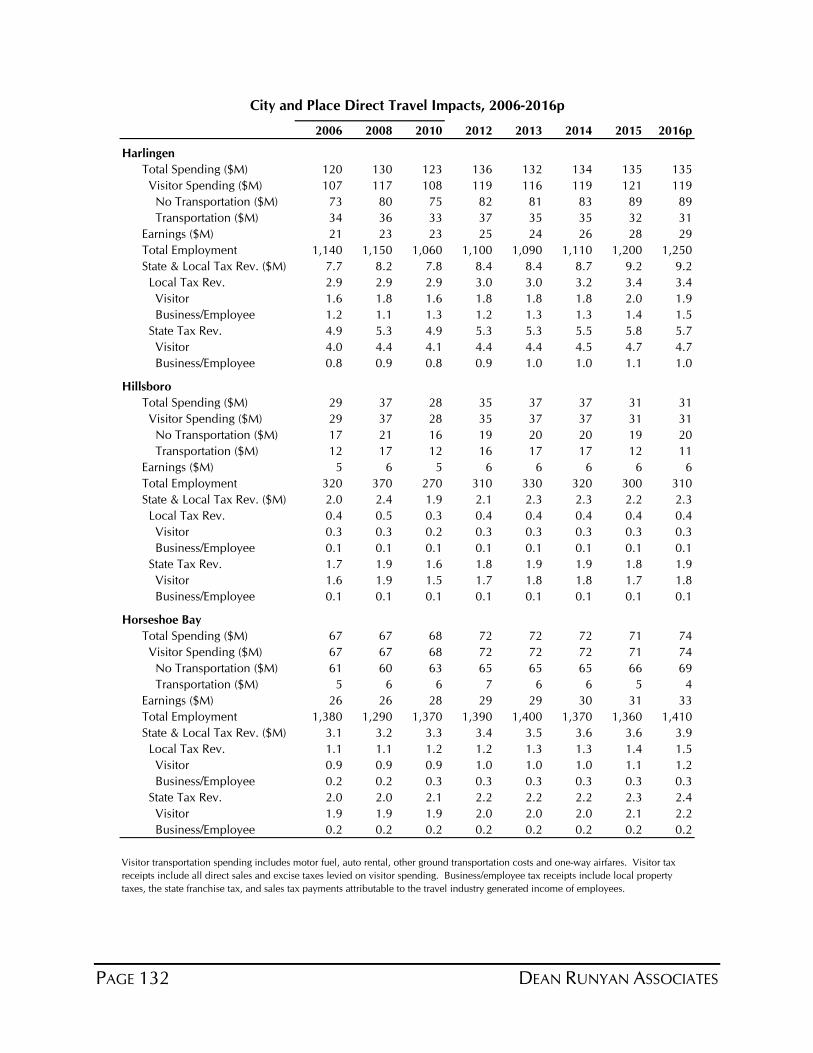
PAGE 132 DEAN RUNYAN ASSOCIATES
2006 2008 2010 2012 2013 2014 2015 2016p
Harlingen
Total Spending ($M) 120 130 123 136 132 134 135 135
Visitor Spending ($M) 107 117 108 119 116 119 121 119
No Transportation ($M) 73 80 75 82 81 83 89 89
Transportation ($M) 34 36 33 37 35 35 32 31
Earnings ($M) 21 23 23 25 24 26 28 29
Total Employment 1,140 1,150 1,060 1,100 1,090 1,110 1,200 1,250
State & Local Tax Rev. ($M) 7.7 8.2 7.8 8.4 8.4 8.7 9.2 9.2
Local Tax Rev. 2.9 2.9 2.9 3.0 3.0 3.2 3.4 3.4
Visitor 1.6 1.8 1.6 1.8 1.8 1.8 2.0 1.9
Business/Employee 1.2 1.1 1.3 1.2 1.3 1.3 1.4 1.5
State Tax Rev. 4.9 5.3 4.9 5.3 5.3 5.5 5.8 5.7
Visitor 4.0 4.4 4.1 4.4 4.4 4.5 4.7 4.7
Business/Employee 0.8 0.9 0.8 0.9 1.0 1.0 1.1 1.0
Hillsboro
Total Spending ($M) 29 37 28 35 37 37 31 31
Visitor Spending ($M) 29 37 28 35 37 37 31 31
No Transportation ($M) 17 21 16 19 20 20 19 20
Transportation ($M) 12 17 12 16 17 17 12 11
Earnings ($M) 5 6 5 6 6 6 6 6
Total Employment 320 370 270 310 330 320 300 310
State & Local Tax Rev. ($M) 2.0 2.4 1.9 2.1 2.3 2.3 2.2 2.3
Local Tax Rev. 0.4 0.5 0.3 0.4 0.4 0.4 0.4 0.4
Visitor 0.3 0.3 0.2 0.3 0.3 0.3 0.3 0.3
Business/Employee 0.1 0.1 0.1 0.1 0.1 0.1 0.1 0.1
State Tax Rev. 1.7 1.9 1.6 1.8 1.9 1.9 1.8 1.9
Visitor 1.6 1.9 1.5 1.7 1.8 1.8 1.7 1.8
Business/Employee 0.1 0.1 0.1 0.1 0.1 0.1 0.1 0.1
Horseshoe Bay
Total Spending ($M) 67 67 68 72 72 72 71 74
Visitor Spending ($M) 67 67 68 72 72 72 71 74
No Transportation ($M) 61 60 63 65 65 65 66 69
Transportation ($M) 5 6 6 7 6 6 5 4
Earnings ($M) 26 26 28 29 29 30 31 33
Total Employment 1,380 1,290 1,370 1,390 1,400 1,370 1,360 1,410
State & Local Tax Rev. ($M) 3.1 3.2 3.3 3.4 3.5 3.6 3.6 3.9
Local Tax Rev. 1.1 1.1 1.2 1.2 1.3 1.3 1.4 1.5
Visitor 0.9 0.9 0.9 1.0 1.0 1.0 1.1 1.2
Business/Employee 0.2 0.2 0.3 0.3 0.3 0.3 0.3 0.3
State Tax Rev. 2.0 2.0 2.1 2.2 2.2 2.2 2.3 2.4
Visitor 1.9 1.9 1.9 2.0 2.0 2.0 2.1 2.2
Business/Employee 0.2 0.2 0.2 0.2 0.2 0.2 0.2 0.2
City and Place Direct Travel Impacts, 2006-2016p
Visitor transportation spending includes motor fuel, auto rental, other ground transportation costs and one-way airfares. Visitor tax
receipts include all direct sales and excise taxes levied on visitor spending. Business/employee tax receipts include local property
taxes, the state franchise tax, and sales tax payments attributable to the travel industry generated income of employees.
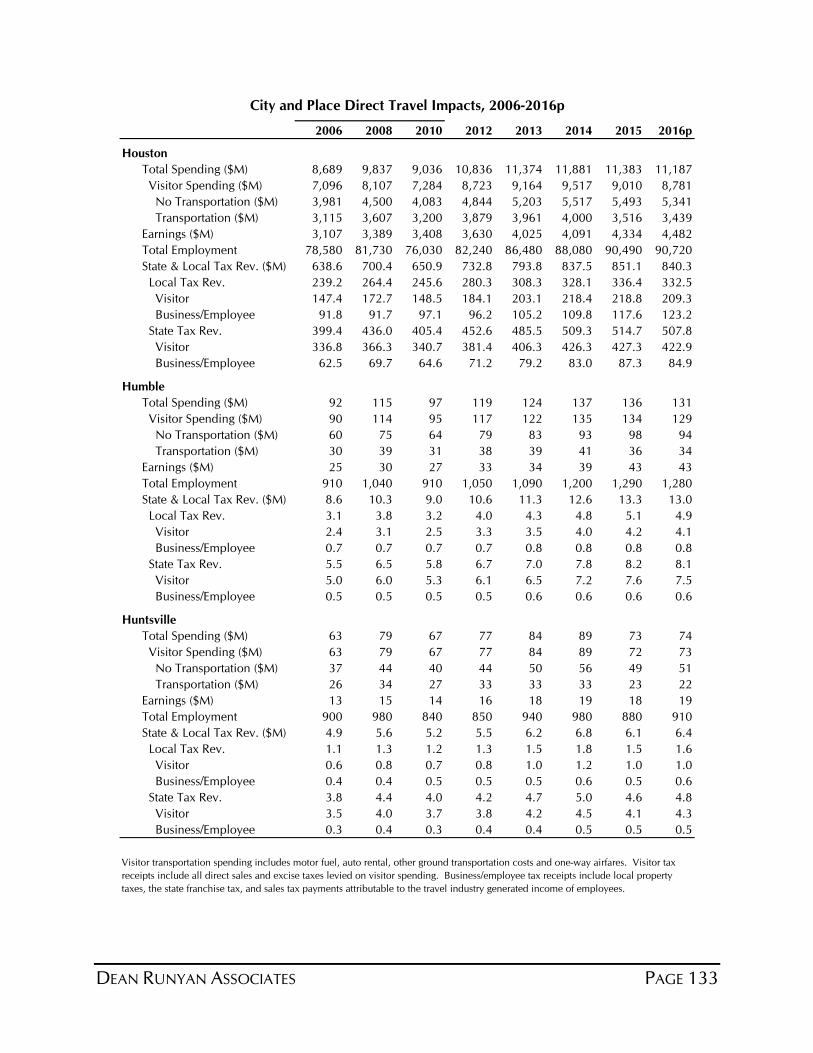
DEAN RUNYAN ASSOCIATES PAGE 133
2006 2008 2010 2012 2013 2014 2015 2016p
Houston
Total Spending ($M) 8,689 9,837 9,036 10,836 11,374 11,881 11,383 11,187
Visitor Spending ($M) 7,096 8,107 7,284 8,723 9,164 9,517 9,010 8,781
No Transportation ($M) 3,981 4,500 4,083 4,844 5,203 5,517 5,493 5,341
Transportation ($M) 3,115 3,607 3,200 3,879 3,961 4,000 3,516 3,439
Earnings ($M) 3,107 3,389 3,408 3,630 4,025 4,091 4,334 4,482
Total Employment 78,580 81,730 76,030 82,240 86,480 88,080 90,490 90,720
State & Local Tax Rev. ($M) 638.6 700.4 650.9 732.8 793.8 837.5 851.1 840.3
Local Tax Rev. 239.2 264.4 245.6 280.3 308.3 328.1 336.4 332.5
Visitor 147.4 172.7 148.5 184.1 203.1 218.4 218.8 209.3
Business/Employee 91.8 91.7 97.1 96.2 105.2 109.8 117.6 123.2
State Tax Rev. 399.4 436.0 405.4 452.6 485.5 509.3 514.7 507.8
Visitor 336.8 366.3 340.7 381.4 406.3 426.3 427.3 422.9
Business/Employee 62.5 69.7 64.6 71.2 79.2 83.0 87.3 84.9
Humble
Total Spending ($M) 92 115 97 119 124 137 136 131
Visitor Spending ($M) 90 114 95 117 122 135 134 129
No Transportation ($M) 60 75 64 79 83 93 98 94
Transportation ($M) 30 39 31 38 39 41 36 34
Earnings ($M) 25 30 27 33 34 39 43 43
Total Employment 910 1,040 910 1,050 1,090 1,200 1,290 1,280
State & Local Tax Rev. ($M) 8.6 10.3 9.0 10.6 11.3 12.6 13.3 13.0
Local Tax Rev. 3.1 3.8 3.2 4.0 4.3 4.8 5.1 4.9
Visitor 2.4 3.1 2.5 3.3 3.5 4.0 4.2 4.1
Business/Employee 0.7 0.7 0.7 0.7 0.8 0.8 0.8 0.8
State Tax Rev. 5.5 6.5 5.8 6.7 7.0 7.8 8.2 8.1
Visitor 5.0 6.0 5.3 6.1 6.5 7.2 7.6 7.5
Business/Employee 0.5 0.5 0.5 0.5 0.6 0.6 0.6 0.6
Huntsville
Total Spending ($M) 63 79 67 77 84 89 73 74
Visitor Spending ($M) 63 79 67 77 84 89 72 73
No Transportation ($M) 37 44 40 44 50 56 49 51
Transportation ($M) 26 34 27 33 33 33 23 22
Earnings ($M) 13 15 14 16 18 19 18 19
Total Employment 900 980 840 850 940 980 880 910
State & Local Tax Rev. ($M) 4.9 5.6 5.2 5.5 6.2 6.8 6.1 6.4
Local Tax Rev. 1.1 1.3 1.2 1.3 1.5 1.8 1.5 1.6
Visitor 0.6 0.8 0.7 0.8 1.0 1.2 1.0 1.0
Business/Employee 0.4 0.4 0.5 0.5 0.5 0.6 0.5 0.6
State Tax Rev. 3.8 4.4 4.0 4.2 4.7 5.0 4.6 4.8
Visitor 3.5 4.0 3.7 3.8 4.2 4.5 4.1 4.3
Business/Employee 0.3 0.4 0.3 0.4 0.4 0.5 0.5 0.5
City and Place Direct Travel Impacts, 2006-2016p
Visitor transportation spending includes motor fuel, auto rental, other ground transportation costs and one-way airfares. Visitor tax
receipts include all direct sales and excise taxes levied on visitor spending. Business/employee tax receipts include local property
taxes, the state franchise tax, and sales tax payments attributable to the travel industry generated income of employees.

PAGE 134 DEAN RUNYAN ASSOCIATES
2006 2008 2010 2012 2013 2014 2015 2016p
Hurst
Total Spending ($M) 44 52 52 55 57 56 55 56
Visitor Spending ($M) 37 46 46 50 53 52 52 54
No Transportation ($M) 29 35 37 39 41 42 44 45
Transportation ($M) 8 11 10 11 11 11 9 8
Earnings ($M) 14 16 17 19 20 20 21 22
Total Employment 500 630 670 670 710 700 720 740
State & Local Tax Rev. ($M) 7.4 7.6 7.7 8.1 8.7 9.3 10.7 11.2
Local Tax Rev. 3.6 3.4 3.6 3.7 4.0 4.3 5.1 5.5
Visitor 0.7 1.0 1.0 1.1 1.2 1.2 1.2 1.3
Business/Employee 2.8 2.5 2.6 2.6 2.8 3.1 3.9 4.2
State Tax Rev. 3.8 4.2 4.1 4.4 4.7 5.0 5.6 5.7
Visitor 1.9 2.3 2.4 2.5 2.6 2.6 2.7 2.8
Business/Employee 1.9 1.9 1.7 1.9 2.1 2.4 2.9 2.9
Irving
Total Spending ($M) 1,309 1,414 1,268 1,465 1,516 1,595 1,621 1,683
Visitor Spending ($M) 1,254 1,353 1,211 1,394 1,446 1,522 1,544 1,601
No Transportation ($M) 933 964 887 1,014 1,065 1,135 1,207 1,267
Transportation ($M) 321 389 324 380 381 387 337 334
Earnings ($M) 458 471 443 511 531 568 614 657
Total Employment 13,380 13,020 12,240 13,490 14,170 15,140 15,810 16,670
State & Local Tax Rev. ($M) 116.4 120.8 112.7 126.6 133.4 139.9 149.9 157.9
Local Tax Rev. 39.0 40.0 37.5 42.6 45.2 47.2 51.3 55.0
Visitor 26.4 27.7 24.3 28.4 30.3 32.5 35.2 37.4
Business/Employee 12.6 12.2 13.2 14.2 14.9 14.7 16.1 17.6
State Tax Rev. 77.4 80.8 75.3 84.1 88.2 92.7 98.6 102.9
Visitor 68.8 71.5 66.5 73.6 76.9 81.6 86.6 90.8
Business/Employee 8.6 9.3 8.8 10.5 11.3 11.1 12.0 12.1
Jasper
Total Spending ($M) 22 27 19 18 19 21 20 20
Visitor Spending ($M) 22 27 19 18 19 21 20 20
No Transportation ($M) 19 22 15 14 15 17 17 17
Transportation ($M) 4 5 4 4 4 4 3 3
Earnings ($M) 7 8 6 5 5 6 6 6
Total Employment 430 460 300 260 260 310 310 300
State & Local Tax Rev. ($M) 1.6 1.8 1.3 1.2 1.2 1.4 1.4 1.4
Local Tax Rev. 0.5 0.6 0.4 0.4 0.4 0.5 0.5 0.5
Visitor 0.4 0.5 0.3 0.3 0.3 0.4 0.4 0.4
Business/Employee 0.1 0.1 0.1 0.1 0.1 0.1 0.1 0.1
State Tax Rev. 1.0 1.2 0.9 0.8 0.8 0.9 1.0 0.9
Visitor 1.0 1.1 0.8 0.7 0.8 0.8 0.9 0.9
Business/Employee 0.1 0.1 0.1 0.1 0.1 0.1 0.1 0.1
City and Place Direct Travel Impacts, 2006-2016p
Visitor transportation spending includes motor fuel, auto rental, other ground transportation costs and one-way airfares. Visitor tax
receipts include all direct sales and excise taxes levied on visitor spending. Business/employee tax receipts include local property
taxes, the state franchise tax, and sales tax payments attributable to the travel industry generated income of employees.
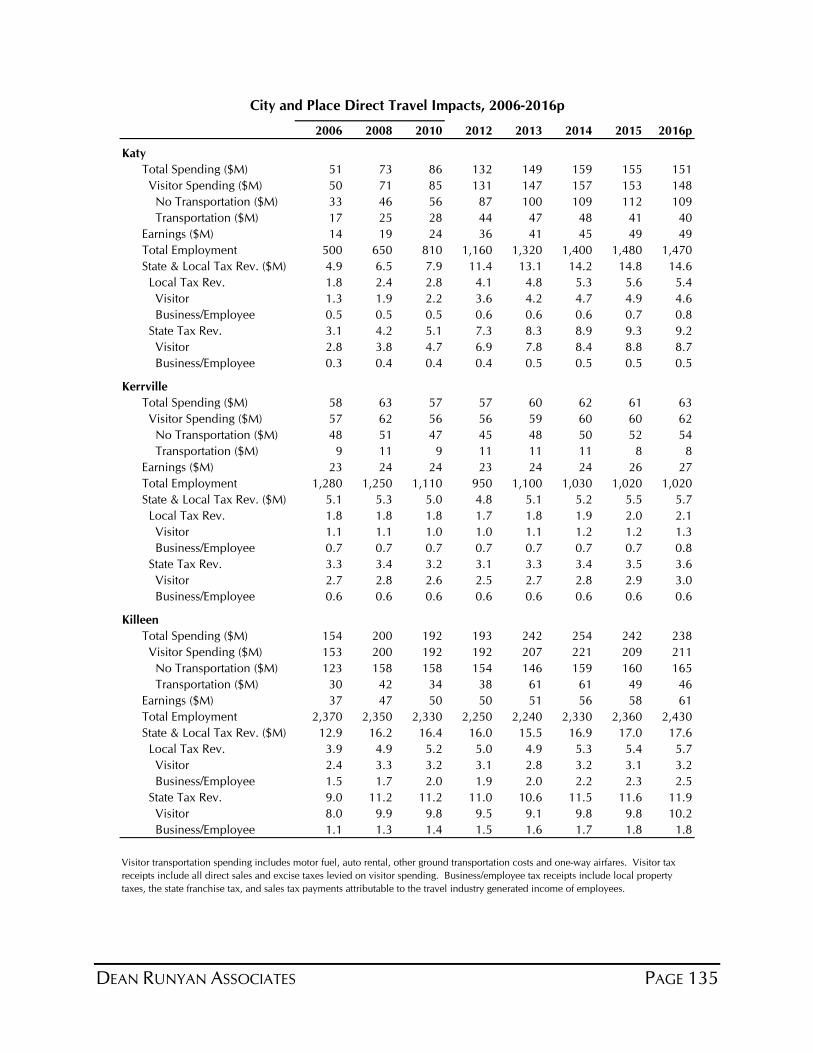
DEAN RUNYAN ASSOCIATES PAGE 135
2006 2008 2010 2012 2013 2014 2015 2016p
Katy
Total Spending ($M) 51 73 86 132 149 159 155 151
Visitor Spending ($M) 50 71 85 131 147 157 153 148
No Transportation ($M) 33 46 56 87 100 109 112 109
Transportation ($M) 17 25 28 44 47 48 41 40
Earnings ($M) 14 19 24 36 41 45 49 49
Total Employment 500 650 810 1,160 1,320 1,400 1,480 1,470
State & Local Tax Rev. ($M) 4.9 6.5 7.9 11.4 13.1 14.2 14.8 14.6
Local Tax Rev. 1.8 2.4 2.8 4.1 4.8 5.3 5.6 5.4
Visitor 1.3 1.9 2.2 3.6 4.2 4.7 4.9 4.6
Business/Employee 0.5 0.5 0.5 0.6 0.6 0.6 0.7 0.8
State Tax Rev. 3.1 4.2 5.1 7.3 8.3 8.9 9.3 9.2
Visitor 2.8 3.8 4.7 6.9 7.8 8.4 8.8 8.7
Business/Employee 0.3 0.4 0.4 0.4 0.5 0.5 0.5 0.5
Kerrville
Total Spending ($M) 58 63 57 57 60 62 61 63
Visitor Spending ($M) 57 62 56 56 59 60 60 62
No Transportation ($M) 48 51 47 45 48 50 52 54
Transportation ($M) 9 11 9 11 11 11 8 8
Earnings ($M) 23 24 24 23 24 24 26 27
Total Employment 1,280 1,250 1,110 950 1,100 1,030 1,020 1,020
State & Local Tax Rev. ($M) 5.1 5.3 5.0 4.8 5.1 5.2 5.5 5.7
Local Tax Rev. 1.8 1.8 1.8 1.7 1.8 1.9 2.0 2.1
Visitor 1.1 1.1 1.0 1.0 1.1 1.2 1.2 1.3
Business/Employee 0.7 0.7 0.7 0.7 0.7 0.7 0.7 0.8
State Tax Rev. 3.3 3.4 3.2 3.1 3.3 3.4 3.5 3.6
Visitor 2.7 2.8 2.6 2.5 2.7 2.8 2.9 3.0
Business/Employee 0.6 0.6 0.6 0.6 0.6 0.6 0.6 0.6
Killeen
Total Spending ($M) 154 200 192 193 242 254 242 238
Visitor Spending ($M) 153 200 192 192 207 221 209 211
No Transportation ($M) 123 158 158 154 146 159 160 165
Transportation ($M) 30 42 34 38 61 61 49 46
Earnings ($M) 37 47 50 50 51 56 58 61
Total Employment 2,370 2,350 2,330 2,250 2,240 2,330 2,360 2,430
State & Local Tax Rev. ($M) 12.9 16.2 16.4 16.0 15.5 16.9 17.0 17.6
Local Tax Rev. 3.9 4.9 5.2 5.0 4.9 5.3 5.4 5.7
Visitor 2.4 3.3 3.2 3.1 2.8 3.2 3.1 3.2
Business/Employee 1.5 1.7 2.0 1.9 2.0 2.2 2.3 2.5
State Tax Rev. 9.0 11.2 11.2 11.0 10.6 11.5 11.6 11.9
Visitor 8.0 9.9 9.8 9.5 9.1 9.8 9.8 10.2
Business/Employee 1.1 1.3 1.4 1.5 1.6 1.7 1.8 1.8
City and Place Direct Travel Impacts, 2006-2016p
Visitor transportation spending includes motor fuel, auto rental, other ground transportation costs and one-way airfares. Visitor tax
receipts include all direct sales and excise taxes levied on visitor spending. Business/employee tax receipts include local property
taxes, the state franchise tax, and sales tax payments attributable to the travel industry generated income of employees.
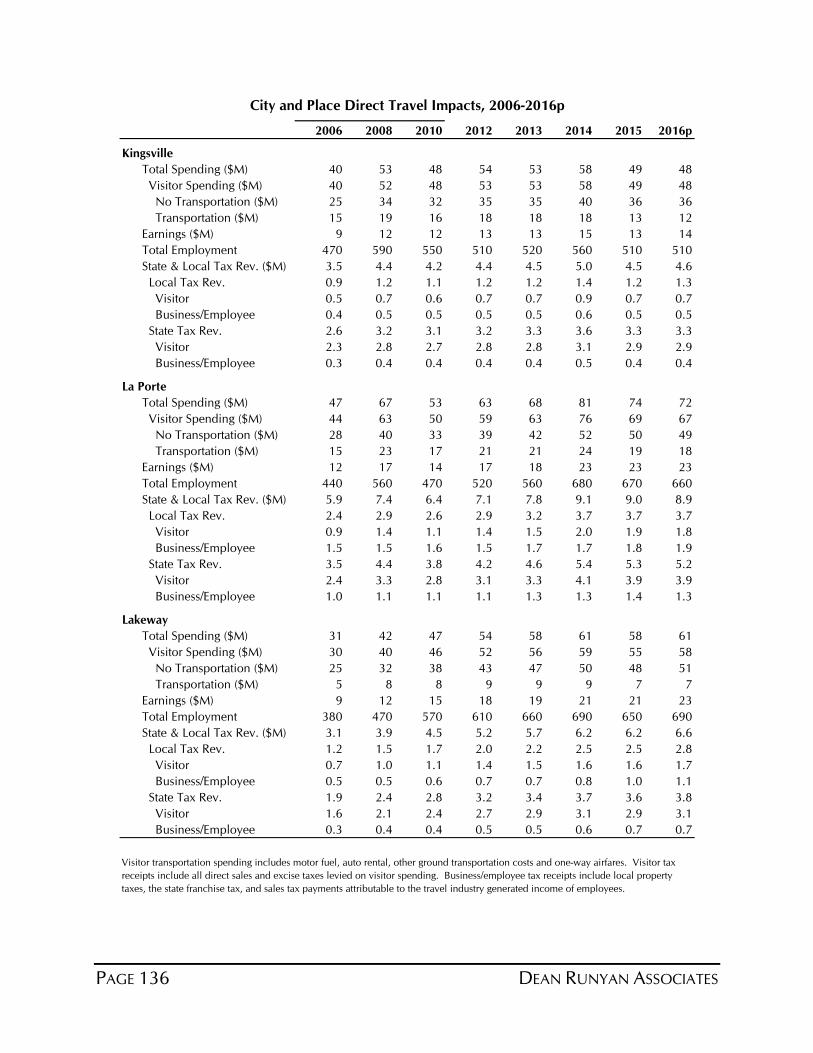
PAGE 136 DEAN RUNYAN ASSOCIATES
2006 2008 2010 2012 2013 2014 2015 2016p
Kingsville
Total Spending ($M) 40 53 48 54 53 58 49 48
Visitor Spending ($M) 40 52 48 53 53 58 49 48
No Transportation ($M) 25 34 32 35 35 40 36 36
Transportation ($M) 15 19 16 18 18 18 13 12
Earnings ($M) 9 12 12 13 13 15 13 14
Total Employment 470 590 550 510 520 560 510 510
State & Local Tax Rev. ($M) 3.5 4.4 4.2 4.4 4.5 5.0 4.5 4.6
Local Tax Rev. 0.9 1.2 1.1 1.2 1.2 1.4 1.2 1.3
Visitor 0.5 0.7 0.6 0.7 0.7 0.9 0.7 0.7
Business/Employee 0.4 0.5 0.5 0.5 0.5 0.6 0.5 0.5
State Tax Rev. 2.6 3.2 3.1 3.2 3.3 3.6 3.3 3.3
Visitor 2.3 2.8 2.7 2.8 2.8 3.1 2.9 2.9
Business/Employee 0.3 0.4 0.4 0.4 0.4 0.5 0.4 0.4
La Porte
Total Spending ($M) 47 67 53 63 68 81 74 72
Visitor Spending ($M) 44 63 50 59 63 76 69 67
No Transportation ($M) 28 40 33 39 42 52 50 49
Transportation ($M) 15 23 17 21 21 24 19 18
Earnings ($M) 12 17 14 17 18 23 23 23
Total Employment 440 560 470 520 560 680 670 660
State & Local Tax Rev. ($M) 5.9 7.4 6.4 7.1 7.8 9.1 9.0 8.9
Local Tax Rev. 2.4 2.9 2.6 2.9 3.2 3.7 3.7 3.7
Visitor 0.9 1.4 1.1 1.4 1.5 2.0 1.9 1.8
Business/Employee 1.5 1.5 1.6 1.5 1.7 1.7 1.8 1.9
State Tax Rev. 3.5 4.4 3.8 4.2 4.6 5.4 5.3 5.2
Visitor 2.4 3.3 2.8 3.1 3.3 4.1 3.9 3.9
Business/Employee 1.0 1.1 1.1 1.1 1.3 1.3 1.4 1.3
Lakeway
Total Spending ($M) 31 42 47 54 58 61 58 61
Visitor Spending ($M) 30 40 46 52 56 59 55 58
No Transportation ($M) 25 32 38 43 47 50 48 51
Transportation ($M) 5 8 8 9 9 9 7 7
Earnings ($M) 9 12 15 18 19 21 21 23
Total Employment 380 470 570 610 660 690 650 690
State & Local Tax Rev. ($M) 3.1 3.9 4.5 5.2 5.7 6.2 6.2 6.6
Local Tax Rev. 1.2 1.5 1.7 2.0 2.2 2.5 2.5 2.8
Visitor 0.7 1.0 1.1 1.4 1.5 1.6 1.6 1.7
Business/Employee 0.5 0.5 0.6 0.7 0.7 0.8 1.0 1.1
State Tax Rev. 1.9 2.4 2.8 3.2 3.4 3.7 3.6 3.8
Visitor 1.6 2.1 2.4 2.7 2.9 3.1 2.9 3.1
Business/Employee 0.3 0.4 0.4 0.5 0.5 0.6 0.7 0.7
City and Place Direct Travel Impacts, 2006-2016p
Visitor transportation spending includes motor fuel, auto rental, other ground transportation costs and one-way airfares. Visitor tax
receipts include all direct sales and excise taxes levied on visitor spending. Business/employee tax receipts include local property
taxes, the state franchise tax, and sales tax payments attributable to the travel industry generated income of employees.
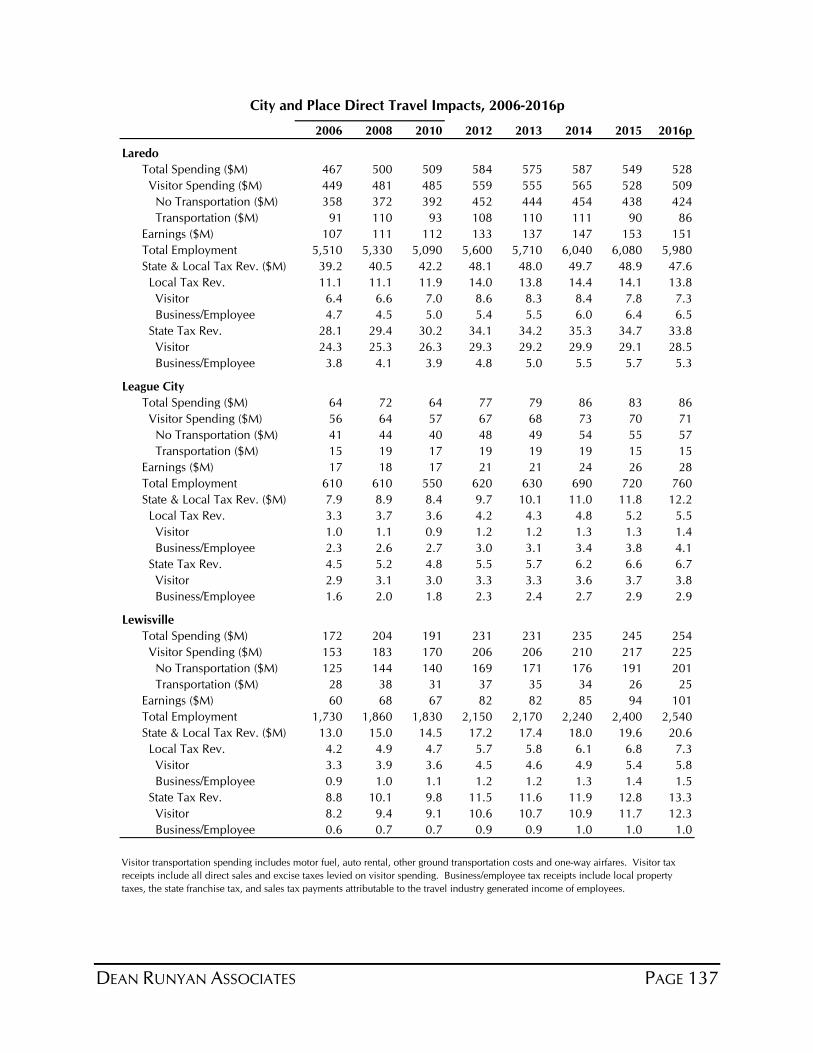
DEAN RUNYAN ASSOCIATES PAGE 137
2006 2008 2010 2012 2013 2014 2015 2016p
Laredo
Total Spending ($M) 467 500 509 584 575 587 549 528
Visitor Spending ($M) 449 481 485 559 555 565 528 509
No Transportation ($M) 358 372 392 452 444 454 438 424
Transportation ($M) 91 110 93 108 110 111 90 86
Earnings ($M) 107 111 112 133 137 147 153 151
Total Employment 5,510 5,330 5,090 5,600 5,710 6,040 6,080 5,980
State & Local Tax Rev. ($M) 39.2 40.5 42.2 48.1 48.0 49.7 48.9 47.6
Local Tax Rev. 11.1 11.1 11.9 14.0 13.8 14.4 14.1 13.8
Visitor 6.4 6.6 7.0 8.6 8.3 8.4 7.8 7.3
Business/Employee 4.7 4.5 5.0 5.4 5.5 6.0 6.4 6.5
State Tax Rev. 28.1 29.4 30.2 34.1 34.2 35.3 34.7 33.8
Visitor 24.3 25.3 26.3 29.3 29.2 29.9 29.1 28.5
Business/Employee 3.8 4.1 3.9 4.8 5.0 5.5 5.7 5.3
League City
Total Spending ($M) 64 72 64 77 79 86 83 86
Visitor Spending ($M) 56 64 57 67 68 73 70 71
No Transportation ($M) 41 44 40 48 49 54 55 57
Transportation ($M) 15 19 17 19 19 19 15 15
Earnings ($M) 17 18 17 21 21 24 26 28
Total Employment 610 610 550 620 630 690 720 760
State & Local Tax Rev. ($M) 7.9 8.9 8.4 9.7 10.1 11.0 11.8 12.2
Local Tax Rev. 3.3 3.7 3.6 4.2 4.3 4.8 5.2 5.5
Visitor 1.0 1.1 0.9 1.2 1.2 1.3 1.3 1.4
Business/Employee 2.3 2.6 2.7 3.0 3.1 3.4 3.8 4.1
State Tax Rev. 4.5 5.2 4.8 5.5 5.7 6.2 6.6 6.7
Visitor 2.9 3.1 3.0 3.3 3.3 3.6 3.7 3.8
Business/Employee 1.6 2.0 1.8 2.3 2.4 2.7 2.9 2.9
Lewisville
Total Spending ($M) 172 204 191 231 231 235 245 254
Visitor Spending ($M) 153 183 170 206 206 210 217 225
No Transportation ($M) 125 144 140 169 171 176 191 201
Transportation ($M) 28 38 31 37 35 34 26 25
Earnings ($M) 60 68 67 82 82 85 94 101
Total Employment 1,730 1,860 1,830 2,150 2,170 2,240 2,400 2,540
State & Local Tax Rev. ($M) 13.0 15.0 14.5 17.2 17.4 18.0 19.6 20.6
Local Tax Rev. 4.2 4.9 4.7 5.7 5.8 6.1 6.8 7.3
Visitor 3.3 3.9 3.6 4.5 4.6 4.9 5.4 5.8
Business/Employee 0.9 1.0 1.1 1.2 1.2 1.3 1.4 1.5
State Tax Rev. 8.8 10.1 9.8 11.5 11.6 11.9 12.8 13.3
Visitor 8.2 9.4 9.1 10.6 10.7 10.9 11.7 12.3
Business/Employee 0.6 0.7 0.7 0.9 0.9 1.0 1.0 1.0
City and Place Direct Travel Impacts, 2006-2016p
Visitor transportation spending includes motor fuel, auto rental, other ground transportation costs and one-way airfares. Visitor tax
receipts include all direct sales and excise taxes levied on visitor spending. Business/employee tax receipts include local property
taxes, the state franchise tax, and sales tax payments attributable to the travel industry generated income of employees.
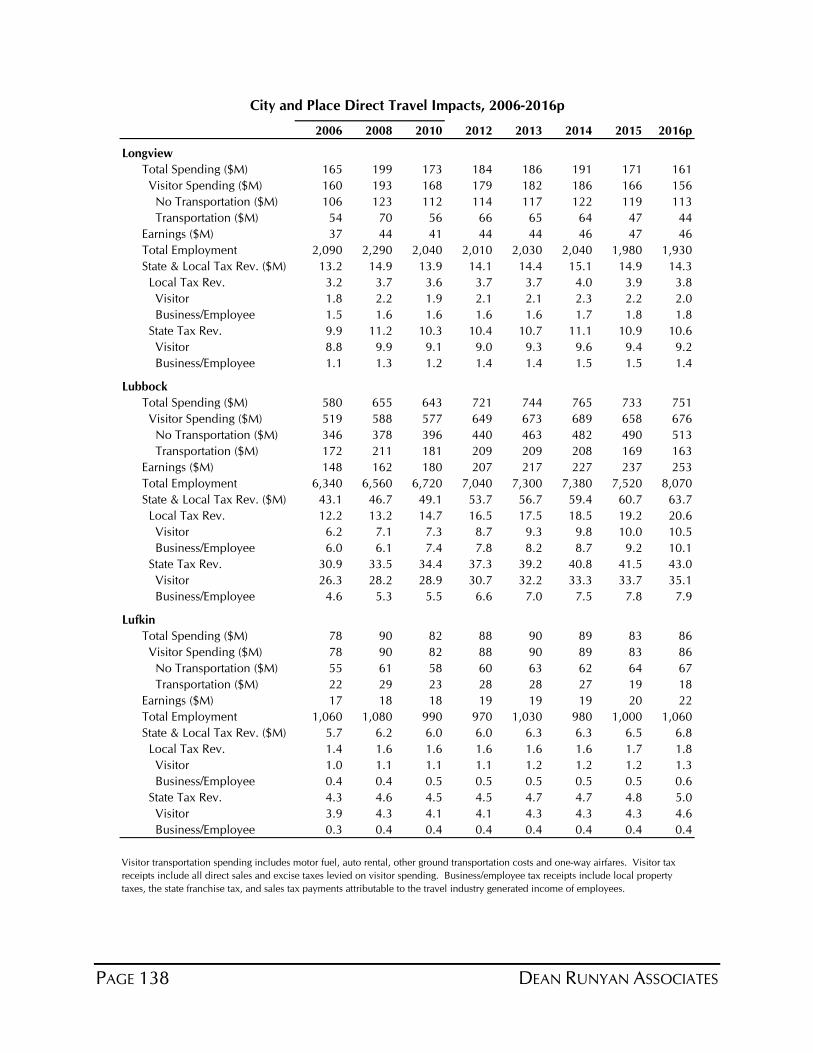
PAGE 138 DEAN RUNYAN ASSOCIATES
2006 2008 2010 2012 2013 2014 2015 2016p
Longview
Total Spending ($M) 165 199 173 184 186 191 171 161
Visitor Spending ($M) 160 193 168 179 182 186 166 156
No Transportation ($M) 106 123 112 114 117 122 119 113
Transportation ($M) 54 70 56 66 65 64 47 44
Earnings ($M) 37 44 41 44 44 46 47 46
Total Employment 2,090 2,290 2,040 2,010 2,030 2,040 1,980 1,930
State & Local Tax Rev. ($M) 13.2 14.9 13.9 14.1 14.4 15.1 14.9 14.3
Local Tax Rev. 3.2 3.7 3.6 3.7 3.7 4.0 3.9 3.8
Visitor 1.8 2.2 1.9 2.1 2.1 2.3 2.2 2.0
Business/Employee 1.5 1.6 1.6 1.6 1.6 1.7 1.8 1.8
State Tax Rev. 9.9 11.2 10.3 10.4 10.7 11.1 10.9 10.6
Visitor 8.8 9.9 9.1 9.0 9.3 9.6 9.4 9.2
Business/Employee 1.1 1.3 1.2 1.4 1.4 1.5 1.5 1.4
Lubbock
Total Spending ($M) 580 655 643 721 744 765 733 751
Visitor Spending ($M) 519 588 577 649 673 689 658 676
No Transportation ($M) 346 378 396 440 463 482 490 513
Transportation ($M) 172 211 181 209 209 208 169 163
Earnings ($M) 148 162 180 207 217 227 237 253
Total Employment 6,340 6,560 6,720 7,040 7,300 7,380 7,520 8,070
State & Local Tax Rev. ($M) 43.1 46.7 49.1 53.7 56.7 59.4 60.7 63.7
Local Tax Rev. 12.2 13.2 14.7 16.5 17.5 18.5 19.2 20.6
Visitor 6.2 7.1 7.3 8.7 9.3 9.8 10.0 10.5
Business/Employee 6.0 6.1 7.4 7.8 8.2 8.7 9.2 10.1
State Tax Rev. 30.9 33.5 34.4 37.3 39.2 40.8 41.5 43.0
Visitor 26.3 28.2 28.9 30.7 32.2 33.3 33.7 35.1
Business/Employee 4.6 5.3 5.5 6.6 7.0 7.5 7.8 7.9
Lufkin
Total Spending ($M) 78 90 82 88 90 89 83 86
Visitor Spending ($M) 78 90 82 88 90 89 83 86
No Transportation ($M) 55 61 58 60 63 62 64 67
Transportation ($M) 22 29 23 28 28 27 19 18
Earnings ($M) 17 18 18 19 19 19 20 22
Total Employment 1,060 1,080 990 970 1,030 980 1,000 1,060
State & Local Tax Rev. ($M) 5.7 6.2 6.0 6.0 6.3 6.3 6.5 6.8
Local Tax Rev. 1.4 1.6 1.6 1.6 1.6 1.6 1.7 1.8
Visitor 1.0 1.1 1.1 1.1 1.2 1.2 1.2 1.3
Business/Employee 0.4 0.4 0.5 0.5 0.5 0.5 0.5 0.6
State Tax Rev. 4.3 4.6 4.5 4.5 4.7 4.7 4.8 5.0
Visitor 3.9 4.3 4.1 4.1 4.3 4.3 4.3 4.6
Business/Employee 0.3 0.4 0.4 0.4 0.4 0.4 0.4 0.4
City and Place Direct Travel Impacts, 2006-2016p
Visitor transportation spending includes motor fuel, auto rental, other ground transportation costs and one-way airfares. Visitor tax
receipts include all direct sales and excise taxes levied on visitor spending. Business/employee tax receipts include local property
taxes, the state franchise tax, and sales tax payments attributable to the travel industry generated income of employees.
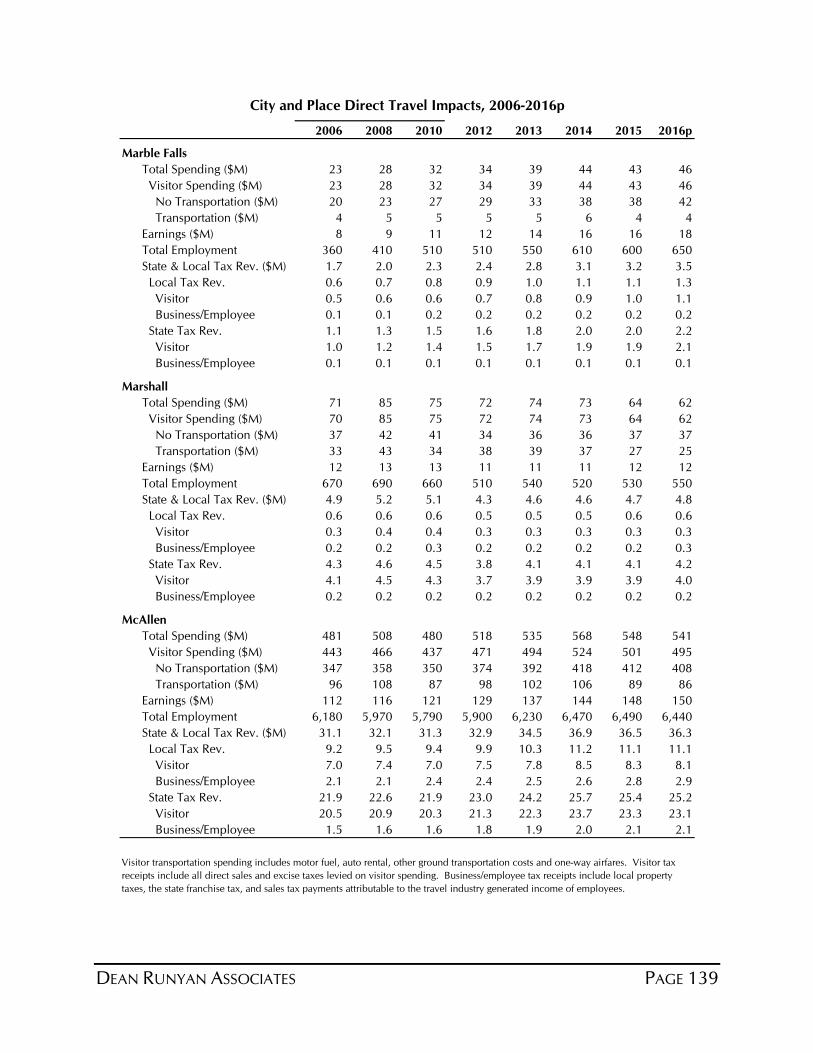
DEAN RUNYAN ASSOCIATES PAGE 139
2006 2008 2010 2012 2013 2014 2015 2016p
Marble Falls
Total Spending ($M) 23 28 32 34 39 44 43 46
Visitor Spending ($M) 23 28 32 34 39 44 43 46
No Transportation ($M) 20 23 27 29 33 38 38 42
Transportation ($M) 4 5 5 5 5 6 4 4
Earnings ($M) 8 9 11 12 14 16 16 18
Total Employment 360 410 510 510 550 610 600 650
State & Local Tax Rev. ($M) 1.7 2.0 2.3 2.4 2.8 3.1 3.2 3.5
Local Tax Rev. 0.6 0.7 0.8 0.9 1.0 1.1 1.1 1.3
Visitor 0.5 0.6 0.6 0.7 0.8 0.9 1.0 1.1
Business/Employee 0.1 0.1 0.2 0.2 0.2 0.2 0.2 0.2
State Tax Rev. 1.1 1.3 1.5 1.6 1.8 2.0 2.0 2.2
Visitor 1.0 1.2 1.4 1.5 1.7 1.9 1.9 2.1
Business/Employee 0.1 0.1 0.1 0.1 0.1 0.1 0.1 0.1
Marshall
Total Spending ($M) 71 85 75 72 74 73 64 62
Visitor Spending ($M) 70 85 75 72 74 73 64 62
No Transportation ($M) 37 42 41 34 36 36 37 37
Transportation ($M) 33 43 34 38 39 37 27 25
Earnings ($M) 12 13 13 11 11 11 12 12
Total Employment 670 690 660 510 540 520 530 550
State & Local Tax Rev. ($M) 4.9 5.2 5.1 4.3 4.6 4.6 4.7 4.8
Local Tax Rev. 0.6 0.6 0.6 0.5 0.5 0.5 0.6 0.6
Visitor 0.3 0.4 0.4 0.3 0.3 0.3 0.3 0.3
Business/Employee 0.2 0.2 0.3 0.2 0.2 0.2 0.2 0.3
State Tax Rev. 4.3 4.6 4.5 3.8 4.1 4.1 4.1 4.2
Visitor 4.1 4.5 4.3 3.7 3.9 3.9 3.9 4.0
Business/Employee 0.2 0.2 0.2 0.2 0.2 0.2 0.2 0.2
McAllen
Total Spending ($M) 481 508 480 518 535 568 548 541
Visitor Spending ($M) 443 466 437 471 494 524 501 495
No Transportation ($M) 347 358 350 374 392 418 412 408
Transportation ($M) 96 108 87 98 102 106 89 86
Earnings ($M) 112 116 121 129 137 144 148 150
Total Employment 6,180 5,970 5,790 5,900 6,230 6,470 6,490 6,440
State & Local Tax Rev. ($M) 31.1 32.1 31.3 32.9 34.5 36.9 36.5 36.3
Local Tax Rev. 9.2 9.5 9.4 9.9 10.3 11.2 11.1 11.1
Visitor 7.0 7.4 7.0 7.5 7.8 8.5 8.3 8.1
Business/Employee 2.1 2.1 2.4 2.4 2.5 2.6 2.8 2.9
State Tax Rev. 21.9 22.6 21.9 23.0 24.2 25.7 25.4 25.2
Visitor 20.5 20.9 20.3 21.3 22.3 23.7 23.3 23.1
Business/Employee 1.5 1.6 1.6 1.8 1.9 2.0 2.1 2.1
City and Place Direct Travel Impacts, 2006-2016p
Visitor transportation spending includes motor fuel, auto rental, other ground transportation costs and one-way airfares. Visitor tax
receipts include all direct sales and excise taxes levied on visitor spending. Business/employee tax receipts include local property
taxes, the state franchise tax, and sales tax payments attributable to the travel industry generated income of employees.
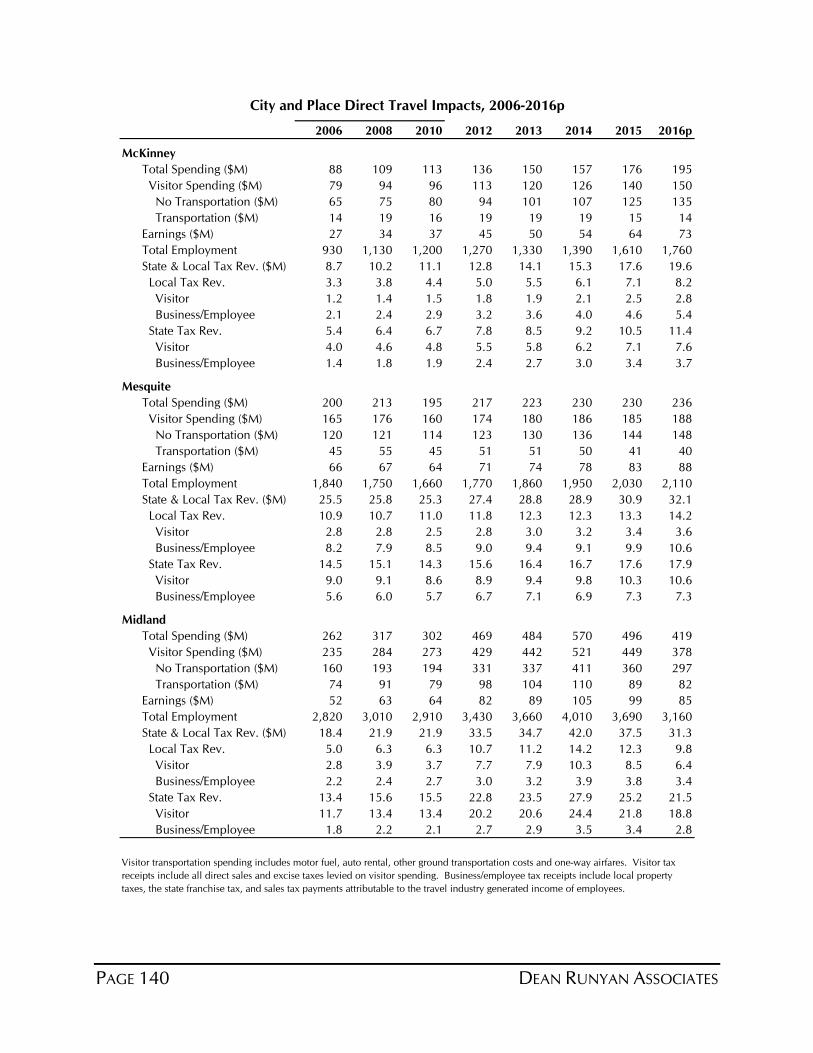
PAGE 140 DEAN RUNYAN ASSOCIATES
2006 2008 2010 2012 2013 2014 2015 2016p
McKinney
Total Spending ($M) 88 109 113 136 150 157 176 195
Visitor Spending ($M) 79 94 96 113 120 126 140 150
No Transportation ($M) 65 75 80 94 101 107 125 135
Transportation ($M) 14 19 16 19 19 19 15 14
Earnings ($M) 27 34 37 45 50 54 64 73
Total Employment 930 1,130 1,200 1,270 1,330 1,390 1,610 1,760
State & Local Tax Rev. ($M) 8.7 10.2 11.1 12.8 14.1 15.3 17.6 19.6
Local Tax Rev. 3.3 3.8 4.4 5.0 5.5 6.1 7.1 8.2
Visitor 1.2 1.4 1.5 1.8 1.9 2.1 2.5 2.8
Business/Employee 2.1 2.4 2.9 3.2 3.6 4.0 4.6 5.4
State Tax Rev. 5.4 6.4 6.7 7.8 8.5 9.2 10.5 11.4
Visitor 4.0 4.6 4.8 5.5 5.8 6.2 7.1 7.6
Business/Employee 1.4 1.8 1.9 2.4 2.7 3.0 3.4 3.7
Mesquite
Total Spending ($M) 200 213 195 217 223 230 230 236
Visitor Spending ($M) 165 176 160 174 180 186 185 188
No Transportation ($M) 120 121 114 123 130 136 144 148
Transportation ($M) 45 55 45 51 51 50 41 40
Earnings ($M) 66 67 64 71 74 78 83 88
Total Employment 1,840 1,750 1,660 1,770 1,860 1,950 2,030 2,110
State & Local Tax Rev. ($M) 25.5 25.8 25.3 27.4 28.8 28.9 30.9 32.1
Local Tax Rev. 10.9 10.7 11.0 11.8 12.3 12.3 13.3 14.2
Visitor 2.8 2.8 2.5 2.8 3.0 3.2 3.4 3.6
Business/Employee 8.2 7.9 8.5 9.0 9.4 9.1 9.9 10.6
State Tax Rev. 14.5 15.1 14.3 15.6 16.4 16.7 17.6 17.9
Visitor 9.0 9.1 8.6 8.9 9.4 9.8 10.3 10.6
Business/Employee 5.6 6.0 5.7 6.7 7.1 6.9 7.3 7.3
Midland
Total Spending ($M) 262 317 302 469 484 570 496 419
Visitor Spending ($M) 235 284 273 429 442 521 449 378
No Transportation ($M) 160 193 194 331 337 411 360 297
Transportation ($M) 74 91 79 98 104 110 89 82
Earnings ($M) 52 63 64 82 89 105 99 85
Total Employment 2,820 3,010 2,910 3,430 3,660 4,010 3,690 3,160
State & Local Tax Rev. ($M) 18.4 21.9 21.9 33.5 34.7 42.0 37.5 31.3
Local Tax Rev. 5.0 6.3 6.3 10.7 11.2 14.2 12.3 9.8
Visitor 2.8 3.9 3.7 7.7 7.9 10.3 8.5 6.4
Business/Employee 2.2 2.4 2.7 3.0 3.2 3.9 3.8 3.4
State Tax Rev. 13.4 15.6 15.5 22.8 23.5 27.9 25.2 21.5
Visitor 11.7 13.4 13.4 20.2 20.6 24.4 21.8 18.8
Business/Employee 1.8 2.2 2.1 2.7 2.9 3.5 3.4 2.8
City and Place Direct Travel Impacts, 2006-2016p
Visitor transportation spending includes motor fuel, auto rental, other ground transportation costs and one-way airfares. Visitor tax
receipts include all direct sales and excise taxes levied on visitor spending. Business/employee tax receipts include local property
taxes, the state franchise tax, and sales tax payments attributable to the travel industry generated income of employees.
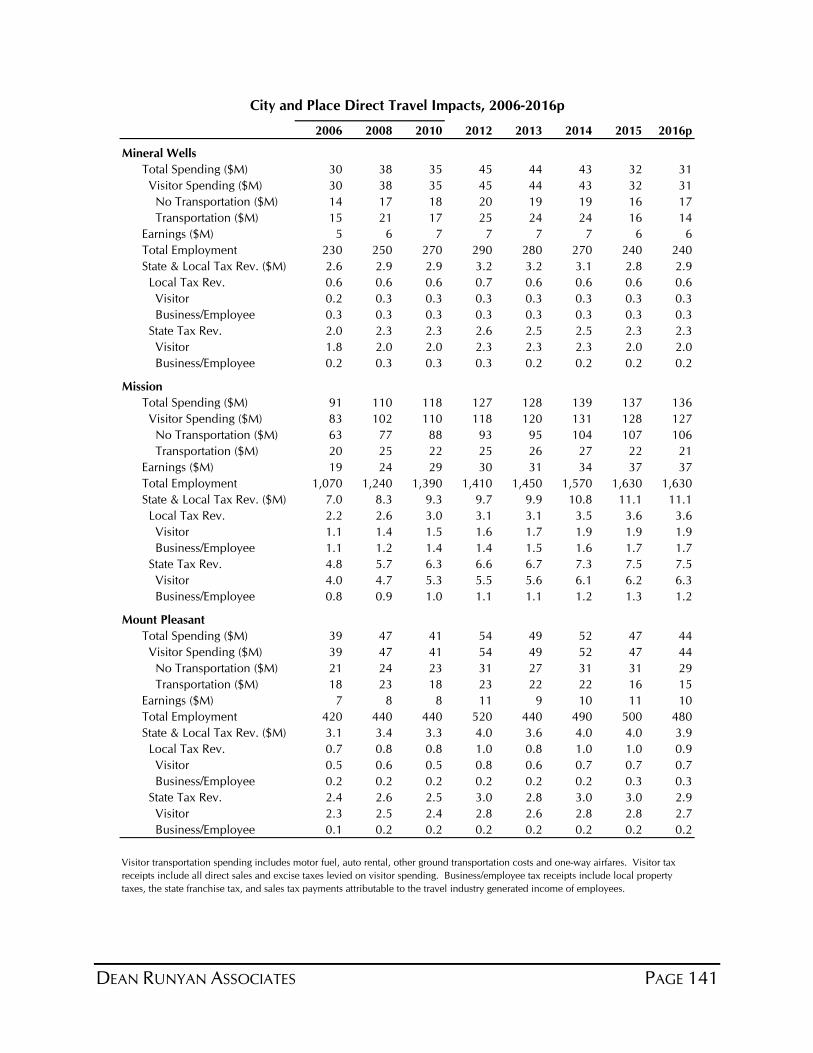
DEAN RUNYAN ASSOCIATES PAGE 141
2006 2008 2010 2012 2013 2014 2015 2016p
Mineral Wells
Total Spending ($M) 30 38 35 45 44 43 32 31
Visitor Spending ($M) 30 38 35 45 44 43 32 31
No Transportation ($M) 14 17 18 20 19 19 16 17
Transportation ($M) 15 21 17 25 24 24 16 14
Earnings ($M) 5 6 7 7 7 7 6 6
Total Employment 230 250 270 290 280 270 240 240
State & Local Tax Rev. ($M) 2.6 2.9 2.9 3.2 3.2 3.1 2.8 2.9
Local Tax Rev. 0.6 0.6 0.6 0.7 0.6 0.6 0.6 0.6
Visitor 0.2 0.3 0.3 0.3 0.3 0.3 0.3 0.3
Business/Employee 0.3 0.3 0.3 0.3 0.3 0.3 0.3 0.3
State Tax Rev. 2.0 2.3 2.3 2.6 2.5 2.5 2.3 2.3
Visitor 1.8 2.0 2.0 2.3 2.3 2.3 2.0 2.0
Business/Employee 0.2 0.3 0.3 0.3 0.2 0.2 0.2 0.2
Mission
Total Spending ($M) 91 110 118 127 128 139 137 136
Visitor Spending ($M) 83 102 110 118 120 131 128 127
No Transportation ($M) 63 77 88 93 95 104 107 106
Transportation ($M) 20 25 22 25 26 27 22 21
Earnings ($M) 19 24 29 30 31 34 37 37
Total Employment 1,070 1,240 1,390 1,410 1,450 1,570 1,630 1,630
State & Local Tax Rev. ($M) 7.0 8.3 9.3 9.7 9.9 10.8 11.1 11.1
Local Tax Rev. 2.2 2.6 3.0 3.1 3.1 3.5 3.6 3.6
Visitor 1.1 1.4 1.5 1.6 1.7 1.9 1.9 1.9
Business/Employee 1.1 1.2 1.4 1.4 1.5 1.6 1.7 1.7
State Tax Rev. 4.8 5.7 6.3 6.6 6.7 7.3 7.5 7.5
Visitor 4.0 4.7 5.3 5.5 5.6 6.1 6.2 6.3
Business/Employee 0.8 0.9 1.0 1.1 1.1 1.2 1.3 1.2
Mount Pleasant
Total Spending ($M) 39 47 41 54 49 52 47 44
Visitor Spending ($M) 39 47 41 54 49 52 47 44
No Transportation ($M) 21 24 23 31 27 31 31 29
Transportation ($M) 18 23 18 23 22 22 16 15
Earnings ($M) 7 8 8 11 9 10 11 10
Total Employment 420 440 440 520 440 490 500 480
State & Local Tax Rev. ($M) 3.1 3.4 3.3 4.0 3.6 4.0 4.0 3.9
Local Tax Rev. 0.7 0.8 0.8 1.0 0.8 1.0 1.0 0.9
Visitor 0.5 0.6 0.5 0.8 0.6 0.7 0.7 0.7
Business/Employee 0.2 0.2 0.2 0.2 0.2 0.2 0.3 0.3
State Tax Rev. 2.4 2.6 2.5 3.0 2.8 3.0 3.0 2.9
Visitor 2.3 2.5 2.4 2.8 2.6 2.8 2.8 2.7
Business/Employee 0.1 0.2 0.2 0.2 0.2 0.2 0.2 0.2
City and Place Direct Travel Impacts, 2006-2016p
Visitor transportation spending includes motor fuel, auto rental, other ground transportation costs and one-way airfares. Visitor tax
receipts include all direct sales and excise taxes levied on visitor spending. Business/employee tax receipts include local property
taxes, the state franchise tax, and sales tax payments attributable to the travel industry generated income of employees.
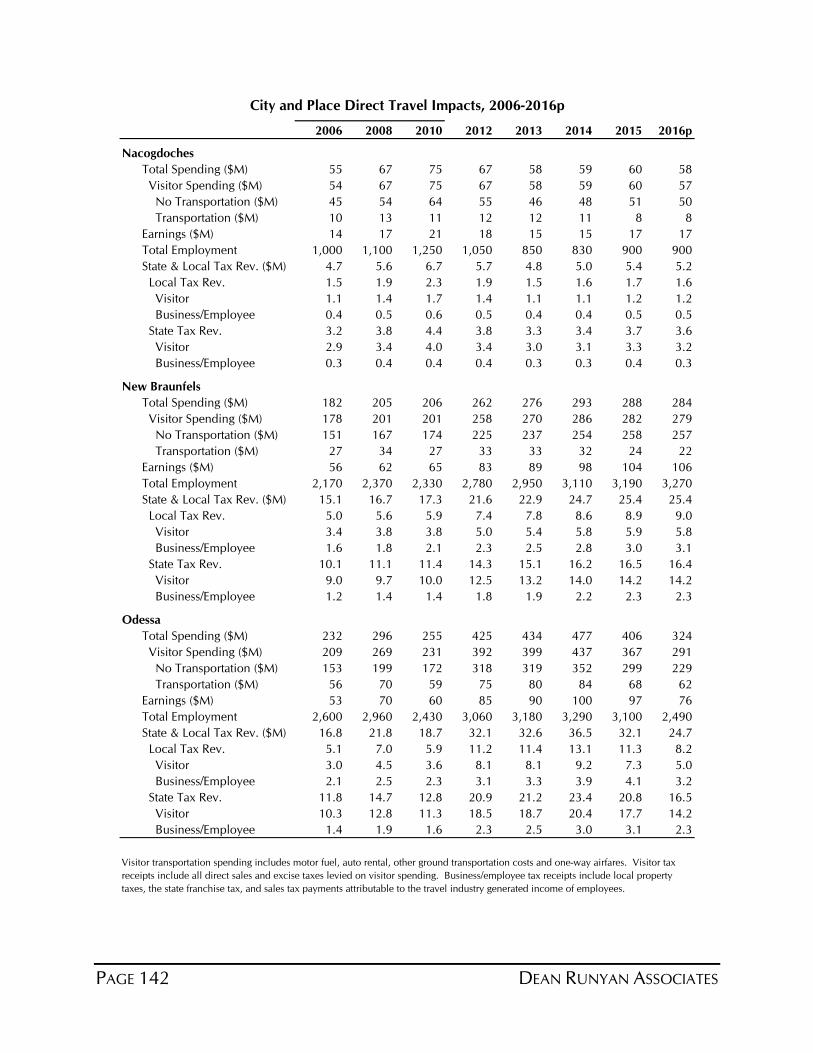
PAGE 142 DEAN RUNYAN ASSOCIATES
2006 2008 2010 2012 2013 2014 2015 2016p
Nacogdoches
Total Spending ($M) 55 67 75 67 58 59 60 58
Visitor Spending ($M) 54 67 75 67 58 59 60 57
No Transportation ($M) 45 54 64 55 46 48 51 50
Transportation ($M) 10 13 11 12 12 11 8 8
Earnings ($M) 14 17 21 18 15 15 17 17
Total Employment 1,000 1,100 1,250 1,050 850 830 900 900
State & Local Tax Rev. ($M) 4.7 5.6 6.7 5.7 4.8 5.0 5.4 5.2
Local Tax Rev. 1.5 1.9 2.3 1.9 1.5 1.6 1.7 1.6
Visitor 1.1 1.4 1.7 1.4 1.1 1.1 1.2 1.2
Business/Employee 0.4 0.5 0.6 0.5 0.4 0.4 0.5 0.5
State Tax Rev. 3.2 3.8 4.4 3.8 3.3 3.4 3.7 3.6
Visitor 2.9 3.4 4.0 3.4 3.0 3.1 3.3 3.2
Business/Employee 0.3 0.4 0.4 0.4 0.3 0.3 0.4 0.3
New Braunfels
Total Spending ($M) 182 205 206 262 276 293 288 284
Visitor Spending ($M) 178 201 201 258 270 286 282 279
No Transportation ($M) 151 167 174 225 237 254 258 257
Transportation ($M) 27 34 27 33 33 32 24 22
Earnings ($M) 56 62 65 83 89 98 104 106
Total Employment 2,170 2,370 2,330 2,780 2,950 3,110 3,190 3,270
State & Local Tax Rev. ($M) 15.1 16.7 17.3 21.6 22.9 24.7 25.4 25.4
Local Tax Rev. 5.0 5.6 5.9 7.4 7.8 8.6 8.9 9.0
Visitor 3.4 3.8 3.8 5.0 5.4 5.8 5.9 5.8
Business/Employee 1.6 1.8 2.1 2.3 2.5 2.8 3.0 3.1
State Tax Rev. 10.1 11.1 11.4 14.3 15.1 16.2 16.5 16.4
Visitor 9.0 9.7 10.0 12.5 13.2 14.0 14.2 14.2
Business/Employee 1.2 1.4 1.4 1.8 1.9 2.2 2.3 2.3
Odessa
Total Spending ($M) 232 296 255 425 434 477 406 324
Visitor Spending ($M) 209 269 231 392 399 437 367 291
No Transportation ($M) 153 199 172 318 319 352 299 229
Transportation ($M) 56 70 59 75 80 84 68 62
Earnings ($M) 53 70 60 85 90 100 97 76
Total Employment 2,600 2,960 2,430 3,060 3,180 3,290 3,100 2,490
State & Local Tax Rev. ($M) 16.8 21.8 18.7 32.1 32.6 36.5 32.1 24.7
Local Tax Rev. 5.1 7.0 5.9 11.2 11.4 13.1 11.3 8.2
Visitor 3.0 4.5 3.6 8.1 8.1 9.2 7.3 5.0
Business/Employee 2.1 2.5 2.3 3.1 3.3 3.9 4.1 3.2
State Tax Rev. 11.8 14.7 12.8 20.9 21.2 23.4 20.8 16.5
Visitor 10.3 12.8 11.3 18.5 18.7 20.4 17.7 14.2
Business/Employee 1.4 1.9 1.6 2.3 2.5 3.0 3.1 2.3
Visitor transportation spending includes motor fuel, auto rental, other ground transportation costs and one-way airfares. Visitor tax
receipts include all direct sales and excise taxes levied on visitor spending. Business/employee tax receipts include local property
taxes, the state franchise tax, and sales tax payments attributable to the travel industry generated income of employees.
City and Place Direct Travel Impacts, 2006-2016p
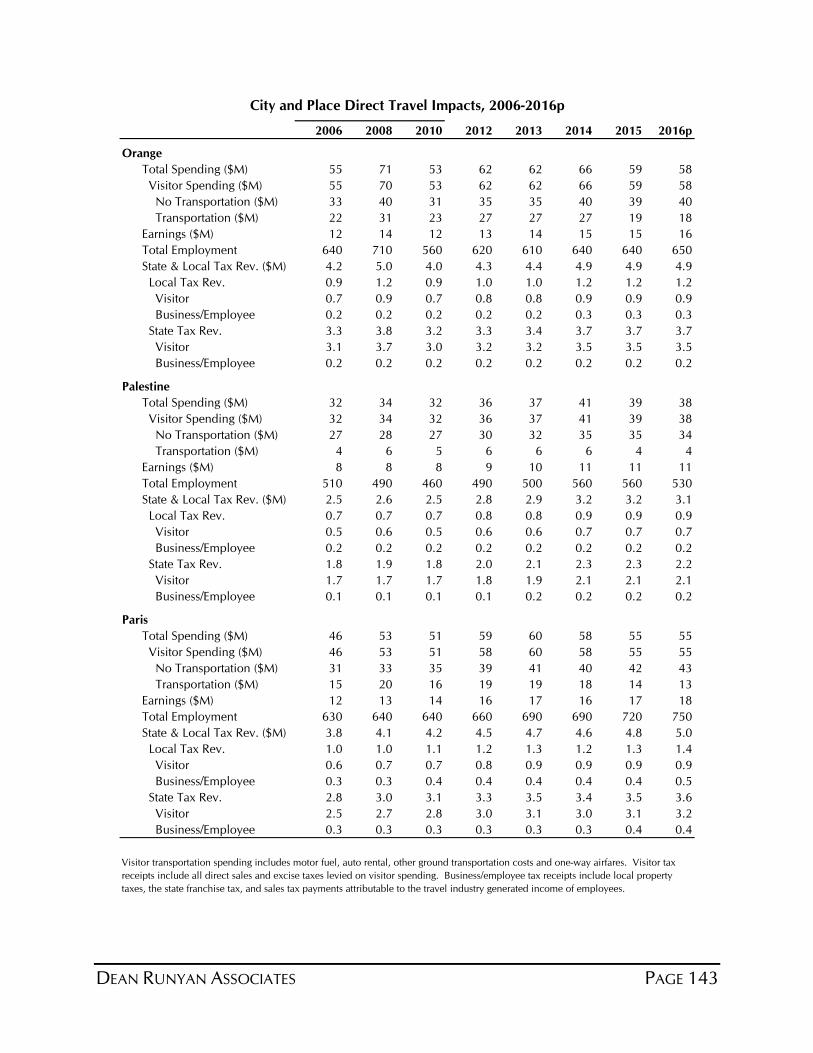
DEAN RUNYAN ASSOCIATES PAGE 143
2006 2008 2010 2012 2013 2014 2015 2016p
Orange
Total Spending ($M) 55 71 53 62 62 66 59 58
Visitor Spending ($M) 55 70 53 62 62 66 59 58
No Transportation ($M) 33 40 31 35 35 40 39 40
Transportation ($M) 22 31 23 27 27 27 19 18
Earnings ($M) 12 14 12 13 14 15 15 16
Total Employment 640 710 560 620 610 640 640 650
State & Local Tax Rev. ($M) 4.2 5.0 4.0 4.3 4.4 4.9 4.9 4.9
Local Tax Rev. 0.9 1.2 0.9 1.0 1.0 1.2 1.2 1.2
Visitor 0.7 0.9 0.7 0.8 0.8 0.9 0.9 0.9
Business/Employee 0.2 0.2 0.2 0.2 0.2 0.3 0.3 0.3
State Tax Rev. 3.3 3.8 3.2 3.3 3.4 3.7 3.7 3.7
Visitor 3.1 3.7 3.0 3.2 3.2 3.5 3.5 3.5
Business/Employee 0.2 0.2 0.2 0.2 0.2 0.2 0.2 0.2
Palestine
Total Spending ($M) 32 34 32 36 37 41 39 38
Visitor Spending ($M) 32 34 32 36 37 41 39 38
No Transportation ($M) 27 28 27 30 32 35 35 34
Transportation ($M) 4 6 5 6 6 6 4 4
Earnings ($M) 8 8 8 9 10 11 11 11
Total Employment 510 490 460 490 500 560 560 530
State & Local Tax Rev. ($M) 2.5 2.6 2.5 2.8 2.9 3.2 3.2 3.1
Local Tax Rev. 0.7 0.7 0.7 0.8 0.8 0.9 0.9 0.9
Visitor 0.5 0.6 0.5 0.6 0.6 0.7 0.7 0.7
Business/Employee 0.2 0.2 0.2 0.2 0.2 0.2 0.2 0.2
State Tax Rev. 1.8 1.9 1.8 2.0 2.1 2.3 2.3 2.2
Visitor 1.7 1.7 1.7 1.8 1.9 2.1 2.1 2.1
Business/Employee 0.1 0.1 0.1 0.1 0.2 0.2 0.2 0.2
Paris
Total Spending ($M) 46 53 51 59 60 58 55 55
Visitor Spending ($M) 46 53 51 58 60 58 55 55
No Transportation ($M) 31 33 35 39 41 40 42 43
Transportation ($M) 15 20 16 19 19 18 14 13
Earnings ($M) 12 13 14 16 17 16 17 18
Total Employment 630 640 640 660 690 690 720 750
State & Local Tax Rev. ($M) 3.8 4.1 4.2 4.5 4.7 4.6 4.8 5.0
Local Tax Rev. 1.0 1.0 1.1 1.2 1.3 1.2 1.3 1.4
Visitor 0.6 0.7 0.7 0.8 0.9 0.9 0.9 0.9
Business/Employee 0.3 0.3 0.4 0.4 0.4 0.4 0.4 0.5
State Tax Rev. 2.8 3.0 3.1 3.3 3.5 3.4 3.5 3.6
Visitor 2.5 2.7 2.8 3.0 3.1 3.0 3.1 3.2
Business/Employee 0.3 0.3 0.3 0.3 0.3 0.3 0.4 0.4
City and Place Direct Travel Impacts, 2006-2016p
Visitor transportation spending includes motor fuel, auto rental, other ground transportation costs and one-way airfares. Visitor tax
receipts include all direct sales and excise taxes levied on visitor spending. Business/employee tax receipts include local property
taxes, the state franchise tax, and sales tax payments attributable to the travel industry generated income of employees.
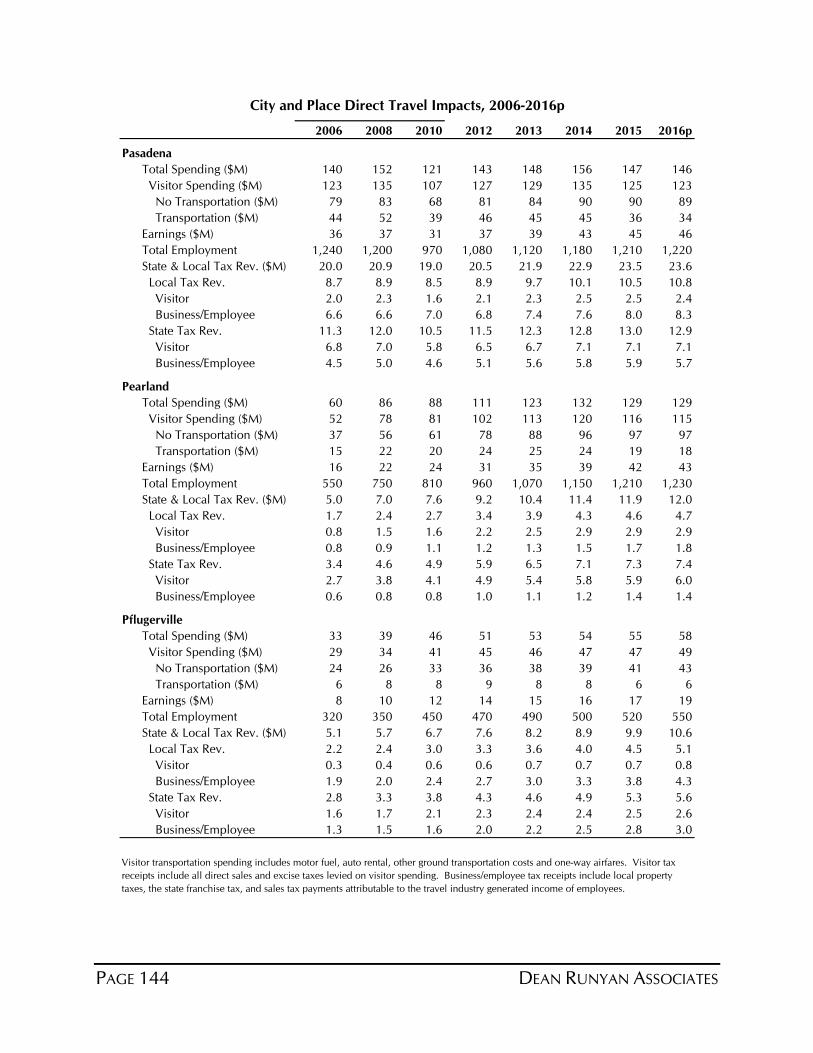
PAGE 144 DEAN RUNYAN ASSOCIATES
2006 2008 2010 2012 2013 2014 2015 2016p
Pasadena
Total Spending ($M) 140 152 121 143 148 156 147 146
Visitor Spending ($M) 123 135 107 127 129 135 125 123
No Transportation ($M) 79 83 68 81 84 90 90 89
Transportation ($M) 44 52 39 46 45 45 36 34
Earnings ($M) 36 37 31 37 39 43 45 46
Total Employment 1,240 1,200 970 1,080 1,120 1,180 1,210 1,220
State & Local Tax Rev. ($M) 20.0 20.9 19.0 20.5 21.9 22.9 23.5 23.6
Local Tax Rev. 8.7 8.9 8.5 8.9 9.7 10.1 10.5 10.8
Visitor 2.0 2.3 1.6 2.1 2.3 2.5 2.5 2.4
Business/Employee 6.6 6.6 7.0 6.8 7.4 7.6 8.0 8.3
State Tax Rev. 11.3 12.0 10.5 11.5 12.3 12.8 13.0 12.9
Visitor 6.8 7.0 5.8 6.5 6.7 7.1 7.1 7.1
Business/Employee 4.5 5.0 4.6 5.1 5.6 5.8 5.9 5.7
Pearland
Total Spending ($M) 60 86 88 111 123 132 129 129
Visitor Spending ($M) 52 78 81 102 113 120 116 115
No Transportation ($M) 37 56 61 78 88 96 97 97
Transportation ($M) 15 22 20 24 25 24 19 18
Earnings ($M) 16 22 24 31 35 39 42 43
Total Employment 550 750 810 960 1,070 1,150 1,210 1,230
State & Local Tax Rev. ($M) 5.0 7.0 7.6 9.2 10.4 11.4 11.9 12.0
Local Tax Rev. 1.7 2.4 2.7 3.4 3.9 4.3 4.6 4.7
Visitor 0.8 1.5 1.6 2.2 2.5 2.9 2.9 2.9
Business/Employee 0.8 0.9 1.1 1.2 1.3 1.5 1.7 1.8
State Tax Rev. 3.4 4.6 4.9 5.9 6.5 7.1 7.3 7.4
Visitor 2.7 3.8 4.1 4.9 5.4 5.8 5.9 6.0
Business/Employee 0.6 0.8 0.8 1.0 1.1 1.2 1.4 1.4
Pflugerville
Total Spending ($M) 33 39 46 51 53 54 55 58
Visitor Spending ($M) 29 34 41 45 46 47 47 49
No Transportation ($M) 24 26 33 36 38 39 41 43
Transportation ($M) 6 8 8 9 8 8 6 6
Earnings ($M) 8 10 12 14 15 16 17 19
Total Employment 320 350 450 470 490 500 520 550
State & Local Tax Rev. ($M) 5.1 5.7 6.7 7.6 8.2 8.9 9.9 10.6
Local Tax Rev. 2.2 2.4 3.0 3.3 3.6 4.0 4.5 5.1
Visitor 0.3 0.4 0.6 0.6 0.7 0.7 0.7 0.8
Business/Employee 1.9 2.0 2.4 2.7 3.0 3.3 3.8 4.3
State Tax Rev. 2.8 3.3 3.8 4.3 4.6 4.9 5.3 5.6
Visitor 1.6 1.7 2.1 2.3 2.4 2.4 2.5 2.6
Business/Employee 1.3 1.5 1.6 2.0 2.2 2.5 2.8 3.0
City and Place Direct Travel Impacts, 2006-2016p
Visitor transportation spending includes motor fuel, auto rental, other ground transportation costs and one-way airfares. Visitor tax
receipts include all direct sales and excise taxes levied on visitor spending. Business/employee tax receipts include local property
taxes, the state franchise tax, and sales tax payments attributable to the travel industry generated income of employees.
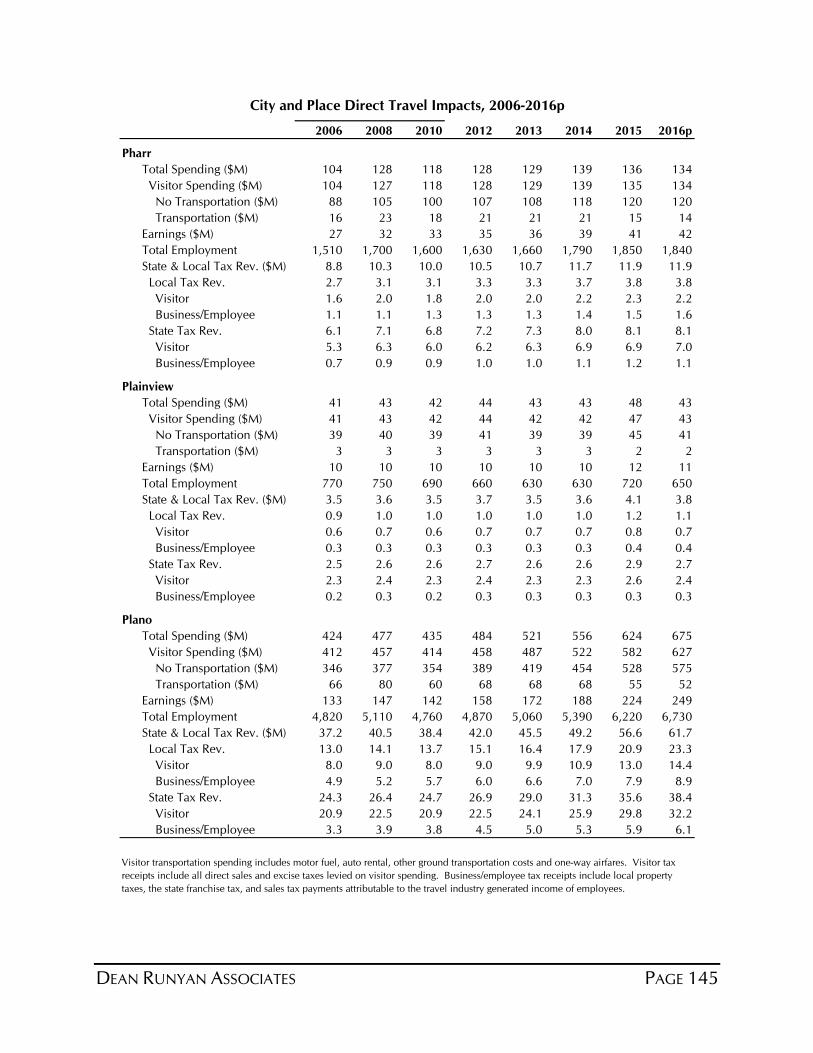
DEAN RUNYAN ASSOCIATES PAGE 145
2006 2008 2010 2012 2013 2014 2015 2016p
Pharr
Total Spending ($M) 104 128 118 128 129 139 136 134
Visitor Spending ($M) 104 127 118 128 129 139 135 134
No Transportation ($M) 88 105 100 107 108 118 120 120
Transportation ($M) 16 23 18 21 21 21 15 14
Earnings ($M) 27 32 33 35 36 39 41 42
Total Employment 1,510 1,700 1,600 1,630 1,660 1,790 1,850 1,840
State & Local Tax Rev. ($M) 8.8 10.3 10.0 10.5 10.7 11.7 11.9 11.9
Local Tax Rev. 2.7 3.1 3.1 3.3 3.3 3.7 3.8 3.8
Visitor 1.6 2.0 1.8 2.0 2.0 2.2 2.3 2.2
Business/Employee 1.1 1.1 1.3 1.3 1.3 1.4 1.5 1.6
State Tax Rev. 6.1 7.1 6.8 7.2 7.3 8.0 8.1 8.1
Visitor 5.3 6.3 6.0 6.2 6.3 6.9 6.9 7.0
Business/Employee 0.7 0.9 0.9 1.0 1.0 1.1 1.2 1.1
Plainview
Total Spending ($M) 41 43 42 44 43 43 48 43
Visitor Spending ($M) 41 43 42 44 42 42 47 43
No Transportation ($M) 39 40 39 41 39 39 45 41
Transportation ($M) 3 3 3 3 3 3 2 2
Earnings ($M) 10 10 10 10 10 10 12 11
Total Employment 770 750 690 660 630 630 720 650
State & Local Tax Rev. ($M) 3.5 3.6 3.5 3.7 3.5 3.6 4.1 3.8
Local Tax Rev. 0.9 1.0 1.0 1.0 1.0 1.0 1.2 1.1
Visitor 0.6 0.7 0.6 0.7 0.7 0.7 0.8 0.7
Business/Employee 0.3 0.3 0.3 0.3 0.3 0.3 0.4 0.4
State Tax Rev. 2.5 2.6 2.6 2.7 2.6 2.6 2.9 2.7
Visitor 2.3 2.4 2.3 2.4 2.3 2.3 2.6 2.4
Business/Employee 0.2 0.3 0.2 0.3 0.3 0.3 0.3 0.3
Plano
Total Spending ($M) 424 477 435 484 521 556 624 675
Visitor Spending ($M) 412 457 414 458 487 522 582 627
No Transportation ($M) 346 377 354 389 419 454 528 575
Transportation ($M) 66 80 60 68 68 68 55 52
Earnings ($M) 133 147 142 158 172 188 224 249
Total Employment 4,820 5,110 4,760 4,870 5,060 5,390 6,220 6,730
State & Local Tax Rev. ($M) 37.2 40.5 38.4 42.0 45.5 49.2 56.6 61.7
Local Tax Rev. 13.0 14.1 13.7 15.1 16.4 17.9 20.9 23.3
Visitor 8.0 9.0 8.0 9.0 9.9 10.9 13.0 14.4
Business/Employee 4.9 5.2 5.7 6.0 6.6 7.0 7.9 8.9
State Tax Rev. 24.3 26.4 24.7 26.9 29.0 31.3 35.6 38.4
Visitor 20.9 22.5 20.9 22.5 24.1 25.9 29.8 32.2
Business/Employee 3.3 3.9 3.8 4.5 5.0 5.3 5.9 6.1
City and Place Direct Travel Impacts, 2006-2016p
Visitor transportation spending includes motor fuel, auto rental, other ground transportation costs and one-way airfares. Visitor tax
receipts include all direct sales and excise taxes levied on visitor spending. Business/employee tax receipts include local property
taxes, the state franchise tax, and sales tax payments attributable to the travel industry generated income of employees.
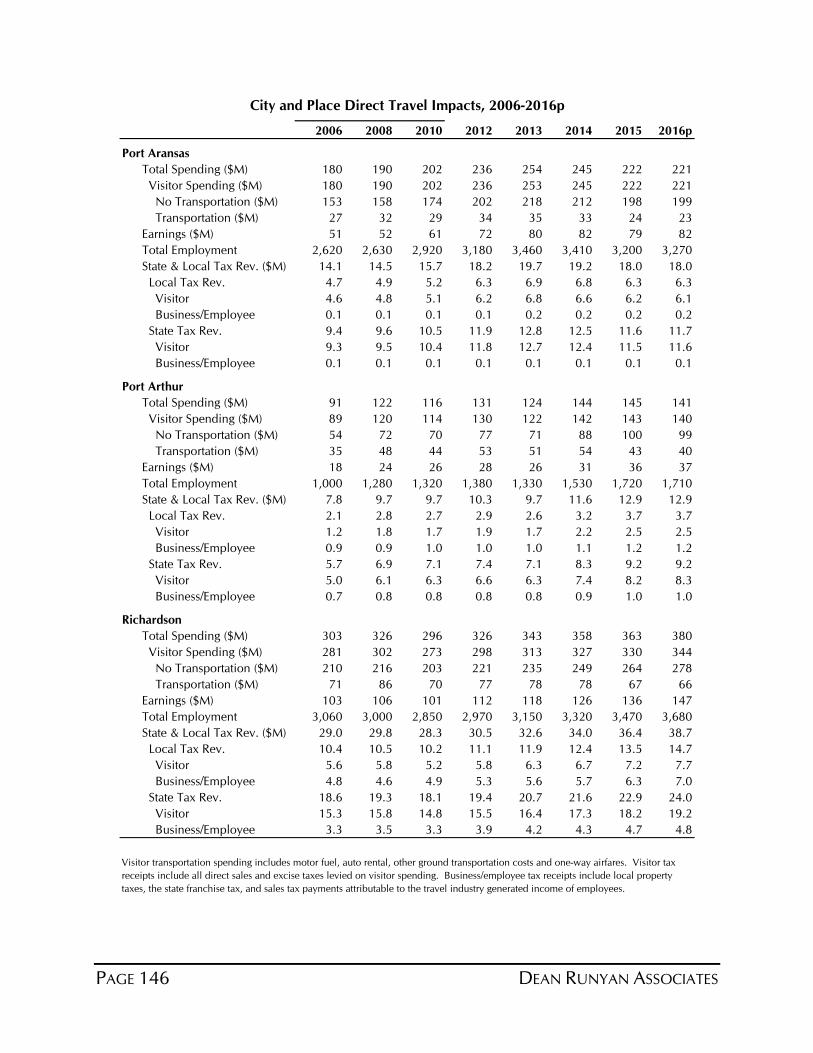
PAGE 146 DEAN RUNYAN ASSOCIATES
2006 2008 2010 2012 2013 2014 2015 2016p
Port Aransas
Total Spending ($M) 180 190 202 236 254 245 222 221
Visitor Spending ($M) 180 190 202 236 253 245 222 221
No Transportation ($M) 153 158 174 202 218 212 198 199
Transportation ($M) 27 32 29 34 35 33 24 23
Earnings ($M) 51 52 61 72 80 82 79 82
Total Employment 2,620 2,630 2,920 3,180 3,460 3,410 3,200 3,270
State & Local Tax Rev. ($M) 14.1 14.5 15.7 18.2 19.7 19.2 18.0 18.0
Local Tax Rev. 4.7 4.9 5.2 6.3 6.9 6.8 6.3 6.3
Visitor 4.6 4.8 5.1 6.2 6.8 6.6 6.2 6.1
Business/Employee 0.1 0.1 0.1 0.1 0.2 0.2 0.2 0.2
State Tax Rev. 9.4 9.6 10.5 11.9 12.8 12.5 11.6 11.7
Visitor 9.3 9.5 10.4 11.8 12.7 12.4 11.5 11.6
Business/Employee 0.1 0.1 0.1 0.1 0.1 0.1 0.1 0.1
Port Arthur
Total Spending ($M) 91 122 116 131 124 144 145 141
Visitor Spending ($M) 89 120 114 130 122 142 143 140
No Transportation ($M) 54 72 70 77 71 88 100 99
Transportation ($M) 35 48 44 53 51 54 43 40
Earnings ($M) 18 24 26 28 26 31 36 37
Total Employment 1,000 1,280 1,320 1,380 1,330 1,530 1,720 1,710
State & Local Tax Rev. ($M) 7.8 9.7 9.7 10.3 9.7 11.6 12.9 12.9
Local Tax Rev. 2.1 2.8 2.7 2.9 2.6 3.2 3.7 3.7
Visitor 1.2 1.8 1.7 1.9 1.7 2.2 2.5 2.5
Business/Employee 0.9 0.9 1.0 1.0 1.0 1.1 1.2 1.2
State Tax Rev. 5.7 6.9 7.1 7.4 7.1 8.3 9.2 9.2
Visitor 5.0 6.1 6.3 6.6 6.3 7.4 8.2 8.3
Business/Employee 0.7 0.8 0.8 0.8 0.8 0.9 1.0 1.0
Richardson
Total Spending ($M) 303 326 296 326 343 358 363 380
Visitor Spending ($M) 281 302 273 298 313 327 330 344
No Transportation ($M) 210 216 203 221 235 249 264 278
Transportation ($M) 71 86 70 77 78 78 67 66
Earnings ($M) 103 106 101 112 118 126 136 147
Total Employment 3,060 3,000 2,850 2,970 3,150 3,320 3,470 3,680
State & Local Tax Rev. ($M) 29.0 29.8 28.3 30.5 32.6 34.0 36.4 38.7
Local Tax Rev. 10.4 10.5 10.2 11.1 11.9 12.4 13.5 14.7
Visitor 5.6 5.8 5.2 5.8 6.3 6.7 7.2 7.7
Business/Employee 4.8 4.6 4.9 5.3 5.6 5.7 6.3 7.0
State Tax Rev. 18.6 19.3 18.1 19.4 20.7 21.6 22.9 24.0
Visitor 15.3 15.8 14.8 15.5 16.4 17.3 18.2 19.2
Business/Employee 3.3 3.5 3.3 3.9 4.2 4.3 4.7 4.8
City and Place Direct Travel Impacts, 2006-2016p
Visitor transportation spending includes motor fuel, auto rental, other ground transportation costs and one-way airfares. Visitor tax
receipts include all direct sales and excise taxes levied on visitor spending. Business/employee tax receipts include local property
taxes, the state franchise tax, and sales tax payments attributable to the travel industry generated income of employees.
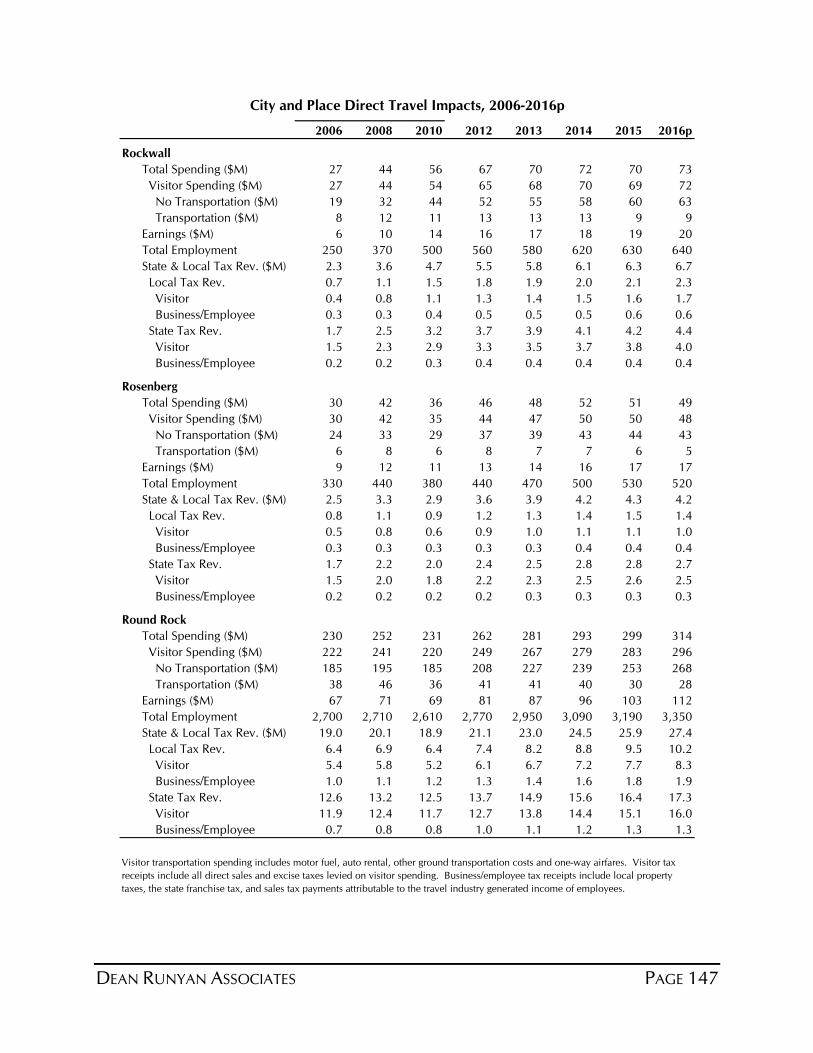
DEAN RUNYAN ASSOCIATES PAGE 147
2006 2008 2010 2012 2013 2014 2015 2016p
Rockwall
Total Spending ($M) 27 44 56 67 70 72 70 73
Visitor Spending ($M) 27 44 54 65 68 70 69 72
No Transportation ($M) 19 32 44 52 55 58 60 63
Transportation ($M) 8 12 11 13 13 13 9 9
Earnings ($M) 6 10 14 16 17 18 19 20
Total Employment 250 370 500 560 580 620 630 640
State & Local Tax Rev. ($M) 2.3 3.6 4.7 5.5 5.8 6.1 6.3 6.7
Local Tax Rev. 0.7 1.1 1.5 1.8 1.9 2.0 2.1 2.3
Visitor 0.4 0.8 1.1 1.3 1.4 1.5 1.6 1.7
Business/Employee 0.3 0.3 0.4 0.5 0.5 0.5 0.6 0.6
State Tax Rev. 1.7 2.5 3.2 3.7 3.9 4.1 4.2 4.4
Visitor 1.5 2.3 2.9 3.3 3.5 3.7 3.8 4.0
Business/Employee 0.2 0.2 0.3 0.4 0.4 0.4 0.4 0.4
Rosenberg
Total Spending ($M) 30 42 36 46 48 52 51 49
Visitor Spending ($M) 30 42 35 44 47 50 50 48
No Transportation ($M) 24 33 29 37 39 43 44 43
Transportation ($M) 6 8 6 8 7 7 6 5
Earnings ($M) 9 12 11 13 14 16 17 17
Total Employment 330 440 380 440 470 500 530 520
State & Local Tax Rev. ($M) 2.5 3.3 2.9 3.6 3.9 4.2 4.3 4.2
Local Tax Rev. 0.8 1.1 0.9 1.2 1.3 1.4 1.5 1.4
Visitor 0.5 0.8 0.6 0.9 1.0 1.1 1.1 1.0
Business/Employee 0.3 0.3 0.3 0.3 0.3 0.4 0.4 0.4
State Tax Rev. 1.7 2.2 2.0 2.4 2.5 2.8 2.8 2.7
Visitor 1.5 2.0 1.8 2.2 2.3 2.5 2.6 2.5
Business/Employee 0.2 0.2 0.2 0.2 0.3 0.3 0.3 0.3
Round Rock
Total Spending ($M) 230 252 231 262 281 293 299 314
Visitor Spending ($M) 222 241 220 249 267 279 283 296
No Transportation ($M) 185 195 185 208 227 239 253 268
Transportation ($M) 38 46 36 41 41 40 30 28
Earnings ($M) 67 71 69 81 87 96 103 112
Total Employment 2,700 2,710 2,610 2,770 2,950 3,090 3,190 3,350
State & Local Tax Rev. ($M) 19.0 20.1 18.9 21.1 23.0 24.5 25.9 27.4
Local Tax Rev. 6.4 6.9 6.4 7.4 8.2 8.8 9.5 10.2
Visitor 5.4 5.8 5.2 6.1 6.7 7.2 7.7 8.3
Business/Employee 1.0 1.1 1.2 1.3 1.4 1.6 1.8 1.9
State Tax Rev. 12.6 13.2 12.5 13.7 14.9 15.6 16.4 17.3
Visitor 11.9 12.4 11.7 12.7 13.8 14.4 15.1 16.0
Business/Employee 0.7 0.8 0.8 1.0 1.1 1.2 1.3 1.3
City and Place Direct Travel Impacts, 2006-2016p
Visitor transportation spending includes motor fuel, auto rental, other ground transportation costs and one-way airfares. Visitor tax
receipts include all direct sales and excise taxes levied on visitor spending. Business/employee tax receipts include local property
taxes, the state franchise tax, and sales tax payments attributable to the travel industry generated income of employees.

PAGE 148 DEAN RUNYAN ASSOCIATES
2006 2008 2010 2012 2013 2014 2015 2016p
San Angelo
Total Spending ($M) 148 173 160 215 247 248 190 178
Visitor Spending ($M) 148 173 160 214 247 248 190 178
No Transportation ($M) 113 128 123 171 204 206 159 149
Transportation ($M) 35 45 37 43 43 42 31 29
Earnings ($M) 41 47 51 64 72 76 72 67
Total Employment 2,660 2,810 2,870 3,290 3,550 3,570 3,350 3,120
State & Local Tax Rev. ($M) 12.9 14.6 14.5 18.7 22.1 22.6 18.6 17.6
Local Tax Rev. 3.4 3.9 4.1 5.6 6.9 7.1 5.6 5.2
Visitor 1.7 2.2 2.0 3.3 4.3 4.3 2.9 2.6
Business/Employee 1.7 1.7 2.0 2.3 2.6 2.8 2.7 2.6
State Tax Rev. 9.5 10.6 10.4 13.2 15.2 15.6 13.0 12.4
Visitor 8.1 9.0 8.7 11.0 12.7 12.9 10.5 10.1
Business/Employee 1.4 1.7 1.7 2.2 2.4 2.7 2.5 2.3
San Antonio
Total Spending ($M) 5,632 6,408 6,035 6,919 7,055 7,375 7,044 7,198
Visitor Spending ($M) 5,135 5,841 5,489 6,324 6,457 6,624 6,249 6,336
No Transportation ($M) 2,955 3,230 3,231 3,731 3,852 4,019 4,060 4,196
Transportation ($M) 2,180 2,612 2,258 2,593 2,604 2,604 2,188 2,140
Earnings ($M) 1,412 1,521 1,531 1,718 1,803 1,921 2,012 2,137
Total Employment 50,640 54,720 52,550 56,830 59,440 60,910 61,850 64,470
State & Local Tax Rev. ($M) 476.1 512.8 505.4 553.7 576.0 606.2 618.4 641.8
Local Tax Rev. 169.7 182.2 181.1 199.9 208.5 221.9 229.6 242.4
Visitor 112.1 124.8 119.4 135.8 141.6 148.7 151.7 157.6
Business/Employee 57.6 57.4 61.7 64.1 66.9 73.2 77.9 84.7
State Tax Rev. 306.5 330.6 324.3 353.8 367.5 384.3 388.8 399.4
Visitor 267.3 286.9 283.2 306.3 317.1 328.9 331.0 341.1
Business/Employee 39.2 43.7 41.0 47.4 50.4 55.3 57.8 58.4
San Marcos
Total Spending ($M) 91 99 118 131 141 149 156 165
Visitor Spending ($M) 91 99 117 130 141 148 156 165
No Transportation ($M) 72 76 98 108 118 126 139 149
Transportation ($M) 19 23 20 22 23 22 16 15
Earnings ($M) 26 27 36 40 44 48 54 59
Total Employment 1,070 1,080 1,310 1,330 1,470 1,560 1,710 1,860
State & Local Tax Rev. ($M) 7.8 8.2 10.2 11.2 12.3 13.3 14.5 15.5
Local Tax Rev. 2.3 2.5 3.2 3.6 4.0 4.4 4.9 5.3
Visitor 1.7 1.8 2.3 2.7 2.9 3.1 3.5 3.8
Business/Employee 0.6 0.6 0.9 1.0 1.1 1.3 1.4 1.5
State Tax Rev. 5.5 5.7 7.0 7.6 8.3 8.9 9.7 10.3
Visitor 5.0 5.2 6.4 6.8 7.4 7.8 8.5 9.1
Business/Employee 0.5 0.5 0.6 0.8 0.9 1.1 1.2 1.2
City and Place Direct Travel Impacts, 2006-2016p
Visitor transportation spending includes motor fuel, auto rental, other ground transportation costs and one-way airfares. Visitor tax
receipts include all direct sales and excise taxes levied on visitor spending. Business/employee tax receipts include local property
taxes, the state franchise tax, and sales tax payments attributable to the travel industry generated income of employees.
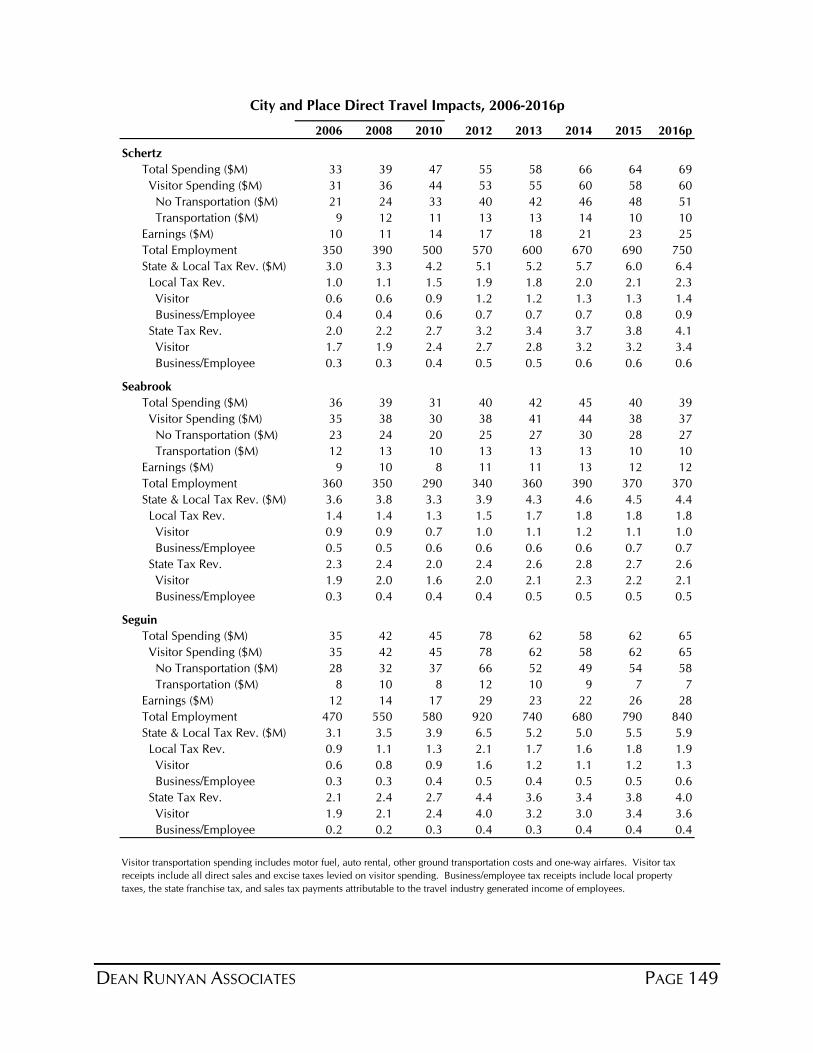
DEAN RUNYAN ASSOCIATES PAGE 149
2006 2008 2010 2012 2013 2014 2015 2016p
Schertz
Total Spending ($M) 33 39 47 55 58 66 64 69
Visitor Spending ($M) 31 36 44 53 55 60 58 60
No Transportation ($M) 21 24 33 40 42 46 48 51
Transportation ($M) 9 12 11 13 13 14 10 10
Earnings ($M) 10 11 14 17 18 21 23 25
Total Employment 350 390 500 570 600 670 690 750
State & Local Tax Rev. ($M) 3.0 3.3 4.2 5.1 5.2 5.7 6.0 6.4
Local Tax Rev. 1.0 1.1 1.5 1.9 1.8 2.0 2.1 2.3
Visitor 0.6 0.6 0.9 1.2 1.2 1.3 1.3 1.4
Business/Employee 0.4 0.4 0.6 0.7 0.7 0.7 0.8 0.9
State Tax Rev. 2.0 2.2 2.7 3.2 3.4 3.7 3.8 4.1
Visitor 1.7 1.9 2.4 2.7 2.8 3.2 3.2 3.4
Business/Employee 0.3 0.3 0.4 0.5 0.5 0.6 0.6 0.6
Seabrook
Total Spending ($M) 36 39 31 40 42 45 40 39
Visitor Spending ($M) 35 38 30 38 41 44 38 37
No Transportation ($M) 23 24 20 25 27 30 28 27
Transportation ($M) 12 13 10 13 13 13 10 10
Earnings ($M) 9 10 8 11 11 13 12 12
Total Employment 360 350 290 340 360 390 370 370
State & Local Tax Rev. ($M) 3.6 3.8 3.3 3.9 4.3 4.6 4.5 4.4
Local Tax Rev. 1.4 1.4 1.3 1.5 1.7 1.8 1.8 1.8
Visitor 0.9 0.9 0.7 1.0 1.1 1.2 1.1 1.0
Business/Employee 0.5 0.5 0.6 0.6 0.6 0.6 0.7 0.7
State Tax Rev. 2.3 2.4 2.0 2.4 2.6 2.8 2.7 2.6
Visitor 1.9 2.0 1.6 2.0 2.1 2.3 2.2 2.1
Business/Employee 0.3 0.4 0.4 0.4 0.5 0.5 0.5 0.5
Seguin
Total Spending ($M) 35 42 45 78 62 58 62 65
Visitor Spending ($M) 35 42 45 78 62 58 62 65
No Transportation ($M) 28 32 37 66 52 49 54 58
Transportation ($M) 8 10 8 12 10 9 7 7
Earnings ($M) 12 14 17 29 23 22 26 28
Total Employment 470 550 580 920 740 680 790 840
State & Local Tax Rev. ($M) 3.1 3.5 3.9 6.5 5.2 5.0 5.5 5.9
Local Tax Rev. 0.9 1.1 1.3 2.1 1.7 1.6 1.8 1.9
Visitor 0.6 0.8 0.9 1.6 1.2 1.1 1.2 1.3
Business/Employee 0.3 0.3 0.4 0.5 0.4 0.5 0.5 0.6
State Tax Rev. 2.1 2.4 2.7 4.4 3.6 3.4 3.8 4.0
Visitor 1.9 2.1 2.4 4.0 3.2 3.0 3.4 3.6
Business/Employee 0.2 0.2 0.3 0.4 0.3 0.4 0.4 0.4
City and Place Direct Travel Impacts, 2006-2016p
Visitor transportation spending includes motor fuel, auto rental, other ground transportation costs and one-way airfares. Visitor tax
receipts include all direct sales and excise taxes levied on visitor spending. Business/employee tax receipts include local property
taxes, the state franchise tax, and sales tax payments attributable to the travel industry generated income of employees.
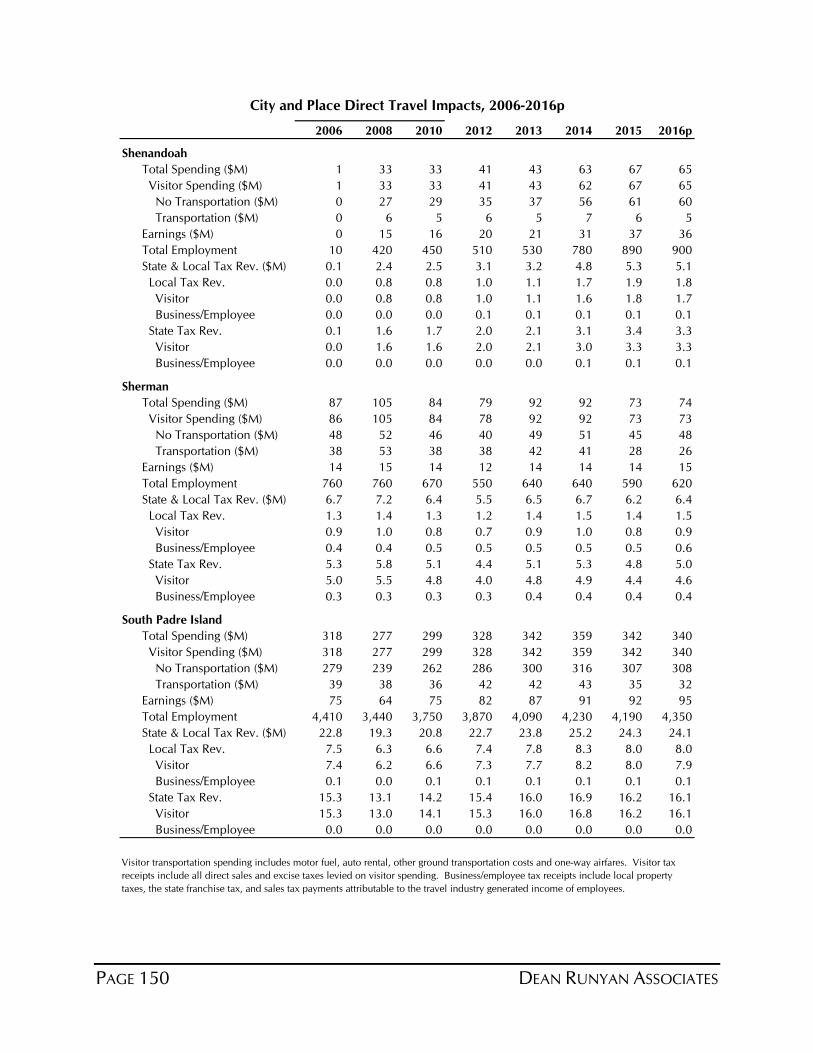
PAGE 150 DEAN RUNYAN ASSOCIATES
2006 2008 2010 2012 2013 2014 2015 2016p
Shenandoah
Total Spending ($M) 1 33 33 41 43 63 67 65
Visitor Spending ($M) 1 33 33 41 43 62 67 65
No Transportation ($M) 0 27 29 35 37 56 61 60
Transportation ($M) 0 6 5 6 5 7 6 5
Earnings ($M) 0 15 16 20 21 31 37 36
Total Employment 10 420 450 510 530 780 890 900
State & Local Tax Rev. ($M) 0.1 2.4 2.5 3.1 3.2 4.8 5.3 5.1
Local Tax Rev. 0.0 0.8 0.8 1.0 1.1 1.7 1.9 1.8
Visitor 0.0 0.8 0.8 1.0 1.1 1.6 1.8 1.7
Business/Employee 0.0 0.0 0.0 0.1 0.1 0.1 0.1 0.1
State Tax Rev. 0.1 1.6 1.7 2.0 2.1 3.1 3.4 3.3
Visitor 0.0 1.6 1.6 2.0 2.1 3.0 3.3 3.3
Business/Employee 0.0 0.0 0.0 0.0 0.0 0.1 0.1 0.1
Sherman
Total Spending ($M) 87 105 84 79 92 92 73 74
Visitor Spending ($M) 86 105 84 78 92 92 73 73
No Transportation ($M) 48 52 46 40 49 51 45 48
Transportation ($M) 38 53 38 38 42 41 28 26
Earnings ($M) 14 15 14 12 14 14 14 15
Total Employment 760 760 670 550 640 640 590 620
State & Local Tax Rev. ($M) 6.7 7.2 6.4 5.5 6.5 6.7 6.2 6.4
Local Tax Rev. 1.3 1.4 1.3 1.2 1.4 1.5 1.4 1.5
Visitor 0.9 1.0 0.8 0.7 0.9 1.0 0.8 0.9
Business/Employee 0.4 0.4 0.5 0.5 0.5 0.5 0.5 0.6
State Tax Rev. 5.3 5.8 5.1 4.4 5.1 5.3 4.8 5.0
Visitor 5.0 5.5 4.8 4.0 4.8 4.9 4.4 4.6
Business/Employee 0.3 0.3 0.3 0.3 0.4 0.4 0.4 0.4
South Padre Island
Total Spending ($M) 318 277 299 328 342 359 342 340
Visitor Spending ($M) 318 277 299 328 342 359 342 340
No Transportation ($M) 279 239 262 286 300 316 307 308
Transportation ($M) 39 38 36 42 42 43 35 32
Earnings ($M) 75 64 75 82 87 91 92 95
Total Employment 4,410 3,440 3,750 3,870 4,090 4,230 4,190 4,350
State & Local Tax Rev. ($M) 22.8 19.3 20.8 22.7 23.8 25.2 24.3 24.1
Local Tax Rev. 7.5 6.3 6.6 7.4 7.8 8.3 8.0 8.0
Visitor 7.4 6.2 6.6 7.3 7.7 8.2 8.0 7.9
Business/Employee 0.1 0.0 0.1 0.1 0.1 0.1 0.1 0.1
State Tax Rev. 15.3 13.1 14.2 15.4 16.0 16.9 16.2 16.1
Visitor 15.3 13.0 14.1 15.3 16.0 16.8 16.2 16.1
Business/Employee 0.0 0.0 0.0 0.0 0.0 0.0 0.0 0.0
City and Place Direct Travel Impacts, 2006-2016p
Visitor transportation spending includes motor fuel, auto rental, other ground transportation costs and one-way airfares. Visitor tax
receipts include all direct sales and excise taxes levied on visitor spending. Business/employee tax receipts include local property
taxes, the state franchise tax, and sales tax payments attributable to the travel industry generated income of employees.
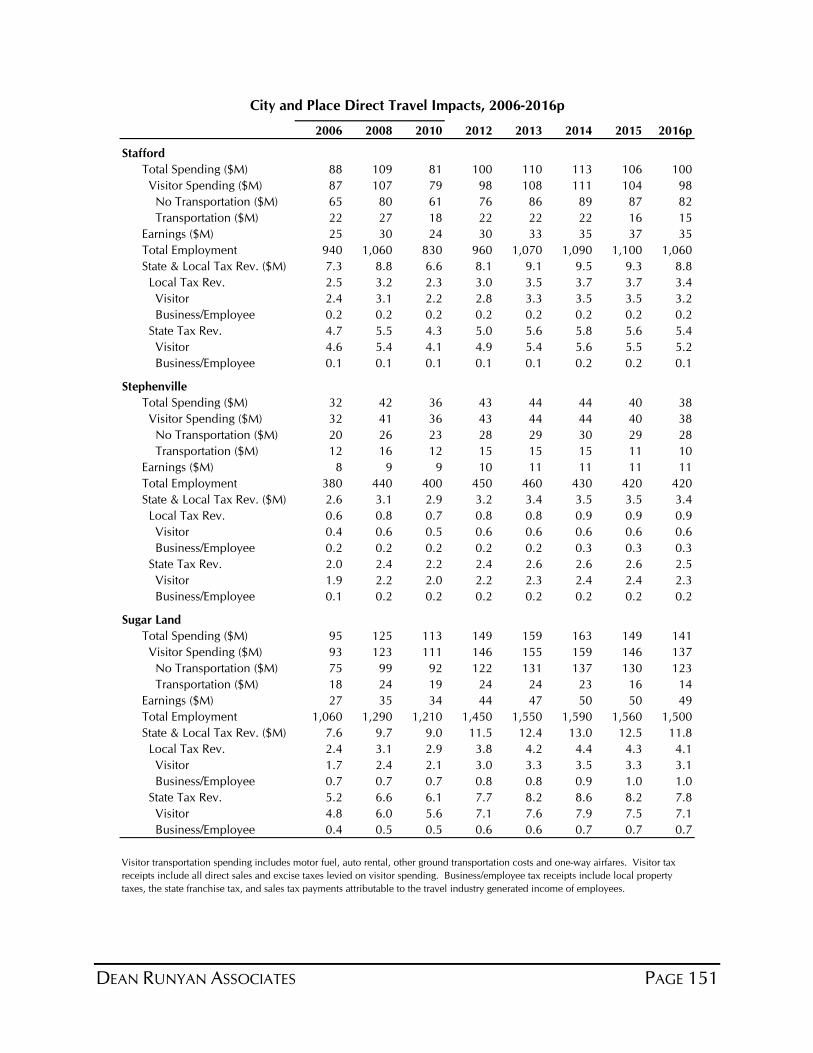
DEAN RUNYAN ASSOCIATES PAGE 151
2006 2008 2010 2012 2013 2014 2015 2016p
Stafford
Total Spending ($M) 88 109 81 100 110 113 106 100
Visitor Spending ($M) 87 107 79 98 108 111 104 98
No Transportation ($M) 65 80 61 76 86 89 87 82
Transportation ($M) 22 27 18 22 22 22 16 15
Earnings ($M) 25 30 24 30 33 35 37 35
Total Employment 940 1,060 830 960 1,070 1,090 1,100 1,060
State & Local Tax Rev. ($M) 7.3 8.8 6.6 8.1 9.1 9.5 9.3 8.8
Local Tax Rev. 2.5 3.2 2.3 3.0 3.5 3.7 3.7 3.4
Visitor 2.4 3.1 2.2 2.8 3.3 3.5 3.5 3.2
Business/Employee 0.2 0.2 0.2 0.2 0.2 0.2 0.2 0.2
State Tax Rev. 4.7 5.5 4.3 5.0 5.6 5.8 5.6 5.4
Visitor 4.6 5.4 4.1 4.9 5.4 5.6 5.5 5.2
Business/Employee 0.1 0.1 0.1 0.1 0.1 0.2 0.2 0.1
Stephenville
Total Spending ($M) 32 42 36 43 44 44 40 38
Visitor Spending ($M) 32 41 36 43 44 44 40 38
No Transportation ($M) 20 26 23 28 29 30 29 28
Transportation ($M) 12 16 12 15 15 15 11 10
Earnings ($M) 8 9 9 10 11 11 11 11
Total Employment 380 440 400 450 460 430 420 420
State & Local Tax Rev. ($M) 2.6 3.1 2.9 3.2 3.4 3.5 3.5 3.4
Local Tax Rev. 0.6 0.8 0.7 0.8 0.8 0.9 0.9 0.9
Visitor 0.4 0.6 0.5 0.6 0.6 0.6 0.6 0.6
Business/Employee 0.2 0.2 0.2 0.2 0.2 0.3 0.3 0.3
State Tax Rev. 2.0 2.4 2.2 2.4 2.6 2.6 2.6 2.5
Visitor 1.9 2.2 2.0 2.2 2.3 2.4 2.4 2.3
Business/Employee 0.1 0.2 0.2 0.2 0.2 0.2 0.2 0.2
Sugar Land
Total Spending ($M) 95 125 113 149 159 163 149 141
Visitor Spending ($M) 93 123 111 146 155 159 146 137
No Transportation ($M) 75 99 92 122 131 137 130 123
Transportation ($M) 18 24 19 24 24 23 16 14
Earnings ($M) 27 35 34 44 47 50 50 49
Total Employment 1,060 1,290 1,210 1,450 1,550 1,590 1,560 1,500
State & Local Tax Rev. ($M) 7.6 9.7 9.0 11.5 12.4 13.0 12.5 11.8
Local Tax Rev. 2.4 3.1 2.9 3.8 4.2 4.4 4.3 4.1
Visitor 1.7 2.4 2.1 3.0 3.3 3.5 3.3 3.1
Business/Employee 0.7 0.7 0.7 0.8 0.8 0.9 1.0 1.0
State Tax Rev. 5.2 6.6 6.1 7.7 8.2 8.6 8.2 7.8
Visitor 4.8 6.0 5.6 7.1 7.6 7.9 7.5 7.1
Business/Employee 0.4 0.5 0.5 0.6 0.6 0.7 0.7 0.7
City and Place Direct Travel Impacts, 2006-2016p
Visitor transportation spending includes motor fuel, auto rental, other ground transportation costs and one-way airfares. Visitor tax
receipts include all direct sales and excise taxes levied on visitor spending. Business/employee tax receipts include local property
taxes, the state franchise tax, and sales tax payments attributable to the travel industry generated income of employees.
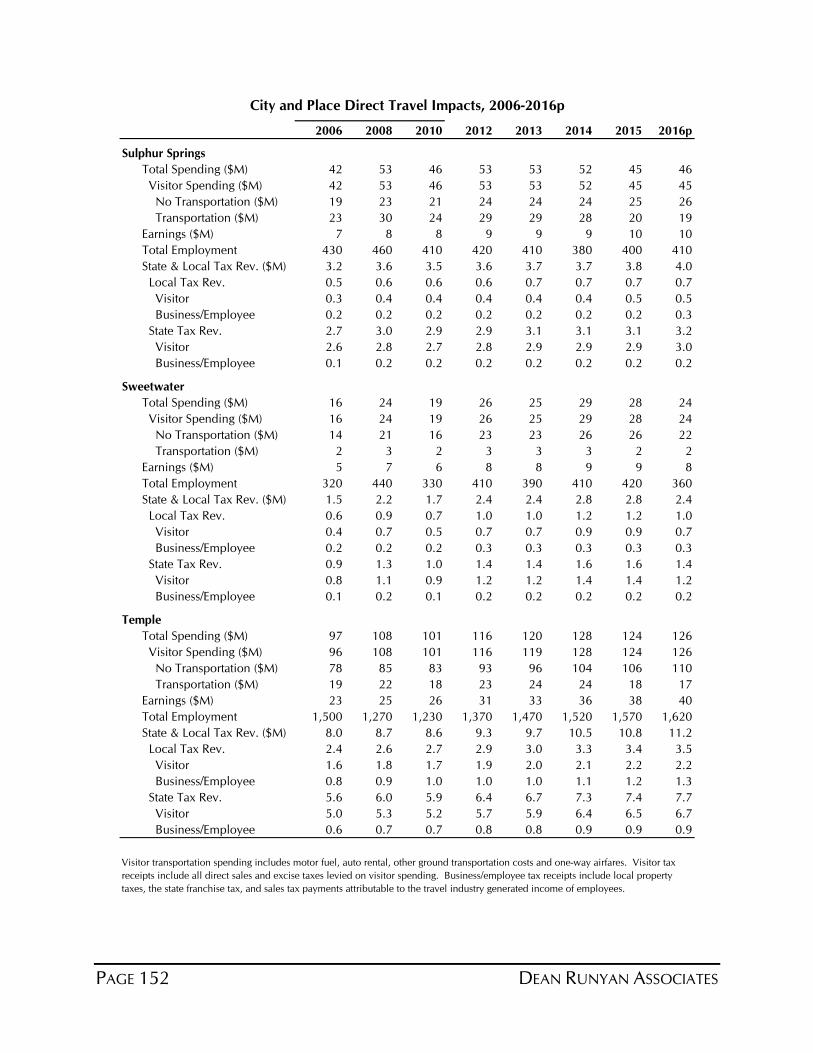
PAGE 152 DEAN RUNYAN ASSOCIATES
2006 2008 2010 2012 2013 2014 2015 2016p
Sulphur Springs
Total Spending ($M) 42 53 46 53 53 52 45 46
Visitor Spending ($M) 42 53 46 53 53 52 45 45
No Transportation ($M) 19 23 21 24 24 24 25 26
Transportation ($M) 23 30 24 29 29 28 20 19
Earnings ($M) 7 8 8 9 9 9 10 10
Total Employment 430 460 410 420 410 380 400 410
State & Local Tax Rev. ($M) 3.2 3.6 3.5 3.6 3.7 3.7 3.8 4.0
Local Tax Rev. 0.5 0.6 0.6 0.6 0.7 0.7 0.7 0.7
Visitor 0.3 0.4 0.4 0.4 0.4 0.4 0.5 0.5
Business/Employee 0.2 0.2 0.2 0.2 0.2 0.2 0.2 0.3
State Tax Rev. 2.7 3.0 2.9 2.9 3.1 3.1 3.1 3.2
Visitor 2.6 2.8 2.7 2.8 2.9 2.9 2.9 3.0
Business/Employee 0.1 0.2 0.2 0.2 0.2 0.2 0.2 0.2
Sweetwater
Total Spending ($M) 16 24 19 26 25 29 28 24
Visitor Spending ($M) 16 24 19 26 25 29 28 24
No Transportation ($M) 14 21 16 23 23 26 26 22
Transportation ($M) 2 3 2 3 3 3 2 2
Earnings ($M) 5 7 6 8 8 9 9 8
Total Employment 320 440 330 410 390 410 420 360
State & Local Tax Rev. ($M) 1.5 2.2 1.7 2.4 2.4 2.8 2.8 2.4
Local Tax Rev. 0.6 0.9 0.7 1.0 1.0 1.2 1.2 1.0
Visitor 0.4 0.7 0.5 0.7 0.7 0.9 0.9 0.7
Business/Employee 0.2 0.2 0.2 0.3 0.3 0.3 0.3 0.3
State Tax Rev. 0.9 1.3 1.0 1.4 1.4 1.6 1.6 1.4
Visitor 0.8 1.1 0.9 1.2 1.2 1.4 1.4 1.2
Business/Employee 0.1 0.2 0.1 0.2 0.2 0.2 0.2 0.2
Temple
Total Spending ($M) 97 108 101 116 120 128 124 126
Visitor Spending ($M) 96 108 101 116 119 128 124 126
No Transportation ($M) 78 85 83 93 96 104 106 110
Transportation ($M) 19 22 18 23 24 24 18 17
Earnings ($M) 23 25 26 31 33 36 38 40
Total Employment 1,500 1,270 1,230 1,370 1,470 1,520 1,570 1,620
State & Local Tax Rev. ($M) 8.0 8.7 8.6 9.3 9.7 10.5 10.8 11.2
Local Tax Rev. 2.4 2.6 2.7 2.9 3.0 3.3 3.4 3.5
Visitor 1.6 1.8 1.7 1.9 2.0 2.1 2.2 2.2
Business/Employee 0.8 0.9 1.0 1.0 1.0 1.1 1.2 1.3
State Tax Rev. 5.6 6.0 5.9 6.4 6.7 7.3 7.4 7.7
Visitor 5.0 5.3 5.2 5.7 5.9 6.4 6.5 6.7
Business/Employee 0.6 0.7 0.7 0.8 0.8 0.9 0.9 0.9
City and Place Direct Travel Impacts, 2006-2016p
Visitor transportation spending includes motor fuel, auto rental, other ground transportation costs and one-way airfares. Visitor tax
receipts include all direct sales and excise taxes levied on visitor spending. Business/employee tax receipts include local property
taxes, the state franchise tax, and sales tax payments attributable to the travel industry generated income of employees.
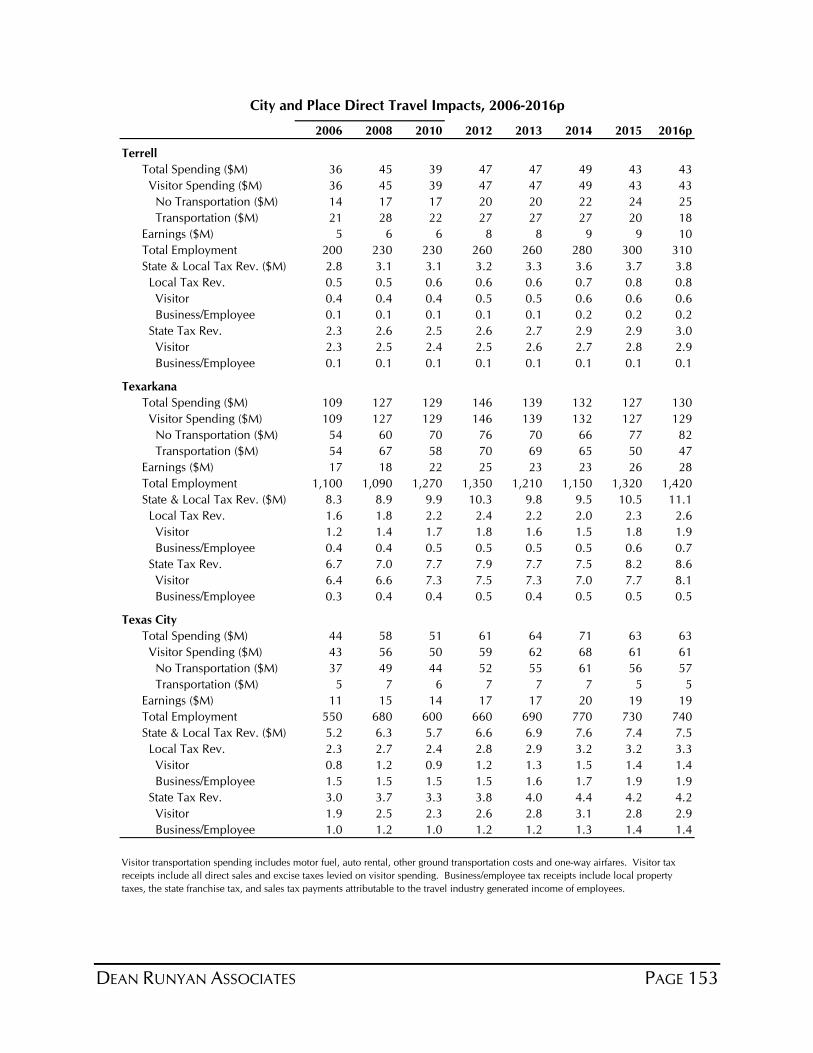
DEAN RUNYAN ASSOCIATES PAGE 153
2006 2008 2010 2012 2013 2014 2015 2016p
Terrell
Total Spending ($M) 36 45 39 47 47 49 43 43
Visitor Spending ($M) 36 45 39 47 47 49 43 43
No Transportation ($M) 14 17 17 20 20 22 24 25
Transportation ($M) 21 28 22 27 27 27 20 18
Earnings ($M) 5 6 6 8 8 9 9 10
Total Employment 200 230 230 260 260 280 300 310
State & Local Tax Rev. ($M) 2.8 3.1 3.1 3.2 3.3 3.6 3.7 3.8
Local Tax Rev. 0.5 0.5 0.6 0.6 0.6 0.7 0.8 0.8
Visitor 0.4 0.4 0.4 0.5 0.5 0.6 0.6 0.6
Business/Employee 0.1 0.1 0.1 0.1 0.1 0.2 0.2 0.2
State Tax Rev. 2.3 2.6 2.5 2.6 2.7 2.9 2.9 3.0
Visitor 2.3 2.5 2.4 2.5 2.6 2.7 2.8 2.9
Business/Employee 0.1 0.1 0.1 0.1 0.1 0.1 0.1 0.1
Texarkana
Total Spending ($M) 109 127 129 146 139 132 127 130
Visitor Spending ($M) 109 127 129 146 139 132 127 129
No Transportation ($M) 54 60 70 76 70 66 77 82
Transportation ($M) 54 67 58 70 69 65 50 47
Earnings ($M) 17 18 22 25 23 23 26 28
Total Employment 1,100 1,090 1,270 1,350 1,210 1,150 1,320 1,420
State & Local Tax Rev. ($M) 8.3 8.9 9.9 10.3 9.8 9.5 10.5 11.1
Local Tax Rev. 1.6 1.8 2.2 2.4 2.2 2.0 2.3 2.6
Visitor 1.2 1.4 1.7 1.8 1.6 1.5 1.8 1.9
Business/Employee 0.4 0.4 0.5 0.5 0.5 0.5 0.6 0.7
State Tax Rev. 6.7 7.0 7.7 7.9 7.7 7.5 8.2 8.6
Visitor 6.4 6.6 7.3 7.5 7.3 7.0 7.7 8.1
Business/Employee 0.3 0.4 0.4 0.5 0.4 0.5 0.5 0.5
Texas City
Total Spending ($M) 44 58 51 61 64 71 63 63
Visitor Spending ($M) 43 56 50 59 62 68 61 61
No Transportation ($M) 37 49 44 52 55 61 56 57
Transportation ($M) 5 7 6 7 7 7 5 5
Earnings ($M) 11 15 14 17 17 20 19 19
Total Employment 550 680 600 660 690 770 730 740
State & Local Tax Rev. ($M) 5.2 6.3 5.7 6.6 6.9 7.6 7.4 7.5
Local Tax Rev. 2.3 2.7 2.4 2.8 2.9 3.2 3.2 3.3
Visitor 0.8 1.2 0.9 1.2 1.3 1.5 1.4 1.4
Business/Employee 1.5 1.5 1.5 1.5 1.6 1.7 1.9 1.9
State Tax Rev. 3.0 3.7 3.3 3.8 4.0 4.4 4.2 4.2
Visitor 1.9 2.5 2.3 2.6 2.8 3.1 2.8 2.9
Business/Employee 1.0 1.2 1.0 1.2 1.2 1.3 1.4 1.4
City and Place Direct Travel Impacts, 2006-2016p
Visitor transportation spending includes motor fuel, auto rental, other ground transportation costs and one-way airfares. Visitor tax
receipts include all direct sales and excise taxes levied on visitor spending. Business/employee tax receipts include local property
taxes, the state franchise tax, and sales tax payments attributable to the travel industry generated income of employees.
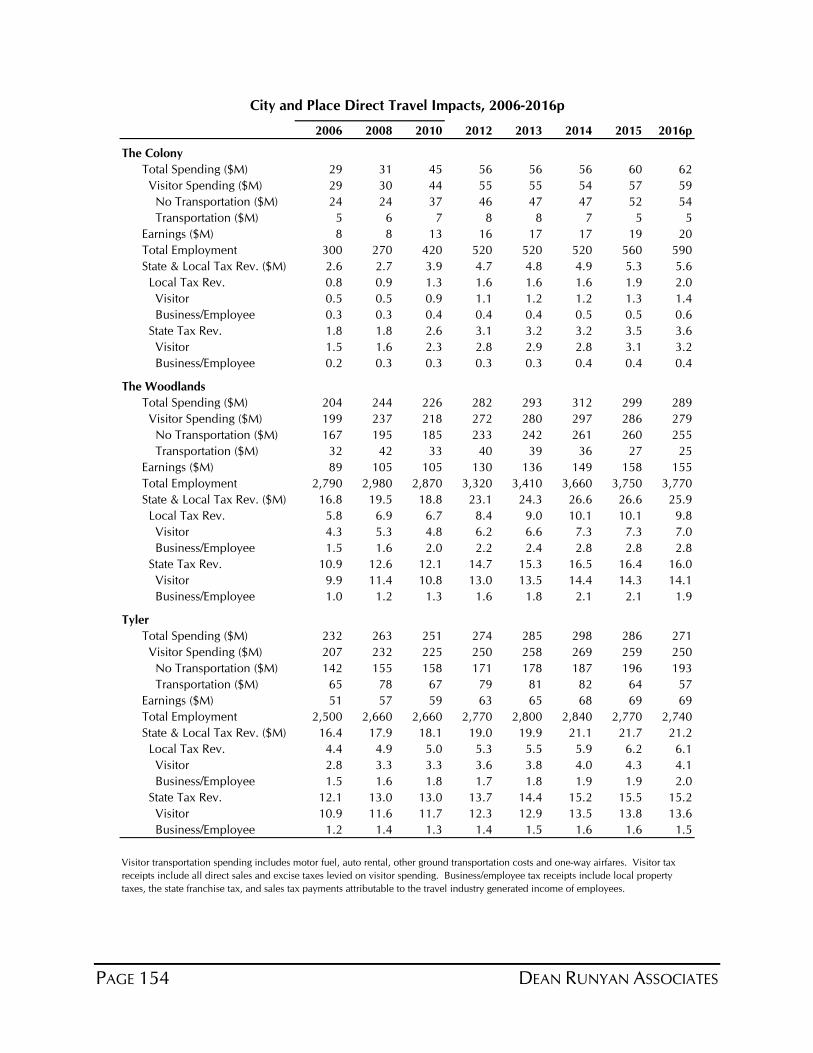
PAGE 154 DEAN RUNYAN ASSOCIATES
2006 2008 2010 2012 2013 2014 2015 2016p
The Colony
Total Spending ($M) 29 31 45 56 56 56 60 62
Visitor Spending ($M) 29 30 44 55 55 54 57 59
No Transportation ($M) 24 24 37 46 47 47 52 54
Transportation ($M) 5 6 7 8 8 7 5 5
Earnings ($M) 8 8 13 16 17 17 19 20
Total Employment 300 270 420 520 520 520 560 590
State & Local Tax Rev. ($M) 2.6 2.7 3.9 4.7 4.8 4.9 5.3 5.6
Local Tax Rev. 0.8 0.9 1.3 1.6 1.6 1.6 1.9 2.0
Visitor 0.5 0.5 0.9 1.1 1.2 1.2 1.3 1.4
Business/Employee 0.3 0.3 0.4 0.4 0.4 0.5 0.5 0.6
State Tax Rev. 1.8 1.8 2.6 3.1 3.2 3.2 3.5 3.6
Visitor 1.5 1.6 2.3 2.8 2.9 2.8 3.1 3.2
Business/Employee 0.2 0.3 0.3 0.3 0.3 0.4 0.4 0.4
The Woodlands
Total Spending ($M) 204 244 226 282 293 312 299 289
Visitor Spending ($M) 199 237 218 272 280 297 286 279
No Transportation ($M) 167 195 185 233 242 261 260 255
Transportation ($M) 32 42 33 40 39 36 27 25
Earnings ($M) 89 105 105 130 136 149 158 155
Total Employment 2,790 2,980 2,870 3,320 3,410 3,660 3,750 3,770
State & Local Tax Rev. ($M) 16.8 19.5 18.8 23.1 24.3 26.6 26.6 25.9
Local Tax Rev. 5.8 6.9 6.7 8.4 9.0 10.1 10.1 9.8
Visitor 4.3 5.3 4.8 6.2 6.6 7.3 7.3 7.0
Business/Employee 1.5 1.6 2.0 2.2 2.4 2.8 2.8 2.8
State Tax Rev. 10.9 12.6 12.1 14.7 15.3 16.5 16.4 16.0
Visitor 9.9 11.4 10.8 13.0 13.5 14.4 14.3 14.1
Business/Employee 1.0 1.2 1.3 1.6 1.8 2.1 2.1 1.9
Tyler
Total Spending ($M) 232 263 251 274 285 298 286 271
Visitor Spending ($M) 207 232 225 250 258 269 259 250
No Transportation ($M) 142 155 158 171 178 187 196 193
Transportation ($M) 65 78 67 79 81 82 64 57
Earnings ($M) 51 57 59 63 65 68 69 69
Total Employment 2,500 2,660 2,660 2,770 2,800 2,840 2,770 2,740
State & Local Tax Rev. ($M) 16.4 17.9 18.1 19.0 19.9 21.1 21.7 21.2
Local Tax Rev. 4.4 4.9 5.0 5.3 5.5 5.9 6.2 6.1
Visitor 2.8 3.3 3.3 3.6 3.8 4.0 4.3 4.1
Business/Employee 1.5 1.6 1.8 1.7 1.8 1.9 1.9 2.0
State Tax Rev. 12.1 13.0 13.0 13.7 14.4 15.2 15.5 15.2
Visitor 10.9 11.6 11.7 12.3 12.9 13.5 13.8 13.6
Business/Employee 1.2 1.4 1.3 1.4 1.5 1.6 1.6 1.5
City and Place Direct Travel Impacts, 2006-2016p
Visitor transportation spending includes motor fuel, auto rental, other ground transportation costs and one-way airfares. Visitor tax
receipts include all direct sales and excise taxes levied on visitor spending. Business/employee tax receipts include local property
taxes, the state franchise tax, and sales tax payments attributable to the travel industry generated income of employees.
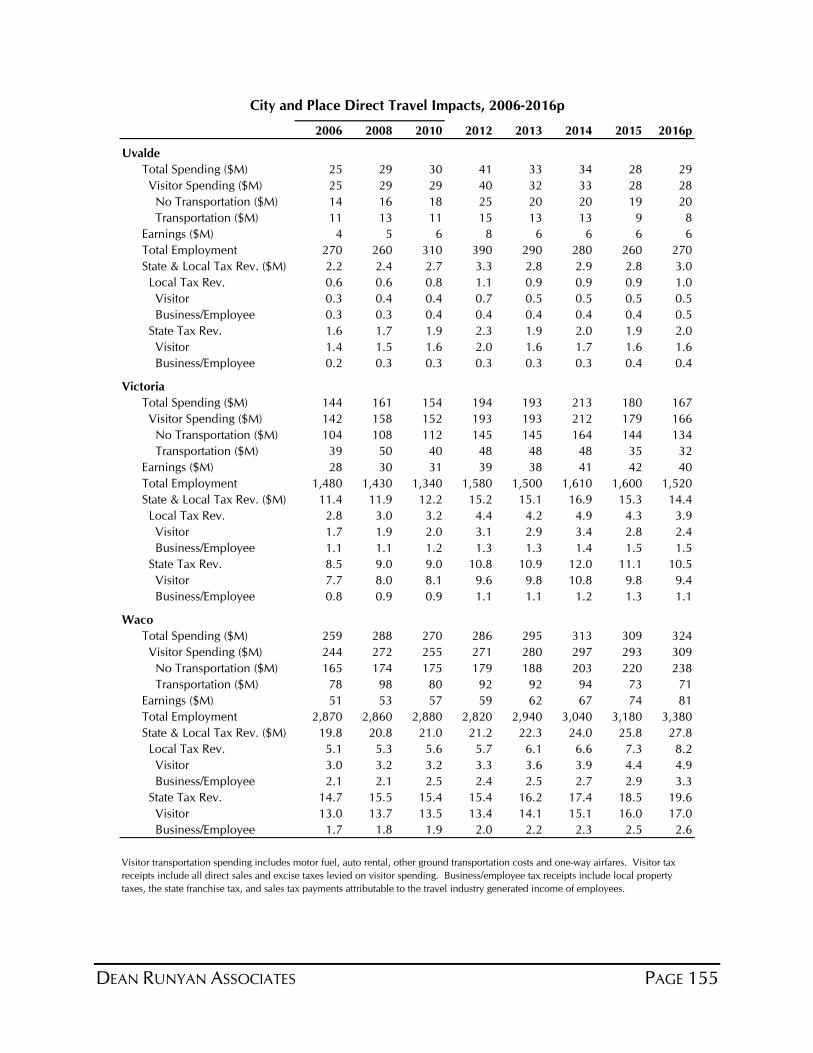
DEAN RUNYAN ASSOCIATES PAGE 155
2006 2008 2010 2012 2013 2014 2015 2016p
Uvalde
Total Spending ($M) 25 29 30 41 33 34 28 29
Visitor Spending ($M) 25 29 29 40 32 33 28 28
No Transportation ($M) 14 16 18 25 20 20 19 20
Transportation ($M) 11 13 11 15 13 13 9 8
Earnings ($M) 4 5 6 8 6 6 6 6
Total Employment 270 260 310 390 290 280 260 270
State & Local Tax Rev. ($M) 2.2 2.4 2.7 3.3 2.8 2.9 2.8 3.0
Local Tax Rev. 0.6 0.6 0.8 1.1 0.9 0.9 0.9 1.0
Visitor 0.3 0.4 0.4 0.7 0.5 0.5 0.5 0.5
Business/Employee 0.3 0.3 0.4 0.4 0.4 0.4 0.4 0.5
State Tax Rev. 1.6 1.7 1.9 2.3 1.9 2.0 1.9 2.0
Visitor 1.4 1.5 1.6 2.0 1.6 1.7 1.6 1.6
Business/Employee 0.2 0.3 0.3 0.3 0.3 0.3 0.4 0.4
Victoria
Total Spending ($M) 144 161 154 194 193 213 180 167
Visitor Spending ($M) 142 158 152 193 193 212 179 166
No Transportation ($M) 104 108 112 145 145 164 144 134
Transportation ($M) 39 50 40 48 48 48 35 32
Earnings ($M) 28 30 31 39 38 41 42 40
Total Employment 1,480 1,430 1,340 1,580 1,500 1,610 1,600 1,520
State & Local Tax Rev. ($M) 11.4 11.9 12.2 15.2 15.1 16.9 15.3 14.4
Local Tax Rev. 2.8 3.0 3.2 4.4 4.2 4.9 4.3 3.9
Visitor 1.7 1.9 2.0 3.1 2.9 3.4 2.8 2.4
Business/Employee 1.1 1.1 1.2 1.3 1.3 1.4 1.5 1.5
State Tax Rev. 8.5 9.0 9.0 10.8 10.9 12.0 11.1 10.5
Visitor 7.7 8.0 8.1 9.6 9.8 10.8 9.8 9.4
Business/Employee 0.8 0.9 0.9 1.1 1.1 1.2 1.3 1.1
Waco
Total Spending ($M) 259 288 270 286 295 313 309 324
Visitor Spending ($M) 244 272 255 271 280 297 293 309
No Transportation ($M) 165 174 175 179 188 203 220 238
Transportation ($M) 78 98 80 92 92 94 73 71
Earnings ($M) 51 53 57 59 62 67 74 81
Total Employment 2,870 2,860 2,880 2,820 2,940 3,040 3,180 3,380
State & Local Tax Rev. ($M) 19.8 20.8 21.0 21.2 22.3 24.0 25.8 27.8
Local Tax Rev. 5.1 5.3 5.6 5.7 6.1 6.6 7.3 8.2
Visitor 3.0 3.2 3.2 3.3 3.6 3.9 4.4 4.9
Business/Employee 2.1 2.1 2.5 2.4 2.5 2.7 2.9 3.3
State Tax Rev. 14.7 15.5 15.4 15.4 16.2 17.4 18.5 19.6
Visitor 13.0 13.7 13.5 13.4 14.1 15.1 16.0 17.0
Business/Employee 1.7 1.8 1.9 2.0 2.2 2.3 2.5 2.6
City and Place Direct Travel Impacts, 2006-2016p
Visitor transportation spending includes motor fuel, auto rental, other ground transportation costs and one-way airfares. Visitor tax
receipts include all direct sales and excise taxes levied on visitor spending. Business/employee tax receipts include local property
taxes, the state franchise tax, and sales tax payments attributable to the travel industry generated income of employees.
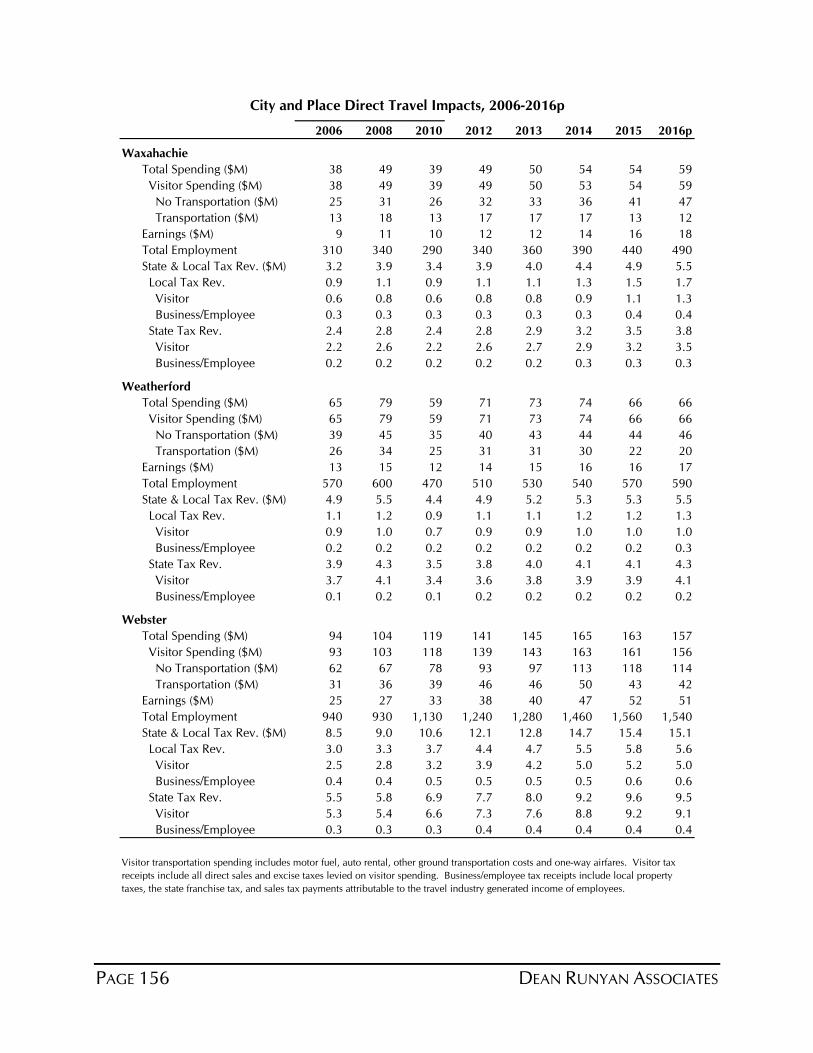
PAGE 156 DEAN RUNYAN ASSOCIATES
2006 2008 2010 2012 2013 2014 2015 2016p
Waxahachie
Total Spending ($M) 38 49 39 49 50 54 54 59
Visitor Spending ($M) 38 49 39 49 50 53 54 59
No Transportation ($M) 25 31 26 32 33 36 41 47
Transportation ($M) 13 18 13 17 17 17 13 12
Earnings ($M) 9 11 10 12 12 14 16 18
Total Employment 310 340 290 340 360 390 440 490
State & Local Tax Rev. ($M) 3.2 3.9 3.4 3.9 4.0 4.4 4.9 5.5
Local Tax Rev. 0.9 1.1 0.9 1.1 1.1 1.3 1.5 1.7
Visitor 0.6 0.8 0.6 0.8 0.8 0.9 1.1 1.3
Business/Employee 0.3 0.3 0.3 0.3 0.3 0.3 0.4 0.4
State Tax Rev. 2.4 2.8 2.4 2.8 2.9 3.2 3.5 3.8
Visitor 2.2 2.6 2.2 2.6 2.7 2.9 3.2 3.5
Business/Employee 0.2 0.2 0.2 0.2 0.2 0.3 0.3 0.3
Weatherford
Total Spending ($M) 65 79 59 71 73 74 66 66
Visitor Spending ($M) 65 79 59 71 73 74 66 66
No Transportation ($M) 39 45 35 40 43 44 44 46
Transportation ($M) 26 34 25 31 31 30 22 20
Earnings ($M) 13 15 12 14 15 16 16 17
Total Employment 570 600 470 510 530 540 570 590
State & Local Tax Rev. ($M) 4.9 5.5 4.4 4.9 5.2 5.3 5.3 5.5
Local Tax Rev. 1.1 1.2 0.9 1.1 1.1 1.2 1.2 1.3
Visitor 0.9 1.0 0.7 0.9 0.9 1.0 1.0 1.0
Business/Employee 0.2 0.2 0.2 0.2 0.2 0.2 0.2 0.3
State Tax Rev. 3.9 4.3 3.5 3.8 4.0 4.1 4.1 4.3
Visitor 3.7 4.1 3.4 3.6 3.8 3.9 3.9 4.1
Business/Employee 0.1 0.2 0.1 0.2 0.2 0.2 0.2 0.2
Webster
Total Spending ($M) 94 104 119 141 145 165 163 157
Visitor Spending ($M) 93 103 118 139 143 163 161 156
No Transportation ($M) 62 67 78 93 97 113 118 114
Transportation ($M) 31 36 39 46 46 50 43 42
Earnings ($M) 25 27 33 38 40 47 52 51
Total Employment 940 930 1,130 1,240 1,280 1,460 1,560 1,540
State & Local Tax Rev. ($M) 8.5 9.0 10.6 12.1 12.8 14.7 15.4 15.1
Local Tax Rev. 3.0 3.3 3.7 4.4 4.7 5.5 5.8 5.6
Visitor 2.5 2.8 3.2 3.9 4.2 5.0 5.2 5.0
Business/Employee 0.4 0.4 0.5 0.5 0.5 0.5 0.6 0.6
State Tax Rev. 5.5 5.8 6.9 7.7 8.0 9.2 9.6 9.5
Visitor 5.3 5.4 6.6 7.3 7.6 8.8 9.2 9.1
Business/Employee 0.3 0.3 0.3 0.4 0.4 0.4 0.4 0.4
City and Place Direct Travel Impacts, 2006-2016p
Visitor transportation spending includes motor fuel, auto rental, other ground transportation costs and one-way airfares. Visitor tax
receipts include all direct sales and excise taxes levied on visitor spending. Business/employee tax receipts include local property
taxes, the state franchise tax, and sales tax payments attributable to the travel industry generated income of employees.
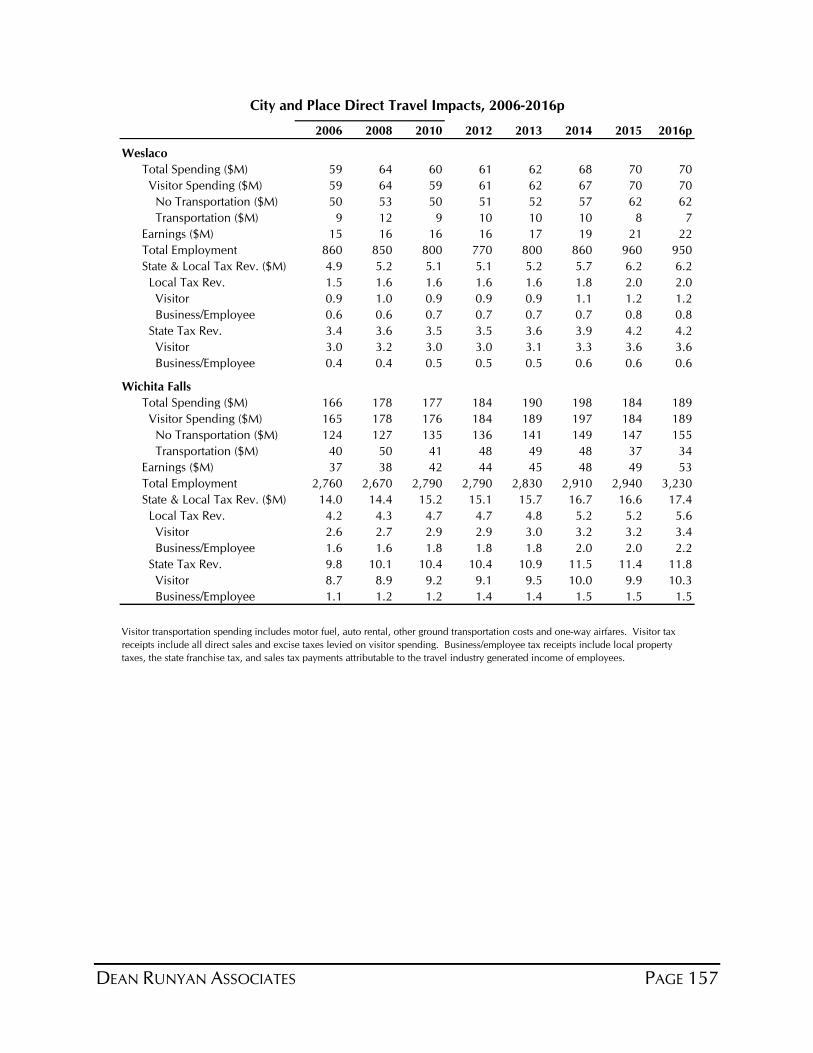
DEAN RUNYAN ASSOCIATES PAGE 157
2006 2008 2010 2012 2013 2014 2015 2016p
Weslaco
Total Spending ($M) 59 64 60 61 62 68 70 70
Visitor Spending ($M) 59 64 59 61 62 67 70 70
No Transportation ($M) 50 53 50 51 52 57 62 62
Transportation ($M) 9 12 9 10 10 10 8 7
Earnings ($M) 15 16 16 16 17 19 21 22
Total Employment 860 850 800 770 800 860 960 950
State & Local Tax Rev. ($M) 4.9 5.2 5.1 5.1 5.2 5.7 6.2 6.2
Local Tax Rev. 1.5 1.6 1.6 1.6 1.6 1.8 2.0 2.0
Visitor 0.9 1.0 0.9 0.9 0.9 1.1 1.2 1.2
Business/Employee 0.6 0.6 0.7 0.7 0.7 0.7 0.8 0.8
State Tax Rev. 3.4 3.6 3.5 3.5 3.6 3.9 4.2 4.2
Visitor 3.0 3.2 3.0 3.0 3.1 3.3 3.6 3.6
Business/Employee 0.4 0.4 0.5 0.5 0.5 0.6 0.6 0.6
Wichita Falls
Total Spending ($M) 166 178 177 184 190 198 184 189
Visitor Spending ($M) 165 178 176 184 189 197 184 189
No Transportation ($M) 124 127 135 136 141 149 147 155
Transportation ($M) 40 50 41 48 49 48 37 34
Earnings ($M) 37 38 42 44 45 48 49 53
Total Employment 2,760 2,670 2,790 2,790 2,830 2,910 2,940 3,230
State & Local Tax Rev. ($M) 14.0 14.4 15.2 15.1 15.7 16.7 16.6 17.4
Local Tax Rev. 4.2 4.3 4.7 4.7 4.8 5.2 5.2 5.6
Visitor 2.6 2.7 2.9 2.9 3.0 3.2 3.2 3.4
Business/Employee 1.6 1.6 1.8 1.8 1.8 2.0 2.0 2.2
State Tax Rev. 9.8 10.1 10.4 10.4 10.9 11.5 11.4 11.8
Visitor 8.7 8.9 9.2 9.1 9.5 10.0 9.9 10.3
Business/Employee 1.1 1.2 1.2 1.4 1.4 1.5 1.5 1.5
City and Place Direct Travel Impacts, 2006-2016p
Visitor transportation spending includes motor fuel, auto rental, other ground transportation costs and one-way airfares. Visitor tax
receipts include all direct sales and excise taxes levied on visitor spending. Business/employee tax receipts include local property
taxes, the state franchise tax, and sales tax payments attributable to the travel industry generated income of employees.
PAGE 158 DEAN RUNYAN ASSOCIATES
APPENDICES
Appendix A. Regional Travel Impact Model
Appendix B. Travel Industry Accounts: A comparison of the
Regional Travel Impact Model and
Travel & Tourism Satellite Accounts
Appendix C. Texas Earnings and Employment by Industry Sector
Appendix D. Secondary Impacts Industry Groups
DEAN RUNYAN ASSOCIATES PAGE 159
APPENDIX A
REGIONAL TRAVEL IMPACT MODEL
This appendix provides a brief overview of methodology, terminology and limitations of
these impact estimates. Other appendices in this report provide greater detail for many of
these topics.
DIRECT IMPACTS
The estimates of the direct impacts associated with traveler spending in Texas were
produced using the Regional Travel Impact Model (RTIM) developed by Dean Runyan
Associates. The input data used to detail the economic impacts of the Texas travel industry
were gathered from various local, state and federal sources.
Travel impacts consist of estimates of travel spending and the employment, earnings and
tax receipts generated by this spending. These estimates are also broken out by type of
traveler accommodation and by the type of business in which the expenditures occur.
SECONDARY (INDIRECT AND INDUCED) IMPACTS
Direct impacts are reported for all counties, metropolitan areas, tourism regions, and
selected cities and places within Texas. Secondary employment and earnings impacts over
and above direct impacts are reported at the state level only. These indirect and induced
impacts are generated from the direct impacts produced by the RTIM, discussed above, and
an input-output model of the Texas economy prepared by the Minnesota IMPLAN Group,
Inc. Indirect impacts represent the purchases of goods and services from other firms by
businesses that directly receive expenditures from travelers. Hotels, for example, purchase
maintenance services from independent contractors. Induced impacts represent the
purchase of goods and services by employees whose earnings are in part derived from
travel expenditures. The sum of the direct, indirect and induced impacts equals the total
impact of all spending by visitors in the state. The “multiplier” refers to the ratio of the
total impacts to the direct impacts for employment or earnings.
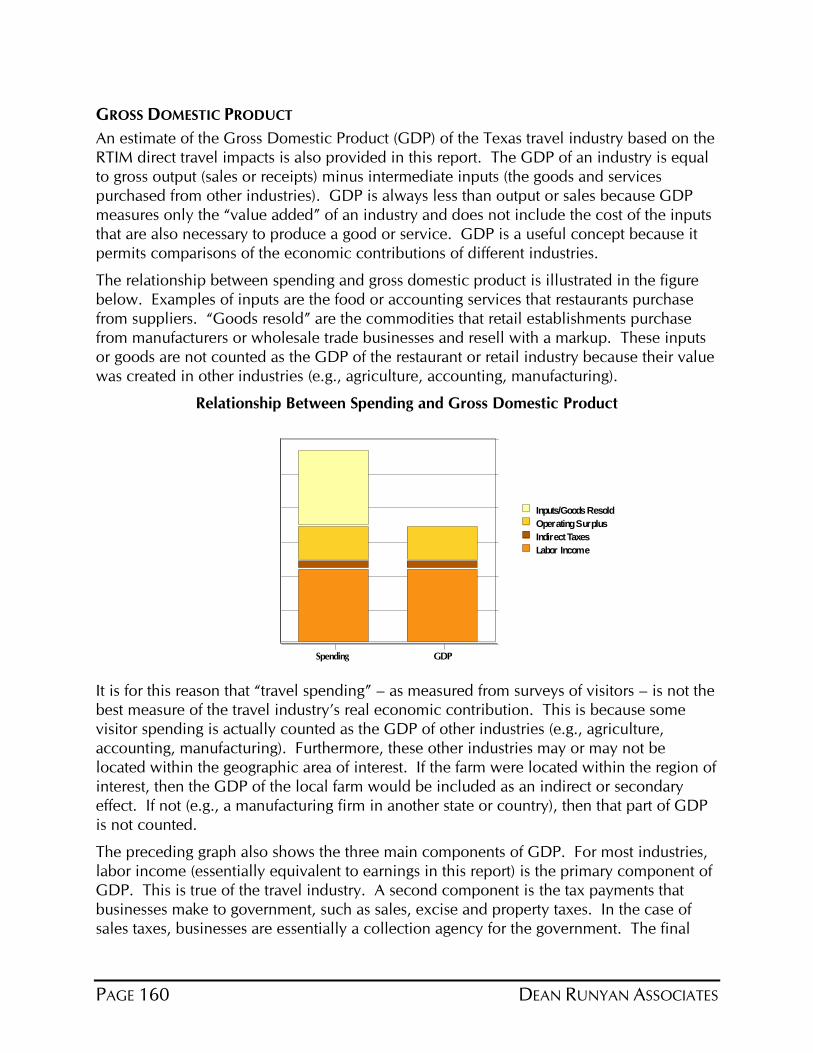
PAGE 160 DEAN RUNYAN ASSOCIATES
Spending GDP
Inputs/Goods Resold
Operating Surplus
Indirect Taxes
Labor Income
GROSS DOMESTIC PRODUCT
An estimate of the Gross Domestic Product (GDP) of the Texas travel industry based on the
RTIM direct travel impacts is also provided in this report. The GDP of an industry is equal
to gross output (sales or receipts) minus intermediate inputs (the goods and services
purchased from other industries). GDP is always less than output or sales because GDP
measures only the “value added” of an industry and does not include the cost of the inputs
that are also necessary to produce a good or service. GDP is a useful concept because it
permits comparisons of the economic contributions of different industries.
The relationship between spending and gross domestic product is illustrated in the figure
below. Examples of inputs are the food or accounting services that restaurants purchase
from suppliers. “Goods resold” are the commodities that retail establishments purchase
from manufacturers or wholesale trade businesses and resell with a markup. These inputs
or goods are not counted as the GDP of the restaurant or retail industry because their value
was created in other industries (e.g., agriculture, accounting, manufacturing).
Relationship Between Spending and Gross Domestic Product
It is for this reason that “travel spending” – as measured from surveys of visitors – is not the
best measure of the travel industry’s real economic contribution. This is because some
visitor spending is actually counted as the GDP of other industries (e.g., agriculture,
accounting, manufacturing). Furthermore, these other industries may or may not be
located within the geographic area of interest. If the farm were located within the region of
interest, then the GDP of the local farm would be included as an indirect or secondary
effect. If not (e.g., a manufacturing firm in another state or country), then that part of GDP
is not counted.
The preceding graph also shows the three main components of GDP. For most industries,
labor income (essentially equivalent to earnings in this report) is the primary component of
GDP. This is true of the travel industry. A second component is the tax payments that
businesses make to government, such as sales, excise and property taxes. In the case of
sales taxes, businesses are essentially a collection agency for the government. The final
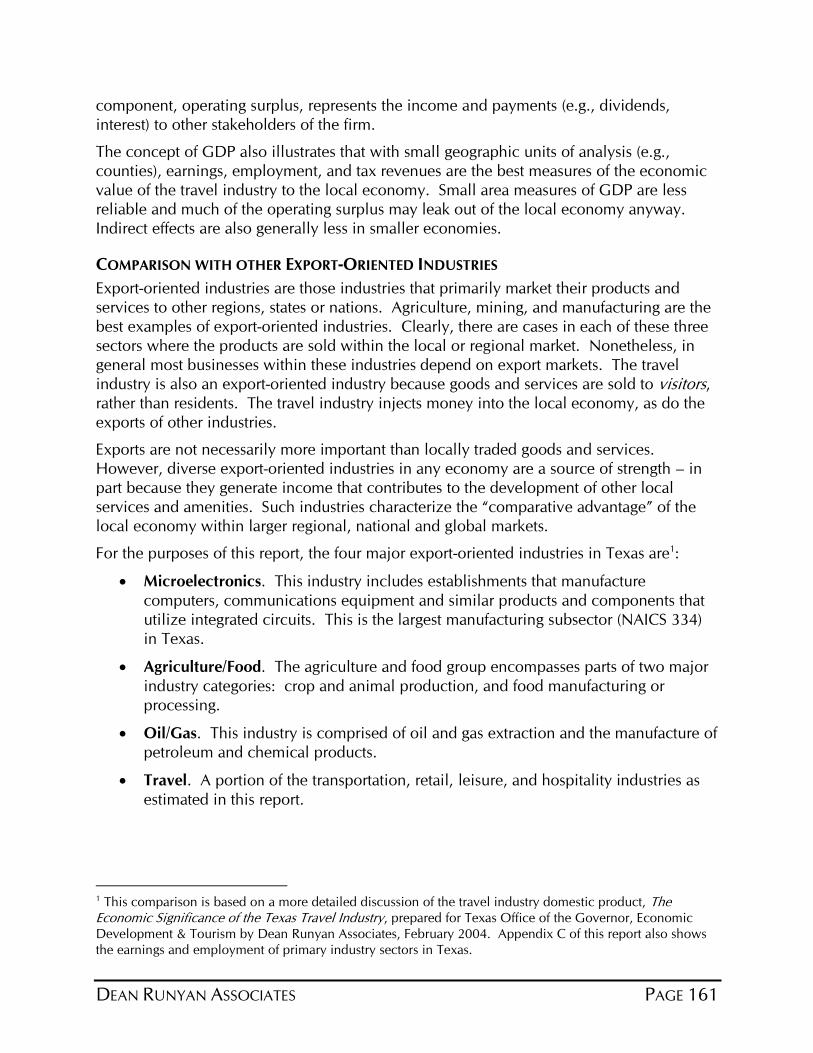
DEAN RUNYAN ASSOCIATES PAGE 161
component, operating surplus, represents the income and payments (e.g., dividends,
interest) to other stakeholders of the firm.
The concept of GDP also illustrates that with small geographic units of analysis (e.g.,
counties), earnings, employment, and tax revenues are the best measures of the economic
value of the travel industry to the local economy. Small area measures of GDP are less
reliable and much of the operating surplus may leak out of the local economy anyway.
Indirect effects are also generally less in smaller economies.
COMPARISON WITH OTHER EXPORT-ORIENTED INDUSTRIES
Export-oriented industries are those industries that primarily market their products and
services to other regions, states or nations. Agriculture, mining, and manufacturing are the
best examples of export-oriented industries. Clearly, there are cases in each of these three
sectors where the products are sold within the local or regional market. Nonetheless, in
general most businesses within these industries depend on export markets. The travel
industry is also an export-oriented industry because goods and services are sold to visitors, rather than residents. The travel industry injects money into the local economy, as do the
exports of other industries.
Exports are not necessarily more important than locally traded goods and services.
However, diverse export-oriented industries in any economy are a source of strength – in
part because they generate income that contributes to the development of other local
services and amenities. Such industries characterize the “comparative advantage” of the
local economy within larger regional, national and global markets.
For the purposes of this report, the four major export-oriented industries in Texas are1:
Microelectronics. This industry includes establishments that manufacture
computers, communications equipment and similar products and components that
utilize integrated circuits. This is the largest manufacturing subsector (NAICS 334)
in Texas.
Agriculture/Food. The agriculture and food group encompasses parts of two major
industry categories: crop and animal production, and food manufacturing or
processing.
Oil/Gas. This industry is comprised of oil and gas extraction and the manufacture of
petroleum and chemical products.
Travel. A portion of the transportation, retail, leisure, and hospitality industries as
estimated in this report.
1 This comparison is based on a more detailed discussion of the travel industry domestic product, The Economic Significance of the Texas Travel Industry, prepared for Texas Office of the Governor, Economic
Development & Tourism by Dean Runyan Associates, February 2004. Appendix C of this report also shows
the earnings and employment of primary industry sectors in Texas.
PAGE 162 DEAN RUNYAN ASSOCIATES
These industries are compared in terms of earnings and GDP in order to illustrate the
significance of the travel industry in the larger economy. This type of comparison is more
meaningful for the travel industry than comparisons with non-export oriented industries
(e.g., health care, retail trade, government) where industry growth is largely a function of
population and demographic factors.
TYPES OF TRAVEL IMPACTS INCLUDED
Most of the travel that occurs in Texas is included in the scope of this analysis. The
purpose of such travel can be for business, pleasure, shopping, to attend meetings, or for
personal, medical or educational purposes. All trips to Texas by U.S. residents and foreign
visitors are included. The travel of Texas residents to other destinations within Texas is
included, provided that it is neither commuting nor other routine travel. Travel to non-
Texas destinations by Texas residents is not included as a component of visitor spending.
Outbound air travel impacts and spending on travel arrangement services are included in
the “Other Travel” category.
The impacts associated with both overnight and day travel are included if the travelers
remain at the destination overnight or the destination is over 50 miles, one-way, from the
traveler's home. These definitions are used to screen and, if necessary, to interpret and
adjust local data used for travel impact measurements. The most conservative
interpretation is employed where data limitations cause deviations from the above
definition.
International
International travel impacts for Texas consist of three components by origin: Overseas,
Mexico, and Canada. Overseas visitor expenditures are calculated using I-94 record of
admission data (U.S. Department of Homeland Security) to estimate the number of
overseas arrivals to the state, multiplied by spending per person per trip based on U.S.
Bureau of Economic Analysis (BEA) International Transactions Data. Travel expenditures
made by visitors from Mexico and Canada are estimated using BEA aggregate spending in
the U.S. for each country, a share of which is attributed to Texas based on I-94 volume data
(Texas share of US total travel expenditures from Mexico and Canada). The sum of these
three components is used to calculate the proportion of total visitor spending (as estimated
from the RTIM analysis) that can be attributable to international travelers.
TRANSPORTATION IMPACTS
The focus of this analysis is on the destination-specific impacts of visitors. This is
straightforward with respect to the spending on commodities such as accommodations,
food services, recreation and retail purchases. It is less obvious with respect to ground and
air transportation services, in that transportation provides a link between an origin and
destination. In this report, the impacts related to spending on transportation are allocated
to the location (i.e., county) in which those spending impacts occur, regardless of whether
that location is the ultimate destination of the visitor. For this reason, urban counties will
tend to have relatively greater transportation impacts even though some of that spending
on transportation will be related to visits at other destinations.
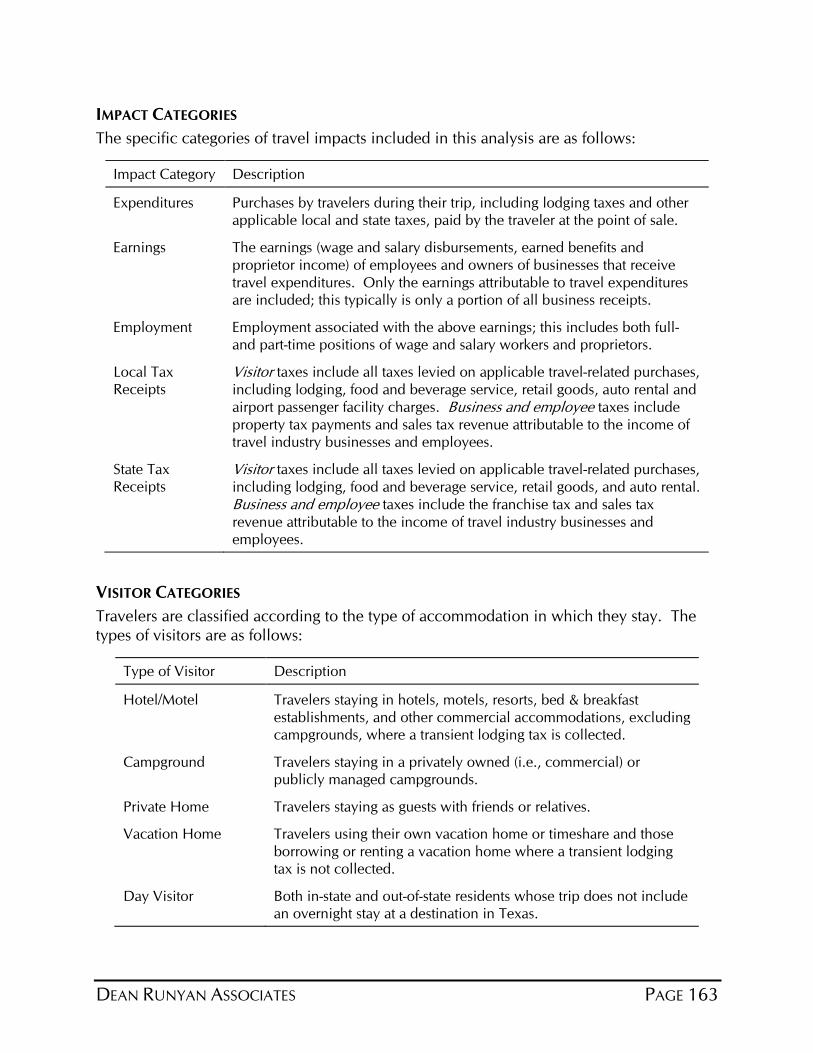
DEAN RUNYAN ASSOCIATES PAGE 163
IMPACT CATEGORIES
The specific categories of travel impacts included in this analysis are as follows:
Impact Category Description
Expenditures Purchases by travelers during their trip, including lodging taxes and other applicable local and state taxes, paid by the traveler at the point of sale.
Earnings The earnings (wage and salary disbursements, earned benefits and
proprietor income) of employees and owners of businesses that receive
travel expenditures. Only the earnings attributable to travel expenditures are included; this typically is only a portion of all business receipts.
Employment Employment associated with the above earnings; this includes both full- and part-time positions of wage and salary workers and proprietors.
Local Tax Receipts
Visitor taxes include all taxes levied on applicable travel-related purchases,
including lodging, food and beverage service, retail goods, auto rental and
airport passenger facility charges. Business and employee taxes include
property tax payments and sales tax revenue attributable to the income of travel industry businesses and employees.
State Tax Receipts
Visitor taxes include all taxes levied on applicable travel-related purchases,
including lodging, food and beverage service, retail goods, and auto rental.
Business and employee taxes include the franchise tax and sales tax
revenue attributable to the income of travel industry businesses and employees.
VISITOR CATEGORIES
Travelers are classified according to the type of accommodation in which they stay. The
types of visitors are as follows:
Type of Visitor Description
Hotel/Motel Travelers staying in hotels, motels, resorts, bed & breakfast
establishments, and other commercial accommodations, excluding campgrounds, where a transient lodging tax is collected.
Campground Travelers staying in a privately owned (i.e., commercial) or publicly managed campgrounds.
Private Home Travelers staying as guests with friends or relatives.
Vacation Home Travelers using their own vacation home or timeshare and those
borrowing or renting a vacation home where a transient lodging tax is not collected.
Day Visitor Both in-state and out-of-state residents whose trip does not include an overnight stay at a destination in Texas.
PAGE 164 DEAN RUNYAN ASSOCIATES
REPORTING FORMAT
A description of the headings and categories of the detailed direct impact tables is provided
below.
Total Direct Travel Spending includes the total visitor spending at destination,
described above, plus spending on travel agencies and resident air travel (other
spending). Total direct travel spending does not include secondary (indirect and
induced) effects.
Visitor Spending by Type of Traveler Accommodation refers to the total direct
spending of each category of visitor at that destination (county or state). For
example, the spending of visitors that stayed at hotels or motels includes their
spending on accommodations, food & beverage service, recreation, transportation
and all other visitor related commodities.
Visitor Spending by Commodity Purchased refers to the total spending on each
commodity for all types of visitors. For example, the total spending on Food &
Beverage Services includes spending by visitors staying in hotels, private
campgrounds, private homes and the other types of accommodation. The total
spending on commodities is identical to the total spending by type of
accommodation.
The next two sections, Travel-Generated Earnings and Employment by Industry, provide
estimates of travel-generated earnings and employment that are based on an industry,
rather than a commodity, classification. A business that is classified in a particular industry
may include more than one commodity. For example, a resort that is classified in the
accommodation industry may provide accommodations, food and beverages, and
recreation.
Industry Earnings Generated by Travel Spending includes the payroll, other earned
benefits and proprietor income of all employees in that industry classification.
Industry Employment Generated by Travel Spending includes all full- and part-time
employees. This includes payroll employees covered by unemployment insurance
and those that are not, as well as proprietors.
The final section provides an estimate of tax receipts generated by travel spending.
Tax Revenues Generated by Travel Spending provides a breakout of local, state and
federal tax receipts at the state level, and local and state tax receipts for areas within
the state. The local and state taxes are further broken out as “visitor” and
“business/employee”. Visitor taxes include all transient occupancy taxes, sales taxes,
mixed beverage taxes, motor fuel taxes, auto rental taxes and airport passenger
facility charges. Business/employee taxes include property taxes, the franchise tax
and the sales/excise tax payments attributable to the income of travel industry
employees. Federal taxes include income and payroll taxes, the motor fuel excise
tax and airline ticket taxes.
DEAN RUNYAN ASSOCIATES PAGE 165
INTERPRETATION OF IMPACT ESTIMATES
Users of this report should be aware of several issues regarding the interpretation of the
impact estimates contained herein.
The monetary estimates in this report are expressed in current dollars. There is no
adjustment for inflation, with the exception of two graphs in the national and state
sections of the report.
The employment estimates in this report are estimates of the total number of full-
and part-time jobs (positions) directly generated by travel spending, rather than the
number of individuals employed. Both payroll jobs and self-employment are
included in these estimates. Caution should therefore be used in comparing these
estimates with other employment data series.
In general, estimates of small geographic areas (e.g., rural counties) are less reliable
than estimates for regions or metropolitan counties. Trend analysis and
comparisons of counties with relatively low levels of travel-related economic
activity should therefore be interpreted cautiously.
The estimates of travel impacts published in this report will necessarily differ
somewhat from estimates generated from different models, methodologies and data
sources. Nonetheless, it should be emphasized that all credible estimates of direct
travel impacts at the state level, including those of Dean Runyan Associates, are of
similar magnitude.
The estimates in this report supersede all previously published impact estimates.
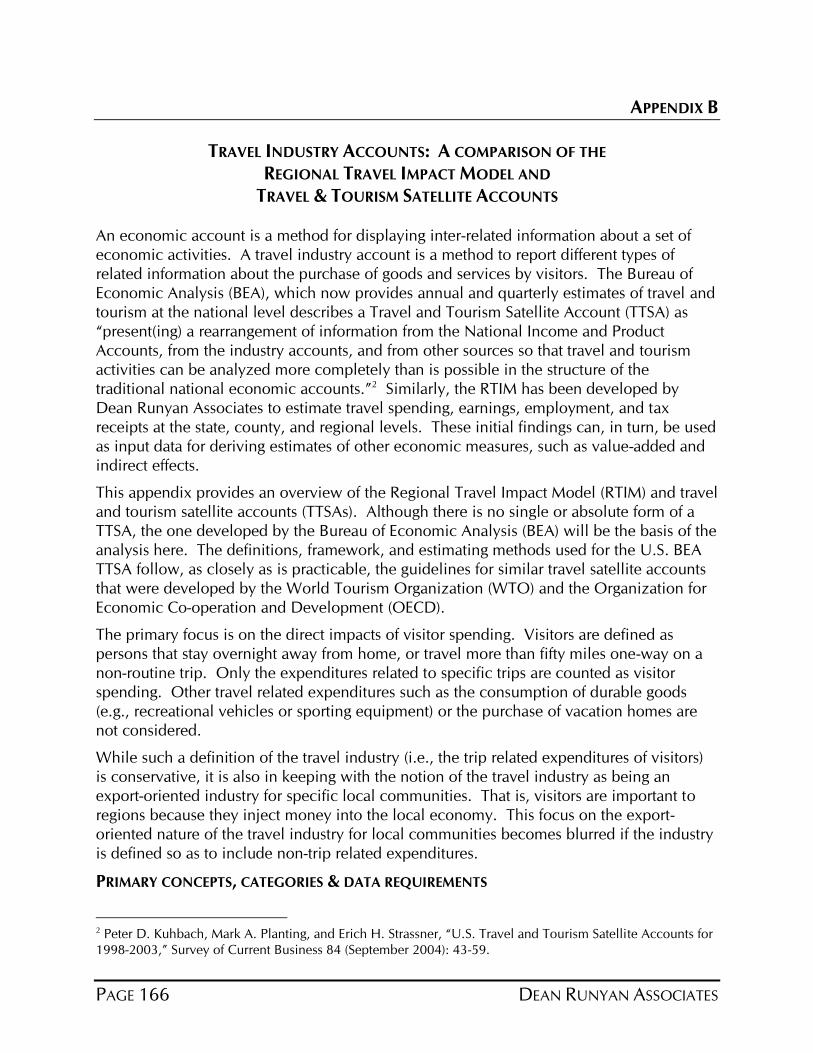
PAGE 166 DEAN RUNYAN ASSOCIATES
APPENDIX B
TRAVEL INDUSTRY ACCOUNTS: A COMPARISON OF THE
REGIONAL TRAVEL IMPACT MODEL AND
TRAVEL & TOURISM SATELLITE ACCOUNTS
An economic account is a method for displaying inter-related information about a set of
economic activities. A travel industry account is a method to report different types of
related information about the purchase of goods and services by visitors. The Bureau of
Economic Analysis (BEA), which now provides annual and quarterly estimates of travel and
tourism at the national level describes a Travel and Tourism Satellite Account (TTSA) as
“present(ing) a rearrangement of information from the National Income and Product
Accounts, from the industry accounts, and from other sources so that travel and tourism
activities can be analyzed more completely than is possible in the structure of the
traditional national economic accounts.”2 Similarly, the RTIM has been developed by
Dean Runyan Associates to estimate travel spending, earnings, employment, and tax
receipts at the state, county, and regional levels. These initial findings can, in turn, be used
as input data for deriving estimates of other economic measures, such as value-added and
indirect effects.
This appendix provides an overview of the Regional Travel Impact Model (RTIM) and travel
and tourism satellite accounts (TTSAs). Although there is no single or absolute form of a
TTSA, the one developed by the Bureau of Economic Analysis (BEA) will be the basis of the
analysis here. The definitions, framework, and estimating methods used for the U.S. BEA
TTSA follow, as closely as is practicable, the guidelines for similar travel satellite accounts
that were developed by the World Tourism Organization (WTO) and the Organization for
Economic Co-operation and Development (OECD).
The primary focus is on the direct impacts of visitor spending. Visitors are defined as
persons that stay overnight away from home, or travel more than fifty miles one-way on a
non-routine trip. Only the expenditures related to specific trips are counted as visitor
spending. Other travel related expenditures such as the consumption of durable goods
(e.g., recreational vehicles or sporting equipment) or the purchase of vacation homes are
not considered.
While such a definition of the travel industry (i.e., the trip related expenditures of visitors)
is conservative, it is also in keeping with the notion of the travel industry as being an
export-oriented industry for specific local communities. That is, visitors are important to
regions because they inject money into the local economy. This focus on the export-
oriented nature of the travel industry for local communities becomes blurred if the industry
is defined so as to include non-trip related expenditures.
PRIMARY CONCEPTS, CATEGORIES & DATA REQUIREMENTS
2 Peter D. Kuhbach, Mark A. Planting, and Erich H. Strassner, “U.S. Travel and Tourism Satellite Accounts for
1998-2003,” Survey of Current Business 84 (September 2004): 43-59.
DEAN RUNYAN ASSOCIATES PAGE 167
There are three primary types of information that are measured and/or estimated in a travel
industry account. The first is a measure of the travel industry in terms of both the
characteristics of the business firms that sell travel goods and services and the
characteristics of consumers that purchase travel industry goods and services. The second
is measure of the demand segments that consume travel industry goods and services. For
example, the distinction between business and leisure travel is a measure of demand
segments. The third is a measure of the components of economic output associated with
the travel industry. The employee earnings generated by visitor spending is one such
component. Travel-generated tax receipts are another. These three categories of
information represent different aspects of the accounting ledger – they represent different
ways of viewing or analyzing the travel industry.
The bulk of this paper will discuss these three types of information in terms of their
conceptual foundations, the data requirements, and some of the more salient issues that
users of this information should be aware of. There will also be some discussion of
indirect and induced effects in that these effects can be reasonably estimated from the
direct travel industry accounts. These secondary (versus direct) effects describe the
relationship of the travel industry to other sectors of the larger economy.
The intent of this discussion will be to provide a general overview of the process of
constructing travel industry accounts and the underlying similarity between the RTIM and a
TTSA. More technical issues are generally placed in footnotes.
TRAVEL INDUSTRY
Defining the travel industry is probably the most critical and data intensive effort involved
in developing a travel industry account. It is an exercise in matching supply (sellers of
goods and services) with demand (the travelers that purchase those particular goods and
services). It is complicated by the fact that no single industrial classification scheme
provides a valid measure of the travel industry.3 There are only three significant industrial
classifications, accommodations (NAICS 721) and Scheduled Passenger Air Transportation
(NAICS 481111) and Travel Arrangement and Reservation Services (NAICS 5615) that
primarily sell travel industry goods and services.4 Firms in other industries (retail,
recreation, transportation) provide goods and services to both travelers and other types of
consumers.
Because of this, most satellite accounts, as well as the RTIM, incorporate at least some
information about the expenditures of visitors in order to define the supply of visitor
industry firms. For example, if there is an estimate of visitor-days and an estimate of how
much the average visitor spends on food services per day, then an estimate of visitor
3 The North American Industrial Classification System (NAICS) is the current standard in the United States. 4 Even these industries are not purely travel. For example, the accommodations industry provides services to
local residents (food service and meeting rooms). Passenger airlines also ship cargo on the same planes that
carry passengers. Fortunately, it is usually possible to make adjustments for these non-travel components
through the use of additional data.
PAGE 168 DEAN RUNYAN ASSOCIATES
spending on food services can be calculated. In most cases, this will be only a fraction of
all food service sales in that residents are a larger market for most restaurants.5
The industry sectors that are usually matched to visitor spending in this way are:
accommodations (NAICS 721), food service (722), arts, entertainment and recreation (71),
and retail trade (44-45). A portion of transportation business is also part of the travel
industry for obvious reasons.
In the case of the transportation sector, the definition and measurement of the travel
industry component is more complicated because most transportation spending by visitors
involves travel to and from the destination, rather than travel at or within the destination
market. This is not an issue if the geographic scope of the travel industry market includes
the origin and destination of travel. National travel industry accounts thus include all
domestic passenger air transportation in the travel industry. The issue is more complicated
at the state or regional level, however. Suppose, for example, that the focus of a travel
industry account is the state of Texas. How should the purchase of a round trip airline
ticket by a Chicago resident traveling to Dallas be treated in that only some of the
economic impact of this spending will occur in Texas? A reasonable approach would be to
allocate only a portion of this spending (and related payroll, taxes, etc.) to Texas and ignore
the remainder for the purpose of creating a travel industry account for Texas. However, if
this procedure were followed for every state, the sum of the state accounts would be less
than the national travel account. The state accounts would be additive if outbound air
travel from each state were included. However, this is methodologically inconsistent with
the construction of a national account, which does not include outbound travel as a
component of domestic tourism demand. The approach used in the RTIM is to make a
distinction between the visitor industry, which includes only visitor demand, and the travel industry, which includes visitor demand and that portion of outbound travel that can be
attributed to the resident economy. For example, the passenger air transportation
employment in Texas can be divided between three groups of travelers: inbound,
outbound, and pass-through. Only that employment attributable to inbound travel is part
of the Texas visitor industry. Employment attributable to outbound and pass-through
travelers is included with the larger travel industry.6
The following two tables display the specific industries that are included in the travel
industry for the BEA’s national TTSA and the RTIM. Although not identical, the industries
are equivalent with only a few exceptions.7
5 The proportion can vary enormously among regions and localities, however. In many popular visitor
destinations, the primary market for food service will be visitors. It should also be noted that even with
reliable visitor survey data, there is still the issue of how to translate spending on food service commodities to
the supply of food service by industry. As indicated in the footnote above, food service is also supplied by
the accommodation industry. 6 The same issue arises with Travel agencies and reservation services (NAICS 5615). Most of these services
are probably related to outbound travel and are treated as such in the RTIM. 7 The major exception is that the BEA includes the production of consumer non-durables that are sold through
retail outlets. This is not a major component and would be even less so at the level of the state.
DEAN RUNYAN ASSOCIATES PAGE 169
Accommodation & Food Services 38.1%
Traveler accommodations 21.5%
Food services and drinking places 16.6%
Transportation 23.3%
Air transportation 15.4%
Rail transportation 0.4%
Water transportation 1.2%
Interurban bus transportation 0.3%
Interurban charter bus transportation 0.2%
Urban transit systems & other tran. 1.7%
Taxi service 1.0%
Automotive equipment rental & leasing 2.0%
Automotive repair services 0.8%
Parking lots and garages 0.2%
Toll highways 0.1%
Recreation 11.2%
Scenic and sightseeing transportation 0.4%
Motion pictures and performing arts 1.1%
Spectator sports 2.3%
Participant sports 2.4%
Gambling 3.0%
All other recreation and entertainment 2.0%
Retail & Nondurable Goods Production 17.8%
Petroleum refineries 0.6%
Industries producing nondurable PCE
commodities, excluding petroleum refineries 4.4%
Wholesale trade & tran. services 5.8%
Gasoline service stations 1.3%
Retail trade services, excluding
gasoline service stations 5.8%
Travel Arrangement 7.3%
All other industries 2.2%
Total Tourism Compensation 100.0%
Bureau of Economic Analysis Tourism Industries
Distribution of Travel-Generated Compensation
in United States, 2007
Source: Adapted from Eric S. Griffith and Steven L. Zemanek, “U.S. Travel and
Tourism Satellite Accounts for 2005-2008,” Survey of Current Business (June
2009): 37, table 6.
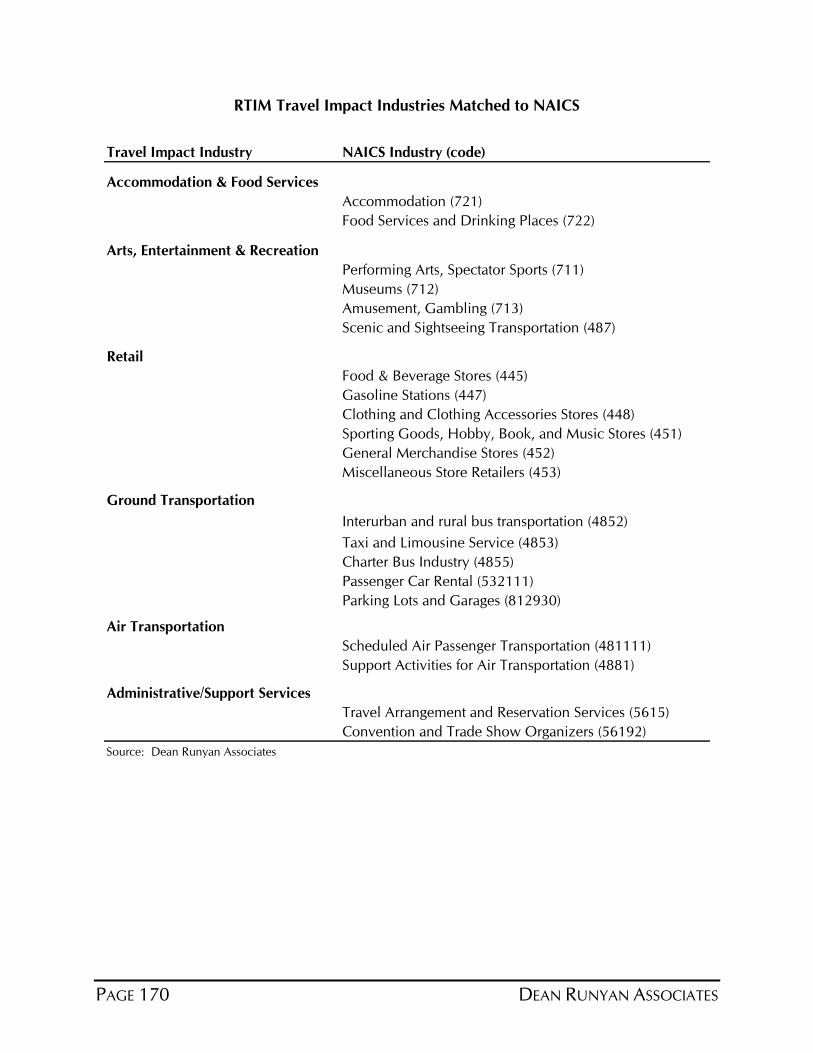
PAGE 170 DEAN RUNYAN ASSOCIATES
RTIM Travel Impact Industries Matched to NAICS
Travel Impact Industry NAICS Industry (code)
Accommodation & Food Services
Accommodation (721)
Food Services and Drinking Places (722)
Arts, Entertainment & Recreation
Performing Arts, Spectator Sports (711)
Museums (712)
Amusement, Gambling (713)
Scenic and Sightseeing Transportation (487)
Retail
Food & Beverage Stores (445)
Gasoline Stations (447)
Clothing and Clothing Accessories Stores (448)
Sporting Goods, Hobby, Book, and Music Stores (451)
General Merchandise Stores (452)
Miscellaneous Store Retailers (453)
Ground Transportation
Interurban and rural bus transportation (4852)
Taxi and Limousine Service (4853)
Charter Bus Industry (4855)
Passenger Car Rental (532111)
Parking Lots and Garages (812930)
Air Transportation
Scheduled Air Passenger Transportation (481111)
Support Activities for Air Transportation (4881)
Administrative/Support Services
Travel Arrangement and Reservation Services (5615)
Convention and Trade Show Organizers (56192)
Source: Dean Runyan Associates
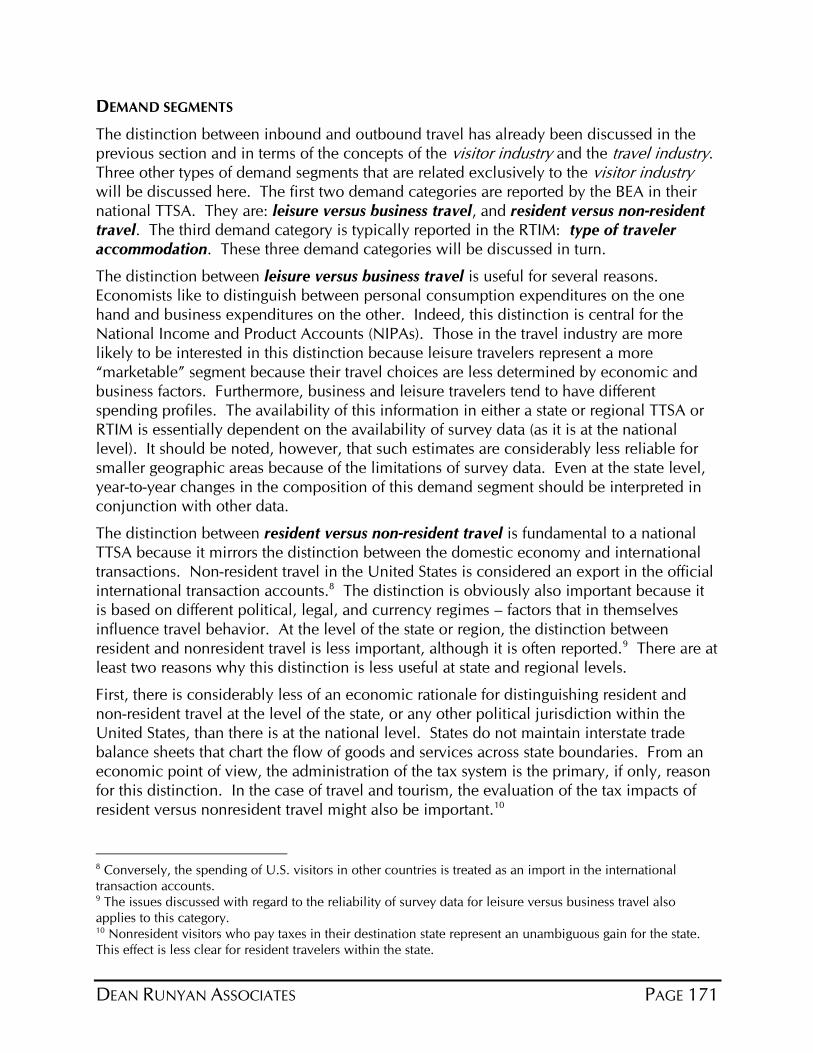
DEAN RUNYAN ASSOCIATES PAGE 171
DEMAND SEGMENTS
The distinction between inbound and outbound travel has already been discussed in the
previous section and in terms of the concepts of the visitor industry and the travel industry.
Three other types of demand segments that are related exclusively to the visitor industry
will be discussed here. The first two demand categories are reported by the BEA in their
national TTSA. They are: leisure versus business travel, and resident versus non-resident
travel. The third demand category is typically reported in the RTIM: type of traveler
accommodation. These three demand categories will be discussed in turn.
The distinction between leisure versus business travel is useful for several reasons.
Economists like to distinguish between personal consumption expenditures on the one
hand and business expenditures on the other. Indeed, this distinction is central for the
National Income and Product Accounts (NIPAs). Those in the travel industry are more
likely to be interested in this distinction because leisure travelers represent a more
“marketable” segment because their travel choices are less determined by economic and
business factors. Furthermore, business and leisure travelers tend to have different
spending profiles. The availability of this information in either a state or regional TTSA or
RTIM is essentially dependent on the availability of survey data (as it is at the national
level). It should be noted, however, that such estimates are considerably less reliable for
smaller geographic areas because of the limitations of survey data. Even at the state level,
year-to-year changes in the composition of this demand segment should be interpreted in
conjunction with other data.
The distinction between resident versus non-resident travel is fundamental to a national
TTSA because it mirrors the distinction between the domestic economy and international
transactions. Non-resident travel in the United States is considered an export in the official
international transaction accounts.8 The distinction is obviously also important because it
is based on different political, legal, and currency regimes – factors that in themselves
influence travel behavior. At the level of the state or region, the distinction between
resident and nonresident travel is less important, although it is often reported.9 There are at
least two reasons why this distinction is less useful at state and regional levels.
First, there is considerably less of an economic rationale for distinguishing resident and
non-resident travel at the level of the state, or any other political jurisdiction within the
United States, than there is at the national level. States do not maintain interstate trade
balance sheets that chart the flow of goods and services across state boundaries. From an
economic point of view, the administration of the tax system is the primary, if only, reason
for this distinction. In the case of travel and tourism, the evaluation of the tax impacts of
resident versus nonresident travel might also be important.10
8 Conversely, the spending of U.S. visitors in other countries is treated as an import in the international
transaction accounts. 9 The issues discussed with regard to the reliability of survey data for leisure versus business travel also
applies to this category. 10 Nonresident visitors who pay taxes in their destination state represent an unambiguous gain for the state.
This effect is less clear for resident travelers within the state.
PAGE 172 DEAN RUNYAN ASSOCIATES
Second, travel is behaviorally defined by length of distance from home (usually at least 50
miles one-way), trip purpose (non-routine), and/or the use of an overnight accommodation
away from home. Rarely is domestic travel defined by virtue of crossing a geographic
boundary.11 The operators of tourist attractions in local communities are generally less
interested in the origin of visitors than in the revenue that they generate for their
businesses. In terms of the economic impacts at the local level, the distinction between in-
state residents, out-of-state residents and international visitors may not be relevant other
than for the purpose of marketing. However, other geographic characteristics of the visitor
(e.g., distance traveled, the specific area of origin) are generally more useful measures of
the visitor market than whether the visitor is a resident or nonresident.
Finally, the distinction among different types of traveler accommodations is generally
reported in the RTIM. Typically, these categories are:
Visitors who stay in hotels, motels, B&Bs., and similar lodging facilities
Visitors who stay at campsites
Visitors who stay in the private homes of friends or relatives
Visitors who stay in vacation or second homes
Visitors who do not stay in overnight accommodations on their trip away from
home (day visitors)
These distinctions can be useful because estimates of economic impacts are often used for
different purposes. The total of all accommodation types, of course, is an estimate of the
total magnitude of the visitor industry. Visitors who stay in commercial lodging such as
hotels and motels are most likely to have the greatest economic impact on a person-day
basis. These visitors are also more likely to be influenced by marketing efforts. In urban
areas, a large proportion will represent business travel. In other words, the type of
accommodation category can be used in conjunction with other types of data to analyze
the market characteristics of visitors.
11 In essence, state level travel impact estimates really represent an aggregation of smaller geographic units,
such as counties or regions. Populous states with large landmasses (e.g., California or Texas) will have a
higher proportion of resident travel than small states (e.g., Rhode Island or Delaware).
DEAN RUNYAN ASSOCIATES PAGE 173
Output (Spending) Value-Added
Inputs/Goods Resold
Operating Surplus
Indirect Taxes
Labor Income
COMPONENTS OF INDUSTRY OUTPUT
Because both the RTIM and the TTSA are empirically linked to NAICS industry accounts, it
is possible to provide estimates of different components of economic output. The major
economic components most often estimated are:12
Travel spending (Gross Output)
Value-added (Gross Product)
Earnings (labor income)
Indirect business taxes (sales, excise, property taxes & fees)
The relationship of these components is shown below. As indicated, the value-added of a
particular industry (the bar on the right) is equal to gross output (travel spending) minus the
intermediate inputs used by travel industry businesses to produce the good or service.
Restaurants, for example, prepare and serve the food products that are purchased from
suppliers. Airlines purchase or lease airplanes from other firms. These intermediate inputs
are not counted as part of the value-added of the travel industry. They are counted as
value-added in other industries (e.g., agriculture, aerospace manufacturing).
Components of Industry Output
The distinction between gross output and value-added is probably even more important at
the state or regional level. This is because the intermediate inputs that are purchased from
other industries are even more likely to be purchased from businesses located in different
regions or states. The economic impact of air passenger travel in the state of Hawaii
should not include the purchase of airplanes manufactured in the United States mainland
12 There are some small differences between the BEA TTSA and the RTIM in what these components include.
The BEA allocates proprietor income to Operating Surplus; the RTIM allocates it to Labor Income. The RTIM
does not have an estimate of property taxes in indirect taxes. Overall, property taxes on businesses are a
relatively small proportion of indirect taxes.
PAGE 174 DEAN RUNYAN ASSOCIATES
by Boeing or in Europe by Airbus. Value-added is a more meaningful measure of the true
economic impact of visitor spending in Hawaii because some of the economic impact of
that spending will occur elsewhere.13
Value-added can also be viewed in terms of the distribution or payout of industry receipts,
exclusive of those paid to other firms for intermediate inputs. Some of the receipts are
distributed to labor as wages, benefits, and proprietor income. Some receipts are paid to
government as indirect taxes. These taxes are called “indirect” because most of them are
actually paid by consumers in the form of sales or excise taxes.14 The remainder leaves
gross operating surplus. Out of gross operating surplus various payments are made in the
form of dividends, interest, and other payments, or retained by the firm. The sum of these
three broad categories of payments is equal to travel industry value-added. To summarize:
Value-added = Spending less intermediate goods & services, or
Value-added = Labor Income plus indirect business taxes plus gross
operating surplus.
The RTIM is similar to the TTSA in that it also provides estimates of these components of
economic output. Travel spending, earnings, and tax impacts are generally provided at the
state or regional level. Value-added is generally reported at the state-level only (sometimes
referred to as Travel Industry Gross Domestic Product). At the level of the state, travel
industry value-added or GDP is an important measure – more economically meaningful
than travel spending.15 For smaller geographic areas, however, the rationale for reporting
value-added is less clear. First, there are real data limitations and data costs in deriving
these estimates. Second, the most important components of value added for the travel
industry are earnings and tax revenue. Because the travel industry is relatively labor
intensive and because a large proportion of travel industry goods and services are subject
to excise and sales taxes, these two components of value-added (labor income and indirect
taxes) are relatively high for the travel industry. The local effects of gross operating surplus
are generally less important and certainly much more difficult to assess than are earnings
and tax impacts. The relevance of earnings and tax receipts is also in keeping the export-
oriented emphasis of the travel industry: earnings and tax receipts are more likely to stay
in the local economy than is operating surplus.
13 It should also be noted the value of the intermediate inputs used by travel industry firms will not
necessarily disappear if the travel industry stops buying them. Aerospace firms will shift their production to
other users (e.g., military). Agriculture will seek new markets for their products. 14 Other taxes included here are property taxes, business franchise taxes, and other fees. Income taxes are
not included, because they are paid out of operating surplus. 15 It is also possible to compare different industries with respect to their value-added. It is more difficult and
less useful to compare industries on the basis of sales.
DEAN RUNYAN ASSOCIATES PAGE 175
INDIRECT, INDUCED AND SECONDARY EFFECTS
To this point, the discussion of travel industry accounts has referred only to the direct
output components. That is, the ripple effects of the re-spending of travel industry receipts
throughout the larger economy have not been analyzed. The structure of both the TTSA
and the RTIM permit such analysis.
Indirect effects refer to the intermediate inputs used to produce the final product or
service, providing that those inputs are themselves produced within the designated
geographic area.
Induced effects refer to the purchase of goods and services by employees that are
attributable to direct and indirect impacts. These induced impacts are derived from
economic data that describe the purchasing patterns of households. For example,
employees of all the designated export-oriented industries will spend their income
on food, household durables, health care, and so on.
The sum of indirect and induced impacts is sometimes referred to as the secondary
effect. These secondary impacts may be as great as or greater than the direct impact
alone.
The ratio of the total effects (direct plus either indirect, induced, or secondary) to the
direct effects is the multiplier.
The BEA reports the indirect components of economic output. This is equivalent to
domestic travel spending less the goods and services imported from abroad to meet
domestic demand. For travel, these imports would include souvenirs manufactured in
China and petroleum extracted in Saudi Arabia. The indirect output multiplier for 2002
was 1.76. The ratio of domestic travel spending to travel industry value-added was 1.88.
The difference reflects the intermediate inputs for travel imported from abroad.
At the state level, these indirect output multipliers are typically lower because relatively
more of the intermediate inputs are purchased from outside of the state. At the county or
metropolitan level, the multipliers are generally even lower for the same reason.
Furthermore, the estimates are usually less reliable because of the data limitations of the
regional input-output model used to estimate the indirect effects.
The BEA does not report induced effects – the effect of household spending of the direct
and indirect labor income. Typically, these induced effects will be larger than the indirect
effects at the state or regional level, in part because they are based on both the direct and
indirect components.16 As with indirect effects, the induced effects will also tend to be
lower for smaller economic areas and the reliability of the estimates will be less.
Secondary effects should be interpreted cautiously. These effects describe the relationship
of economic transactions at a point in time. These relationships will not necessarily remain
constant with a change in direct economic output. This is because all economic resources
have alternative uses. Because of this, it is often difficult to determine the effect of an
increase or decrease in visitor spending on the larger economic system over time.
16 The induced effects can be estimated with the Implan model maintained by the Minnesota Implan Group.
PAGE 176 DEAN RUNYAN ASSOCIATES
THE REGIONAL TRAVEL IMPACT MODEL AND TRAVEL & TOURISM SATELLITE ACCOUNTS
COMPARED
This appendix has provided an overview of Dean Runyan Associates RTIM and the Bureau
of Economic Analysis’ domestic TTSA. These travel industry accounts are similar in terms
of how they define the travel industry and the measures of the industry that are reported.
The differences stem largely from their different levels of analysis – the BEA provides
estimates at the national level only, while the RTIM’s are typically constructed on a state or
regional level. Because of this geographic focus, the RTIM provides a distinction between
the visitor industry and the travel industry. The RTIM also provides measures of all of the
components of economic output and secondary effects at the state or large region level. At
smaller units of analysis, however, the emphasis is on earnings and tax receipts generated
by travel spending as these are the most reliable and meaningful measures of the economic
impact of travel at the local level.
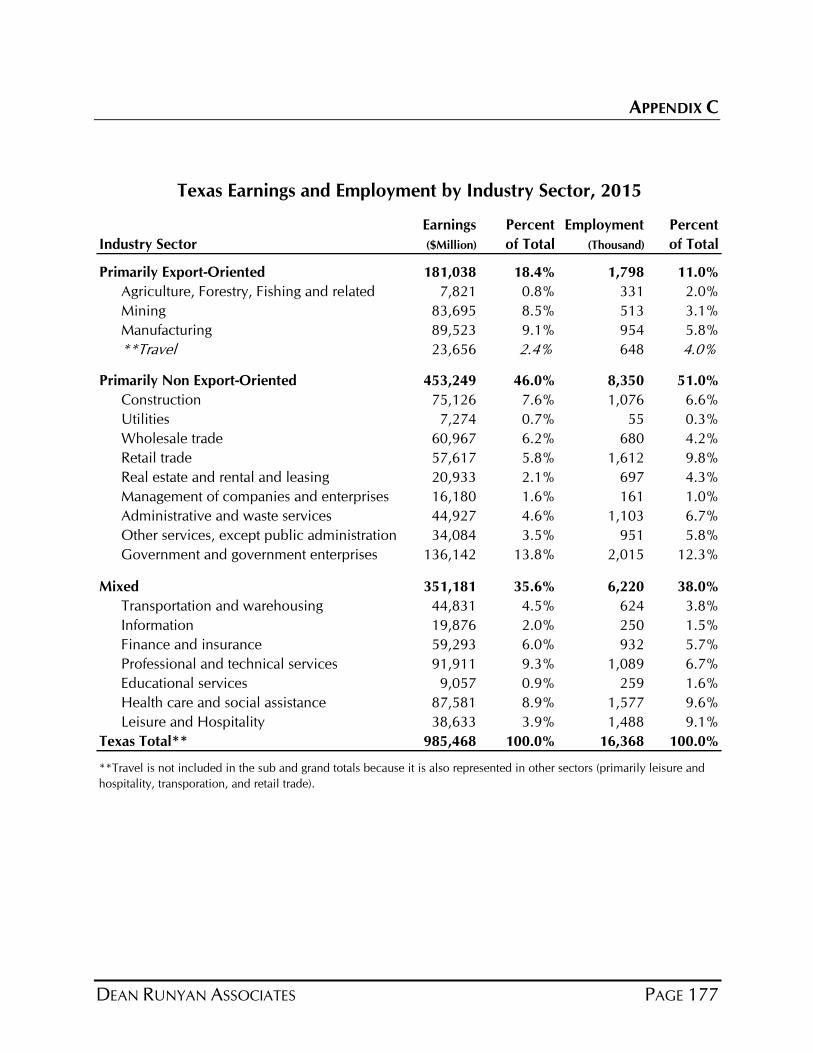
DEAN RUNYAN ASSOCIATES PAGE 177
APPENDIX C
Earnings Percent Employment Percent
Industry Sector ($Million) of Total (Thousand) of Total
Primarily Export-Oriented 181,038 18.4% 1,798 11.0%
Agriculture, Forestry, Fishing and related 7,821 0.8% 331 2.0%
Mining 83,695 8.5% 513 3.1%
Manufacturing 89,523 9.1% 954 5.8%
**Travel 23,656 2.4% 648 4.0%
Primarily Non Export-Oriented 453,249 46.0% 8,350 51.0%
Construction 75,126 7.6% 1,076 6.6%
Utilities 7,274 0.7% 55 0.3%
Wholesale trade 60,967 6.2% 680 4.2%
Retail trade 57,617 5.8% 1,612 9.8%
Real estate and rental and leasing 20,933 2.1% 697 4.3%
Management of companies and enterprises 16,180 1.6% 161 1.0%
Administrative and waste services 44,927 4.6% 1,103 6.7%
Other services, except public administration 34,084 3.5% 951 5.8%
Government and government enterprises 136,142 13.8% 2,015 12.3%
Mixed 351,181 35.6% 6,220 38.0%
Transportation and warehousing 44,831 4.5% 624 3.8%
Information 19,876 2.0% 250 1.5%
Finance and insurance 59,293 6.0% 932 5.7%
Professional and technical services 91,911 9.3% 1,089 6.7%
Educational services 9,057 0.9% 259 1.6%
Health care and social assistance 87,581 8.9% 1,577 9.6%
Leisure and Hospitality 38,633 3.9% 1,488 9.1%
Texas Total** 985,468 100.0% 16,368 100.0%
Texas Earnings and Employment by Industry Sector, 2015
**Travel is not included in the sub and grand totals because it is also represented in other sectors (primarily leisure and
hospitality, transporation, and retail trade).
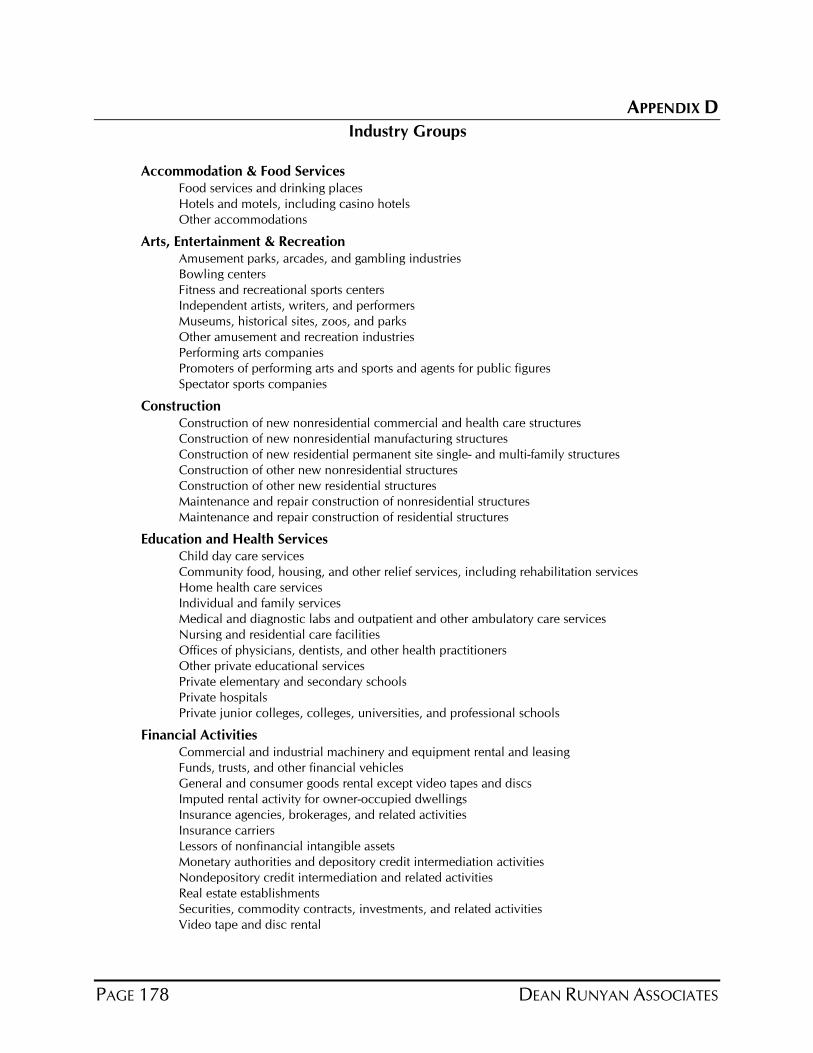
PAGE 178 DEAN RUNYAN ASSOCIATES
APPENDIX D
Accommodation & Food ServicesFood services and drinking places
Hotels and motels, including casino hotels
Other accommodations
Arts, Entertainment & RecreationAmusement parks, arcades, and gambling industries
Bowling centers
Fitness and recreational sports centers
Independent artists, writers, and performers
Museums, historical sites, zoos, and parks
Other amusement and recreation industries
Performing arts companies
Promoters of performing arts and sports and agents for public figures
Spectator sports companies
ConstructionConstruction of new nonresidential commercial and health care structures
Construction of new nonresidential manufacturing structures
Construction of new residential permanent site single- and multi-family structures
Construction of other new nonresidential structures
Construction of other new residential structures
Maintenance and repair construction of nonresidential structures
Maintenance and repair construction of residential structures
Education and Health ServicesChild day care services
Community food, housing, and other relief services, including rehabilitation services
Home health care services
Individual and family services
Medical and diagnostic labs and outpatient and other ambulatory care services
Nursing and residential care facilities
Offices of physicians, dentists, and other health practitioners
Other private educational services
Private elementary and secondary schools
Private hospitals
Private junior colleges, colleges, universities, and professional schools
Financial ActivitiesCommercial and industrial machinery and equipment rental and leasing
Funds, trusts, and other financial vehicles
General and consumer goods rental except video tapes and discs
Imputed rental activity for owner-occupied dwellings
Insurance agencies, brokerages, and related activities
Insurance carriers
Lessors of nonfinancial intangible assets
Monetary authorities and depository credit intermediation activities
Nondepository credit intermediation and related activities
Real estate establishments
Securities, commodity contracts, investments, and related activities
Video tape and disc rental
Industry Groups
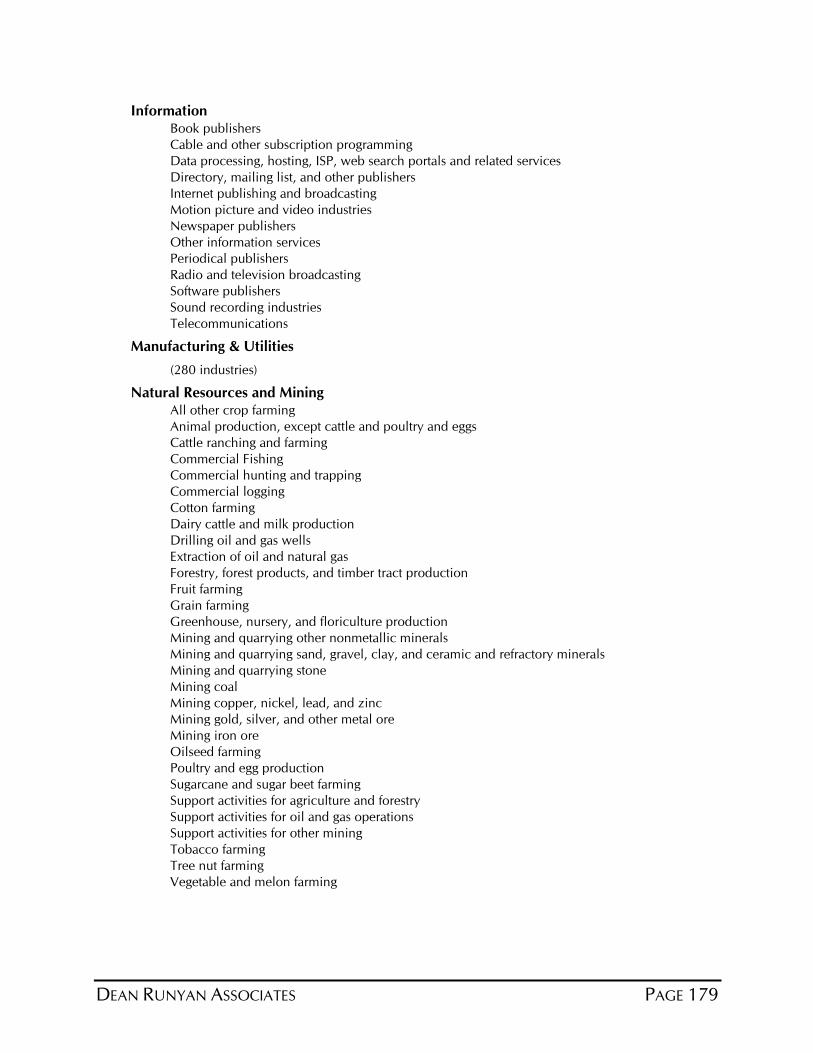
DEAN RUNYAN ASSOCIATES PAGE 179
InformationBook publishers
Cable and other subscription programming
Data processing, hosting, ISP, web search portals and related services
Directory, mailing list, and other publishers
Internet publishing and broadcasting
Motion picture and video industries
Newspaper publishers
Other information services
Periodical publishers
Radio and television broadcasting
Software publishers
Sound recording industries
Telecommunications
Manufacturing & Utilities
(280 industries)
Natural Resources and MiningAll other crop farming
Animal production, except cattle and poultry and eggs
Cattle ranching and farming
Commercial Fishing
Commercial hunting and trapping
Commercial logging
Cotton farming
Dairy cattle and milk production
Drilling oil and gas wells
Extraction of oil and natural gas
Forestry, forest products, and timber tract production
Fruit farming
Grain farming
Greenhouse, nursery, and floriculture production
Mining and quarrying other nonmetallic minerals
Mining and quarrying sand, gravel, clay, and ceramic and refractory minerals
Mining and quarrying stone
Mining coal
Mining copper, nickel, lead, and zinc
Mining gold, silver, and other metal ore
Mining iron ore
Oilseed farming
Poultry and egg production
Sugarcane and sugar beet farming
Support activities for agriculture and forestry
Support activities for oil and gas operations
Support activities for other mining
Tobacco farming
Tree nut farming
Vegetable and melon farming
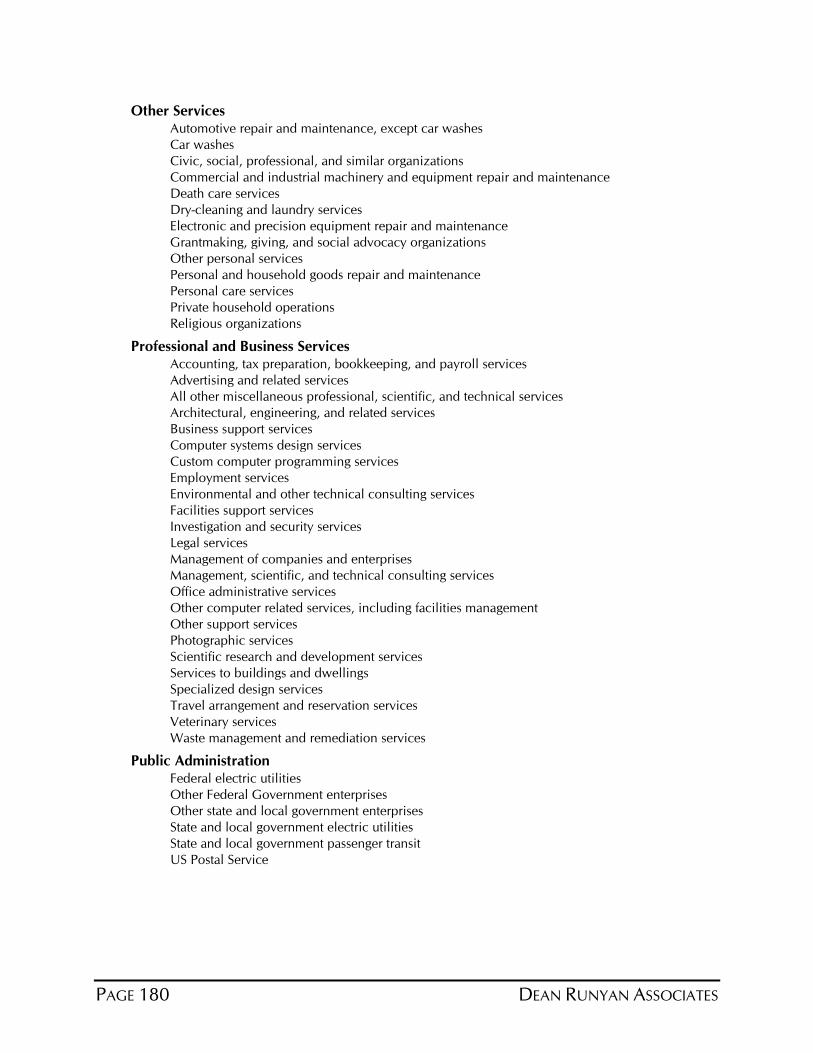
PAGE 180 DEAN RUNYAN ASSOCIATES
Other ServicesAutomotive repair and maintenance, except car washes
Car washes
Civic, social, professional, and similar organizations
Commercial and industrial machinery and equipment repair and maintenance
Death care services
Dry-cleaning and laundry services
Electronic and precision equipment repair and maintenance
Grantmaking, giving, and social advocacy organizations
Other personal services
Personal and household goods repair and maintenance
Personal care services
Private household operations
Religious organizations
Professional and Business ServicesAccounting, tax preparation, bookkeeping, and payroll services
Advertising and related services
All other miscellaneous professional, scientific, and technical services
Architectural, engineering, and related services
Business support services
Computer systems design services
Custom computer programming services
Employment services
Environmental and other technical consulting services
Facilities support services
Investigation and security services
Legal services
Management of companies and enterprises
Management, scientific, and technical consulting services
Office administrative services
Other computer related services, including facilities management
Other support services
Photographic services
Scientific research and development services
Services to buildings and dwellings
Specialized design services
Travel arrangement and reservation services
Veterinary services
Waste management and remediation services
Public AdministrationFederal electric utilities
Other Federal Government enterprises
Other state and local government enterprises
State and local government electric utilities
State and local government passenger transit
US Postal Service
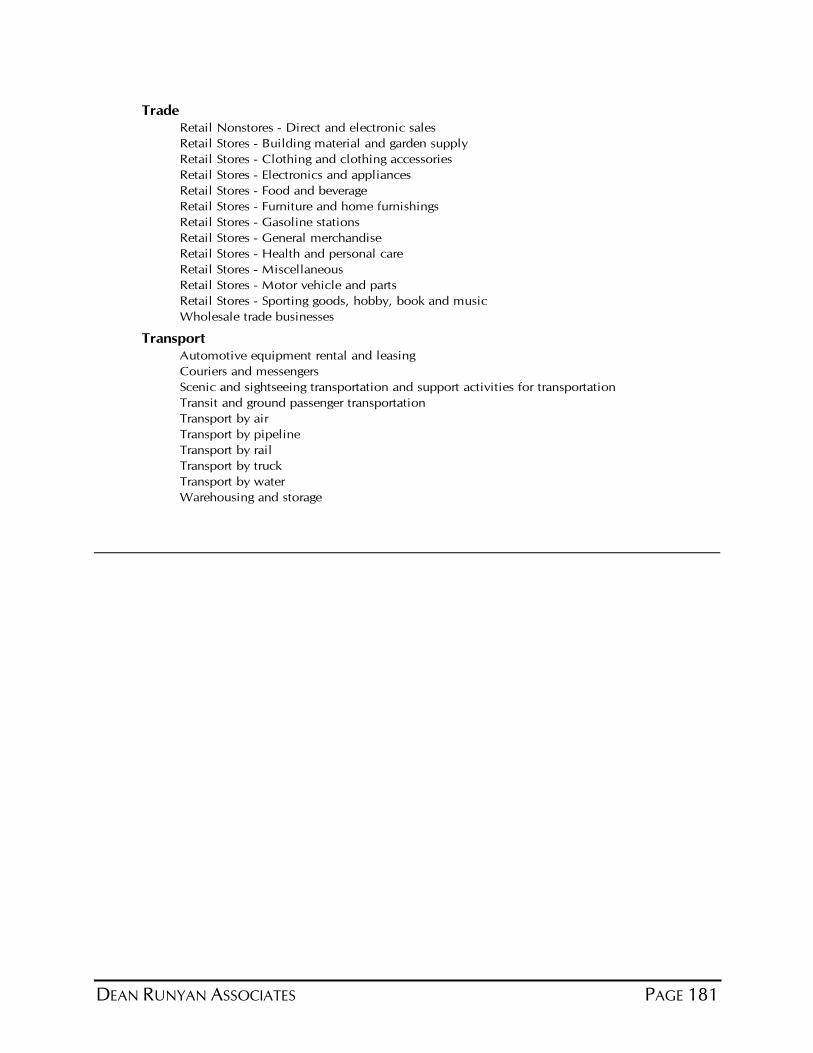
DEAN RUNYAN ASSOCIATES PAGE 181
Trade
Retail Nonstores - Direct and electronic sales
Retail Stores - Building material and garden supply
Retail Stores - Clothing and clothing accessories
Retail Stores - Electronics and appliances
Retail Stores - Food and beverage
Retail Stores - Furniture and home furnishings
Retail Stores - Gasoline stations
Retail Stores - General merchandise
Retail Stores - Health and personal care
Retail Stores - Miscellaneous
Retail Stores - Motor vehicle and parts
Retail Stores - Sporting goods, hobby, book and music
Wholesale trade businesses
Transport
Automotive equipment rental and leasing
Couriers and messengers
Scenic and sightseeing transportation and support activities for transportation
Transit and ground passenger transportation
Transport by air
Transport by pipeline
Transport by rail
Transport by truck
Transport by water
Warehousing and storage